Submitted:
14 October 2025
Posted:
15 October 2025
You are already at the latest version
Abstract
As the development of autonomous vehicles (AVs) progresses, new seating arrangements are emerging. Face-to-face seating is common in SAE L4 AV concepts and is intended to facilitate social interaction during autonomous driving, enabling previously unfeasible non-driving related tasks (NDRTs). However, this is countered by the unpopularity of rearward seating orientations, which is particularly pronounced in cars. In order to develop countermeasures to address this unpopularity, a deeper understanding of the underlying mechanisms is required. This study validates a model that predicts the acceptance of AVs and takes seating orientation into account. To this end, a study with N = 46 participants was conducted to investigate the influence of seating orientation on AV acceptance and related factors such as transparency, trust and motion sickness. Additionally, internal human machine interfaces (iHMIs) were evaluated in regard to their ability to compensate for the disadvantages of a rearward seating orientation. To achieve a realistic implementation of a fully functional SAE L4 AV, an experimental vehicle was equipped with a steering and pedal robot, performing self-driven journeys on a test track. The iHMIs provided information about upcoming maneuvers and detected road users. While engaged in a social NDRT, participants experienced a total of six journeys. Seating orientation and iHMI visualization were manipulated between journeys. Rearward facing passengers showed lower levels of trust and higher levels of motion sickness than forward facing passengers. However, the iHMIs had no effect on acceptance or related factors. Based on these findings, an updated version of the model is proposed, showing that rearward facing passengers in autonomous vehicles pose a particular challenge for trust calibration and motion sickness mitigation. During NDRTs, iHMIs which depend on the attention of AV occupants for information transfer appear to be ineffective. Implications for future research and design of iHMIs to address this challenge are discussed.
Keywords:
motion sickness
; trust
; acceptance
; autonomous vehicle
; seating orientation
; rearward
1. Introduction
Autonomous vehicles are expected to bring various benefits, such as increased safety and comfort. In addition, one of the main benefits is the possibility of using driving time for NDRTs, for example for work or leisure activities. In order to better exploit the potential of possible NDRTs, innovative seating arrangements are being developed, particularly for fully automated vehicles (SAE Level 4, SAE International, 2016). One such arrangement which has been incorporated into various concept vehicles is the rotating front seats (Mercedes-Benz F 015, Volkswagen SEDRIC, Yanfeng Automotive Interiors XiM18, Zoox Boz, Volvo 360c, Renault Symbioz, Renault EZ-Ultimo, Nio EVE, VW ID.Code). This allows face-to-face interaction between occupants, supporting NDRTs such as business meetings or social games.
This seating layout has repeatedly proven to be the most popular alternative among various concepts [1,2,3]. However, the extent to which this kind of a seating layout would actually be used is questionable, as the seating orientation against the direction of travel has been shown to be rather unpopular in trains [4]. This unpopularity is anticipated to be even more pronounced in AVs [5,6,7,8,9,10]. Motion sickness is one of the most frequently mentioned factors and has been shown to be more pronounced in rearward facing passengers [11]. Another potential contributor to the rejection of rearward facing seats in AVs is trust. Paddeu et al. [12] investigated trust in L4 shuttles with speeds of up to 16km/h and found significantly higher trust levels when passengers sat in the direction of travel as opposed to against it.
A lack of willingness to use AVs while being seated rearwards would inhibit the potential benefits of this kind of seating layout and should therefore be addressed when designing the AV’s interior. In order to develop appropriate countermeasures, a deeper understanding of the underlying mechanisms is critical. Willingness to use technology in general and autonomous vehicles in particular has been subject to numerous analyses and the relationships between the factors involved have been mapped in various models [13,14,15,16,17,18,19,20,21,22,23]. Accordingly, the following factors could influence the willingness to be seated rearwards. These factors have been examined within the general context of what could influence the acceptance of being driven by AVs, but could also be influenced by the seating orientation. The relationships between the individual factors are summarized in the proposed autonomous driving acceptance model (Figure 1).
AV acceptance is commonly operationalised as the behavioral intention to use AVs [13,15,16,17]. This intention is largely predicted by hedonic motivation, perceived usefulness and trust [15,23,24,25,26,27,28,29,30,31].
Trust is a widely studied construct in the context of AVs. Lee and See [32], describe trust it as "the attitude that an agent will help achieve an individual’s goals in a situation characterized by uncertainty and vulnerability". Information about the system’s intentions and perception have been shown to positively influence trust in L2 and L3 AVs [33,34,35]. Moreover Paddeu et al. [12] found lower trust levels in rearward facing passengers in a L4 AV with speeds of up to 16 km/h. At these higher automation levels, undertrust is a mayor concern as it can lead to disuse [36].
Trust in AVs has shown to be directly associated with AV acceptance (e.g., [24,25,37]). Furthermore, trust has been found to influence perceived usefulness, which in turn influences acceptance [21,22,23]. This is plausible, as a lack of trust can lead to self-assuring behavior such as observing the vehicle’s operations. Such behavior in turn reduces engagement with the NDRT, diminishing the benefits of autonomous driving and thus the likelihood of it’s adoption.
Hedonic motivation, defined as "the fun or pleasure derived from using a technology", has also repeatedly been shown to predict AV acceptance [14,18,28,38]. We hypothesize hedonic motivation to be negatively related to motion sickness. Motion sickness describes a state of symptoms such as nausea and dizziness resulting from a mismatch between anticipated and perceived acceleration [39]. These symptoms are likely to inhibit the pleasure experienced while using AVs.
We further expect motion sickness to predict perceived usefulness, as it has shown to influence the choice of NDRT during autonomous rides [40]. This is likely due to differences in motion sickness severity elicited by different NDRTs [41]. Specifically, looking outside leads to significantly less motion sickness than conducting a visual NDRT [42,43,44]. Thus, motion sickness will decrease the willingness to pursue useful NDRTs. Even in passengers continuing their NDRT while experiencing motion sickness, NDRT performance will suffer [45,46].
System transparency, particularly on information about the vehicle’s current and planned maneuvers, as well as detected traffic objects and other road users been shown to influence trust [22,47,48,49]. These two types of information are henceforth referred to as “intention transparency” and “perception transparency”. Perception transparency is defined as the extent to which passengers are able to identify traffic objects that are recognized by the AV as such. Intention transparency is defined as the extent to which passengers are able to correctly anticipate vehicle maneuvers. Besides trust, intention transparency is also hypothesized to predict motion sickness, as more accurate information on upcoming maneuvers reduces the probability of sensory mismatches between anticipated and sensed motion.
Intention- and perception transparency are both expected to be negatively influenced by a rearward facing seating orientation. Rearward facing passengers cannot see the road ahead making vehicle maneuvers less predictable. Similarly, they cannot see traffic objects or road users in front of the vehicle. Consequently, these passengers cannot classify maneuvers such as stopping for a crossing pedestrian or turning at an intersection as a reaction to the corresponding traffic objects, reducing perception transparency. While some authors argue that higher levels of autonomy cause lower levels of information needs, rearward facing seats may challenge this assumption by reducing intention and perception transparency [49].
This raises the question how intention- and perception transparency can be increased in AV passengers in general and in rearward facing passengers in particular. Wintersberger et al. [50] manipulated transparent system behavior of AVs in a simulator study using augmented reality (AR) displays. Highlighting traffic objects and other road users, as well as presenting upcoming driving maneuvers to rearward facing participants both led to increased trust and acceptance. Flohr et al. [51] used a wizard-of-oz vehicle to investigate the effect of augmenting other road users and traffic objects. The augmentations were displayed as an overlay on a camera feed of the vehicles apron that was shown on a large display between the first and second row of seats. Fröhlich et al. [52] used a simulated ride in an autonomous bus to compare three modes of presentation for visual information on detected road users and upcoming maneuvers: textual, iconic and AR (icons overlapping a camera feed). The AR variant was most favored by the participants. Wilbrink et al. [53] compared light-based intention- and perception messages in a VR-study and found higher trust and usability ratings for both types of messages compared to a baseline. Oliveira et al. [49] compared various technologies that visually augment the AV’s future trajectory and potential hazards in front of the vehicle. A camera feed on a display with graphical overlays presenting these information was found to increase system transparency and trust.
In summary, there is substantial evidence for the effectiveness of in-vehicle displays that visualize upcoming maneuvers using a camera feed and/or arrows for the manipulation of intention transparency in AVs. Concepts related to perception transparency have been successfully manipulated by highlighting relevant traffic objects, e.g., using bounding boxes or signaling colors. Thus, in the current study, intention transparency is manipulated using displays that are either turned off, present a camera feed from the windshield of the vehicle, or a camera feed with an overlay consisting of arrows that indicate the next maneuver of the AV. Perception transparency is manipulated using the same displays, either highlighting relevant traffic objects and road users with bounding boxes or not. However, little is known about the suitability of this type of information display for rearward facing passengers [50]. The forward view allows the occupants to verify the information presented and to relate them to the real traffic situation. This could have an impact on the influence of the HMIs on the various factors related to acceptance. Thus, seating orientation is manipulated by participants either facing in or against the direction of travel.
Additionally, the passengers in the studies mentioned were not distracted by a NDRT. While this is appropriate for evaluating of the general effectiveness of the HMIs presupposing the passengers’ attention, this attention cannot be guaranteed in fully autonomous vehicles. The capacity to engage in a variety of NDRTs is one of the main advantages of L4 and L5 AVs in general and of rearward facing seats in specific. It is unclear whether passengers engaged in a NDRT require information regarding the AV’s intention and perception and whether display-based iHMIs are suitable for conveying this information.
The aim of this study is to determine the influences of informational displays and the seating orientation of passengers on intention and perception transparency. Furthermore, the relationships described in the model are examined in order to explore the connection between seating orientation and acceptance of fully autonomous vehicles.
Most of the existing AV acceptance models are generated through data from online-questionnaires and samples of naive participants that have had little or no real-life interaction with AVs. The question arises whether the proposed relationships hold true when participants obtained realistic mental models based on hands-on experience with the AV [14]. Especially when investigating factors like seating orientation and motion sickness, this first-hand experience is necessary to derive implications for the development of acceptance promoting HMIs [54].
2. Materials and Methods
2.1. Design
A 2x2x3 mixed design with seating orientation (forward facing vs. rearward facing) and intention transparency (no image vs. camera feed vs. camera feed + arrows) as within-subjects variables and the perception transparency (bounding boxes vs. no bounding boxes) as a between subjects variable was implemented. As no bounding boxes were displayed in the "no image" condition, this resulted in a nested design. The operationalization of intention- and perception transparency is described in greater detail in the subsection "transparency displays".
2.2. Dependent Variables
All data were pseudonymised and processed confidentially. Online questionnaires and questionnaires assessed between the journeys were administered using LimeSurvey Cloud Version 5.6.49 (Limesurvey GmbH).
Motion Sickness was assessed during the rides using the Fast Motion Sickness Scale (FMS, Keshavarz and Hecht [55]). It is a single item scale ranging from 0 (no sickness at all) to 20 (frank sickness). This single item scale was chosen to minimize distraction from the NDRT and allow for continuous assessment of motion sickness over the course of the journeys.
Trust was assessed after each journey, using a modified version of the Situational Trust Scale for Automated Driving (STS-AD, Holthausen et al. [56]). STS-AD assesses trust on the basis of six statements about the topics of trust in the AV, performance, NDRT, risk, judgement, and reaction and is rated on a seven-point scale ranging from 1 (completely disagree) to 7 (completely agree). The term ’in this situation’ was changed to ’during the ride’ to enable trust ratings for the entire journey. Between-journey trust is defined as mean STS-AD scores awarded across the six queries.
Driving involvement, intention transparency and perception transparency were also assessed after each journey. For intention- and perception transparency, German adaptations of the system transparency items used by Choi and Ji [22] were implemented, which consist of three statements for each construct. For driving involvement, a self-devised questionnaire consisting of six statements about the respondents’ monitoring of the journeys was used. Participants rated their approval of the statements of each of these three questionnaires on a six-point scale from 1 (completely disagree) to 6 (completely agree).
Hedonic motivation was assessed after each journey with the scale used by Venkatesh et al. [18]. It measures the participants’ approval of three statements about the fun of using a device on a seven-point scale ranging from ’1 - Strongly disagree’ to ’7 - Strongly agree’. The term ’mobile internet’ was replaced by ’autonomous vehicles’.
Perceived usefulness was assessed after each journey using a modified version of the scale used by Xu et al. [31], which is based on the scale used by Davis [57]. The four items used by Xu et al. were supplemented by an item from Davis et al. that assesses the usefulness of AVs in case of impairment of the respondent, because this aspect was not taken into account by Xu et al. Thus, participants approval of five statements about the usefulness of AVs were rated on a seven-point Likert scale ranging from ’1 - strongly disagree’ to ’7 - strongly agree’.
Lastly, acceptance was assessed after each journey. It was measured as the behavioral intention to use the AV [13,15,16,17]. Behavioral intention was assessed using the two items ’Would you use such a vehicle when sitting against the direction of travel?’ and ’Would you use such a vehicle when sitting in the direction of travel?’ and the response options ’Yes’ and ’No’.
Gaze behavior was assessed using eye tracking glasses (Tobii Pro Glasses 3, Tobii AB 2023). Eye tracking data was collected for exploratory analyses.
2.3. Control Variables
Data for the following variables was collected through an online survey prior to the initial drive. The data obtained was then matched with data gathered during the study using unique codes generated by each participant. Susceptibility to motion sickness was evaluated using a shortened version of the Motion Sickness Susceptibility Questionnaire (MSSQ-Short; Golding [58]), which comprises 18 items. Nine of these items gauge the frequency of experiencing nausea in different motion-related situations before turning twelve, rated on a four-point scale from “never felt sick” to “frequently felt sick”, while the remaining nine measure similar frequencies over the past decade.
Affinity for technology was assessed using the Affinity for Technology Interaction scale (ATI; Franke et al. [59]). Driving experience was assessed through questions about annual mileage, usage frequency of various means of transportation, years of driver license ownership and level of pleasure experienced while driving (as a driver and passenger). Additionally, prior knowledge of autonomous driving and experience with car automation systems were assessed. Propensity to trust was rated on a five-point scale ranging from 1 (strongly disagree) to 5 (strongly agree) via the Propensity to Trust Machines scale employed by [60].
Fixation duration on the displays was measured using eye-tracking data. This was done to relate potential effects of the intention- and perception transparency manipulations to the visual attention these manipulations from the participants.
2.4. Sample
The sample consisted of 51 participants, 30 males and 21 females. Participants were between 19 and 58 years of age (M = 32.46, SD = 10.16). Each participant had a German citizenship. 64 % were employed, twenty-two % were students. All participants were recruited via the mailing list of the DEKRA Automobil GmbH, having met the inclusion criteria of not having any previous experience with autonomous vehicles or the pedal and steering robot, and being 18 years of age or older. Participants were compensated individually, either as working hours, with guided tours over the DEKRA Lausitzring, or financially with 30 Euros.
Descriptive analyses were based on a sample of 45 participants, as one participant did not complete the pre-questionnaire. Of the initial 51 participants, five participants (10%) prematurely terminated the study due to high motion sickness. These dropouts were excluded from the analyses and only used for a descriptive comparison. The remaining participants had held their driving license for an average of 13.79 years (SD = 9.93, min = 0, max = 33). They drove an average of 18,389 km per year (SD = 11,558, min = 0, max = 40,000) and reported greater joy when driving themselves compared to being driven. The mean score for the driver was 4.36 (SD = 0.86, min = 1, max = 5), while the mean score for the co-driver was 3.18 (SD = 0.84, min = 1, max = 4). The most frequently used mode of transportation was the car. The average score for prior knowledge in the field of autonomous driving was 2.10 (SD = 0.69, min = 1, max = 3.67), which corresponds to little prior knowledge. The sample had mean ATI of 4.20 (SD = 0.91, min = 1.67, max = 6), which corresponds to relatively high ATI samples tested by [59]. The mean propensity to trust technology was 3.66 (SD = 0.74, min = 1.83, max = 5), which is relatively high when compared with the sample tested by [61]. The mean MSSQ-Short raw score was 8.35 (SD = 8.54, min = 0, max = 32.38). In comparison to the population tested by Golding (2006), the participants’ motion sickness susceptibility scored between the 0th and 96.58th percentile, with an overall mean of 38.5th percentile against Golding’s (2006) population. The percentile including dropout participants shifted the overall mean to the 43.8th percentile, indicating a higher susceptibility to motion sickness in dropout participants. Based on magnitude estimation, facing forward was clearly preferred over facing rearward for all modes of transportation. Facing rearward in cars was rated as the third least preferred of the 14 options, while facing forward was by far the most preferred.
2.5. Apparatus
A Volkswagen T6 Multivan (2-liter Diesel engine, 200 HP, automatic dual clutch transmission) served as the test vehicle (Figure 2). It featured three rows of seats, with the seats in the middle row being rotated by 180 degrees, causing the seats of the second and third rows to face each other. Participants sat in the second and third row of seats, which were mounted 60 centimeters apart, and the backrest was set at an 100° angle relative to the seating surface. 13-inch LC-displays (Faytech n.d.) with a resolution of 1920x1080 pixels were mounted between the seats of the second and third row, respectively. They were positioned at a height of 85.5 cm from the vehicle floor (lower edge) and 7 cm behind the seats. Each display was visible to participants sitting in the opposite seating row (Figure 2). Vomit bags were provided within easy reach. To enhance the impression of an AV, a magnet board stating ’autonomous vehicle’ was placed on each side of the vehicle. Additionally, four dummy cameras were attached to the vehicle roof.
A Logitech BRIO 4K STREAM EDITION webcam was mounted on the windscreen next to the rear-view mirror, streaming live video of the view from the windscreen to the displays at 1280x720 pixels and 60 frames per second. The camera had a 90-degree field of view and was equipped with a polarisation filter to prevent overexposure. The display manipulations in the rear of the vehicle (visible to rearward facing participants) showed a horizontally mirrored video. Preliminary tests showed that this reduced the discrepancy between expected and actual vehicle movements during turning maneuvers. One drawback, however, was the perception of left-hand driving. The display manipulations were processed by a Jetson AGX Orin Developer Kit (hereafter: Jetson; NVIDIA Corporation, 2023). The experimenter sat in the passenger seat and controlled the Jetson and the display manipulations. The SFPhybrid automated driving system for cars (Stähle GmbH, n.d.) was installed in the test vehicle (Figure 2). It consists of a robot comprising various actuators and the internal measuring unit ADMA-SLIM from GeneSys. The robot combines actuators from the AUTOPILOT HYBRID series, including acceleration and braking actuators, with the STEERING ACTUATOR SSP-FrontFree, both controlled by a mobile control unit. ADMA-SLIM is a GPS-based system mounted on the roof of the vehicle. It measures the vehicle’s motion in all three axes to provide precise position and motion determination (GeneSys Elektronik GmbH, 2023).
To program the route, the course was first driven manually, with the lateral and longitudinal movements of the vehicle recorded by ADMA-SLIM. Synoptically, the systems did not use vehicle sensors to capture the environment; instead, all vehicle motion was hard-coded. Throughout the experiment, a safety driver sat in the driver’s seat and observed the robot’s performance. He was trained to shut down the technology and take back control of the vehicle if the robot was not performing as intended. He had no other influence on the driving performance.
The test was conducted at the DEKRA Lausitzring test track in Klettwitz, Germany. The track included sections simulating urban and rural roads and a motorway. Speeds reached up to 50 km/h on the urban sections, up to 70 km/h on the rural sections and up to 100 km/h on the motorway. The route included four scenarios (two urban, one rural, one highway) to increase realism (Figure 3).
Scenario 1 (Urban): The AV enters a roundabout. As it exists the roundabout after half a rotation, a perviously hidden cyclist played by a confederate crosses the exit lane of the roundabout on a bicycle priority lane. The AV performs an abrupt breaking maneuver and waits for the cyclist to cross.
Scenario 2 (Rural): The AV drives along a rural road at 70km/h as a boar unexpectedly crosses the road. The AV performs an emergency break and comes to a halt just in front of the crossing boar. The boar was stuffed and attached to a rolling board, which was pulled along the road with a rope by a confederate who was not visible to the test subjects.
Scenario 3 (Highway): The AV drives along a highway at 100km/h. It enters a construction site involving a speed restriction to 60km/h and a chicane. Another car, driven by a DEKRA test driver overtakes the AV at 70km/h inside the chicane.
Scenario 4 (Urban): The AV turns right at an intersection. A pedestrian played by a confederate previously invisible to the AV’s passengers crosses the road unexpectedly. The AV performs an abrupt breaking maneuver and waits for the pedestrian to cross.
Training of the confederates ensured reliable timing of the scenarios. The route was driven anticlockwise (scenario order 1, 2, 3, 4) and clockwise (scenario-order 4, 3, 2, 1,) to minimize learning effects (Figure 4). Order of route direction was counterbalanced between groups.
2.6. Transparency Displays
Depending on the intention transparency condition, the displays were either turned off, showed only the camera feed or displayed the camera feed with the arrow overlay. Perception transparency was either enabled or disabled, depending on the group condition. This resulted in five experimental conditions: displays off, camera feed without bounding boxes, camera feed with bounding boxes, arrow overly without bounding boxes or arrow overlay with bounding boxes. Both arrows and bounding boxes were programmed to superimpose the live stream video using Python 3.11 (64-bit). The design of the arrow overlay was based on insights from previous studies investigating transparency in autonomous vehicles, the state of practice in navigation systems, German road signs, and Gestalt principles [33,62,63,64]. Additionally, an expert workshop with eight professionals in the fields of human factors and industrial design was conducted to evaluate several design proposals. This resulted in six different navigation symbols: navigation arrow, acceleration, braking, roundabout, turns, and a neutral state/standing (Figure 5). Adobe Illustrator and Adobe Photoshop (Adobe, 2023) were used for the design. DaVinci Resolve Version 18.6 (Blackmagic Design Pty. Ltd., 2023) was employed to create an animated video involving the navigation symbols appropriate for each course. This overlay video was exported including the alpha channel color, allowing for a transparent background, and enabling it to be overlaid onto the camera feed.
All symbols featured the same curve radius, perspective degree, color, and stroke weight to account for the Gestalt principle of similarity. Additionally, proximity and similarity were utilized in the design of the acceleration and braking navigation symbols. The choice of presentation colors was guided by the figure-ground Gestalt principle, incorporating insights from Künzer [65] regarding the perception of danger or safety based on coloration. Consequently, colors such as green or red were omitted, as they could erroneously imply safe or unsafe maneuvers of the experimental vehicle, potentially contradicting the actual situation (e.g., in the event of an emergency brake). Moreover, these colors are commonly interpreted as ’stop’ and ’go’ within the automotive context [66]. Cyan, recommended for external AV communication as a neutral color [66,67], as well as purple were deemed unsuitable in the present context, as it would not sufficiently contrast with the tarmac. Instead, magenta was chosen as it showed a good figure-ground effect, while still conveying a neutral vehicle state.
Previous research has frequently examined augmented reality representations for vehicle transparency, which emerged as a preferred representation by most participants [62,64]. To account for this preference, the perspective of the navigation symbols was adjusted by two 8-degree rotations to create the illusion of the symbols lying on the ground, and the vehicle driving over them (Figure 5). The intention transparency manipulation was integrated into the Python code, allowing it to function independently and in conjunction with the perception transparency manipulation.
Bounding boxes for perception transparency were generated using Ultralytics’ object recognition software YOLOv8 (Ultralytics Inc., 2023). YOLOv8 is a real-time object detection and image segmentation model based on deep learning and computer vision. As models with large packages were found to introduce increased display manipulation delays without significantly enhancing object detection performance, the model with small package size was chosen for this study. YOLOv8 can detect objects belonging to different classes defined in the COCO dataset (Ultralytics Inc., 2023). For this study, only the categories of person, bicycle, and car were utilized to identify road users. Categories such as road signs were excluded as the corresponding identifications proved to be unreliable. Additionally, a variety of animals (cat, dog, horse, sheep, cow, elephant, bear) were employed to identify the boar, as there is no specific category for it in the dataset. Assigning different color to each category resulted in a cluttered scene due to the software frequently switching categories based on confidence levels for individual objects. Therefore, the code was modified to assign a single color to all objects. Cyan was chosen, as it showed sufficient contrast against the general background of the camera feed.
2.7. NDRT
Participants were instructed to play ’Stadt-Land-Fluss’, the German version of ’Categories’. The categories were given by the trainer and distributed in such a way that the level of difficulty varied as little as possible between trips. Participants were instructed to engage in the NDRT to the extent that they felt comfortable, in order to mimic a realistic automated journey and to facilitate social interaction. This NDRT was chosen for a number of reasons. Firstly, it was considered to be a representative task for this particular seating arrangement as it is a popular social activity during long bus or train journeys. It consists of reading and writing, as well as occasional glances through the windows, e.g. when thinking of an appropriate word. In this way, motion sickness can be induced while still allowing for practical visual differences between seating orientation conditions. It offers a moderate cognitive load that keeps participants engaged throughout the study without overwhelming them. Finally, the general set of rules is well known within the general population of the sample, eliminating the need for extensive instruction or training.
2.8. Procedure
Participants completed the pre-trial questionnaire online prior to the in-situ experiment. On arrival at the test track, participants were greeted by the experimenter, who verbally explained the purpose of the study, the test procedure and participants’ rights. Participants were able to withdraw from the study at any time without consequence or justification. A trial was terminated if a participant reached a FMS value higher than sixteen, which did not occur. Participants then gave informed consent to participate in the study. The eye trackers were introduced and set up. For spectacle wearers, corrective lenses were integrated into the eye tracking goggles. The steering robot was presented to the participants to ensure that they were aware of the autonomy of the test vehicle. Questions about the steering robot’s capabilities were left until the end of the study to avoid influencing trust ratings by revealing that the robot was following a pre-programmed route. Questions about whether the steering robot would drive on its own were answered in the affirmative. Throughout the study, the experimenter emphasized ’automated’ driving rather than ’autonomous’ driving to avoid misinformation. Instructions for the questionnaires on the tablet, the NDRT and the live scale on the clipboard were given, including the rules of the NDRT. The functionality of the displays was then explained.
After calibration of the eye tracking glasses, the first journey started. During the journeys, participants played the ’Categories’ and answered the FMS as well as the within-journey trust scale. After each trip, participants completed the scales for the remaining dependent variables and then changed seats. Order of seating orientation was randomized such that each participant experienced three journeys in forward facing and three journeys in rearward facing seating orientation. Participants experienced the ride in forward facing seating orientation on the co-driver´s seating side at least once as the robot was best visible from here. Afterwards, the next journey started. Overall, participants completed six journeys. Additionally, groups were randomly assigned to the two bounding boxes conditions. Order of display manipulation was counterbalanced between groups. Finally, the participants were thanked for their participation. A debriefing about the robot’s real capabilities was given to all participants via email after data collection was completed to prevent spread of information onto future participants.
3. Results
Mixed model analysis of variance were applied to assess the effects of seating orientation (forward, rearward), intention transparency (IT: no image vs. camera feed vs. camera feed + arrows), and perception transparency (PT: bounding boxes vs. no bounding boxes) on measured intention- and perception transparency, motion sickness, trust, driving involvement, hedonic motivation and perceived usefulness. Each outcome was analyzed separately with fixed effects for the factorial design (SeatingOrientation × IT × PT) and random intercepts for subjects to account for repeated measures [68]. Due to the nested data structure where PT “ON” combined with IT “OFF” effectively functioned as “OFF,” causing unequal group sizes, a mixed model was preferred over classical ANOVA, which assumes balanced data [69].
This mixed model serves as an extension of factorial ANOVA that explicitly handles complex nesting and repeated measures. Type III ANOVA F-tests were estimated within this mixed model framework using the lmerTest package. After fitting via restricted maximum likelihood estimation, the package applies Satterthwaite’s approximation to compute denominator degrees of freedom for each fixed effect.
Two ANOVAs serve as manipulation checks to verify whether the HMIs were capable of improving intention- and perception transparency ratings in forward- and rearward facing AV passengers occupied with a NDRT. The ANOVA with intention transparency ratings as the dependent variable showed a significant main effect of seating orientation. Passengers reported higher intention transparency when facing forward (M = 4.00, SD = 0.90) than when facing rearward (M = 3.48, SD = 1.03, F(1,221.45) = 28.53, p < .001, = 0.114). None of the other main effects or interactions showed significance. Means and standard deviations for each condition are shown in Figure 9.
Perception transparency rating were descriptively higher when the bounding boxes were visible (M = 4.53, SD = 0.77), than when they were not (M = 4.39, SD = 0.72). However, neither this nor any other main effect or interaction regarding perception transparency ratings reached significance.
3.1. Motion Sickness
Passengers experienced significantly stronger motion sickness when facing rearwards (M = 2.02, SD = 2.78) than when facing forwards (M = 1.51, SD = 2.30, F(1,221.05) = 12.86, p < .001, = 0.055). Again, there where no other significant main effects or interactions. Figure 6 provides an overview of the means and standard deviations for each condition.

Table 1.
Type III ANOVA Results from Mixed-Effects Models
| Dependent Variable | Effect | F | dfeffect | dferror | p-value | Partial |
|---|---|---|---|---|---|---|
| Intention Transparency | SeatingOrientation | 28.534 | 1 | 221.449 | <.001*** | 0.114 |
| IT | 0.456 | 2 | 234.877 | .634 | 0.004 | |
| PT | 0.005 | 1 | 251.253 | .942 | 0.000 | |
| SeatingOrientation:IT | 0.284 | 2 | 221.449 | .753 | 0.003 | |
| SeatingOrientation:PT | 0.012 | 1 | 221.449 | .914 | 0.000 | |
| IT:PT | 0.773 | 1 | 221.449 | .380 | 0.003 | |
| SeatingOrientation:IT:PT | 0.377 | 1 | 221.449 | .540 | 0.002 | |
| Perception Transparency | SeatingOrientation | 2.777 | 1 | 221.401 | .097. | 0.012 |
| IT | 0.635 | 2 | 232.370 | .531 | 0.005 | |
| PT | 0.437 | 1 | 263.859 | .509 | 0.002 | |
| SeatingOrientation:IT | 0.146 | 2 | 221.401 | .864 | 0.001 | |
| SeatingOrientation:PT | 2.088 | 1 | 221.401 | .150 | 0.009 | |
| IT:PT | 0.004 | 1 | 221.401 | .947 | 0.000 | |
| SeatingOrientation:IT:PT | 0.128 | 1 | 221.401 | .720 | 0.001 | |
| Motion Sickness | SeatingOrientation | 12.859 | 1 | 221.052 | <.001*** | 0.055 |
| IT | 0.935 | 2 | 224.687 | .394 | 0.008 | |
| PT | 0.017 | 1 | 245.661 | .896 | 0.000 | |
| SeatingOrientation:IT | 0.002 | 2 | 221.052 | .998 | 0.000 | |
| SeatingOrientation:PT | 2.586 | 1 | 221.052 | .109 | 0.012 | |
| IT:PT | 2.632 | 1 | 221.052 | .106 | 0.012 | |
| SeatingOrientation:IT:PT | 0.002 | 1 | 221.052 | .968 | 0.000 | |
| Trust | SeatingOrientation | 7.845 | 1 | 221.000 | .006** | 0.034 |
| IT | 0.431 | 2 | 236.300 | .650 | 0.004 | |
| PT | 1.220 | 1 | 265.992 | .270 | 0.005 | |
| SeatingOrientation:IT | 0.199 | 2 | 221.000 | .820 | 0.002 | |
| SeatingOrientation:PT | 2.350 | 1 | 221.000 | .127 | 0.011 | |
| IT:PT | 0.008 | 1 | 221.000 | .927 | 0.000 | |
| SeatingOrientation:IT:PT | 0.005 | 1 | 221.000 | .945 | 0.000 | |
| Driving Involvement | SeatingOrientation | 0.790 | 1 | 220.869 | .375 | 0.004 |
| IT | 0.803 | 2 | 0 | 1.000 | 1.000 | |
| PT | 0.102 | 1 | 0 | 1.000 | 1.000 | |
| SeatingOrientation:IT | 0.222 | 2 | 220.869 | .801 | 0.002 | |
| SeatingOrientation:PT | 2.663 | 1 | 220.869 | .104 | 0.012 | |
| IT:PT | 0.002 | 1 | 220.869 | .960 | 0.000 | |
| SeatingOrientation:IT:PT | 0.023 | 1 | 220.869 | .879 | 0.000 | |
| Hedonic Motivation | SeatingOrientation | 10.492 | 1 | 220.858 | .001** | 0.045 |
| IT | 0.874 | 2 | 0 | 1.000 | 1.000 | |
| PT | 0.008 | 1 | 0 | 1.000 | 0.996 | |
| SeatingOrientation:IT | 0.377 | 2 | 220.858 | .687 | 0.003 | |
| SeatingOrientation:PT | 3.067 | 1 | 220.858 | .081. | 0.014 | |
| IT:PT | 0.601 | 1 | 220.858 | .439 | 0.003 | |
| SeatingOrientation:IT:PT | 0.612 | 1 | 220.858 | .435 | 0.003 | |
| Perceived Usefulness | SeatingOrientation | 4.597 | 1 | 220.877 | .033* | 0.020 |
| IT | 0.378 | 2 | 226.044 | .686 | 0.003 | |
| PT | 0.134 | 1 | 223.885 | .715 | 0.001 | |
| SeatingOrientation:IT | 0.591 | 2 | 220.877 | .554 | 0.005 | |
| SeatingOrientation:PT | 1.465 | 1 | 220.877 | .227 | 0.007 | |
| IT:PT | 0.882 | 1 | 220.877 | .349 | 0.004 | |
| SeatingOrientation:IT:PT | 0.496 | 1 | 220.877 | .482 | 0.002 | |
| Fixation Duration Display | SeatingOrientation | 3.393 | 1 | 217.137 | .067. | 0.015 |
| IT | 1.394 | 2 | 227.322 | .250 | 0.012 | |
| PT | 1.521 | 1 | 127.743 | .220 | 0.012 | |
| SeatingOrientation:IT | 2.789 | 2 | 217.230 | .064. | 0.025 | |
| SeatingOrientation:PT | 1.016 | 1 | 216.950 | .315 | 0.005 | |
| IT:PT | 0.016 | 1 | 216.950 | .900 | 0.000 | |
| SeatingOrientation:IT:PT | 0.906 | 1 | 216.950 | .342 | 0.004 |
Note. Significance indicators: *** , ** , * , . . Partial = partial eta squared effect sizes. F = F statistic; = numerator degrees of freedom; = denominator degrees of freedom.
3.2. Trust
The ANOVA with trust as the independent variable also revealed a significant effect of seating orientation. Passengers reported higher trust when facing forward (M = 4.88, SD = 0.90) than when facing rearward (M = 4.71, SD = 0.89, F(1,221) = 7.85, p = .006, = 0.034). No other main effects or interactions reached significance. Means and standard deviations for each experimental condition are shown in Figure 6.
3.3. Driving Involvement, Hedonic Motivation and Perceived Usefulness
The ANOVA including driving involvement as the dependent variable showed no significant main effects or interactions.
Hedonic motivation scores were significantly higher when facing forward (M = 4.98, SD = 1.31) than when facing rearward (M = 4.76, SD = 1.42, F(1,220.89) = 10.49 , p = .001, = 0.045).
Passengers reported significantly higher perceived usefulness when facing forward (M = 5.16, SD = 1.30) than when facing rearward (M = 5.06, SD = 1.26, F(1,220,88) = 4.59, p = .033, = 0.020). No other main effects or interactions reached significance.
3.4. Gaze Behavior
The same mixed model ANOVA using mean fixation time on the transparency displays as the dependent variable showed no significant effects. On average, participants spent 3.6% of the journeys duration looking at the displays (M = 11.9s, SD = 16.1s).
3.5. Behavioral Intention
To test whether behavioral intention to use AVs facing rearwards is lower than facing forward, McNemar’s Chi-squared test with continuity correction was conducted. Behavioral intention to use AVs facing forward was significantly greater than facing rearward (, p < 0.001). The odds of a "Yes" response were 4.5 times higher for forward facing than for rearward facing (OR = 0.22), with a large effect size (Cohen’s g = -0.64). The proportion difference was -0.18, meaning forward facing had a 18% higher "Yes"-rate.
3.6. Indirect Effects
To assess indirect effects of intention- and perception transparency and seating orientation on AV acceptance through the other factors of the model, a structural equation model was specified. First, the model proposed in Figure 1 was estimated using robust maximum likelihood (MLR) with 1000 bootstrap samples, taking into account clustering by subject ID. Behavioral intention as a dichotomous outcome was not included in this model. Non-significant paths were then iteratively removed, with a model comparison to the previous best-fitting model after each iteration. Model comparisons were based on CFI, TLI, RMSEA, SRMR, AIC, and BIC. Having identified the best fitting model after path omission, modification indices were examined to identify previously unaccounted for paths that could improve model fit. Only paths that were theoretically justified and had modification indices > 3.84 were considered for inclusion in the model [70]. These paths were added to the model iteratively, again retaining the best-fitting model at each iteration.
The SEM summary is shown in Table 2. The model showed good fit (CFI = 0.969, TLI = 0.916, RMSEA = 0.06, SRMR = 0.05, (11) = 18.11, p = .079, all scaled and robust versions calculated under the MLR estimator). As expected, seating orientation predicted intention transparency to a significant degree. However, the same was not true for perception transparency. Intention transparency predicted neither trust nor motion sickness significantly, however, it did predict driving involvement. Perception transparency predicted trust, but not driving involvement. Motion sickness predicted driving involvement, hedonic motivation and trust, but not perceived usefulness. Trust predicted perceived usefulness, hedonic motivation and driving involvement.
To assess the influence of trust, perceived usefulness and hedonic motivation on behavioral intention, a logistic regression was conducted. Specifically, we used a cluster-robust Firth’s penalized logistic regression with intercept correction and bootstrap inference. [71,72]. Coefficients were bootstrapped with 1000 replicates using case resampling at the the participant level. Odds ratios with 95% confidence intervals were calculated and extracted. A one-point increase on the STS-AD scale increased the odds of intending to use an AV while being seated rearwards by a factor of OR = 2.22, 95% CI [1.20, 4.38]. A one-point increase in hedonic motivation increased the odds by a factor of OR = 1.73, 95% CI [1.20, 4.38]. The odds ratio for perceived usefulness was OR = 1.54, 95% CI [0.88, 2.99]. However, since the confidence interval includes 1, no decisive conclusions can be drawn about its relationship with behavioral intention. The final model is shown in (Figure 7).
4. Discussion
A subject study on a test track was implemented to validate a model that predicts the acceptance of AVs based on the seating orientation of their passengers. Using a test vehicle equipped with a steering- and pedal robot, seating orientation and vehicle transparency were manipulated. Intention transparency was manipulated using in-vehicle displays that were either turned off, showed a live camera feed of the view from the windshield, or AR arrows indicating the vehicles next maneuver as an overlay on the camera feed. Perception transparency was manipulated by either displaying bounding boxes around relevant traffic objects as an overly on the camera feed, or not. Data was gathered on factors that are theorized to influence AV acceptance and to be influenced on seating orientation.
The influences of seating orientation, as well as intention- and perception transparency manipulation on motion sickness, trust, driving involvement, perceived usefulness and hedonic motivation were examined using mixed repeated measures ANOVAs. As expected, subjects reported lower levels of intention transparency, trust, hedonic motivation, perceived usefulness and higher levels of motion sickness when facing rearward. Subjects also reported a higher likelihood of using AVs facing forwards than rearwards. However, seating orientation did not effect perception transparency. Importantly, the manipulations of neither intention nor perception transparency had any significant effect on any of the model variables.
The structural equation model revealed that Intention transparency was found to predicted trust, while perception transparency was not. It is interesting to note, however, that motion sickness was not found to be predicted by intention transparency, but by seating orientation directly. Motion sickness was found to predict hedonic motivation and perceived usefulness. While motion sickness was not found to predict behavioral intention directly, it unexpectedly was found to predict trust. Trust and hedonic motivation were found to predict behavioral intention, while no conclusive statement can be made about perceived usefulness. However, these results should be interpreted cautiously due to the small sample size, which falls below recommended thresholds [73,74]. While robust estimators (MLR) and bootstrapping were used to mitigate bias, the model’s complexity and limited power increase uncertainty in parameter estimates and fit indices. Future studies should validate these findings using larger samples.
One central finding is the failure of the intention and perception transparency manipulations. This is surprising, as similar manipulations showed significant effects in previous studies [49,50,51,52,53].
Analysis of the gaze behavior showed that the participants paid very little attention to the displays in general. Mean fixation duration on the displays was only 3.6% of the journey duration. While we did not explicitly ask the participants why they spent such little time monitoring the displays, several participants reported that they were too preoccupied with the NDRT to pay sufficient attention to the displays. As the majority of previous studies that report evidence in favor of the effectiveness of similar manipulations did not involve NDRTs, this is a plausible explanation. The possibility of conducting NDRTs is considered one of the most impactful advantages of AVs in general and the living room seating layout in particular and passengers are expected to spend a significant proportion of their traveling time with NDRTs [75,76]. Thus, having participants engaged in a NDRT poses a realistic use case that should not be neglected when investigating AV acceptance.
This suggests that displays requiring the passengers’ attention might not be suitable for information transmission in fully autonomous vehicles [77]. Especially when information is provided continuously, such as when visualizing the vehicle’s maneuvers, passengers either need to split their attention between NDRT and iHMI or decide for one of the two. Even though participants in this study were instructed to only engage in the NDRT to the amount they felt comfortable with, this resulted in lack of effectiveness of the iHMI.
Rearward facing passengers experienced lower levels of intention transparency than forward facing passengers. This supports the notion that eliminating the visibility of the vehicle apron limits the passengers’ ability to predict upcoming maneuvers. Perception transparency, on the other hand, did not depend on seating orientation. The road users in three of the four scenarios were first visible from the windshield and only visible from the rear windshield after the scenario was finished (pedestrian, cyclist, boar), while the overtaking vehicle in the highway construction site was first visible from the rear windshield. A possible explanation for this could be that participants learned the positions of the scenarios despite the randomization of driving direction.
While rearward facing passengers reported lower levels of intention transparency and higher levels of motion sickness, we did not find substantial evidence for or against a relationship between intention transparency and motion sickness. This raises the question what aspect of the rearward facing seating orientation caused the increase in motion sickness. It is still not entirely clear to what degree a mismatch between anticipated and sensed motion as opposed to a mismatch between different simultaneous sensory inputs, e.g. for the visual and the vestibular organs, contributes to the development of motion sickness. Susceptibility to motion sickness has been shown in blind people [78], but less so than in sighted people [79], suggesting that visual input is not necessary for the development of motion sickness, but mediates it. Thus, a conflict between visual and vestibular information regarding self-motion cannot be the sole cause of motion sickness. When Bloch [5] compared visual cues indicating the maneuvers of an AV, either 500ms in advance or in real time, both conditions reduced motion sickness to a similar degree. This indicates that a conflict between anticipated and sensed self-motion cannot be the sole cause of motion sickness, either. Comparing the influences of both conflicts directly in future studies could yield more insights into the development and mitigation of motion sickness.
The direct relationship between motion sickness and behavioral intention found previously was not confirmed in this study [80]. The consideration of trust and hedonic motivation, both found to be predicted by motion sickness, might explain this discrepancy. However, there was a link between motion sickness and actual system usage, as all five dropouts in this study stated motion sickness as the reason for discontinuing the experiment. This highlights the importance of real system experience when modeling the acceptance of AVs, as actual AV usage seems to be influenced by immediate physical experiences. It is also possible that the exclusion of these participants from the final analysis prevented the detection of a direct relationship between motion sickness and behavioral intention to use the AV.
The revised model gives insight into the relationship between AV acceptance and seating orientation. Rearward facing passengers have shown an impaired ability to anticipate the vehicle’s maneuvers. They in turn showed less trust in the automation and higher levels of motion sickness. This resulted in reduced hedonic motivation and perceived usefulness of using the AV. Ultimately, this led to less behavioral intention to use AVs. It needs to be addressed that these results are based upon the specific experiences that the subjects made during the study. Therefore, the model does not claim to be generally valid for any type of AV and driving scenario. Some differences in the results compared to previous studies could be explained by the specifics of this test setting. For example, the non-significant relationship between perceived usefulness and behavioral intention could be due to the recreational nature of the pre-defined NDRT. However, the added value in this experimental setting lies in obtaining data from subjects with consistent mental models of AVs based on realistic experiences. In particular, first-hand experience of the factors newly added to this model, such as seating orientation and motion sickness, can differ substantially from the expectations of the participants. Thus, the model provides a basis for design decisions about iHMIs in AVs with living room seating layouts.
Factors such as social influence or personality traits, which are part of various previous models, were not investigated in this study (e.g., [13,14,15,18,20,28,38]). As the aim of this study was to support the development of iHMIs that foster the acceptance of rearward facing seating in AVs by gaining a deeper understanding of the relationship between seating orientation and AV acceptance, we focused on factors that could be influenced by iHMIs. Nevertheless, potential interactions between, for example, social influence and motion sickness cannot be discounted and pose an intriguing subject for future research.
5. Conclusions
The objective of the present study was to gain a more profound understanding of the relationship between seating orientation in AVs and their acceptance. The utilization of steering robotics on a test track enabled the implementation of autonomous journeys, thus allowing for the measurement of factors such as motion sickness and trust under realistic conditions. A reduction in intention transparency and an increase in motion sickness were observed when facing against the direction of travel. The reduced intention transparency was accompanied by reduced trust, which, like the increased motion sickness, was associated with reduced perceived usefulness and thus a reduced behavioral intention to use the AV. These findings illustrate the pivotal roles of seating orientation and motion sickness when modeling AV acceptance, and highlight the necessity for motion sickness mitigating measures to foster this acceptance. Furthermore, displays for the visualization of vehicle maneuvers and detected road users to increase intention and perception transparency were investigated for the first time in a realistic L4 setting including a NDRT. Here, the displays had no effect which emphasizes the need for novel iHMIs to transmit information during visual NDRTs. In addition to the use of other sensory modalities such as haptics and acoustics, the utilization of the AV occupants’ peripheral vision represents a promising approach in this regard. Future research should focus on the design of these iHMIs.
Author Contributions
Conceptualization, L.R. and A.W.; methodology, L.R., A.J. and A.W.; formal analysis, L.R.; investigation, L.R.; data curation, L.R. and A.W.; writing—original draft preparation, L.R.; writing—review and editing, L.R., A.W., A.J. and M.V.; visualization, L.R.; supervision, M.V.; project administration, L.R. All authors have read and agreed to the published version of the manuscript.
Funding
This work is a result of the joint research project STADT:up (Funding code 19A22006M). The project is supported by the German Federal Ministry for Economic Affairs and Climate Action (BMWK), based on a decision of the German Bundestag. The authors are solely responsible for the content of this publication. This work was partly funded by HELLA GmbH und Co. KGaA. The authors express their gratitude to their colleagues and research associates for their support and encouragement.
Institutional Review Board Statement
The study was conducted in accordance with the Declaration of Helsinki, and approved by the Ethics Committee of Faculty 2 of the Technische Universität Braunschweig (FV-2023-19, 29.01.2024).
Informed Consent Statement
Informed consent was obtained from all subjects involved in the study.
Data Availability Statement
The data that has been used is confidential.
Acknowledgments
We would like to thank Prof. Dr.-Ing. Jan-Niklas Voigt-Antons and the Immersive Reality Lab at the Hochschule Hamm-Lippstadt for kindly providing the eye-tracking equipment. We would also like to express our gratitude to the Vehicle Technology Department at Dekra Automobil GmbH at the Lausitzring for their support in conducting the study.
Conflicts of Interest
The authors declare no conflicts of interest. The funders had no role in the design of the study; in the collection, analyses, or interpretation of data; in the writing of the manuscript; or in the decision to publish the results’.
Abbreviations
The following abbreviations are used in this manuscript:
| ATI | Affinity for Technology Interaction scale |
| AV | Autonomous Vehicle |
| FMS | Fast Motion Sickness Scale |
| HMI | Human-Machine Interface |
| iHMI | Internal Human-Machine Interface |
| MSSQ | Motion Sickness Susceptibility Questionnaire |
| NDRT | Non-Driving Related Task |
References
- Jorlöv, S.; Bohman, K.; Larsson, A. Seating Positions and Activities in Highly Automated Cars – A Qualitative Study of Future Automated Driving Scenarios. In Proceedings of the IRCOBI Conference Proceedings, 2017, pp. 13–22.
- Östling, M.; Larsson, A. Occupant Activities and Sitting Positions in Automated Vehicles in China and Sweden. In Proceedings of the 26th International Technical Conference on the Enhanced Safety of Vehicles (ESV): Technology: Enabling a Safer TomorrowNational Highway Traffic Safety Administration, 2019, number 19-0083, pp. 1–9.
- Pettersson, I.; Karlsson, I.M. Setting the Stage for Autonomous Cars: A Pilot Study of Future Autonomous Driving Experiences. IET Intelligent Transport Systems 2015, 9, 694–701. [CrossRef]
- Han, S.; Jung, E.; Jung, M.; Kwahk, J.; Park, S. Psychophysical Methods and Passenger Preferences of Interior Designs. Applied Ergonomics 1998, 29, 499–506. [CrossRef]
- Bloch, M. Alleviating Motion Sickness through Presentations on Interior Panels of Autonomous Vehicles. https://essay.utwente.nl/76160/, 2018.
- Diels, C. Will Autonomous Vehicles Make Us Sick? In Contemporary Ergonomics and Human Factors 2014; Sharples, S.; Shorrock, S., Eds.; Taylor & Francis, 2014; pp. 301–307. [CrossRef]
- Diels, C.; Bos, J.E.; Hottelart, K.; Reilhac, P. Motion Sickness in Automated Vehicles: The Elephant in the Room. In Road Vehicle Automation 3; Meyer, G.; Beiker, S., Eds.; Springer International Publishing: Cham, 2016; pp. 121–129. [CrossRef]
- Diels, C.; Bos, J.E. Self-Driving Carsickness. Applied Ergonomics 2016, 53, 374–382. [CrossRef]
- Heiß, M.A.B.F.E. Fragebogenbasierte Studie Zu Kinetose (Bewegungskrankheit) Während Des Autofahrens. PhD thesis, Charité - Universitätsmedizin Berlin, 2021. [CrossRef]
- Turner, M. Motion Sickness in Public Road Transport: Passenger Behaviour and Susceptibility. Ergonomics 1999, 42, 444–461. [CrossRef]
- Salter, S.; Diels, C.; Herriotts, P.; Kanarachos, S.; Thake, D. Motion Sickness in Automated Vehicles with Forward and Rearward Facing Seating Orientations. Applied Ergonomics 2019, 78, 54–61. [CrossRef]
- Paddeu, D.; Parkhurst, G.; Shergold, I. Passenger Comfort and Trust on First-Time Use of a Shared Autonomous Shuttle Vehicle. Transportation Research Part C: Emerging Technologies 2020, 115, 102604. [CrossRef]
- Hewitt, C.; Politis, I.; Amanatidis, T.; Sarkar, A. Assessing Public Perception of Self-Driving Cars: The Autonomous Vehicle Acceptance Model. In Proceedings of the Proceedings of the 24th International Conference on Intelligent User Interfaces, Marina del Ray California, 2019; pp. 518–527. [CrossRef]
- Nordhoff, S.; Madigan, R.; Van Arem, B.; Merat, N.; Happee, R. Interrelationships among Predictors of Automated Vehicle Acceptance: A Structural Equation Modelling Approach. Theoretical Issues in Ergonomics Science 2021, 22, 383–408. [CrossRef]
- Nordhoff, S.; Malmsten, V.; Van Arem, B.; Liu, P.; Happee, R. A Structural Equation Modeling Approach for the Acceptance of Driverless Automated Shuttles Based on Constructs from the Unified Theory of Acceptance and Use of Technology and the Diffusion of Innovation Theory. Transportation Research Part F: Traffic Psychology and Behaviour 2021, 78, 58–73. [CrossRef]
- Osswald, S.; Wurhofer, D.; Trösterer, S.; Beck, E.; Tscheligi, M. Predicting Information Technology Usage in the Car: Towards a Car Technology Acceptance Model. In Proceedings of the Proceedings of the 4th International Conference on Automotive User Interfaces and Interactive Vehicular Applications, Portsmouth New Hampshire, 2012; pp. 51–58. [CrossRef]
- Venkatesh.; Morris.; Davis.; Davis. User Acceptance of Information Technology: Toward a Unified View. MIS Quarterly 2003, 27, 425, [10.2307/30036540]. [CrossRef]
- Venkatesh.; Thong.; Xu. Consumer Acceptance and Use of Information Technology: Extending the Unified Theory of Acceptance and Use of Technology. MIS Quarterly 2012, 36, 157, [10.2307/41410412]. [CrossRef]
- Zhang, T.; Tao, D.; Qu, X.; Zhang, X.; Lin, R.; Zhang, W. The Roles of Initial Trust and Perceived Risk in Public’s Acceptance of Automated Vehicles. Transportation Research Part C: Emerging Technologies 2019, 98, 207–220. [CrossRef]
- Zhang, T.; Tao, D.; Qu, X.; Zhang, X.; Zeng, J.; Zhu, H.; Zhu, H. Automated Vehicle Acceptance in China: Social Influence and Initial Trust Are Key Determinants. Transportation Research Part C: Emerging Technologies 2020, 112, 220–233. [CrossRef]
- Zhang, T.; Zeng, W.; Zhang, Y.; Tao, D.; Li, G.; Qu, X. What Drives People to Use Automated Vehicles? A Meta-Analytic Review. Accident Analysis & Prevention 2021, 159, 106270. [CrossRef]
- Choi, J.K.; Ji, Y.G. Investigating the Importance of Trust on Adopting an Autonomous Vehicle. International Journal of Human-Computer Interaction 2015, 31, 692–702. [CrossRef]
- Ghazizadeh, M.; Lee, J.D.; Boyle, L.N. Extending the Technology Acceptance Model to Assess Automation. Cognition, Technology & Work 2012, 14, 39–49. [CrossRef]
- Benleulmi, A.Z.; Blecker, T. Investigating the Factors Influencing the Acceptance of Fully Autonomous Cars. In Proceedings of the Proceedings of the Hamburg International Conference of Logistics (HICL);23, Hamburg, 2017; 99 - 115. [CrossRef]
- Buckley, L.; Kaye, S.A.; Pradhan, A.K. Psychosocial Factors Associated with Intended Use of Automated Vehicles: A Simulated Driving Study. Accident Analysis & Prevention 2018, 115, 202–208. [CrossRef]
- Herrenkind, B.; Brendel, A.B.; Nastjuk, I.; Greve, M.; Kolbe, L.M. Investigating End-User Acceptance of Autonomous Electric Buses to Accelerate Diffusion. Transportation Research Part D: Transport and Environment 2019, 74, 255–276. [CrossRef]
- Jing, P.; Xu, G.; Chen, Y.; Shi, Y.; Zhan, F. The Determinants behind the Acceptance of Autonomous Vehicles: A Systematic Review. Sustainability 2020, 12, 1719. [CrossRef]
- Nordhoff, S.; Kyriakidis, M.; Van Arem, B.; Happee, R. A Multi-Level Model on Automated Vehicle Acceptance (MAVA): A Review-Based Study. Theoretical Issues in Ergonomics Science 2019, 20, 682–710. [CrossRef]
- Panagiotopoulos, I.; Dimitrakopoulos, G. An Empirical Investigation on Consumers’ Intentions towards Autonomous Driving. Transportation Research Part C: Emerging Technologies 2018, 95, 773–784. [CrossRef]
- Rahman, M.M.; Deb, S.; Strawderman, L.; Burch, R.; Smith, B. How the Older Population Perceives Self-Driving Vehicles. Transportation Research Part F: Traffic Psychology and Behaviour 2019, 65, 242–257. [CrossRef]
- Xu, Z.; Zhang, K.; Min, H.; Wang, Z.; Zhao, X.; Liu, P. What Drives People to Accept Automated Vehicles? Findings from a Field Experiment. Transportation Research Part C: Emerging Technologies 2018, 95, 320–334. [CrossRef]
- Lee, J.D.; See, K.A. Trust in Automation: Designing for Appropriate Reliance. Human Factors 2004.
- Beggiato, M.; Hartwich, F.; Schleinitz, K.; Krems, J.; Othersen, I.; Petermann-Stock, I. What Would Drivers like to Know during Automated Driving? Information Needs at Different Levels of Automation. In Proceedings of the 7. Tagung Fahrerassistenzsysteme. [object Object], 2015. [CrossRef]
- Detjen, H.; Salini, M.; Kronenberger, J.; Geisler, S.; Schneegass, S. Towards Transparent Behavior of Automated Vehicles: Design and Evaluation of HUD Concepts to Support System Predictability Through Motion Intent Communication. In Proceedings of the Proceedings of the 23rd International Conference on Mobile Human-Computer Interaction, Toulouse & Virtual France, 2021; pp. 1–12. [CrossRef]
- Häuslschmid, R.; Von Bülow, M.; Pfleging, B.; Butz, A. SupportingTrust in Autonomous Driving. In Proceedings of the Proceedings of the 22nd International Conference on Intelligent User Interfaces, Limassol Cyprus, 2017; pp. 319–329. [CrossRef]
- Walker, F.; Forster, Y.; Hergeth, S.; Kraus, J.; Payre, W.; Wintersberger, P.; Martens, M. Trust in Automated Vehicles: Constructs, Psychological Processes, and Assessment. Frontiers in Psychology 2023, 14, 1279271. [CrossRef]
- Cho, Y.; Park, J.; Park, S.; Jung, E.S. Technology Acceptance Modeling Based on User Experience for Autonomous Vehicles. Journal of the Ergonomics Society of Korea.
- Madigan, R.; Louw, T.; Wilbrink, M.; Schieben, A.; Merat, N. What Influences the Decision to Use Automated Public Transport? Using UTAUT to Understand Public Acceptance of Automated Road Transport Systems. Transportation Research Part F: Traffic Psychology and Behaviour 2017, 50, 55–64. [CrossRef]
- Reason, J.T. Motion Sickness Adaptation: A Neural Mismatch Model. Journal of the Royal Society of Medicine 1978, 71, 819–829. [CrossRef]
- Zou, X.; Logan, D.B.; Vu, H.L. Modeling Public Acceptance of Private Autonomous Vehicles: Value of Time and Motion Sickness Viewpoints. Transportation Research Part C: Emerging Technologies 2022, 137, 103548. [CrossRef]
- Metzulat, M.; Metz, B.; Landau, A.; Neukum, A.; Kunde, W. Does the Visual Input Matter? Influence of Non-Driving Related Tasks on Car Sickness in an Open Road Setting. Transportation Research Part F: Traffic Psychology and Behaviour 2024, 104, 234–248. [CrossRef]
- Brietzke, A.; Pham Xuan, R.; Dettmann, A.; Bullinger-Hoffmann, A. Head Motion as Indicator for Visual Anticipation in the Context of Car Sickness; 2020.
- Brietzke, A.; Pham Xuan, R.; Dettmann, A.; Bullinger, A.C. Influence of Dynamic Stimulation, Visual Perception and Individual Susceptibility to Car Sickness during Controlled Stop-and-Go Driving. Forschung im Ingenieurwesen 2021, 85, 517–526. [CrossRef]
- Jones, M.L.H.; , Victor C., L.; , Sheila M., E.; , Kathleen H., S.; , Matthew P., R.; and Sayer, J.R. Motion Sickness in Passenger Vehicles during Test Track Operations. Ergonomics 2019, 62, 1357–1371. [CrossRef]
- Matsangas, P.; McCauley, M.E.; Becker, W. The Effect of Mild Motion Sickness and Sopite Syndrome on Multitasking Cognitive Performance. Human Factors: The Journal of the Human Factors and Ergonomics Society 2014, 56, 1124–1135. [CrossRef]
- Smyth, J.; Birrell, S.; Mouzakitis, A.; Jennings, P. Motion Sickness and Human Performance – Exploring the Impact of Driving Simulator User Trials. In Advances in Human Aspects of Transportation; Stanton, N., Ed.; Springer International Publishing: Cham, 2019; Vol. 786, pp. 445–457. [CrossRef]
- Diels, C.; Thompson, S. Information Expectations in Highly and Fully Automated Vehicles. In Proceedings of the Advances in Human Aspects of Transportation; Stanton, N.A., Ed., Cham, 2018; pp. 742–748. [CrossRef]
- Hoff, K.A.; Bashir, M. Trust in Automation: Integrating Empirical Evidence on Factors That Influence Trust. Human Factors 2015, 57, 407–434. [CrossRef]
- Oliveira, L.; Burns, C.; Luton, J.; Iyer, S.; Birrell, S. The Influence of System Transparency on Trust: Evaluating Interfaces in a Highly Automated Vehicle. Transportation Research Part F: Traffic Psychology and Behaviour 2020, 72, 280–296. [CrossRef]
- Wintersberger, P.; Frison, A.K.; Riener, A.; Sawitzky, T.V. Fostering User Acceptance and Trust in Fully Automated Vehicles: Evaluating the Potential of Augmented Reality. Presence: Teleoperators and Virtual Environments 2018, 27, 46–62. [CrossRef]
- Flohr, L.A.; Valiyaveettil, J.S.; Krüger, A.; Wallach, D.P. Prototyping Autonomous Vehicle Windshields with AR and Real-Time Object Detection Visualization: An On-Road Wizard-of-Oz Study. In Proceedings of the Proceedings of the 2023 ACM Designing Interactive Systems Conference, Pittsburgh PA USA, 2023; pp. 2123–2137. [CrossRef]
- Fröhlich, P.; Schatz, R.; Buchta, M.; Schrammel, J.; Suette, S.; Tscheligi, M. “What’s the Robo-Driver up to?” Requirements for Screen-based Awareness and Intent Communication in Autonomous Buses. i-com 2019, 18, 151–165. [CrossRef]
- Wilbrink, M.; Schieben, A.; Oehl, M. Reflecting the Automated Vehicle’s Perception and Intention: Light-based Interaction Approaches for on-Board HMI in Highly Automated Vehicles. In Proceedings of the Companion Proceedings of the 25th International Conference on Intelligent User Interfaces, Cagliari Italy, 2020; pp. 105–107. [CrossRef]
- Mühlbacher, D.; Tomzig, M.; Reinmüller, K.; Rittger, L. Methodological Considerations Concerning Motion Sickness Investigations during Automated Driving. Information 2020, 11, 265. [CrossRef]
- Keshavarz, B.; Hecht, H. Validating an Efficient Method to Quantify Motion Sickness. Human Factors: The Journal of the Human Factors and Ergonomics Society 2011, 53, 415–426. [CrossRef]
- Holthausen, B.E.; Wintersberger, P.; Walker, B.N.; Riener, A. Situational Trust Scale for Automated Driving (STS-AD): Development and Initial Validation. In Proceedings of the 12th International Conference on Automotive User Interfaces and Interactive Vehicular Applications, Virtual Event DC USA, 2020; pp. 40–47. [CrossRef]
- Davis, F.D. Perceived Usefulness, Perceived Ease of Use, and User Acceptance of Information Technology. MIS Quarterly 1989, 13, 319, [249008]. [CrossRef]
- Golding, J.F. Predicting Individual Differences in Motion Sickness Susceptibility by Questionnaire. Personality and Individual Differences 2006, 41, 237–248. [CrossRef]
- Franke, T.; Attig, C.; Wessel, D. A Personal Resource for Technology Interaction: Development and Validation of the Affinity for Technology Interaction (ATI) Scale. International Journal of Human–Computer Interaction 2019, 35, 456–467. [CrossRef]
- Sinha, R.; Curran, P.G.; Merritt, S.M.; Ilgen, D.R. Role of Trust in Decision Making: Trusting Humans versus Trusting Machines. In Proceedings of the Paper Session at the Academy of Management Annual Meeting, Anaheim, CA, 2008.
- Scholz, D.D.; Kraus, J.; Miller, L. Measuring the Propensity to Trust in Automated Technology: Examining Similarities to Dispositional Trust in Other Humans and Validation of the PTT-A Scale. International Journal of Human–Computer Interaction 2024, pp. 1–24. [CrossRef]
- Bolton, A.; Burnett, G.; Large, D.R. An Investigation of Augmented Reality Presentations of Landmark-Based Navigation Using a Head-up Display. In Proceedings of the Proceedings of the 7th International Conference on Automotive User Interfaces and Interactive Vehicular Applications, Nottingham United Kingdom, 2015; pp. 56–63. [CrossRef]
- Debernard, S.; Chauvin, C.; Pokam, R.; Langlois, S. Designing Human-Machine Interface for Autonomous Vehicles. IFAC-PapersOnLine 2016, 49, 609–614. [CrossRef]
- Detjen, H.; Faltaous, S.; Pfleging, B.; Geisler, S.; Schneegass, S. How to Increase Automated Vehicles’ Acceptance through In-Vehicle Interaction Design: A Review. International Journal of Human–Computer Interaction 2021, 37, 308–330. [CrossRef]
- Künzer, L. ,,Alarmstufe Rot!“ oder ,,Alles im grünen Bereich!“ Farben im Kontext von Gefahr und Sicherheit. PhD thesis, Universität Regensburg, 2016.
- Carmona, J.; Guindel, C.; Garcia, F.; De La Escalera, A. eHMI: Review and Guidelines for Deployment on Autonomous Vehicles. Sensors 2021, 21, 2912. [CrossRef]
- Dey, D.; Habibovic, A.; Pfleging, B.; Martens, M.; Terken, J. Color and Animation Preferences for a Light Band eHMI in Interactions Between Automated Vehicles and Pedestrians. In Proceedings of the Proceedings of the 2020 CHI Conference on Human Factors in Computing Systems, Honolulu HI USA, 2020; pp. 1–13. [CrossRef]
- Kuznetsova, A.; Brockhoff, P.B.; Christensen, R.H.B. lmerTest Package: Tests in Linear Mixed Effects Models. Journal of Statistical Software 2017, 82, 1–26. [CrossRef]
- Murrar, S.; Brauer, M. Mixed Model Analysis of Variance. In The SAGE Encyclopedia of Educational Research, Measurement, and Evaluation; SAGE Publications, Inc., 2018; pp. 1075–1078. [CrossRef]
- Kline, R.B. Principles and Practice of Structural Equation Modeling, fifth edition ed.; Methodology in the Social Sciences, The Guilford Press: New York, 2023.
- Firth, D. Bias Reduction of Maximum Likelihood Estimates. Biometrika 1993, 80, 27–38. [CrossRef]
- Puhr, R.; Heinze, G.; Nold, M.; Lusa, L.; Geroldinger, A. Firth’s Logistic Regression with Rare Events: Accurate Effect Estimates and Predictions? Statistics in Medicine 2017, 36, 2302–2317. [CrossRef]
- Memon, M.A.; Ting, H.; Cheah, J.H.; Thurasamy, R.; Chuah, F.; Cham, T.H. Sample Size for Survey Research: Review and Recommendations. Journal of Applied Structural Equation Modeling 2020, 4, i–xx.
- Wolf, E.J.; Harrington, K.M.; Clark, S.L.; Miller, M.W. Sample Size Requirements for Structural Equation Models: An Evaluation of Power, Bias, and Solution Propriety. Educational and Psychological Measurement 2013, 76, 913–934. [CrossRef]
- Hecht, T.; Feldhütter, A.; Draeger, K.; Bengler, K. What Do You Do? An Analysis of Non-driving Related Activities During a 60 Minutes Conditionally Automated Highway Drive. In Human Interaction and Emerging Technologies; Ahram, T.; Taiar, R.; Colson, S.; Choplin, A., Eds.; Springer International Publishing: Cham, 2020; Vol. 1018, pp. 28–34. [CrossRef]
- Hecht, T.; Darlagiannis, E.; Bengler, K. Non-Driving Related Activities in Automated Driving – An Online Survey Investigating User Needs. In Human Systems Engineering and Design II; Ahram, T.; Karwowski, W.; Pickl, S.; Taiar, R., Eds.; Springer International Publishing: Cham, 2020; Vol. 1026, pp. 182–188. [CrossRef]
- Diels, C.; Bos, J. Great Expectations: On the Design of Predictive Motion Cues to Alleviate Carsickness. In HCI in Mobility, Transport, and Automotive Systems; Krömker, H., Ed.; Springer International Publishing: Cham, 2021; Vol. 12791, pp. 240–251. [CrossRef]
- Graybiel, A. Susceptibility to Acute Motion Sickness in Blind Persons. Aerospace Medicine 1970, 41, 650–653.
- De Thierry De Faletans, C.; Watelain, E.; Duché, P. Motion Sickness and Visual Impairment. Brain Research Bulletin 2024, 217, 111063. [CrossRef]
- Rottmann, L.; Johannsen, A.; Niedling, M.; Vollrath, M. Influence of Seating Orientation on Motion Sickness in Autonomous Vehicles. Applied Ergonomics 2026, 130, 104643. [CrossRef]
Figure 1.
Proposed Autonomous driving acceptance model.
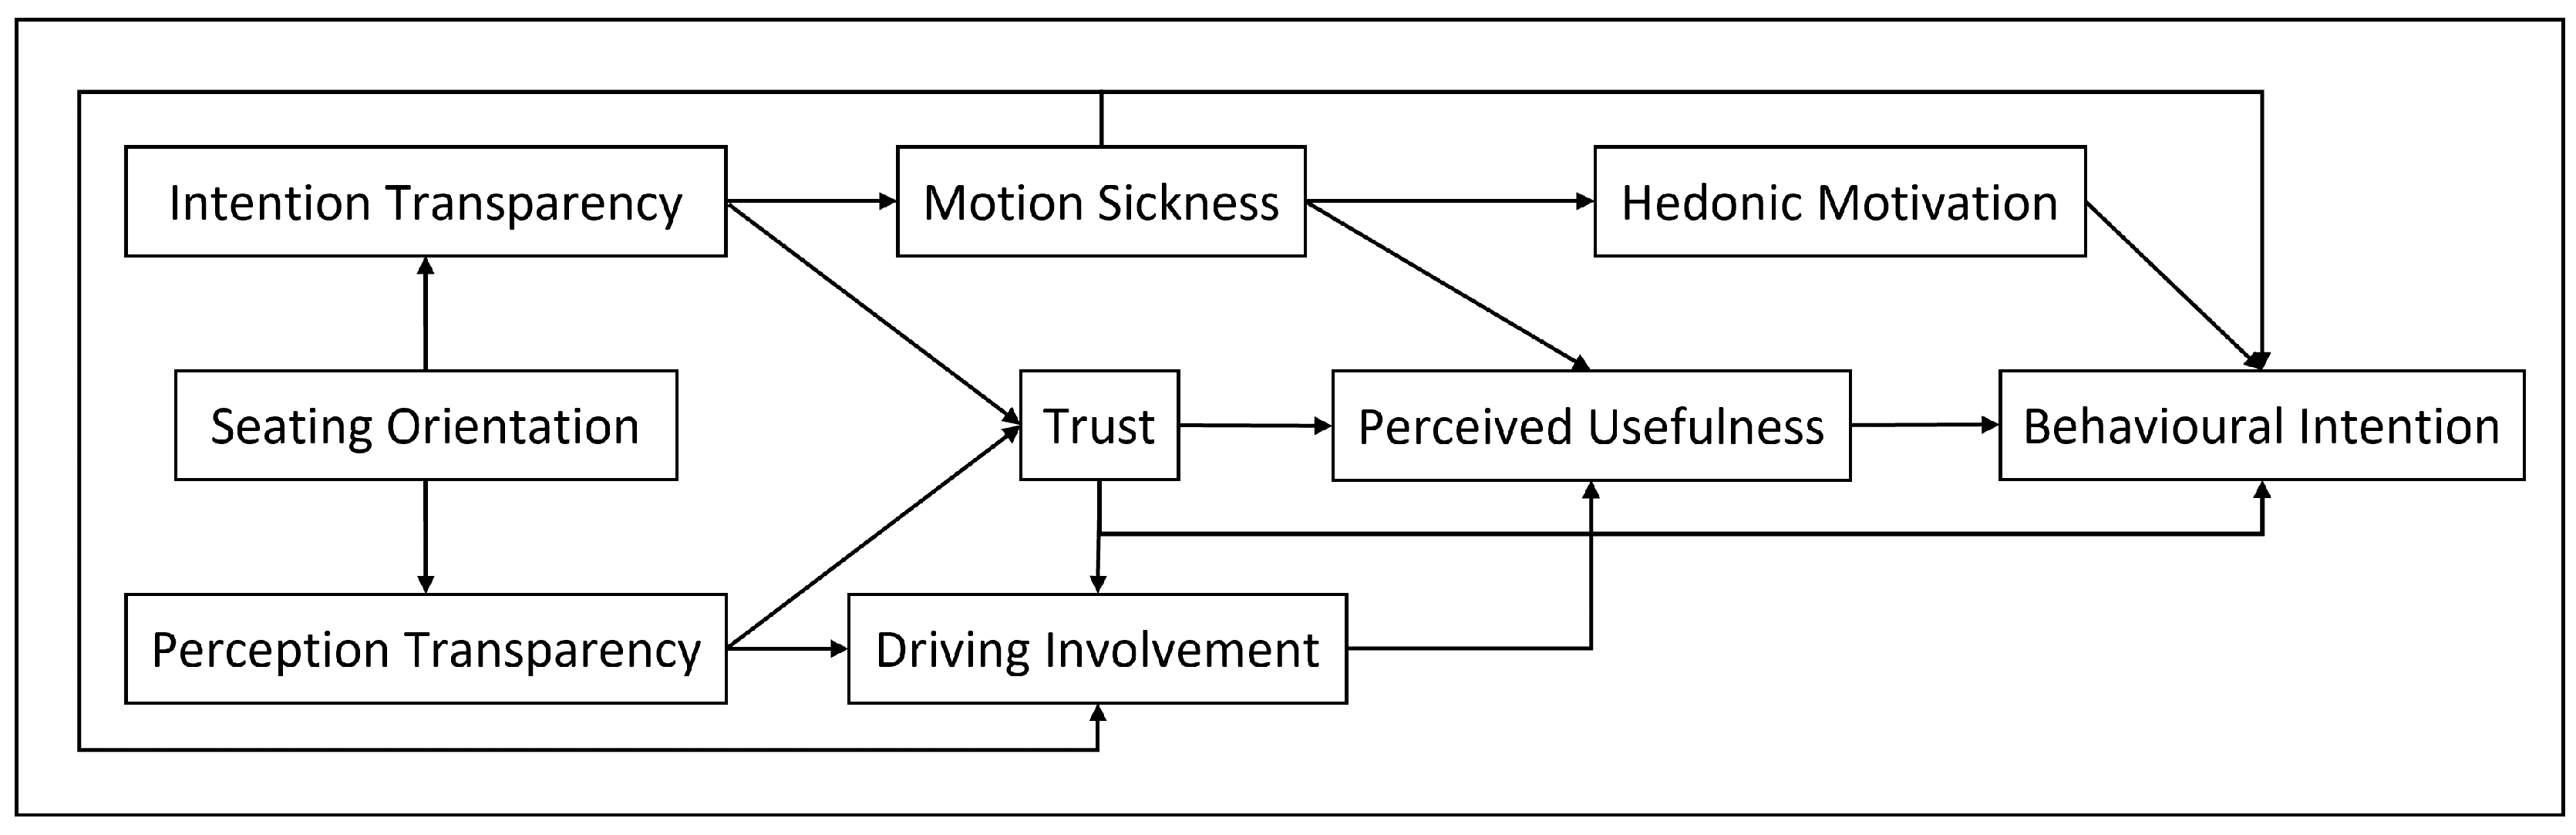
Figure 2.
(a) Test vehicle equipped with fake surveillance cameras to suggest autonomous driving. (b) Steering robot installed on the steering wheel. (c) View for forward facing passengers. (d) View for rearward facing passengers.
Figure 2.
(a) Test vehicle equipped with fake surveillance cameras to suggest autonomous driving. (b) Steering robot installed on the steering wheel. (c) View for forward facing passengers. (d) View for rearward facing passengers.
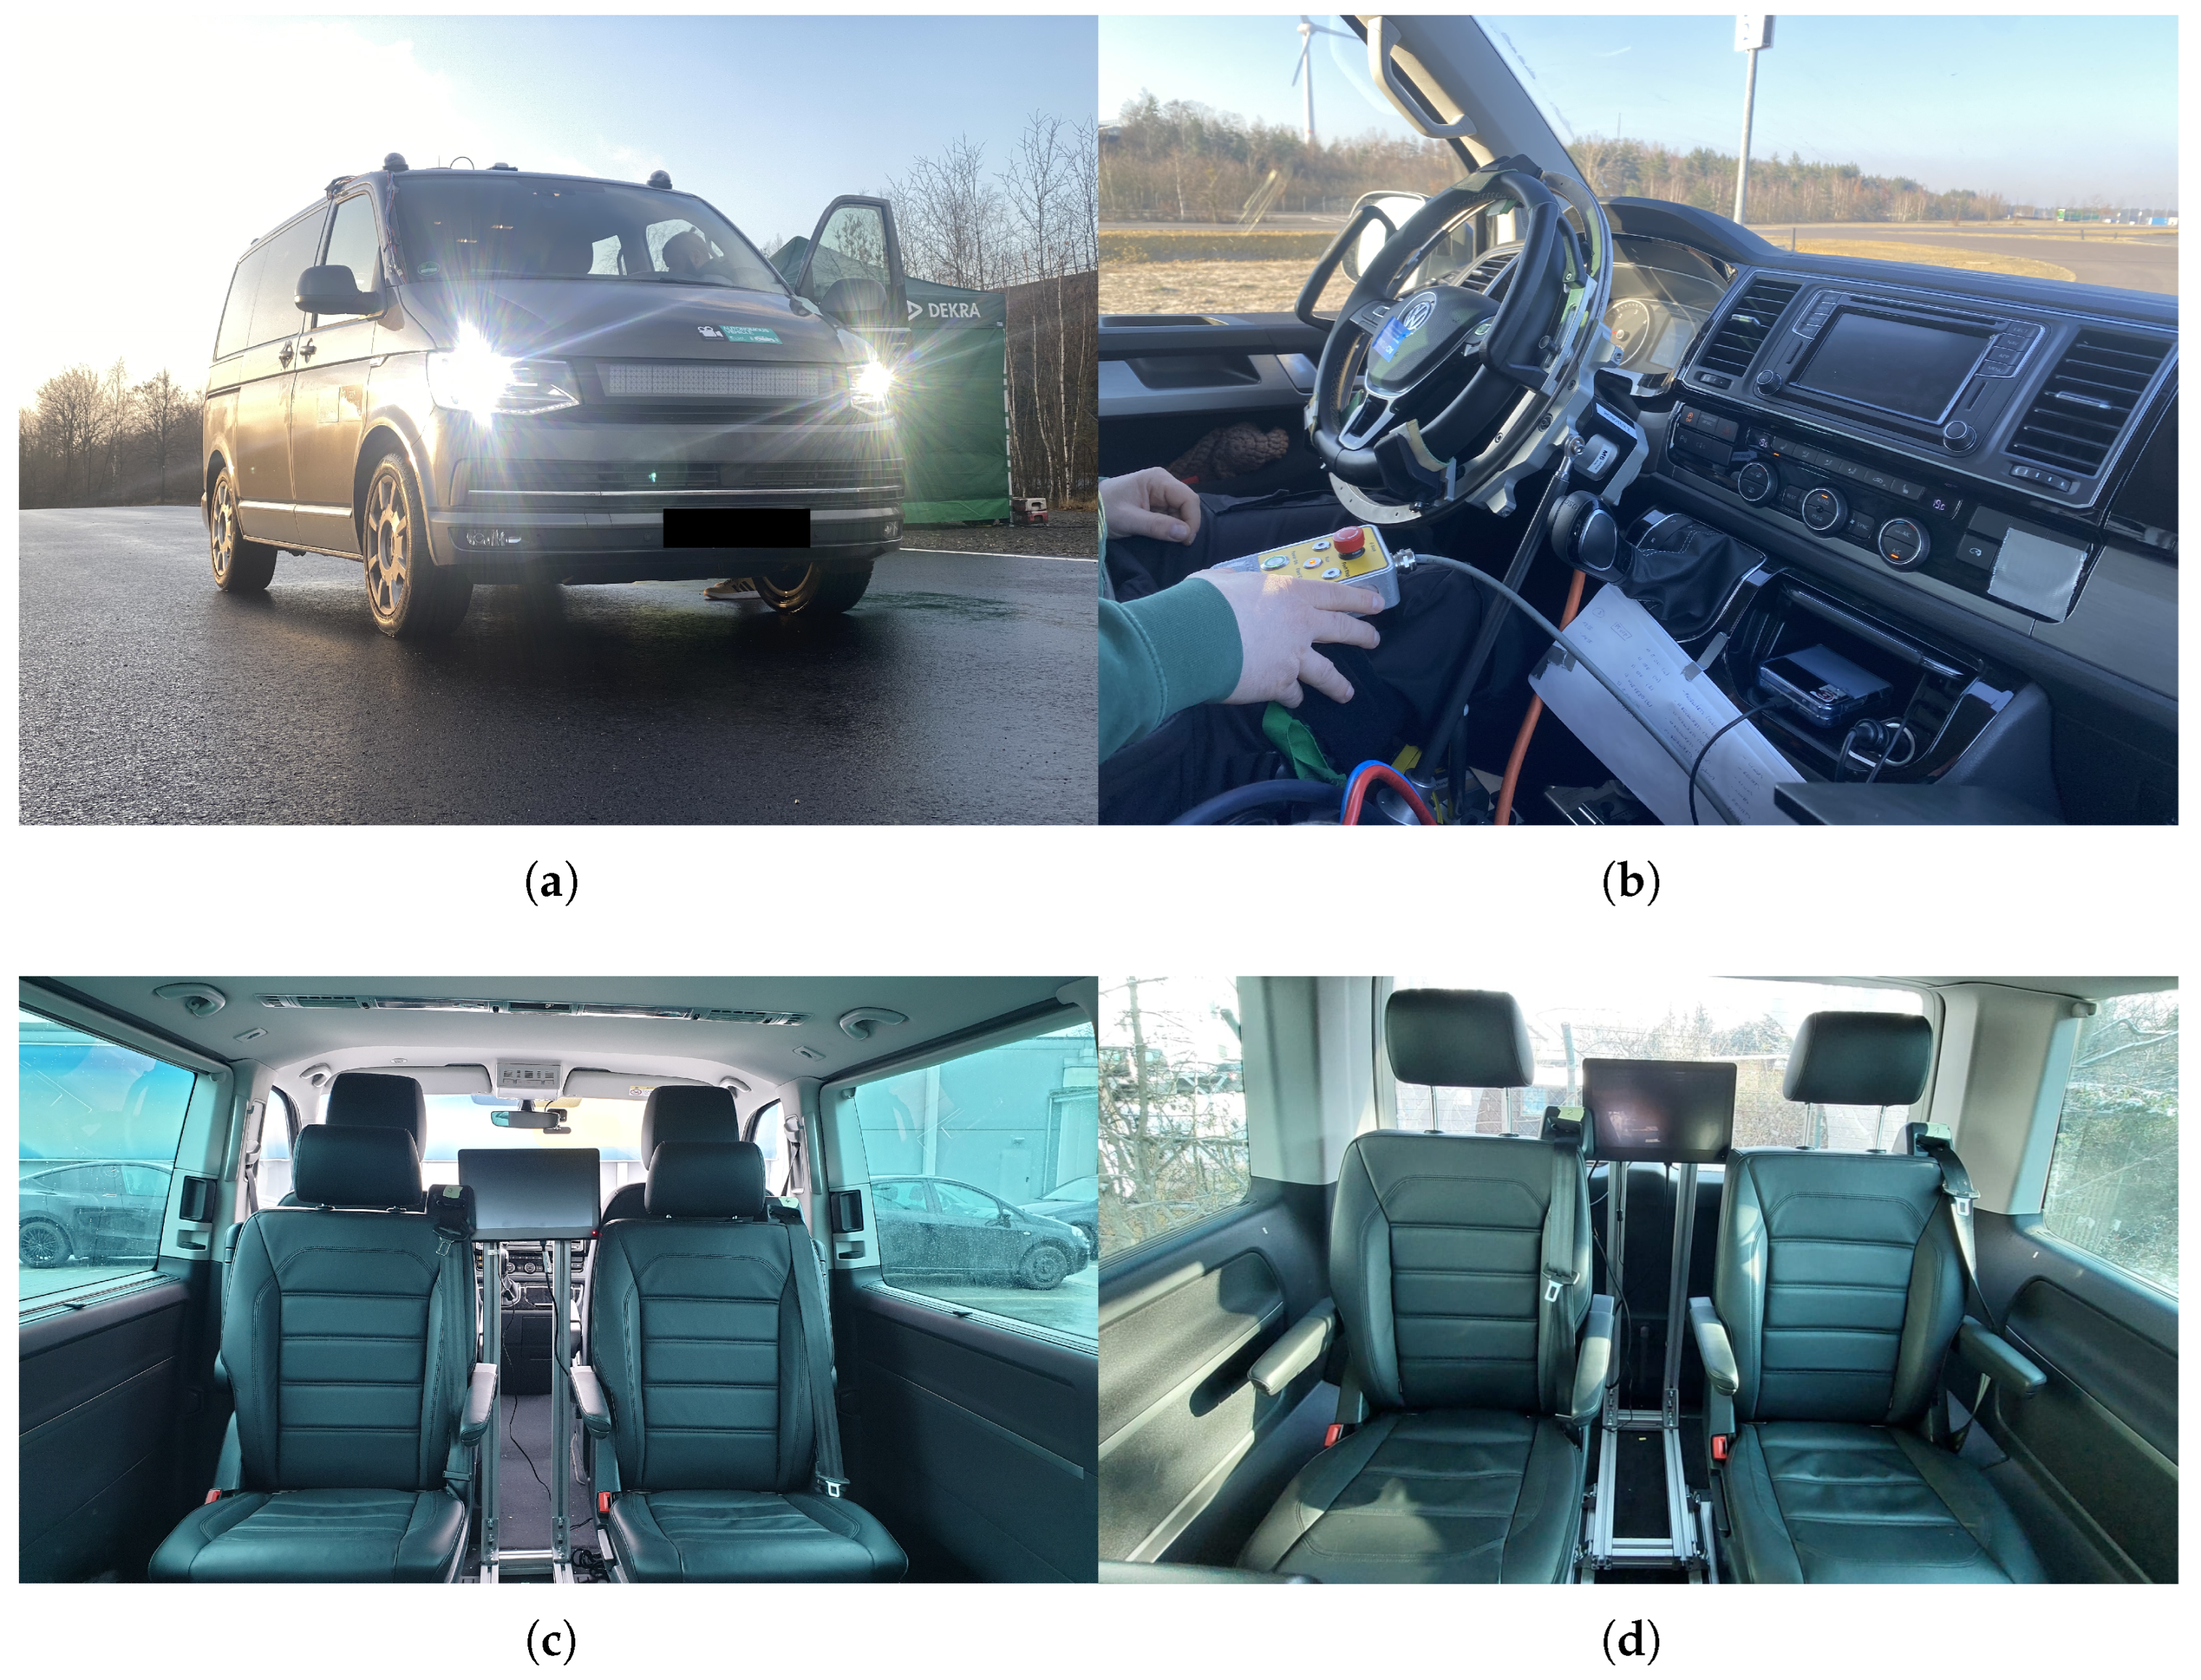
Figure 3.
The four traffic scenarios that occurred during the journeys. (a) Crossing cyclist. (b) Crossing boar. (c) Overtaking vehicle on a highway construction site. (d) Crossing pedestrian.
Figure 3.
The four traffic scenarios that occurred during the journeys. (a) Crossing cyclist. (b) Crossing boar. (c) Overtaking vehicle on a highway construction site. (d) Crossing pedestrian.
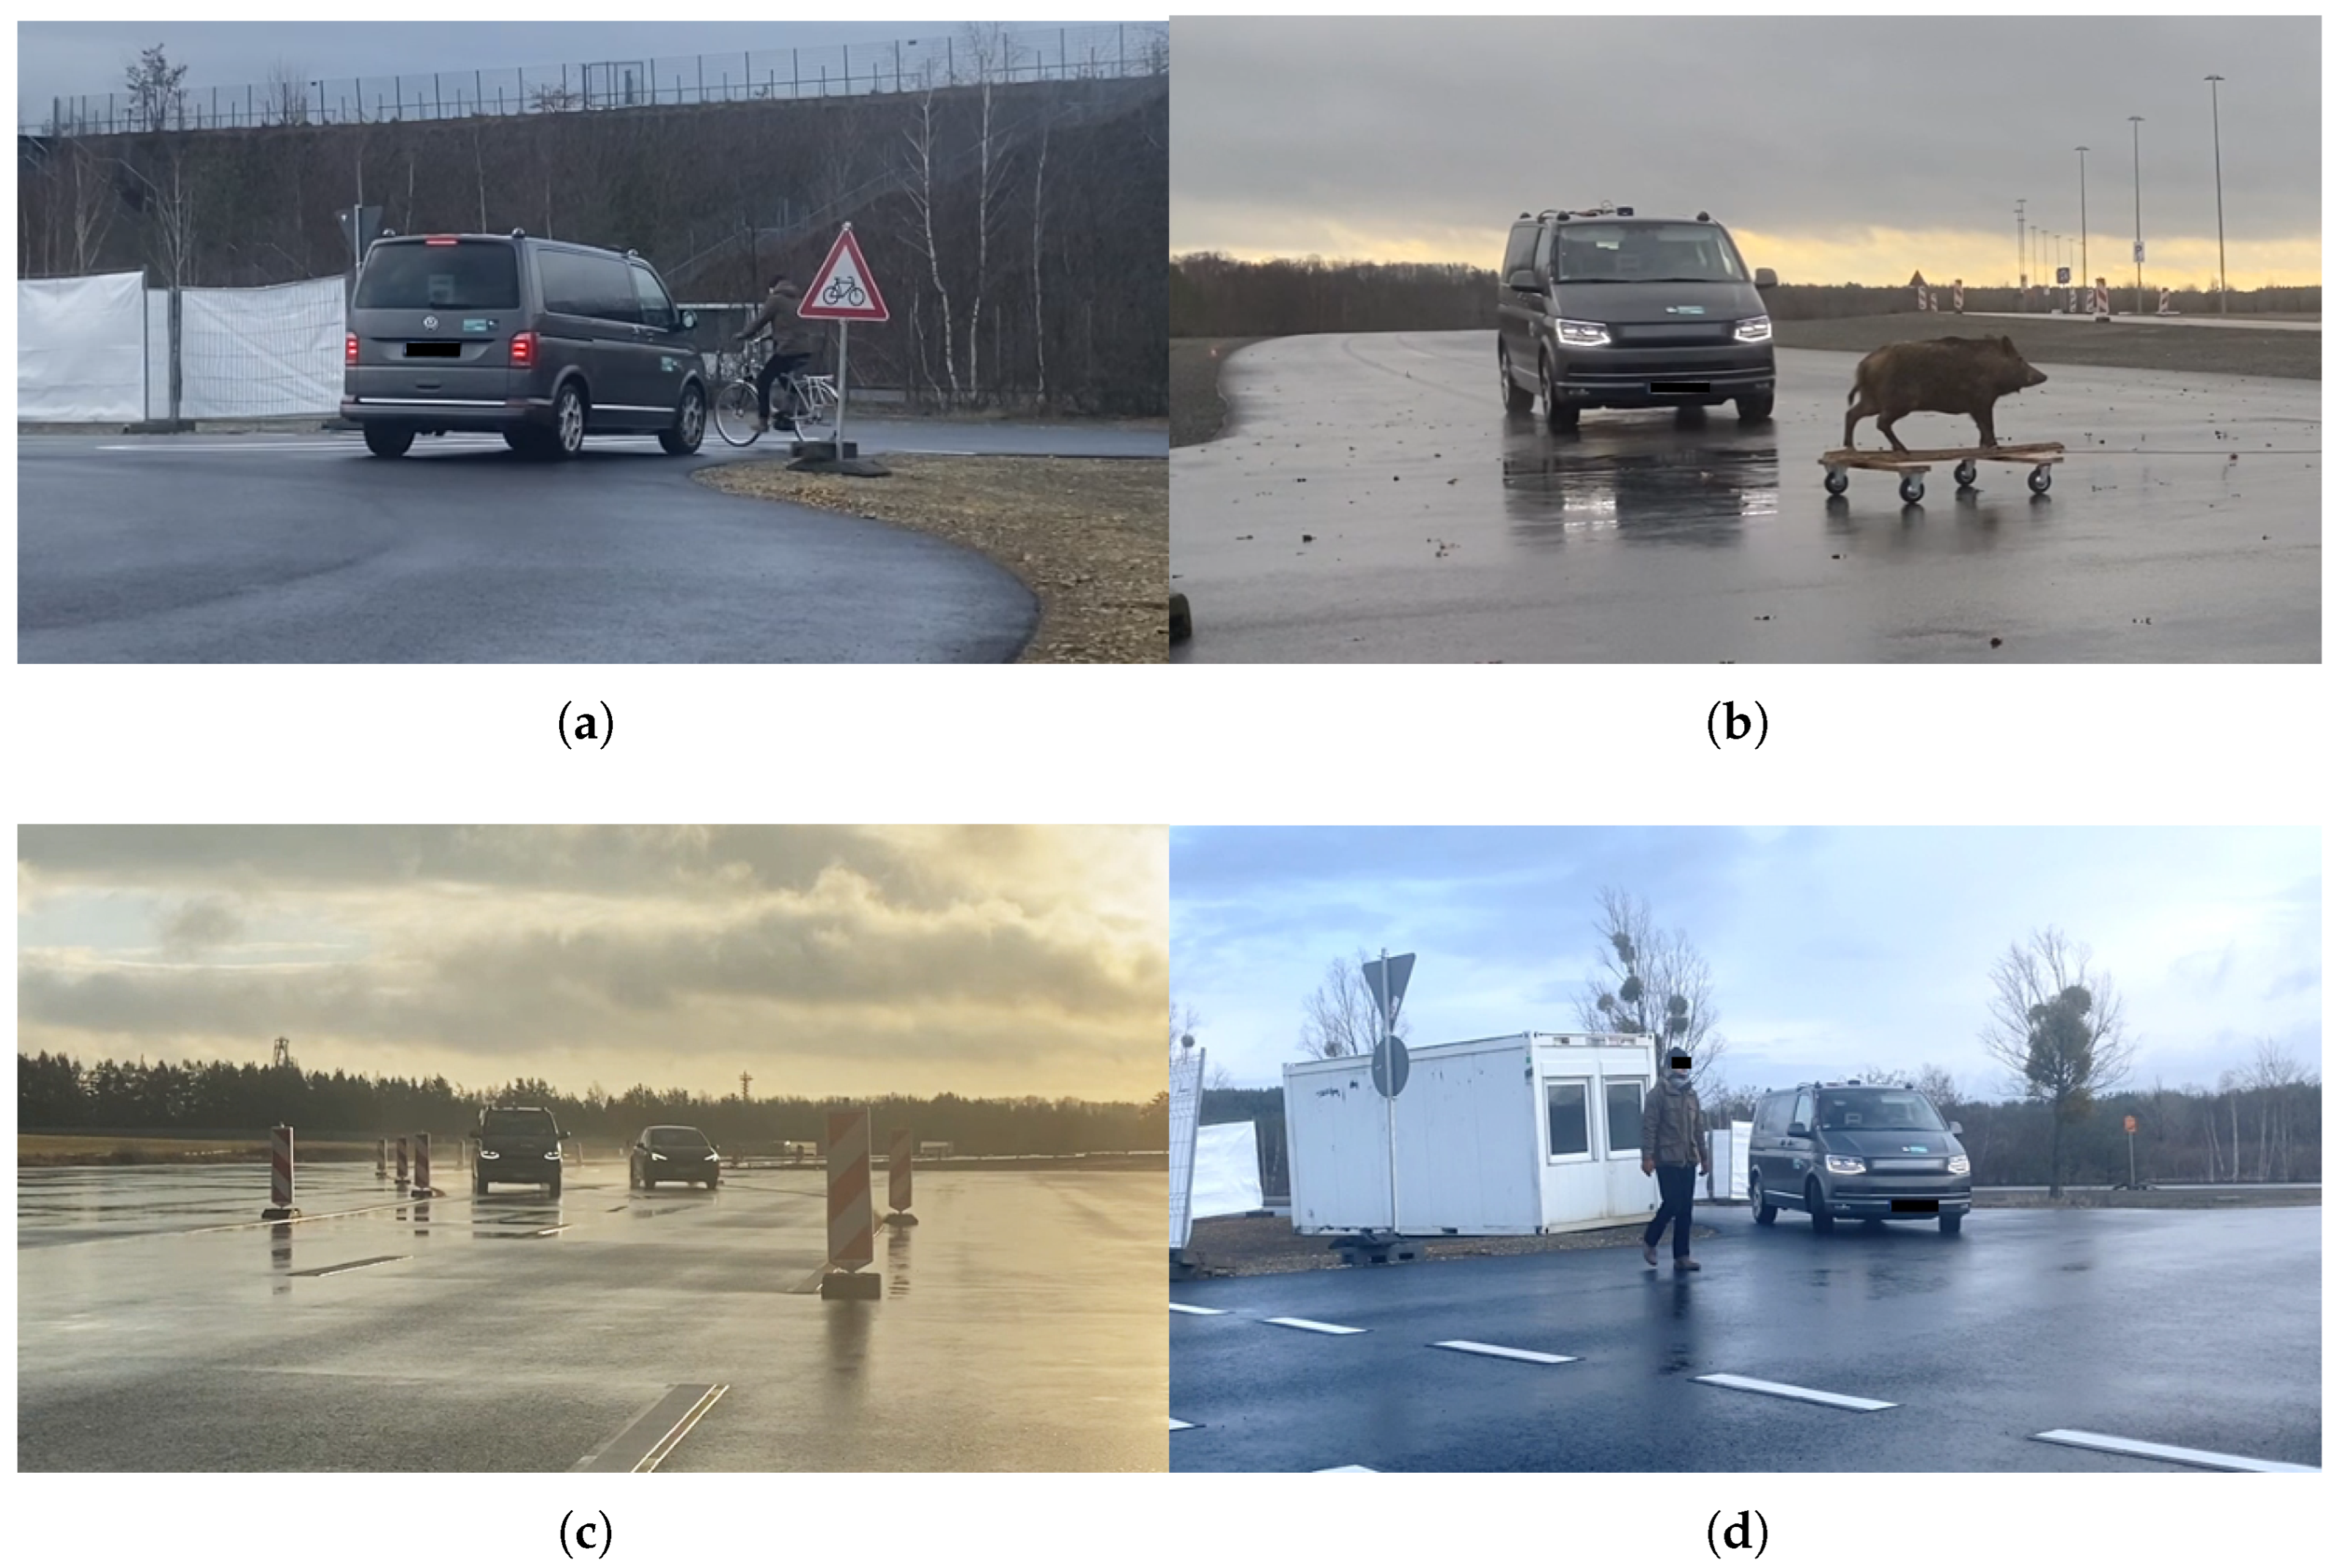
Figure 4.
Test track. X marks the start and end points for both the clockwise and counterclockwise courses. The locations of scenarios 1-4 are marked by the corresponding numbers.
Figure 4.
Test track. X marks the start and end points for both the clockwise and counterclockwise courses. The locations of scenarios 1-4 are marked by the corresponding numbers.
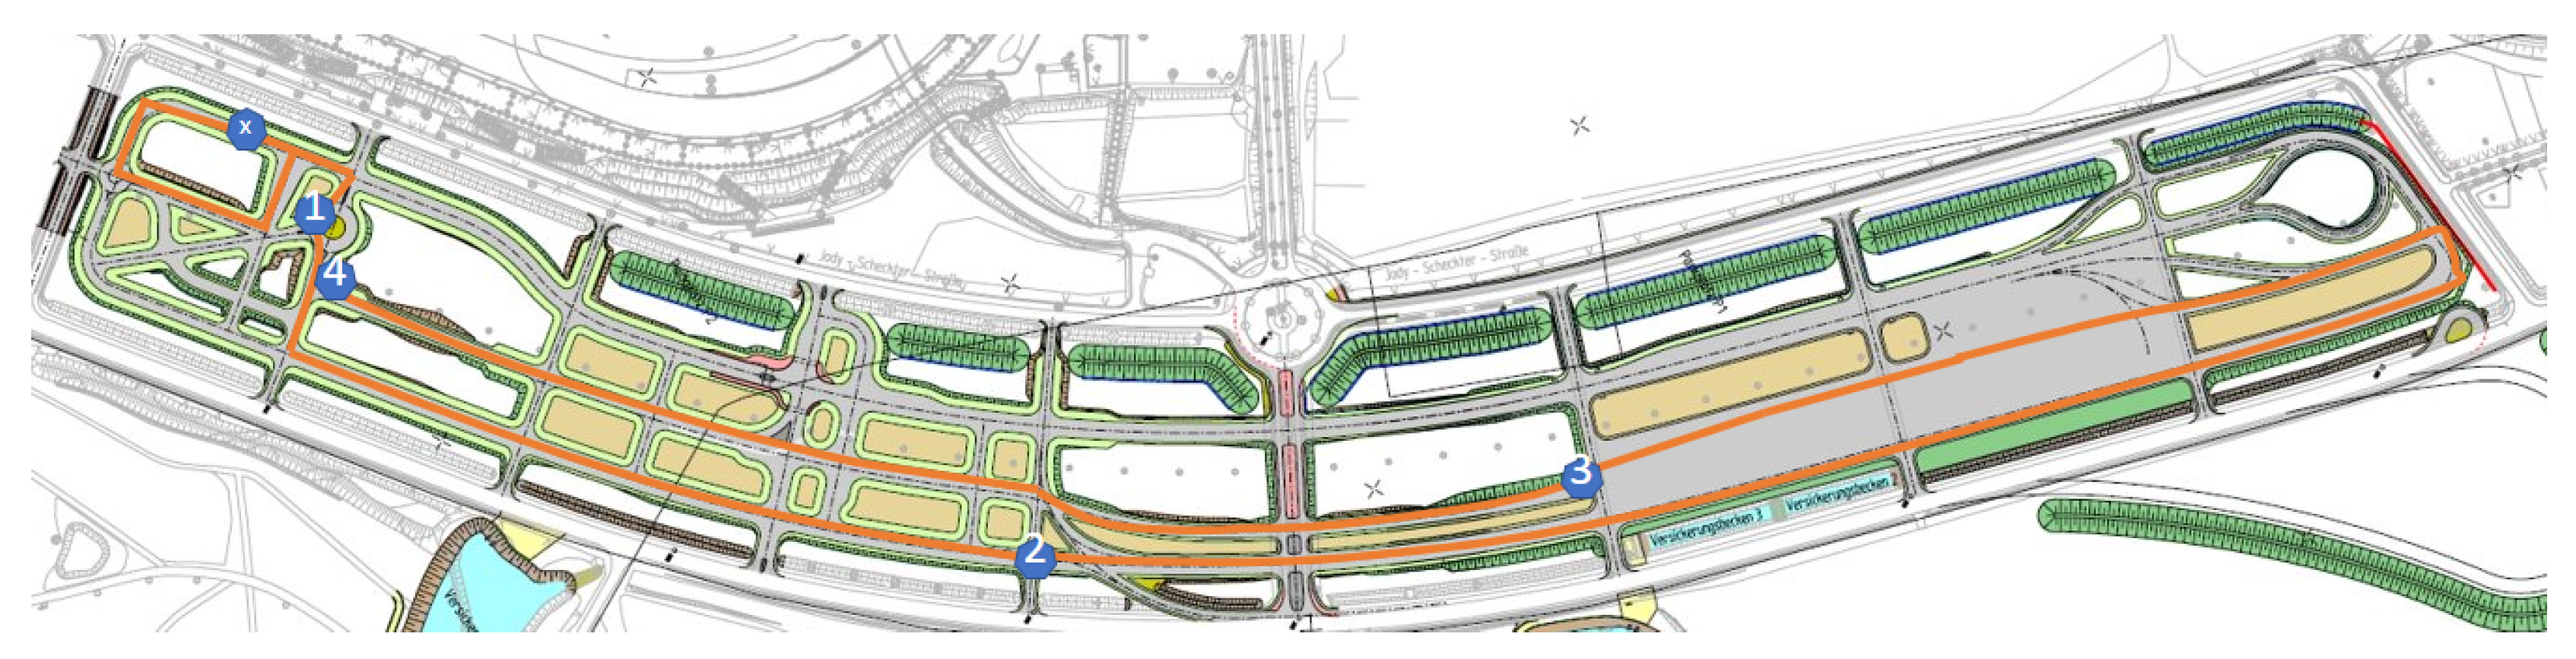
Figure 5.
(a) Arrows used for the "ITon" intention transparency condition. (b) "ITon" and bounding boxes used to manipulate perception transparency as a camera feed overlay.
Figure 5.
(a) Arrows used for the "ITon" intention transparency condition. (b) "ITon" and bounding boxes used to manipulate perception transparency as a camera feed overlay.
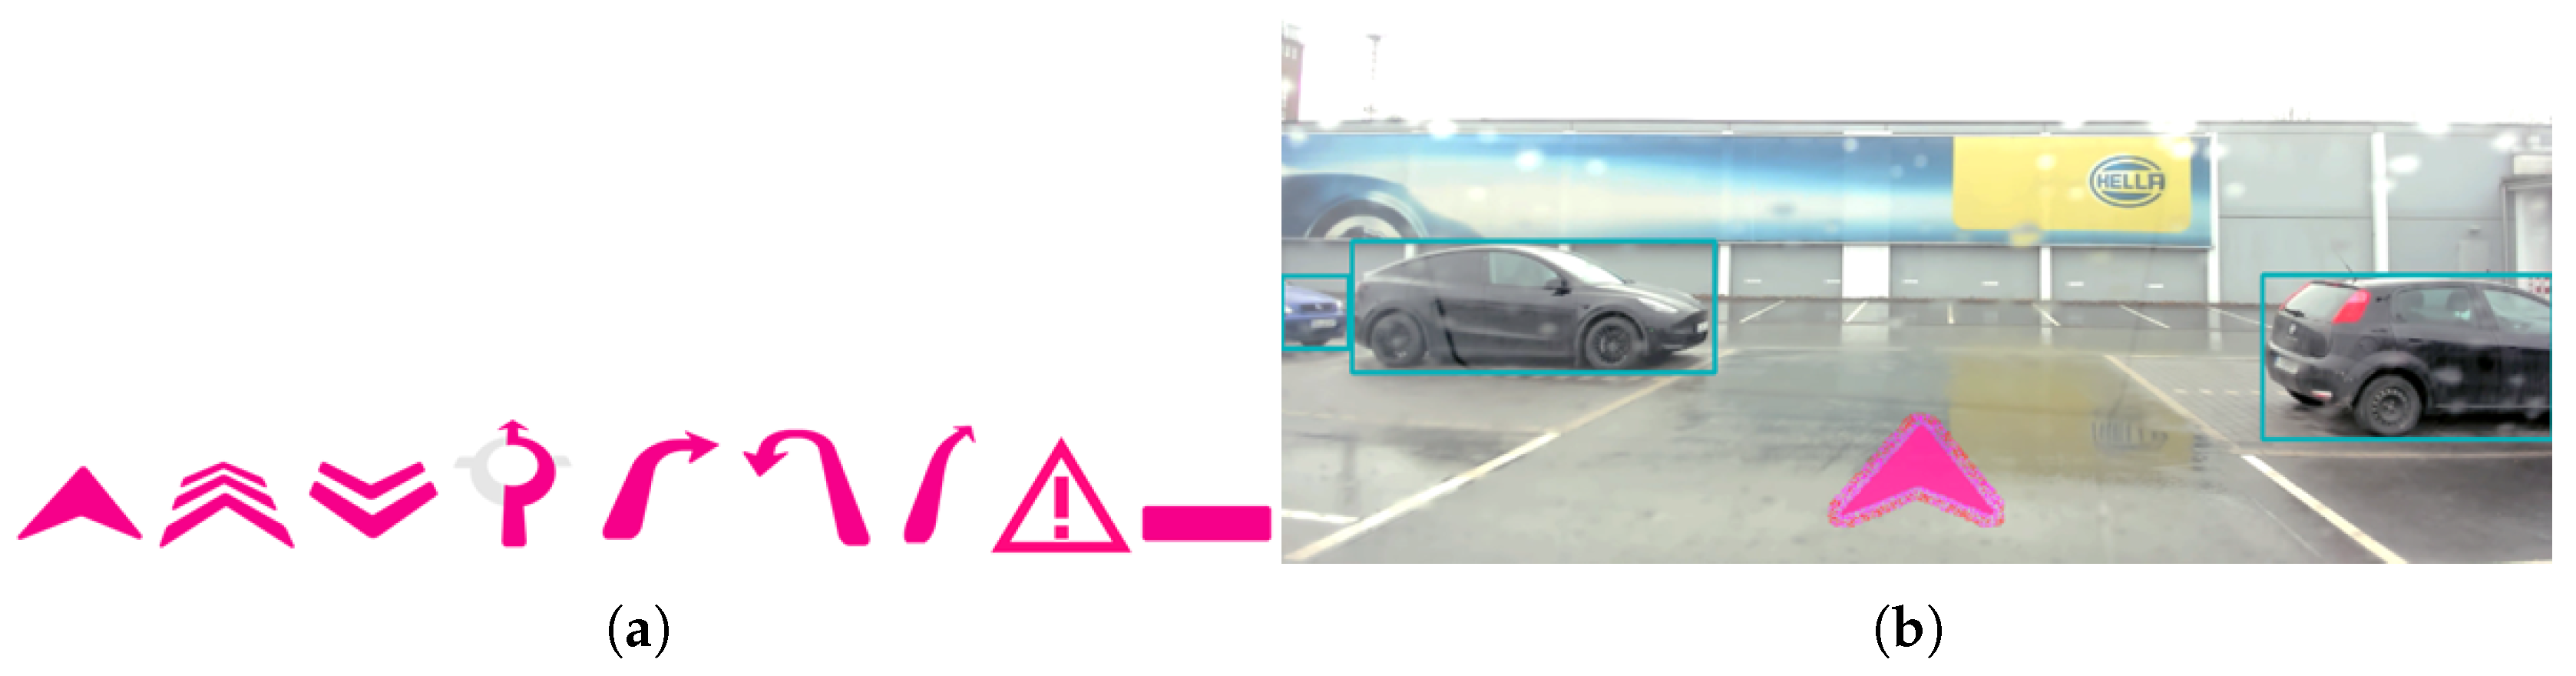
Figure 6.
(a) Means and standard deviations of FMS ratings for each experimental condition. Note that FMS assesses motion sickness on a scale from 0 to 20. (b) Means and standard deviations of trust scores for each experimental condition.
Figure 6.
(a) Means and standard deviations of FMS ratings for each experimental condition. Note that FMS assesses motion sickness on a scale from 0 to 20. (b) Means and standard deviations of trust scores for each experimental condition.
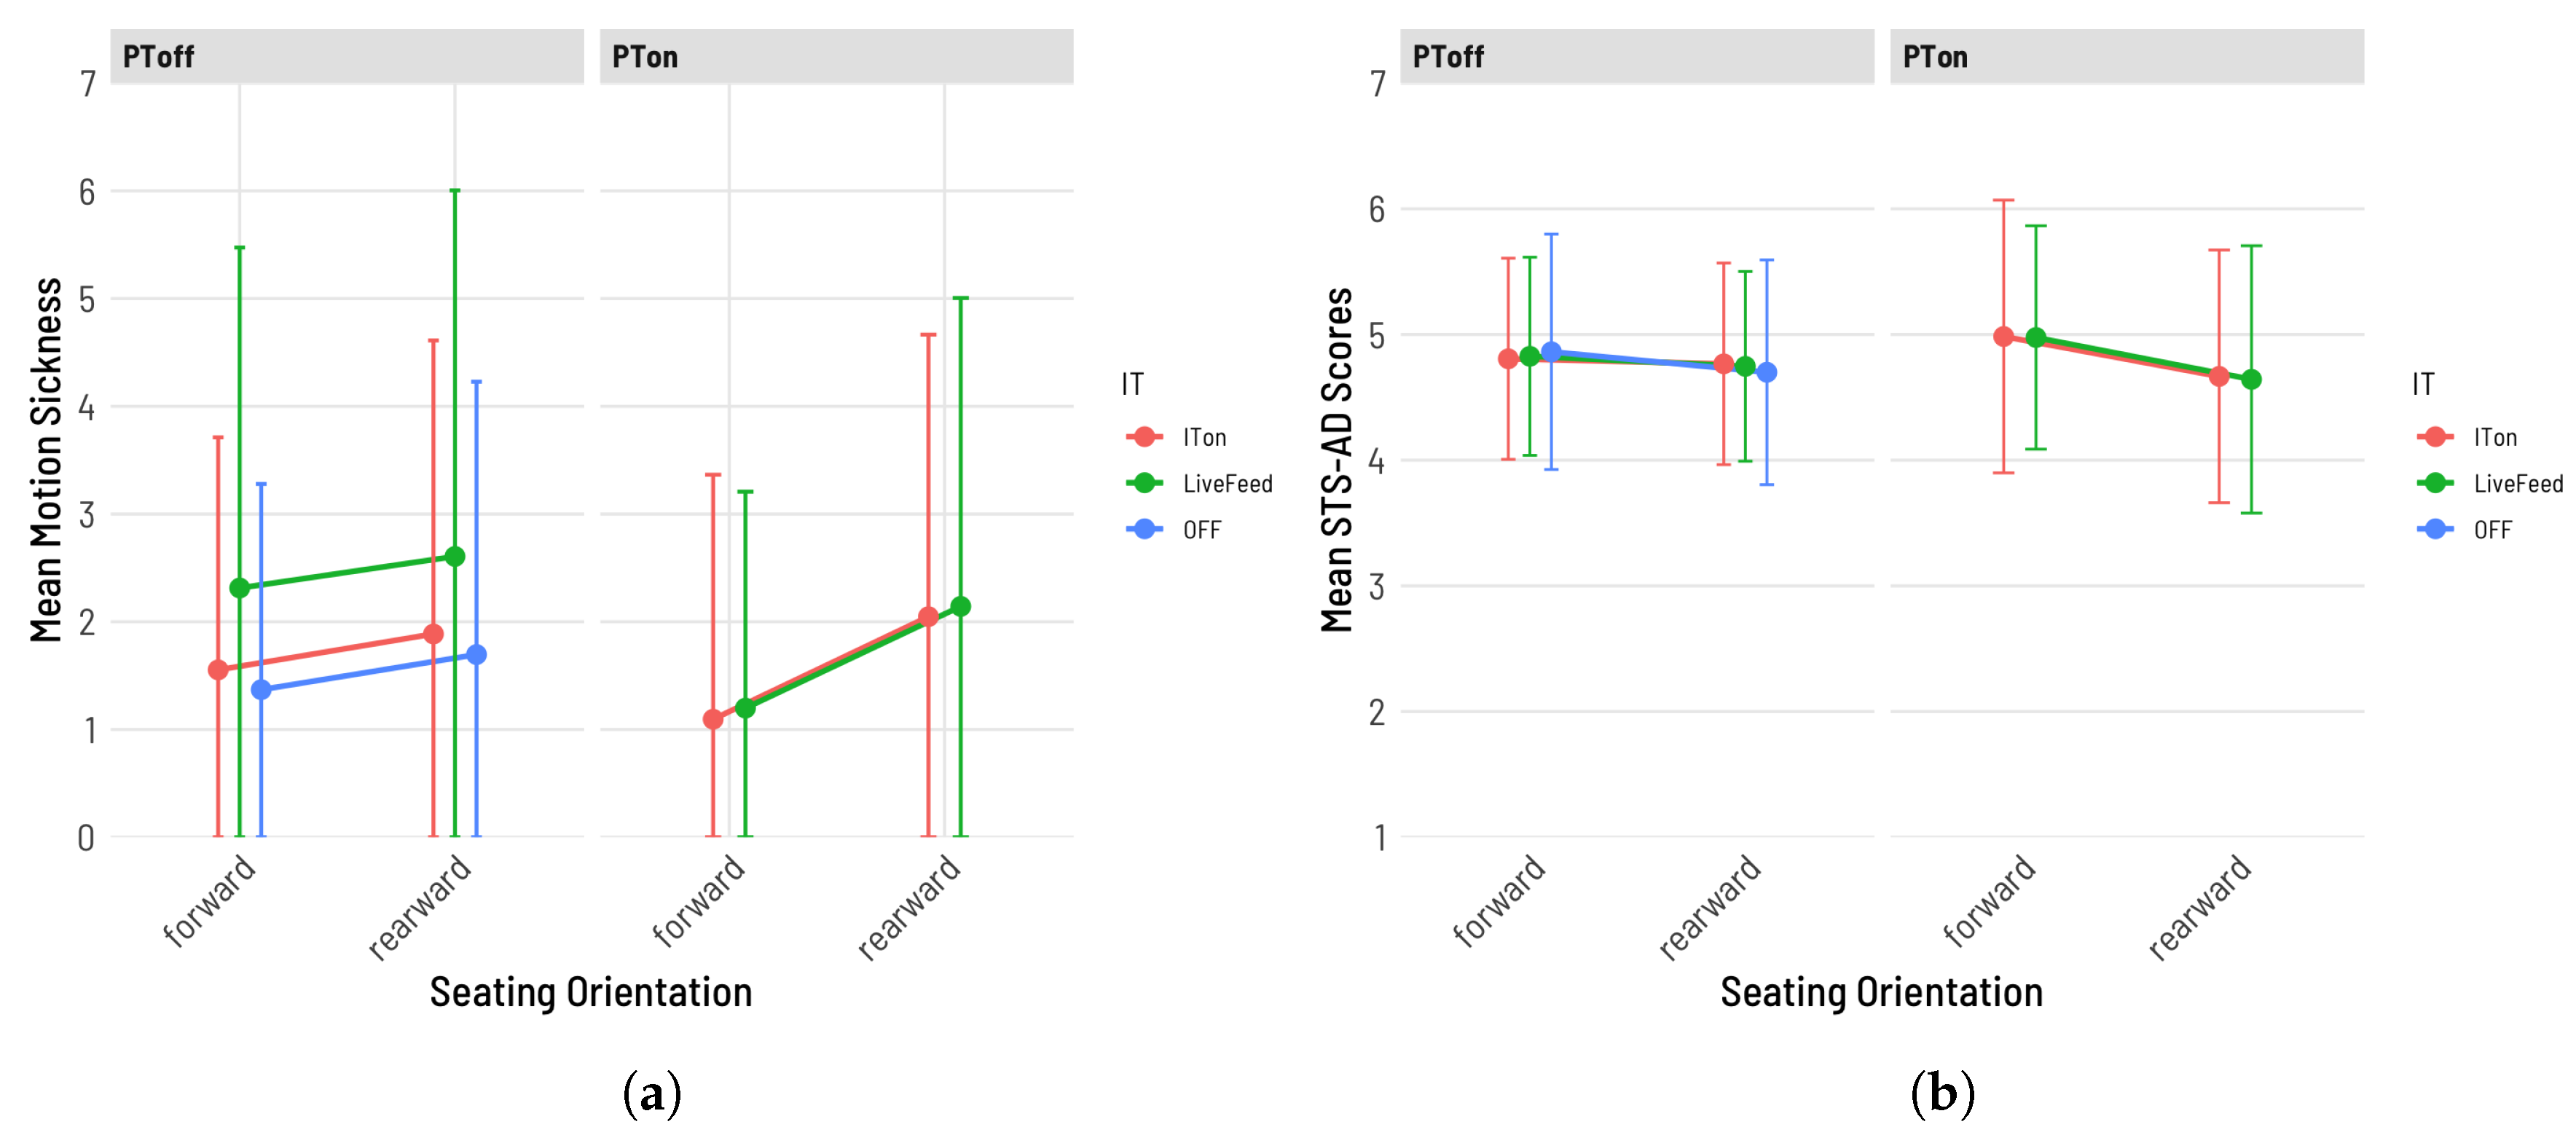
Figure 7.
Results of the structural equation model. Only path coefficients that reached significance are shown, other paths are marked as non significant. Odds ratios for predictors of behavioral intention were calculated via a logistic regression and are shown with 95% confidence intervals.
Figure 7.
Results of the structural equation model. Only path coefficients that reached significance are shown, other paths are marked as non significant. Odds ratios for predictors of behavioral intention were calculated via a logistic regression and are shown with 95% confidence intervals.
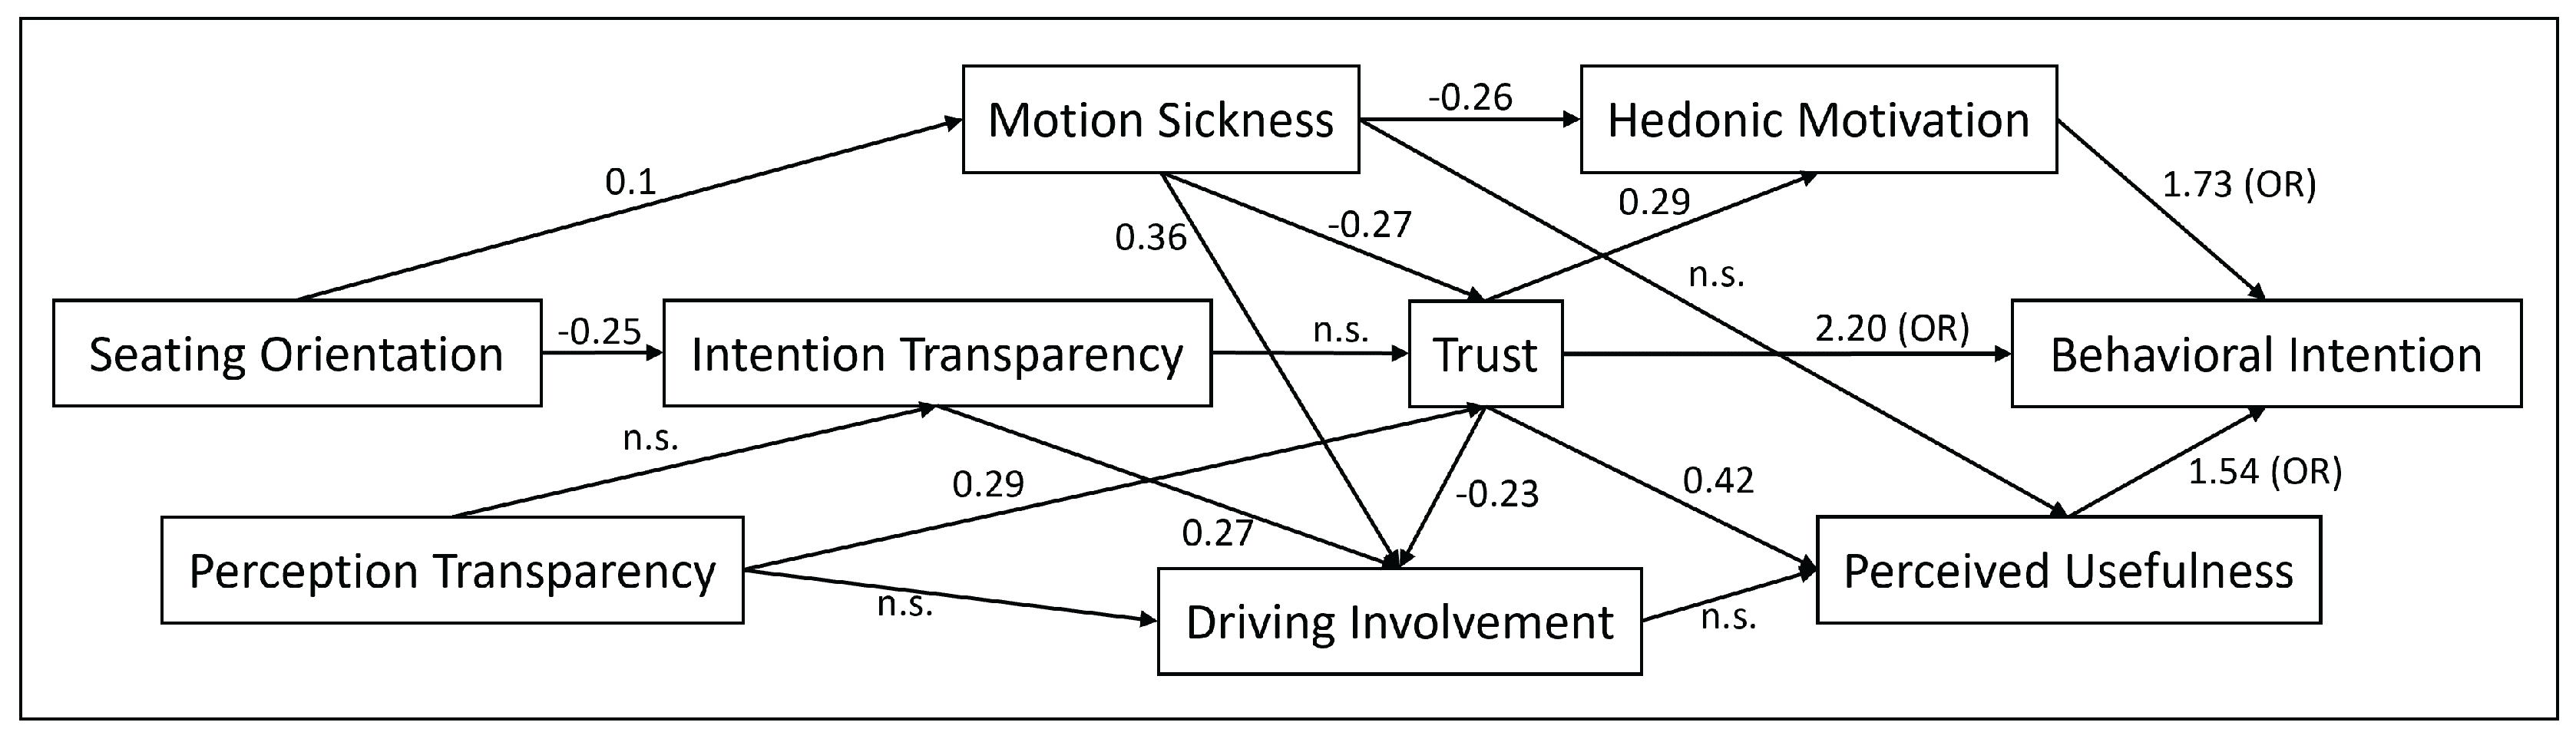
Table 2.
Summary of the structural equation model.
| Outcome | Predictor | Coefficient | SE | z | p | 95% CI | Beta |
| Intention Transparency | Seating Orientation | -0.50 | 0.12 | -4.02 | < .001*** | [ -0.74; -0.26 ] | -0.25 |
| Intention Transparency | Perception Transparency | 0.19 | 0.12 | 1.58 | 0.114 | [ -0.05; 0.42 ] | 0.14 |
| Motion Sickness | Seating Orientation | 0.51 | 0.17 | 3.08 | 0.002** | [ 0.19; 0.84 ] | 0.10 |
| Trust | Intention Transparency | 0.15 | 0.08 | 1.76 | 0.079. | [ -0.02; 0.31 ] | 0.16 |
| Trust | Perception Transparency | 0.35 | 0.11 | 3.19 | 0.001** | [ 0.14; 0.57 ] | 0.29 |
| Trust | Driving Involvement | -0.20 | 0.06 | -3.15 | 0.002** | [ -0.33; -0.08 ] | -0.23 |
| Trust | Motion Sickness | -0.09 | 0.02 | -3.84 | < .001*** | [ -0.14; -0.05 ] | -0.27 |
| Driving Involvement | Perception Transparency | -0.26 | 0.14 | -1.91 | 0.056. | [ -0.53; 0.01 ] | -0.19 |
| Driving Involvement | Motion Sickness | 0.14 | 0.03 | 5.23 | < .001*** | [ 0.09; 0.20 ] | 0.36 |
| Driving Involvement | Intention Transparency | 0.28 | 0.06 | 4.63 | < .001*** | [ 0.16; 0.39 ] | 0.27 |
| Perceived Usefulness | Trust | 0.60 | 0.15 | 4.09 | < .001*** | [ 0.31; 0.88 ] | 0.42 |
| Perceived Usefulness | Motion Sickness | -0.07 | 0.07 | -1.06 | 0.289 | [ -0.20; 0.06 ] | -0.14 |
| Perceived Usefulness | Driving Involvement | -0.04 | 0.08 | -0.43 | 0.665 | [ -0.20; 0.13 ] | -0.03 |
| Hedonic Motivation | Motion Sickness | -0.14 | 0.06 | -2.20 | 0.028* | [ -0.26; -0.02 ] | -0.26 |
| Hedonic Motivation | Trust | 0.45 | 0.15 | 2.93 | 0.003** | [ 0.15; 0.75 ] | 0.29 |
Note. *** , ** , * , .. Values in Beta represent standardized coefficients and thus effect sizes.
Disclaimer/Publisher’s Note: The statements, opinions and data contained in all publications are solely those of the individual author(s) and contributor(s) and not of MDPI and/or the editor(s). MDPI and/or the editor(s) disclaim responsibility for any injury to people or property resulting from any ideas, methods, instructions or products referred to in the content. |
© 2025 by the authors. Licensee MDPI, Basel, Switzerland. This article is an open access article distributed under the terms and conditions of the Creative Commons Attribution (CC BY) license (http://creativecommons.org/licenses/by/4.0/).
Copyright: This open access article is published under a Creative Commons CC BY 4.0 license, which permit the free download, distribution, and reuse, provided that the author and preprint are cited in any reuse.


