
Submitted:
10 October 2025
Posted:
15 October 2025
You are already at the latest version
Abstract
In this study, the effects of rubber content, particle size (total surface area), and water–cement (W/C) ratio on the slump and air content of fresh concrete and the mechanical properties (compressive strength and Young's modulus) of hardened concrete were investigated for rubber-mixed concrete (RuC) using waste tire-derived rubber as a partial replacement for fine aggregates. An estimation formula was proposed, and the experimental results confirmed that the slump and air content were primarily governed by the total rubber surface area and exhibited an upper limit (saturation point). These properties can be approximated using simple symmetric mathematical models, such as logistic or exponential functions. Although the mechanical properties deteriorated with increasing rubber content, the degree of reduction was not constant and varied depending on the W/C ratio and rubber content. Based on these results, a symmetric mathematical model—the logistic function—was established to estimate the compressive strength under standard conditions (W/C = 0.56). Subsequently, a method was proposed to correct for these effects when W/C = 0.56. The verification demonstrated that the proposed two-tier model, consisting of a symmetric baseline equation and W/C-dependent correction, could estimate the compressive strength of RuC under any condition, including those with strong asymmetry. These findings provide a framework for the construction industry to design and implement rubberized concrete mixes, promoting this sustainable material in structural applications by enabling accurate predictions of mechanical performance under varied conditions.
Keywords:
rubberized concrete
; compressive strength
; logistic function
; water–cement ratio
; rubber surface area
1. Introduction
The recycling and reuse of waste tires has become a global challenge because of the rapid increase in automobile production and the resulting accumulation of used tires. Rubber-modified concrete (RuC), in which a portion of the mineral aggregate is replaced with recycled rubber particles, has garnered significant attention as a sustainable construction material that contributes to resource conservation and carbon footprint reduction [1,2]. Numerous studies have reported that the incorporation of rubber particles significantly affects the properties of concrete, including the slump, air content, compressive strength, and elastic modulus [3,4]. However, the dominant mechanisms remain complex because the density, particle size, and surface area of rubber differ significantly from those of conventional aggregates, thereby introducing further heterogeneity into cementitious matrices.
Previous studies have primarily focused on monotonic trends, such as a decrease in the compressive strength with increasing rubber content or have proposed empirical equations capturing this average behavior [5]. However, the combined effects of the water–cement (W/C) ratio and rubber properties (particularly particle size and surface area) have not been systematically elucidated. These interactions are critical because the W/C ratio fundamentally governs the hydration products and pore structure, whereas the rubber particle surface area controls the interfacial transition zone (ITZ) and air content [6,7]. The lack of an integrated framework that considers these interdependent factors limits the predictive capability and practical application of existing models.
From a symmetrical perspective, material properties are often assumed to exhibit smooth and balanced variations, which can be expressed using symmetric mathematical functions. For example, in RuC, many studies have applied symmetric monotonic models, such as exponential functions, as approximations of the correlation between the rubber volume replacement rate and mechanical properties [8,9]. Conversely, the compressive strength and elastic modulus are also influenced by conditions such as the W/C ratio and rubber particle size. The relationship between these conditions and mechanical properties has been established to exhibit asymmetric responses [10,11]. Although some properties of RuC can be approximated using symmetric models, they exhibit the unique characteristics of asymmetric deviations under specific conditions.
This study aims to experimentally investigate the mechanical properties of RuC by systematically varying the W/C ratio, rubber particle size, and substitution rate, and to establish predictive equations that capture both symmetric and asymmetric behaviors. Two experimental series were conducted: (i) Series A, in which the rubber content was varied over a wide range to examine the overall trends, and (ii) Series B, in which the W/C ratio was systematically varied while maintaining a constant rubber replacement level. Correlations between the experimentally obtained RuC properties and conditions, such as the formulation and physical properties of the mixed rubber, were analyzed, leading to the proposal of equations for estimating the properties from the conditions. The estimation formula is fundamentally based on a symmetry model but incorporates corrections for the effects of asymmetry arising from different conditions. This enables the estimation of properties under any condition, including those in which asymmetry dominates. This finding demonstrates that the inherent asymmetric mechanical behavior of heterogeneous cementitious composites can be predicted using a symmetric, simplified mathematical formulation.
2. Experimental Overview
2.1. Experimental Materials and Specimen Preparation
The experimental materials used in this study were aggregates, water, cement, admixtures, and powdered rubber, all of which conformed to the concrete production standards.
The apparent dry densities of the coarse and fine aggregates were 2.65 g/cm3 and 2.61 g/cm3, respectively, with the maximum dimension of the coarse aggregate being 25 mm. Rubber was produced from discarded truck and bus tires (TB tires) at a density of 0.93 g/cm3. Rubber particles were sieve-graded into four groups based on average particle size: 0.9, 1.8, 3.7, and 7.5 mm, derived from particles with average sizes of 1.3, 2.2, and 6.5 mm. The particle size cumulative frequency curves for each group are shown in Figure 1.
Ordinary Portland cement with a density of 3.15 g/cm3 was used. An AE water-reducing agent, EX20, was used as an admixture. A dosage of 1% of the cement mass was used.
The aggregates were dried to a completely dry state before use, and the moisture content was adjusted prior to use. The mixture was then manually mixed. Moisture-adjusted coarse and fine aggregates, cement, and rubber were mixed for 5 min. Water and a water-reducing agent were added, and the mixture was kneaded for 10 min.
The test specimens were cylinders with a height of approximately 200 mm and a diameter of 100 mm. After placement in the steel formwork, the specimens were demolded for 24 h and then transferred to a curing tank. They were cured for 28 d in water at 20 ± 2 °C. Before the loading tests, the top and bottom surfaces of the specimens were ground to eliminate unevenness.
2.2. Experimental Cases
The parameters for each experiment were the rubber mixing ratio, rubber particle size, and W/C ratio. Table 1 lists the experimental cases and their respective mix designs.
This study employed three indicators to represent the rubber content: rubber mass replacement rate, rubber volume replacement rate, and surface area. The rubber mass replacement rate is the proportion of the total fine aggregate mass replaced by rubber, and is calculated using the following equation:
where Rm is the rubber mass replacement rate [%], mr is the rubber mass [kg], and mf is the fine aggregate mass [kg].
The rubber volume replacement rate is the ratio of the volume of fine aggregate replaced by rubber to the total volume of fine aggregate and is calculated using the following equation:
where Rv is the rubber volume replacement rate [%], Vr is the rubber volume [m3], and Vf is the fine aggregate volume [m3].
The surface area of the rubber particles was calculated using the following formula, assuming that the rubber particles within the same group were spherical and uniform in size:
where Sr is the rubber surface area [m2], and n is the number of rubber particles. Sr-D50 is the surface area [m2] of a single rubber particle calculated assuming a rubber particle with an average particle size of D50.
The cases in this experiment were broadly categorized as Series A and Series B. Series A varied the mass and volume replacement ratios by unifying the rubber particle size and changing the number of mixed rubber particles. Series B maintained a constant mass and volume replacement ratio for each case by adjusting the number of particles added, although the mixed rubber particle sizes varied. In Series B, the W/C ratio was varied to confirm the effect of the cement quantity.
2.3. Measurement Overview
Slump tests were conducted using slump cones with inner diameters of 10 cm (top) and 20 cm (bottom) and a height of 30 cm, in accordance with JIS A 1101 [12]. Fresh concrete was placed in a cone in three separate portions, each compacted 25 times using a tamper. The top surface was then leveled, and the slump cone was lifted vertically to measure the deflection at the center of the concrete. The air content was measured using an air content meter according to JIS A 1128 [13]. Both the slump and air content tests were performed thrice, and the average value was recorded as the test result.
Compressive-strength tests were conducted according to JIS A 1108 [14]. The loading rate was 0.6 ± 0.4 N/mm2 per second. The compressive strength s for each test was calculated by dividing the applied load by the area of the specimen on which the load was applied. The specimen diameter used to calculate the applied area was the average of six measurements taken at two right angles: one at the top and bottom faces and one at the midsection. The specimen height was the average of the measurements obtained at two right angles between the top and bottom faces of the cylinder. Young’s modulus was determined according to JIS A 1149 as the average of the test values of the static elastic modulus connecting the point at 1/3 of the compressive strength and the point where the strain was 50×10 -6 [15]. Three specimens were used per case, and the results were presented as averages.
3. Experimental Results
Figure 2 shows the experimental results. Figure 2 illustrates the relationship between the physical properties of rubber (mass replacement rate, volume replacement rate, average rubber particle size, and surface area) and the characteristics of RuC (slump, air content, compressive strength, and Young’s modulus). This section confirms the relationship between the physical properties of each characteristic, and a quantitative analysis, including previous experimental results, is presented in the following sections.
3.1. Slump Test Results
The slump test results in the first row of Figure 2, particularly in (a), (b), and (d) of Series A, show that the slump values in the region with low rubber content (mass replacement ratio ≤ 7.5%, volume replacement ratio ≤ 20%, and surface area ≤ approximately 200 mm2) were approximately identical to those without rubber. This was because the measured slump values under these conditions reached or exceeded 20 cm, which was the upper limit of the measurement range, suggesting that the addition of rubber did not exert any measurable influence. In contrast, when the rubber content increased, a decreasing trend in the slump values was observed. Two main factors are considered to be responsible for the slump reduction due to rubber incorporation. First, because the density of rubber is approximately one-third that of the aggregate, the dead load decreases as the rubber content increases. Second, the inclusion of rubber altered the fineness modulus of the aggregate system. It is generally recognized that an increase in the fineness modulus leads to greater interparticle contact among aggregates, thereby reducing the slump [16]. Figure 3(a) shows the relationship between the fineness modulus and slump, whereas Figure 3(b) shows the relationship between the weight of the aggregates, rubber, and slump. A negative correlation between the fineness modulus and slump was observed, which is consistent with the behavior of conventional concrete, wherein a higher fineness modulus corresponds to a lower slump. Additionally, a positive correlation was observed between the weight and slump, indicating that a reduction in weight (i.e., lower gravitational load) leads to a reduced slump. This was attributed to the lower density of rubber, which diminished the downward-acting load.
The influence of the W/C on the slump was examined using the Series B results shown in Figure 2 (a)–(d). All measured values exceeded 20 cm, which is near the upper limit of the measurement. Therefore, a detailed analysis is difficult; however, under the present experimental conditions, the differences in the W/C ratio did not significantly affect the slump.
In (c), the rubber particle size exhibits a weaker correlation with the slump than with the mass replacement ratio, volume replacement ratio, and surface area. These results suggest that rubber particle size had no statistically significant influence on the slump in this study.
3.2. Air Content Test Results
The air content results shown in the second row of Figure 2 for (a), (b), and (d) indicate that Series A exhibited an increasing air content with a higher mass replacement ratio, volume replacement ratio, and rubber surface area. As noted in Section 1, this trend can be attributed to the tendency of rubber to entrap air, which leads to an overall increase in air content. However, when the mass replacement ratio exceeded 7.5%, the volume replacement ratio exceeded 20%. When the surface area surpassed approximately 220 m2, the air content did not increase. This suggests the existence of an upper limit for the increase in air content owing to rubber incorporation.
In the Series B results for (a) and (b), the mass and volume replacement ratios remained constant; however, the measured air content varied within a range of 2–3.5%. In contrast, the surface area results in (d) showed an increasing trend similar to that of Series A, and the distribution closely approximated the Series A data. This implies that the relationship between the surface area and air content can be unified, irrespective of the series type or differences in the W/C ratio. Because the primary cause of the increased air content was the adherence of air bubbles to the rubber surface, the surface area should show a stronger correlation than the other parameters. Regarding (c), no correlation was observed between the rubber particle size and air content. These findings indicate that the properties of individual rubber particles do not directly determine the overall air content.
3.3. Compressive-Strength Test Results
Because the compressive strength and Young’s modulus exhibited similar trends, the following discussion focuses on the compressive strength, as shown in the third row of Figure 2.
The Series A results in (a), (b), and (d) show that the compressive strength decreased with increasing rubber mass replacement ratio, volume replacement ratio, and surface area. However, the decreasing trend varied depending on the amount of rubber incorporated.
For instance, as shown in (b) for the volumetric replacement ratio (Rv), and in (d) for the total surface area (Sr), when Rv = 20% and Sr = 167 m2, the compressive strength was approximately 24.9 N/mm2. Because the compressive strength at Rv = 0% and Sr = 0 m2 was approximately 30 N/mm2, the reduction ratio of compressive strength in the range Rv = 0–20% and Sr = 0–167 m2 (Region I) was approximately 16%, calculated as (30.0 − 24.9)/30.0. Contrastingly, when Rv = 41% and Sr = 418 m2, the compressive strength decreased to 11.6 N/mm2. The reduction ratio in the range Rv = 20–40% and Sr = 167–418 m2 (Region II) reached 53%, indicating a more pronounced decrease in strength than in Region I.
Furthermore, when Rv = 55% and Sr = 598 m2, the compressive strength was 7.6 N/mm2, corresponding to a reduction ratio of only 2.9%. This suggests that in the range of Rv > 40% and Sr > 418 m2 (Region III), the variation in compressive strength was limited owing to the amount of rubber. Considering that the changes in Rv and Sr across Regions I–III are approximately equivalent, it can be concluded that the reduction behavior of compressive strength evolves with increasing rubber content. The decrease is relatively small in Regions I and III, whereas Region II—situated between them—serves as a transition zone where the compressive strength declines more markedly.
The Series B results in (a) and (b) show variations in compressive strength ranging from 13 to 22 N/mm2 under constant replacement ratios. With respect to the surface area (d), Series B exhibited a decreasing trend similar to that of Series A, but with greater scatter than the air content results. A higher W/C ratio resulted in a lower compressive strength, whereas a lower W/C ratio yielded a higher compressive strength, suggesting that the observed scatter was primarily attributable to the differences in the W/C ratio.
To clarify the effect of the W/C ratio on the mechanical properties, nine cases with varying W/C ratios were examined (G0.9-50, G1.8-50, G3.7-50, G0.9-56, G1.8-56, G3.7-56, G0.9-60, G1.8-60, and G3.7-60). For convenience, the compressive strength and Young’s modulus at W/C = a% are denoted as σ(a) and E(a), respectively. The test results were normalized by those at W/C = 0.56, with the same rubber particle size, that is, σ(56) and E(56).
As shown in Figure 4, both the compressive strength and Young’s modulus decreased with increasing W/C ratio, which is consistent with the behavior of conventional concrete. However, the degree of reduction varies depending on the size of the rubber particles and the total surface area. For smaller particle sizes and larger surface areas, the reductions in σ and E owing to the higher W/C ratios were more pronounced. For larger particle sizes, the effect of the W/C difference decreased. For example, at a particle size of 0.9 mm and a surface area of approximately 200 m2, σ(60)/σ(56) and E(60)/E(56) were approximately 0.7, whereas at a particle size of 3.7 mm and a surface area of approximately 50 m2, the ratios increased to approximately 0.8. In addition, at W/C = 0.50, σ(50)/σ(56) and E(50)/E(56) decreased with larger particle sizes and smaller surface areas, and for D50 = 3.7 mm and Sr = 200 m2, the values approached 1.0, indicating negligible strength enhancement due to the lower W/C ratio.
In summary, similar to ordinary concrete, the compressive strength and Young’s modulus of RuC decreased as the W/C ratio increased. However, the degree of decrease was not uniform; the smaller particle size and larger surface area of the rubber amplified the influence of the W/C ratio on the mechanical properties. These results demonstrate that the mechanical properties of RuC are affected not only by the presence of rubber but also by its physical characteristics (e.g., particle size and surface area) and concrete mix proportions (W/C ratio). Consequently, the relationship between rubber incorporation and the mechanical performance of RuC is complex and asymmetrical and is influenced by multiple interacting parameters.
4. Proposal of Estimation Equations for RuC Properties
As confirmed in the previous section, the properties of RuC—slump, air content, compressive strength, and Young’s modulus—vary depending on the quantity and physical characteristics of the incorporated rubber and concrete mixture. In this section, we analyze the correlations between the RuC properties and rubber properties/mix parameters based on the experimental results and propose equations to estimate the RuC properties from the rubber quantity/attributes and concrete mix design.
4.1. Estimation Equations for Fresh Concrete Properties (Slump and Air Content)
As shown in Figure 2, the RuC slump and air content were only marginally influenced by the W/C ratio and exhibited strong correlations with the total surface area of the incorporated rubber. Accordingly, we propose equations to predict the slump and air content from the total rubber surface area.
Figure 5 presents the relationship between the RuC slump/air content and total rubber surface area (reproduced from Figure 2(d)), together with the fitted curves obtained using the following procedure (Eqs. (4) and (5)). Because the slump has both upper and lower bounds, we assumed a logistic distribution and adopted a logistic function as the basic approximation. Because the air content had an upper bound, it was approximated using an exponential function. The constants in the functions were identified using regression analysis with the Levenberg–Marquardt algorithm.
The fitted curves for the slump and air content exhibited smooth variations without abrupt changes, with gentle inflection curves. The experimental points appeared near the apparent inflection zones, and the gradual increase or decrease in the slump and air content with increasing rubber surface area was well reproduced. The coefficient of determination R2 exceeded 0.9, indicating excellent goodness of fit. Hence, these properties can generally be approximated using symmetrical mathematical models, such as logistic and exponential functions.
where SL is the slump [cm], Ac is the air content [%], and Sr is the total surface area of the rubber [m2].
4.2. Proposal of Estimation Equations for Mechanical Properties
As shown previously, the mechanical properties of RuC vary with the amount of incorporated rubber. As shown in Figure 4, the influence of the W/C ratio on the mechanical properties of RuC depends on the rubber particle size. Based on these observations, we propose estimation equations for the mechanical properties of RuCs.
Among the mechanical properties of rubberized concrete, numerous equations have already been proposed for estimating its compressive strength. Some of these models employ indicators such as the W/C ratio and amount of rubber incorporated. These equations estimate the extent to which the compressive strength (σ) of RuC decreases relative to the reference strength (σ0) obtained under the condition without rubber, expressed in terms of the Strength Reduction Factor (SRF). Typically, the SRF is represented by an exponential or polynomial function, as shown in Eqs. (6) and (7), respectively [8].
where k(w), a(w), b(w), and c(w) are coefficients expressed as functions of the W/C ratio (w).The variable x denotes an indicator of the rubber content, which is typically expressed by the volume replacement ratio (Rv) in previous studies.
In this study, these equations, along with several other mathematical models, were examined and fitted to the experimental data.
It should be noted that determining the experimental SRF requires reference data obtained using the same mix proportions and materials, but without rubber. Therefore, the estimation equations for the mechanical properties were first examined for the 11 cases tested at W/C = 0.56, after which a correction was applied to account for the effect of the W/C ratio. Hereafter, the compressive strength and Young’s modulus for RuC with rubber content RRR (expressed as the mass replacement ratio, volume replacement ratio, or total surface area of rubber) and W/C ratio a% are denoted by σ(R,a) and E(R,a), respectively.
4.2.1. Estimation Equations for the Results at W/C = 0.56
Figure 6 shows the relationship between the compressive strength (upper panels) and Young’s modulus (lower panels) and the rubber mass replacement ratio Rm [%], volume replacement ratio Rv [%], and total surface area Sr for the tests at W/C = 0.56. The vertical axis (compressive strength or Young’s modulus) was nondimensionalized by the result of control case C (no rubber) within each series.
For the compressive strength, the figure also shows the approximation equations for each horizontal axis variable. Three types of approximation models have been proposed: the exponential function shown in Eq. (6), polynomial function in Eq. (7), and logistic function shown in Eq. (8). Although no previous studies have applied the logistic function to investigate the mechanical properties of RuC, this study explores its applicability. Considering that the variation in strength reduction behavior with respect to rubber content (Regions I, II, and III) discussed in Figure 2 may be reproduced by this function, a trial analysis using the logistic model is conducted herein.
where A, B, x0, and p are coefficients, and x is represented by Rm, Rv, or Sr.
The fitting procedure was identical to that for the slump; however, because the compressive strength was nondimensionalized, the vertical axis value was set to 1 when Sr = 0.
Table 2 presents the approximation results for each equation, along with the corresponding determination coefficients (R2). Because Eq. (7) is defined for dimensionless quantities, the parameters Rm and Rv were normalized by dividing by 100, whereas Sr was normalized by the maximum experimental value of 598 m2.
As shown in Table 2, all equations exhibit high coefficients of determination (R2 ≥ 0.85); however, the logistic function yields the highest value. Figure 6 shows that the approximation results obtained using Eqs. (6) and (7) exhibit smoother variations in Region II, where the compressive strength decreases rapidly compared with those of Eq. (8), resulting in a larger deviation from the experimental data. Contrastingly, the logistic function more accurately reproduces the strength reduction characteristics associated with the differences in rubber content.
Therefore, the logistic function is considered more suitable than the conventional exponential model for reproducing the compressive-strength reduction behavior of RuC. Based on these findings, subsequent analyses focused on the approximation model employing the logistic function.
Among the results of the approximation model employing the logistic function, for the mass and volume replacement ratios, the fitted curves did not reproduce the scatter of Series B because it consistently maintained these ratios. Therefore, plots using these variables on the horizontal axis cannot reflect differences in the test conditions. In contrast, when the total surface area was used, the fitting was satisfactory, even for Series B.
Therefore, for compressive strength, nondimensionalization enables approximation by a symmetric (logistic) function, irrespective of the differences between Series A and B. In contrast, the Young’s modulus shows clear differences between Series A and B. Specifically, in Series A, the reduction in Young’s modulus is limited for small Sr and decreases sharply beyond approximately Sr = 200 m2, whereas in Series B, even a small amount of rubber results in a pronounced reduction. We attribute this difference to an error in the test specimen’s deformation measurement. As a common basis could not be established for Young’s modulus, even after nondimensionalization, the following proposals focus on compressive strength.
4.2.2. Estimation Equation for Compressive Strength of RuC with Arbitrary W/C and Rubber Content
Next, we attempt to extend the estimation formula to W/C = 0.56, as examined in (1), such that it can be applied to any W/C ratio.
Figure 7 shows the relationship between W/C and σ(Sr,a)/σ(Sr,56) for each rubber particle size in Series B. Because the vertical axis is normalized by the compressive strength at W/C = 0.56 for the same particle size, all values are 1.0 at W/C = 0.56. As discussed in Figure 4, the “cement–water ratio” concept is also applicable to RuC compressive strength: values at W/C = 0.50 exceed 1.0, while those at W/C = 0.60 are below 1.0.
To quantify the change in the compressive-strength ratio with the W/C ratio, we examined the slope G of each line segment (red segments in Figure 7). In general, G = { s (a) / s (56) -1}/(-|a – 0.56|). For example, for Sr = 200 m2, the compressive-strength ratio at W/C = 0.50 is approximately σ(200,50)/σ(200,56)≈1.13, and the W/C difference between the two points is 0.06, yielding (1.13−1)/(−0.06)≈−2.17.
Table 3 lists the slopes of G for the line segments in Figure 7 and Figure 8 show the results. In Figure 8, G1 denotes the slope between W/C = 0.50 and 0.56, and G2 denotes the slope between W/C = 0.56 and 0.60. In both ranges, the slope decreased with increasing particle size, indicating a diminished influence of the W/C ratio on the compressive strength for larger particles.
From the upper panel of Figure 8 (range 0.50 ≤ W/C ≤ 0.56), G1 decreases approximately linearly with increasing Sr. From the lower panel (range 0.56 ≤ W/C ≤ 0.60), G2 decreases with Sr for Sr ≤ 100 m2, but remains constant at −7.94 for Sr ≥ 100 m2. Therefore, the relationship between the compressive-strength increase/decrease rate and Sr can be expressed by Eqs. (9) and (10), respectively. In the following equations, the ranges enclosed within < > indicate the applicable domains of each equation.
By rearrangement, the compressive strength σ(Sr,a) of RuC with an arbitrary W/C ratio can be obtained from Eqs. (8)–(10):
Here, σ(Sr,56) on the right-hand side can be obtained from Table 2 using Eq. (14):
Substituting Eq. (14) into Eqs. (11)–(13) yield the compressive strengths of RuC for arbitrary W/C ratios and rubber content.
4.2.3. Verification of Estimation Accuracy
Equations (11)–(13) correct the symmetric mathematical model (logistic curve) to evaluate the asymmetric tendency, whereby the influence of the W/C ratio on the RuC compressive strength depends on the rubber surface area. Here, we assessed the extent to which this correction improved prediction accuracy.
Figure 9 shows a comparison of the experimentally obtained compressive strengths (the experimental values are listed in Table 1) with those calculated using the equations discussed herein. For W/C = 0.50 and 0.60, two calculated values are presented: those obtained directly from the equations in Table 2 and those computed using Eqs. (11)–(14). Table 4 summarizes the means and sample standard deviations of the ratios (experiment/calculation). The statistics are reported for the W/C-corrected cases (0.50 and 0.60 only) and all data, including W/C = 0.56.
As shown in Figure 9, the calculated values for W/C = 0.56 generally agree with the experimental results. For the cases with W/C = 0.50 and 0.60, the compressive-strength values calculated using the equations from Table 2 was slightly higher than the experimental results. In contrast, the values derived using Eqs. (11)–(14) were closer to the experimental values. The mean experiment/calculation ratio for W/C = 0.50 and 0.60 is 0.88 when using the Table-2 equations but improves to 1.02 when using Eqs. (11)–(14), indicating better agreement after correction. Using all the data, the mean ratio was calculated using Eqs. (11)–(14) was 1.00, demonstrating an accurate evaluation of the experiments.
In summary, the compressive strength of RuC can be determined using a symmetric logistic model once the effects of W/C and rubber incorporation are appropriately corrected using Eqs. (11)–(14).
5. Discussion and Conclusions
This study proposes estimation models for the fresh and mechanical properties of RuC using symmetric functions and asymmetric corrections. The principal findings of this study are as follows:
- The slump and air content of RuC are strongly governed by the total surface area of the incorporated rubber, whereas the influence of the W/C ratio is limited. The slump, which is a monotonic quantity with upper and lower bounds, was well approximated by a logistic function, whereas the air content was well captured by a saturating exponential function. This supports the treatment of the total rubber surface area as the primary control variable in the mix design.
- The compressive strength decreased with increasing rubber content; however, the degree of reduction was not uniform and depended on the W/C ratio, amount, and properties of the rubber. Specifically, strength sensitivity to variations in the W/C ratio increased with smaller particle size or larger surface area, and decreased with larger particles or smaller surface areas.
- The logistic function provided a more appropriate mathematical model than conventional exponential or polynomial functions. This is because the experimental results exhibited a distinctly nonlinear reduction in compressive strength: a modest decrease at low and high rubber contents, but a sharp decline in an intermediate transition zone. The logistic function accurately captured this rapid strength reduction, whereas simpler models fail to reproduce it with comparable accuracy.
- The relationship between compressive strength and total rubber surface area at a W/C ratio of 0.56 was defined using a logistic baseline, and a W/C-dependent correction was proposed to account for differences in strength ratios across W/C levels. This two-step model (“symmetric baseline” + “W/C-dependent correction”) enables consistent estimation of the RuC compressive strength for arbitrary conditions (W/C and rubber content).
- By correcting for W/C using the two-step model, the tendency of a simple symmetric model (logistic function) to overestimate relative to the experiments was mitigated, yielding improved agreement. Thus, even for strongly asymmetric material behaviors, such as the RuC compressive strength, appropriately corrected symmetric models can provide accurate and practical predictions.
These findings also provide a methodological framework for evaluating concrete properties in relation to the material characteristics incorporated into the mix. These results suggest potential pathways for developing concretes with enhanced performance and additional functional properties by conducting further experiments with various materials and applying the same analytical approach presented herein—thereby extending its applicability beyond rubber.
However, the model proposed in this study was developed and validated within a limited range of mix proportions, particularly under specific W/C ratios, rubber particle sizes, and replacement levels. To verify the general applicability and predictive accuracy of the proposed equations, it is essential to expand the database to encompass a broader range of cement types, admixtures, and aggregate sources. Furthermore, beyond experimental validation, the development of reproduction models and parametric analyses that consider the deformation of rubber particles and their interaction or detachment within the ITZ and surrounding cement matrix will be indispensable for further elucidating the underlying mechanisms.
Author Contributions
As the research coordinator, Kouno developed the research concept, selected the experimental conditions and cases, conducted the experiments, and analyzed the results. He wrote and edited the manuscript. Qiu and Tang prepared the test samples and conducted the experiments. Qiu was responsible for preparing the figures for the experimental results. Tang and Qiu reviewed and approved the manuscript by Kouno.
Funding
This study was conducted with the support of research grants from the Takahashi Industrial and Economic Research Foundation in the fiscal year 2025.
Data Availability Statement
Data is contained within the article or supplementary material. The original contributions presented in this study are included in the article/supplementary material. Further inquiries can be directed to the corresponding author.
Conflicts of Interest
The authors declare no conflicts of interest. The funders had no role in the design of the study; in the collection, analyses, or interpretation of data; in the writing of the manuscript; or in the decision to publish the results.
References
- Tang, B.; Wu, H.; Wu, Y.F. Evaluation of carbon footprint of compression cast waste rubber concrete based on LCA approach. J. Build. Eng. 2024, 86. [Google Scholar] [CrossRef]
- He, S.; Jiang, Z.; Chen, H.; Chen, Z.; Ding, J.; Deng, H.; Mosallam, A.S. Mechanical properties, durability, and structural applications of rubber concrete: A state-of-the-art-review. Sustainability 2023, 15. [Google Scholar] [CrossRef]
- Agrawal, D.; Waghe, U.; Ansari, K.; Amran, M.; Gamil, Y.; Alluqmani, A.E.; Thakare, N. Optimization of eco-friendly concrete with recycled coarse aggregates and rubber particles as sustainable industrial byproducts for construction practices. Heliyon 2024, 10, e25923. [Google Scholar] [CrossRef] [PubMed]
- Du, T.; Yang, Y.; Cao, H.; Si, N.; Kordestani, H.; Sktani, Z.D.I.; Arab, A.; Zhang, C. Rubberized concrete: Effect of the rubber size and content on static and dynamic behavior. Buildings 2024, 14. [Google Scholar] [CrossRef]
- Guíñez, F.; Santa María, H.; Araya-Letelier, G.; Lincoleo, J.; Palominos, F. Effect of mix dosage on rubberized concrete mechanical performance: A multivariable prediction model towards design provisions. J. Build. Eng. 2024, 90. [Google Scholar] [CrossRef]
- Samal, D.K.; Ray, S. An improved understanding of the influence of w/c ratio and interfacial transition zone on fracture mechanisms in concrete. Mag. Concr. Res. 2023, 75, 847–863. [Google Scholar] [CrossRef]
- Wang, S.; Gao, W.; Zhu, P.; Wu, J.; Liu, H.; Lyu, Q.; Liu, S. Leaching-induced deterioration of shear bonding strength and micro-Vickers hardness of the ITZ modified by micro-SiO2 and nano-SiO2. J. Build. Eng. 2024, 92. [Google Scholar] [CrossRef]
- Gregori, A.; Castoro, C.; Venkiteela, G. Predicting the compressive strength of rubberized concrete using artificial intelligence methods. Sustainability 2021, 13. [Google Scholar] [CrossRef]
- Zvonarić, M.; Benšić, M.; Barišić, I.; Dokšanović, T. Prediction models for mechanical properties of cement-bound aggregate with waste rubber. Appl. Sci. 2024, 14. [Google Scholar] [CrossRef]
- Zhang, G.; Du, H.; Li, J.; Yuan, J. Effect of rubber aggregates on early-age mechanical properties and deformation behaviors of cement mortar. Buildings 2024, 14. [Google Scholar] [CrossRef]
- Buddhacosa, N.; Galos, J.; Khatibi, A.; Das, R.; Kandare, E. Effect of tyre-derived rubber particle size on the mechanical properties of rubberised syntactic foam. Cleaner Mater. 2024, 11. [Google Scholar] [CrossRef]
- Japanese Industrial Standards Committee. JIS A 1101:2020 Method of Test for Slump of Concrete; Japanese Standards Association. 2020.
- Japanese Industrial Standards Committee. JIS A 1128: 2020 Method of Test for Air Content of Fresh Concrete; Japanese Standards Association. 2020.
- Japanese Industrial Standards Committee. JIS A 1108: 2020 Method of Test for Compressive Strength of Concrete; Japanese Standards Association. 2018.
- Japanese Industrial Standards Committee. JIS A 1149 Method of Test for Static Modulus of Elasticity of Concrete; Japanese Standards Association, 2010.
- Zheng, W.; Shui, Z.; Xu, Z.; Gao, X.; Gao, K. Impact of coarse aggregate morphology andseparation distance on concrete properties based on visual learning. J. Build. Eng. 2024, 89. [Google Scholar] [CrossRef]
Figure 1.
Gradation curves of natural aggregates and rubber chips.
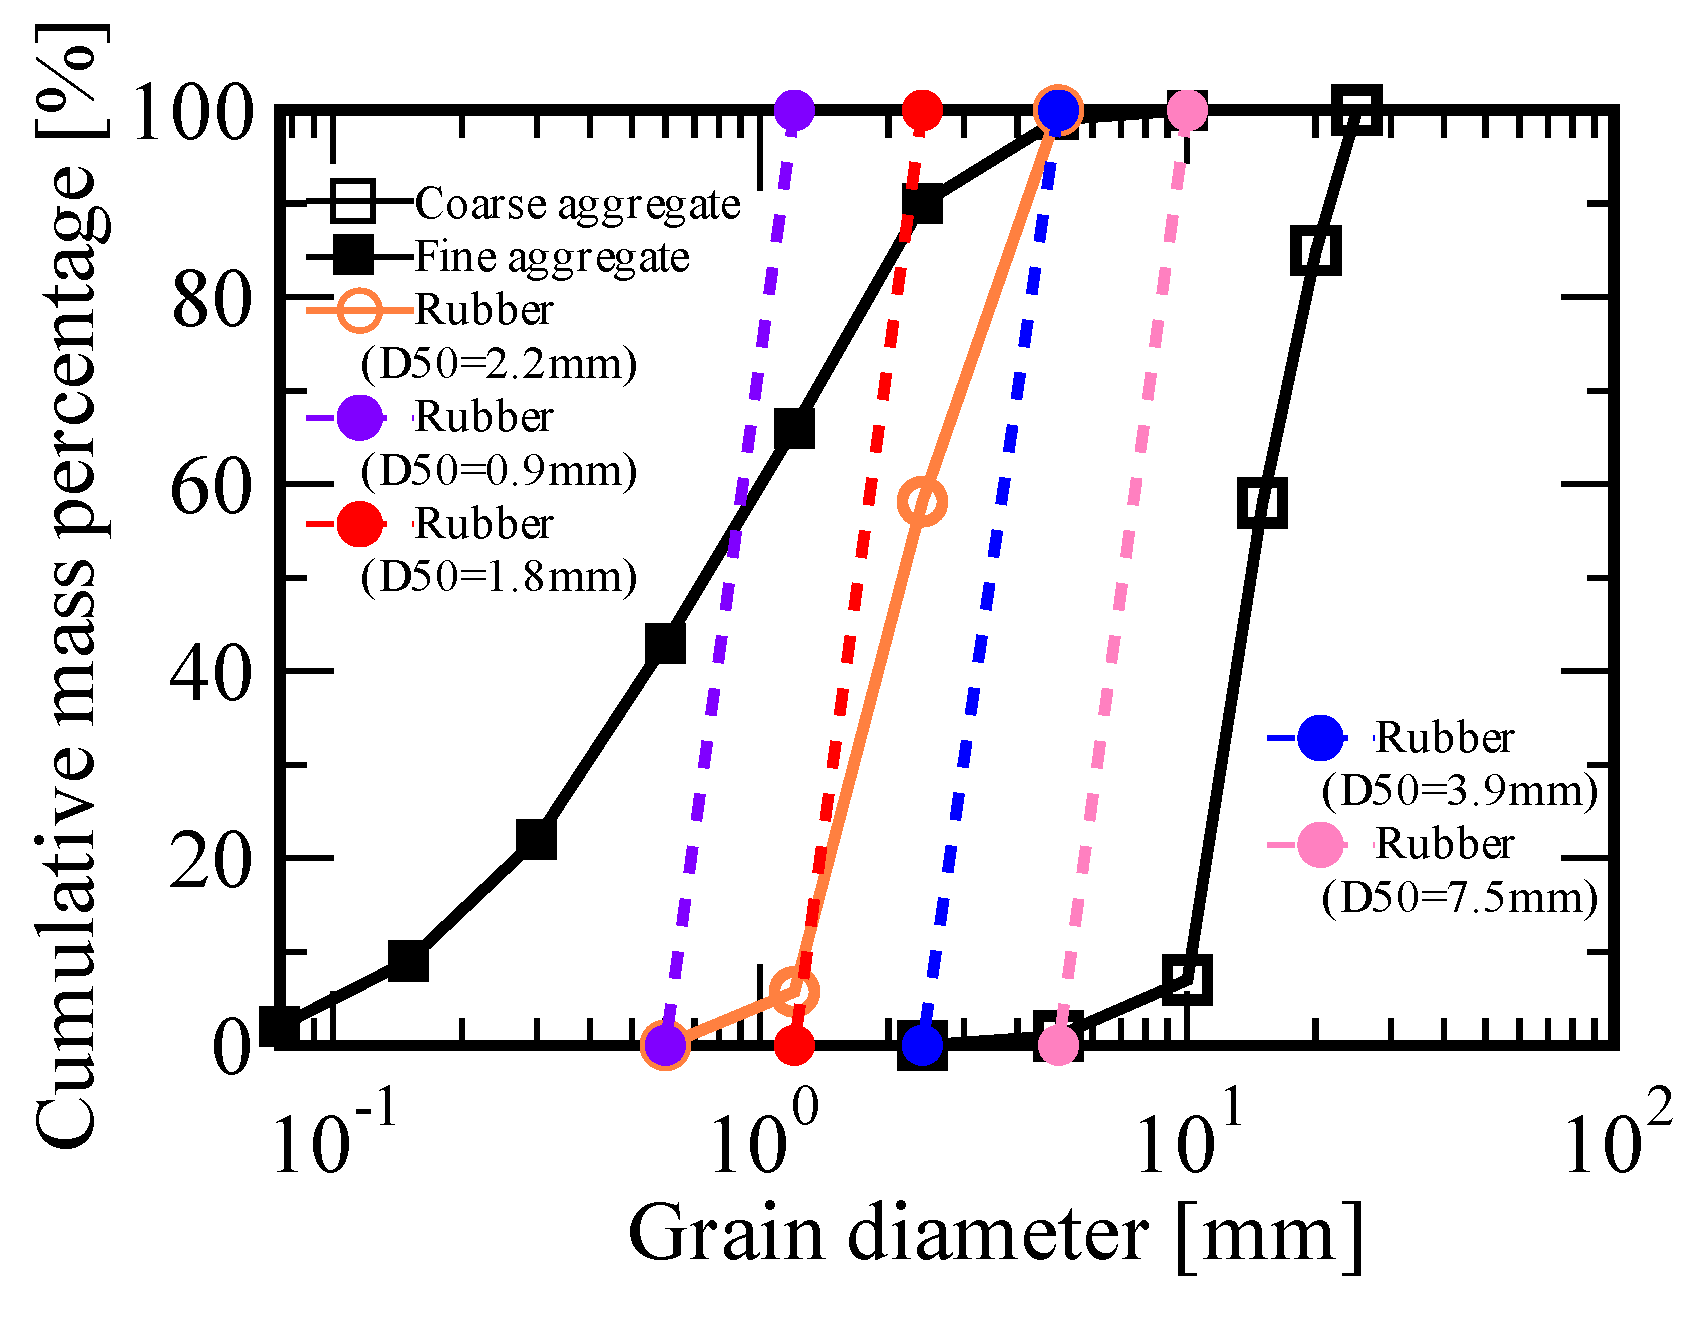
Figure 2.
Relationship between rubber properties and RuC characteristics: (a) rubber mass replacement ratio, (b) rubber volume replacement ratio, (c) rubber diameter, and (d) rubber surface area. (1st row: slump, 2nd row: air content, 3rd row: compressive strength, and 4th row: Young’s modulus).
Figure 2.
Relationship between rubber properties and RuC characteristics: (a) rubber mass replacement ratio, (b) rubber volume replacement ratio, (c) rubber diameter, and (d) rubber surface area. (1st row: slump, 2nd row: air content, 3rd row: compressive strength, and 4th row: Young’s modulus).
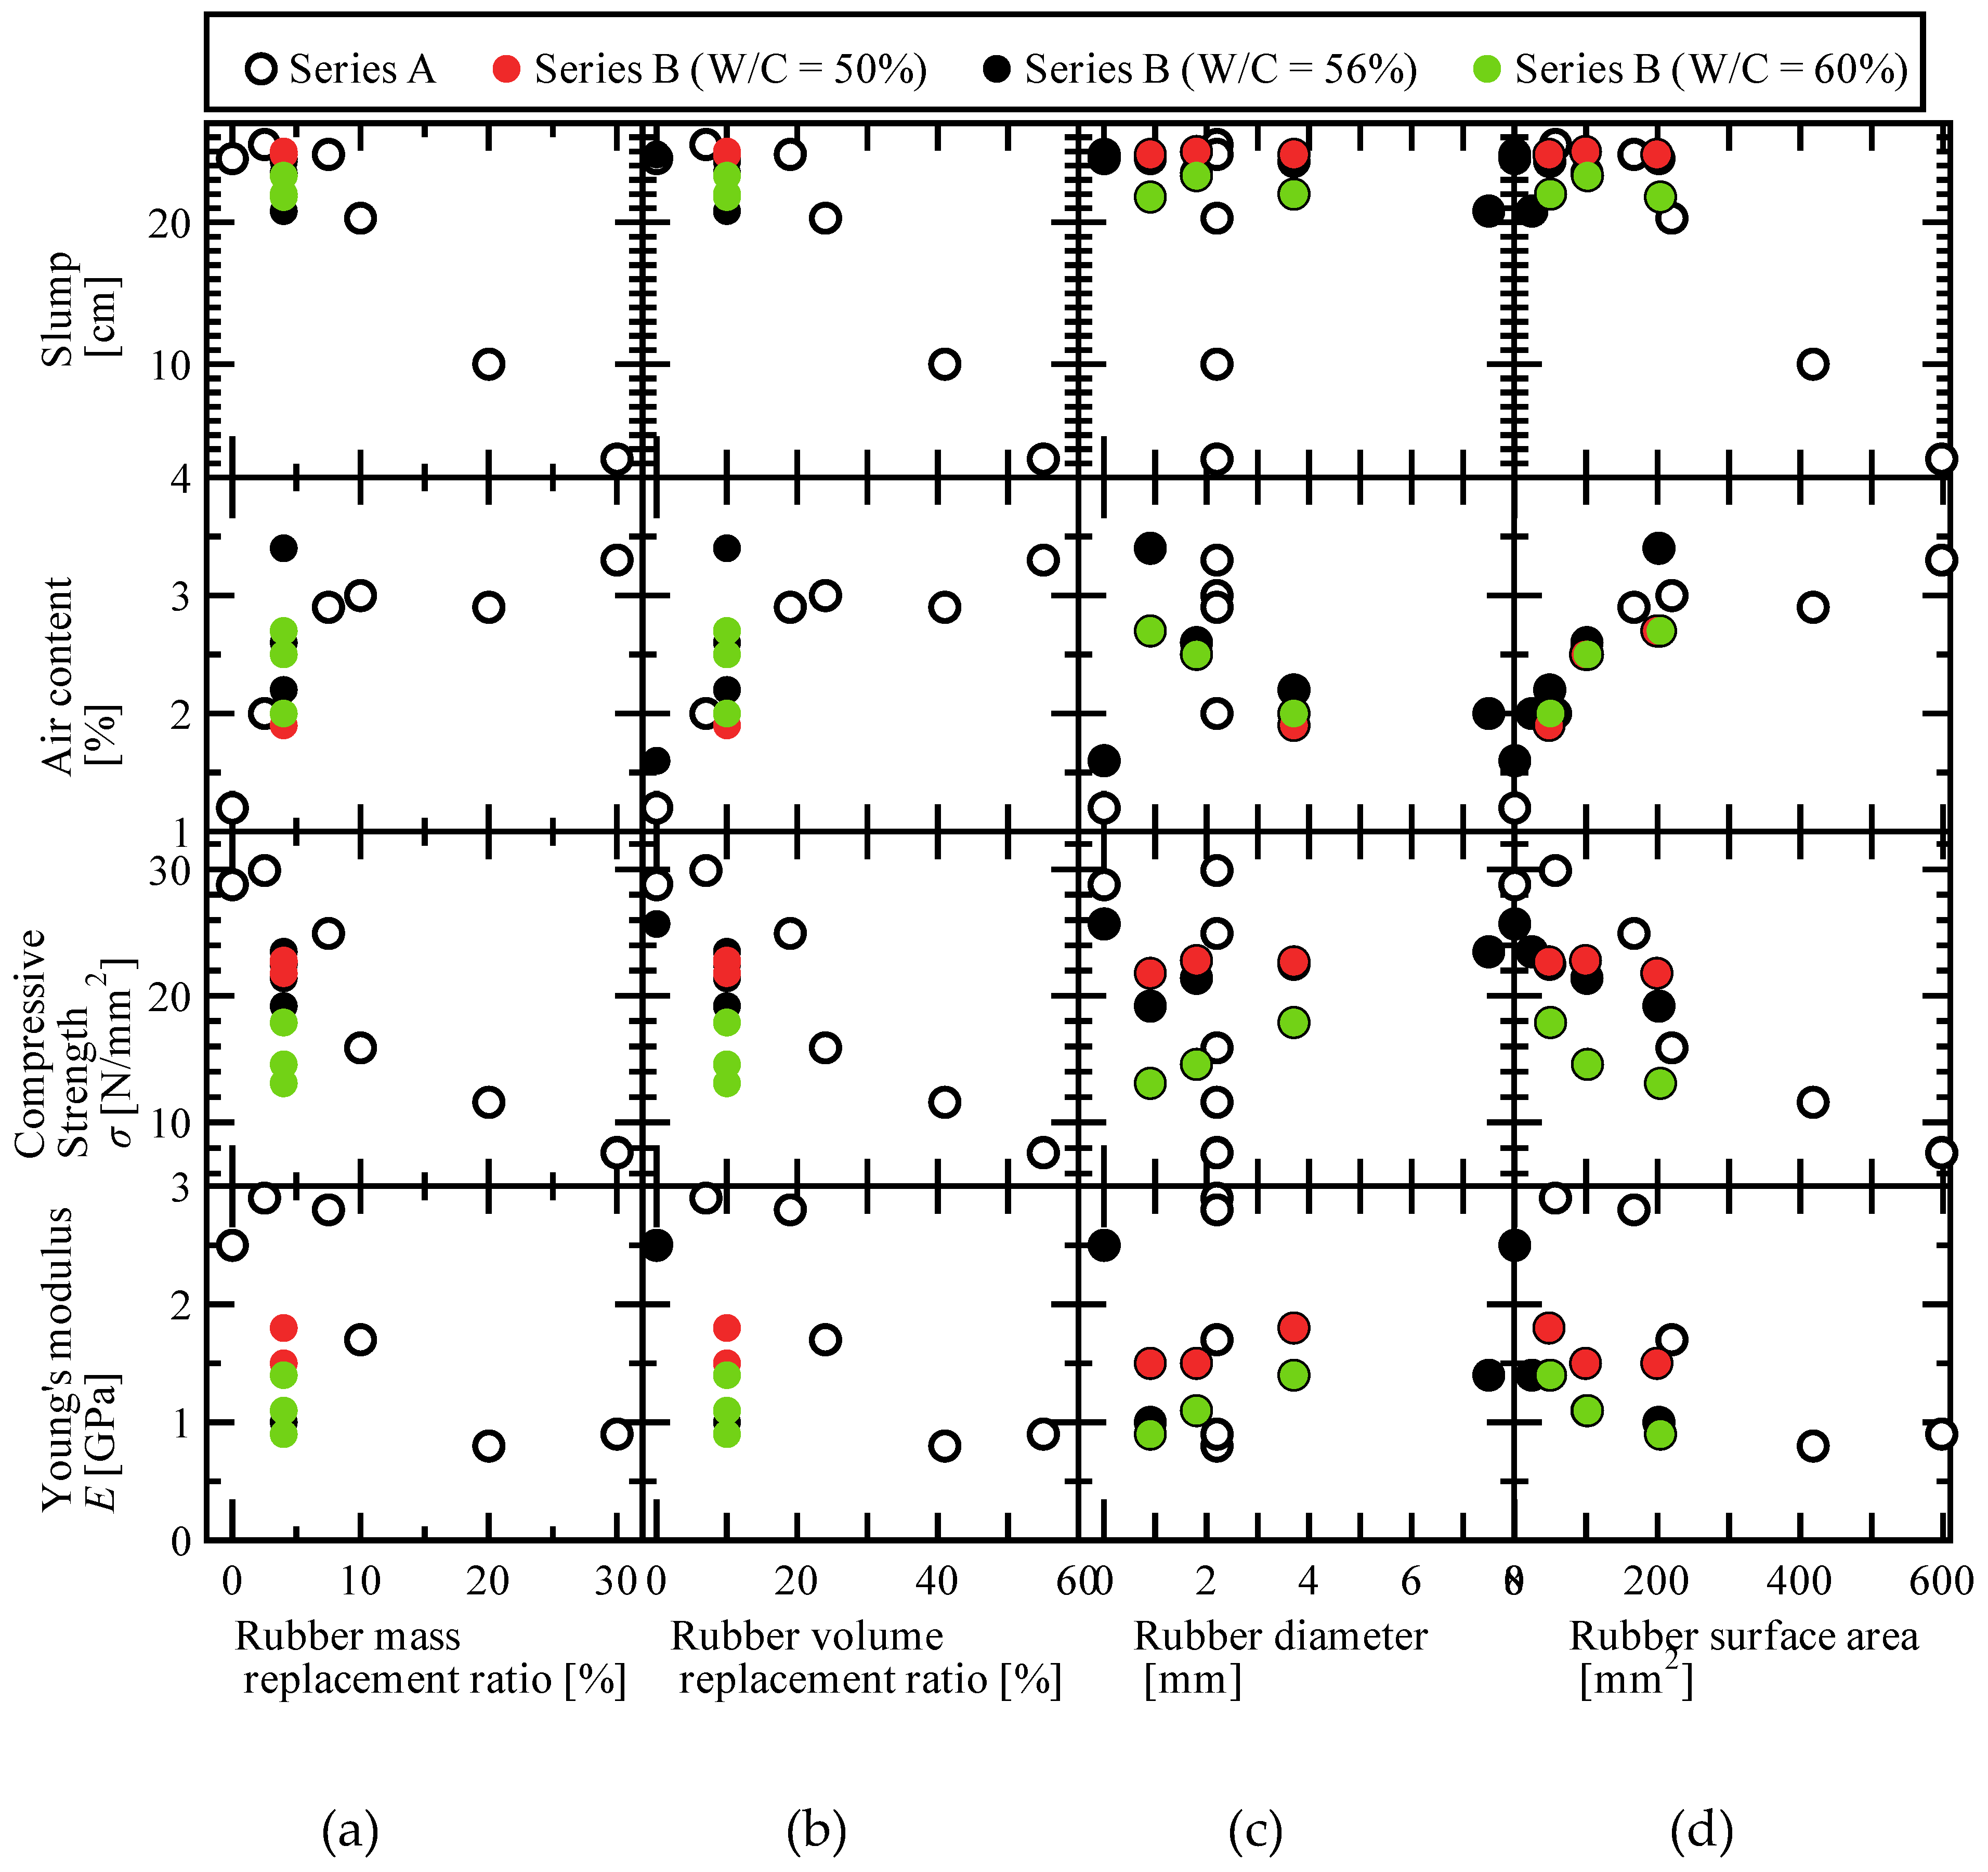
Figure 3.
Relationship between slump, fineness modulus, and aggregate weight.
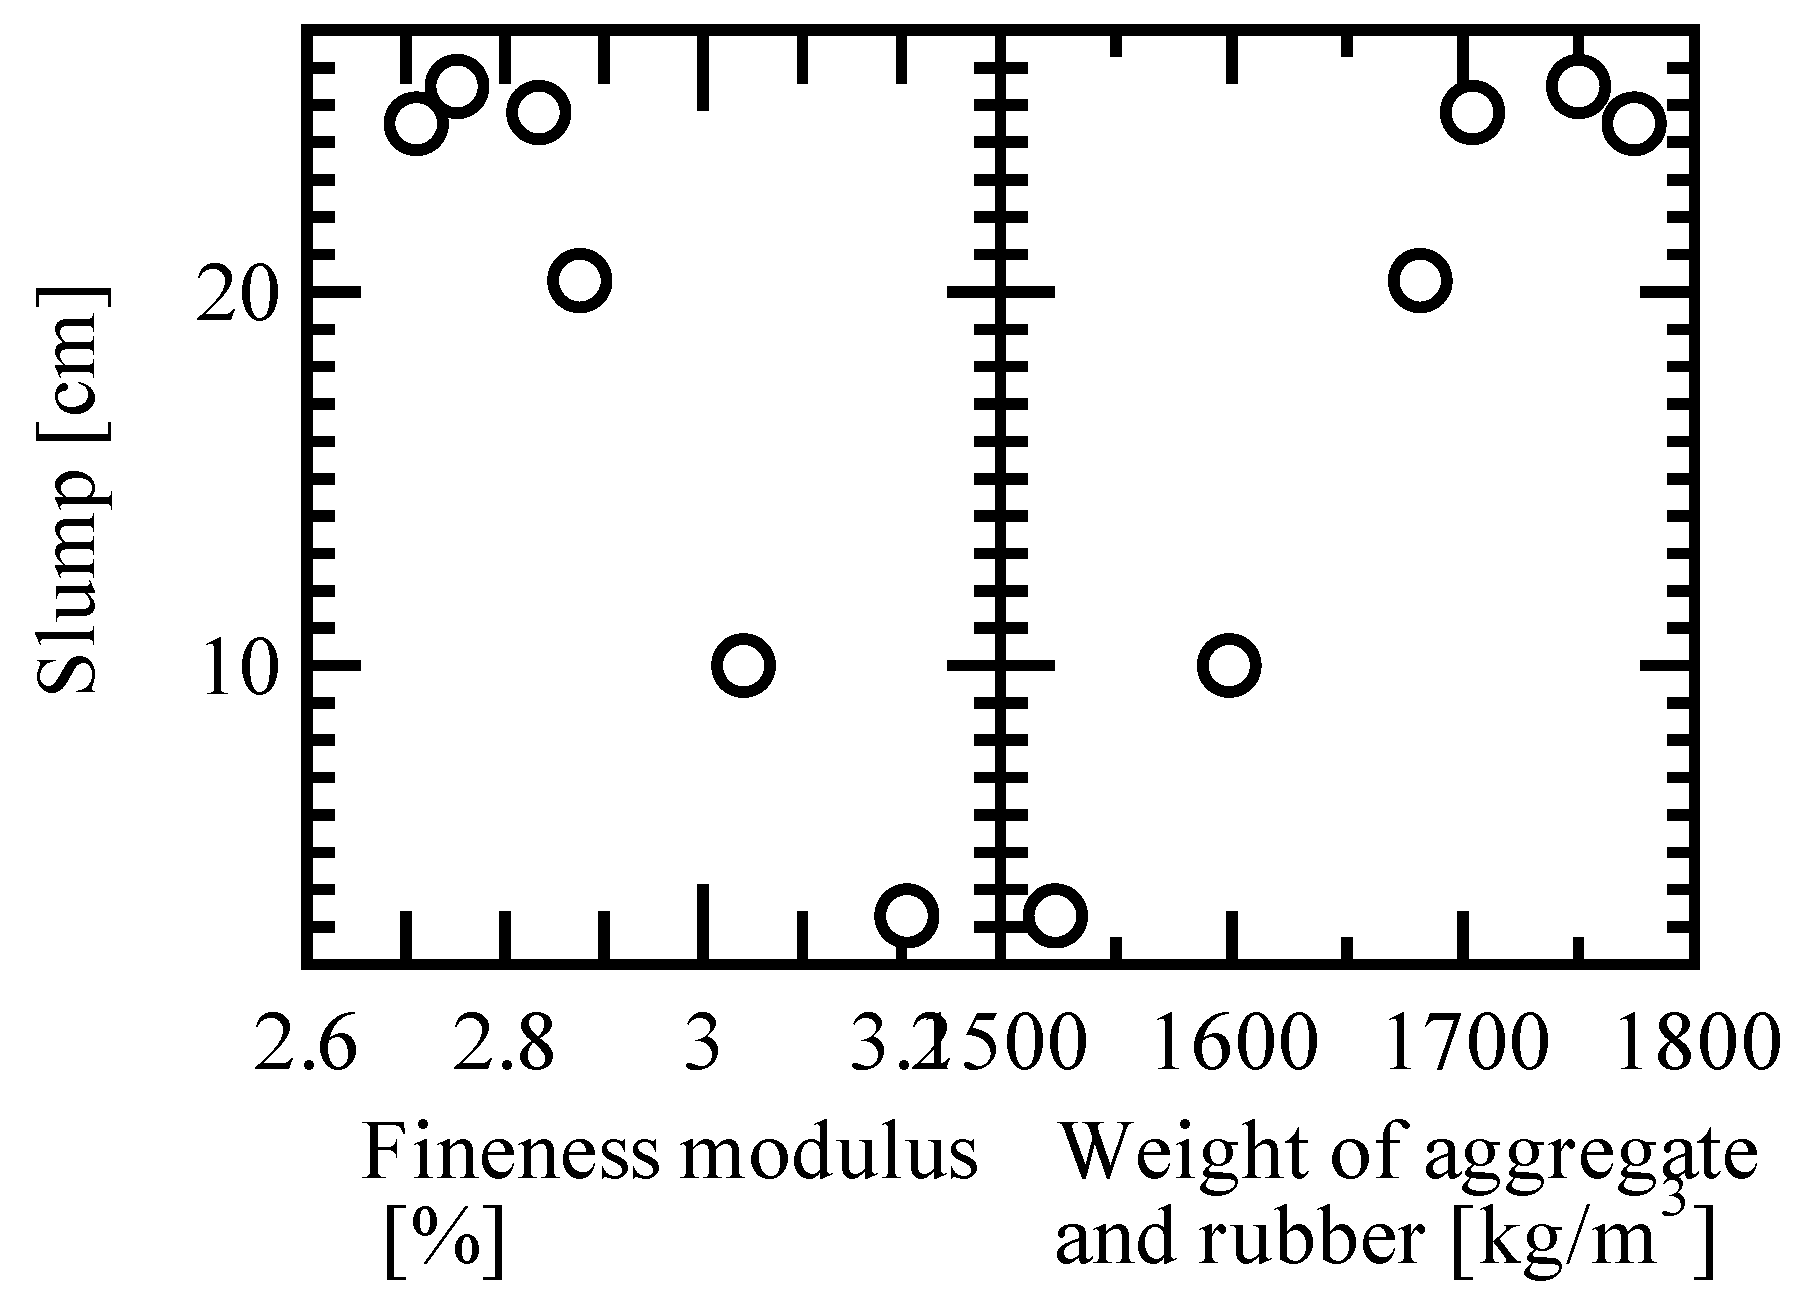
Figure 4.
Effect of rubber particle size D50 and total effective area Sr on the relationship between mechanical properties (Series B).
Figure 4.
Effect of rubber particle size D50 and total effective area Sr on the relationship between mechanical properties (Series B).
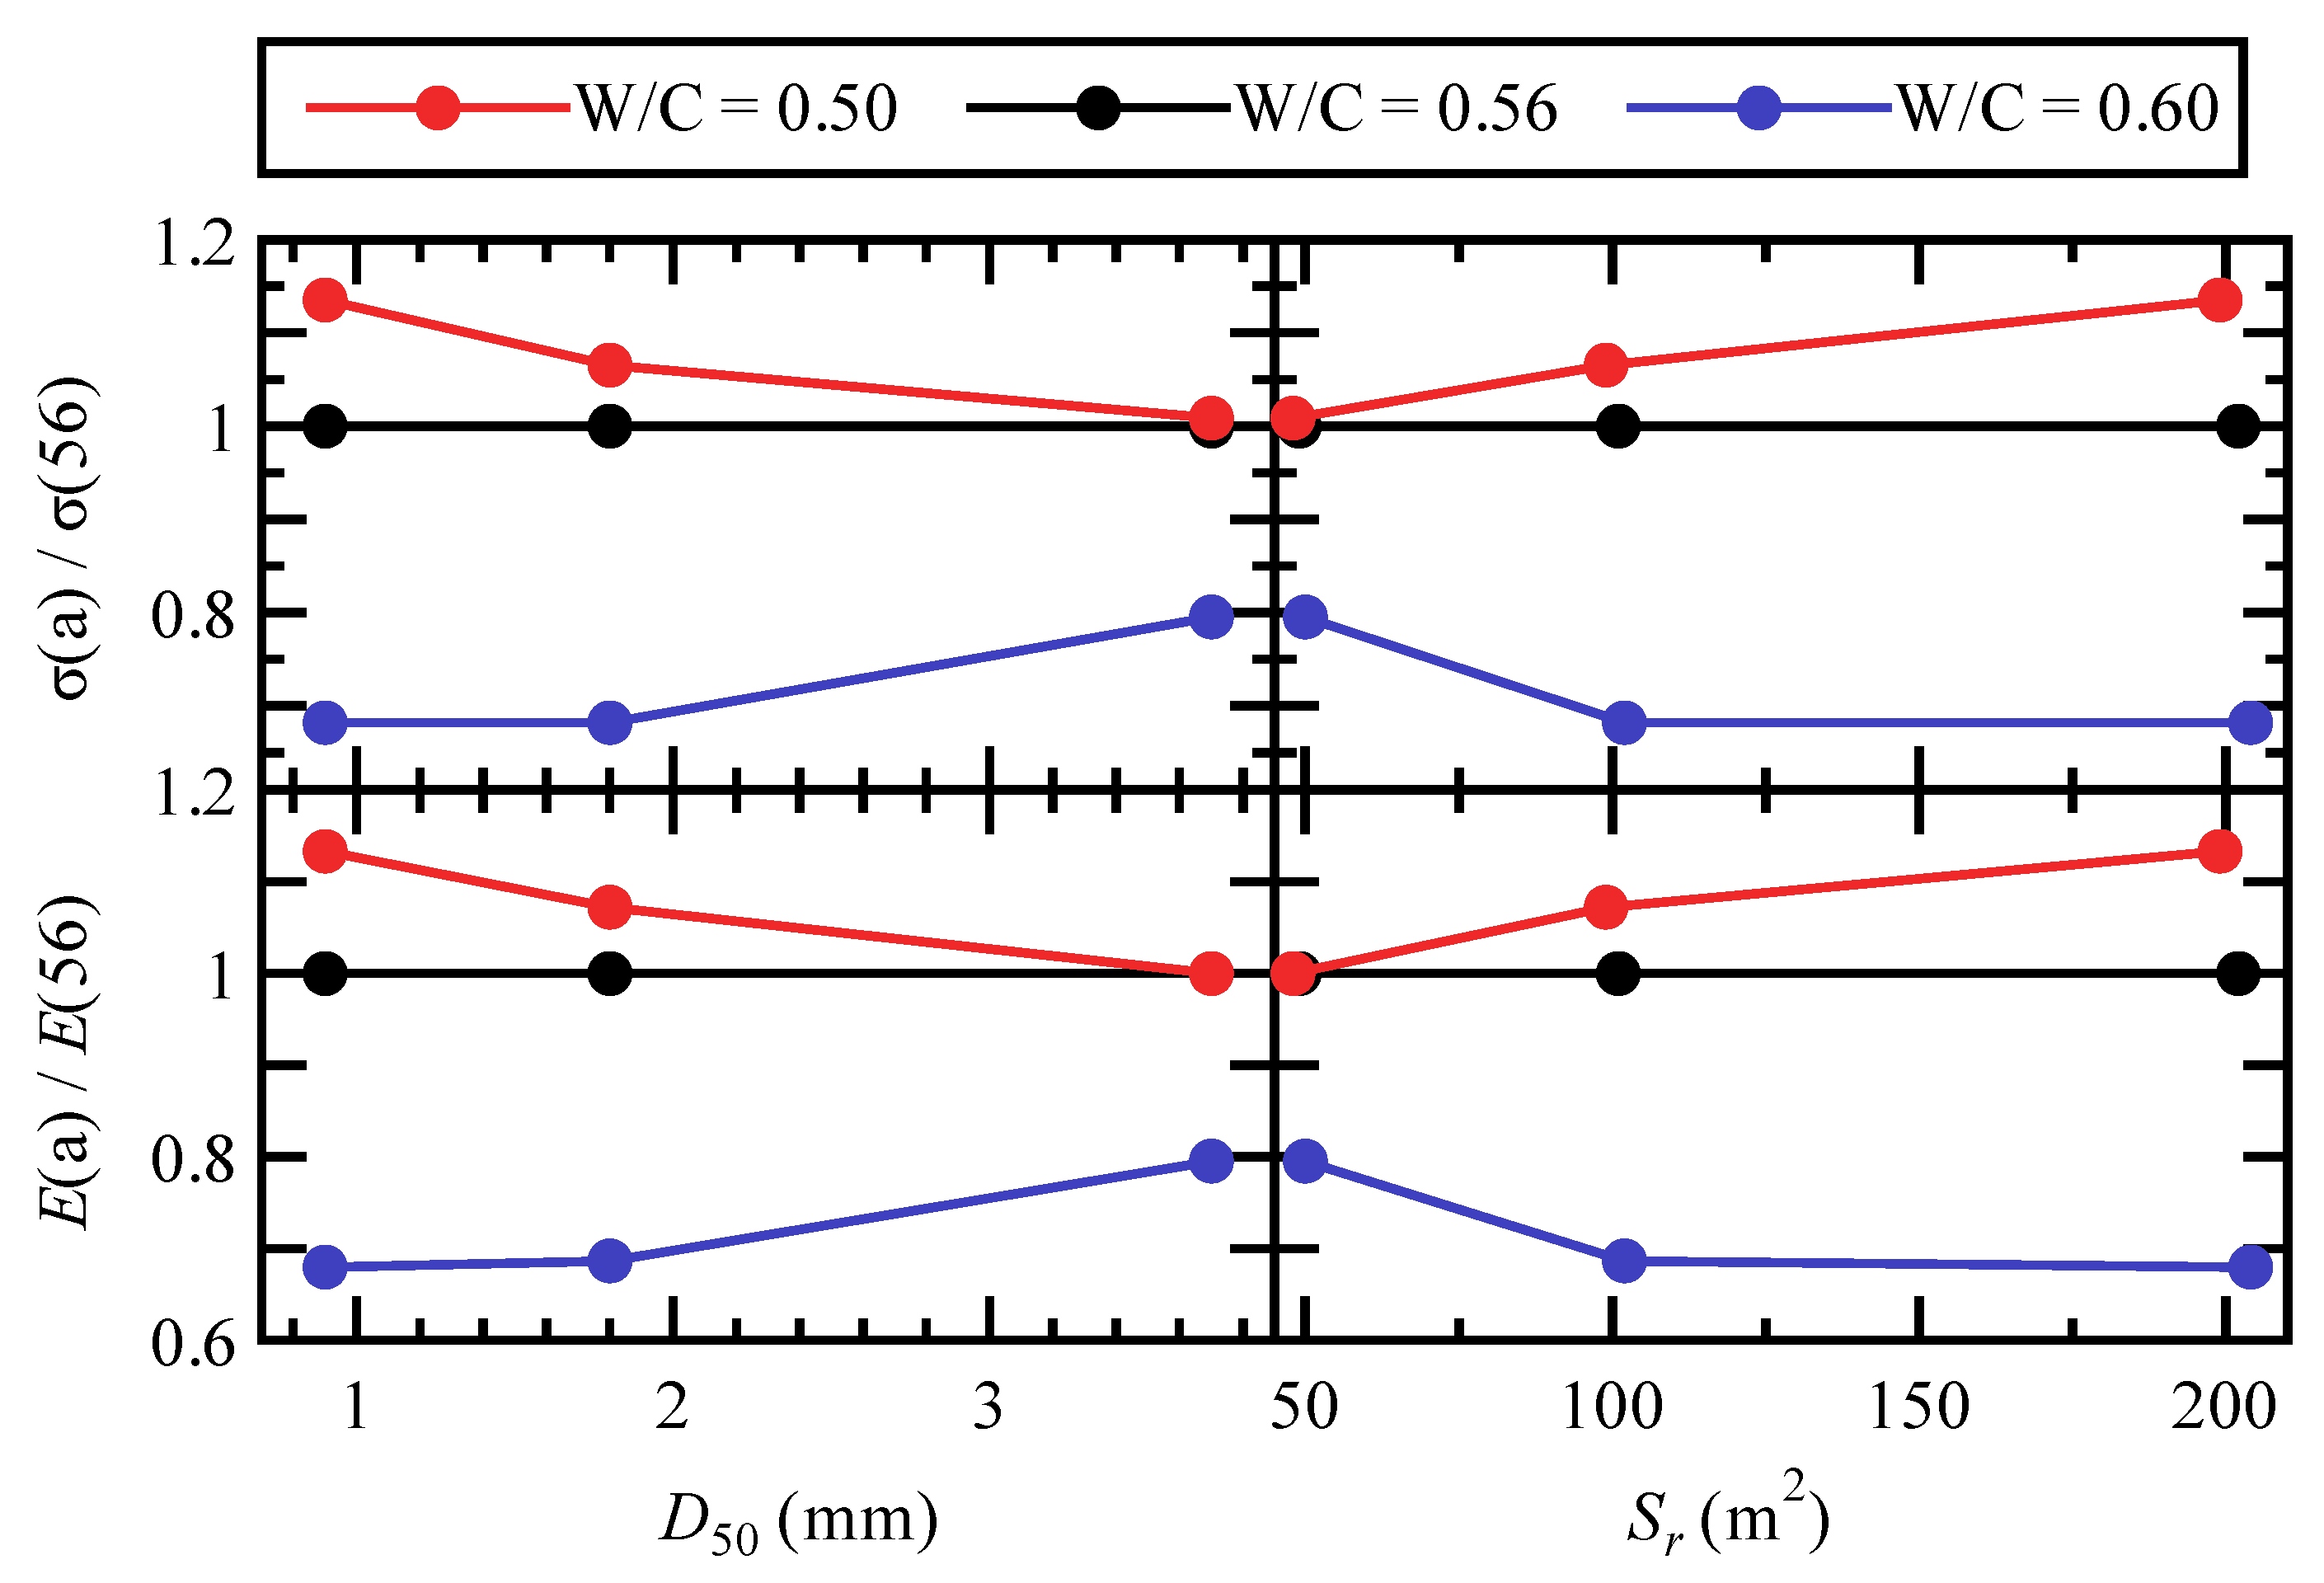
Figure 5.
Relationship between RuC slump, air content, and total rubber surface area.
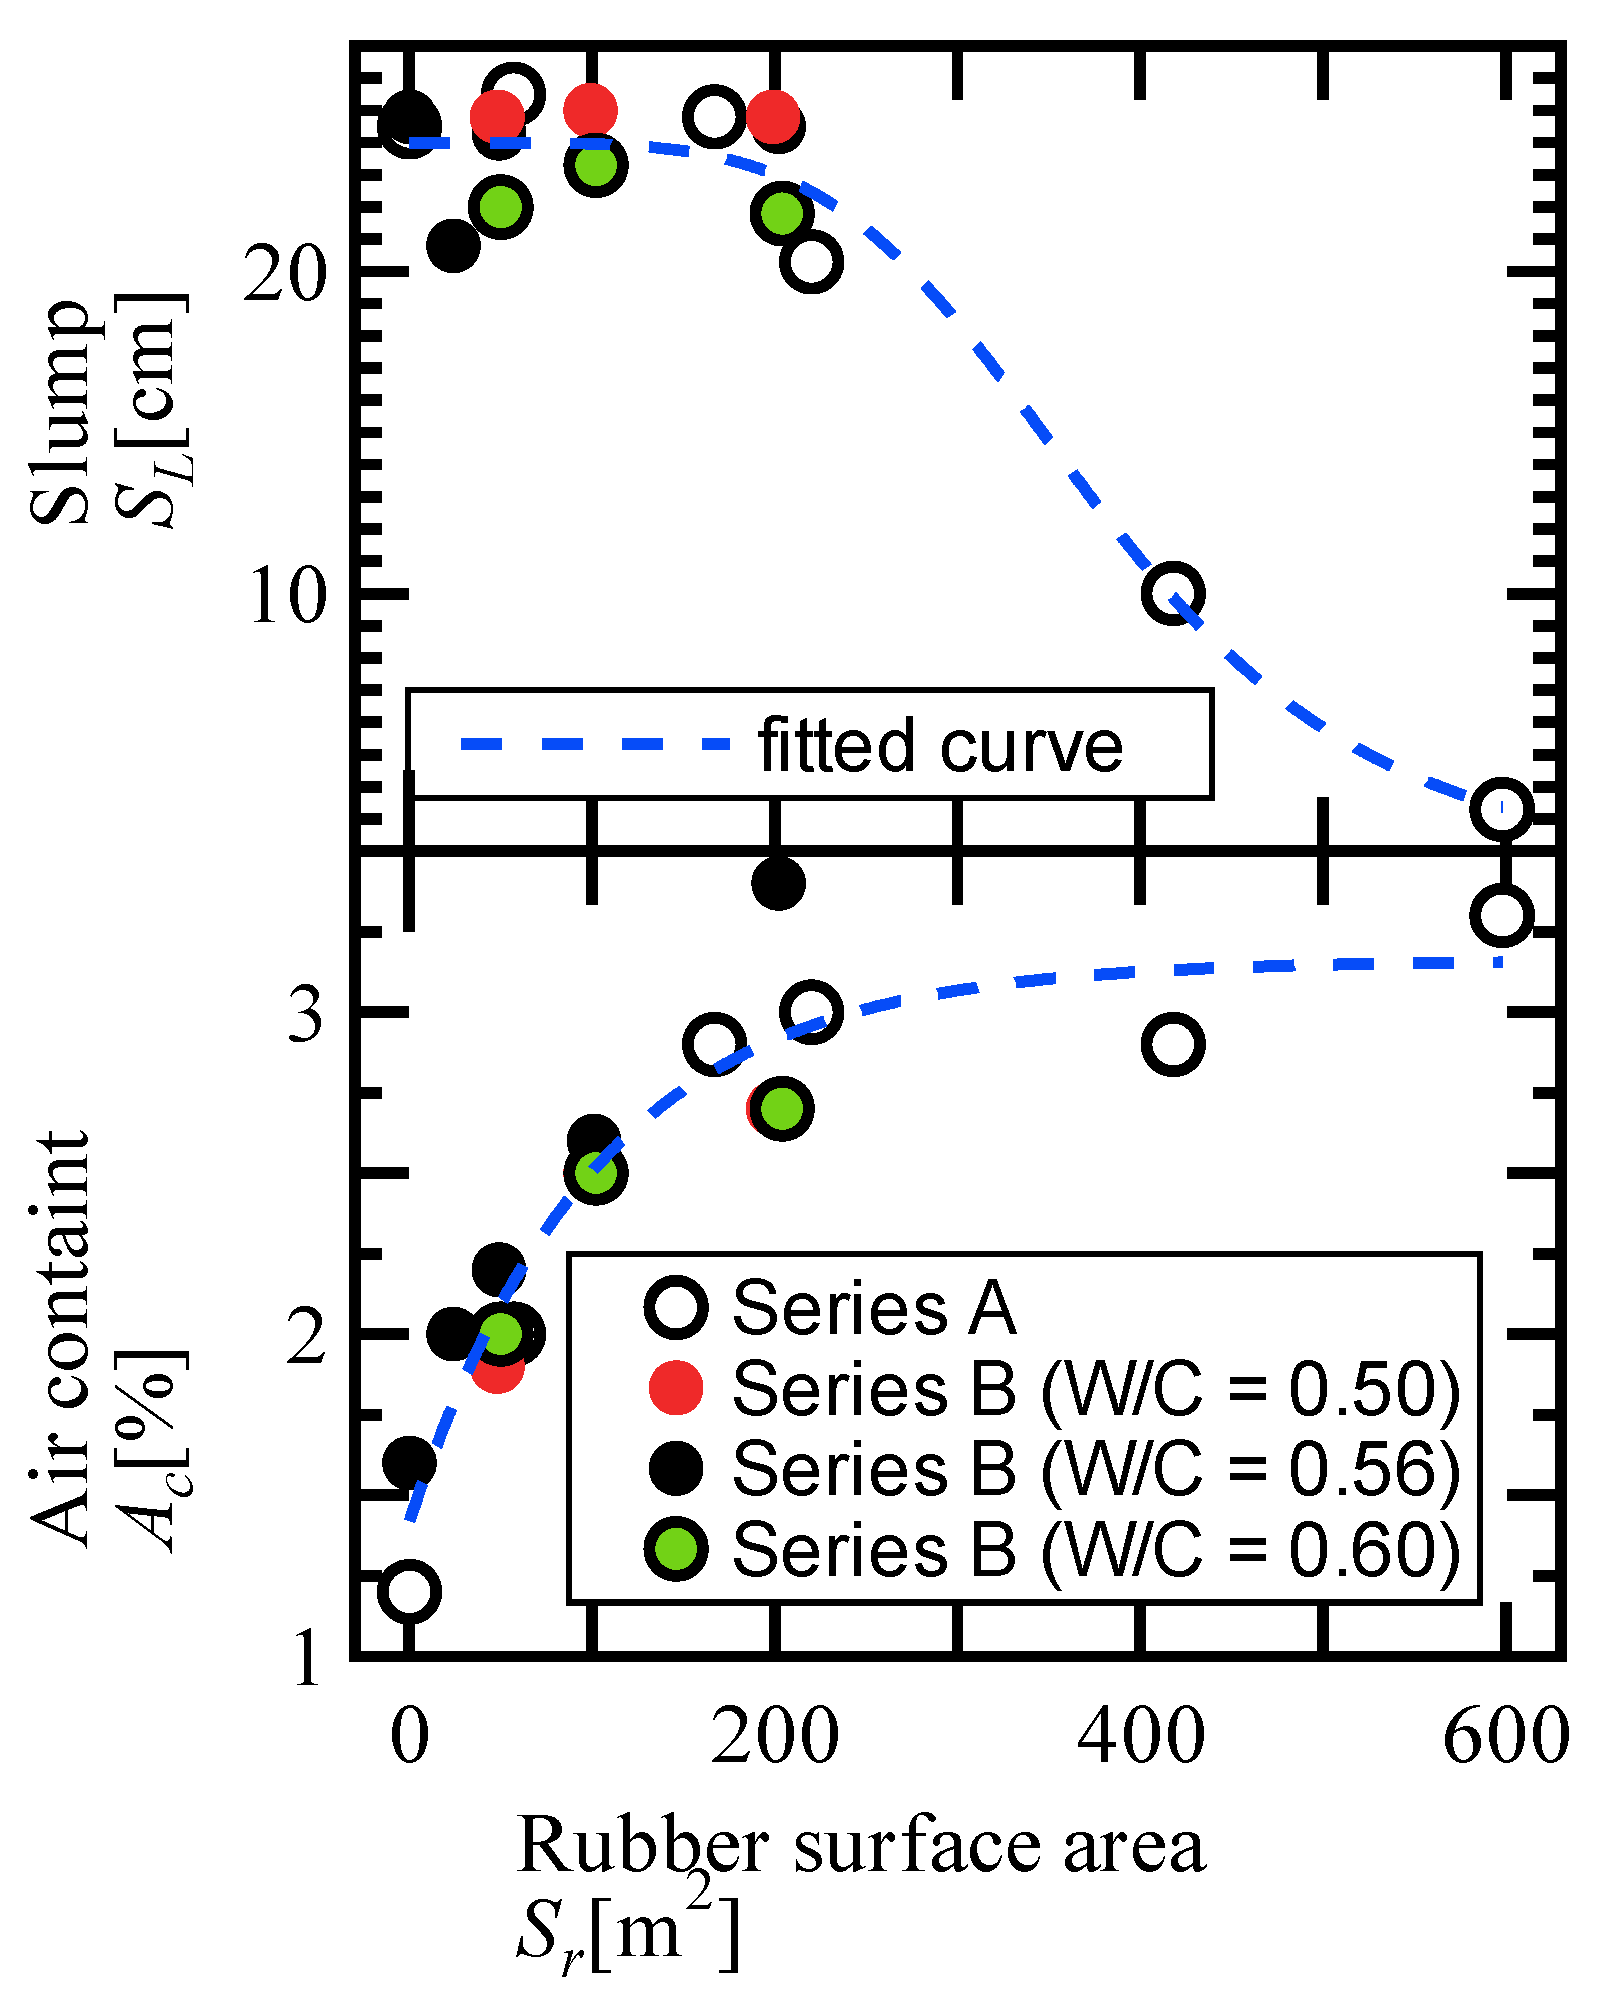
Figure 6.
Relationship between the mechanical properties of RuC and rubber quantities.
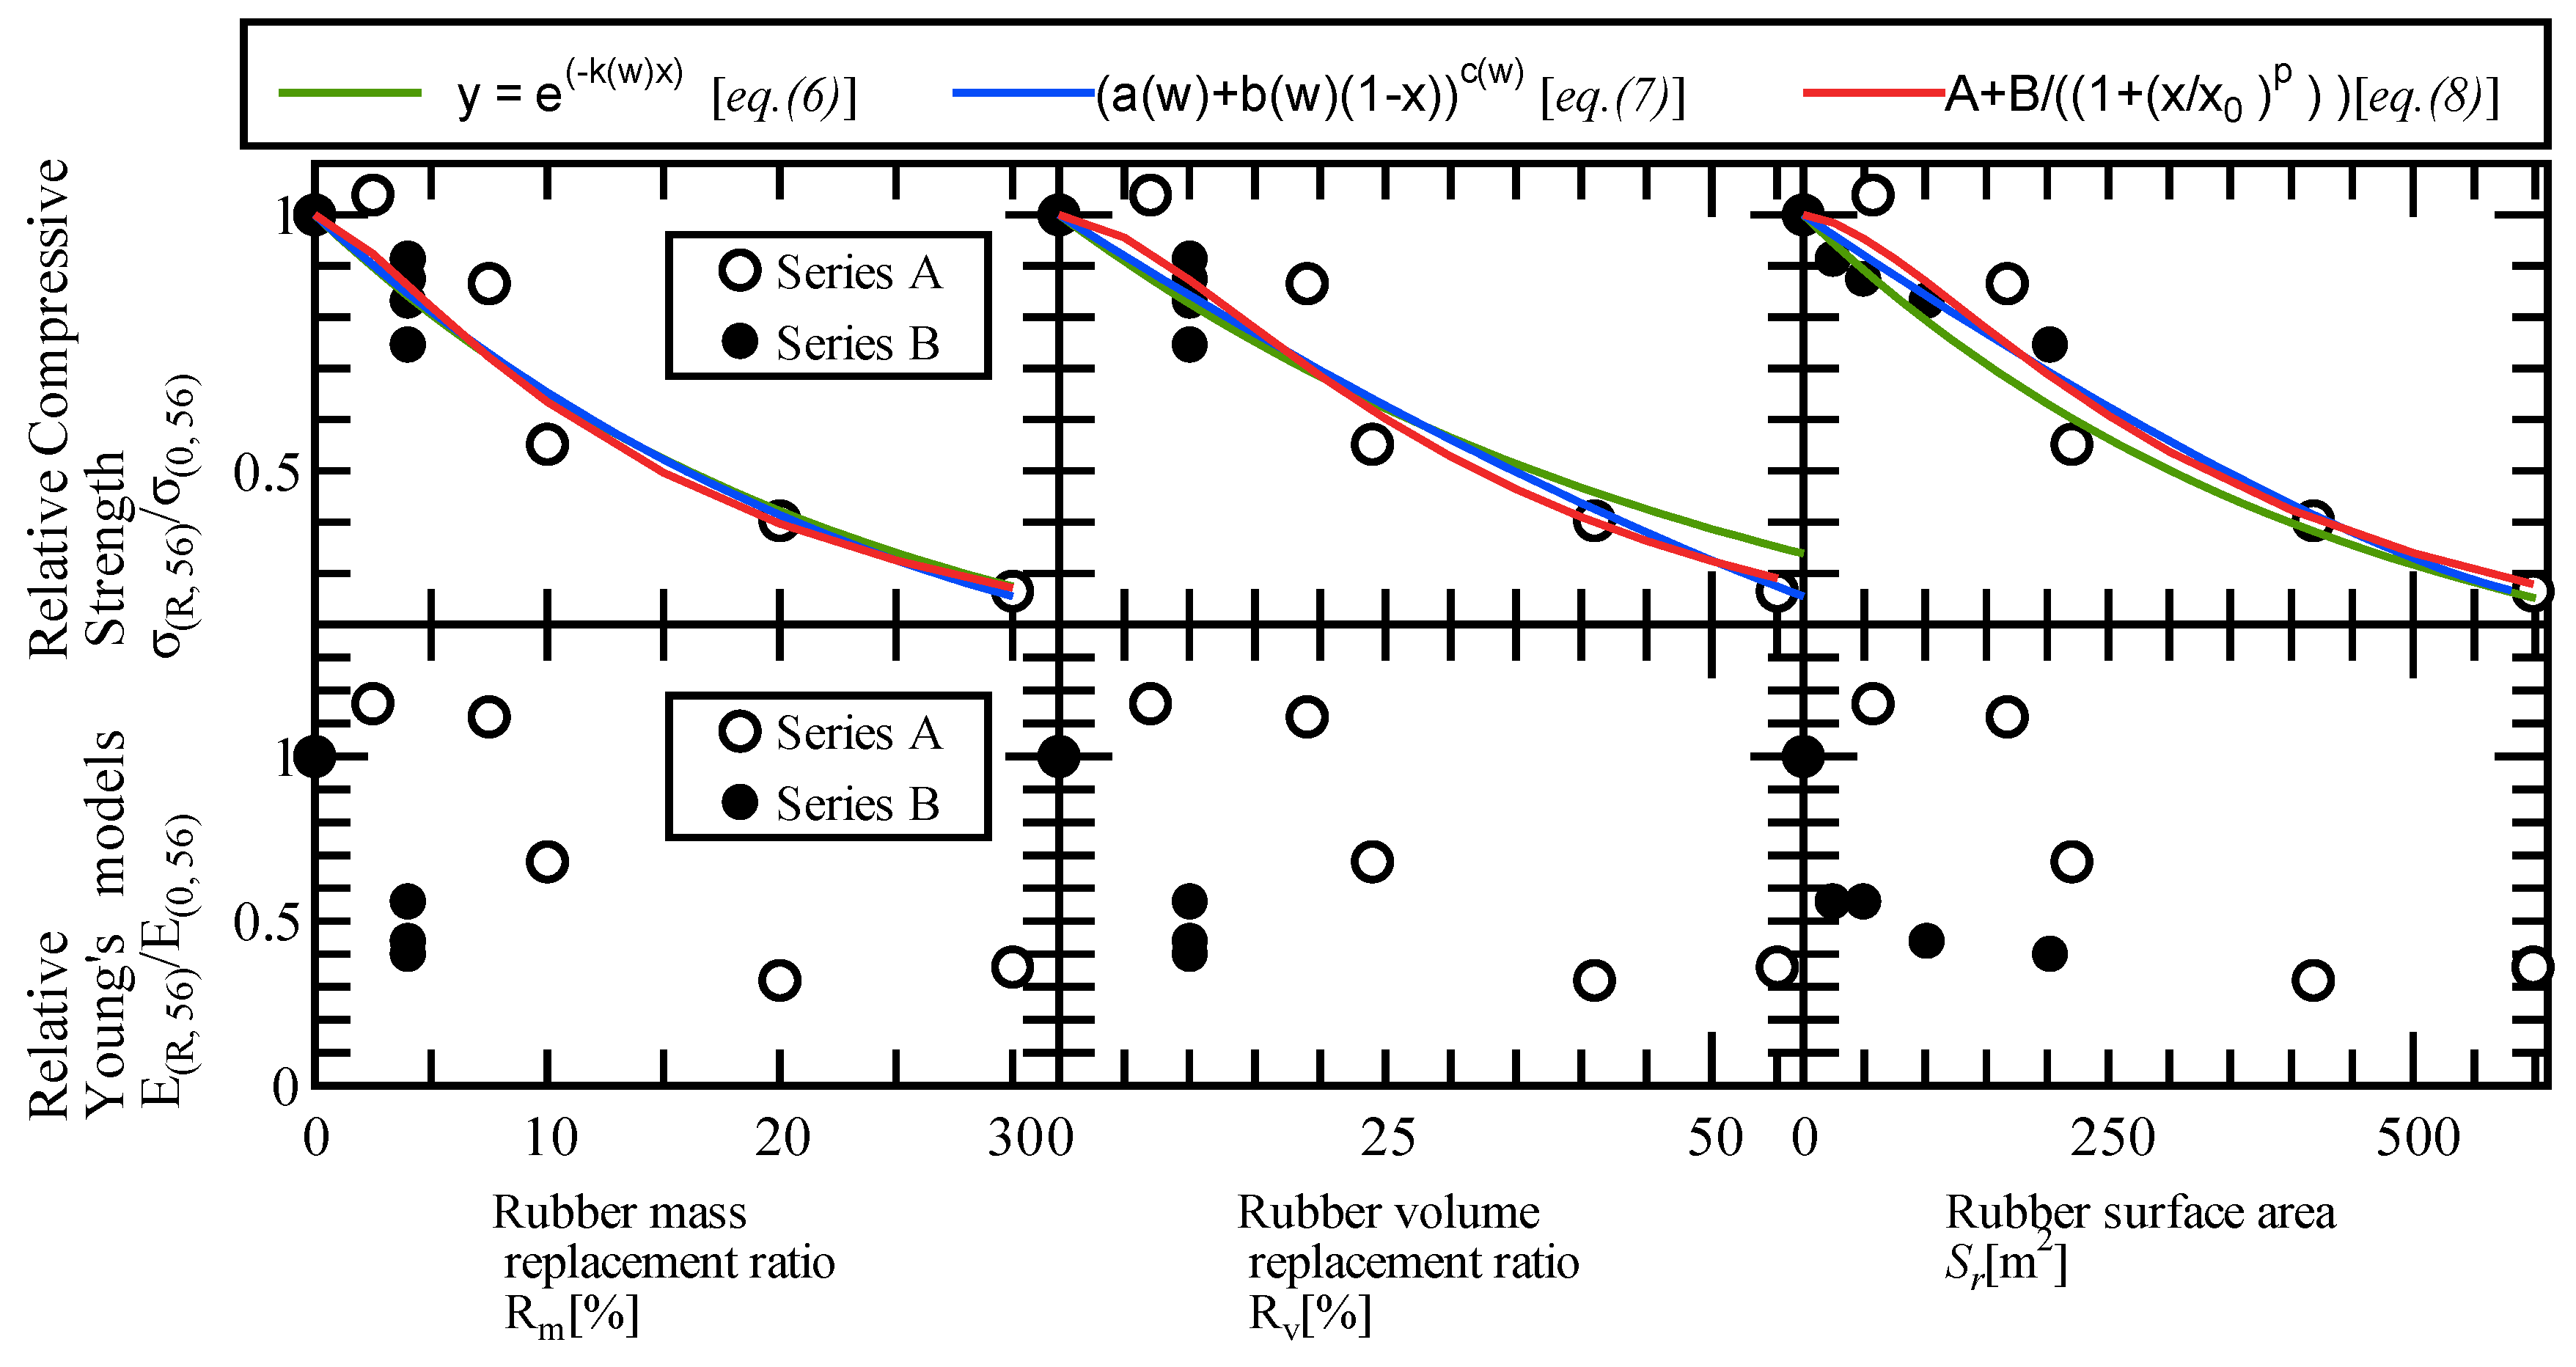
Figure 7.
Effect of W/C ratio on compressive strength.
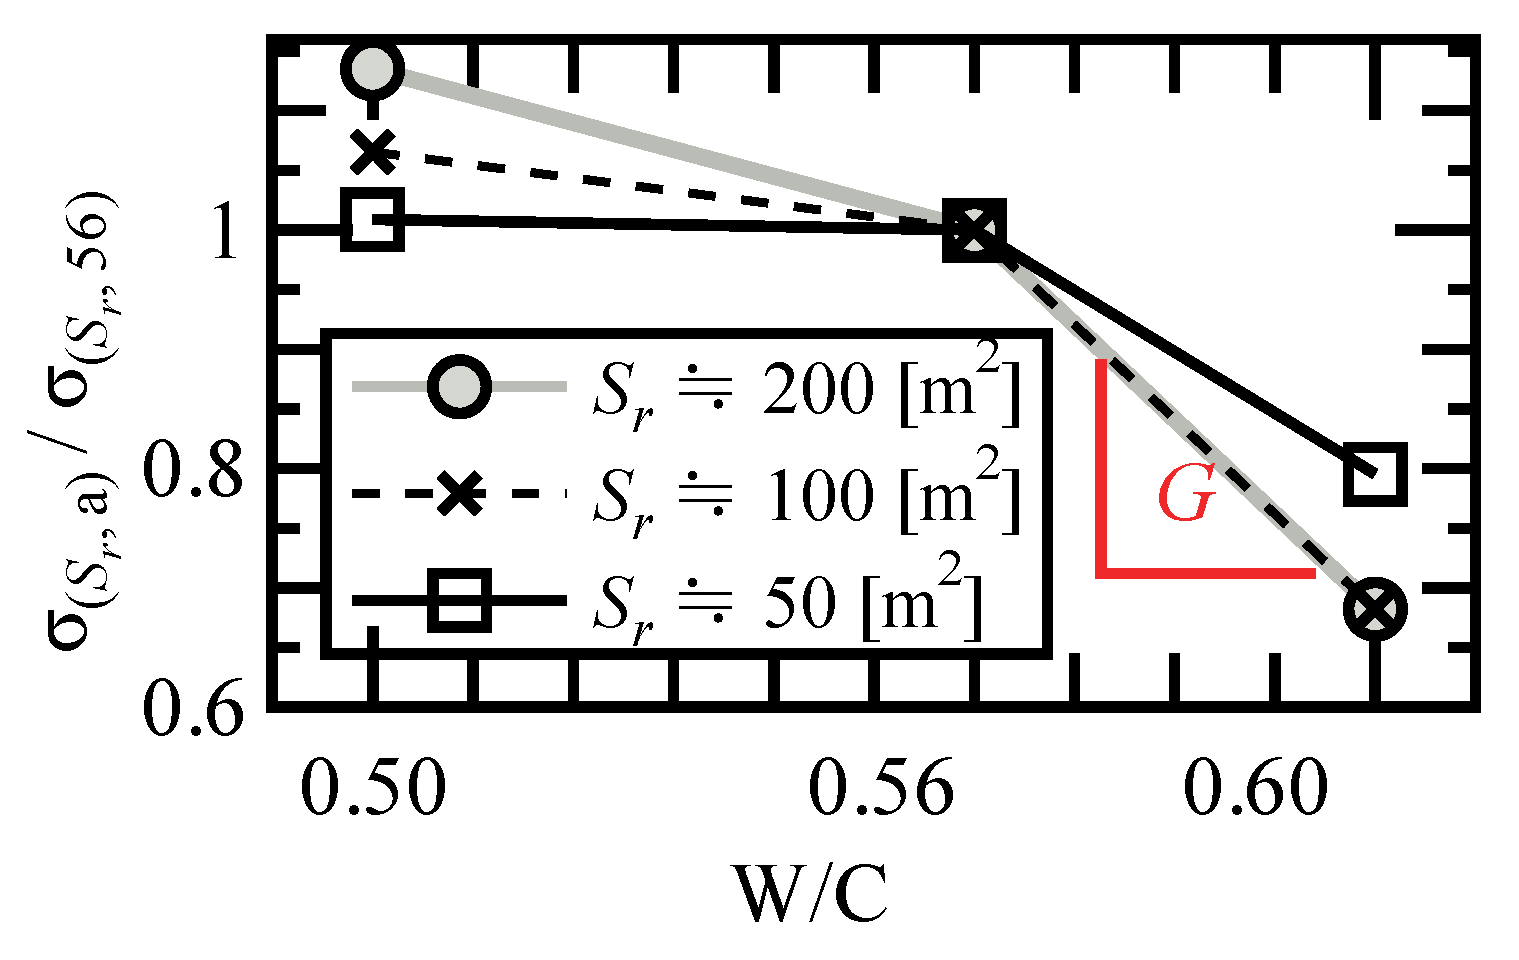
Figure 8.
Relationship between change ratio of compressive strength G and rubber surface area Sr.
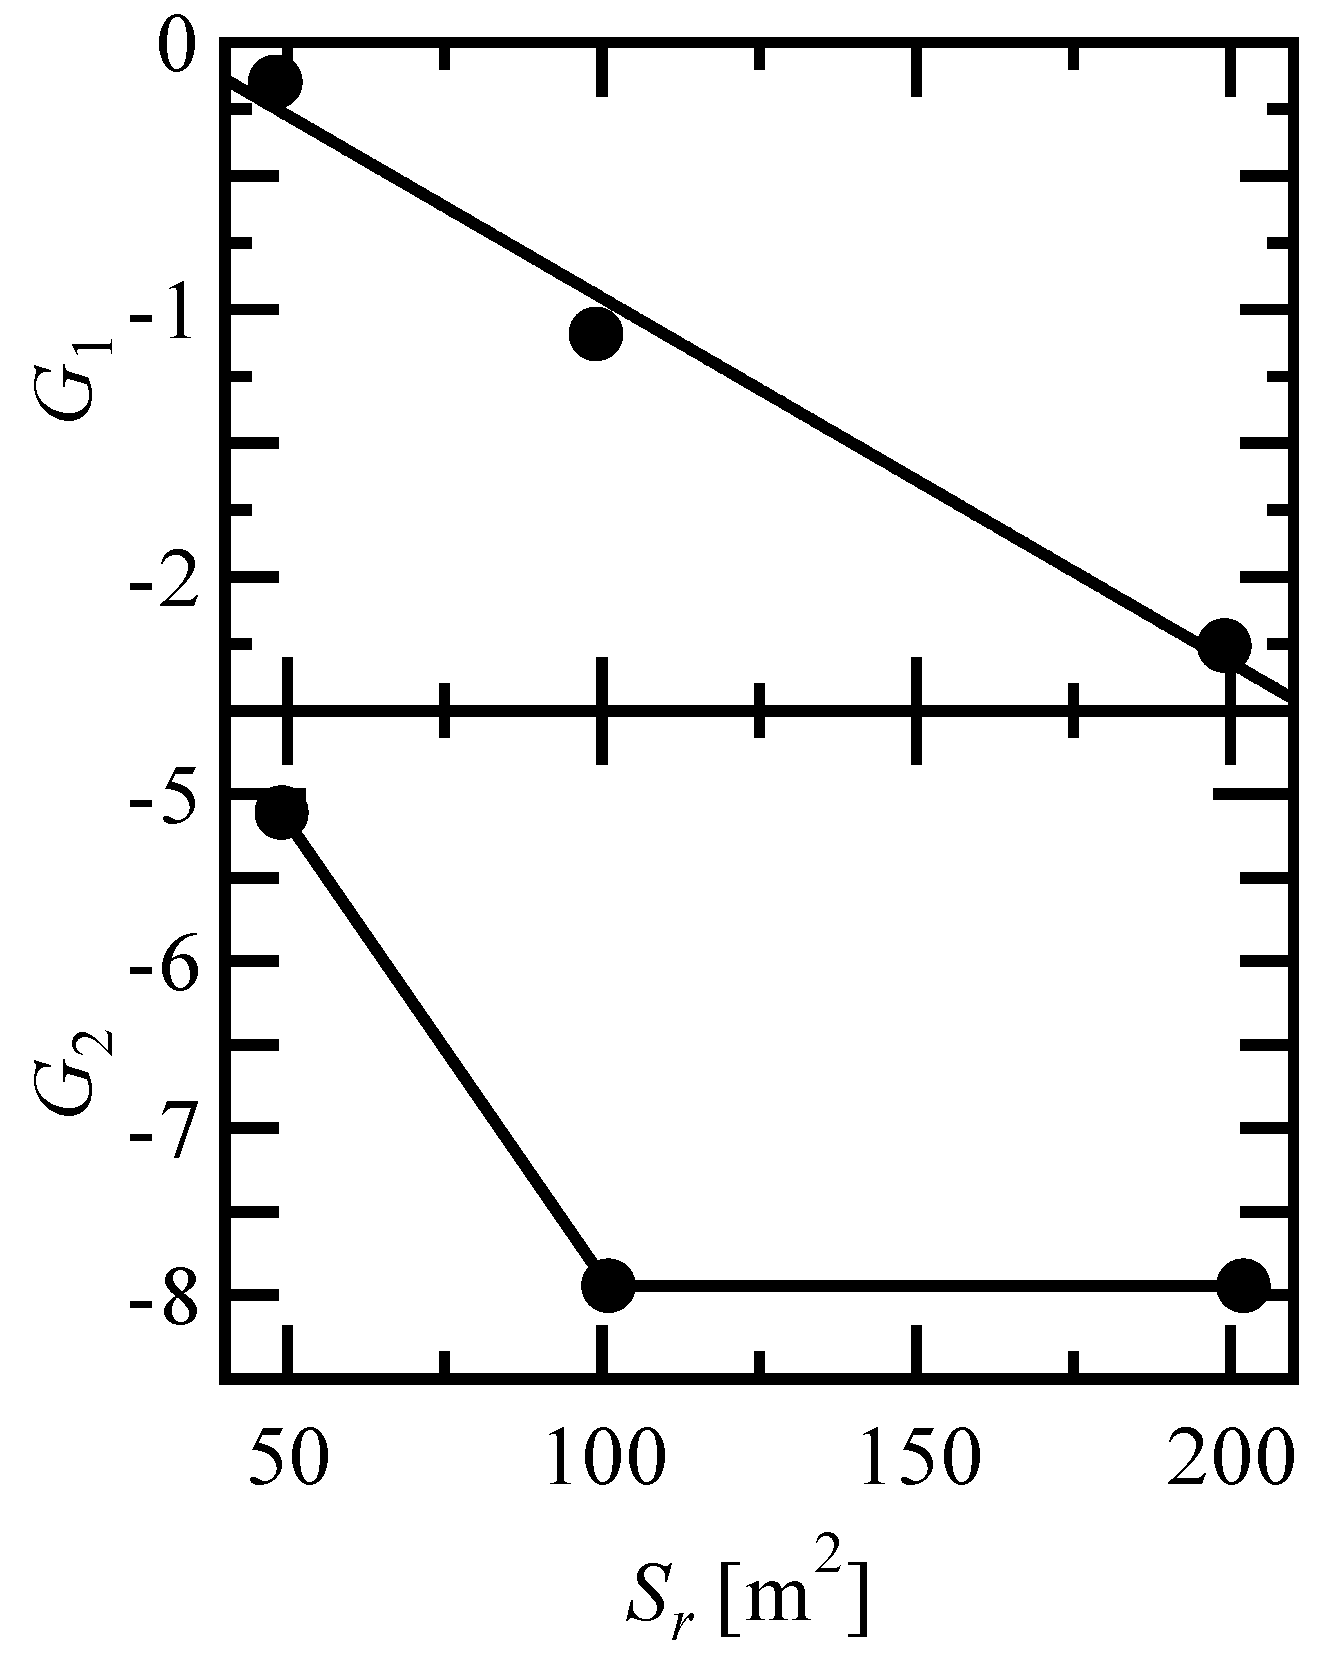
Figure 9.
Comparison of experimental results and calculated values.
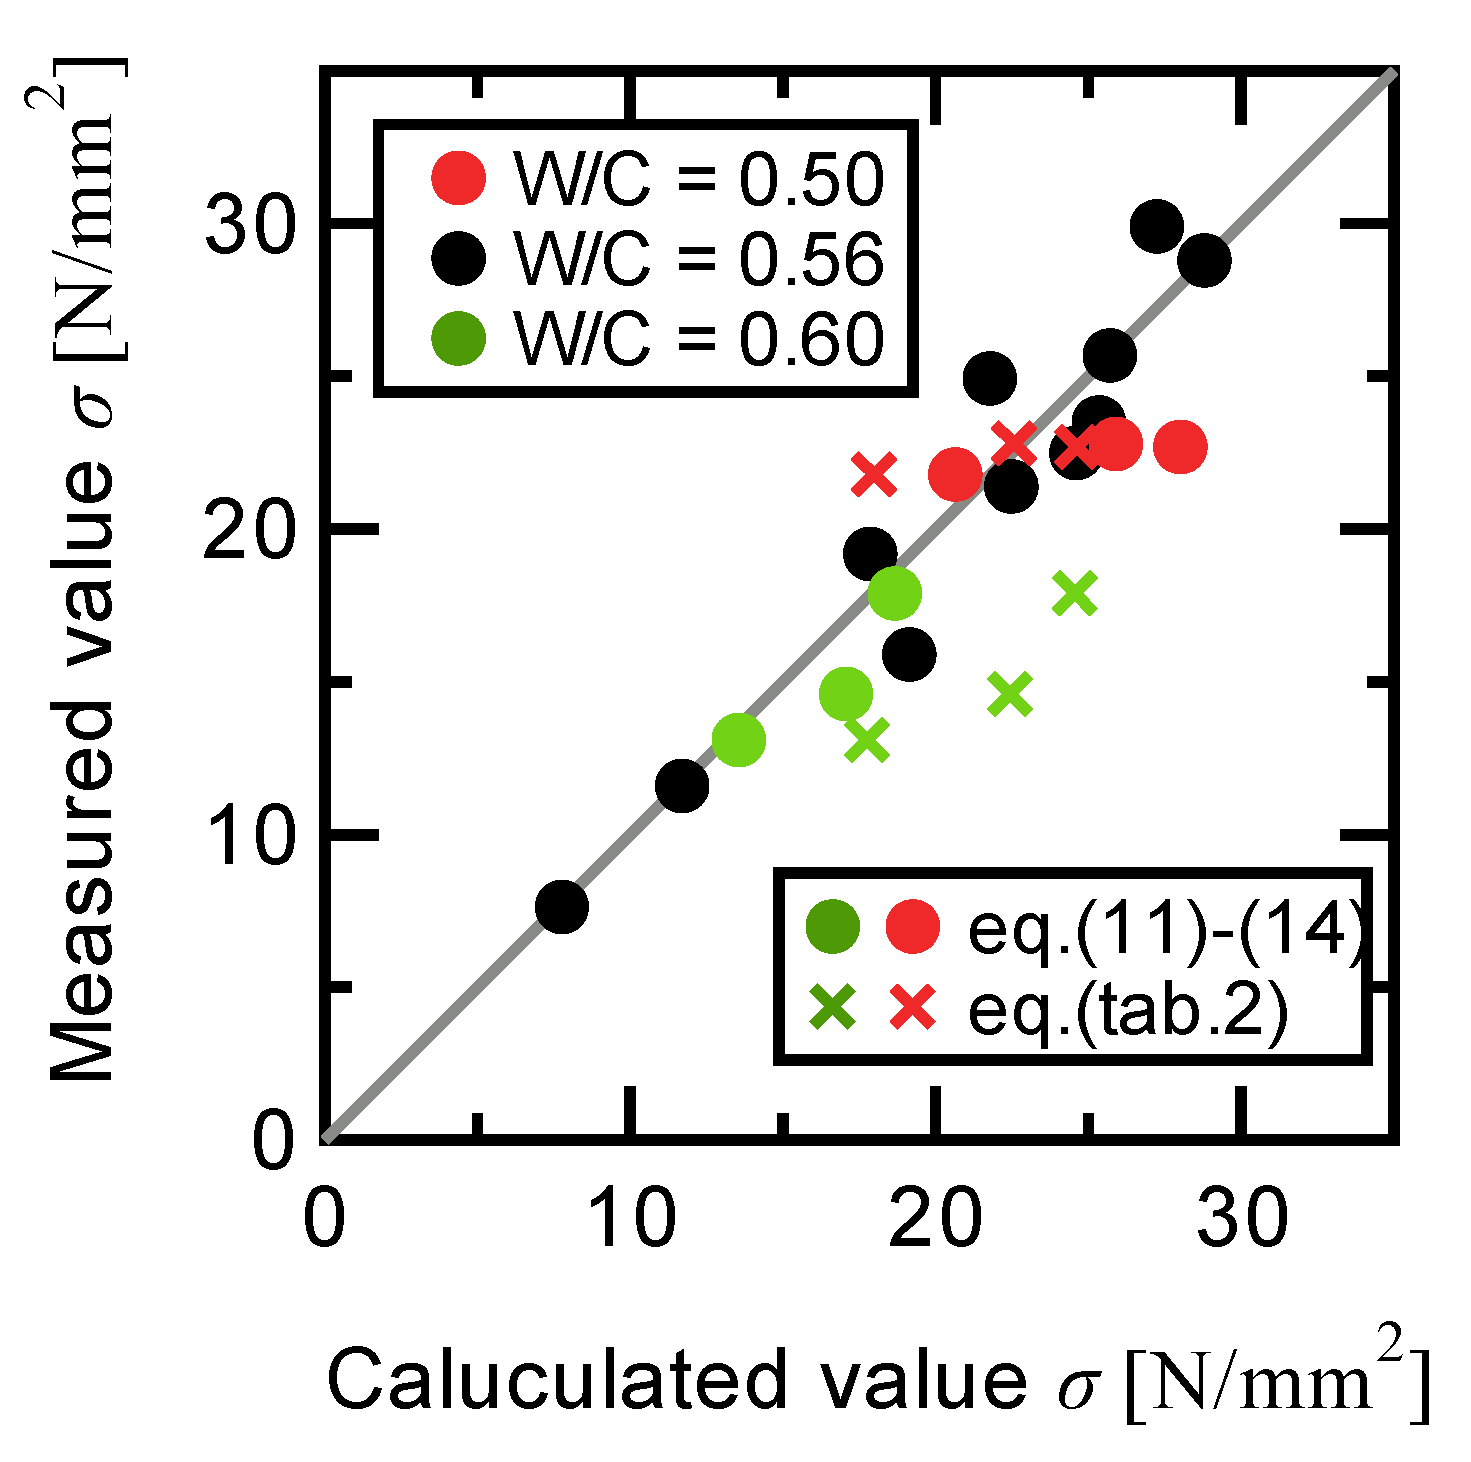

Table 1.
Mixing proportions, experimental cases, and experimental results.
| Series | Case | Mix Design | Rubber Quantities | Experimental Results | |||||||||
|---|---|---|---|---|---|---|---|---|---|---|---|---|---|
| Coarse Aggregate [kg/m3] |
Fine Aggregate [kg/m3] |
Rubber Quantity [kg/m3] |
W/C [%] |
Mass Replacement Rate [%] |
Volume Replacement Rate [%] |
Rubber Particle Diameter [mm] |
Rubber Surface Area [m2] |
Slump [cm] |
Air content [%] |
Compre-ssive Strength [N/mm2] |
Young’s Modulus [GPa] |
||
| A | GC | 983.0 | 791.0 | 0 | 56 | 0 | 0 | 0 | 0 | 24.5 | 1.2 | 28.8 | 2.5 |
| GS2.5 | 969.7 | 760.8 | 19.5 | 56 | 2.5 | 6.8 | 2.2 | 56.9 | 25.5 | 2.0 | 29.9 | 2.9 | |
| GS7.5 | 944.3 | 702.9 | 57.0 | 56 | 7.5 | 18.5 | 2.2 | 165.9 | 24.8 | 2.9 | 24.9 | 2.8 | |
| GS10 | 932.0 | 675.0 | 75.0 | 56 | 10.0 | 23.8 | 2.2 | 218.4 | 20.3 | 3.0 | 15.9 | 1.7 | |
| GS20 | 886.0 | 570.4 | 142.6 | 56 | 20.0 | 41.2 | 2.2 | 415.3 | 10.0 | 2.9 | 11.6 | 0.8 | |
| GS30 | 844.3 | 475.6 | 203.8 | 56 | 30.0 | 54.6 | 2.2 | 593.7 | 3.3 | 3.3 | 7.6 | 0.9 | |
| B | C | 983.0 | 791 | 0 | 56 | 0 | 0 | 0 | 0 | 24.8 | 1.6 | 25.7 | 2.5 |
| G0.9-56 | 983.0 | 711.8 | 28.2 | 56 | 3.8 | 10.0 | 0.9 | 202.2 | 24.5 | 3.4 | 19.2 | 1.0 | |
| G1.8-56 | 983.0 | 711.8 | 28.2 | 56 | 3.8 | 10.0 | 1.8 | 101.1 | 23.5 | 2.6 | 21.4 | 1.1 | |
| G3.7-56 | 983.0 | 711.8 | 28.2 | 56 | 3.8 | 10.0 | 3.7 | 49.2 | 24.3 | 2.2 | 22.5 | 1.4 | |
| G7.5-56 | 983.0 | 711.8 | 28.2 | 56 | 3.8 | 10.0 | 7.5 | 24.3 | 20.8 | 2.0 | 23.5 | 1.4 | |
| G0.9-50 | 964.0 | 698.0 | 27.7 | 50 | 3.8 | 10.0 | 0.9 | 198.6 | 24.8 | 2.7 | 21.8 | 1.5 | |
| G1.8-50 | 964.0 | 698.0 | 27.7 | 50 | 3.8 | 10.0 | 1.8 | 99.3 | 25.0 | 2.5 | 22.8 | 1.5 | |
| G3.7-50 | 964.0 | 698.0 | 27.7 | 50 | 3.8 | 10.0 | 3.7 | 48.3 | 24.8 | 1.9 | 22.7 | 1.8 | |
| G0.9-60 | 992.0 | 718.0 | 28.5 | 60 | 3.8 | 10.0 | 0.9 | 203.9 | 21.8 | 2.7 | 13.1 | 0.9 | |
| G1.8-60 | 992.0 | 718.0 | 28.5 | 60 | 3.8 | 10.0 | 1.8 | 102.0 | 23.3 | 2.5 | 14.6 | 1.1 | |
| G3.7-60 | 992.0 | 718.0 | 28.5 | 60 | 3.8 | 10.0 | 3.7 | 49.6 | 22.0 | 2.0 | 17.9 | 1.4 | |
Table 2.
Approximate formula for compressive-strength reduction behavior for results with W/C = 0.56.
Table 2.
Approximate formula for compressive-strength reduction behavior for results with W/C = 0.56.
| Eq.(6) |
[R2 = 089] |
[R2 = 0.85] |
[R2 = 0.89] |
| Eq.(7) | 0.05+0.95(1−/100)4.3 [R2 = 0.89] |
(1/100) 1.6 [R2 = 0.88] |
0.26+0.74 (1/598) 1.3 [R2 = 0.91] |
| Eq.(8) |
[R2 = 0.93] |
[R2 = 0.93] |
[R2 = 0.95] |
Table 3.
Ratio G of change in compressive strength to change in W/C ratio.
| G Sr [m2] (D50 [mm]) |
G1 (W/C = 0.50—0.56) | G2 (W/C = 0.56—0.60) |
|---|---|---|
| 200 (0.9) | -2.17 | -7.94 |
| 100 (1.8) | -1.09 | -7.94 |
| 50 (3.7) | -0.15 | -5.11 |
Table 4.
Ratio of experimental results to calculated values.
| Table 2 equations | Eqs. (11)–(14) | ||
|---|---|---|---|
| W/C = 0.50 and 0.60 | Average | 0.88 | 1.02 |
| Standard division | 0.21 | 0.20 | |
| All data | Average | 0.95 | 1.00 |
| Standard division | 0.15 | 0.14 |
Disclaimer/Publisher’s Note: The statements, opinions and data contained in all publications are solely those of the individual author(s) and contributor(s) and not of MDPI and/or the editor(s). MDPI and/or the editor(s) disclaim responsibility for any injury to people or property resulting from any ideas, methods, instructions or products referred to in the content. |
© 2025 by the authors. Licensee MDPI, Basel, Switzerland. This article is an open access article distributed under the terms and conditions of the Creative Commons Attribution (CC BY) license (https://creativecommons.org/licenses/by/4.0/).
Copyright: This open access article is published under a Creative Commons CC BY 4.0 license, which permit the free download, distribution, and reuse, provided that the author and preprint are cited in any reuse.


