
Submitted:
14 October 2025
Posted:
14 October 2025
You are already at the latest version
Abstract
The energy transition is an essential process for mitigating the effects of climate change, in a global context where recent conflicts are increasingly jeopardising the security of energy supply. Municipalities play an increasing role in achieving the decarbonization targets set at a national level using more efficient technologies, renewable energy production, cleaner energy solutions and the active involvement of citizens. Effective and prescriptive tools are needed to enable local administrators to identify the most appropriate actions and policies for achieving quantitative targets. Among the tools available, energy models make it possible to represent the status quo, based on the energy balance of a reference year, and the evolution of the energy system under different boundary conditions or constraints, to define the least-cost pathways for sustainable development based on present and future technology availability. The aim of this paper is to demonstrate the usefulness of a bottom-up modelling approach in the framework of the ETSAP TIMES models’ generator to represent and optimize the local scale energy system of the city of Tito in Southern Italy and to pave the way for further analysis aimed at promoting the implementation of a renewable energy community and energy efficiency measures, with the view to achieve a significant reduction in greenhouse gas emissions in the residential and tertiary sectors. The optimization of a Business-as-Usual reference scenario over a thirty-year time horizon (2020-2050) shows an initial situation based on the prevalent use of natural gas. The sensitivity analysis carried out by gradually increasing the cost of natural gas and providing subsidies for the purchase of heat pumps shows significant benefits in terms of reduction of fossil fuel consumption and CO2 emissions.
Keywords:
energy transition
; climate change
; TIMES model
; renewable energy
; decarbonization
; sensitivity analysis
1. Introduction
The clean energy transition supports a global shift from fossil fuel-based energy systems to renewable and sustainable sources such as solar, wind and biomass. This transformation is driven by the urgent need to mitigate climate change, reduce greenhouse gas emissions, enhance energy security, and build a more resilient, sustainable energy infra-structure that supports long-term economic growth [1].
In fact, the switch from energy systems based predominantly on the use of fossil fuels to new, more efficient and environmentally sustainable models based on the use of renewable energy sources is mandatory to mitigate climate change and increase energy security.
Promoting a clean energy transition represents a priority for the European Union (EU) strongly engaged in the fight against climate change with the ambitious goal set out in the European Green Deal to become climate-neutral by 2050, setting an intermediate – 55% target for CO2 emissions at 2030 [2]. Considering the enormous efforts required from all European countries to move to a climate-neutral economy by 2050, a complex set of laws has been defined to accelerate the energy transition. In particular, the Clean Energy for all Europeans Package [3] sets out the European energy policy framework to facilitate a clean energy transition towards a more sustainable, decentralized and consumer-oriented system. The Clean Energy Package (CEP), based on four Directives [4,5,6,7] and four Regulations [8,9,10,11], focus on the energy performance of buildings, renewable energy, energy efficiency, governance and electricity market design, updating the EU targets for 2030 as follows:
- a 40% reduction in Greenhouse gas (GHG) emissions compared to 1990 levels;
- 32% for renewable energy sources in the EU energy mix;
- an energy efficiency target of 32.5%, compared to a baseline scenario set in 2007.
Another important initiative is the REPowerEU plan launched in response to Russia's invasion of Ukraine, that aims to reduce Europe's dependence on Russian gas (-18% of gas consumption), by promoting energy efficiency, diversify energy supplies and produce clean energy by accelerating the adoption of renewable sources [12,13,14]. By 1 March 2026, EU Member States must submit national plans containing strategies for diversifying energy supplies, with detailed measures and milestones for phasing out direct and indirect imports of Russian gas and oil. These measures will accelerate the EU's energy transition and diversify energy supplies to eliminate risks to security of supply and market stability [15]. The RePower plan also supports citizen-driven energy actions to contribute to the clean energy transition, advancing energy efficiency within local communities [16].
As far as Italy is concerned, European regulatory frameworks have been transposed into national legislation, in line with the country's ambitious decarbonisation targets and providing financial incentives for community-based energy projects.
The Integrated National Energy and Climate Plan 2030 (PNIEC) [17] defines Italy's policies and measures for achieving its energy and climate targets for 2030 and is the main instrument for implementing a new energy policy that guarantees the full environmental, social and economic sustainability of the Italian national territory and supports the energy transition. It addresses decarbonisation, energy efficiency and energy security in an integrated way through the development of the internal energy market, research, innovation and competitiveness [17]. The updated version of the 2023 PNIEC sets a 43.7% reduction compared to 2005 in greenhouse gas emissions by 2030 and electricity production from renewable sources exceeding 65% [18].
Although, unlike other European countries, Italy does not yet have a "framework law on climate", numerous provisions deriving from decrees and sectoral laws also contribute to implementing the EU guidelines. For example, budget laws and several ministerial decrees have introduced incentives to promote renewable energy sources, including the ”Conto Termico” [19], tax benefits aimed at promoting the replacement of obsolete air conditioning systems [20], the 110% “Super bonus”[21] and other financial incentives to increase energy efficiency and reduce the energy demand of buildings [22]. Furthermore, Decree No. 414 of 7 December 2023 of the Minister of the Environment and Energy Security (REC Decree), in force since 24 January 2024, introduces a new participatory model of energy management represented by Renewable Energy Communities (REC) [23]. In particular, the REC Decree defined the new methods of granting incentives, aimed at promoting the local share of energy by installing plants powered by renewable sources included in configurations of energy communities, groups of self-consumers and remote self-consumers.
However, as Lv [24] also points out, the energy transition is not a straightforward process, as there are several factors that could hinder and slow down its progress. In fact, the high cost of investing in infrastructure for renewable energy sources, the political influence of the fossil fuel industry in some countries, and local communities' concerns about noise pollution and the impact on the landscape are all factors that need to be considered in the governance of this process. In this context, the local dimension is becoming increasingly important due to its significant contribution to greenhouse gas emissions (cities are responsible for almost 70%), high energy consumption and the even greater impact of climate change on the population and infrastructure [25]. Municipalities are therefore taking on a central role in the implementation of energy and climate policies, facing challenges such as high energy costs, public funding and investment payback times, the reliability of energy services provided, public acceptance, and technical and managerial skills.
Taking advantage of the composite legislative framework aimed at promoting a clean energy transition at local level within the achievement of the 2030 targets, several projects have been presented to implement energy production from renewable sources. Ronchetti et al. analysed the project proposals in the authorization phase for electricity production from renewable sources to assess the achievement of the intermediate decarbonisation targets set for 2030. They highlighted an imbalance in the location of projects in southern Italy, which could lead to future problems if not properly aligned with the infrastructure development planned by the national government [26].
From a methodological point of view, taking into account that energy and climate issues are intertwined and should be integrated into a common planning framework that support energy transition, as also underlined by the sustainable energy and climate action plans (SECAPs) [27], it is necessary to adopt scalable and comparable analytical approaches based on widely used models capable of representing technological progress and performing energy-environmental scenario analyses to devise the energy technology roadmaps. Among the most used models that support policy assessment and energy planning at local level [28], The Integrated MARKAL-EFOM System (TIMES) model generator, developed as part of the International Energy Agency's Energy Technology Systems Analysis Programme (ETSAP-IEA), ensures compliance with all requirements as it allows performing energy and environmental analyses and devising robust policies [29]. A study by Gupta and Ahlgren [30] demonstrated that the TIMES platform is the most widely used for energy systems optimization over a long-time horizon to support energy planning at local scale. The TIMES-NE model was set up to analyze the energy system of the city of Gothenburg considering the end-use demands of the residential and transport sectors. In this study the City Energy Plan scenario was defined as an exploratory strategic scenario by incorporating the policy measures outlined in the city energy plan with the aim of describing the possible consequences of strategic decisions [31]. The TIMES-Oslo model is another example of the TIMES application at the local scale to assess how the implementation of energy and climate policies can contribute to low-carbon cities. [32] The TIMES_EVORA model was implemented to analyze the energy system of the Portuguese city in 2030 by introducing constraints for the reduction of CO2 emissions, and considering the household incomes to verify for their investment capacity for the acquisition of more efficient technologies, from household appliances to private vehicles [33]. Di Leo et al implemented the TIMES-Basilicata model to analyse the energy system of the Basilicata region in the Southern Italy. They focused their study on the construction of two low-carbon scenarios to identify development trajectories for the energy system in the Basilicata region: imposing an 85% reduction in CO2 emissions by 2050 and introducing several combinations of energy efficiency measures. The modelling platform has proven to be effective and useful in supporting energy and climate strategic planning on a medium-long term on a regional/local scale [34]. Another local application of the ETSAP-TIMES model generator involved the implementation of the TIMES Land-WEF model to investigate the interactions and interrelations between water, energy, food and land in the agricultural system of the Basilicata region. In this application, the scenario analysis carried out to support the achievement of some of the objectives set out in the European Farm to Fork Strategy, such as the reduction of pesticides or fertilisers from 2030 onwards, showed the evolution of the system under consideration in terms of land use, energy consumption and water use [35]. Di Leo et al. used the ETSAP-TIMES model generator to analyse an automotive manufacturing industry and identify the most efficient and sustainable solutions for the production system. In this study, scenario analysis was applied to evaluate the system's responses to the introduction of energy and material recovery measures and the introduction of alternative energy production technologies [36].
In this study the ETSAP-TIMES model’s generator is applied to model the energy system of the Municipality of Tito, in Southern Italy, in order to analyze its evolution over a 30-year time horizon (2020-2050) under a Business as Usual (BaU) scenario. The structure of the paper is organized as follows: Section 2 outlines the methodology ad its application to local energy systems modeling; Section 3 provides an in-depth description of the Municipality of Tito energy system with reference to the statistical data for characterising the demand profiles, the technologies in-use and available in the modeling time horizon and the projections of future energy requirements; Section 4 and Section 5 present the results of the optimisation of a BaU scenario and the possible implications in terms of energy policies.
2. Methods
2.1. The Integrated MARKAL-EFOM System (TIMES)
The Integrated MARKAL-EFOM System (TIMES) models’ generator was developed within the Energy Technology Systems Analysis Program of the International Energy Agency (ETSAP-IEA) to design least-cost pathways for sustainable energy systems and is widely utilized in global, regional, national and local applications to support policy assessment and energy-environmental planning [37].
This modeling platform enables a comprehensive depiction of energy systems, at different spatial scales and with different complexity, from primary energy sources to transformation process, technologies and end-use energy demands, modeling the evolution of key variables (energy and technology availability, climate and air quality targets) and allowing to compare contrasting medium to long term scenarios (typically 30 to 50 years), to determine the energy technology roadmaps in compliance with the exogenous constraints [38].
A powerful feature of the TIMES modelling approach is its bottom-up, technology-oriented optimization framework in which the demand for goods and services of end-use sectors is the training variable. This allows users to incorporate new technologies and phase out obsolete and in-use ones according to efficiency, economic profitability and the policy context ensuring the competitiveness of the energy system under different contrasting scenarios.
The structure of each model shows a complex network of interrelated processes, from extraction, import and transformation of primary sources into secondary sources to final demand. The network of the energy system integrates different types of fuels (such as natural gas, liquefied petroleum gas, solar thermal, diesel, biomass and electricity, that constitute the inputs to the technologies and enable end-uses demand to be satisfied.
Therefore, the prerequisite for modeling any energy system is the definition of a flow diagram, the Reference Energy System (RES), which represents the complex interactions between the demand sectors and the supply within the technology network. Based on the RES, the data for the characterization of the energy system and its constraints are gathered and elaborated to define the model data input. In this phase, the base year (the statistical reference), the time horizon and the time-horizon intervals are defined.
A peculiar feature of data collection is technology characterization, which includes technical, economic and environmental parameters, namely input and output commodities, emission factors, efficiency, market availability, operating lifetime, investment costs, operating and maintenance costs. This step is essential to allow comparison of competing technologies and to assess the feasibility of integrating new technologies, such as solar photovoltaic (PV) systems into the existing energy system over the explored time horizon [39]. The characterization of technologies should be complemented by an accurate description of the system in terms of resources availability (fuels and materials), macroeconomic parameters, infrastructure, physical and policy constraints.
The last step of model building concerns the optimization of the draft model and verification of its compliance with statistical data (calibration).
Then the scenario hypotheses are defined and quantitatively determined to model the status quo and the alternative scenarios, which are reported in the so-called “scenario files”. The comparison of the optimized contrasting scenarios allows modelers and policy makers to assess the effectiveness of policies and to identify through the analysis of feasible solutions the energy-technology roadmaps for the implementation of the policy measures (Figure 1)
In general, the whole process is assisted by a model interface that not only facilitates the entire energy modeling process. but also enables smart management of input and output data and meaningful comparison of results.
In particular, the VEDA2.0 (Versatile Data Analyst) is currently the most used interface to manage input data and explore the results produced by the TIMES models, increasing the efficiency and transparency [40].
2.2. The Case Study: Municipality of Tito
2.2.1. The Municipality of Tito: Main Features
Tito is an Italian municipality with approximately 7,162 inhabitants (2020 ISTAT census) located in the province of Potenza, in Basilicata, southern Italy. The territory is essentially divided into two parts: the town of Tito, where most of the inhabitants live, home to the Town Hall and other services, and the industrial and commercial area of Tito Scalo, where numerous companies from Potenza have established their headquarters.
The climate is typical of Mediterranean areas, characterized by hot summers and mild wet winters and favorable to the deployment of solar power due to the high levels of solar irradiance [41].
In line with national trends and like most municipalities in Basilicata, energy supply is still heavily based on fossil fuels, taking advantage of a discount on gas bills granted to Lucanian citizens as environmental compensation for hydrocarbon extraction in the region [42]. However, growing concern about climate change and air quality is promoting the transition to cleaner energy sources at both municipal and regional level to reduce environmental impact and improve energy security, in line with European Union policies. Currently, Tito ranks first in Basilicata in terms of installed photovoltaic capacity (18,775 kW), second in terms of installed photovoltaic capacity per km² (263 kW/km²) and third in terms of installed photovoltaic capacity per inhabitant (2.64 kW/inhabitant). The electricity produced locally by photovoltaics is distributed through infrastructure connected to the national grid.
In recent decades, the municipality of Tito has distinguished itself for its focus on environmental issues. In 2011, the municipality of Tito joined the European Commission's Covenant of Mayors initiative and in 2012 issued its Sustainable Energy Action Plan (SEAP) [43]. It is currently one of six pilot municipalities in the LIFE CET Local Go Green project, which aims to accelerate the transition to clean energy at the municipal level [44]. As part of this project, the municipal council recently approved a climate emergency declaration (CED), making concrete commitments to tackle climate change and promote renewable energy sources. Another important initiative is the promotion of a REC in accordance with national legislation, which will involve citizens in a new system of production and self-consumption of energy produced from renewable sources and is aimed at providing a concrete response to the challenges of the ecological transition [45].
Based on these premises, the TIMES-Tito model has been implemented to analyze the municipal energy system in order to assess the capacity to reach the renewable energy and CO2 emissions targets set by the EU.
2.2.2. The TIMES-Tito Energy Model
Tito’s energy system analysis focuses on Residential and Tertiary, two sectors that can greatly benefit from the photovoltaic electricity generation to help meet energy supply.
Therefore, the end-use demands considered are related to the services that can be satisfied by electricity as an alternative to other fuels. Regarding the tertiary sector, seven sub-sectors have been defined based on the economic activities defined by the ATECO 2007 classification [46]. Starting with the ATECO 2007 classification, some sub-sectors required reworking, which in some cases involved a subdivision of activities and in Other Uses, an aggregation of activities. For example, the item “Accommodation and Food service activities” has been divided into two sub-sectors: “Food” for Food service activities and “Accommodation”. Instead for Private Offices it was necessary to aggregate the economic activities ‘financial and insurance activities’, ‘real estate activities’, ‘administrative and support services, information and communication’, and so on.
In Table 1 the end-use demands by sector are reported, along with the corresponding TIMES model codes and units of measure.
2.2.3. The Reference Energy System
As explained above, the definition of a customized RES is essential to provide a disaggregated graphical representation of the supply and demand sectors and the technology network, which synthetically describes the current configuration of the energy system under consideration and helps understanding the dynamics and interactions between energy production, distribution and consumption technologies [47].
In the following section, the RES developed for the Tito municipality is illustrated in detail regarding supply, electricity production, Residential and Tertiary.
- Supply
The supply sector of Tito municipality is based on a mix of conventional and renewable energy sources including natural gas (SUPGAS), liquefied petroleum gas, (SUPLPG) diesel, (SUPDIE) biomass, (SUPBIO) and solar thermal (SUPTHES). Electricity (SUPELC) is mainly imported from the national grid (IMPELC20). The supply sector reference energy system shows how imported and locally produced energy sources are converted into input energy commodities of the tertiary and residential sectors by fictitious (dummy) technologies (Figure 2).
A more detailed reference system is designed for electricity production by photovoltaic systems as extensively explained in the following.
- Electricity
As concerns electricity, photovoltaic endogenous production integrates the import from the national transmission grid, helping to meet energy demand in residential and tertiary sectors. The electricity produced by photovoltaic systems is partly self-consumed and partly sold to the national electricity grid.
The reference system for electricity (RES-E) highlights the transformation of the endogenous source (MINELCSOL) into electricity from solar sources (ELCSOLRI) that powers the photovoltaic systems serving homes (ERESSOLRI1) and tertiary buildings (ETERSOLRI1) as well as the excess production fed into the national electricity grid (ELCT and ELCR).
The scheme shows the electricity produced by photovoltaic systems in the residential (ELCRESD) and tertiary (ELCTERD) sectors (Figure 3). It distinguishes between the two energy vectors used for self-consumption (RESELC and TERELC) and the amount transferred to the national grid (ELCR and ELCT).
- Residential
Six end-use demand categories were taken into consideration when modelling the residential sector: Space Heating, Space Cooling, Water Heating, Cooking, Lighting, and Other Electric Uses, including in the reference network the in-use technologies by category. Multiple and single outputs were also considered for Space Cooling, Water Heating, and Space Heating technologies (such as heat pumps and dual boilers) and single end-use technologies (such as single boilers, heaters, etc.) as shown in Figure 4.
The energy sources natural gas (RESGNA), liquefied petroleum gas (RESLPG), biomass (RESBIO) solar thermal (RESTHES) and electricity (RESELC) are inputs of the in-use technologies that produce, in turn, the useful energy for Space Heating (RESSH), water heating (RESWH), and space cooling (RESSC). As the demands for services are expressed into different units of measures (respectively Mm2 for Space Heating (DRSH) and Space Cooling (DRSC), G-Liters for Water Heating (DRWH)) dummy technologies (RDRSHD101, RDRWHD101, RDRSCD101) were modeled to convert the useful energy into end-use demands.
Cooking, Lighting and Other Electric Uses, whose technologies have a direct link with the final use demand, have a very simple schematization (Figure 5). Lighting includes incandescent, halogen, and compact fluorescent lighting lamps.
- Tertiary Sector
The seven subsectors of the tertiary sector have a similar representation: input fuels feed end-use technologies whose outputs provide useful energy in PJ to fulfil Space Heating and Water Heating demand. Dummy technologies convert the useful energy in PJ into the end-use demand units. Space Cooling and Other Electric Uses are modelled through technologies that have output directly the end use demands. In the reference model, space cooling demand of Schools was not considered, due to the current infrastructure and to the school calendar (from September to June). This assumption could be reconsidered in the light of the increasing rise of temperature due to climate change and possible modification of the school calendar.
Figure 6 shows as an example, the RES for the Food subsector, in which the processes convert energy sources into useful energy for Space Heating (TERCSH) and Water Heating (TERCWH) and the dummy technologies (TDCSHD101 and TDCWHD101) convert the useful energy in PJ into end-use demands for Space Heating (DTCSH) and Water Heating (DTCWH), both expressed in MEmployees.
3. The TIMES-TITO Energy Model Data Input
3.1. The Model Spreadsheets
The structure of the input data of the TIMES-TITO energy model consists of several interrelated spreadsheets, each serving a specific purpose:
-
Base Year Templates: These are the primary data files consisting of four spreadsheets that establish the basic structure of the TIMES-TITO energy system and include the base year data (2020) and the data for modeling energy flows along the time horizon.
- Energy Supply: The energy mixes over the time-horizon (primary energy mining and import, with reference to both renewables and fossil fuels)
- Electricity Production: Data on sources and technologies for electricity generation and additional technical parameters
- Residential: Energy consumption patterns of residential sector end-uses and technology network
- Tertiary: Energy consumption patterns of tertiary sector end-uses and technology network
- Database of New Technologies: This database catalogs alternative and emerging energy technologies in the future. It includes data on their market availability, technical and economic performance and potential environmental impacts, allowing the model to select the most suitable ones to meet energy needs and optimize the energy system in the expected time horizon, based on scenario assumptions. [48]. The new technological options included in the TIMES Tito model are related to the alternative for the key sectors of electricity generation, Residential and Tertiary.
- Scenario files: These files contain assumptions about the future development of the energy system: demand projections, changes in socioeconomic factors, technology penetration rates, and policy and environmental targets. A range of scenarios can be modelled, from "business-as-usual" to pathways to accelerate decarbonisation and energy transition. Emission factors for GHG and local air pollutants have been included in Tito's energy system scenario files to explore mitigation strategies and evaluate the impacts on air quality.
A visual representation of the model structure is shown in Figure 7.
3.2. Input: Data Collection and Elaboration
The TIMES-Tito model analyses the energy system of the Municipality of Tito over a thirty-year time horizon, from 2020 to 2050, focusing on the residential and tertiary sectors. The analysis is based on the year 2020 (the statistical reference year) and the key years 2021, 2025, 2030, 2035, 2040, 2045 and 2050 as milestones along the time horizon. The energy mix includes renewable and conventional energy sources, dominated by biomass, natural gas and electricity, partly produced by photovoltaic plants.
An important aspect in modeling a local scale energy system concerns the data collection process and the construction of the energy balance for the reference year.
As highlighted by Unluturk and Riekkola [49], the collection and processing phase of TIMES energy models at municipal scale is one of the major challenges for modelers and is key either to guarantee realistic and reliable model outputs and to devise robust solutions from optimized scenarios. Furthermore, in general, there are no official databases available at municipal scale as reference for building the energy balance. Therefore, it is necessary to process heterogeneous data from multiple reliable sources by formulating a series of checked assumptions and using appropriate proxy variables to estimate the energy consumption of the various sub-sectors.
In this study, SEAP 2012 data [43] were used to estimate some parameters in the residential and tertiary sectors and to fine-tune the data. The calculation procedure is explained in detail below.
3.2.1. Energy Consumption of the Residential Sector
The procedure applied to estimate energy consumption for the residential sector is shown in Figure 8.
Electricity consumption of the entire province of Potenza [49] was downscaled to municipal level by using as proxy variables the number of inhabitants in the province and the number of inhabitants in the Municipality of Tito.
In addition, average annual household expenditure in the Basilicata region for natural gas, LPG and biomass was used to estimate consumption for the Municipality of Tito [41]. The estimated reference costs for energy consumption in the municipality of Tito per family are respectively €533 for natural gas, €60 for LPG, €163 for firewood and €97 for pellets [50], considering an average cost of €139 per tonne for wood and €245 per tonne for pellets. Considering an average number of 2’847 households in 2020 for the municipality of Tito [51] and the end-use categories included in the TIMES Basilicata model [47] the breakdown of energy consumption by fuel and end-uses (e.g., Space heating, Water heating, Space cooling, Lighting, Cooking, and Other electric uses) was estimated (Table 2).
As highlighted, biomass is the most used energy source for Space Heating (62%), followed by natural gas (36%). Natural gas is also the prevailing energy source for cooking (83%) and water heating (80%) while space cooling is fulfilled only by electricity, which on the whole accounts for 10%. LPG and solar thermal contribution overall are respectively 3% and 1%.
Different hypotheses were formulated to estimate end use demand in the base-year of the six subsectors in residential sector. The Space Heating demand, expressed in Mm2, was estimated using data provided by the Italian Revenue Agency [52], considering the total number of premises at municipal level for each residential cadastral category multiplied by the average floor area per room (about 20 square meters) and considering the percentage of uninhabited houses during the year.
The Water Heating demand, expressed in liters, was estimated considering an average need of 40 liters per day per inhabitant [53] and multiplying this daily need by the number of inhabitants of the municipality of Tito and the number of days per year.
The cooling demand, as for the heating demand, was related to the surface area of the dwellings, assuming a 50% penetration of cooling technologies in accordance with national data [54].
The cooking demand was estimated by directly associating it with the number of inhabitants (7,162) in the Tito municipality.
The lighting demand was estimated by assuming an average lighting demand of 150 lumens per square meter [55] and considering the total number of square meters of residential dwellings in the municipality of Tito.
The demand for other electrical uses was estimated considering the average annual demand per household (290 MJ/households) [56] and the number of households in the municipality of Tito (2,847).
Table 3 shows the estimated demand for end-use category for the year 2020.
3.2.2. Energy Consumption of the Tertiary Sector
Energy consumption of the tertiary sector for the Tito municipality was estimated considering the number of employees as proxy variable [57].
The energy consumption of the tertiary sector was estimated based on the total national energy consumption [58], considering the ratio between the employees of the Municipality of Tito (2,204) and the total employees in Italy (15,099,495), using direct knowledge of the local situation to make some corrections to the estimated value. In this way, the estimated energy consumption of the tertiary sector for the municipality of Tito in 2020 was equal to 1 TJ divided by fuel as follows: 41 TJ natural gas, 40 TJ electricity, 2.7 TJ LPG, 0.48 TJ diesel, and 0.21 TJ solar thermal energy.
In a second step, the percentage of employees for each sub-sector was used to estimate the total energy consumption by category (Table 4).
In the third phase, energy consumption per sub-sector was broken down by end use, considering Space Heating, Water Heating, Space Cooling and Other Electrical Uses (Table 5) based on the national distribution provided by the RSE study [59].
Finally, for each subsector and end-use, the average consumption by fuel was estimated considering the average energy consumption percentages by source for the Tito municipality (Table 6).
3.2.3. Electricity Production
The electricity production modeled in the Tito energy system is related to photovoltaic production serving both residential and tertiary buildings. For the purposes of this study, large ground-mounted photovoltaic plants and wind farms are not considered, since the electricity produced by them is sold directly to Energy Services Manager (GSE) [https://www.gse.it/] and fed directly into the national electricity grid.
The total number of photovoltaic systems (n. 164) and the total installed power (18,775 kW) of the municipality of Tito in 2020 were obtained from the Atlaimpianti database which provides a detailed description of the installed renewable energy systems [60]. Further elaborations were carried out to differentiate the photovoltaic systems based on their location: Residential, Tertiary and Industrial-Ground. In particular, the Industrial-Ground location refers to medium-high photovoltaic systems typically serving industrial plants or to ground- based systems for the production of electricity sold to the national electricity transmission grid.
The use of PVGIS software allowed us to estimate the production of electricity from photovoltaic systems for each sector based on their installed capacity [61].
Considering the national data relating to the percentage of self-consumption (30% for Residential and 52% for Tertiary) the values of self-consumed electricity and sold to the national transmission network were estimated (Table 7).
3.2.4. Energy Balance of the Base Year
The reference energy balance for the base year was obtained considering the local production of electricity and the imports of other fuels necessary to satisfy the energy demand of the residential and tertiary sectors. In particular, fossil fuels (natural gas, liquefied petroleum gas and diesel) and biomass (wood and pellets) are imported, which satisfy the energy demand for heating of the residential sector. The electricity produced by photovoltaic systems sold to GSE was considered an exported commodity. Table 8 shows the energy balance for the reference year.
4. Business as Usual Scenario
The Business as Usual scenario represents the status quo development of the energy system of the municipality of Tito taking into account the statistical data and the demand projections for the reference energy system (benchmark scenario). The exogenous assumptions concerned the costs of energy commodities, which were assumed to be constant over the time horizon, and the revenues from environmental compensation paid on on gas consumption, subject to the exploitation of oil fields, which were considered unchanged until 2050. The electricity produced by ground-mounted photovoltaic systems and those serving industrial buildings is not considered in this scenario. In fact, in the first case the electricity produced by is fed into the national electricity grid, while in the second case the electricity produced and self-consumed is related to a non-modeled sector. For the tertiary and residential sectors, the electricity produced and fed into the grid is considered an export. As concerns the technologies included in the file “database of new technologies”, photovoltaic systems for both the residential and tertiary sectors were duplicated to allow their activation in the examined time horizon and make explicit their contribution. In the tertiary sector, a minimum increase of 10% in the use of technologies with combined outputs (e.g. space heating and hot water) was assumed respect to the base year.
Furthermore, category-specific drivers were identified to estimate demand trends over the time horizon (2020-2050) through a statistical approach. For the residential sector, population and household projections at municipal level were used. The 20-year demographic trend provided by the National Institute of Statistics (ISTAT) was used, which estimates a population decline from 7,147 in 2022 to 6,389 in 2042 [62]. This assumption was also used to project the demographic trend to 2050 by identifying an appropriate mathematical function for extrapolation. The negative population trend shown in Table 9 is typical of small municipalities in Southern Italy and in the internal areas of the Italian Apennines. On the contrary, the number of families residing in Tito in the last twenty years has recorded an increase from 2003 to 2023 (from 2323 to 2873) with a decrease in the average number of members per family (from 2.81 in 2003 to 2.45 in 2023) [51]. Based on the statistical data of the period 2003-2023, the trend of the average number of members per family in the period 2024-2050 was estimated and, consequently, the trend of the number of families in the period 2020-2050 (obtained as the ratio between the population and the average number of members per family).
For Space Heating, the number of heated square meters per household was assumed to be constant over the entire 2020-2050 time horizon and, using the estimated number of households as the main driver, the number of heated square meters from 2024 to 2050 was calculated.
Water heating demand, on the contrary, is directly linked to population trends, assuming an increase in hot water per capita daily demand from the current 40 liters to 50 liters from 2030 to 2050.
Like Space Heating, the number of households is the main driver of space cooling, lighting and other electricity consumption demand over the time horizon. For space cooling, the share of households using air conditioning is assumed to increase from 50% in the base year to 60% in 2030-2040 and to 70% by 2040. Demand projections for lighting and other electrical uses were estimated, assuming an average household demand of 150 lumens for lighting and 290 MJ for other electrical obliged uses. Table 10 summarizes the end-use demand projections for the period 2020-2050 in the residential sector.
In the tertiary sector, the trend of energy demand for different end uses is not directly related to demographic parameters. Based on the available statistical data, a trend line was identified for each subsector and, using this information, the demand projection over the 2020-2050 time horizon was obtained. For the public sector (Schools and Public Buildings), energy demand was considered constant over the time horizon, assuming that there is no increase in the volumes of Public Buildings and that the decrease in population does not affect consumption. Table 11 summarizes the energy demand projections of the different tertiary sectors.
5. Results
The subsequent sections present the results of the BaU scenario, focusing on electricity production, energy supply, total energy consumption, and air pollutant emissions.
5.1. Electricity Production and Energy Supply
Electricity production from PV (Figure 9) increases by 99% in the considered time horizon going from 0.0034 PJ in 2020 to 0.0067 PJ by 2050, highlighting a strong commitment to the development of solar power, which is essential to meet energy needs and, at the same time, support the achievement of sustainability goals.
56% of photovoltaic electricity is produced by the tertiary sector and 44% by the residential sector, demonstrating the equal importance of both sectors in the development of photovoltaic energy.
Investing in photovoltaics is a measure that, on the one hand, provides electricity from renewable sources and, on the other, reduces CO2 emissions, objectives contained in the PNIEC [14]. In the year 2020, 42% of the electricity produced by photovoltaic is self-consumed (0.0014 PJ), while the remaining 58% (0.0019 PJ) is sent to the national distribution grid.
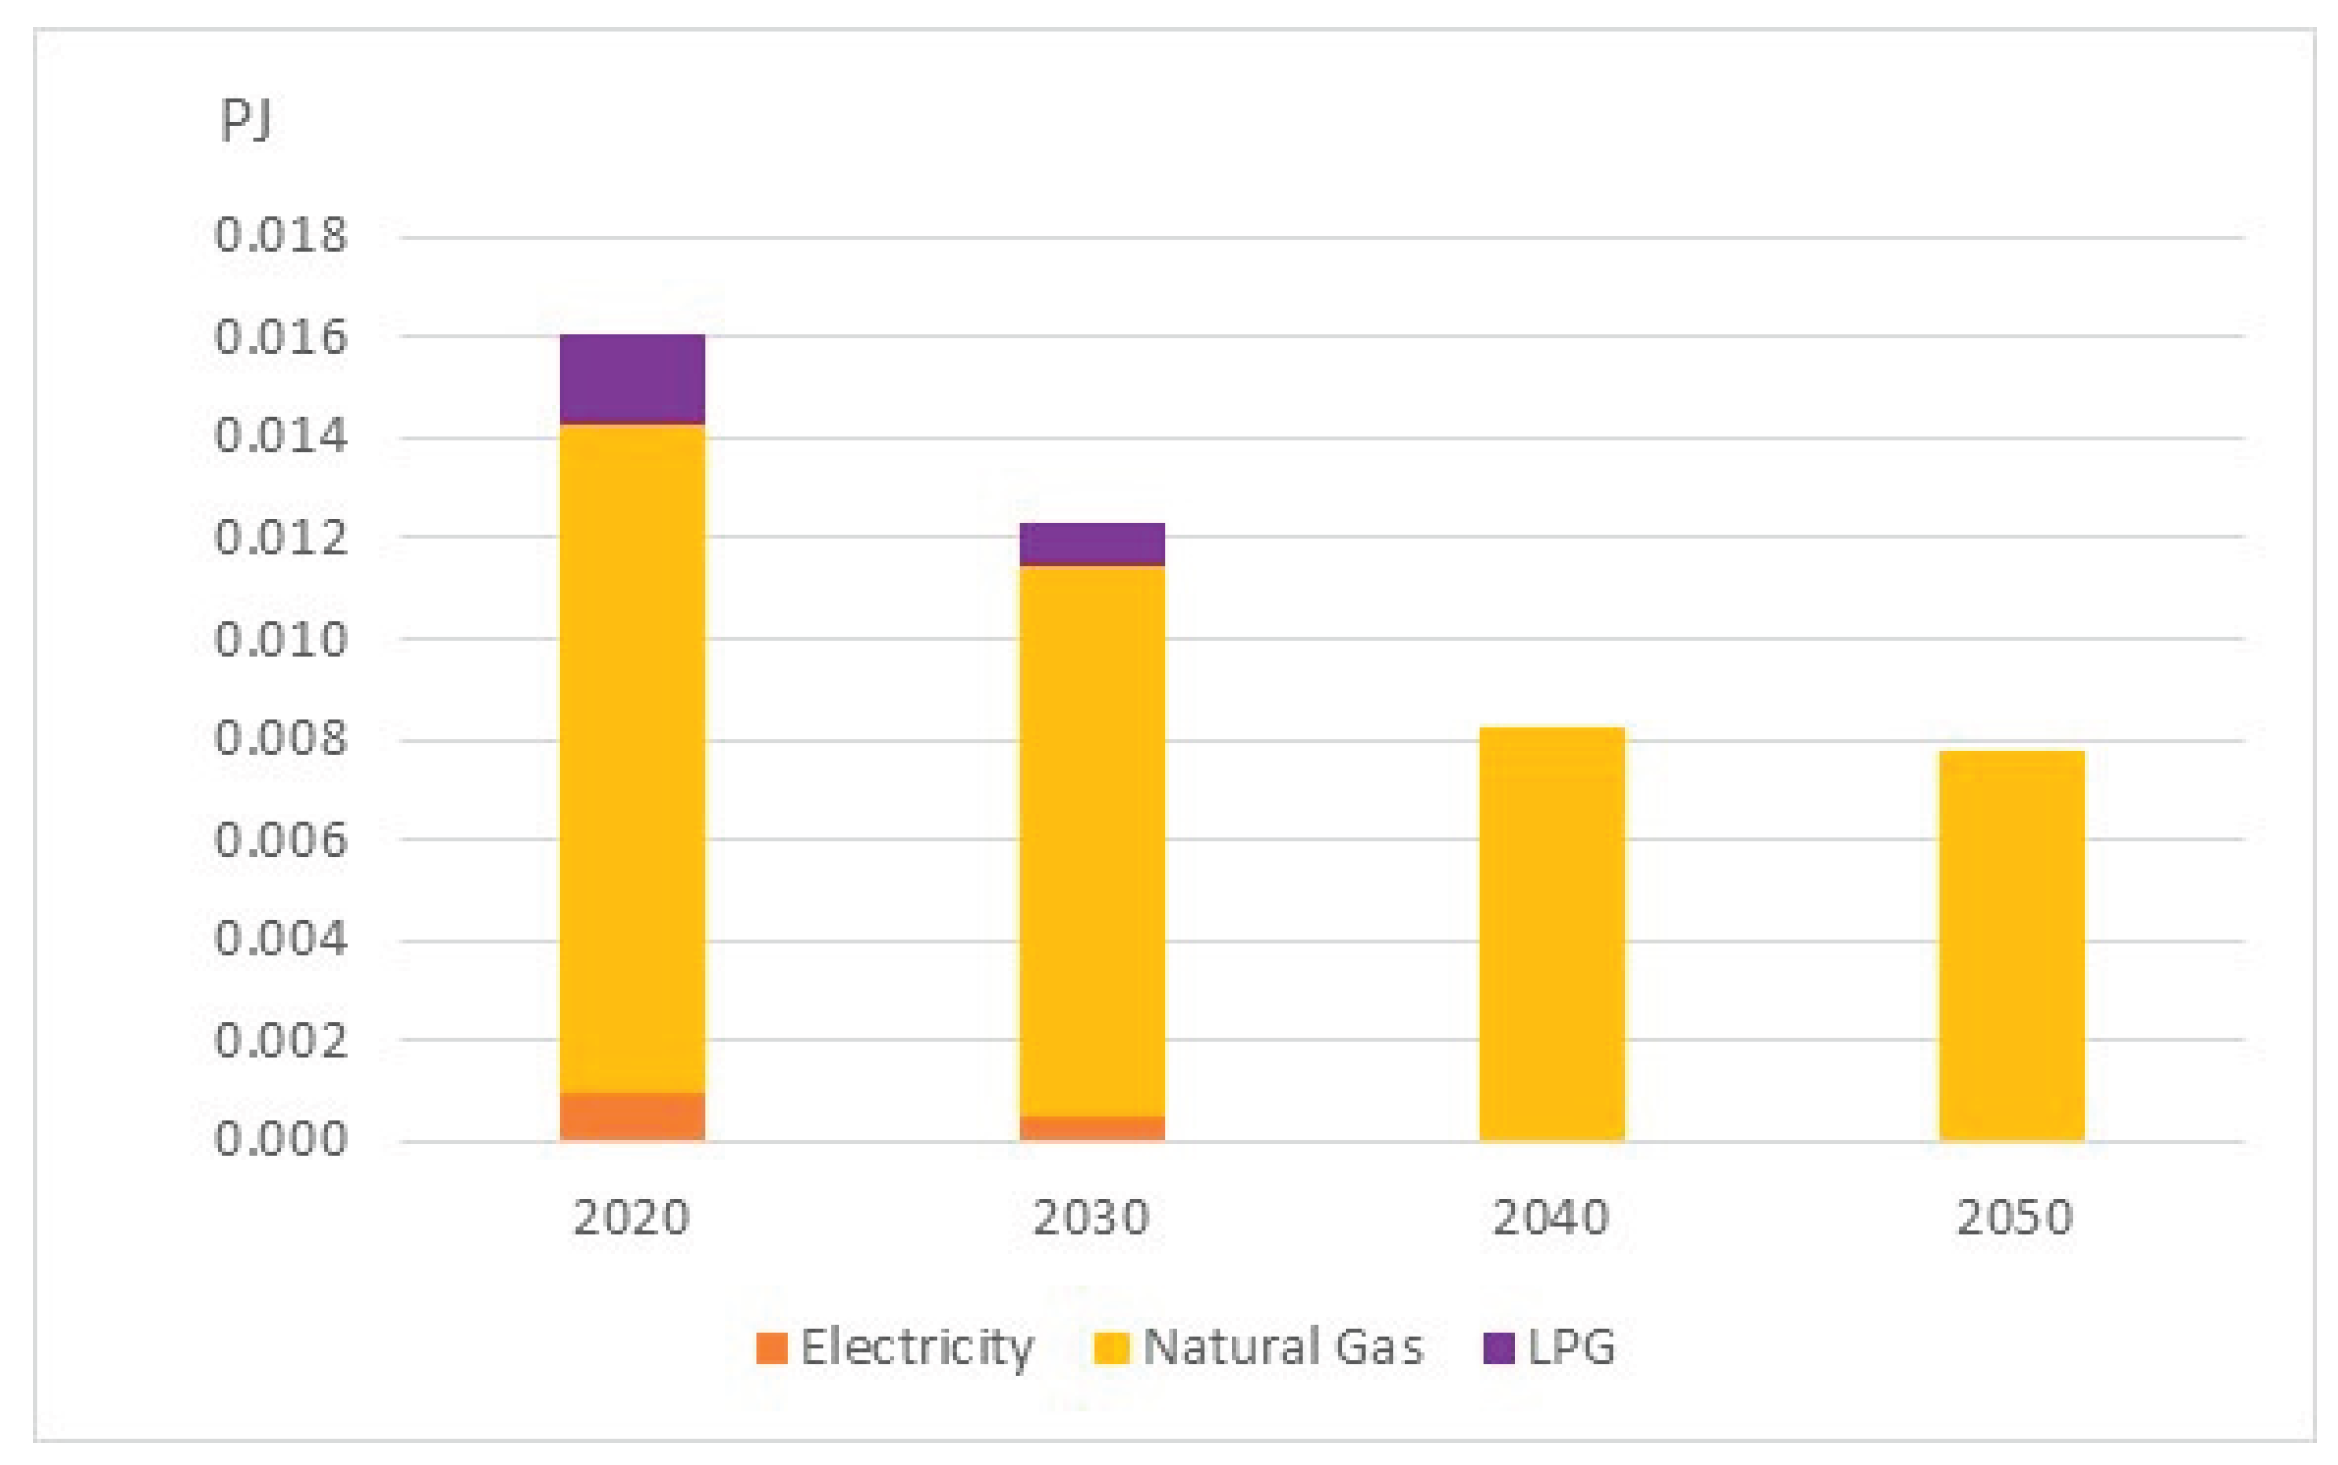
Figure 10 shows the energy mix from 2020 to 2050, highlighting the important role of natural gas and electricity, which, in the long term, substitute all fuels. In particular, natural gas reaches its maximum in 2035 (0.214 PJ) while biomass, diesel and LPG are gradually phased out by 2040, replaced by electricity, which increases to 0.064 PJ in 2050, representing 24% of the energy supply.
5.2. Energy Consumption
Total energy consumption from 2020 to 2050 (Figure 11) decreases by 15% and shows a significant change in energy use patterns, driven by the decline of biomass and the increase in natural gas consumption (+ 44% in 2050 compared to 2020). Biomass is used only in the residential sector and, together with LPG, is gradually phased out in 2040.
Diesel follows a similar trend, being phased out by 2035. Electricity consumption, after an initial decrease from 0.063 PJ in 2020 to 0,052 PJ in 2025, increases 5% on the time horizon reaching 0.066 PJ in 2050.
Solar thermal energy is experiencing significant growth (+187% by 2050), demonstrating that technological progress is driving investment in renewable energy to meet climate goals [63]. Electricity consumption overall is about 20% in 2020 and 24 % in 2050 with a minimum of 0,052 PJ (18%) in 2030, being mainly used in the tertiary sector (62% in 2020 and 73% in 2050 of the total electricity available). Natural gas consumption remains constant over the period considered in both the residential (71%) and tertiary (29%) sectors. The distribution of natural gas consumption between the residential sector (71%) and the tertiary sector (29%) remains constant over the time horizon. The distribuion of LPG consumption, which also remains constant until 2040, accounts for 73% in the residential sector and 27% in the tertiary sector, before being phased out by 2040.
Energy consumption in residential sector decreases 30% by 2050 mainly due to the phasing out of some fuels and the decrease of electricity (0.0179 PJ in 2050 - 24%). Biomass, the prevailing fuel in 2020 (44%) is phased out by 2040, being entirely substituted by natural gas (88%), while electricity consumption is almost constant (around 10% on the whole time horizon and solar thermal increasing from 0.0012 PJ in 2020 to 0.003 PJ by 2050) contributing to fulfil around 2% of the energy demand of Residential in 2050 (Figure 12).
The demand for Space Heating, initially met by natural gas, biomass and LPG (52%, 45% and 3% respectively), will be entirely covered by natural gas from 2040 onwards, decreasing about 4% on the time horizon (Figure 13).
Water heating demand increases 7% over the time horizon, being fulfilled in 2020 by natural gas (82%), Electricity (11%), LPG (5%) and solar thermal (2%), while in 2050 natural gas and solar thermal are the only fuels (95% and 5% respectively) (Figure 14).
Cooking demand, initially fulfilled by natural gas (83%), LPG (11%) and electricity (6%), is fully met by natural gas since 2040 with a decrease of 51% total fuel consumption.
Figure 15.
Fuel consumption for Cooking – Residential sector (PJ).
Space cooling is entirely fulfilled by electricity accounting for 3% of electric uses including lighting, and other electric appliances, with a 25% increase for lighting in 2050 compared to the base year (Figure 16).
Energy consumption in the tertiary sector increases by 30% over the period considered, i.e. +22% for electricity, +45% for natural gas and a significant increase in solar thermal energy (from 0.0002 to 0.0013 PJ), which replaces LPG and diesel, gradually phased out from 2030 onwards. In 2050, energy demand of tertiary is fulfilled by natural gas (55%), electricity 44% and solar thermal (1%) (Figure 17).
Total energy consumption by subsector provides further insights, as shown in Figure 18. Energy consumption in tertiary increases 30% along the time horizon. In 2020 Private Offices and shopping centers accounted for 47% and 34%, respectively, followed by Food, Public Buildings and Schools (around 5 % each). In 2050 a remarkable increase of Healthcare and Accommodation subsectors is expected (+190% and + 78% respectively), while Schools and Public Buildings will reduce consistently their consumption (-37% and -12% respectively), due to efficiency interventions on building structures. Food shows a 30% increase on the time horizon in line with the expected growth in the number of employees, accounting for about 5% on entire time horizon.
Figure 19 and Figure 20 show natural gas and electricity consumption by subsector over the time horizon. For both fuels Private Offices and Shopping Centers have the highest consumption. In 2020 Private Offices account for 56% of natural gas consumption and 37% of electricity, while Shopping Centers account for 24% natural gas and 44% electricity respectively. In 2050 Private Offices see a 7% decrease in their share of total natural gas consumption (from 56% in 2020 to 49% in 2050), while their share of total electricity consumption increases by 4% (from 37% in 2020 to 41% in 2050). On the other hand, Shopping Buildings show a 6% increase in their share on natural gas consumption (from 24% in 2020 to 30% in 2050) and a 4% decrease in their share on electricity consumption (from 44% in 2020 to 40% in 2050). In the same period for this subsector electricity consumption increases from 0.018 PJ to 0.19 PJ. Analyzing the breakdown of natural gas consumption of all subsectors (Figure 19), an increase is observed for Food and Healthcare (2% and 4% respectively), while share of School consumption decrease 4% (from 7% in 2020 to 3% in 2050).
As concerns electricity, Healthcare and Private Offices increase their share + 5% and 4% respectively, while other subsectors decrease their share from 5% to 1% (Figure 20).
5.3. Sensitivity Analysis
A sensitivity analysis was carried out by gradually increasing the purchase cost of natural gas to assess the behavior of the energy system in terms of fuel uses and technology configuration. A progressive increase (+20%, 30%, 50% and 100%) in the cost of natural gas of the reference year along the time horizon was therefore considered to assess the response to both moderate changes and extreme conditions that could occur in the event of geopolitical instability.
The total cost of the energy system represents the total amount of energy production and consumption expenditure over a 30-year period. It includes fuel purchase costs, investment costs for new technologies, operating and maintenance costs for infrastructure and conversion and end-use technologies, minus any profits from energy sales or incentives.
Figure 21 shows the increase in the total energy system cost to the variations of natural gas prices. The cost increase goes from 2.5% to 5.2% compared to the BAU scenario.
Figure 22 shows the natural gas supply trends highlighting the decrease due to the increase in purchasing costs, which is more evident in the long term.
A 20% increase in the natural gas price is almost ineffective on consumption, which decrease in consumption ranges from 1% in 2030 to 8% in 2040. In the GASCOST+30% case, the reduction is significant, ranging from -71% to -95% in 2040. Doubling the natural gas costs (GASCOST+100% case) the reduction in the long term is -97%. Energy supply variations highlight the effects of the increase of natural gas prices on fuel mix (Figure 23).
Natural gas is mainly substituted by electricity and biomass. In particular, in 2030 electricity increase ranges from 2% to 75%, while biomass decreases in the GASCOST+20% and GASCOST+30% cases, increasing up to 103% in the GASCOST+100% case, achieving 0.0625 PJ (Figure 23 a). In 2050, electricity increases from 3% to 67%, while biomass and LPG contributions achieve 0.043 PJ and 0.0045 PJ respectively in the GASCOST+ 100% case. Fuel mix in Residential at increasing natural gas costs is reported in (Figure 24).
In 2030 (Figure 24 a), natural gas decreases to 92% (GASCOST+100% case) being substituted by electricity (+141%) and biomass (+103%). LPG and solar thermal contribution are constant, being respectively 0.01PJ and 0.002 PJ. In 2050, Electricity consumption increases +157% and biomass 138%. Solar thermal is constant (around 0.003 PJ) and LPG is zero in all cases except GASCOST+100%, which achieves 0.003PJ, contributing 3% to total residential energy consumption.
The increase in electricity consumption, which compensates for the decline in natural gas consumption, is linked in particular to the use of heat pumps for space and water heating as also demonstrated by the increase in space electricity consumption per square meter, which goes from 0.0023 PJ (BaU) to a maximum of 0.14 PJ (GASCOST+100% case, year 2040) ((Figure 25).
Biomass also contributes to meeting Space Heating demand, showing a downward trend and gaining importance in 2040 and 2050, when the price of gas increases by at least 30% (Figure 26).
In the tertiary sector, the increase in electricity consumption driven by the rise in natural gas prices is lower than in the residential sector, achieving + 29% in 2050 when natural gas price is doubled (GASCOST100% case) (Figure 27).
Figure 28 shows the expected distribution among sub-sectors in 2050. Private Offices and Shopping Buildings still account for the largest share (84%), while Schools and Public Buildings account for about 4% each, Food and Healthcare about 3% each, and Accommodation 0.15%.
Considering the results of the sensitivity analysis, further investigation was conducted under the assumption of a 50% non-repayable grant for the purchase of heat pumps in both the residential and tertiary sectors, alongside a gradual increase in natural gas purchase costs (Table 12).
Figure 29 shows the trend in total system costs considering a 50% reduction in investment costs of heat pumps and a gradual increase in the purchase cost of natural gas. In all the four cases the total system’s cost is lower than the cost of the BaU scenario. The lowest total system cost (29.19 MEuro) is obtained in the GASCOST+20%_50_HP case corresponding to 50% reduction in heat pumps investment cost and a 20% increase in the purchase cost of natural gas. the total cost of the system reaches 29.70 MEuro in the GASCOST+100%_50_HP case corresponding to a 100% increase in the purchase cost of natural gas and a 50% reduction in heat pumps investment cost.
The following figures show the results of the GASCOST+20%_50_HP and GASCOST+30%_50_HP cases in which the cost of natural gas increased by 20% and 30%. The results obtained with a further increase in the cost of gas are comparable to those obtained in the GASCOST+50% and GASCOST+100% cases with no reduction in the purchase cost of heat pumps. When the investment cost of heat pumps is halved, biomass boilers, formerly selected as the most economical technology without any reduction in the price of heat pumps, from a 30% increase of the cost of natural gas increases 30%, are discarded. Biomass is therefore no longer used for space heating in the residential sector, as illustrated in (Figure 30).
The reduction in heat pump investment costs leads also to a more rapid reduction in natural gas consumption, as shown in Figure 31, which shows the trend in gas consumption considering a 20% and 30% increase in natural gas purchase costs with and without the reduction in heat pump investment costs (GASCOST+20%, GASCOST+20%_50_HP, GASCOST+30%, GASCOST+30%_50_HP cases). In the GASCOST+20%_50_HP case, natural gas consumption is reduced by 80% in 2030 and by 94% in 2040 and 2050 compared to the GASCOST+20% case. In the GASCOST+30%_HP case, the reduction is 91% in 2030, 65% in 2040 and 37% in 2050 compared to the GASCOST+30% case. In the GASCOST+30% case, natural gas consumption is lower than in the BaU scenario as early as 2040.
With regard to electricity, the GASCOST+20%_HP case, in which the cost of natural gas increases 20% and the investment cost for heat pumps is halved, shows a significant increase in electricity consumption (64% in 2030, 65% in 2040 and 55% in 2050) compared to the GASCOST+20% case whose consumption is very similar (almost identical) to that of the BAU scenario (Figure 32). In 2030, the increase in electricity consumption in the GASCOST+30%_HP case is 42% compared to the GASCOST+30% case. This difference is not evident in 2040 and 2050, where the trends for the GASCOST+30% and GASCOST+30%_HP cases are very similar. In the GASCOST+30%_HP case, there is a slight reduction in consumption of 1.6% in 2040 and 2.8% in 2050 compared to the GASCOST+30% case, due to the use of more efficient heat pumps than in the GASCOST+30% case, promoted by lower investment costs.
5.4. Greenhouse Gases Emissions
The Kyoto Protocol identified seven greenhouse gases that contribute to global warming: carbon dioxide (CO2), methane (CH4), nitrous oxide (N2O), hydrofluorocarbons (HFCs), perfluorocarbons (PFCs), sulphur hexafluoride (SF6) and nitrogen trifluoride (NF3), among which carbon dioxide, methane and nitrous oxide are the main contributors. Carbon dioxide is by far the most important anthropogenic greenhouse gas, as it currently accounts for the largest share of warming associated with human activities. In fact, globally, total CO₂ emissions linked to energy use increased by 0.8% in 2024, contributing to an atmospheric CO₂ concentration of 422.5 ppm, 50% higher than pre-industrial levels. This increase was driven by the rise in natural gas emissions in 2024 (180 Mt CO₂, +2.5%), which was the main contributor to the growth in global carbon emissions. [64,65].
As concerns the Tito energy system, the analysis focused on CO₂ emissions, which are mainly determined by natural gas consumption in residential and tertiary sectors. As shown in Figure 33, CO2 emissions increase till 2035 (+ 42%) and start declining from 2045 with an overall increase around 34% respect to 2020. Residential accounts for 71% highlighting its main contribution, while Tertiary emits the remaining 29%, these percentages remain constant over the time horizon. The slight decrease in the last time-period is mainly due to due to a decrease in natural gas consumption.
The decrease in natural gas consumption due to the increasing gas prices drives a decrease in CO2 emissions (Figure 34).
In 2030, the decline will be significant when the price of natural gas is at least 50% higher than the current selling price (-71% compared to emissions in the BaU scenario). By 2040, a 30% increase will already be effective (-85%), while in 2050 the reduction in CO2 emissions will vary from 92% (GASCOST30% case) to 95% (GASCOST50% and GASCOST100% cases). This confirms the effectiveness of a 30% increase in the price of natural gas in the long term in bringing about a steady decrease in CO2 emissions.
Analyzing the cases with the reduction in heat pump investment costs (Figure 35), it is possible to see a reduction in CO2 emissions of 80% by 2030, 94% by 2040 and 2050 in the GASCOST+20%_HP case compared to the GASCOST+20% case. In the GASCOST+30%_HP case, CO2 emissions are reduced by 90% compared to the GASCOST+30% case in 2030, while in subsequent periods the values are very similar, with a difference of -1.2 kton in 2040 and -0.4 kton in 2050.
6. Conclusions
The implementation of the municipal energy system model based on ETSAP-TIMES framework articulated a potential evolution pathway under the BAU scenario, which reflects current national policies and energy consumption trends paving the way to further investigation of future contrasting scenarios.
Current energy landscape highlights the heavy reliance of Tito's energy system on fossil fuels in 2020, particularly on natural gas, despite the municipality's leading position in the Basilicata region for installed PV capacity. Biomass is the most used source for residential heating, followed closely by natural gas.
In the BaU scenario total energy consumption decreases by 15% by 2050. It is observed that there is a noticeable overall decline in biomass, LPG, and diesel use which are are gradually phased out by 2040 and 2035, respectively, driven by regulatory pressures and the phasing out of more carbon-intensive sources. A substantial growth of renewables is also observed. In particular, electricity production from PV systems increases by 99% over the time horizon, going from 0.0034 PJ in 2020 to 0.0067 PJ by 2050 demonstrating a meaningful shift toward renewable energy and alignment with national climate goals. Also, solar thermal exhibits encouraging growth, increasing by 187% by 2050, although its overall contribution remains relatively modest in absolute terms. Despite the PV growth, natural gas remains the dominant energy carrier throughout the time horizon. Its consumption increases 44% by 2050 compared to 2020 and is particularly dominant for Space Heating and Cooking demands in the residential sector, indicating a slower transition away from fossil fuels in these critical end-uses. The residential sector trends toward reduced overall energy use by 30% by 2050, reflecting improved efficiency or behavioral shifts. In this sector, biomass, the prevailing fuel in 2020 (44%), is entirely substituted by natural gas (88% contribution) by 2040. Energy consumption in the tertiary sector increases by 30% over the time horizon, particularly in the Healthcare and Accommodation subsectors (expected increases of +190% and +78% respectively by 2050). The continued reliance on natural gas leads to a 34% increase in CO2 emissions by 2050 compared to 2020, peaking in 2035. The residential sector is the primary contributor, accounting for 71% of these emissions. The slight emissions downturn by mid-century suggests some progress toward decarbonization, potentially aided by improved energy efficiency.
The sensitivity analysis investigates the impact of gas prices and the effectiveness of subsidies to promote technology innovation. Increasing the price of natural gas is highly effective at reducing consumption and the associated CO2 emissions. A 30% price increase reduces long-term consumption significantly, leading to a 92% drop in CO2 emissions by 2050 compared to the BaU scenario. Electricity (powering heat pumps) and biomass emerge as the primary substitutes. Combining a moderate natural gas price increase (+20%) with a 50% non-repayable grant for heat pumps proves to be the most effective policy lever. This approach drastically reduces natural gas consumption and CO2 emissions (an 80% reduction by 2030) while simultaneously lowering the total energy system cost below that of the BaU scenario.
The overall conclusion is that the BaU pathway only partially aligns with decarbonization targets. The current trajectory emphasizes the need for more aggressive policy actions and technological innovation to significantly reduce fossil fuel dependency and accelerate the transition to a low-carbon energy system.
The next step in this research involves scenario analysis where different external constraints will be applied to assess the effectiveness of specific measures and policies. This future analysis is particularly relevant for understanding the implications of implementing RECs in accordance with European and Italian directives.
Author Contributions
Conceptualization, I.I.I, C.C., A.D.A and S.D.L.; methodology, I.I.I, C.C., and S.D.L.; software, S.D.L.; validation, I.I.I and S.D.L..; formal analysis, I.I.I and S.D.L.; investigation, I.I.I and S.D.L.; resources, C.C.; data curation, I.I.I and S.D.L.; writing—original draft preparation, I.I.I and S.D.L.; writing—review and editing, C.C. and A.D.A.; visualization, C.C. and A.D.A.; supervision, C.C. and A.D.A..; project administration, C.C. and A.D.A.; funding acquisition, C.C. All authors have read and agreed to the published version of the manuscript.
Funding
The research was funded by CNR-IMAA and was carried out within the framework of the activities of the PhD in Engineering for Innovation and Sustainable Development XXXVIII cycle at the University of Basilicata – Potenza.
Data Availability Statement
Dataset available on request from the authors
Conflicts of Interest
The authors declare no conflicts of interest.
Abbreviations
The following abbreviations are used in this manuscript:
| EU | European Union |
| CEP | Clean Energy Package |
| GHG | Greenhouse Gas |
| PNIEC | Integrated National Energy and Climate Plan |
| REC | Renewable Energy Communities |
| SECAP | Sustainable Energy and Climate Action Plans |
| TIMES | The Integrated MARKAL-EFOM System |
| IEA | International Energy Agency |
| ETSAP | Energy Technology Systems Analysis Programme |
| BaU | Business as Usual |
| LPG | Liquefied Petroleum Gas |
| RES | Reference Energy System |
| PV | Solar photovoltaic |
| VEDA | Versatile Data Analyst |
| SEAP | Sustainable Energy Action Plan |
| CED | climate emergency declaration |
| GSE | Energy Services Manager |
| ISTAT | National Institute of Statistics |
Appendix A
GLOSSARY: Classification of processes and commodities in TIMES

Table A1.
End-use Demands.
| TIMES Code | Description | Sector | Unit of measure |
|---|---|---|---|
| DRSH | Space Heating | Residential | Mm2 |
| DRWH | Water Heating | Residential | Mliters |
| DRSC | Space Cooling | Residential | Mm2 |
| DRCO | Cooking | Residential | MUnit |
| DRLG | Lighting | Residential | Glumen |
| DROEU | Other Electric Uses | Residential | PJ |
| DTASH | Space Heating | Tertiary - Accommodation | Mpresences |
| DTAWH | Water Heating | Tertiary – Accommodation | Mpresences |
| DTASC | Space Cooling | Tertiary – Accommodation | Mpresences |
| DTAOEU | Other Electric Uses | Tertiary - Accommodation | Mpresences |
| DTCSH | Space Heating | Tertiary – Food | MEmployees |
| DTCWH | Water Heating | Tertiary – Food | MEmployees |
| DTCSC | Space Cooling | Tertiary – Food | MEmployees |
| DTCOEU | Other Electric Uses | Tertiary - Food | MEmployees |
| DTPSH | Space Heating | Tertiary – Public Buildings | Mm3 |
| DTPWH | Water Heating | Tertiary – Public Buildings | Mm3 |
| DTPSC | Space Cooling | Tertiary – Public Buildings | Mm3 |
| DTPOEU | Other Electric Uses | Tertiary – Public Buildings | Mm3 |
| DTPOSH | Space Heating | Tertiary – Private Offices | MEmployees |
| DTPOWH | Water Heating | Tertiary – Private Offices | MEmployees |
| DTPOSC | Space Cooling | Tertiary – Private Offices | MEmployees |
| DTPOOEU | Other Electric Uses | Tertiary – Private Offices | MEmployees |
| DTPSH | Space Heating | Tertiary – Shopping Buildings | Mm2 |
| DTPWH | Water Heating | Tertiary – Shopping Buildings | Mm2 |
| DTPSC | Space Cooling | Tertiary – Shopping Buildings | Mm2 |
| DTPOEU | Other Electric Uses | Tertiary – Shopping Buildings | Mm2 |
| DTHSH | Space Heating | Tertiary – Healthcare | MEmployees |
| DTHWH | Water Heating | Tertiary – Healthcare | MEmployees |
| DTHSC | Space Cooling | Tertiary – Healthcare | MEmployees |
| DTHOEU | Other Electric Uses | Tertiary – Healthcare | MEmployees |
| DTPSH | Space Heating | Tertiary - Schools | Mm3 |
| DTPWH | Water Heating | Tertiary – Schools | Mm3 |
| DTPOEU | Other Electric Uses | Tertiary - Schools | Mm3 |
Table A2.
Commodities.
| TIMES Code | Description | Sector | Unit of measure |
| SUPGAS | Natural gas | Supply | PJ |
| SUPLPG | LPG | Supply | PJ |
| SUPDIE | Diesel | Supply | PJ |
| SUPBIO | Biomass | Supply | PJ |
| SUPELC | Electricity | Supply | PJ |
| SUPTHES | Solar thermal | Supply | PJ |
| RESGAS | Natural gas | Residential | PJ |
| RESLPG | LPG | Residential | PJ |
| RESBIO | Biomass | Residential | PJ |
| RESELC | Electricity | Residential | PJ |
| RESTHES | Solar thermal | Residential | PJ |
| TERGAS | Natural gas | Tertiary | PJ |
| TERLPG | LPG | Tertiary | PJ |
| TERDIE | Diesel | Tertiary | PJ |
| TERELC | Electricity | Tertiary | PJ |
| TERTHES | Solar thermal | Tertiary | PJ |
| ELCSOLRI | Solar energy for photovoltaics | Supply | PJ |
| ELCRESD | Electricity generated by photovoltaics - Residential | Electricity production | PJ |
| ELCTERD | Electricity generated by photovoltaics - Tertiary | Electricity production | PJ |
| ELCR | Electricity produced by photovoltaics and fed into the grid – Residential | Supply | PJ |
| ELCT | Electricity produced by photovoltaics and fed into the grid - Tertiary | Supply | PJ |
| RESSH | Useful energy for space heating | Residential | PJ |
| RESWH | Useful energy for water heating | Residential | PJ |
| RESSC | Useful energy for space cooling | Residential | PJ |
| TERCSH | Useful energy for space heating | Tertiary – Food | PJ |
| TERCWH | Useful energy for water heating | Tertiary - Food | PJ |
Table A3.
Processes.
| TIMES Code | Description | Sector | Activity | Capacity |
|---|---|---|---|---|
| IMPGAS20 | Import of natural gas | Supply | PJ | - |
| IMPLPG20 | Import of LPG | Supply | PJ | - |
| IMPDIE20 | Import of diesel | Supply | PJ | - |
| IMPBIO20 | Import of biomass | Supply | PJ | - |
| IMPELC20 | Import of electricity | Supply | PJ | - |
| MINTHES20 | Mining of solar thermal | Supply | PJ | - |
| SHAREGAS20 | Infrastructure for natural gas | Supply | PJ | PJ-year |
| SHARELPG20 | Infrastructure for LPG | Supply | PJ | PJ-year |
| SHAREDIE20 | Infrastructure for diesel | Supply | PJ | PJ-year |
| SHAREBIO20 | Infrastructure for biomass | Supply | PJ | PJ-year |
| SHAREELC20 | Infrastructure for electricity | Supply | PJ | PJ-year |
| SHARETHES20 | Infrastructure for solar thermal | Supply | PJ | PJ-year |
| MINELCSOL | Mining of solar energy for photovoltaics | Supply | PJ | - |
| ERESSOLRI1 | Photovoltaic plants for Residential | Electricity production | PJ | GW |
| ETESSOLRI1 | Photovoltaic plants for Tertiary | Electricity production | PJ | GW |
| SHARESELC00 | Infrastructure of produced electricity -Residential | Supply | PJ | PJ-year |
| SHATERELC00 | Infrastructure of produced electricity - Tertiary | Supply | PJ | PJ-year |
| RRSHGNATS01 | Natural gas space heating technology – single output | Residential | PJ | GW |
| RRSHGNATM01 | Natural gas space heating technology – mixed output | Residential | PJ | GW |
| RRWHGNATS01 | Natural gas water heating technology – single output | Residential | PJ | GW |
| RRSHLPGTS01 | LPG space heating technology – single output | Residential | PJ | GW |
| RRSHLPGTM01 | LPG space heating technology – mixed output | Residential | PJ | GW |
| RRWHLPGTS01 | LPG water heating technology – single output | Residential | PJ | GW |
| RRSHBIOTS01 | Biomass space heating technology – single output | Residential | PJ | GW |
| RRWHTHESTS01 | Solar thermal water heating technology – single output | Residential | PJ | GW |
| RRSHELCTS01 | Electricity space heating technology – single output | Residential | PJ | GW |
| RRSHELCTS02 | Electricity space heating technology – single output | Residential | PJ | GW |
| RRWHELCTS01 | Electricity water heating standard heat pump technology – single output | Residential | PJ | GW |
| RRWHELCTT01 | Electricity water heating top heat pump technology – single output | Residential | PJ | GW |
| RRWHELCTN01 | Electricity water heating new DWH technology – single output | Residential | PJ | GW |
| RRSCELCTS01 | Electricity space cooling technology – single output | Residential | PJ | GW |
| RRSCELCTS01 | Electricity space cooling portable technology – single output | Residential | PJ | GW |
| RRSCELCTS02 | Electricity space cooling class A technology – single output | Residential | PJ | GW |
| RRSCELCTS03 | Electricity space cooling class BC technology – single output | Residential | PJ | GW |
| RRSCELCTS04 | Electricity space cooling class DE technology – single output | Residential | PJ | GW |
| RRSCELCTS05 | Electricity space cooling class EF technology – single output | Residential | PJ | GW |
| RRSCELCTS06 | Electricity space cooling technology others– single output | Residential | PJ | GW |
| RRCOGNAT01 | Natural gas cooking technology | Residential | PJ | Munit |
| RRCOLPGT01 | LPG cooking technology | Residential | PJ | Munit |
| RRCOELCT01 | Electricity cooking technology | Residential | PJ | Munit |
| RRLGELCT01 | Incandescent lighting technology | Residential | PJ | Glumen |
| RRLGELCT02 | Halogen Lighting technology | Residential | PJ | Glumen |
| RRLGELCT03 | Compact Fluo Lighting technology | Residential | PJ | Glumen |
| RROEUELCT01 | Other uses technology | Residential | PJ | PJ |
| TCSHGNATS01 | Natural gas space heating technology, single output | Tertiary - Food | PJ | GW |
| TCSHGNATM01 | Natural gas space heating technology, mixed output | Tertiary - Food | PJ | GW |
| TCWHGNATS01 | Natural gas water heating technology, single output | Tertiary - Food | PJ | GW |
| TCSHLPGTS01 | LPG space heating technology, single output | Tertiary - Food | PJ | GW |
| TCSHLPGTM01 | LPG space heating technology, mixed output | Tertiary - Food | PJ | GW |
| TCWHLPGTS01 | LPG water heating technology, single output | Tertiary - Food | PJ | GW |
| TCSHDIETS01 | Diesel space heating technology, single output | Tertiary - Food | PJ | GW |
| TCSHDIETM01 | Diesel space heating technology, mixed output | Tertiary - Food | PJ | GW |
| TCWHDIETS01 | Diesel water heating technology, single output | Tertiary - Food | PJ | GW |
| TCWHTHESTS01 | Solar thermal water heating technology, single output | Tertiary - Food | PJ | GW |
| TCSHELCTS01 | Electricity space heating technology 1, single output | Tertiary - Food | PJ | GW |
| TCSHELCTS02 | Electricity space heating technology 2, single output | Tertiary - Food | PJ | GW |
| TCSHELCPS01 | Electricity space heating heat pump technology, single output | Tertiary - Food | PJ | GW |
| TCWHELCTS01 | Electricity water heating technology 1, single output | Tertiary - Food | PJ | GW |
| TCWHELCTS02 | Electricity water heating technology 2, single output | Tertiary - Food | PJ | GW |
| TCWHELCTS03 | Electricity water heating technology 3, single output | Tertiary - Food | PJ | GW |
| TCWHELCTS04 | Electricity water heating technology 4, single output | Tertiary - Food | PJ | GW |
| TCSCELCT01 | Electricity space cooling technology | Tertiary - Food | MEmployees | |
| TCOEUELCT01 | Electricity equipment technology | Tertiary - Food | MEmployees |
Table A4.
Dummy technologies.
| TIMES Code | Description | Sector | Activity |
|---|---|---|---|
| RDRSHD101 | Dummy technology space heating | Residential | Mm2 |
| RDRWHD101 | Dummy technology water heating | Residential | Mliters |
| RDRSCD101 | Dummy technology space cooling | Residential | Mm2 |
| TDCSHD101 | Dummy technology space heating | Tertiary - Food | MEmployees |
| TDCWHD101 | Dummy technology water heating | Tertiary - Food | MEmployees |
References
- Muhire, F.; Turyareeba, D.; Adaramola, M.S.; Nantongo, N; Atukunda, R.; Olyanga, A.M. Drivers of green energy transition: A review. Green Energy and Resources 2024, Vol. 2(4), 100105. [CrossRef]
- European Commission. Communication from the Commission to the European Parliament, the European Council, the council, the European economic and social committee and the committee of the regions. The European Green Deal. COM(2019) 640 final. https://eur-lex.europa.eu/resource.html?uri=cellar:b828d165-1c22-11ea-8c1f-01aa75ed71a1.0002.02/DOC_1&format=PDF.
- European Commission. Communication from the Commission. Clean Energy For All Europeans. COM(2016) 860 final. https://eur-lex.europa.eu/legal-content/EN/TXT/HTML/?uri=CELEX:52016DC0860.
- European Union. Directive (EU) 2018/844 of the European Parliament and of the Council of 30 May 2018 amending Directive 2010/31/EU on the energy performance of buildings and Directive 2012/27/EU on energy efficiency. https://eur-lex.europa.eu/legal-content/EN/TXT/?toc=OJ%3AL%3A2018%3A156%3ATOC&uri=uriserv%3AOJ.L_.2018.156.01.0075.01.ENG.
- European Union. Directive (EU) 2018/2001 of the European Parliament and of the Council of 11 December 2018 on the promotion of the use of energy from renewable sources (recast). https://eur-lex.europa.eu/legal-content/EN/TXT/?uri=uriserv:OJ.L_.2018.328.01.0082.01.ENG&toc=OJ:L:2018:328:TOC.
- European Union. Directive (EU) 2018/2002 of the European Parliament and of the Council of 11 December 2018 amending Directive 2012/27/EU on energy efficiency.
- European Union. Directive (EU) 2019/944 of the European Parliament and of the Council of 5 June 2019 on common rules for the internal market for electricity and amending Directive 2012/27/EU (recast). https://eur-lex.europa.eu/legal-content/EN/TXT/?uri=uriserv:OJ.L_.2019.158.01.0125.01.ENG&toc=OJ:L:2019:158:TOC.
- European Union. Regulation (EU) 2018/1999 of the European Parliament and of the Council of 11 December 2018 on the Governance of the Energy Union and Climate Action, amending Regulations (EC) No 663/2009 and (EC) No 715/2009 of the European Parliament and of the Council, Directives 94/22/EC, 98/70/EC, 2009/31/EC, 2009/73/EC, 2010/31/EU, 2012/27/EU and 2013/30/EU of the European Parliament and of the Council, Council Directives 2009/119/EC and (EU) 2015/652 and repealing Regulation (EU) No 525/2013 of the European Parliament and of the Council. https://eur-lex.europa.eu/legal-content/EN/TXT/?uri=uriserv:OJ.L_.2018.328.01.0001.01.ENG&toc=OJ:L:2018:328:TOC.
- European Union. Regulation (EU) 2019/943 of the European Parliament and of the Council of 5 June 2019 on the internal market for electricity (recast). https://eur-lex.europa.eu/legal-content/EN/TXT/?uri=CELEX%3A02019R0943-20240716.
- European Union. Regulation (EU) 2019/941 of the European Parliament and of the Council of 5 June 2019 on risk-preparedness in the electricity sector and repealing Directive 2005/89/EC https://eur-lex.europa.eu/legal-content/EN/TXT/?uri=uriserv:OJ.L_.2019.158.01.0001.01.ENG&toc=OJ:L:2019:158:TOC.
- European Union. Regulation (EU) 2019/942 of the European Parliament and of the Council of 5 June 2019 establishing a European Union Agency for the Cooperation of Energy Regulators (recast). https://eur-lex.europa.eu/legal-content/EN/TXT/?uri=uriserv:OJ.L_.2019.158.01.0022.01.ENG&toc=OJ:L:2019:158:TOC.
- European Union. Communication from the Commission to the European Parliament, the European Council, the Council, the European Economic and social committee and the committee of the regions. REPowerEU Plan. COM(2022) 230 final. https://eur-lex.europa.eu/legal-content/EN/TXT/?uri=COM%3A2022%3A230%3AFIN&qid=1653033742483.
- European Union. Commission staff working document implementing the repower eu action plan: investment needs, hydrogen accelerator and achieving the bio-methane targets accompanying the document communication from the commission to the European Parliament, the European Council, the council, the european economic and social committee and the committee of the regions REPowerEU Plan. SWD(2022) 230 final. https://eur-lex.europa.eu/legal-content/EN/TXT/?uri=SWD%3A2022%3A230%3AFIN&qid=1653033922121.
- Santos, L.F.; Istrate, R.; Mac Dowell, N.; Guillén-Gosálbez, G. Environmental impacts of restructuring the EU’s natural gas supply and consumption: Learnings from the 2022 energy crisis. IScience 2025, Vol. 28(1), 111575. [Google Scholar] [CrossRef] [PubMed]
- European Commission. REPowerEU Affordable, secure and sustainable energy for Europe. Available online: https://commission.europa.eu/topics/energy/repowereu_en#securing-affordable-energy (accessed on 2 October 2025).
- European Commission. Energy Communities. Available online: https://energy.ec.europa.eu/topics/markets-and-consumers/energy-consumers-and-prosumers/energy-communities_en (accessed on 2 October 2025).
- Ministry of Economic Development, Ministry of the Environment and Protection of Natural Resources and Sea, Ministry of Infrastructure and Transport. Integrated National Energy and Climate Plan. 2020 https://www.mimit.gov.it/images/stories/documenti/it_final_necp_main_en.pdf.
- Ministry of Environment and Energy Security. Integrated National Energy and Climate Plan. 2023. https://www.mase.gov.it/portale/documents/d/guest/pniec_2023-pdf.
- Energy Services Manager. Thermal Account. https://www.gse.it/servizi-per-te/efficienza-energetica/conto-termico (accessed on 2 October 2025).
- National Agency for New Technologies, Energy and Sustainable Economic Development. Home bonus. https://www.efficienzaenergetica.enea.it/detrazioni-fiscali/bonus-casa.html (accessed on 2 October 2025).
- Italian Government. Presidency of the Council of Ministers. Department of Italian Homes. Superbonus 110%. https://www.casaitalia.governo.it/generali/approfondimenti/superbonus-110/ (accessed on 2 October 2025).
- Ministry of Economy and Finance of Italy. The Revenue Agency. Energy Saving. https://www.agenziaentrate.gov.it/portale/aree-tematiche/casa/agevolazioni/agevolazioni-risparmio-energetico (accessed on 2 October 2025).
- Minister of the Environment and Energy Security. Decree No. 414 of 7 December 2023. https://www.mase.gov.it/portale/documents/d/guest/decreto-cer-pdf (accessed on 2 October 2025).
- Lv, Y. Transitioning to sustainable energy: opportunities, challenges, and the potential of blockchain technology. Front. Energy Res 2023, Vol. 11, 1258044. [Google Scholar] [CrossRef]
- Salvia, M.; Pietrapertosa, F.; D'Alonzo, V.; Clerici Maestosi, P.; Simoes, S.G.; Reckien, D. Key dimensions of cities’ engagement in the transition to climate neutrality. Journal of Environmental Management 2023, Vol. 344, 118519. [Google Scholar] [CrossRef] [PubMed]
- Ronchetti, G.; Galbiati, I.; Garofalo, E. Analyzing wind and photovoltaic plant development toward the energy transition in Italy. Next Energy 2025, Vol. 8, 100265. [Google Scholar] [CrossRef]
- Montes, A.D.; Sánchez-Rivero, M.V.; Fernández-Maroto, M.; De Las Rivas, J.L. The role of sustainable energy and climate action plans (SECAPs) in urban energy transition. Science of The Total Environment 2025, Vol. 973, 179110. [Google Scholar] [CrossRef] [PubMed]
- Loulou, R.; Goldstein, G.; Noble, K. Documentation for the MARKAL Family of Models. Energy technology systems analysis programme (ETSAP) IEA 2005 https://iea-etsap.org/docs/Documentation_for_the_TIMES_Model-Part-I.pdf.
- Loulou, R.; Labriet, M. ETSAP-TIAM: the TIMES integrated assessment model Part I: Model structure. CMS 2008 Vol. 5 pp. 7-40. [CrossRef]
- Gupta, K.; Ahlgren E.O. Analysis of City Energy Systems Modeling Case Studies: A Systematic Review. International Journal of Sustainable Energy Planning and Management 2025 Vol. 43, pp 123–139. [CrossRef]
- Gupta, K.; Karlsson, K.; Ahlgren E.O. City energy planning: Modeling long-term strategies under system uncertainties. Energy Strategy Reviews 2024 Vol. 56, 101564. [CrossRef]
- Lind, A.; Espegren, K. The use of energy system models for analysing the transition to low-carbon cities – The case of Oslo. Energy Strategy Reviews 2017 Vol. 15, pp 44-56. [CrossRef]
- Dias, L.P.; Simões, S; Gouveia, J. P.; Seixas, J. City energy modelling - Optimising local low carbon transitions with household budget constraints. Energy Strateg Rev 2019 Vol. 26 100387. [CrossRef]
- Di Leo, S.; Pietrapertosa, F.; Salvia, M.; Cosmi, C. Contribution of the Basilicata region to decarbonisation of the energy system: results of a scenario analysis. Renew Sustain Energy Rev 2021 Vol. 138, 110544. [CrossRef]
- Di Leo, S.; Tortorella, M.M.; Fortes, P.; Viccaro, M.; Cozzi, M.; Romano, S.; Cosmi, C. The TIMES Land-WEF model: An integrated analysis of the agricultural system of the Basilicata Region (Southern Italy) Energy Nexus 2024 Vol 15, pp.100315. [CrossRef]
- Di Leo, S.; Pietrapertosa, F.; Salvia, M.; Cosmi, C. A multi-region representation of an automotive manufacturing plant with the TIMES energy model In Proceedings of the ECEEE Industrial Efficiency 2020, Online Conference (15 September 2020).
- ETSAP-IEA Energy Technology System Analysis Program of International Energy Agency. https://iea-etsap.org/index.php/applications (accessed on 2 October 2025).
- Loulou, R. ETSAP-TIAM: the TIMES integrated assessment model. Part II: mathematical formulation. CMS 2008 Vol. 5 pp 41–66. [CrossRef]
- Labriet, M.; Drouet, L.; Vielle, M.; Loulou, R.; Kanudia, A.; Haurie, A. Assessment of the Effectiveness of Global Climate Policies Using Coupled Bottom-Up and Top-Down Models. FEEM 2015 Working Paper No. 023. [CrossRef]
- KanORS-EMR. (2025). VEDA 2.0 – Data handling system for TIMES models. Available online https://veda-documentation.readthedocs.io (accessed on 2 October 2025).
- ISTAT database. Demographic and Climate Data for Italian Municipalities. Available online: https://www.istat.it (accessed on 20 June 2025).
- Basilicata Regional Law 23 August 2022, n. 28. Regional measures of environmental compensation for the energy transition and repopulation of the lucanian territory. Available online http://atticonsiglio.consiglio.basilicata.it/AD_Elenco_Leggi?Codice=1966 (accessed on 03 October 2025).
- Covenant of Mayors ’’ Sustainable Energy Action plan (SEAP) – Tito Municipality’’2012. Available online: https://vecchiosito.comune.tito.pz.it/index.php?option=com_phocadownload&view=category&download=883:piano-d-azione-per-l-energia-sostenibile&id=184:piano-energetico&Itemid=81 (accessed on 03 October 2025).
- LIFE 3.0 LOCAL GoGREEN Project. Empower local authorities for accelerating the CET. Available online: https://localgogreen.eu/ (accessed on 03 October 2025).
- Institutional website of the municipality of Tito. Available at https://www.comune.tito.pz.it/sito/ (accessed on 03 October 2025).
- ISTAT - National Institute of Statistics. Available online https://www.istat.it/classificazione/versioni-precedenti-ateco/ (accessed on 03 October 2025).
- Di Leo, S.; Pietrapertosa, F.; Loperte, S.; Salvia, M.; Cosmi, C. Energy systems modelling to support key strategic decisions in energy and climate change at regional scale. Renew Sustain Energy Rev 2015 Vol. 42. pp. 394-414. [CrossRef]
- Cosmi, C.; Di Leo, S.; Loperte, S.; Macchiato, M.; Pietrapertosa, F.; Salvia, M.; Cuomo, V. A model for representing the Italian energy system: The NEEDS-TIMES experience. Renew. Sustain. Energy Rev 2009 Vol. 13 (4). pp. 763-776. [CrossRef]
- Terna driving Energy. Regional statistical 2020. Available online: https://download.terna.it/terna/8%20-%20REGIONI_8dbcf15768c9488.pdf (accessed on 03 October 2025).
- ISTAT database. Available online: https://www.istat.it/wp-content/uploads/2022/12/Tavole.xlsx (accessed on 03 October 2025).
- AdminStat. Italia. “Maps, analysis and statistics about the resident population”. Available online: https://ugeo.urbistat.com/AdminStat/it/it/demografia/famiglie/tito/76089/4 (accessed on 03 October 2025).
- Revenue Agency - Ministry of Economy and Finance. Personal communication.
- Hot water association Available online https://www.hotwater.org.uk/sizing-a-hot-water-cylinder/ (accessed on 03 October 2025).
- ISTAT statistics report. Household energy consumption. https://www.istat.it/it/files/2022/06/REPORT-CONSUMI-ENERGETICI-FAMIGLIE-2021-DEF.pdf (accessed on 03 October 2025).
- Sypher solutions pty ltd. Available online: https://www.syphersolutions.com.au/post/how-many-downlights-do-you-really-need-in-your-home (accessed on 03 October 2025).
- Borgarello M, Ciarniello U, Lanati F, Martini R, Vitale S, De Miglio R, Gargiulo M. Adaptation and extension of the Matisse model. Technical report. 2010. p. 1e267 (In italian).
- ISTAT database. “Number of Employees.”. Available online: http://dati.istat.it/index.aspx?queryid=21145# (accessed on 03 October 2025).
- Eurostat. database. Available online: https://ec.europa.eu/eurostat/web/energy/database/additional-data#Energy%20balances (accessed on 03 October 2025).
- Besagni, G; Borgarello, M; Maggiore, S; Brugnetti, E, Vilà, L.P; “RSE- Metabolismo energetico degli utenti finali: modellazione analitica dei consumi.” RSE report 2020. Available online: https://www.rse-web.it/wp-content/uploads/2022/05/20009870.pdf cited 04-6-2025 (accessed on 03 October 2025).
- Energy Services Manager. Atlaimpianti. Available online: https://atla.gse.it/atlaimpianti/%20project/Atlaimpianti_Internet.html Cited (accessed on 03 October 2025).
- European Commission. “Photovoltaic geographical information system (PVGIS). Available online: https://joint-research-centre.ec.europa.eu/photovoltaic-geographical-information-system-pvgis_en (accessed on 03 October 2025).
- ISTAT database. “Municipal population projections.’’. Available online: https://demo.istat.it/app/?i=PPC (accessed on 03 October 2025).
- IEA (2024), Renewables 2023, IEA, Paris Available online: https://www.iea.org/reports/renewables-2023, Licence: CC BY 4.0.
- International Energy Agency. Global Energy Review 2025 Available online https://www.iea.org/reports/global-energy-review-2025 (accessed on 03 October 2025).
- Materi S.; D’Angola A.; Enescu D.; Renna P. Reducing energy costs and CO2 emissions by production system energy flexibility through the integration of renewable energy Production Engineering, 2021 15 (5), pp. 667 - 681. [CrossRef]
Figure 1.
Diagram of the methodological steps.
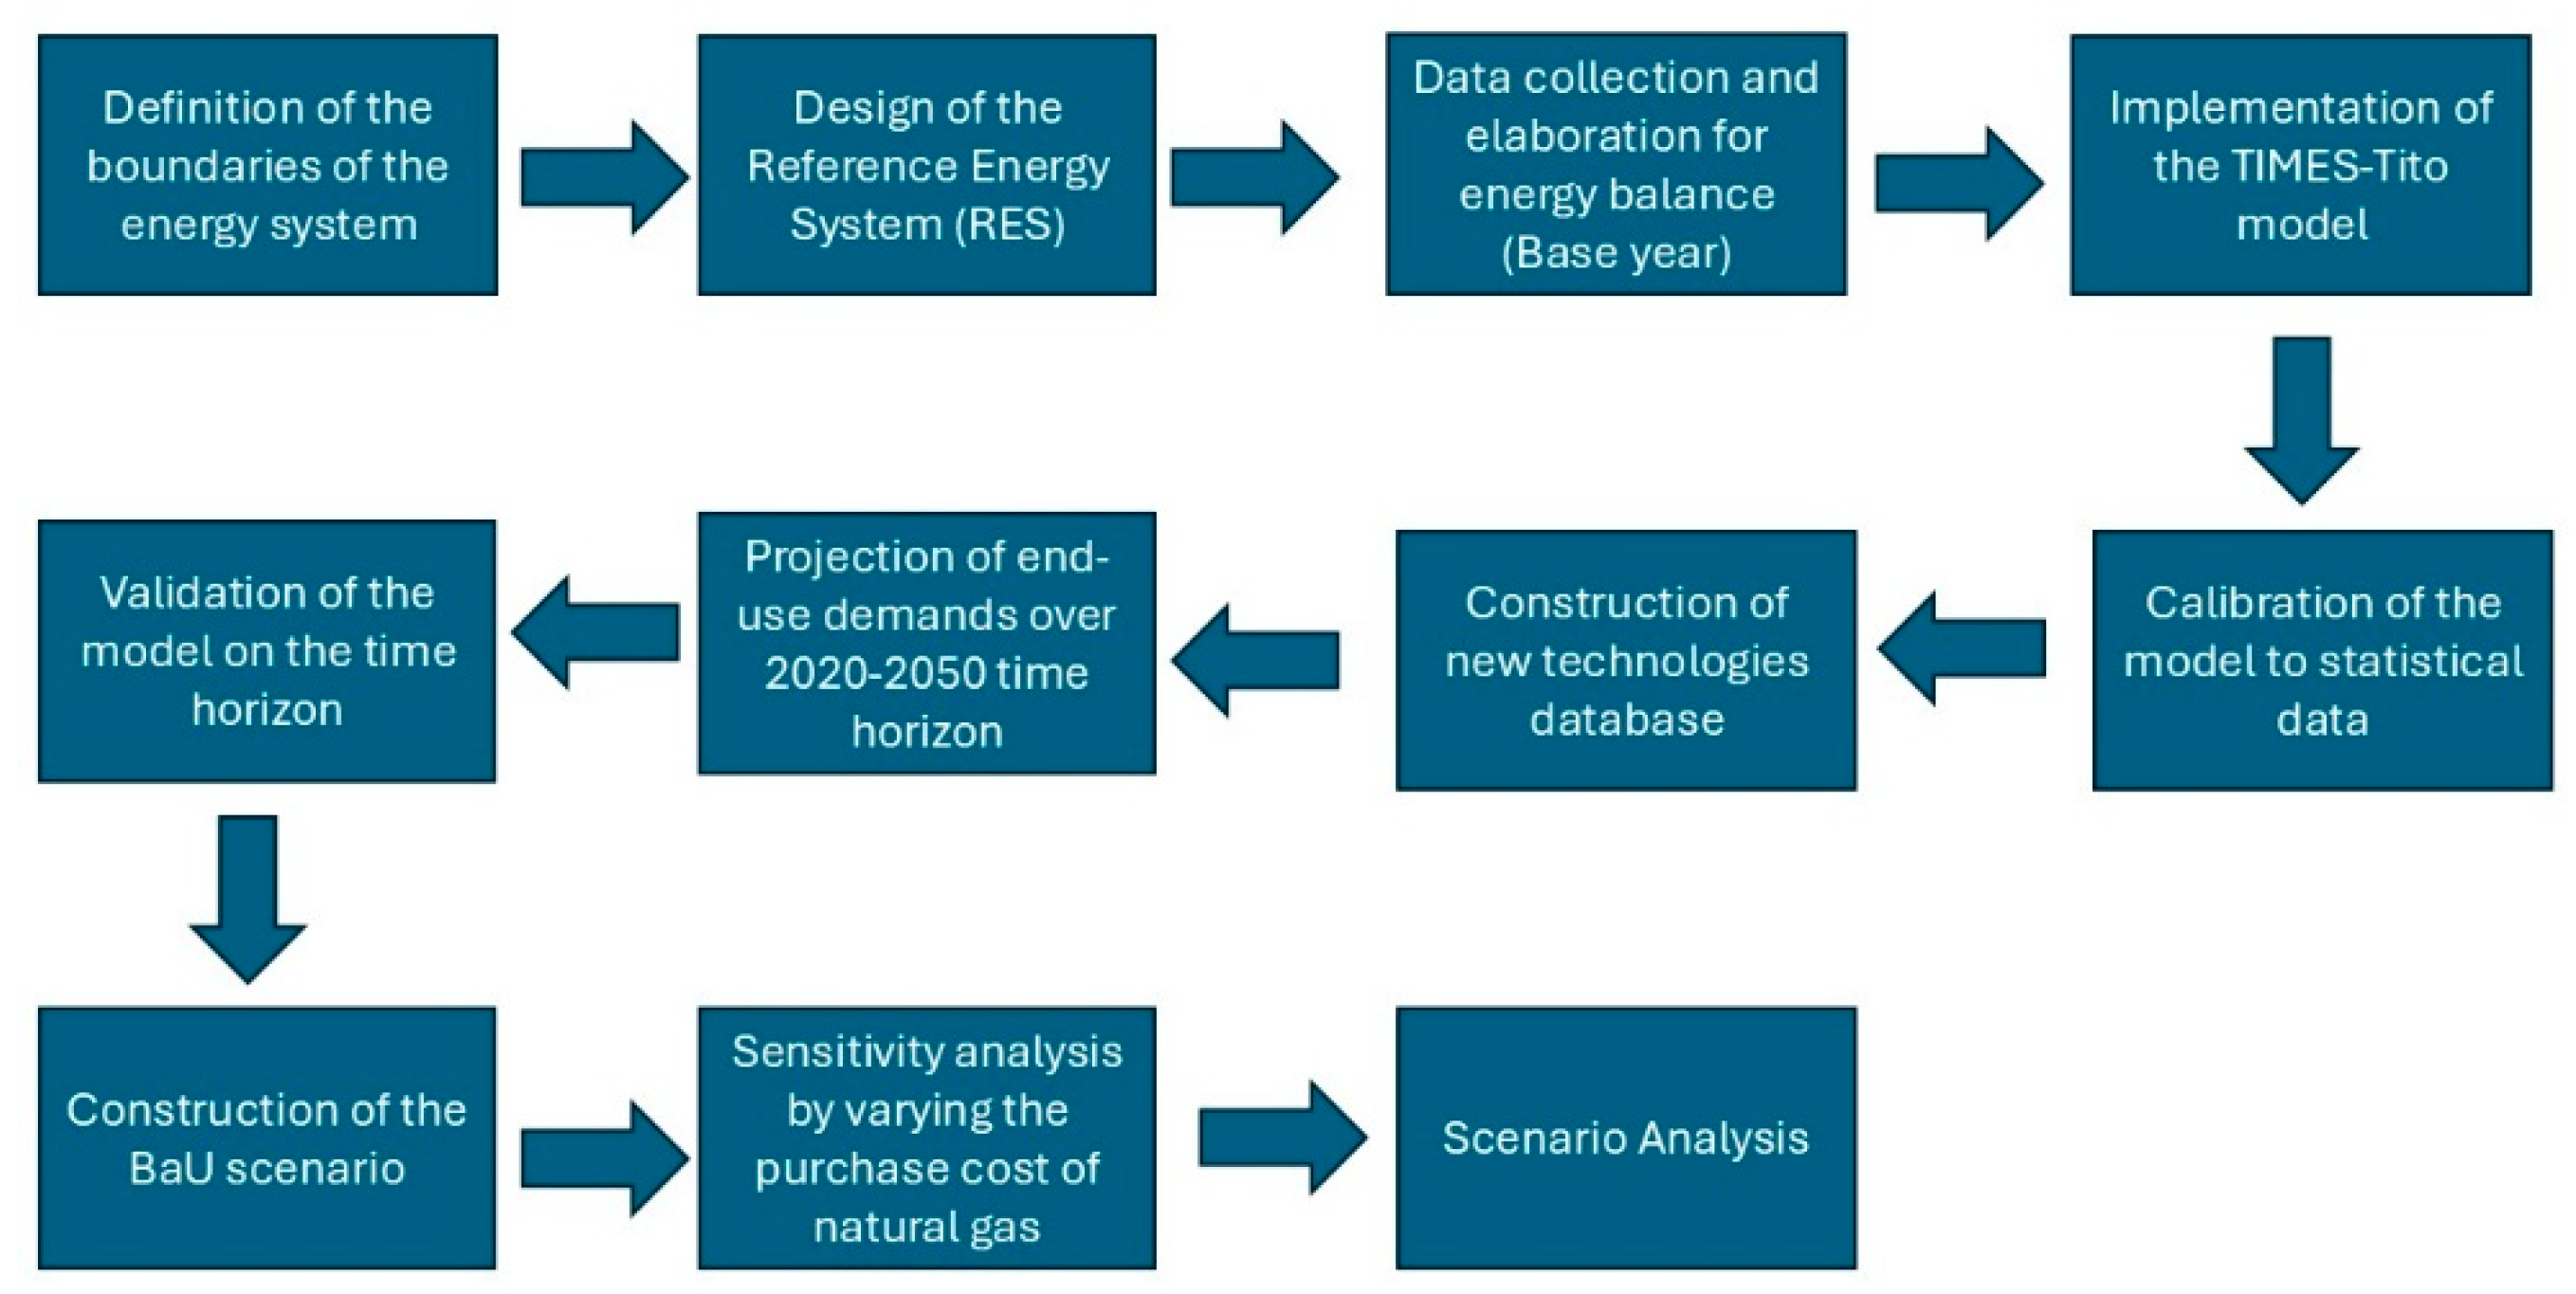
Figure 2.
RES of the supply sector.
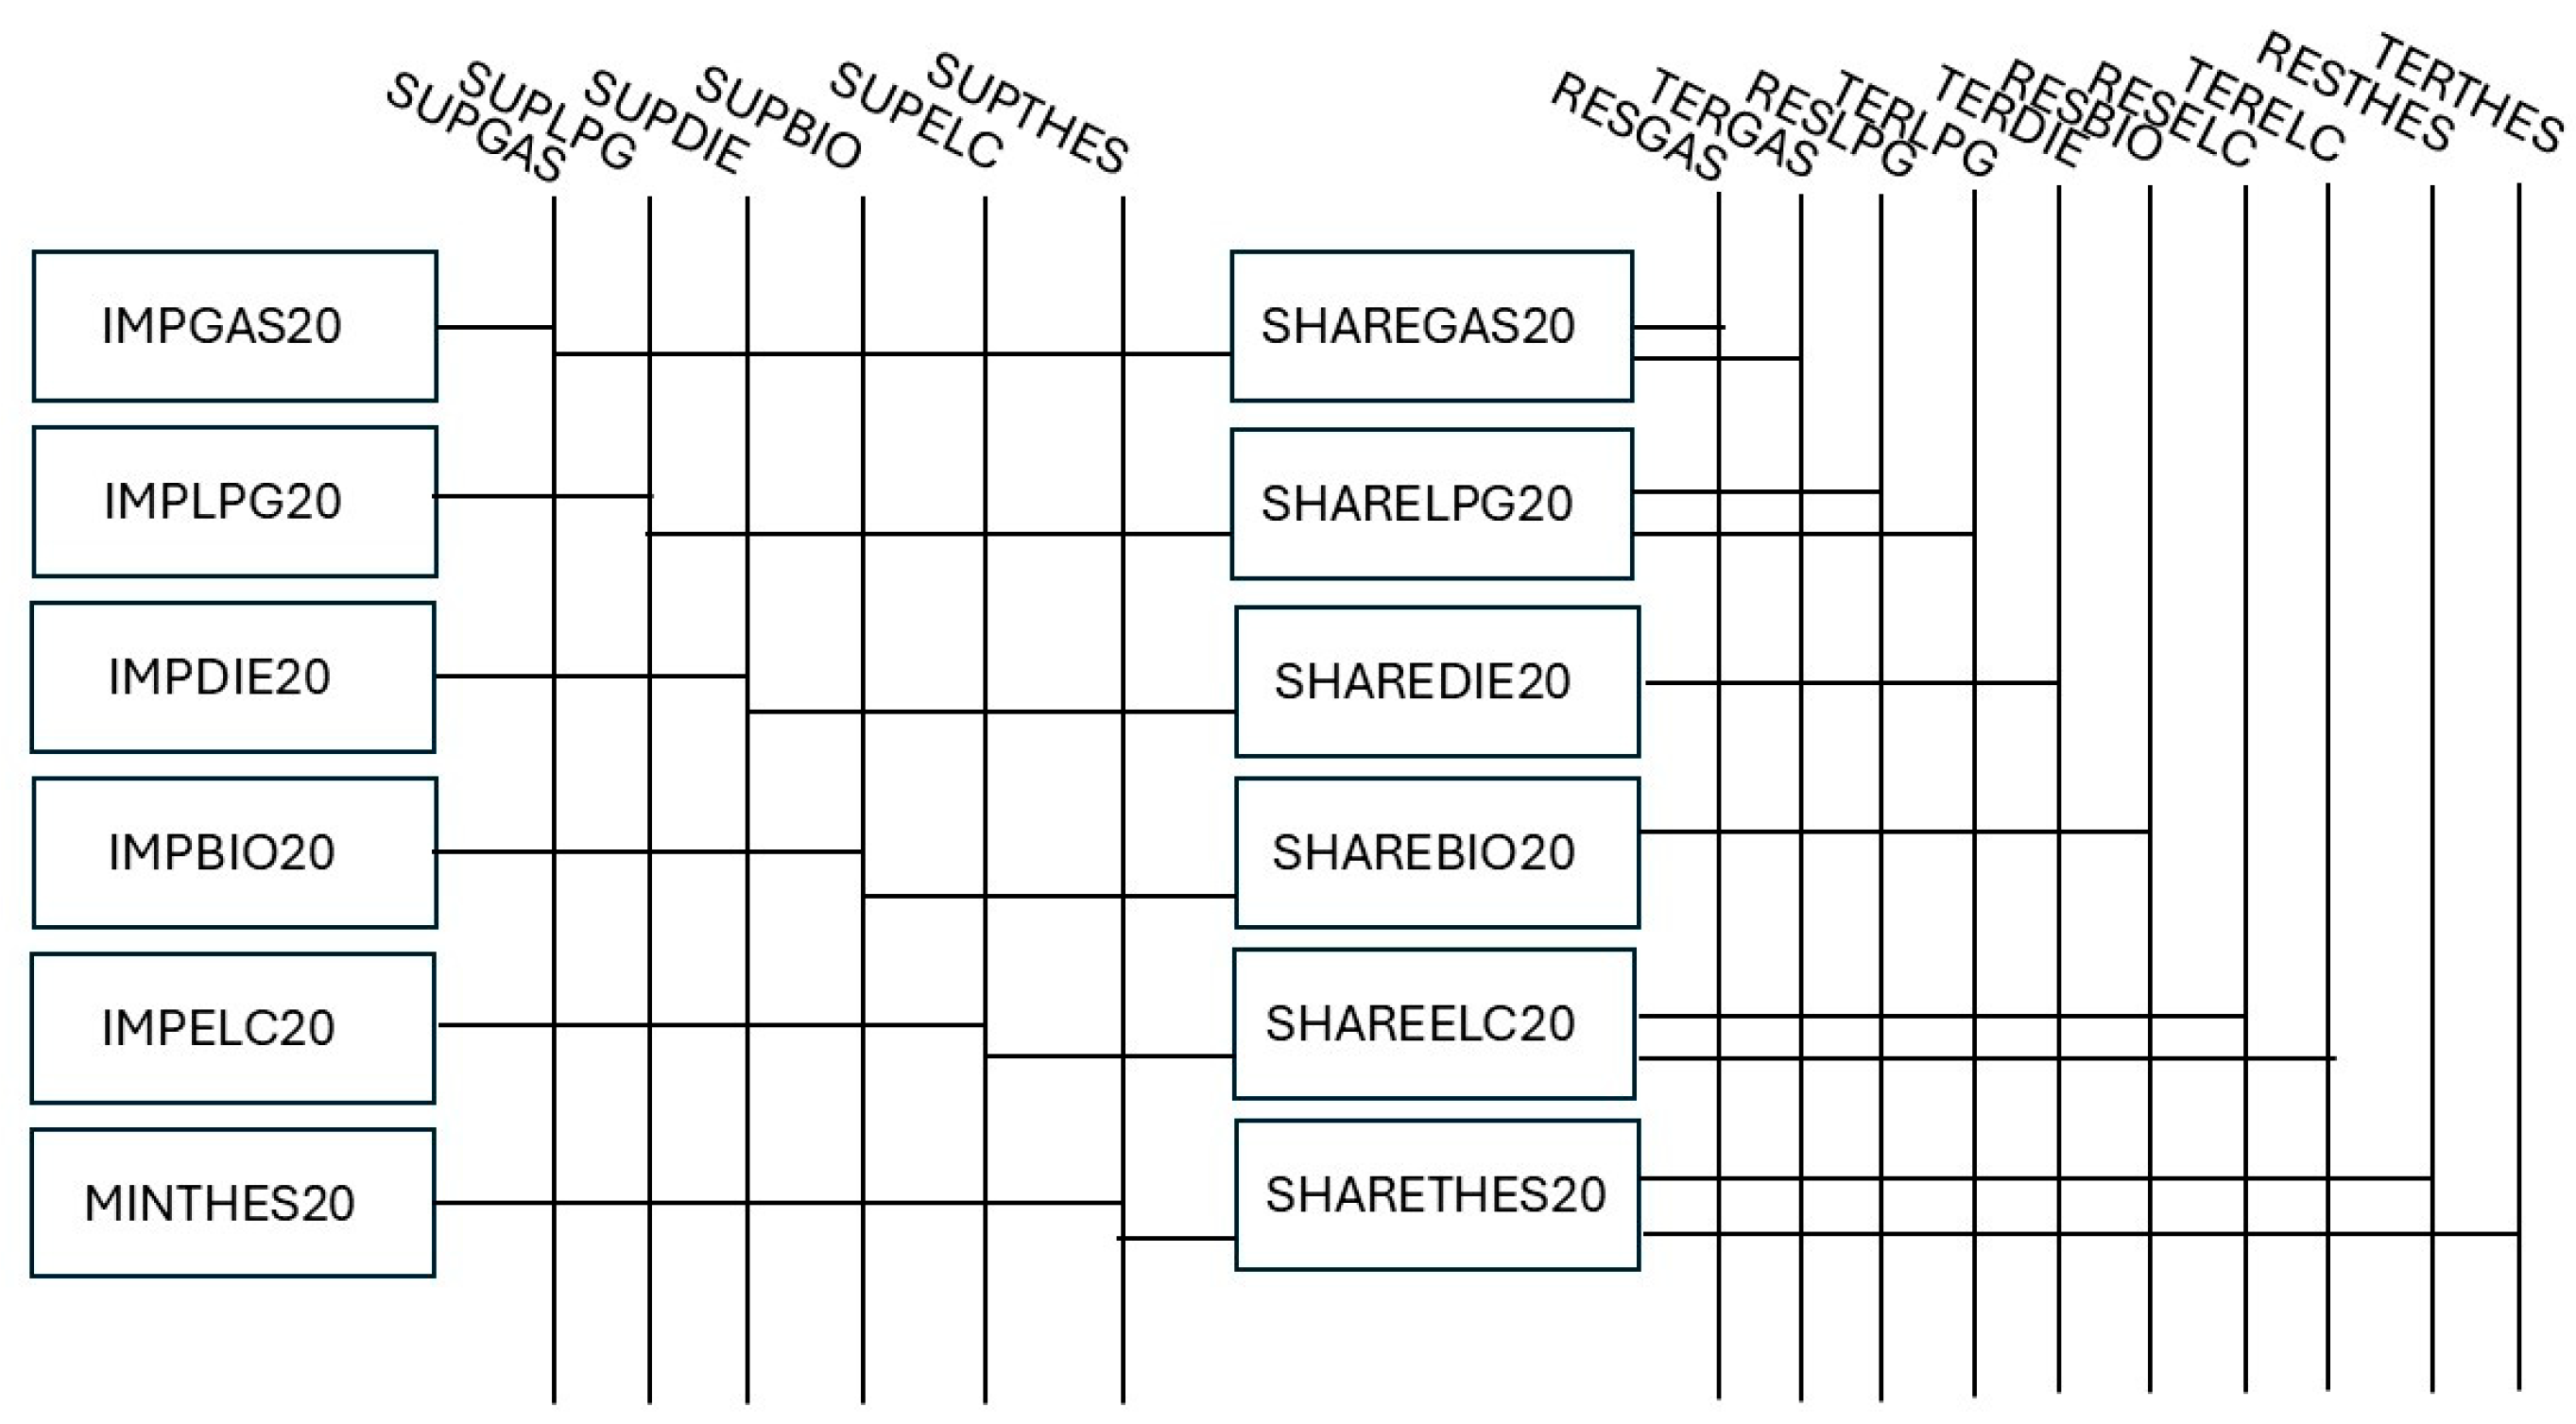
Figure 3.
RES of electricity production from photovoltaic systems (RES-E).
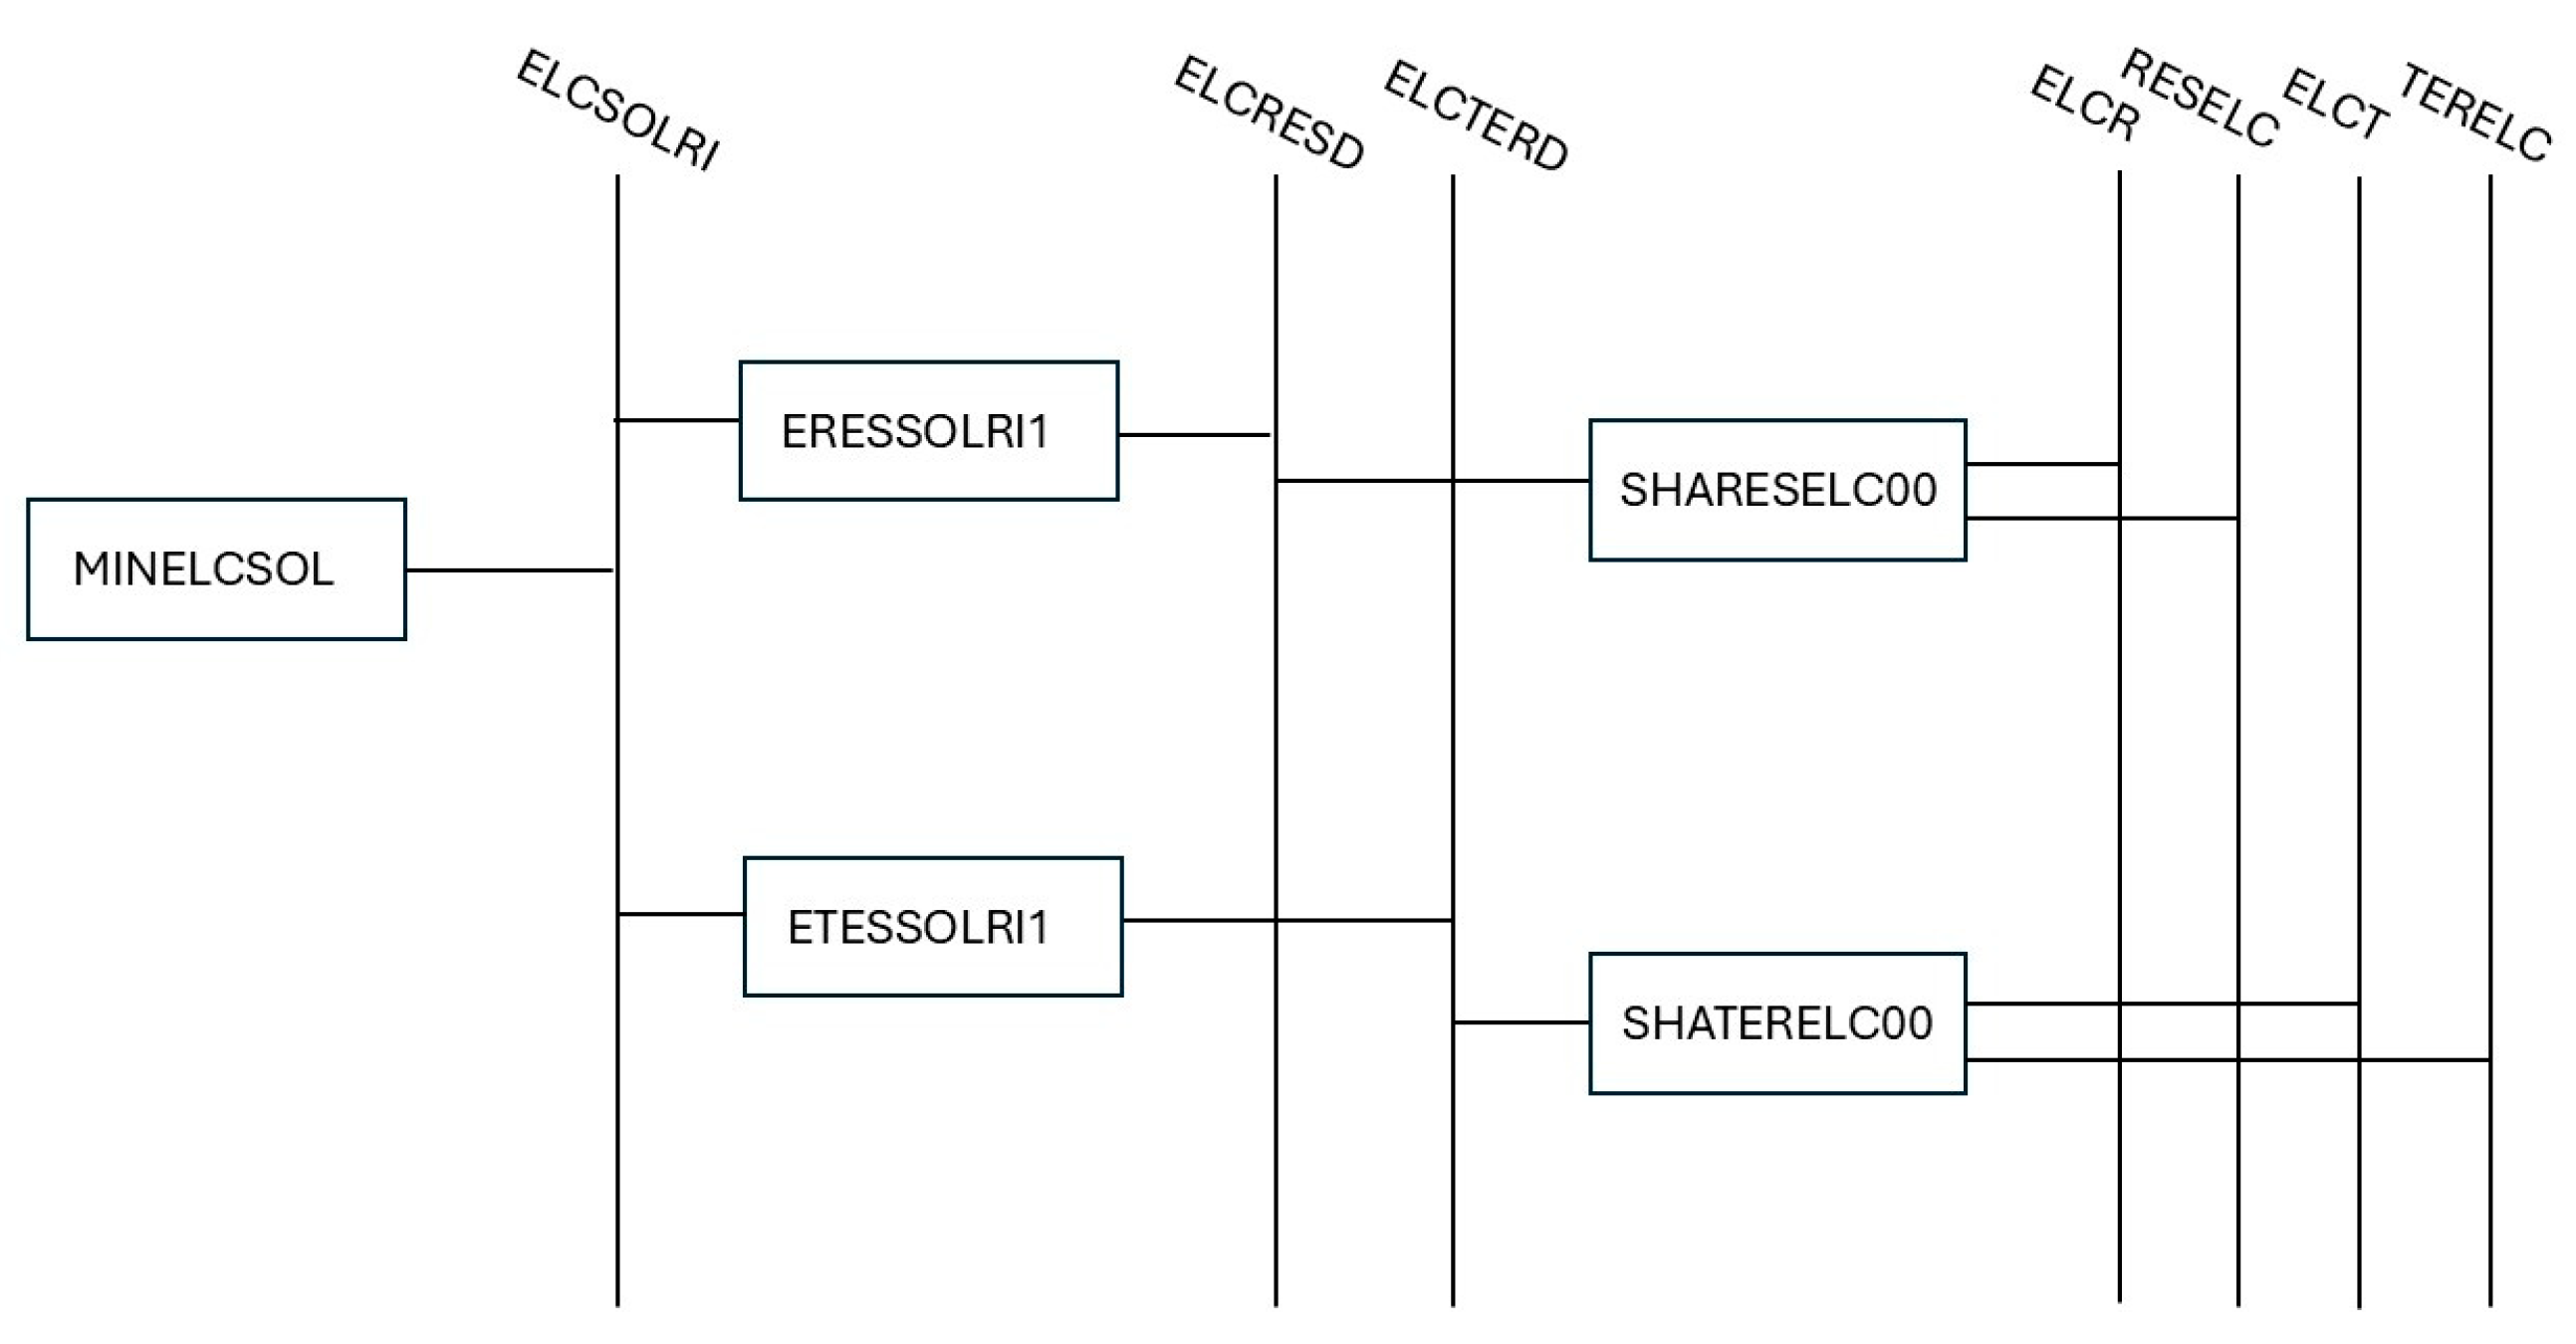
Figure 4.
RES for Space Heating, Water Heating and Space Cooling of the residential sector.
Figure 5.
RES for cooking, lighting and other electrical uses of the residential sector.
Figure 6.
RES of the Food subsector in the tertiary sector.
Figure 7.
TIMES-TITO energy model structure.
Figure 8.
Calculation procedure for residential data.
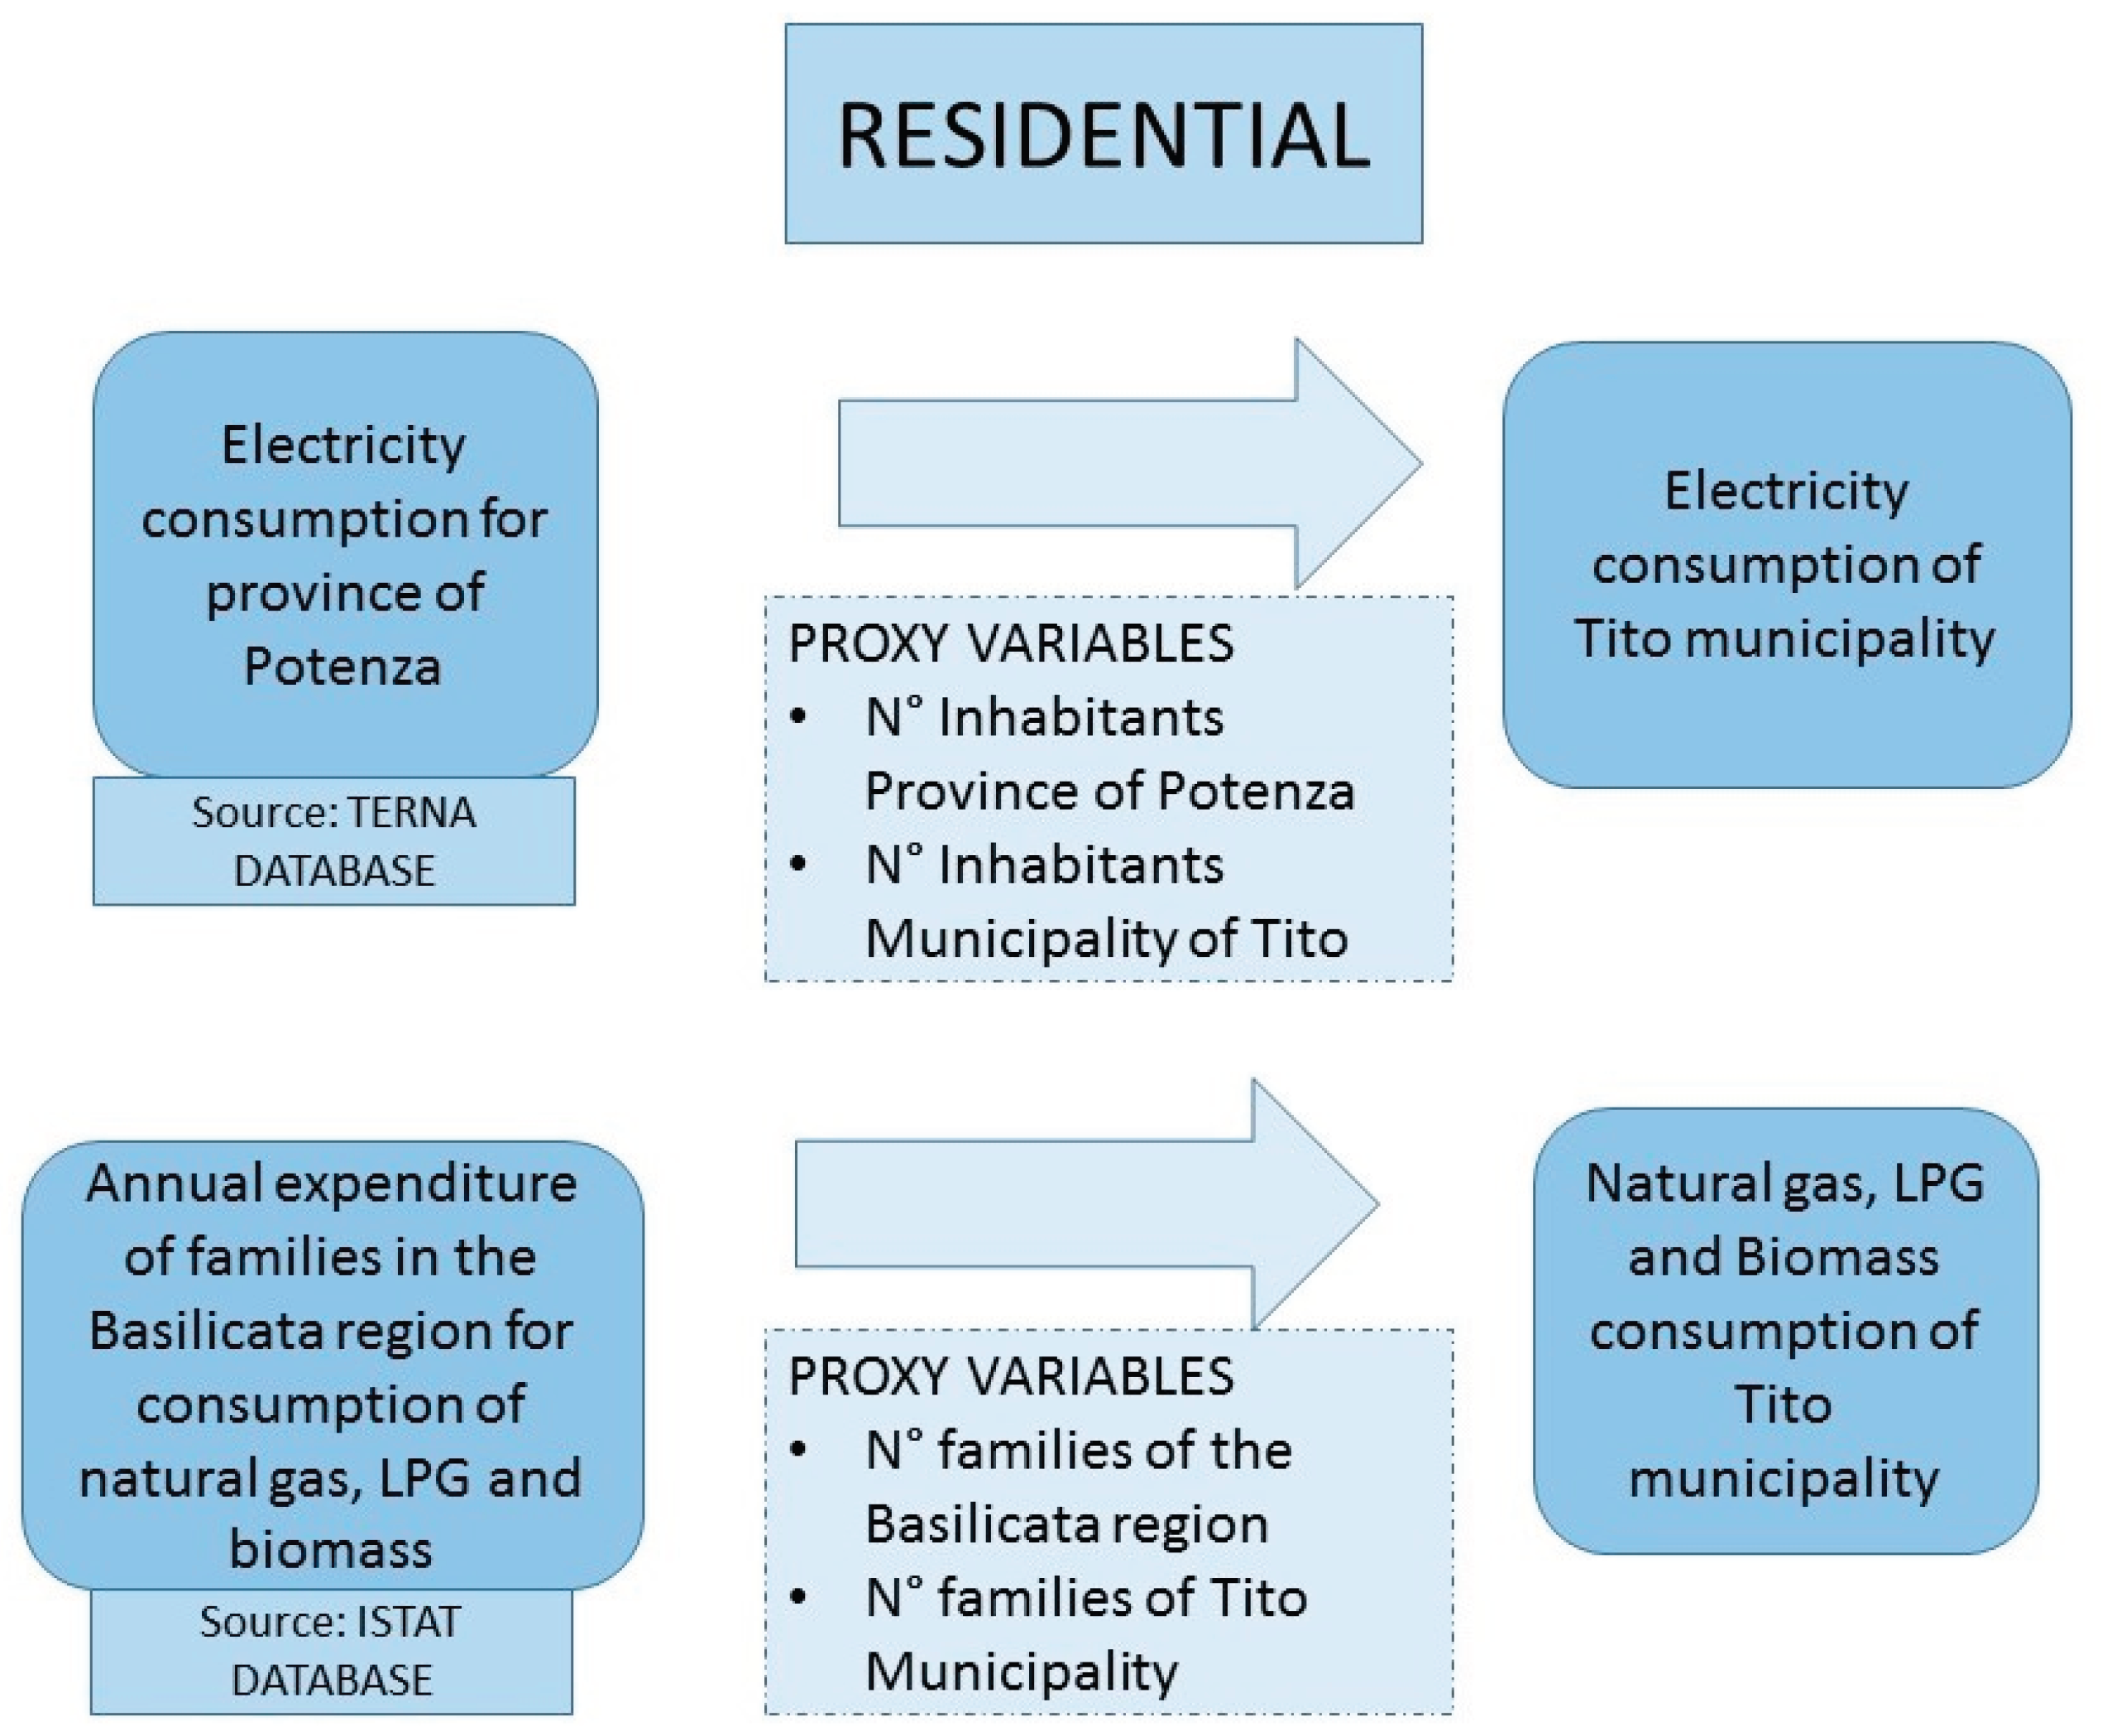
Figure 9.
Electricity production from PV (PJ).
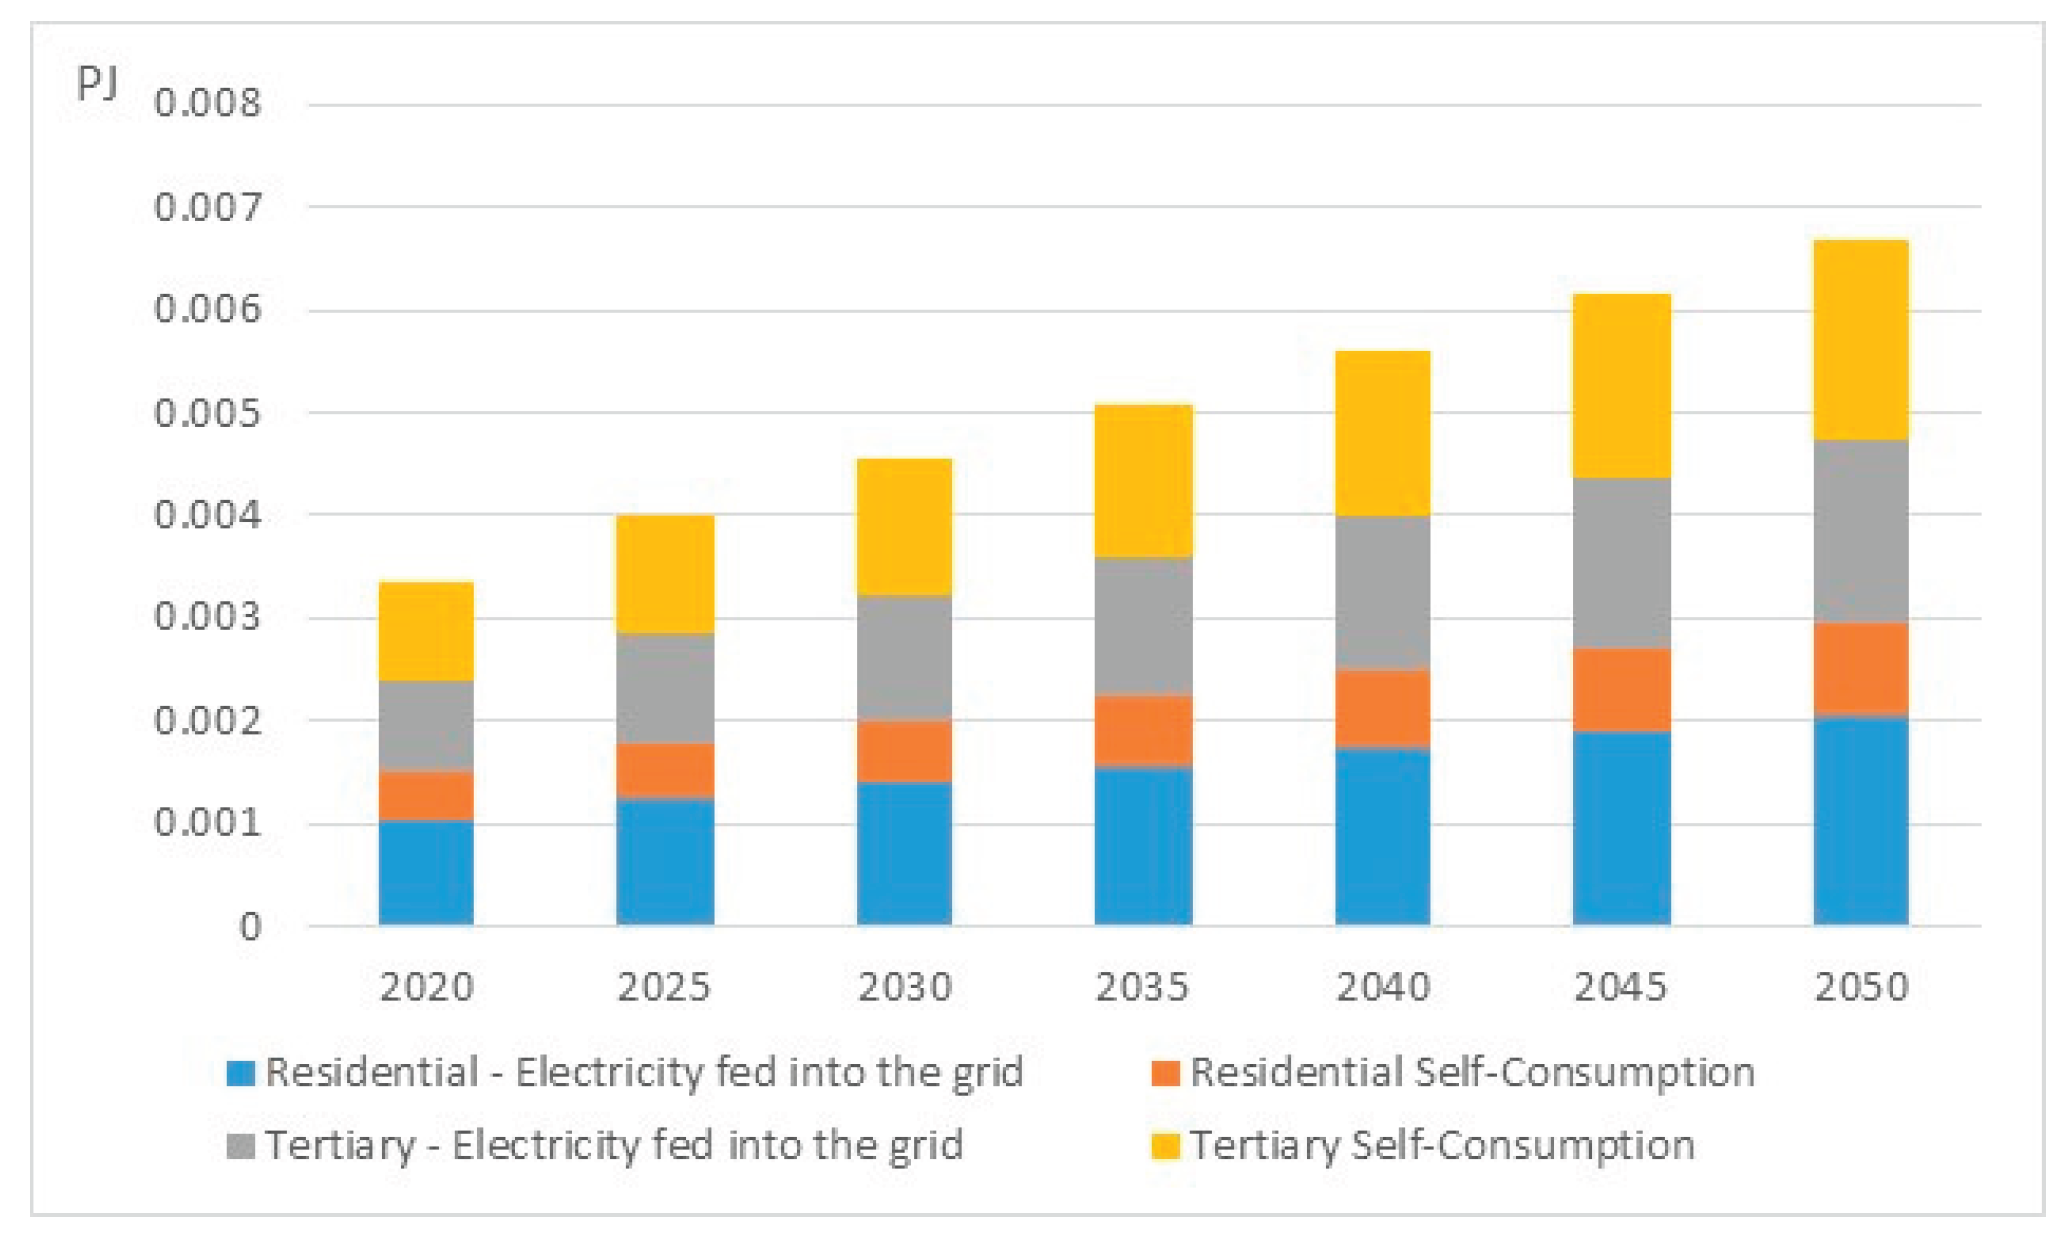
Figure 10.
Energy supply (PJ).
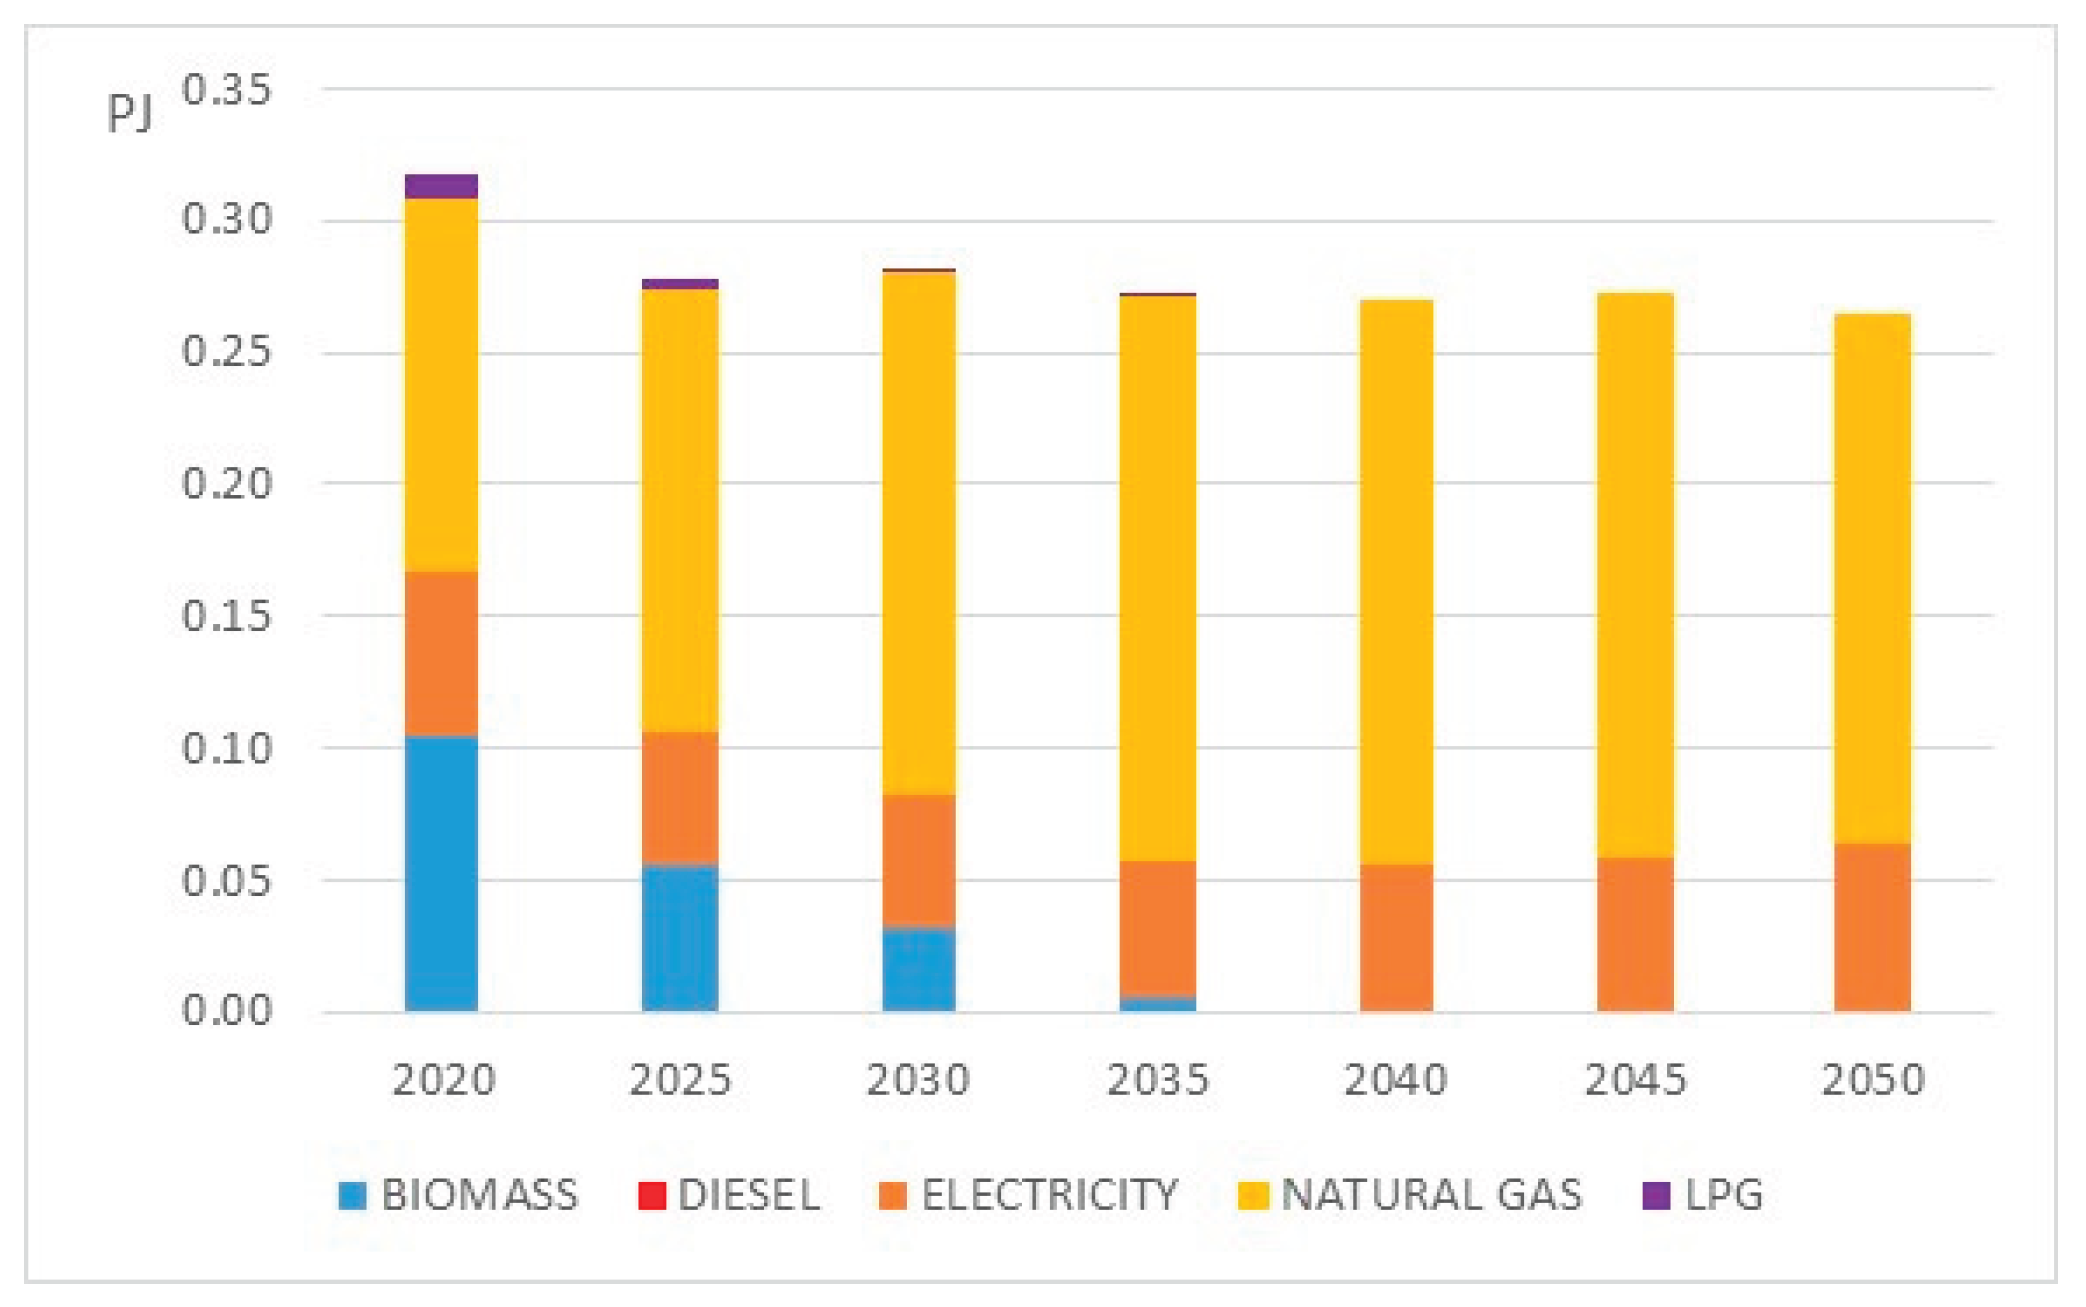
Figure 11.
Total energy consumption (PJ).
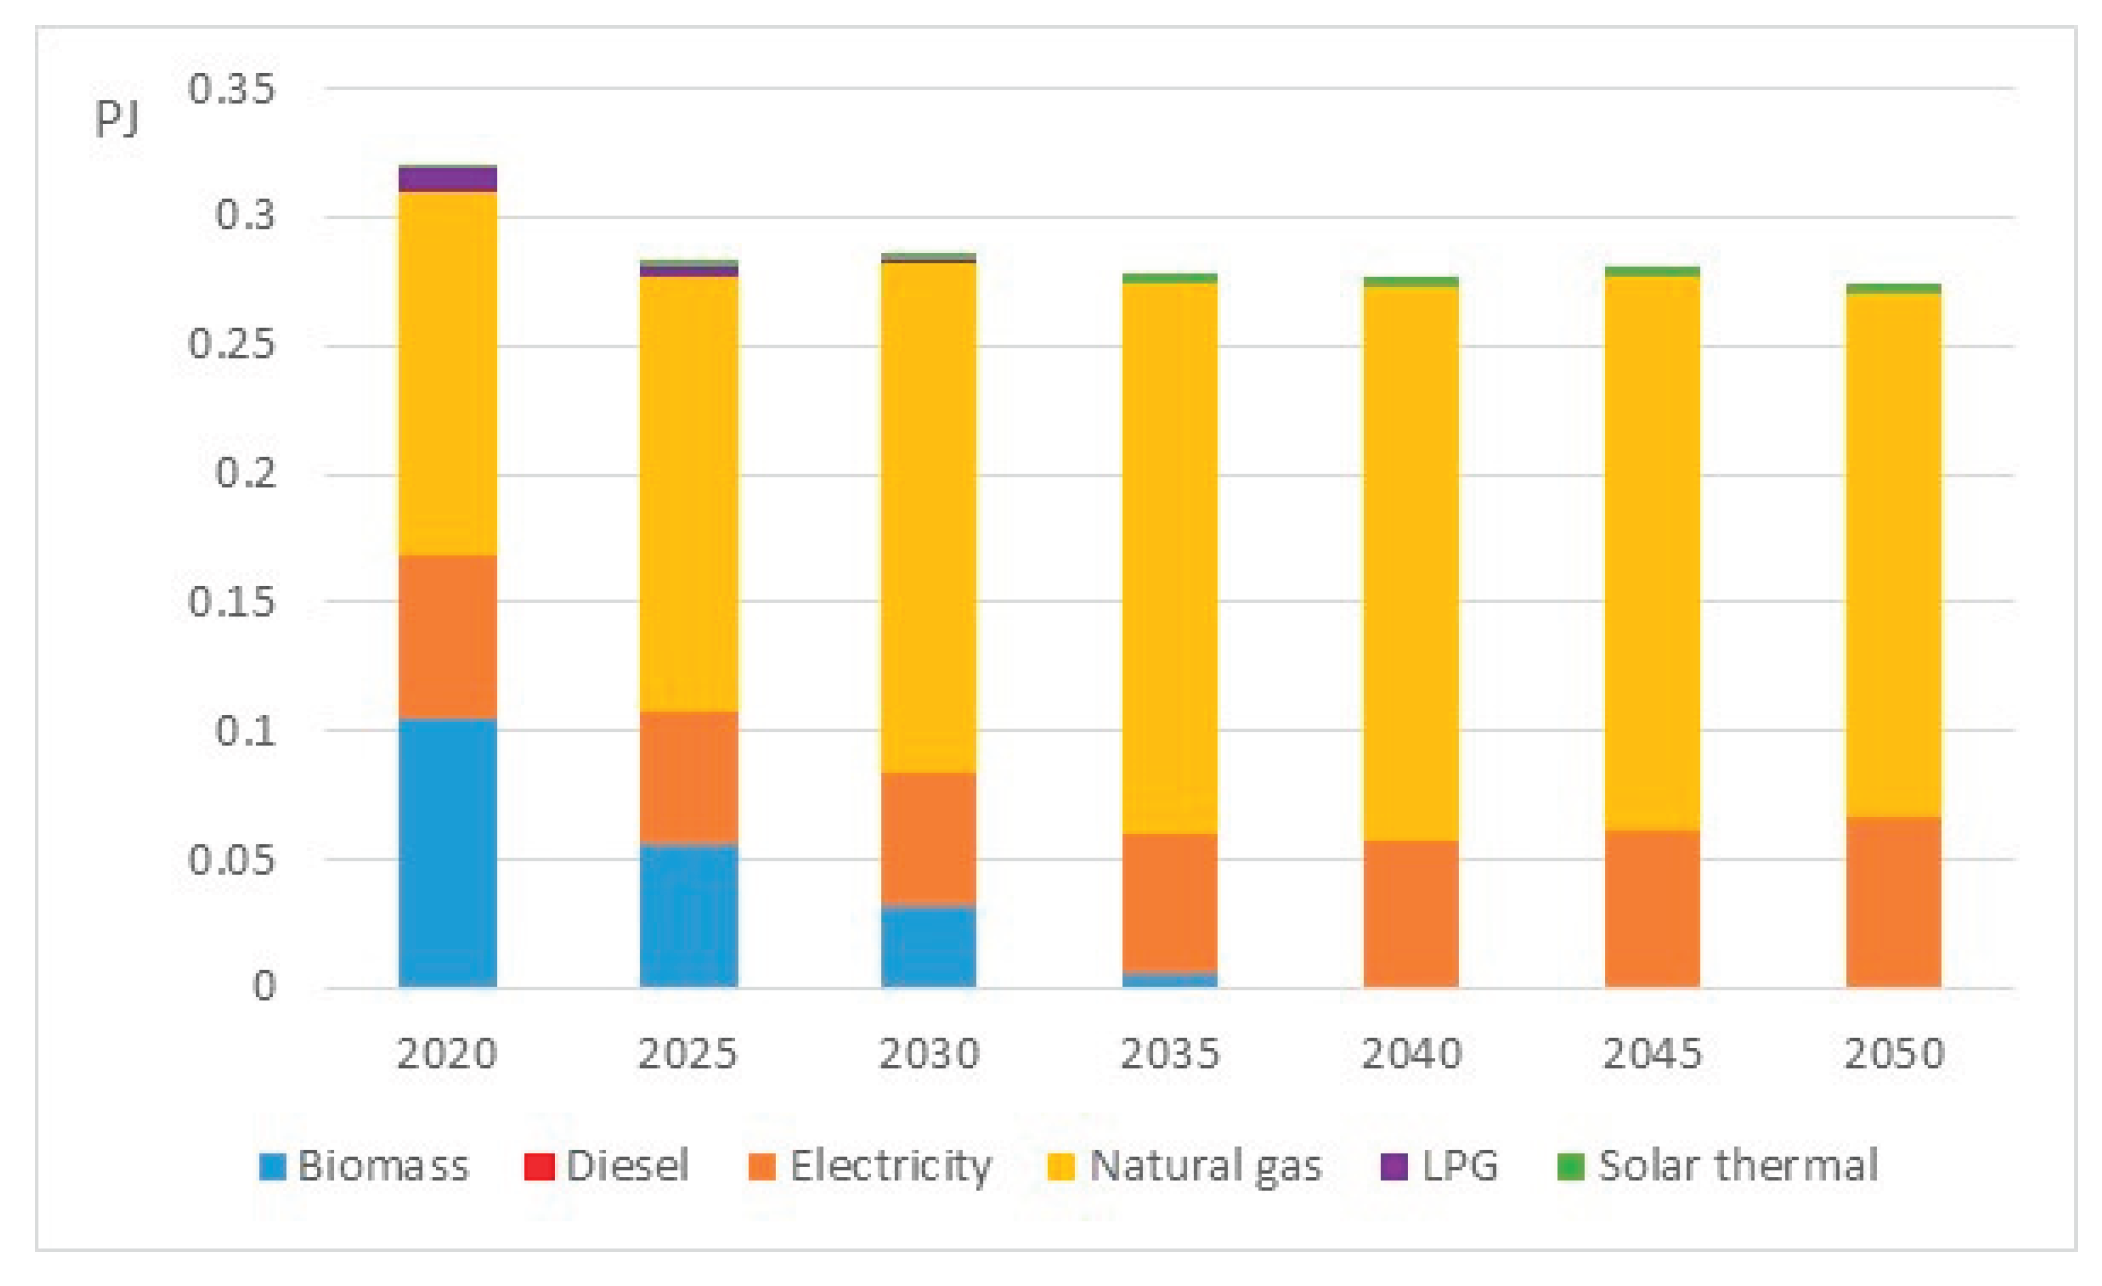
Figure 12.
Total fuel consumption – Residential sector (PJ).
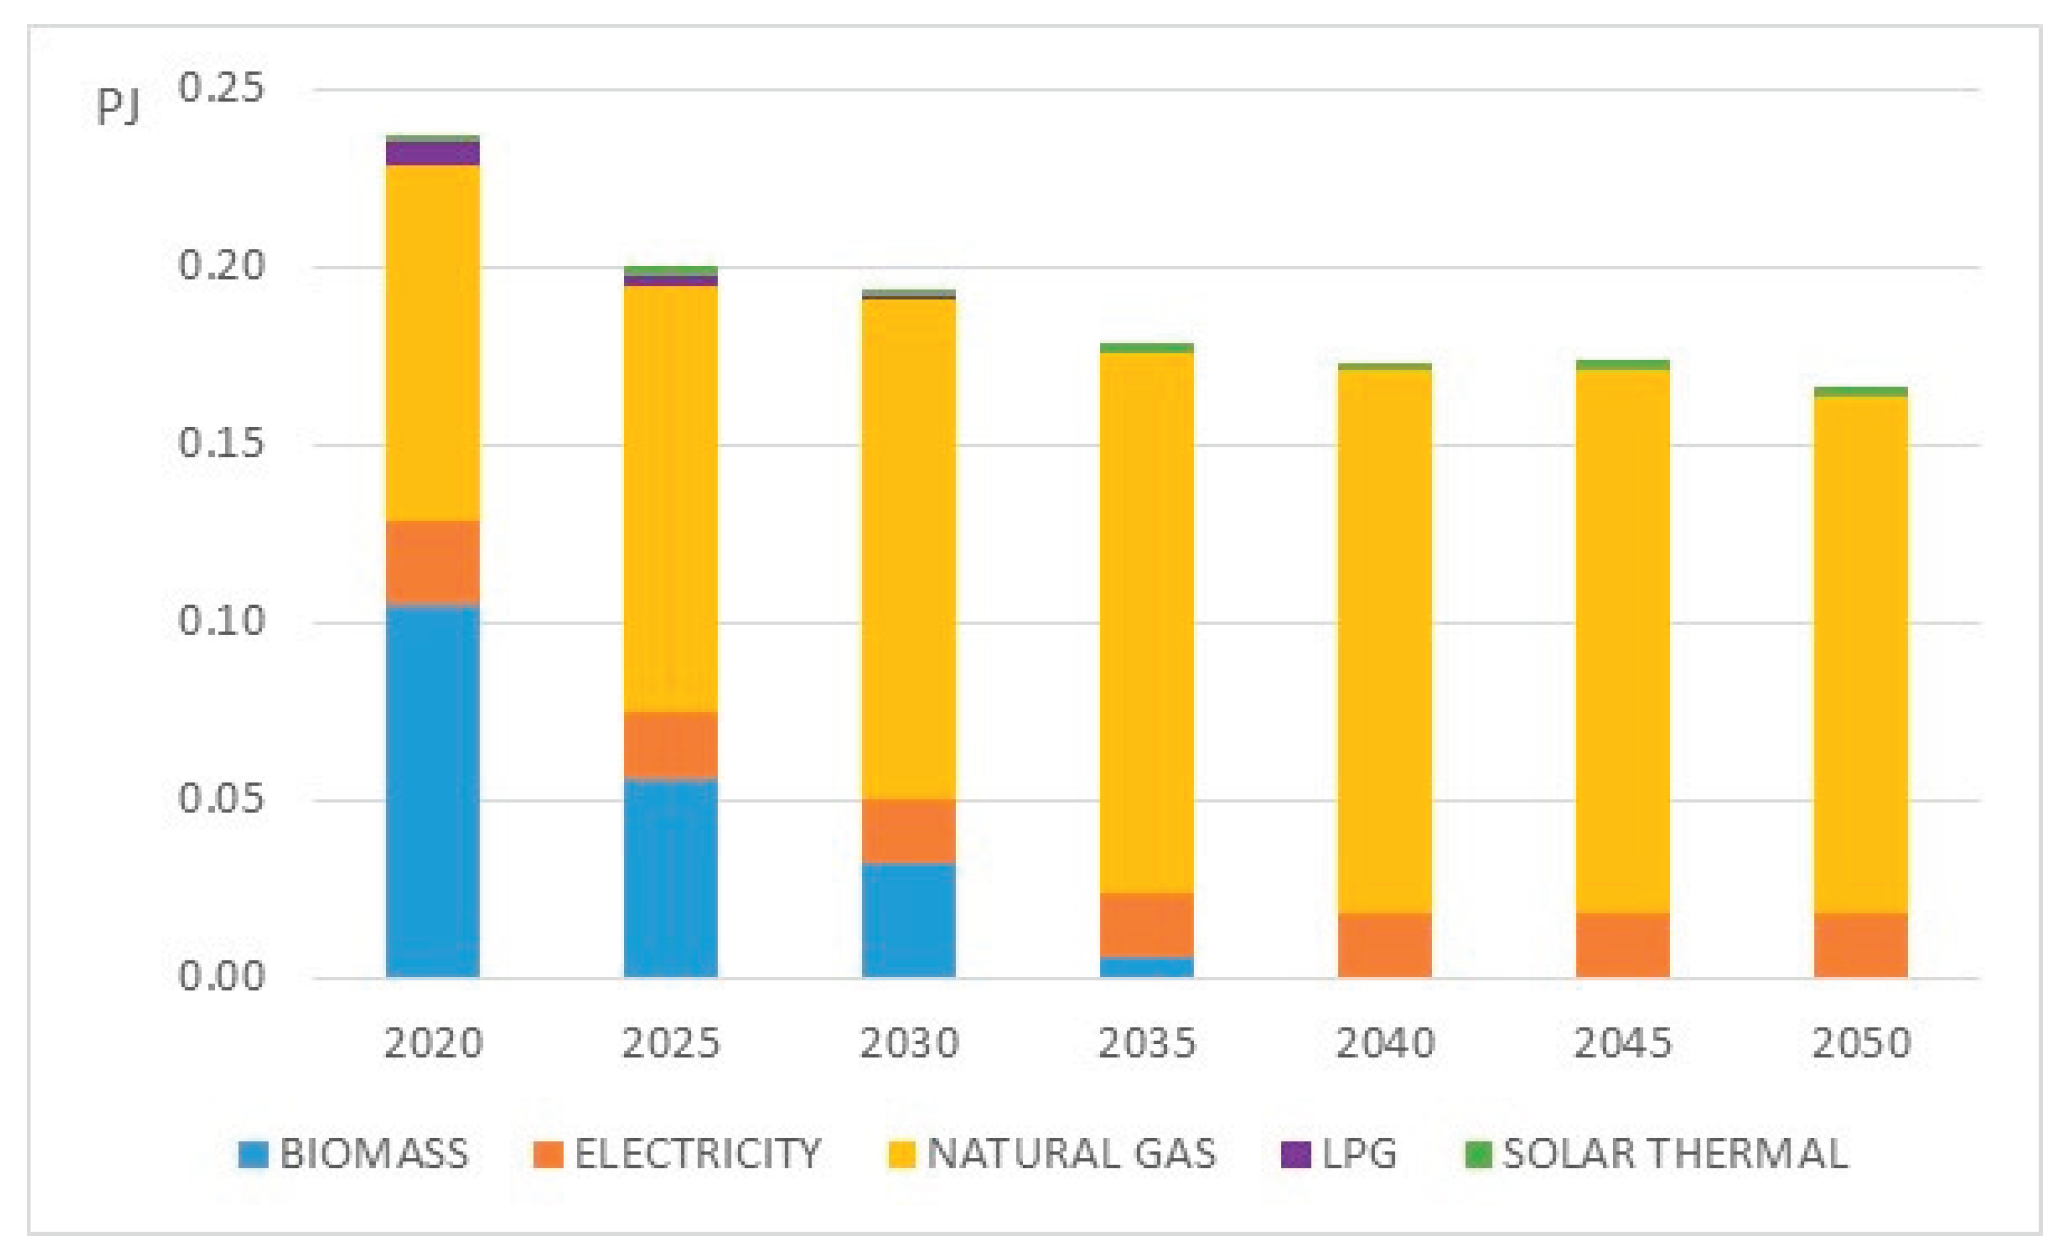
Figure 13.
Space Heating demand – Residential sector (PJ).
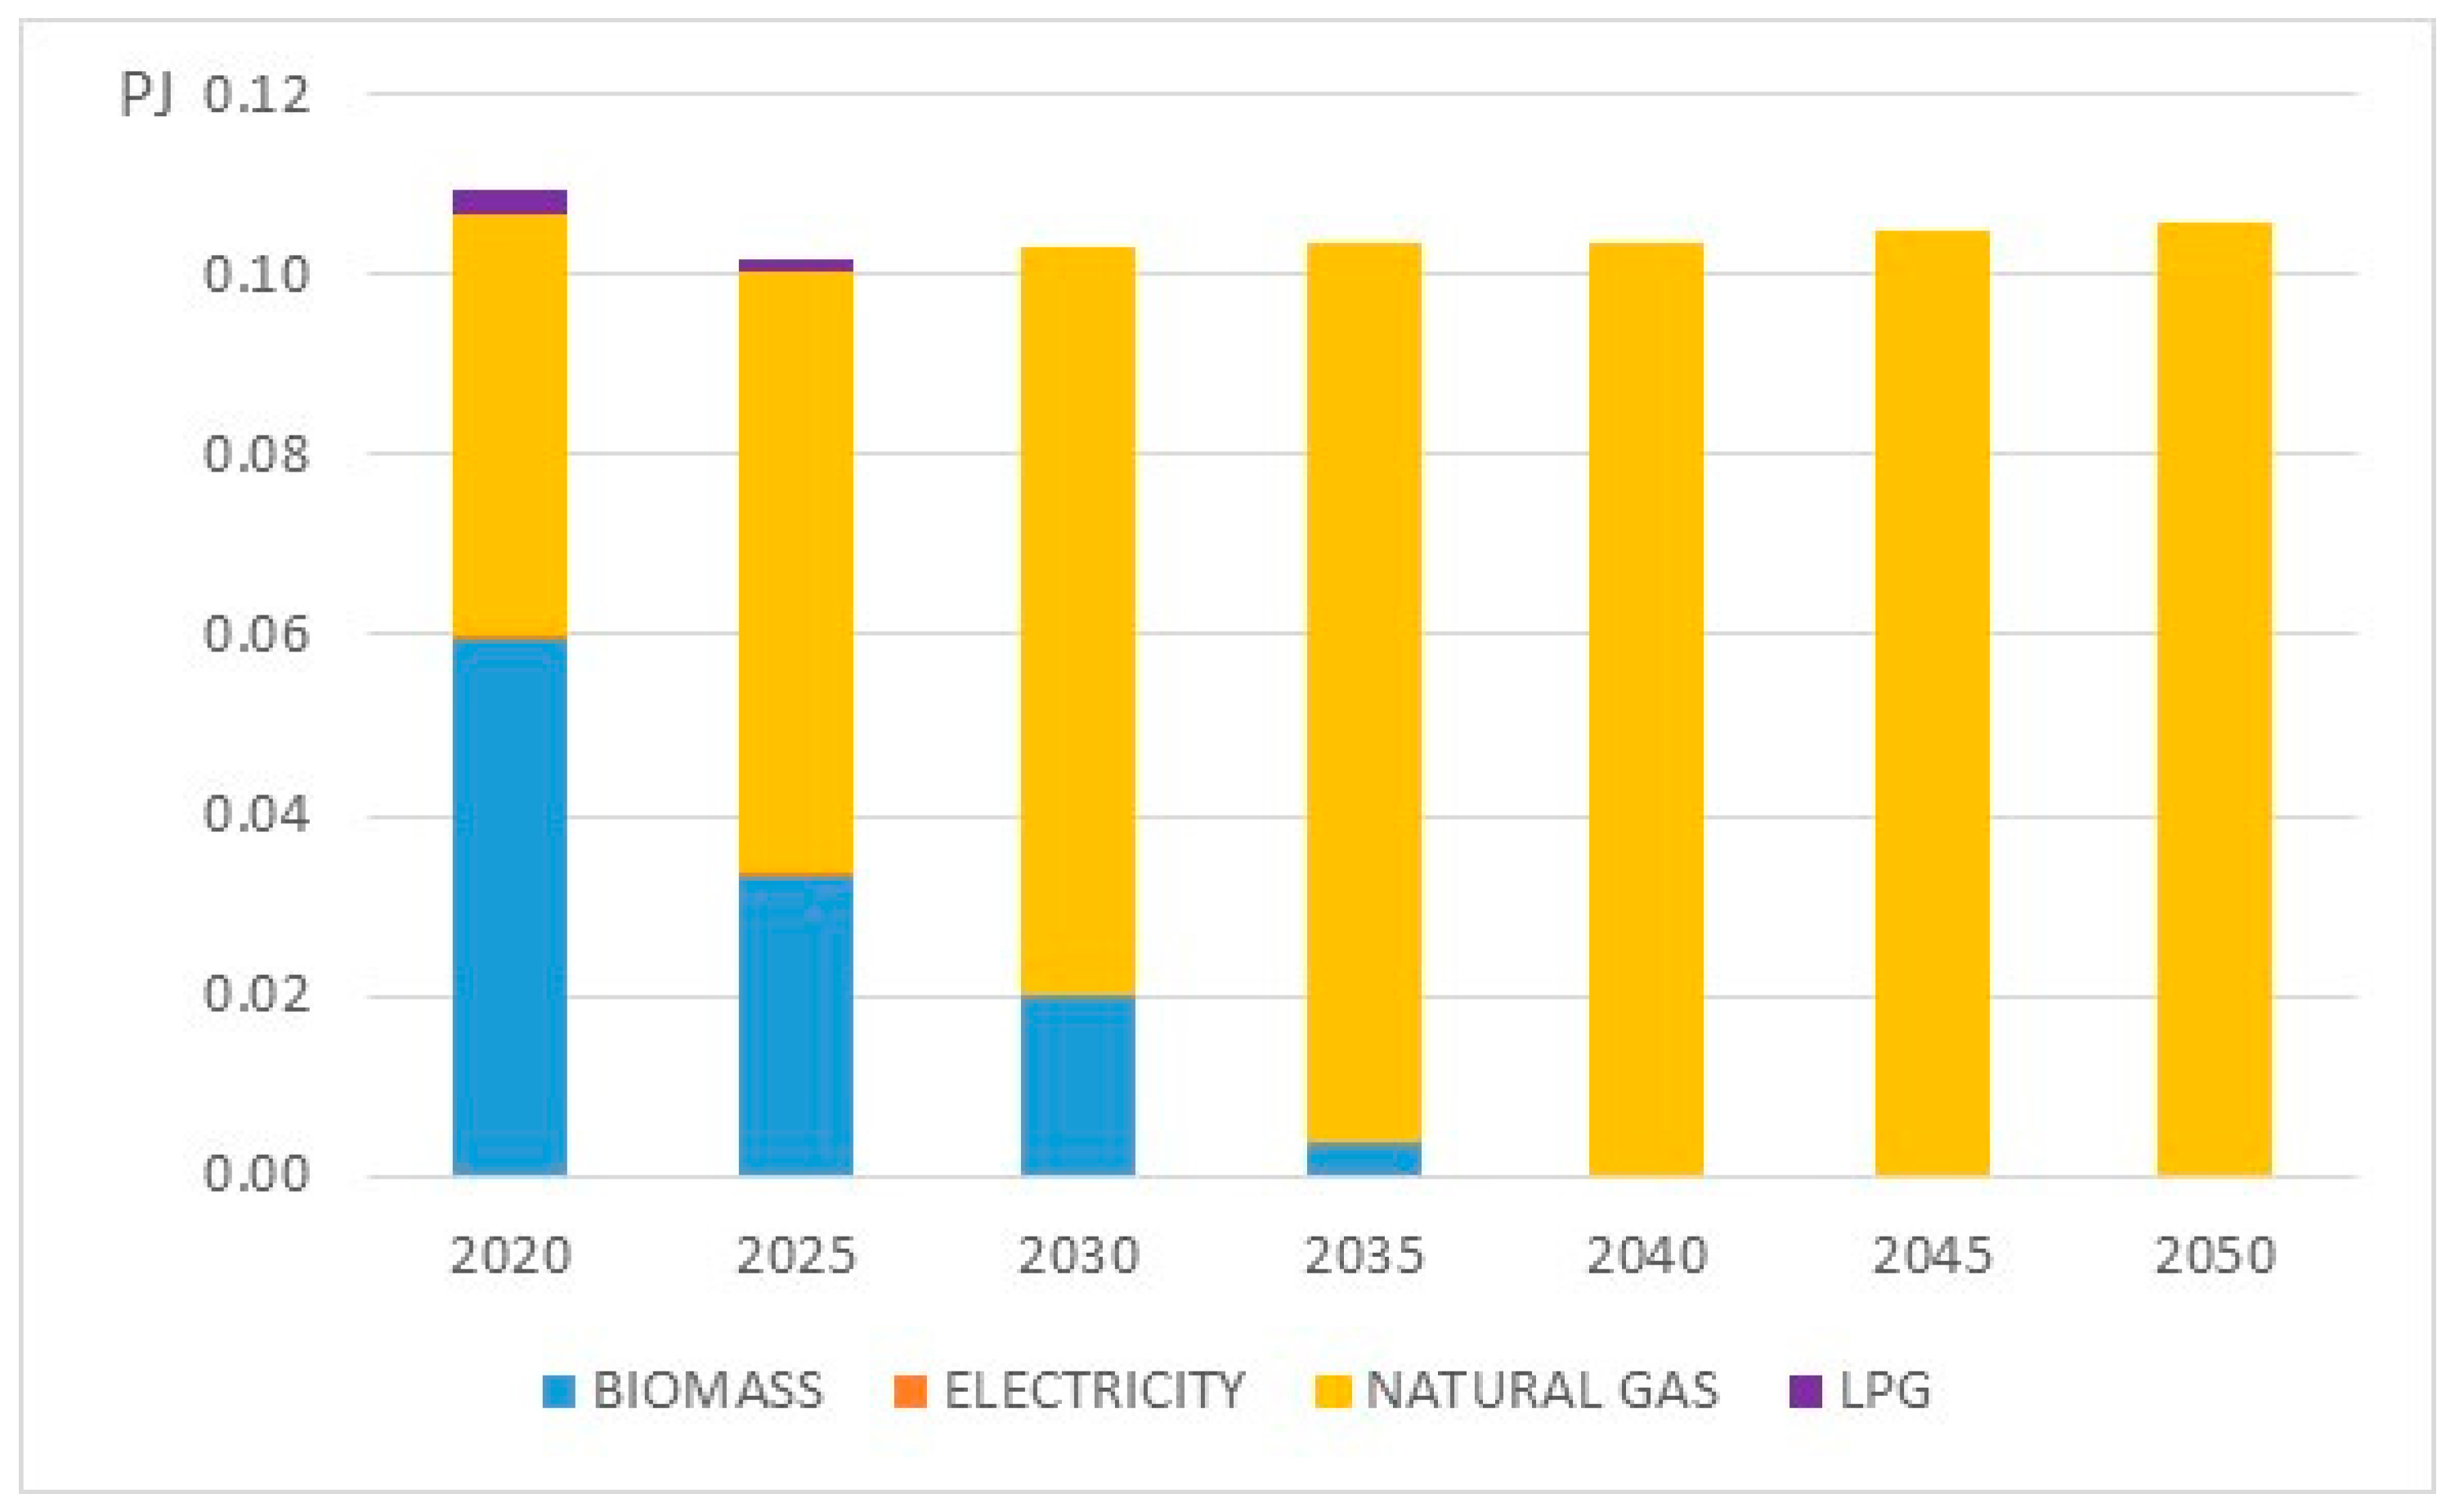
Figure 14.
Water heating demand – Residential sector (PJ).
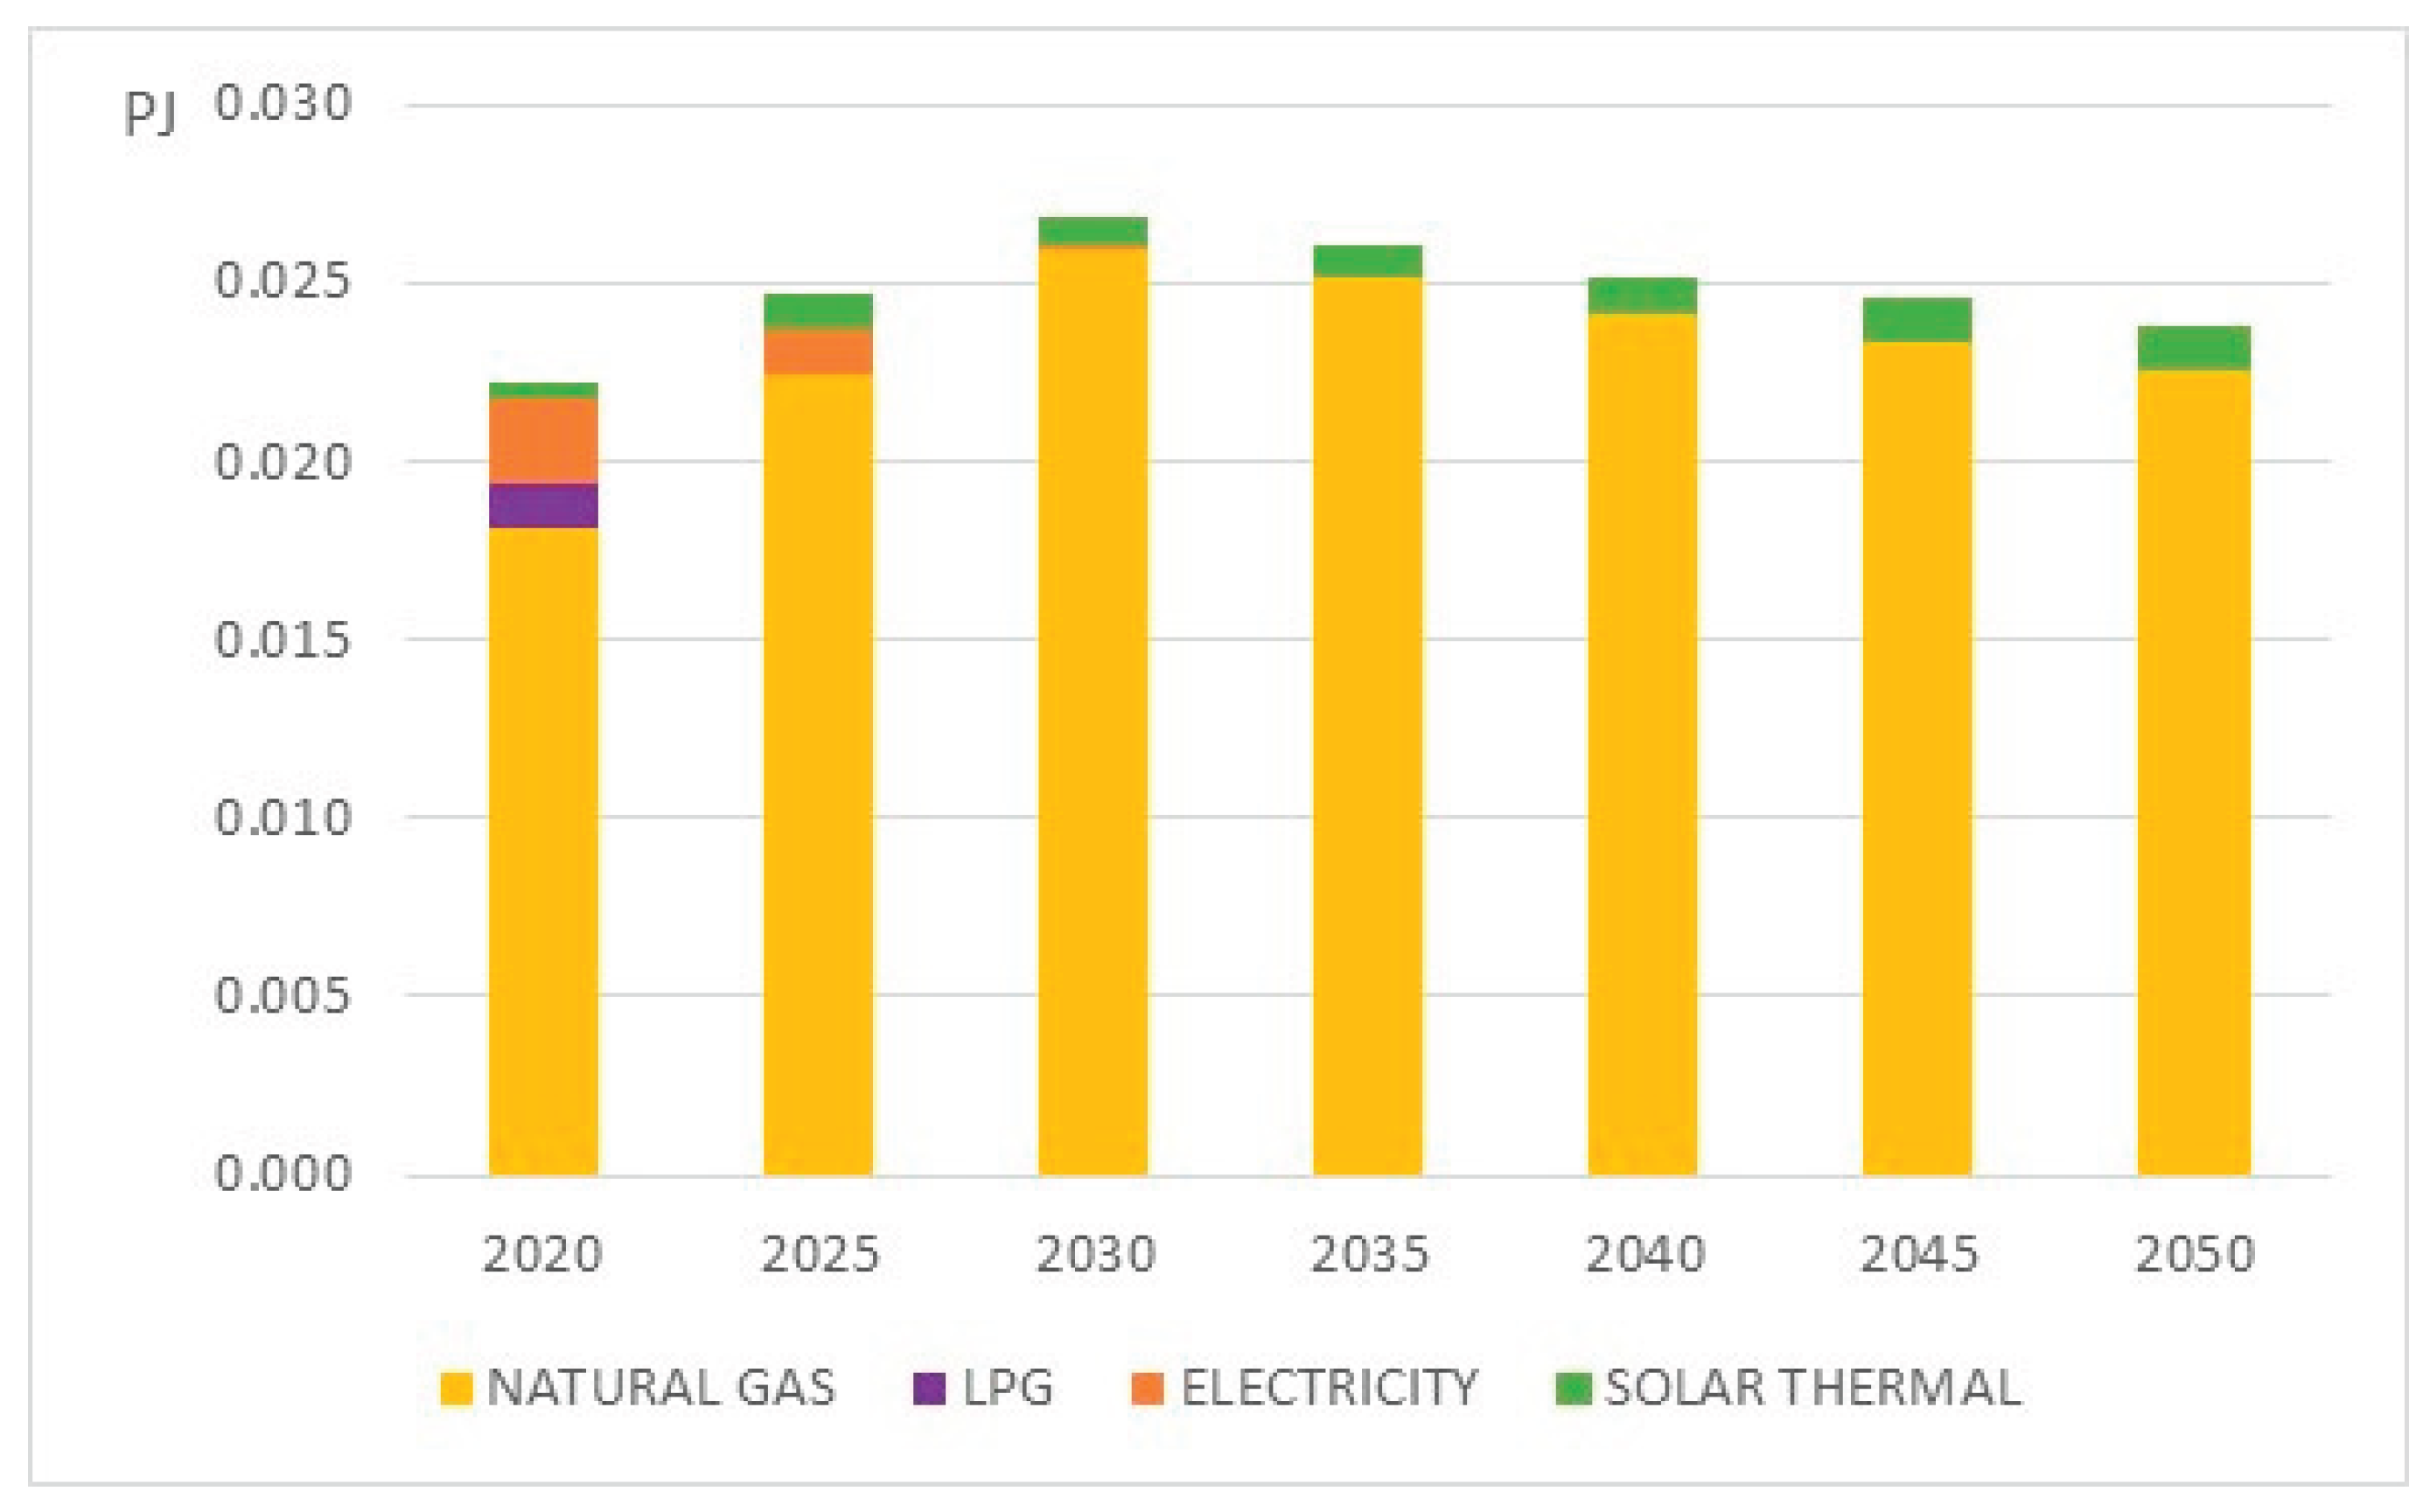
Figure 16.
Electricity consumption for space cooling, lighting and other electric uses – Residential sector (PJ).
Figure 16.
Electricity consumption for space cooling, lighting and other electric uses – Residential sector (PJ).

Figure 17.
Total fuel consumption – Tertiary sector (PJ).

Figure 18.
Total fuel consumption per subsector– Tertiary sector (PJ).
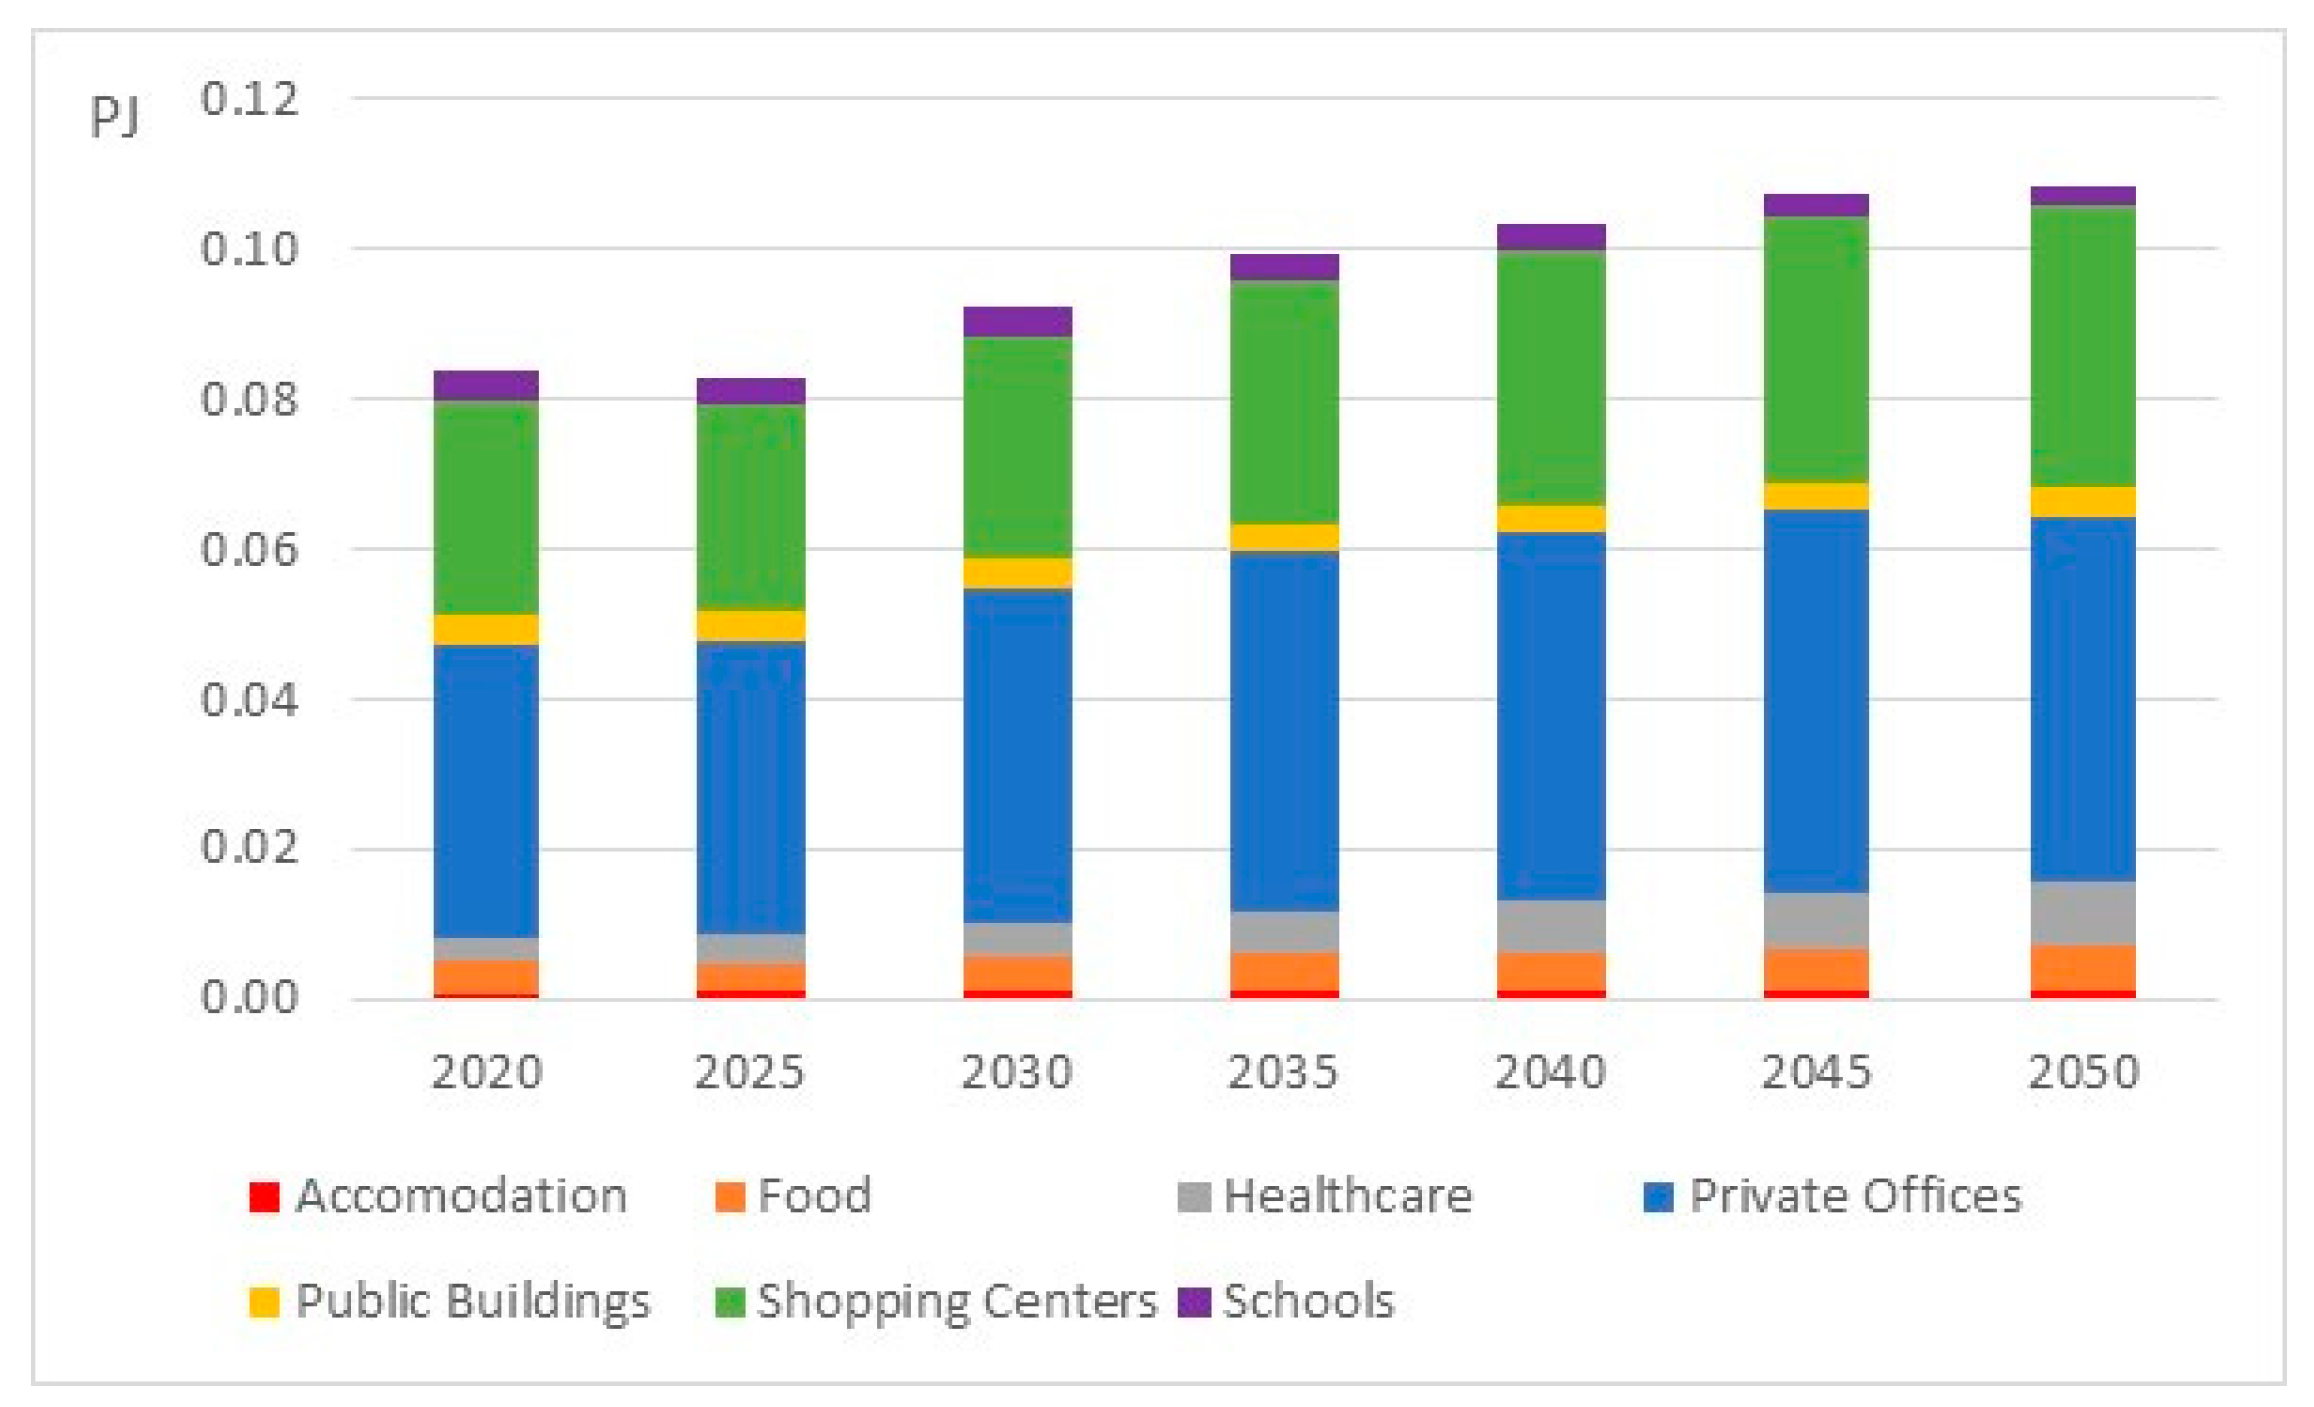
Figure 19.
Natural gas consumption per subsector (PJ).

Figure 20.
Electricity consumption per subsector (PJ).
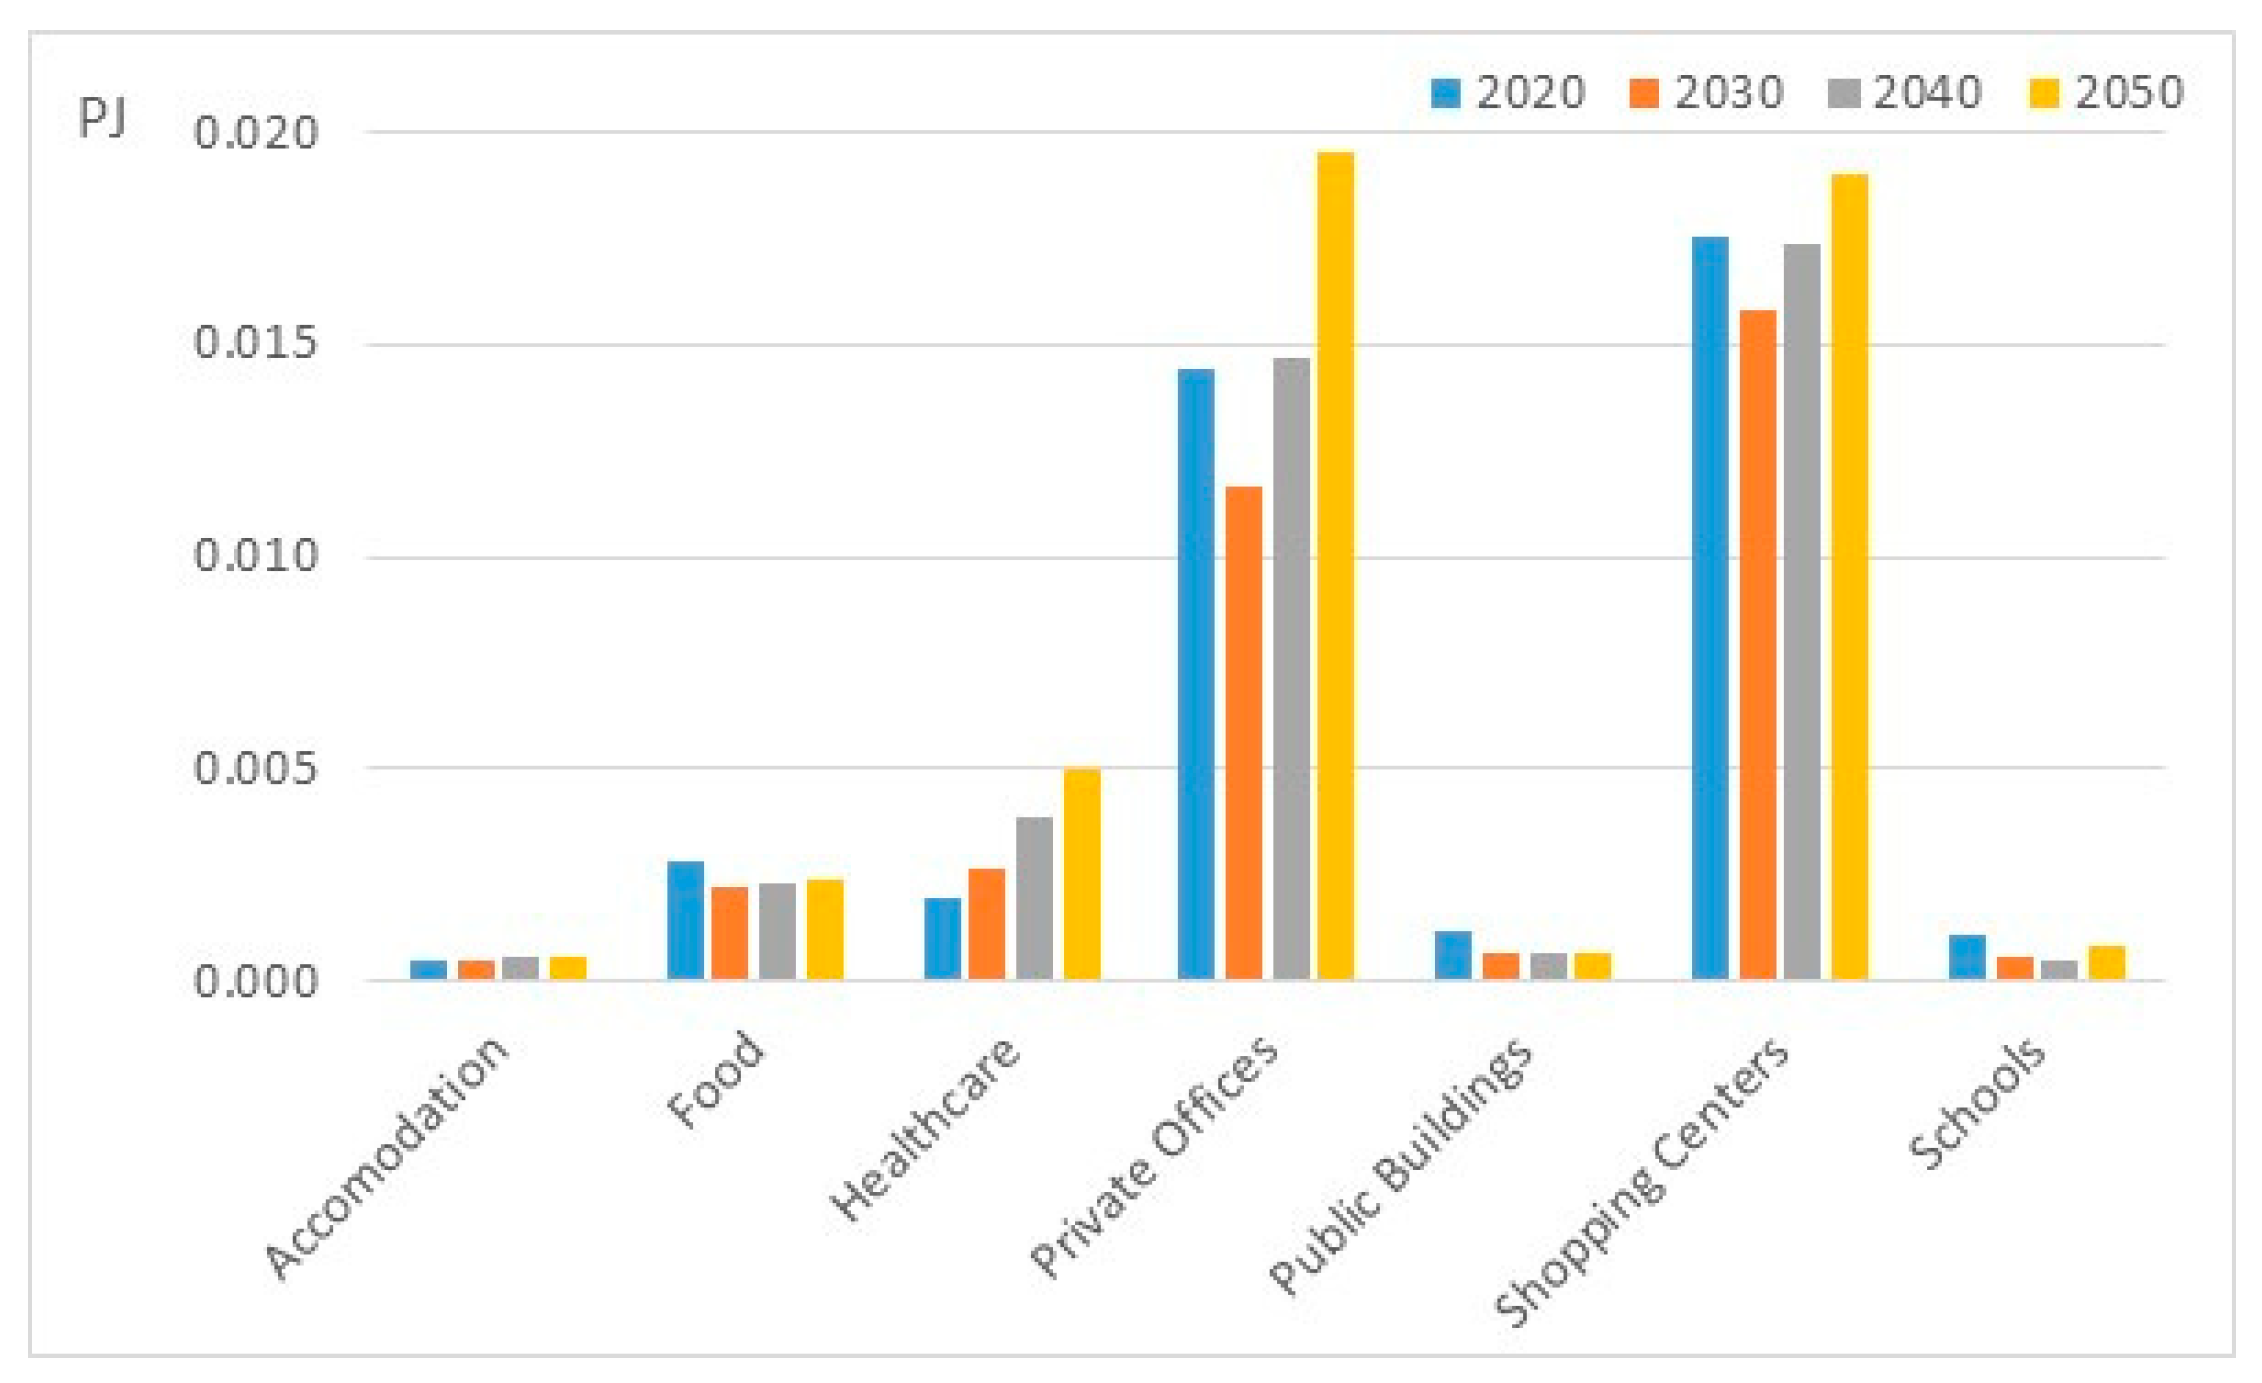
Figure 21.
Total energy system cost (MEuro).
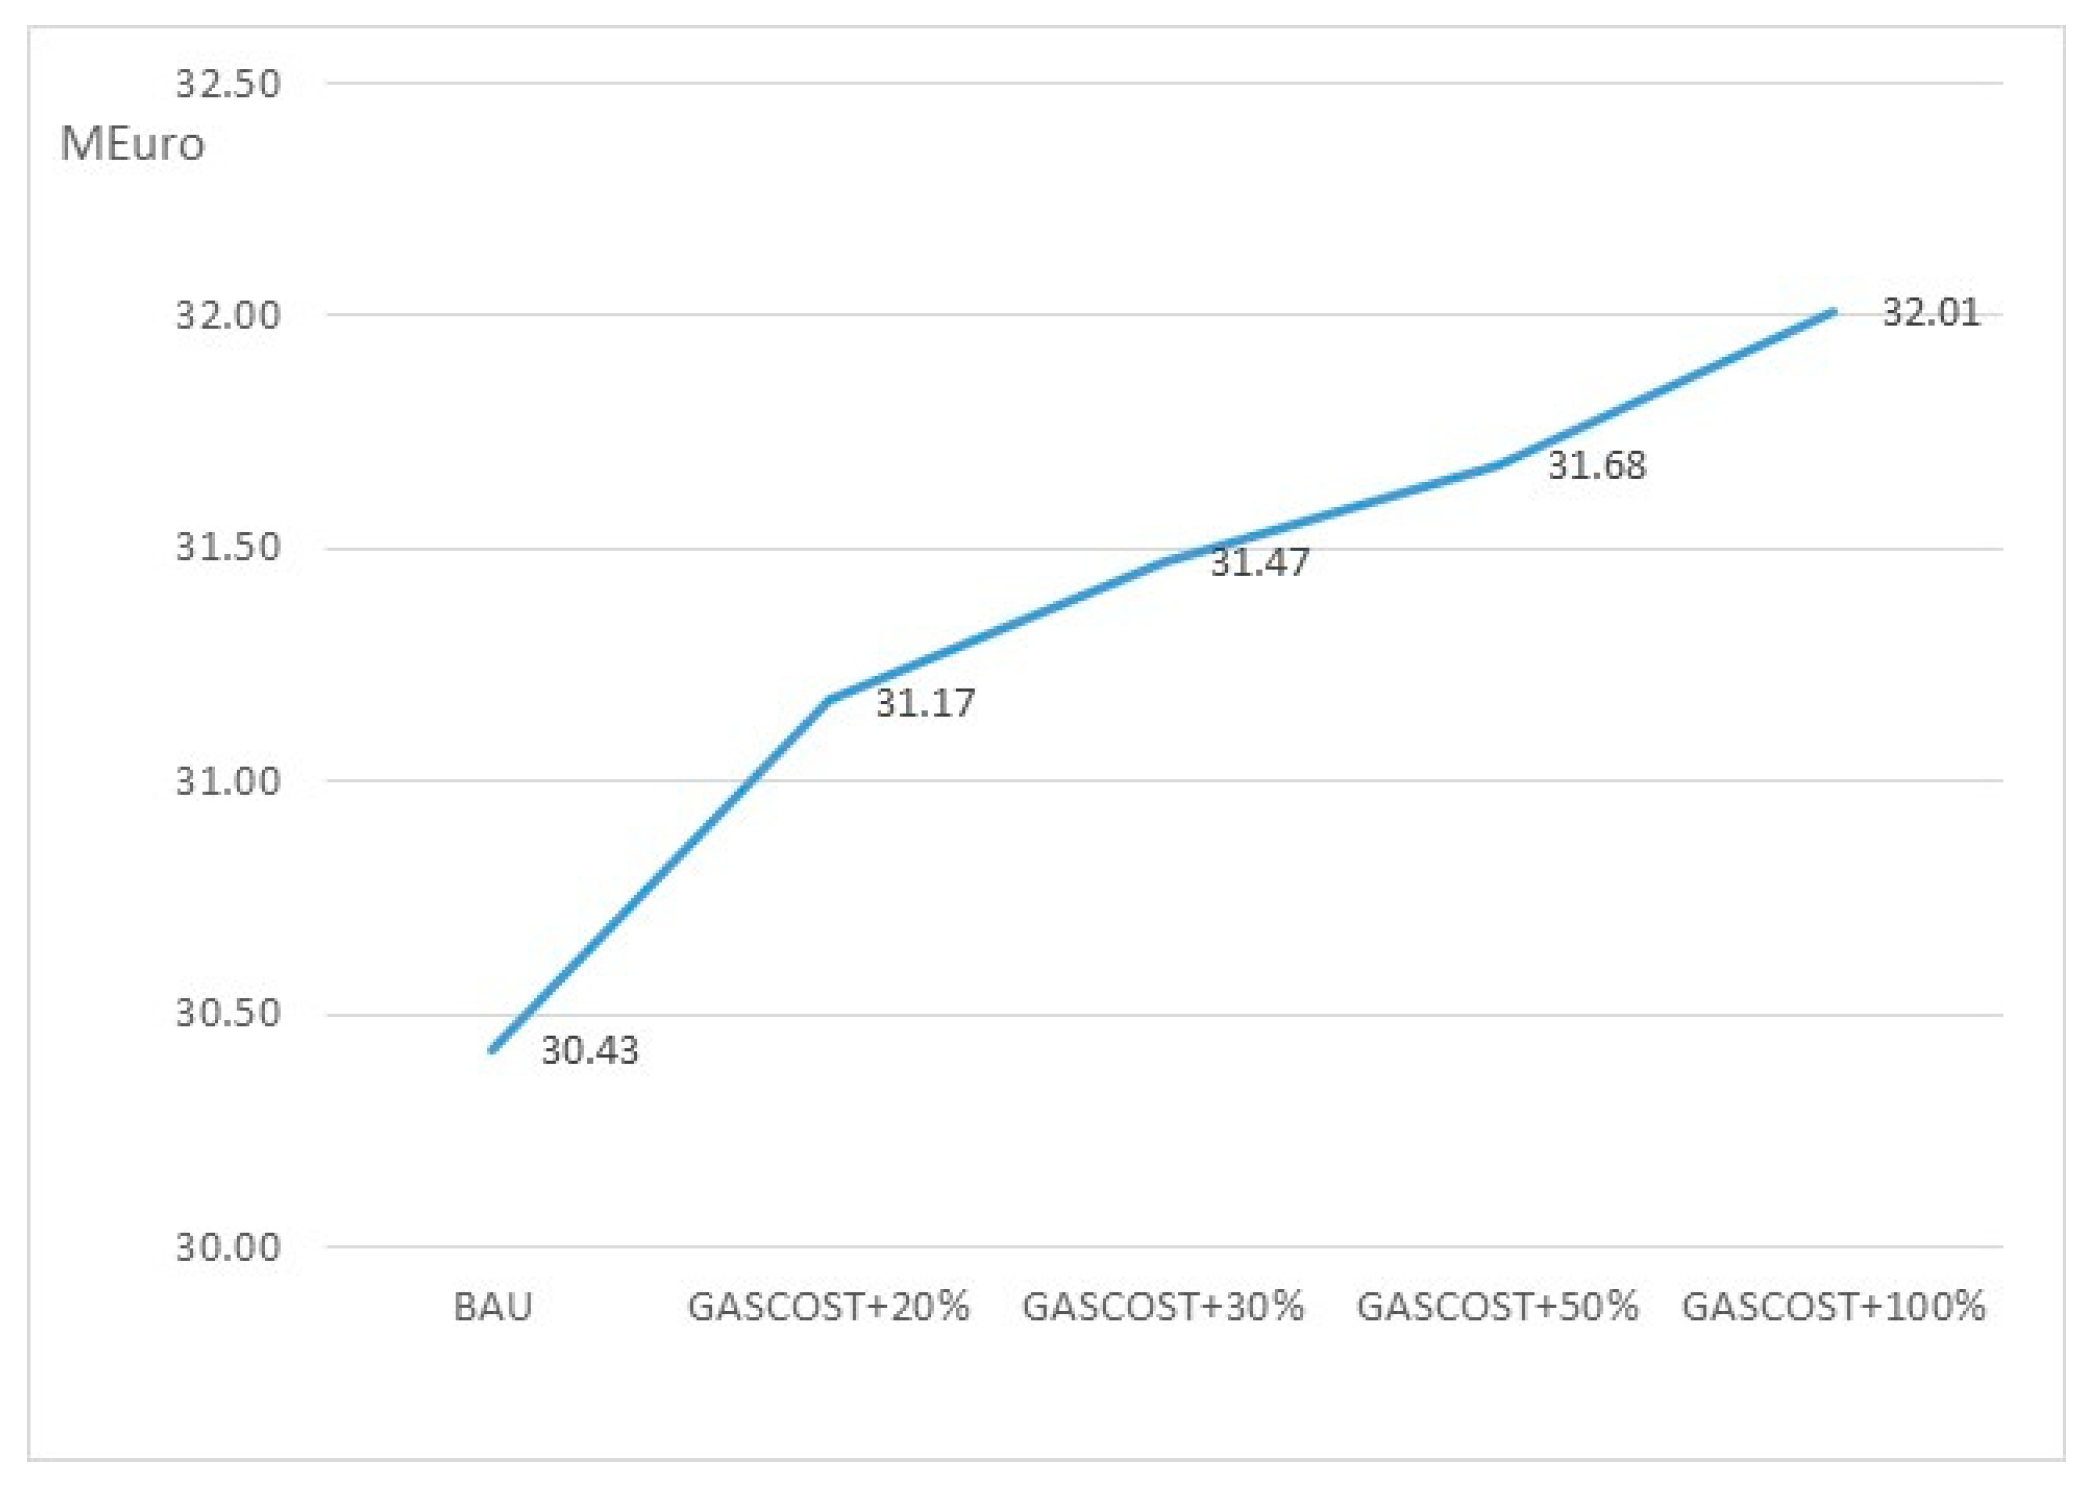
Figure 22.
Natural gas supply (PJ).
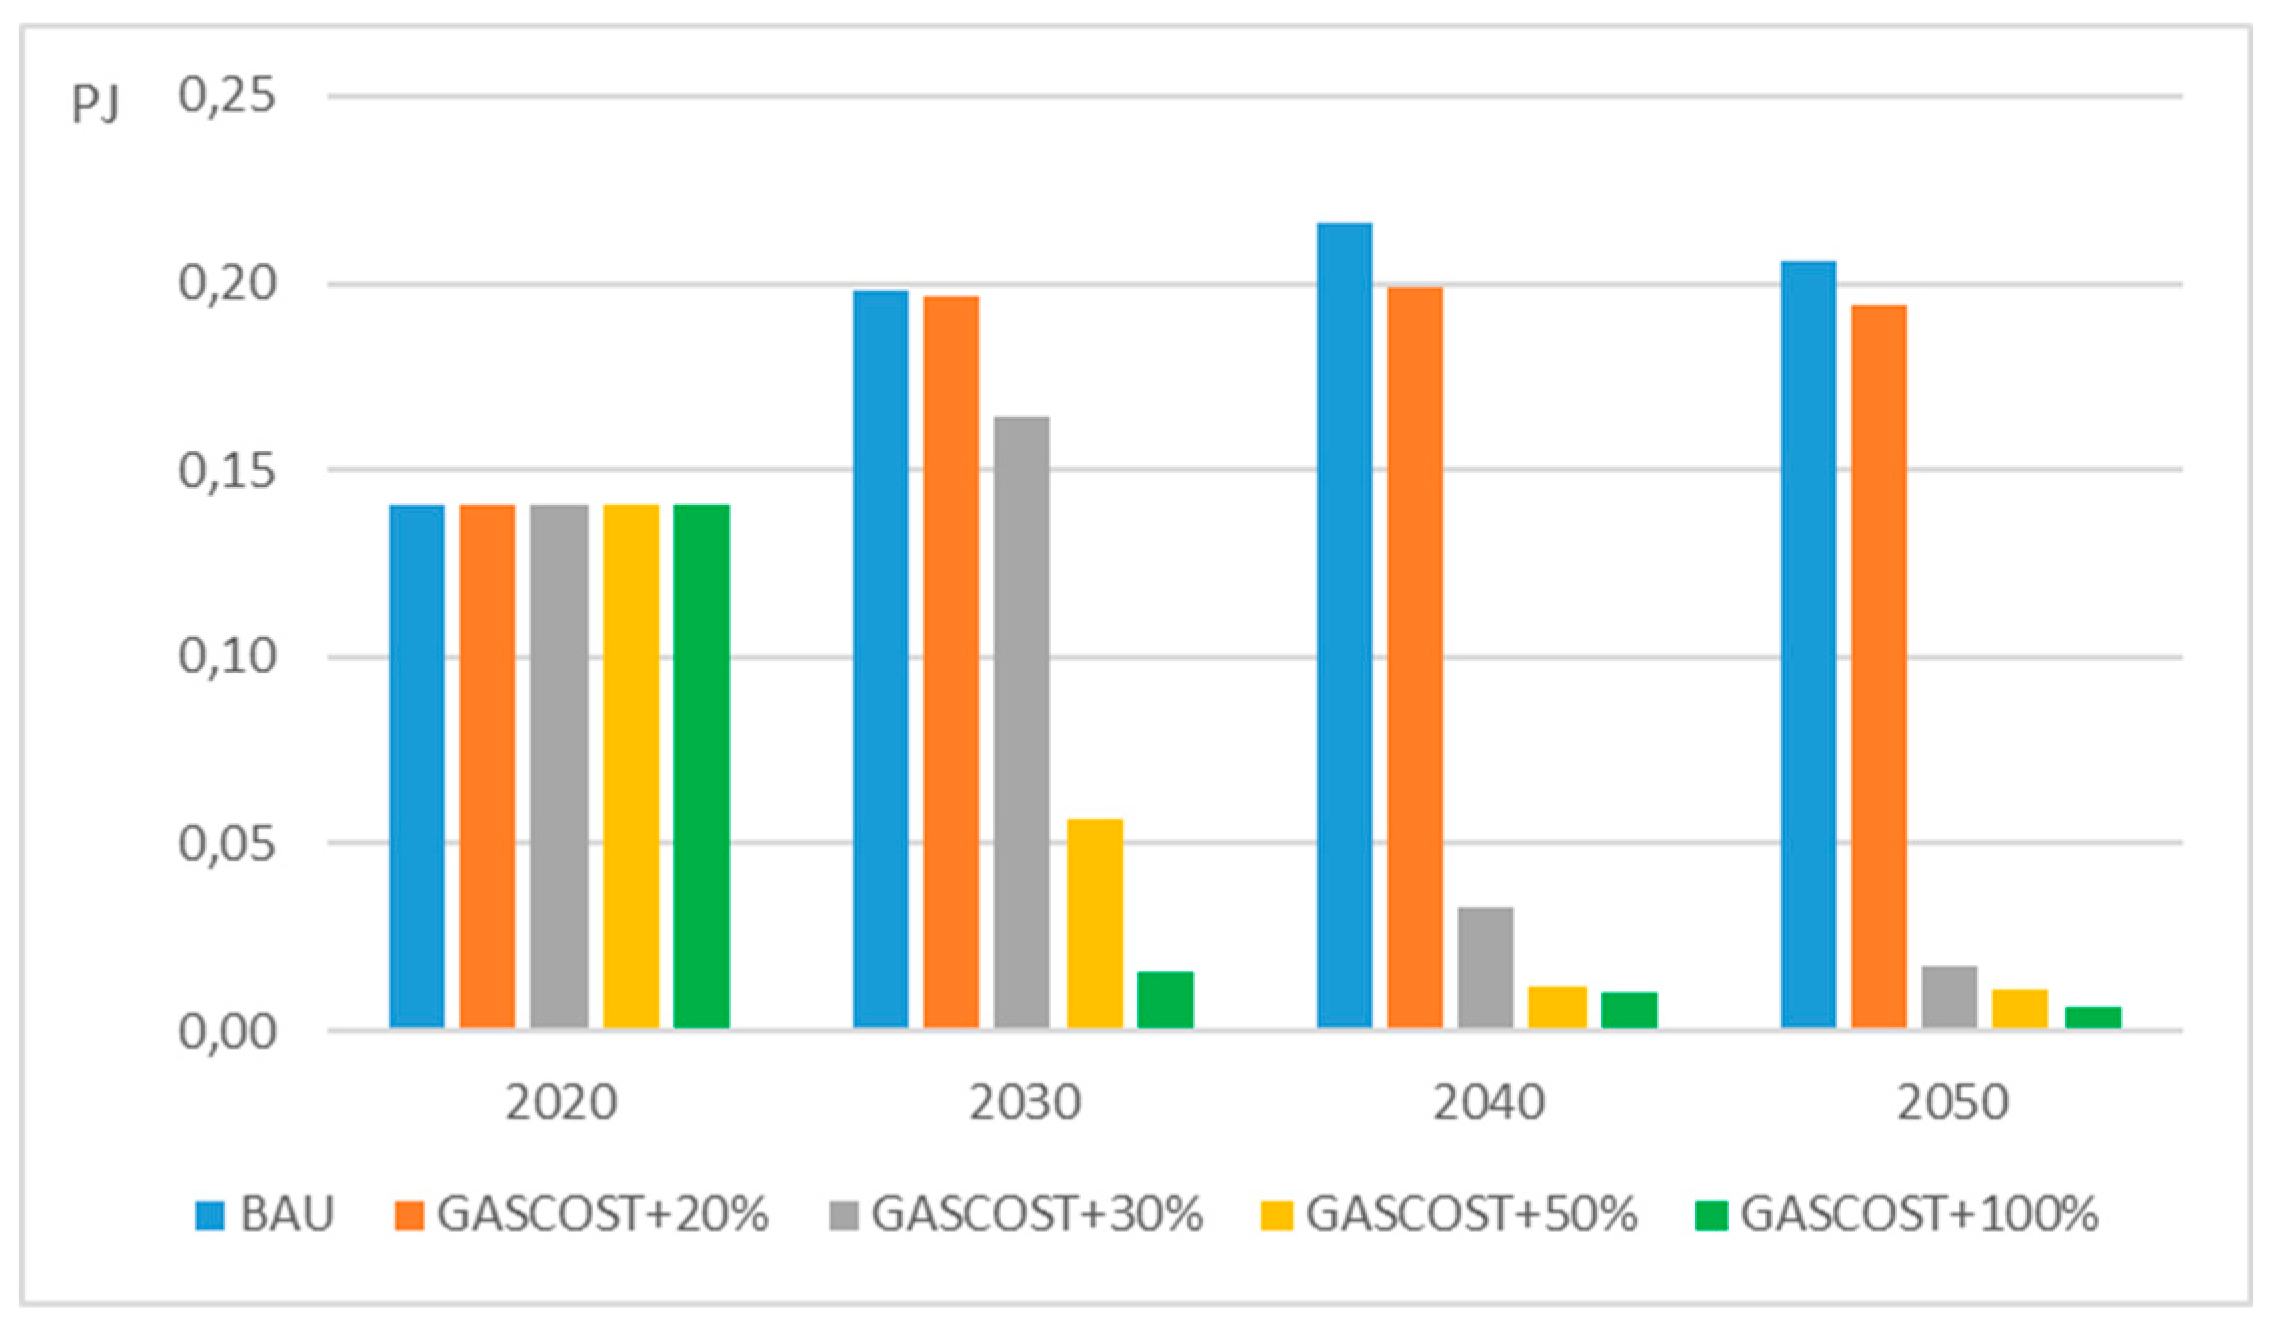
Figure 23.
Fuel Supply variations at increasing of natural gas costs – a) year 2030 and b) year 2050.
Figure 23.
Fuel Supply variations at increasing of natural gas costs – a) year 2030 and b) year 2050.
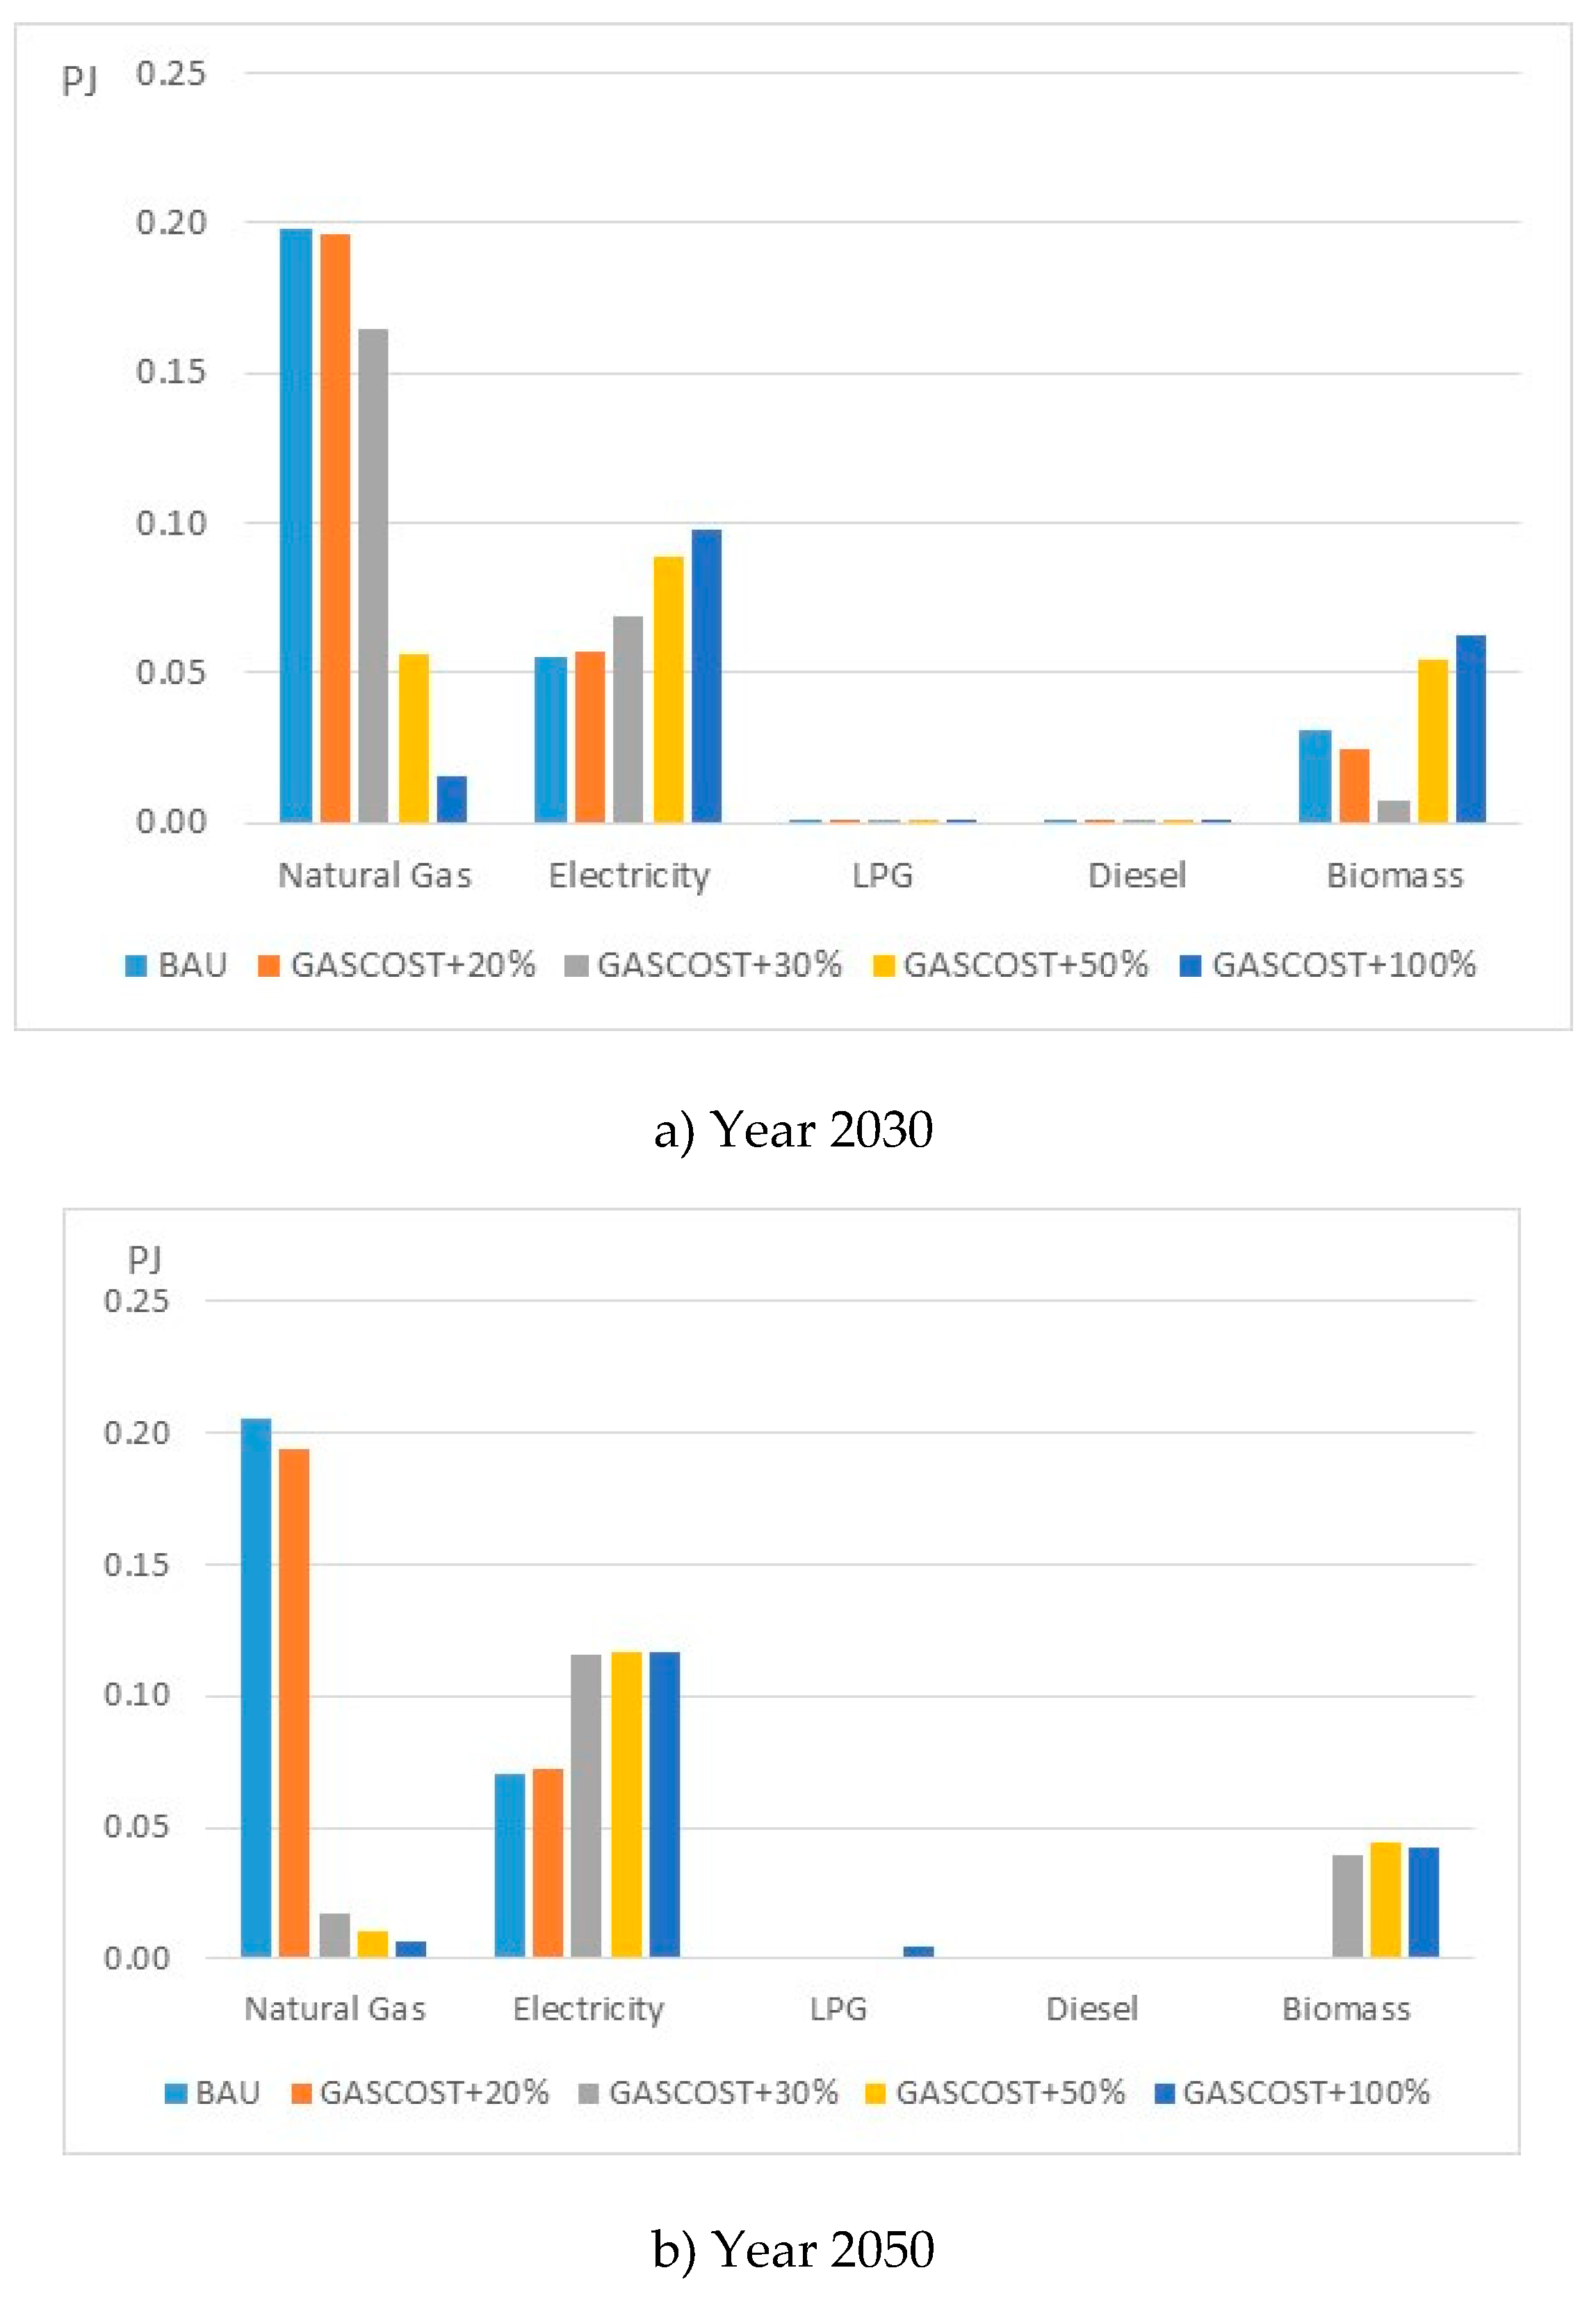
Figure 24.
Residential fuel mix a) year 2030 and b) year 2050.
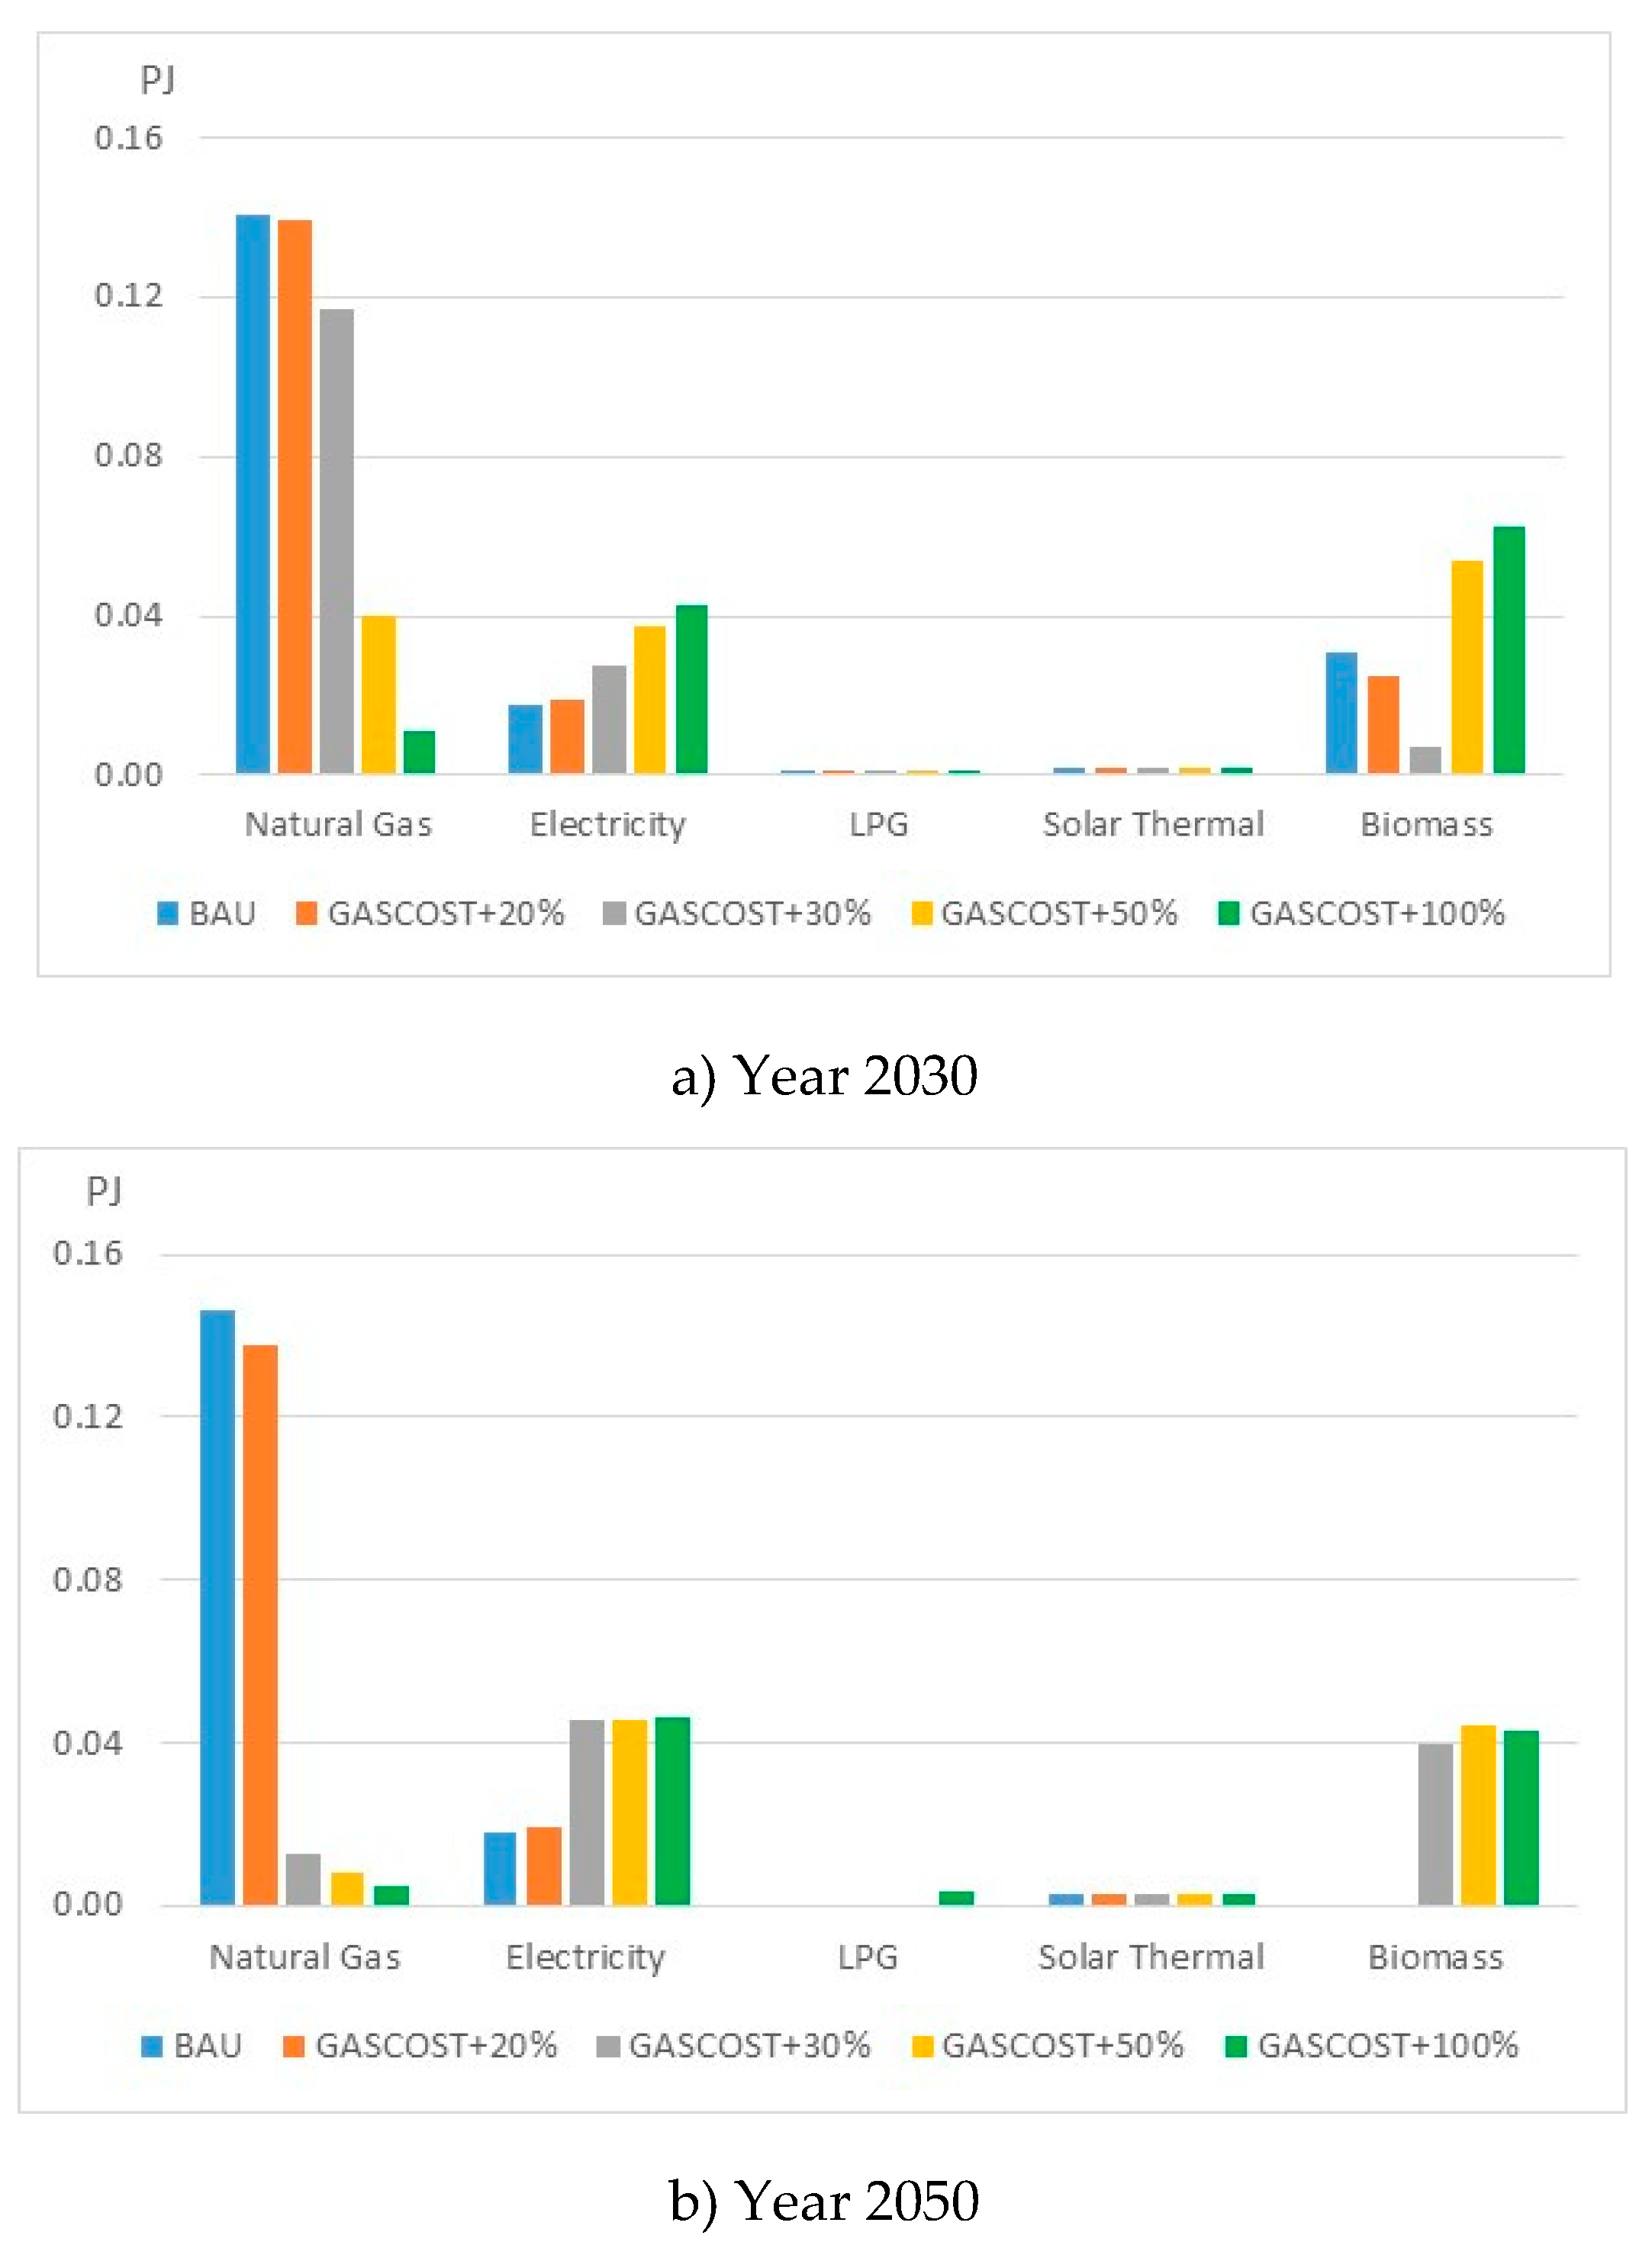
Figure 25.
Electricity consumption for space heating (PJ/Mm2).
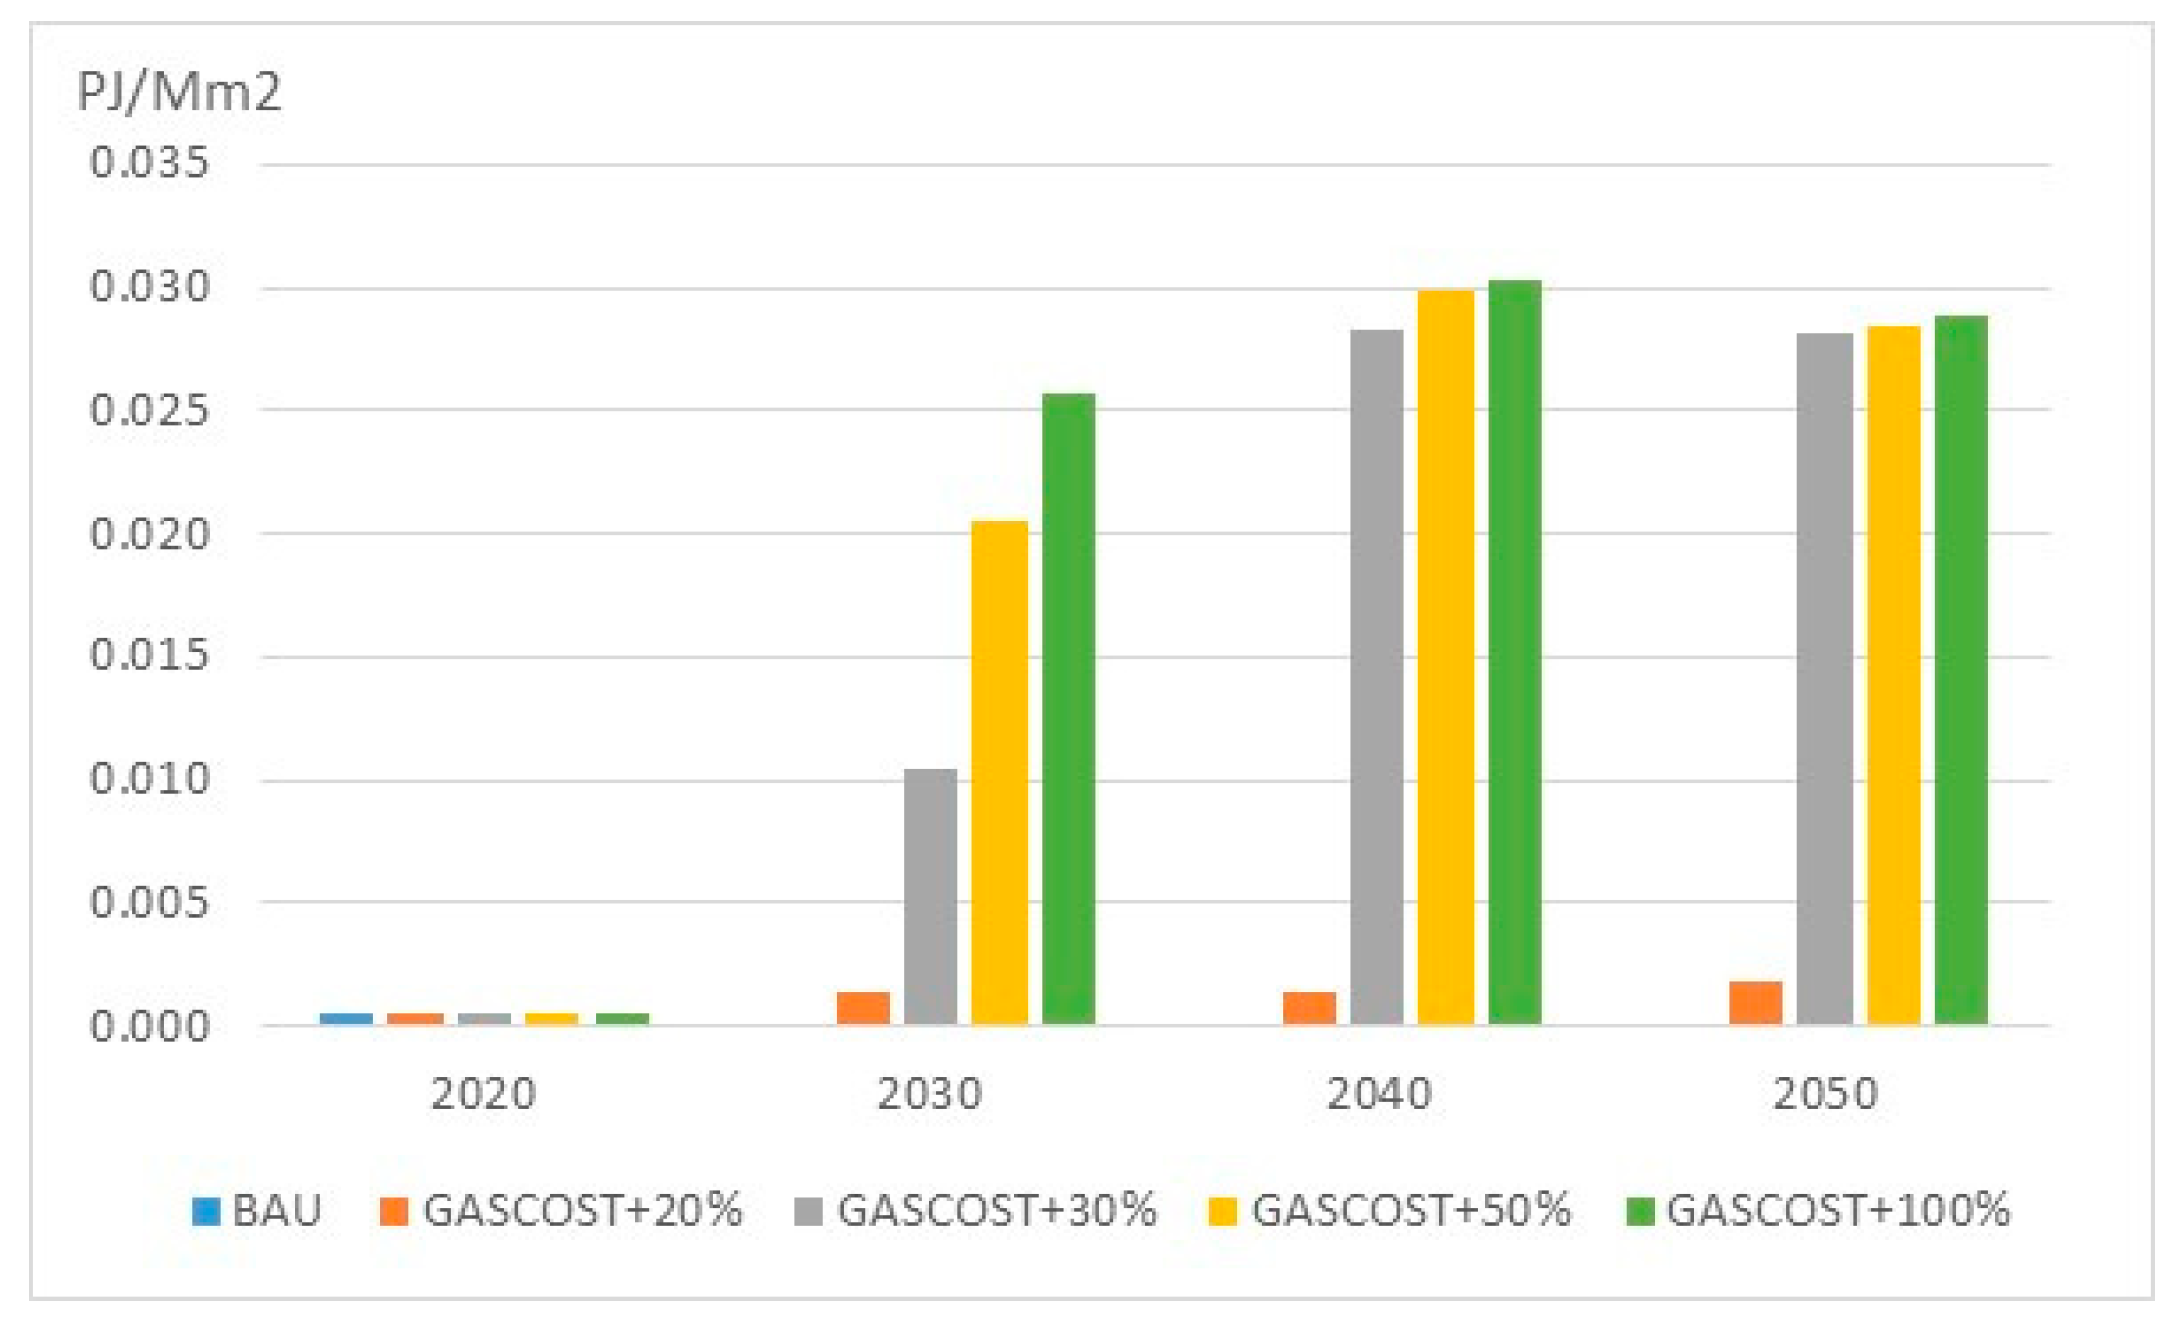
Figure 26.
Biomass consumption for space heating (PJ/Mm2).
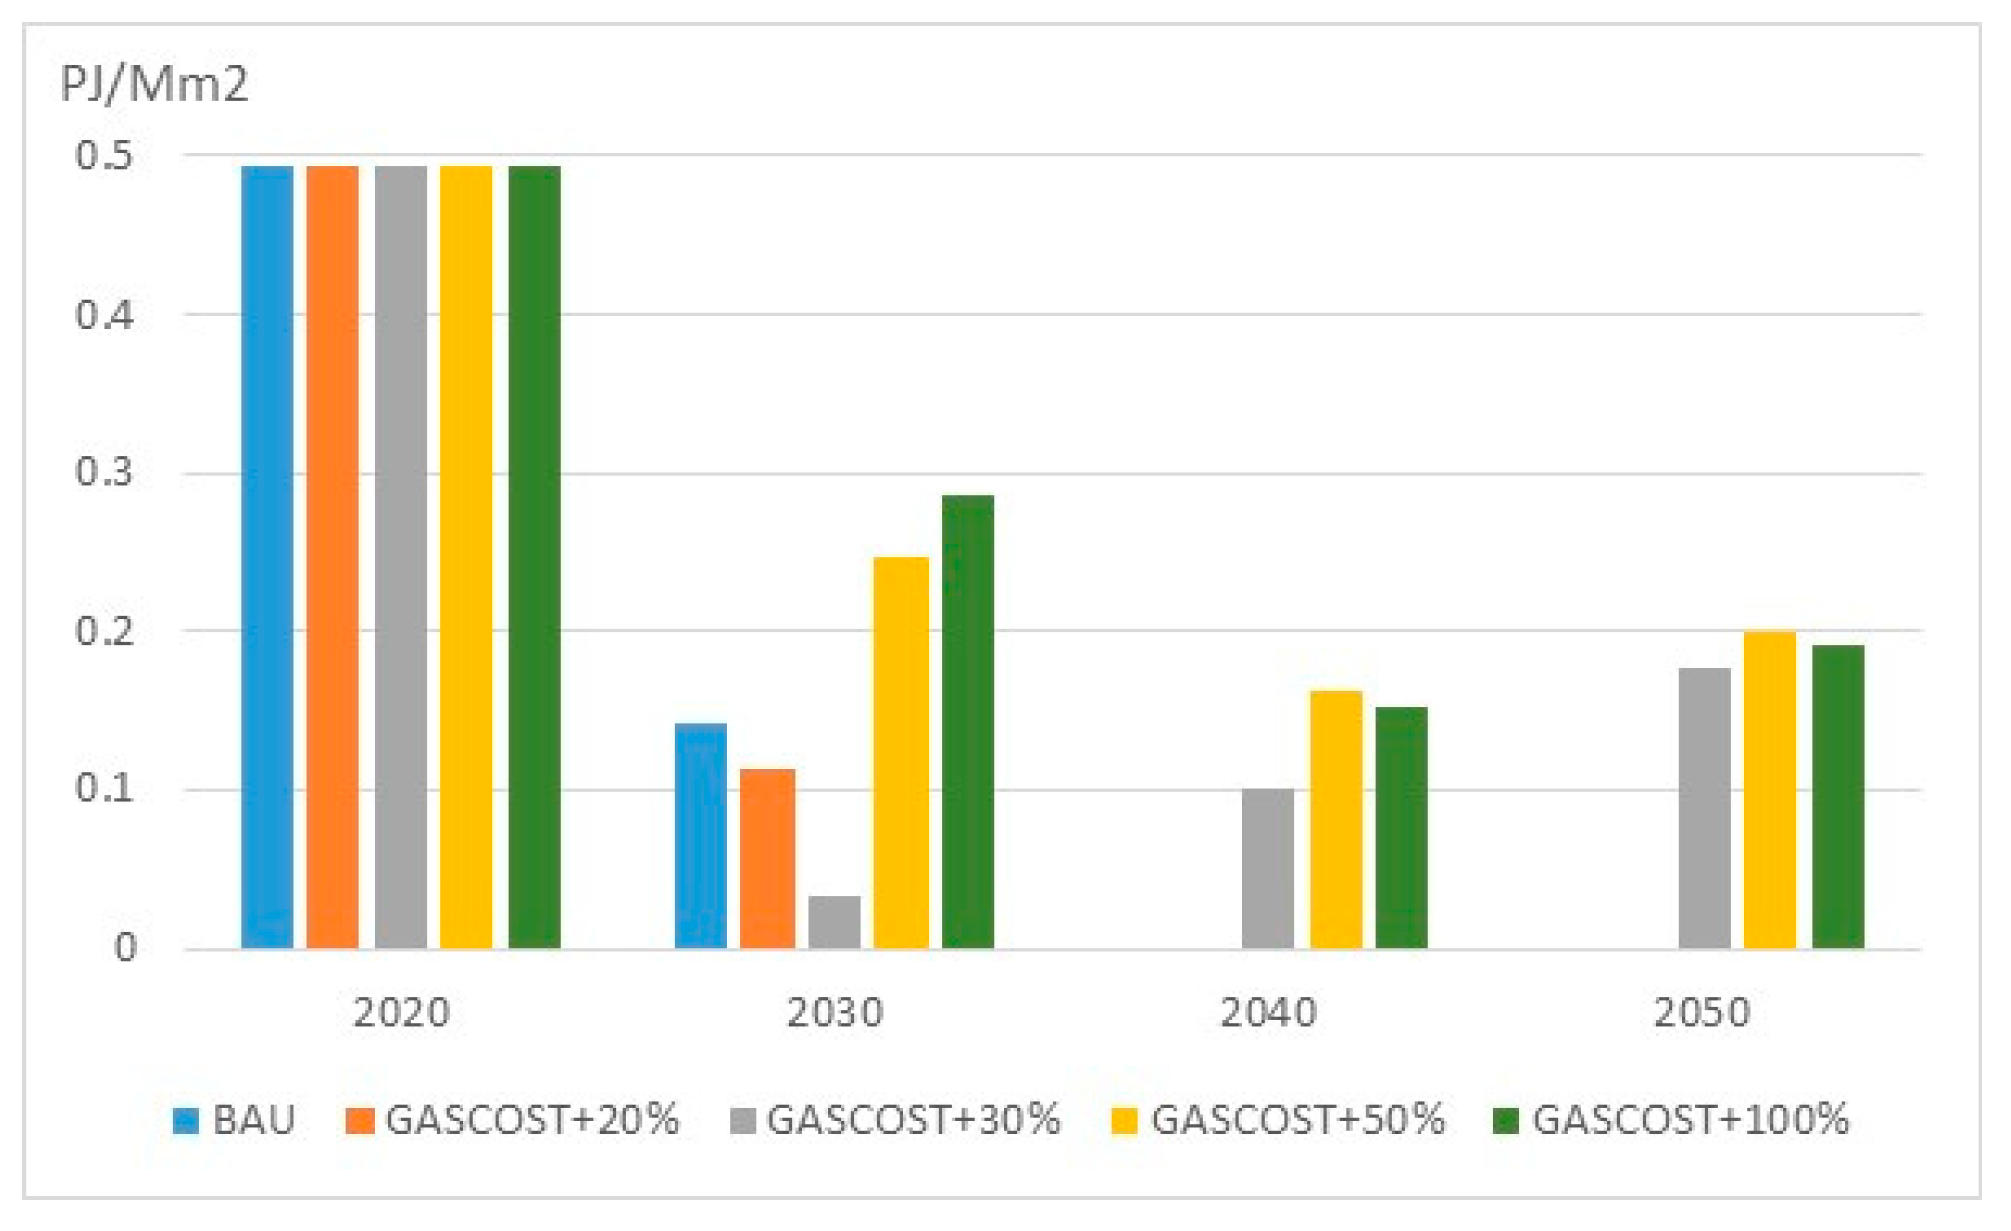
Figure 27.
Electricity consumption in the tertiary sector.
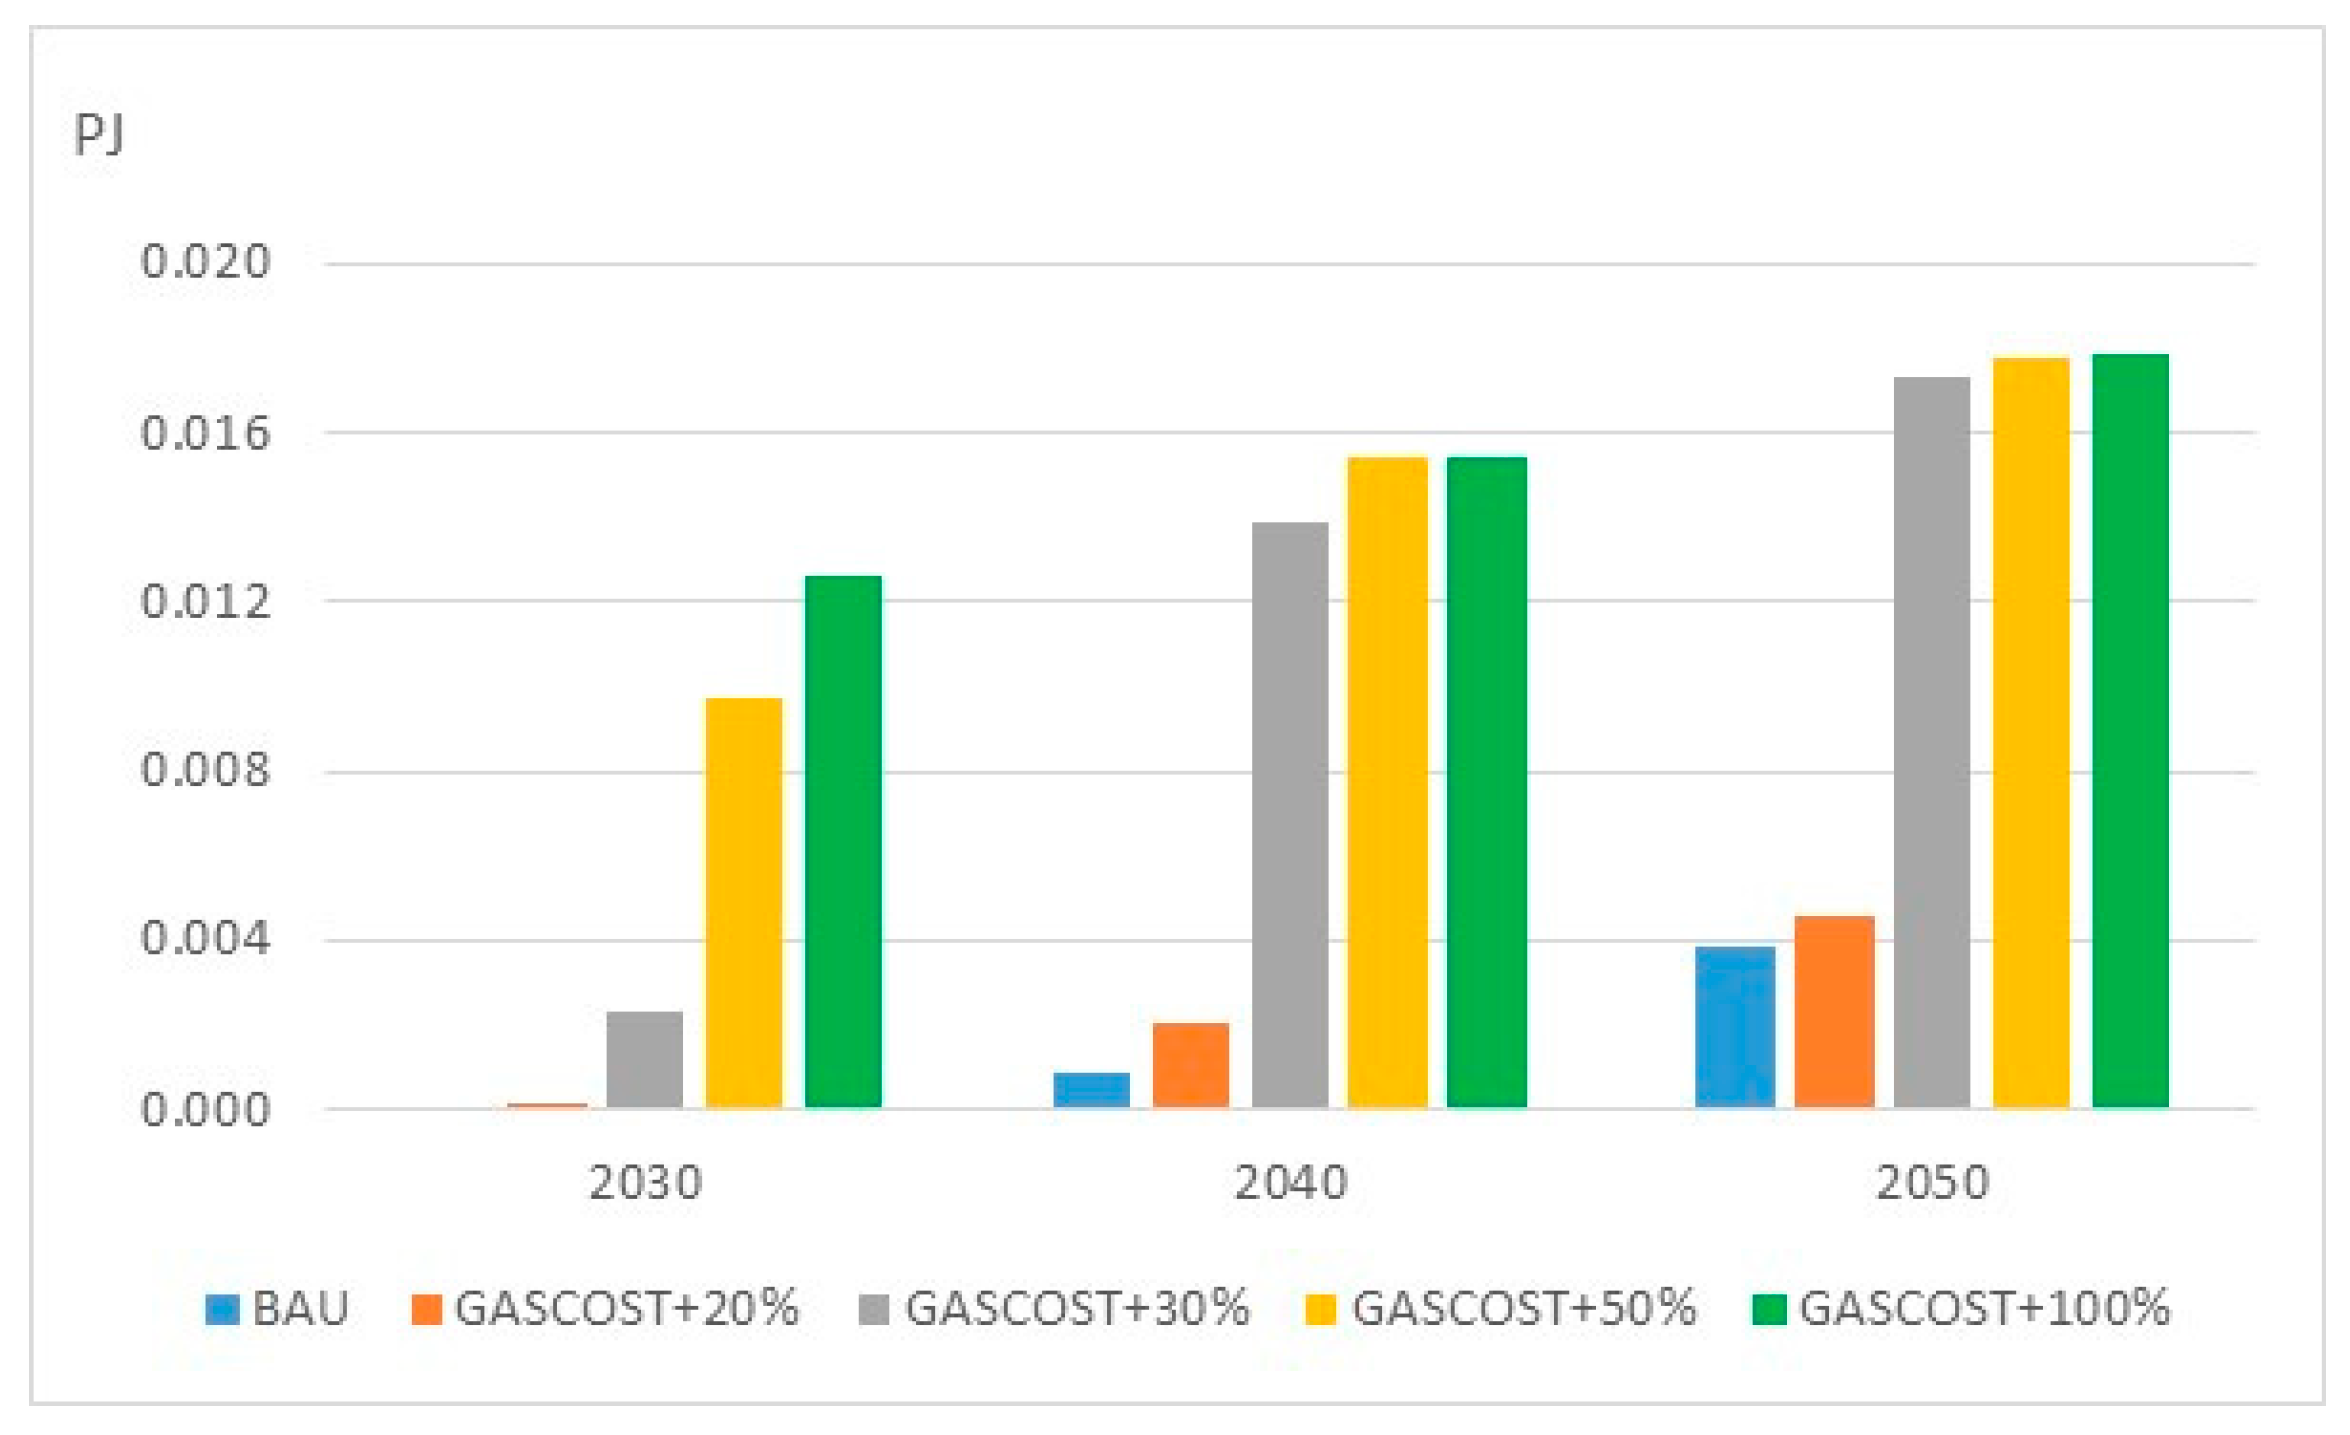
Figure 28.
Electricity consumption by subsectors- Year 2050.
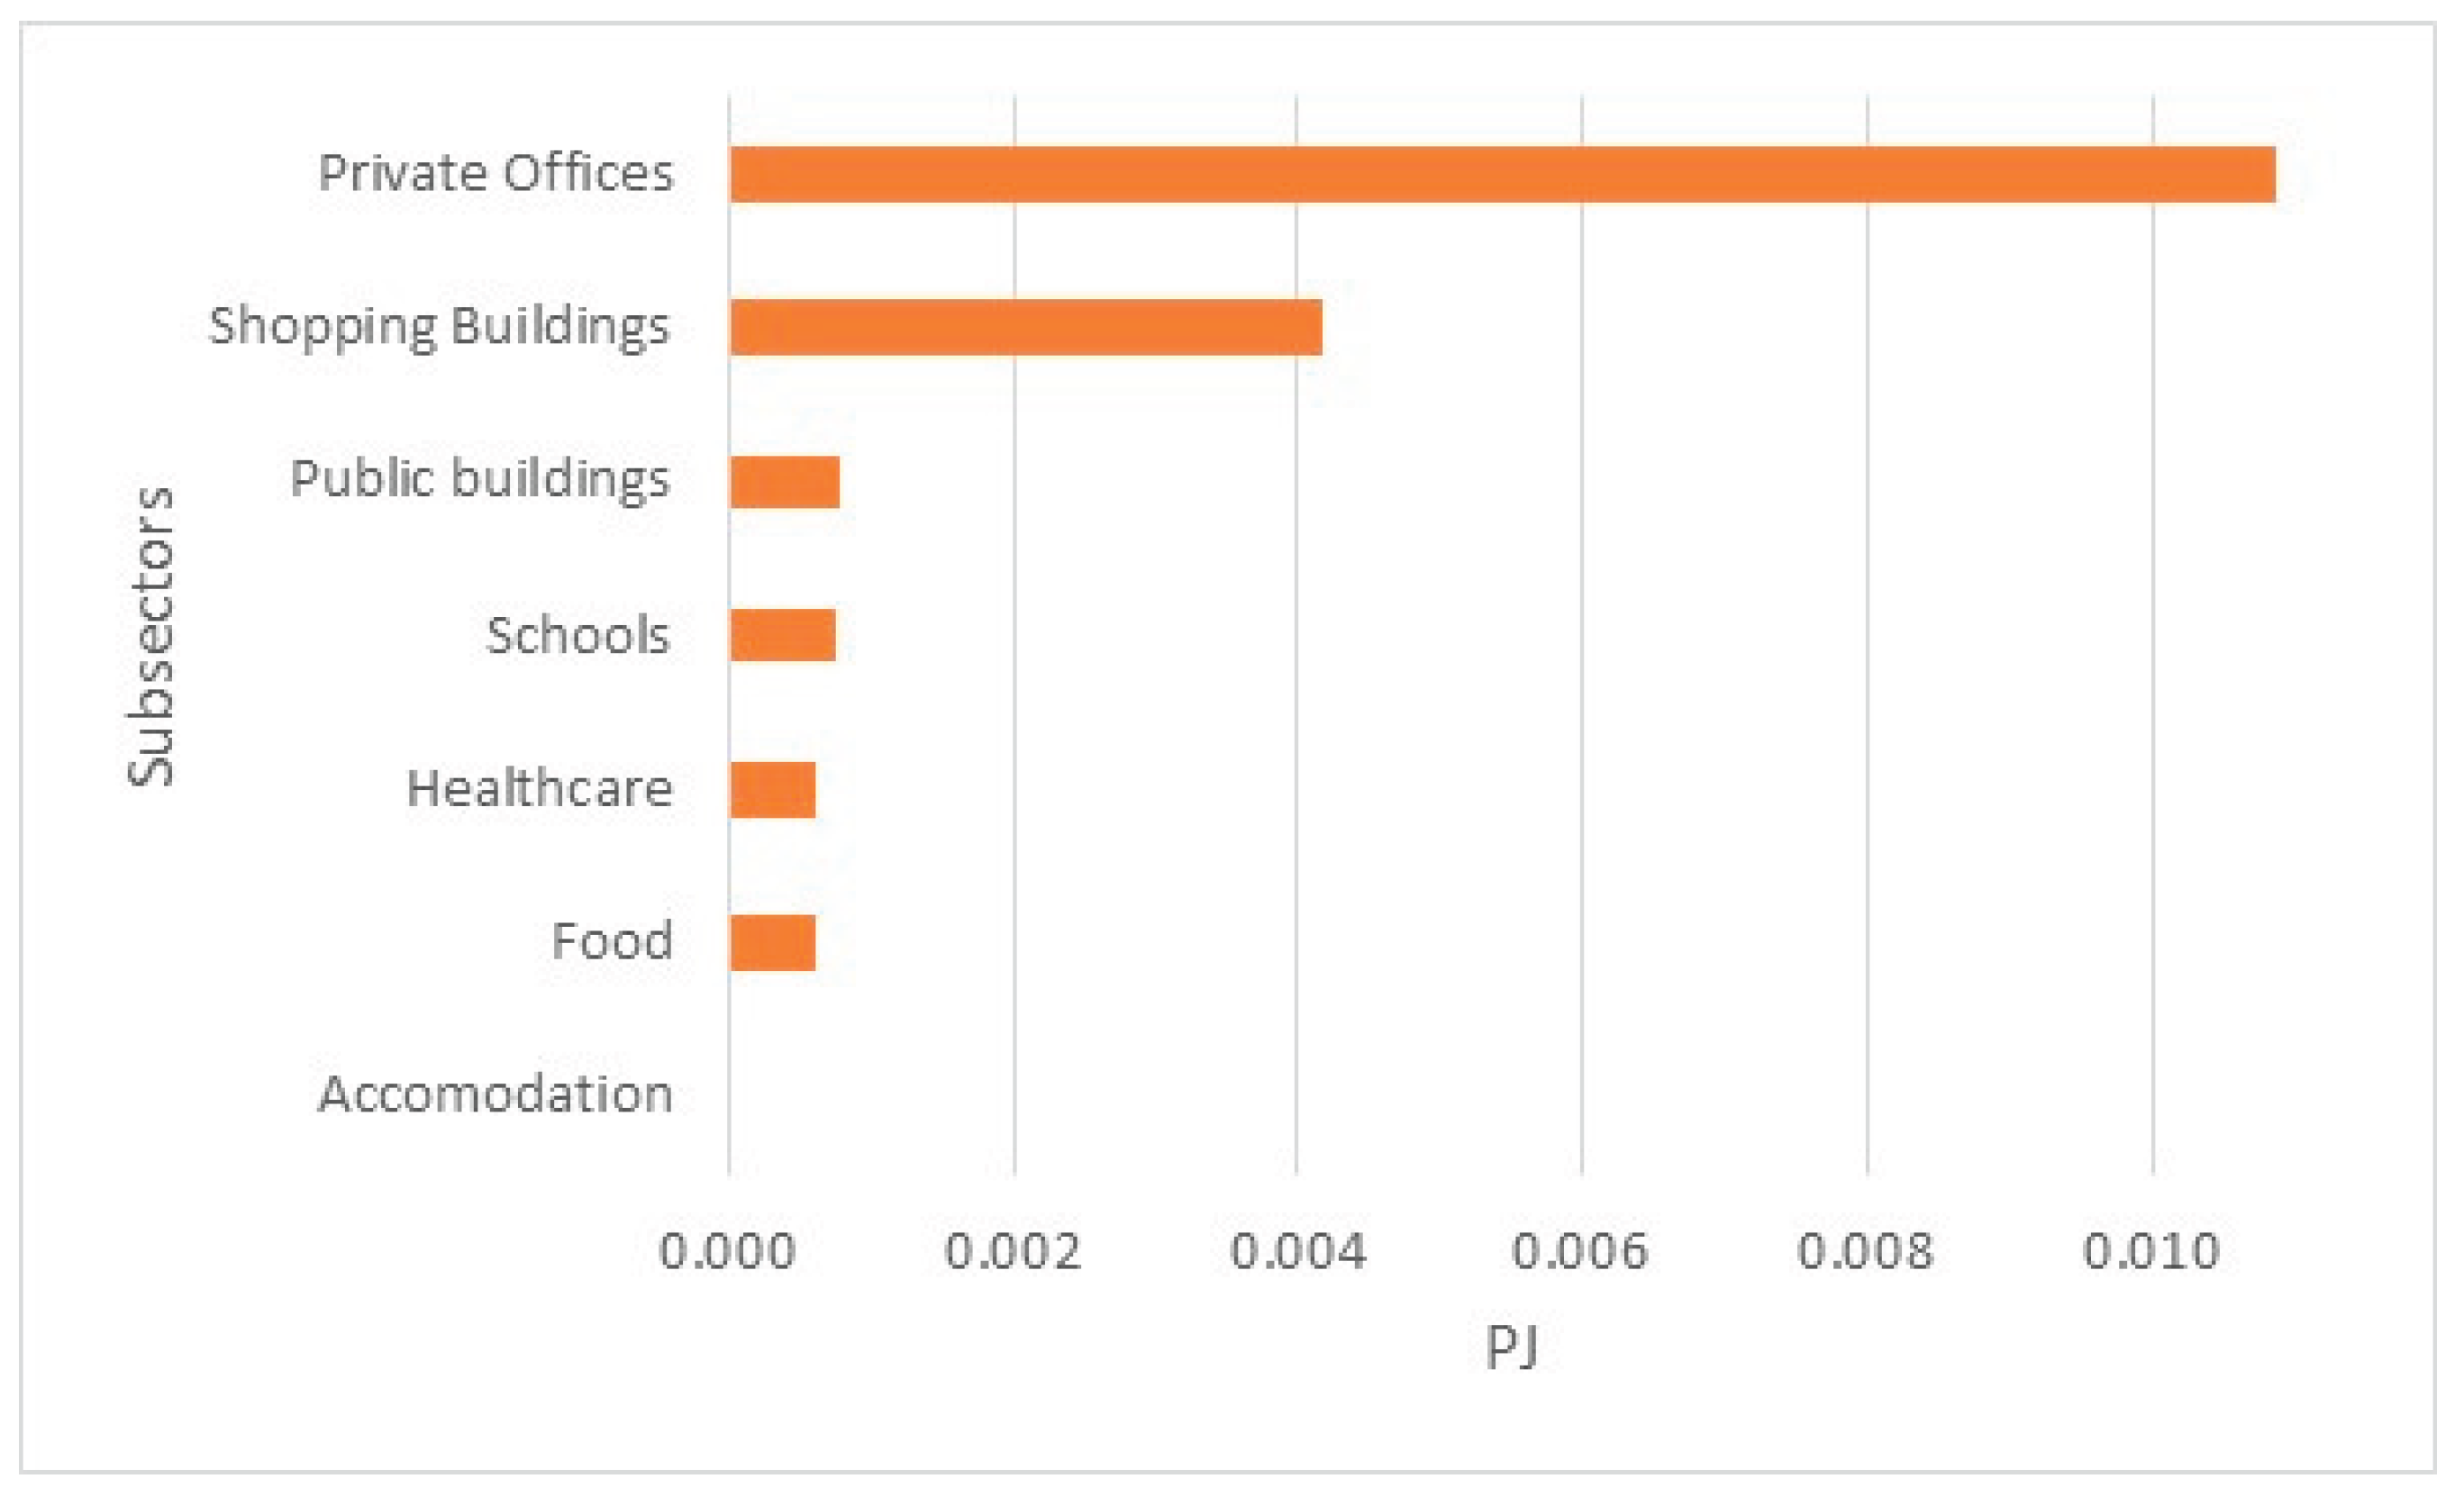
Figure 29.
Total energy system cost (MEuro).
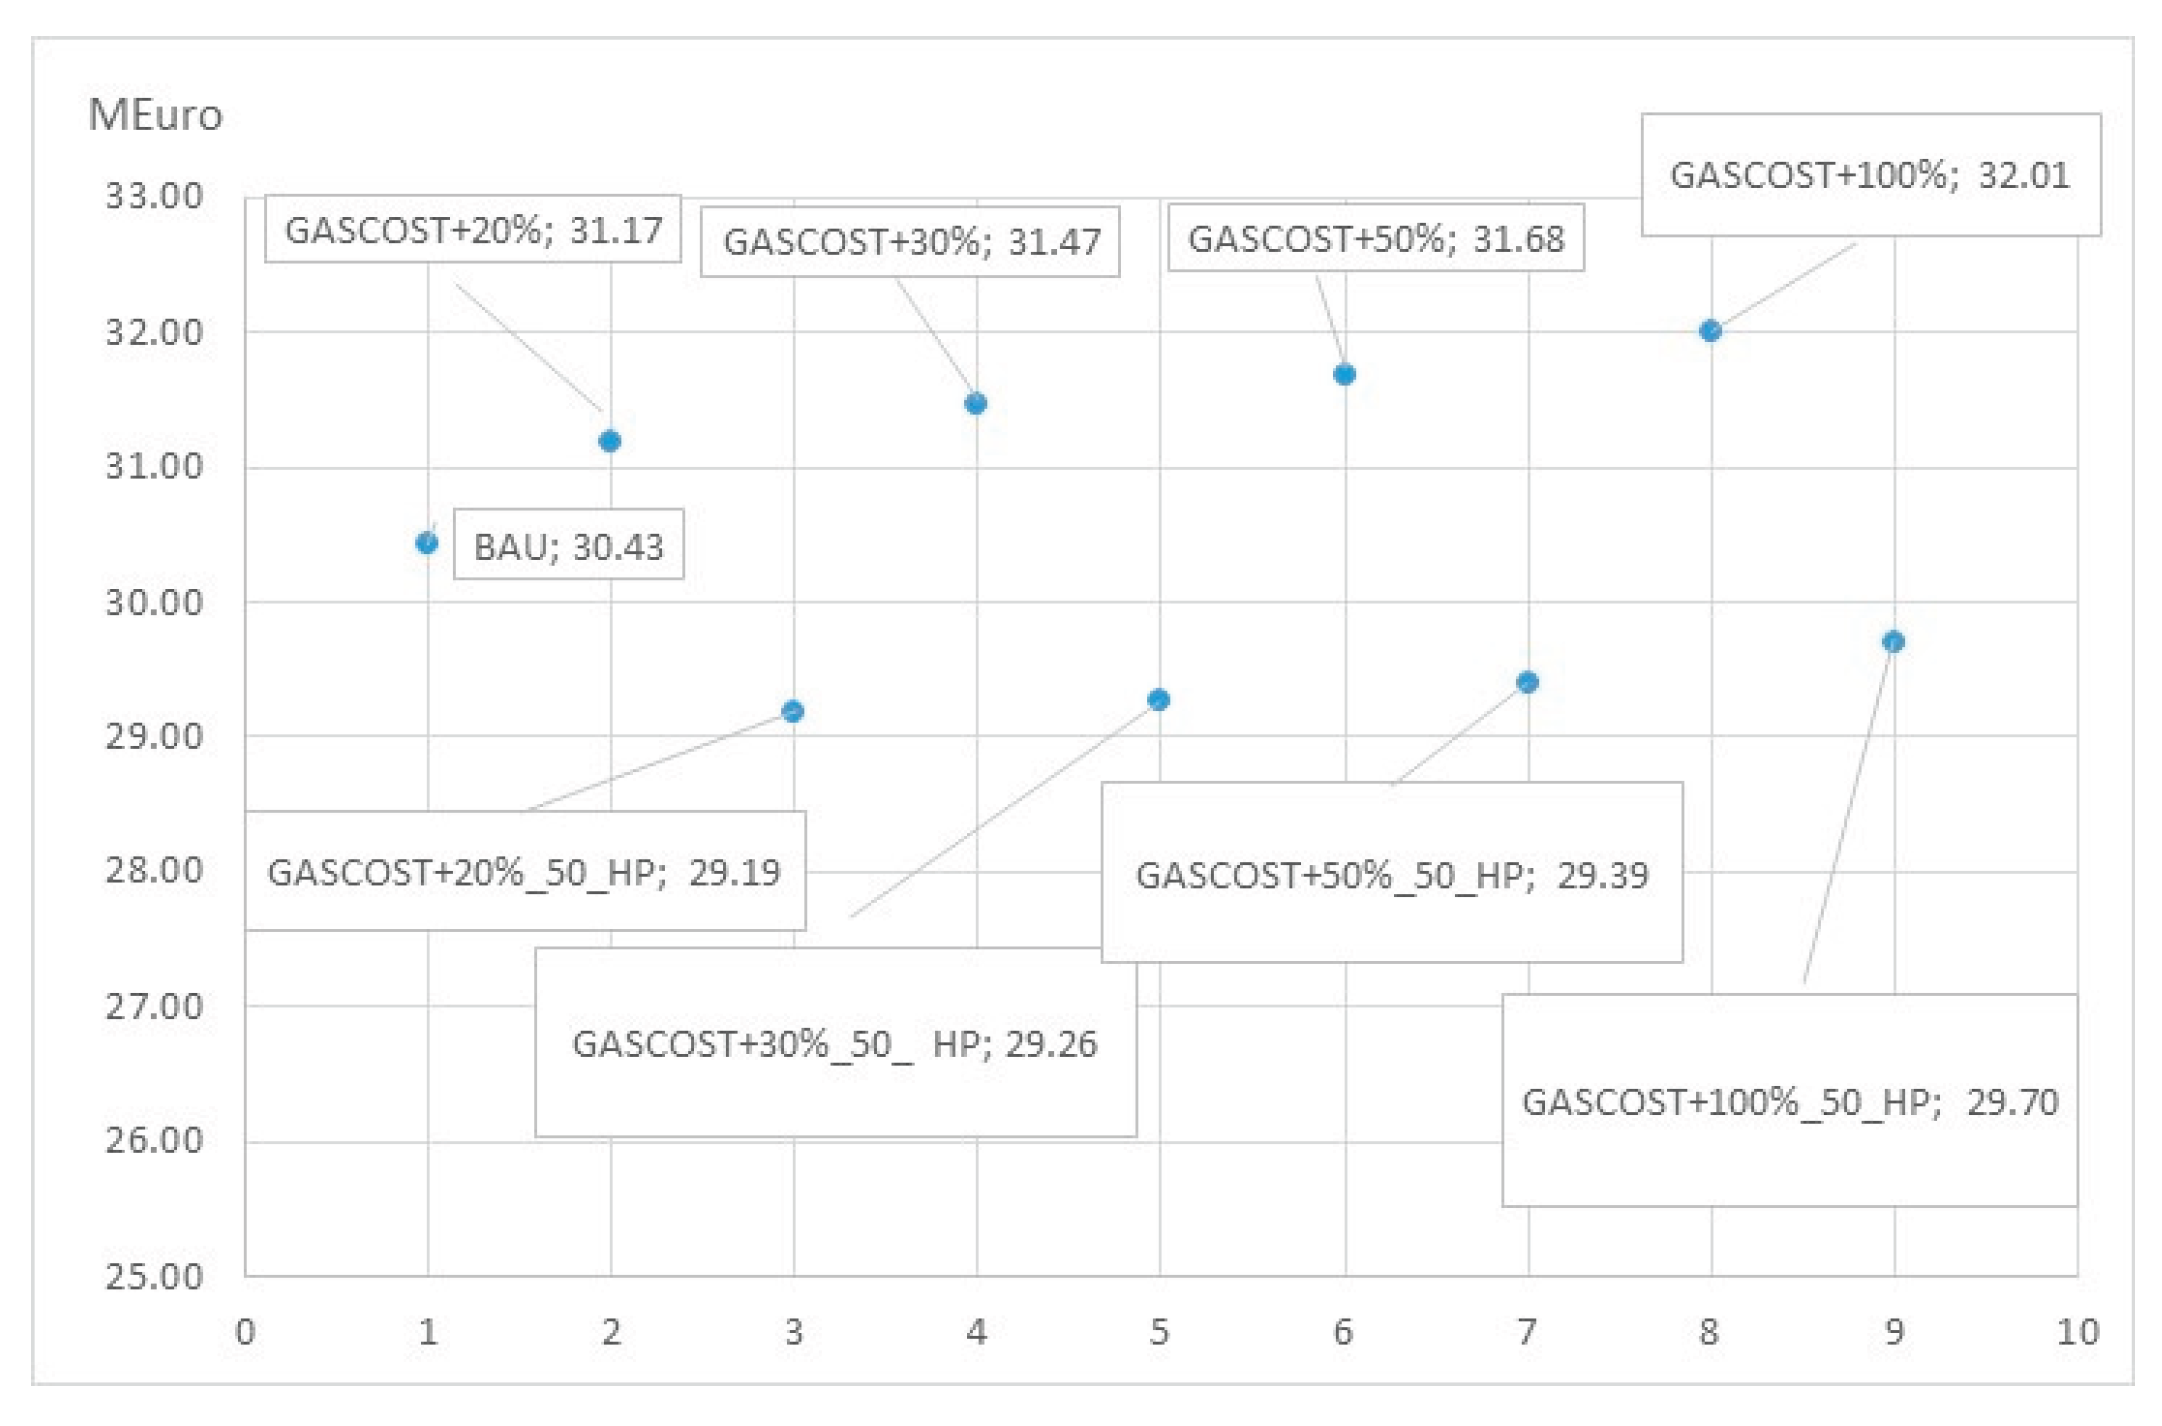
Figure 30.
Supply of biomass (PJ).
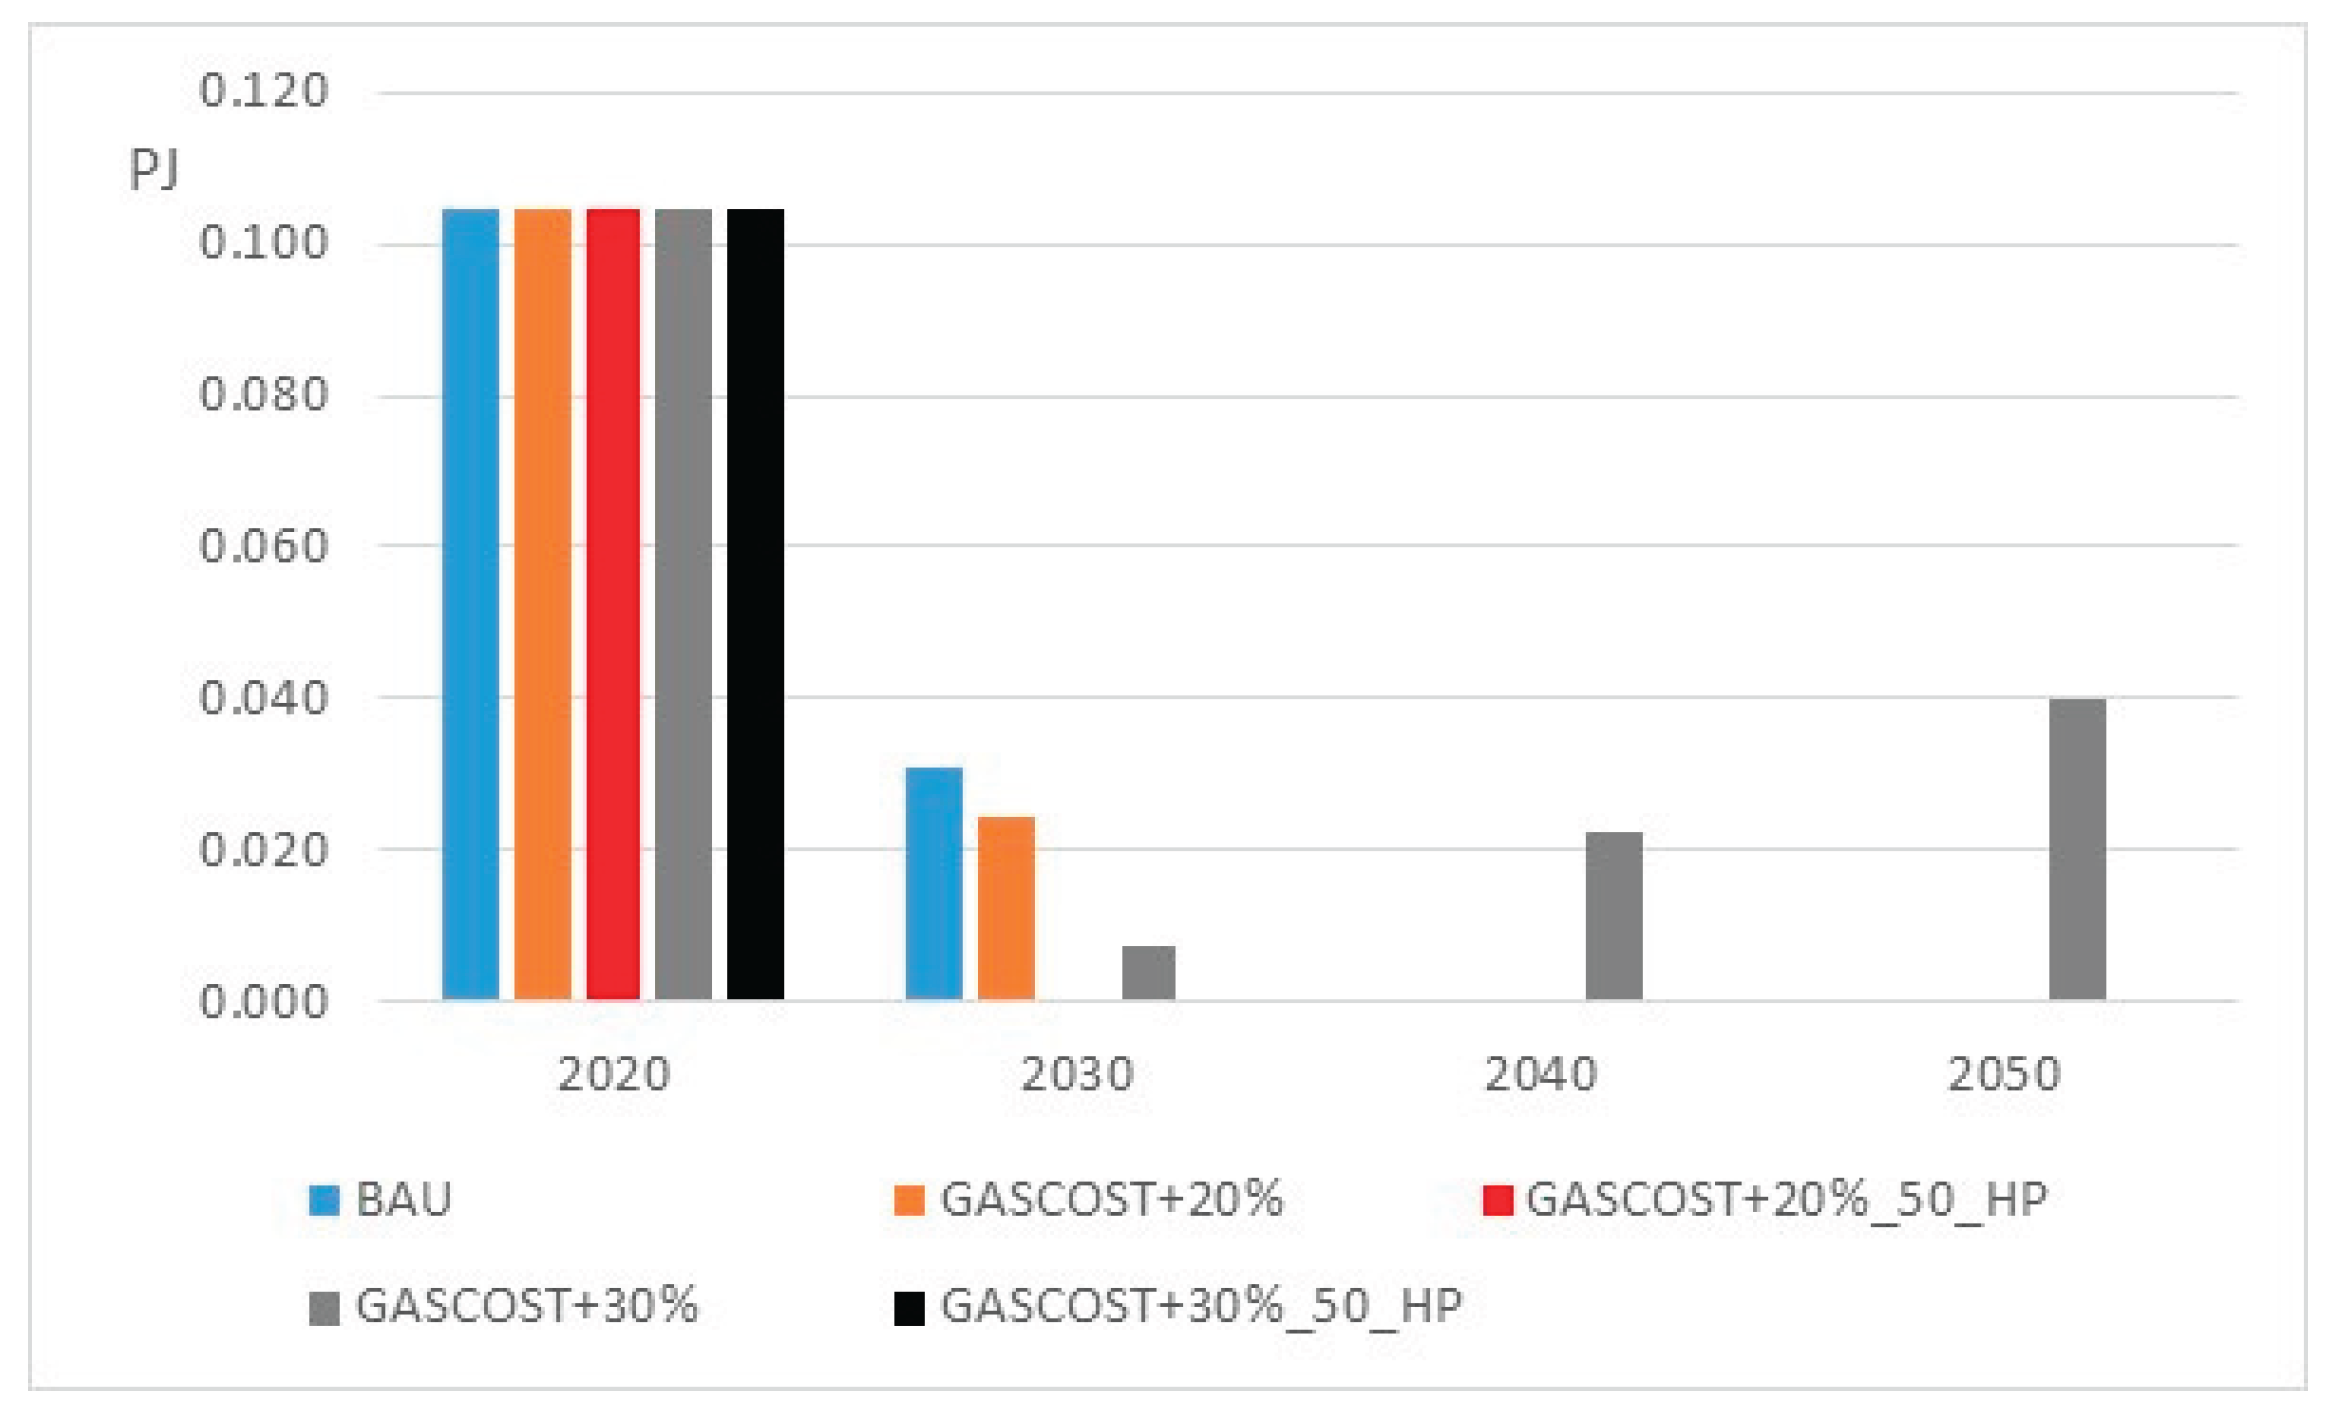
Figure 31.
Supply of natural gas (PJ).
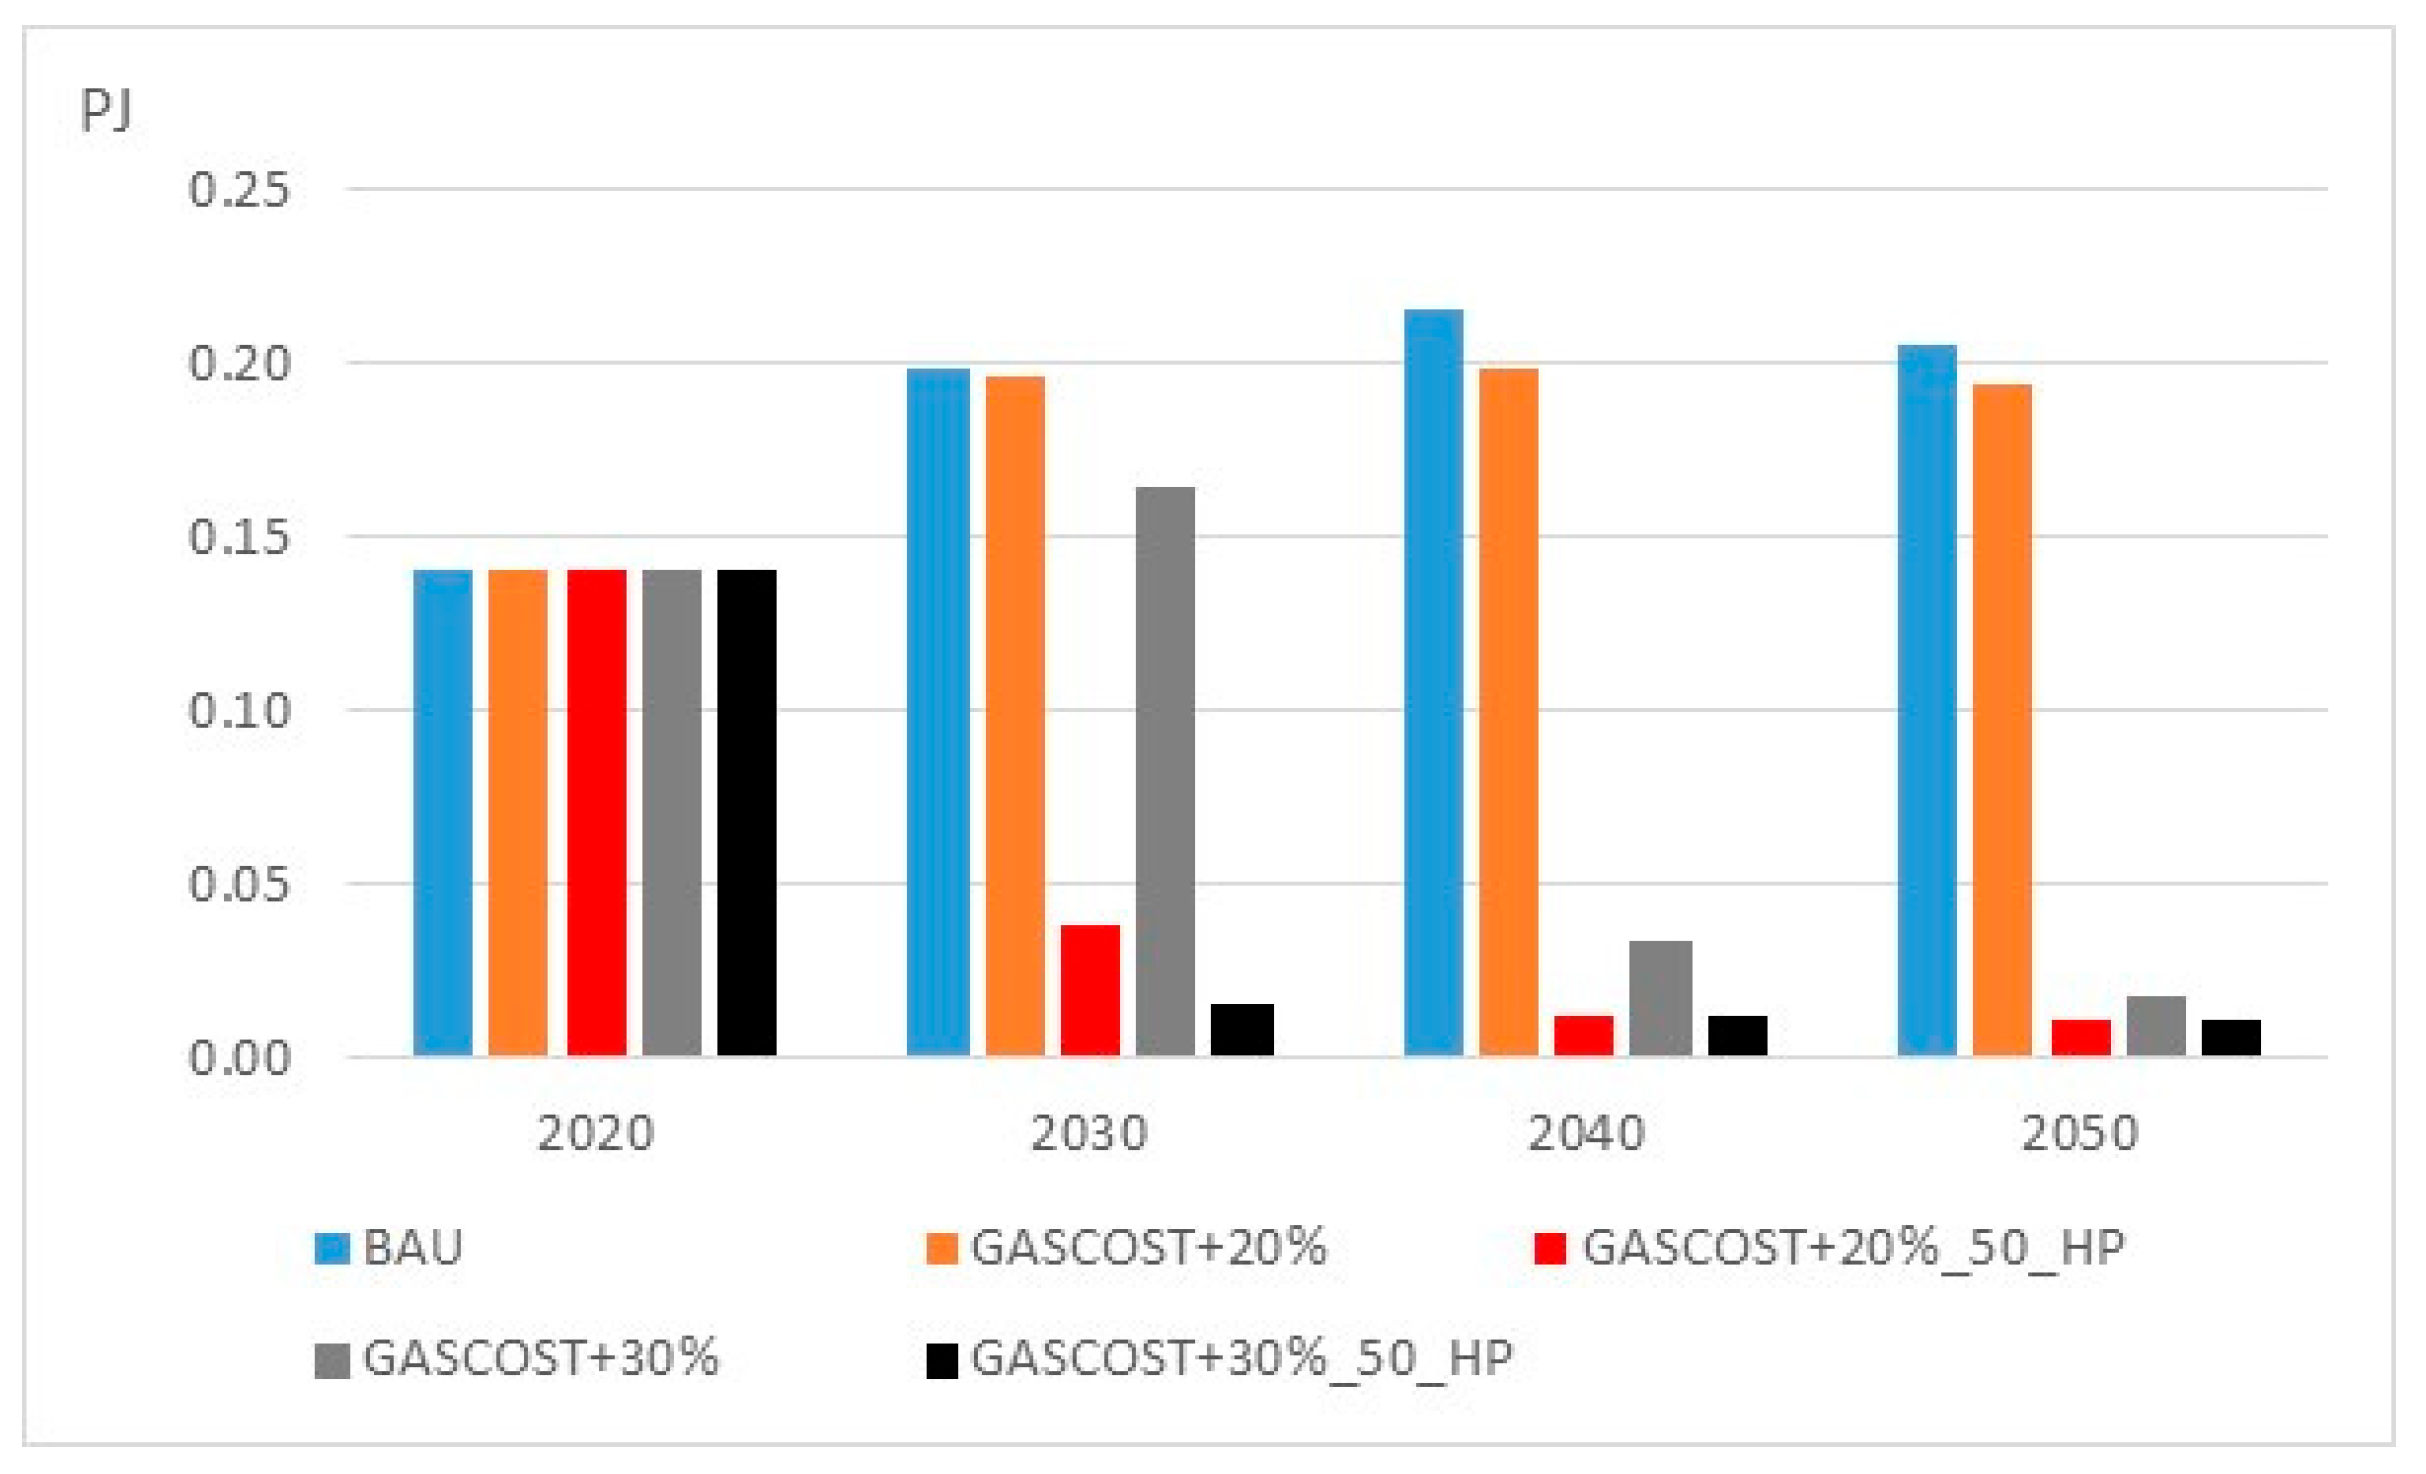
Figure 32.
Supply of electricity (PJ).
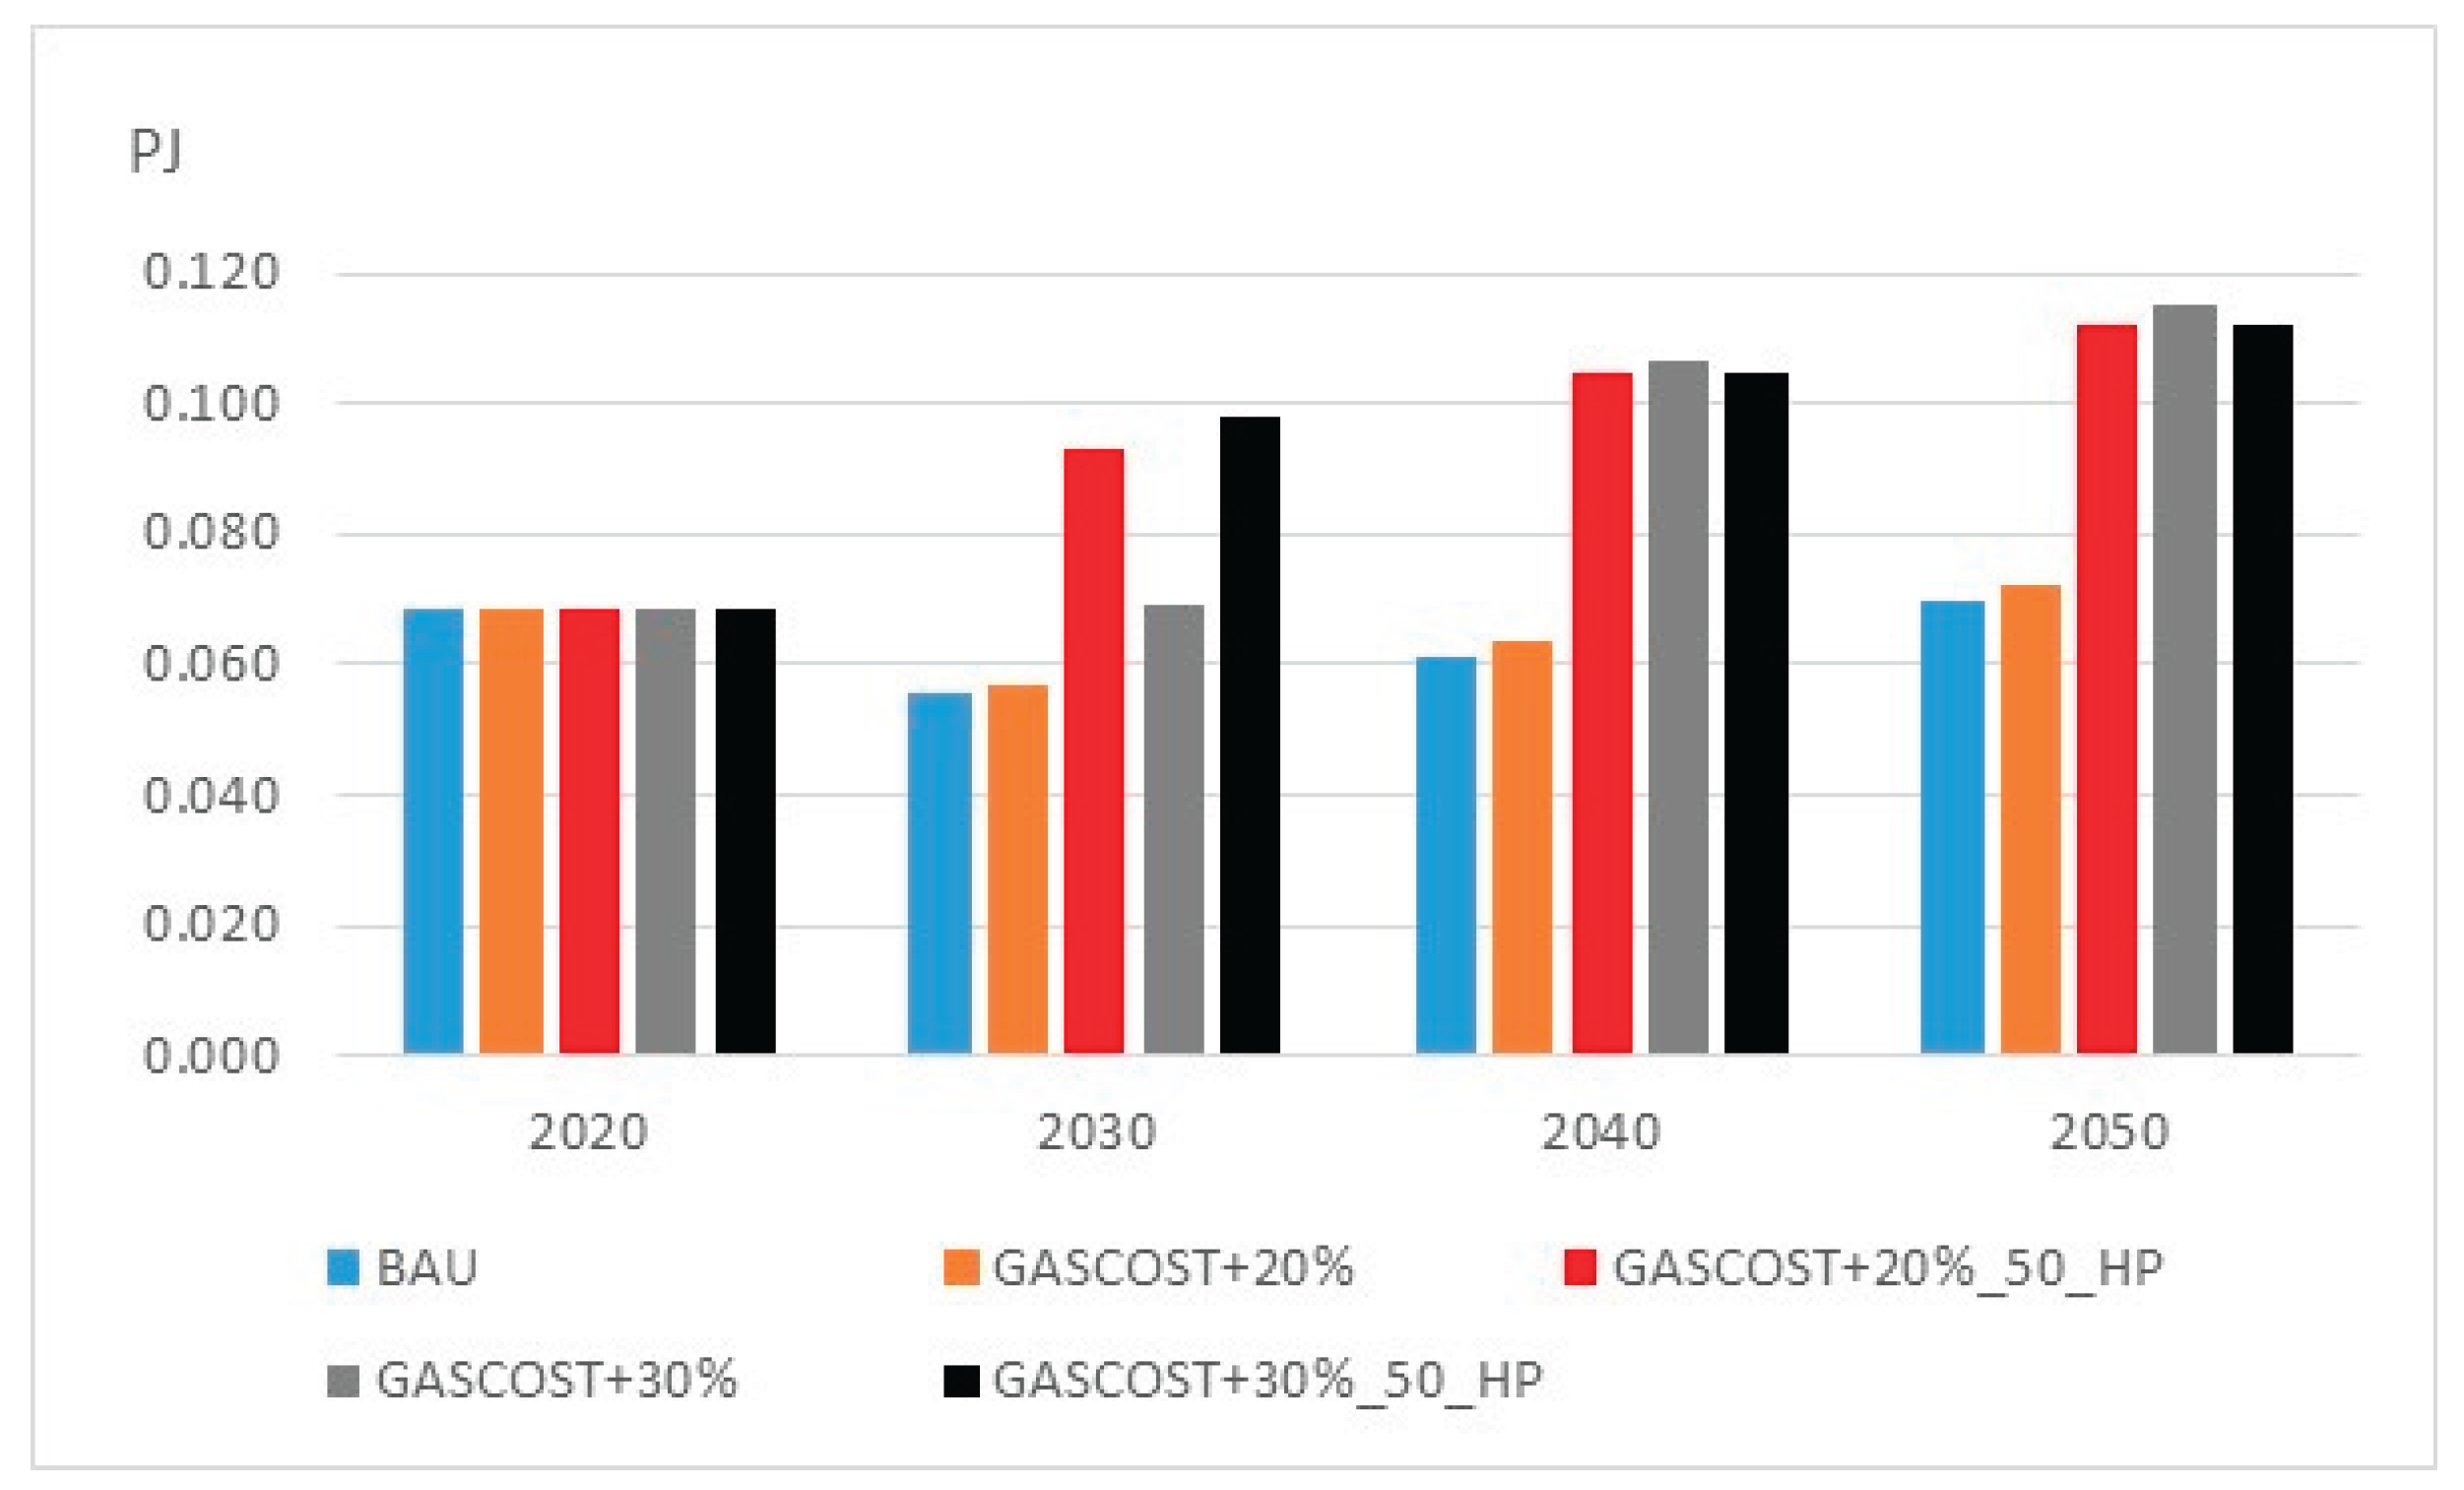
Figure 33.
CO2 emissions - BaU scenario (kton).
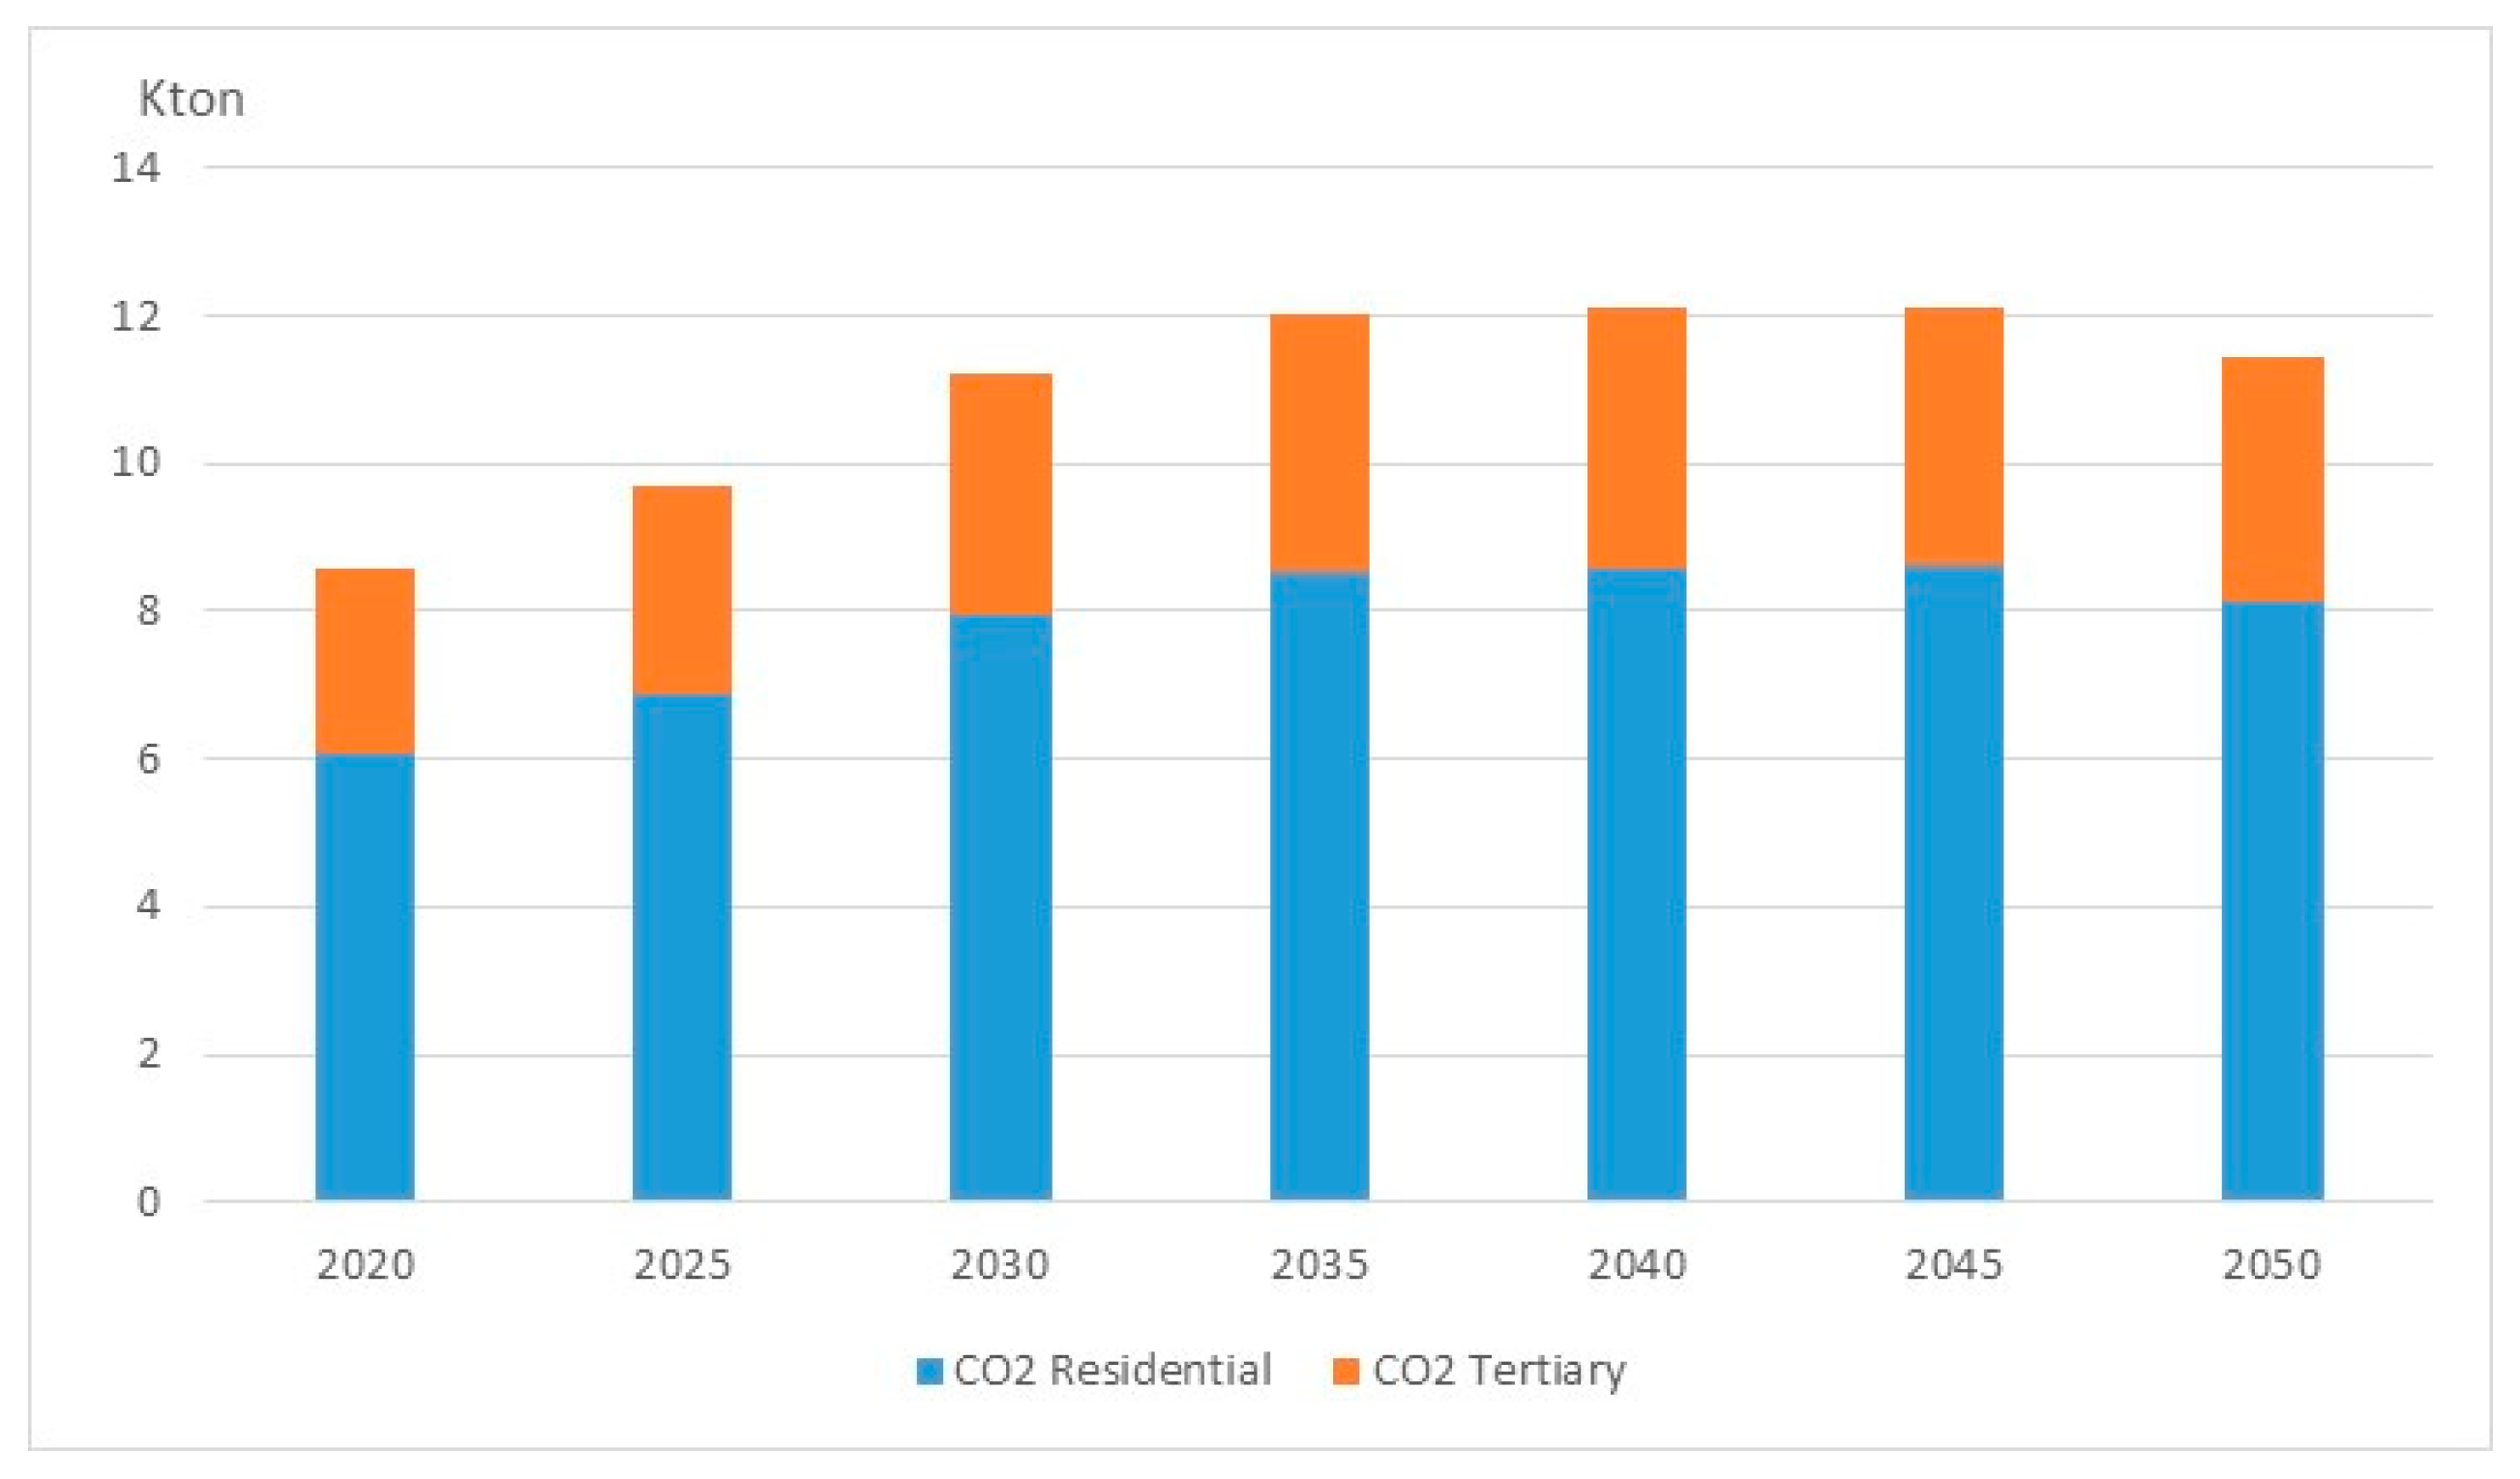
Figure 34.
Total CO2 emissions (kton).
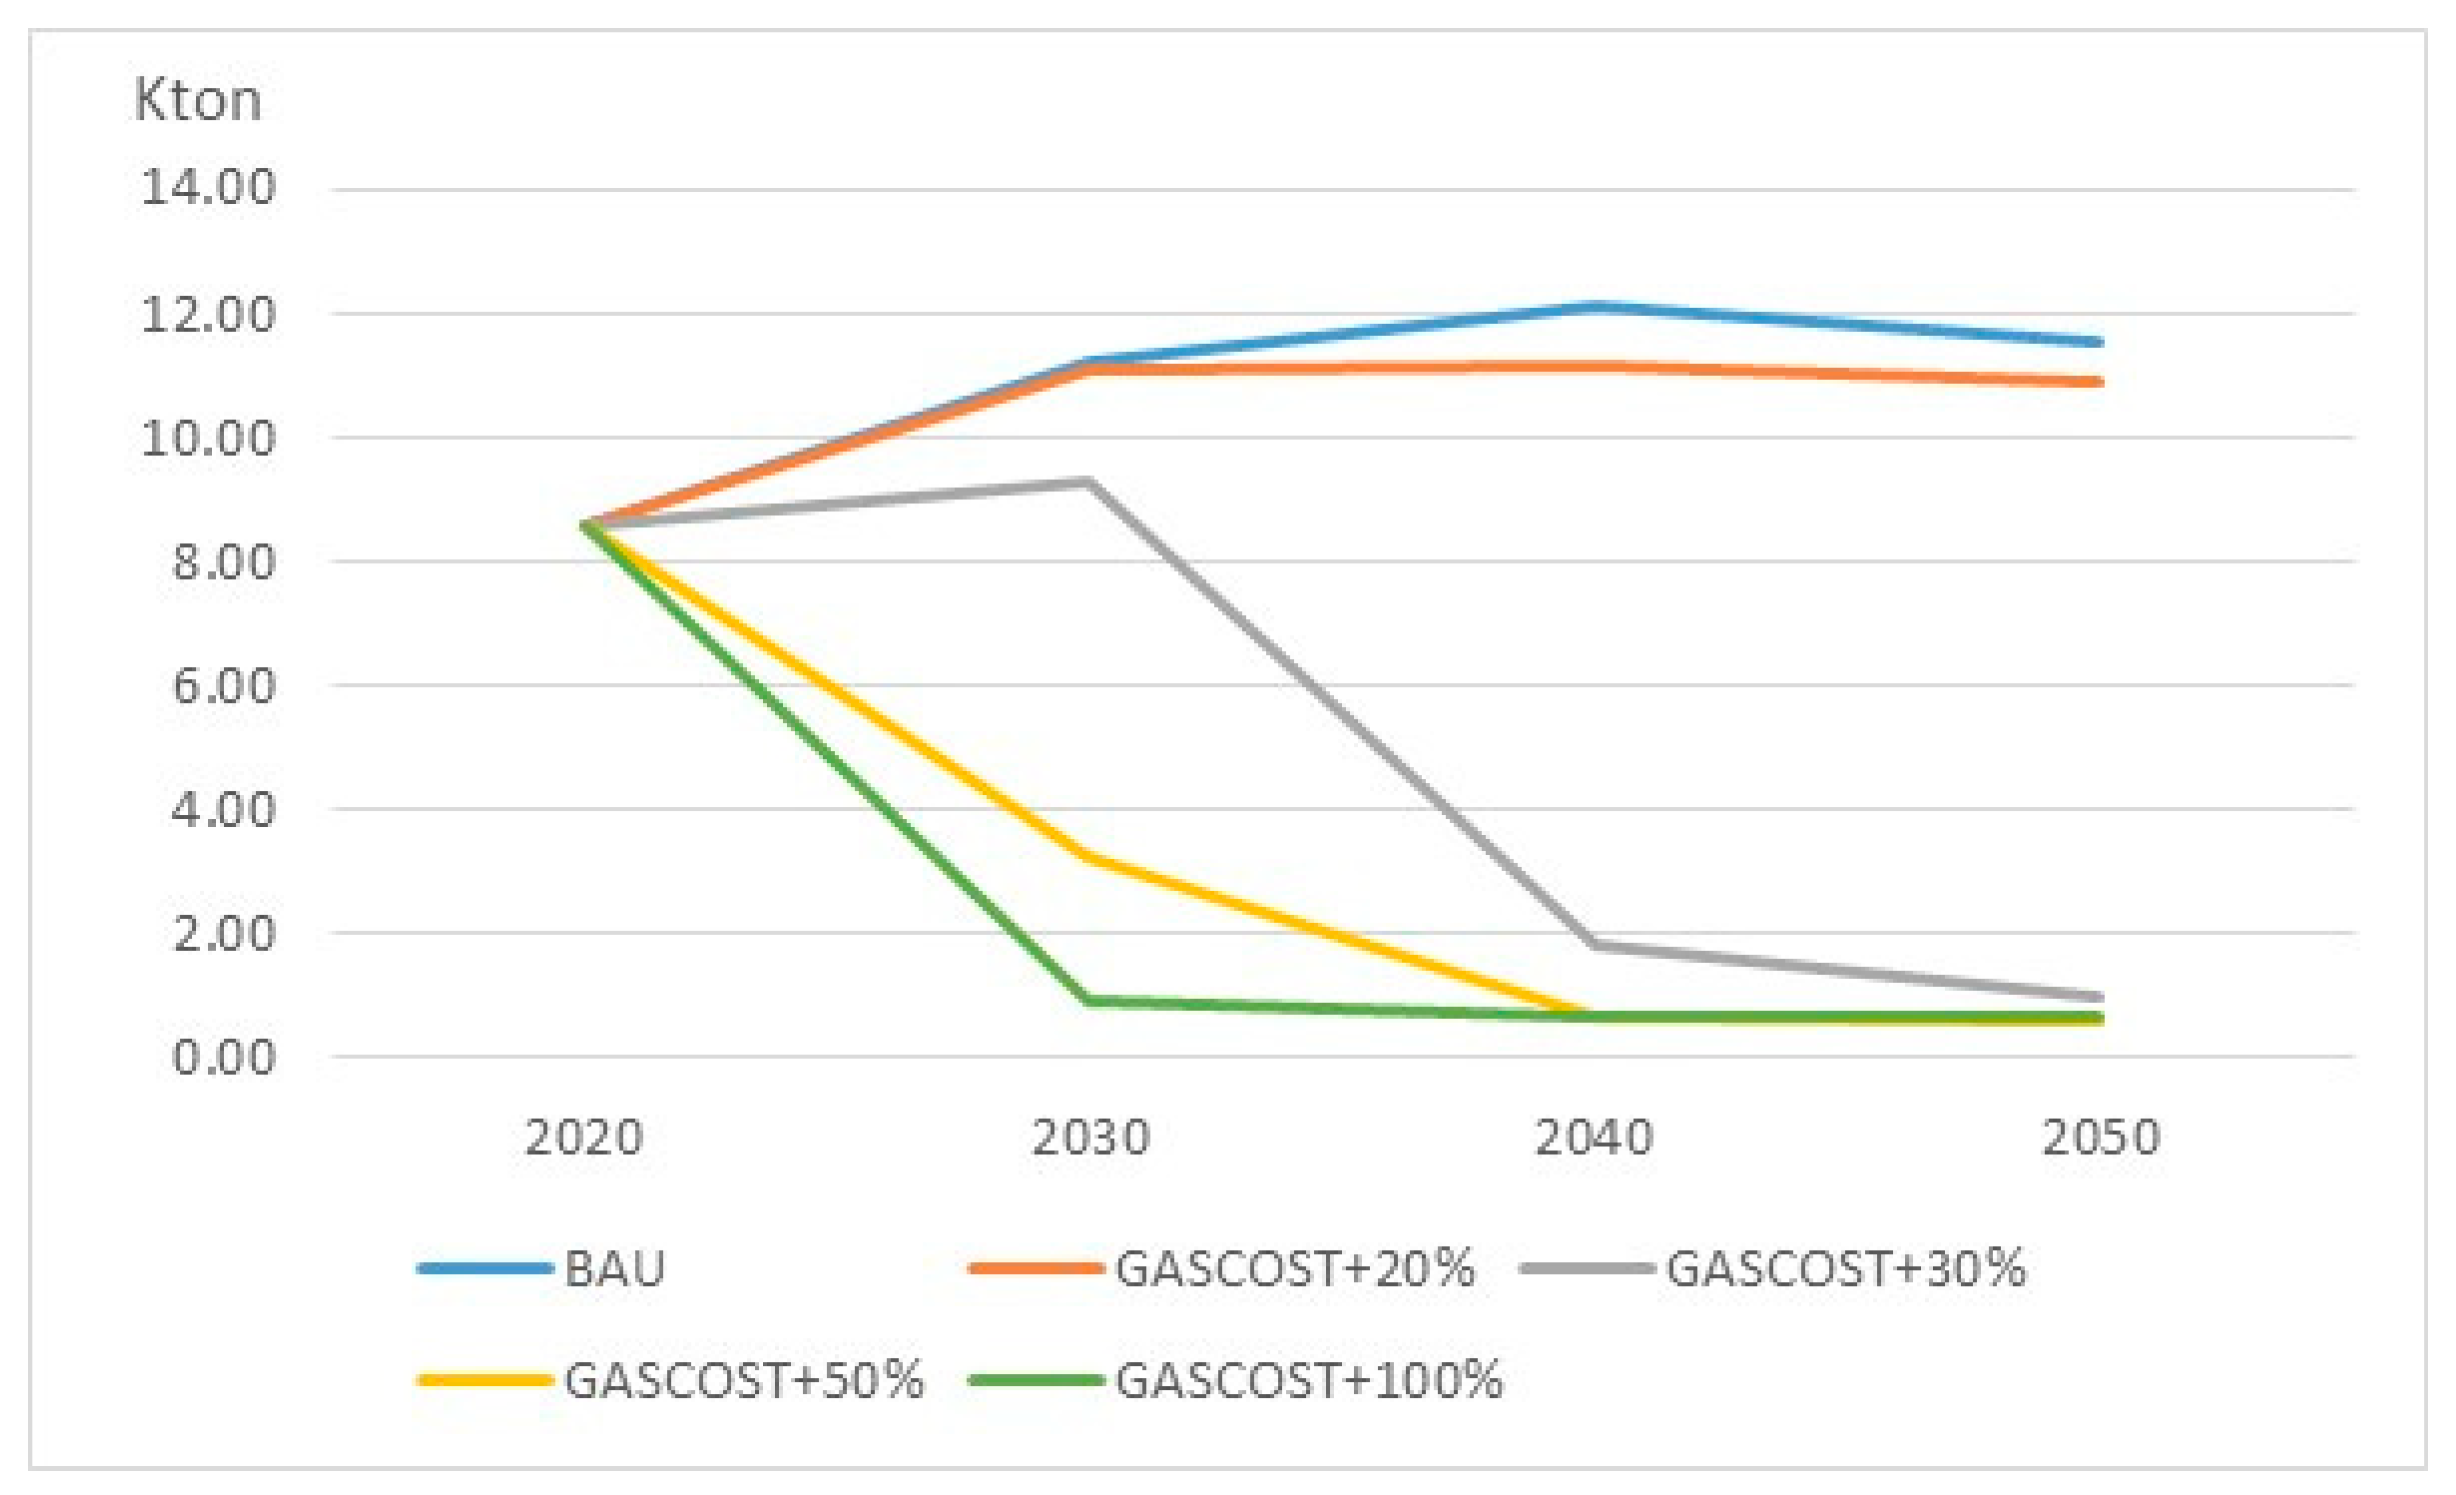
Figure 35.
Total CO2 emissions (PJ).
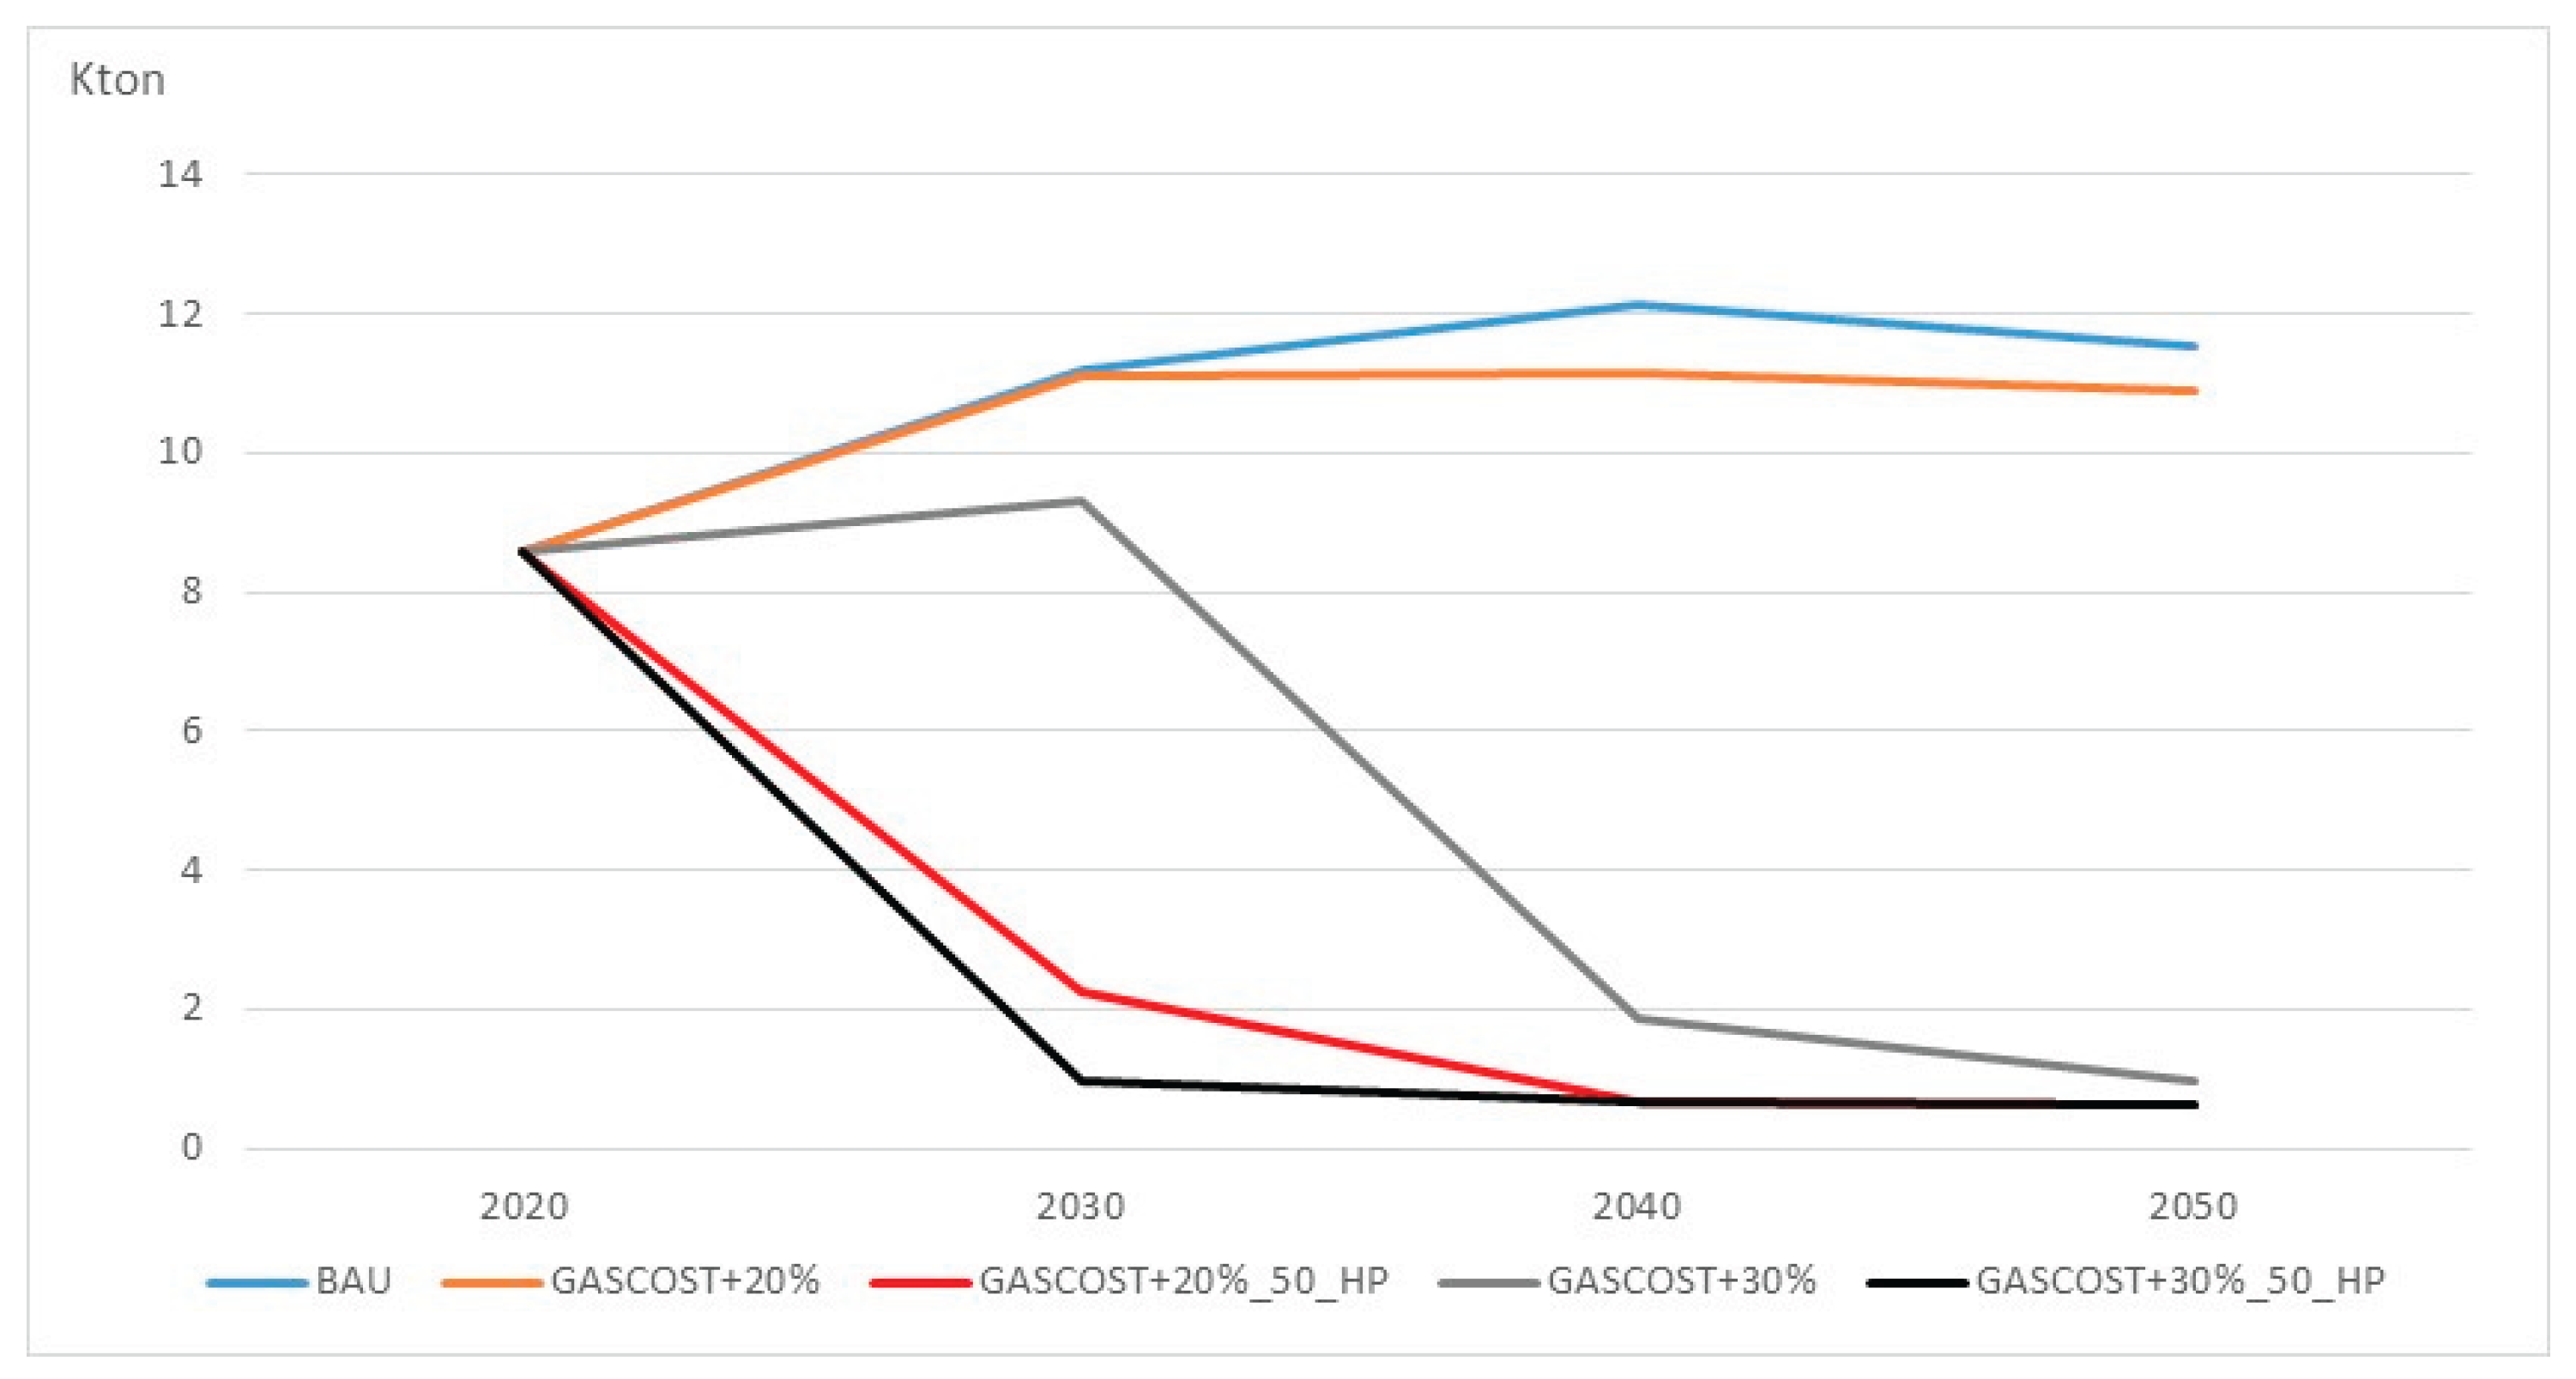
Table 1.
End use demands by sector
| Description | TIMES Code | Unit of measure | Description | TIMES Code | Unit of measure |
|---|---|---|---|---|---|
| Residential | Tertiary – Accommodation | ||||
| Space Heating | DRSH | Mm2 | Space Heating | DTASH | Mpresences |
| Water Heating | DRWH | Mliters | Water Heating | DTAWH | Mpresences |
| Space Cooling | DRSC | Mm2 | Space Cooling | DTASC | Mpresences |
| Cooking | DRCO | MUnit | Other Electric Uses | DTAOEU | Mpresences |
| Lighting | DRLG | Glumen | |||
| Other Electric Uses | DROEU | PJ | |||
| Tertiary – Food | Tertiary – Public Buildings | ||||
| Space Heating | DTCSH | MEmployees | Space Heating | DTPSH | Mm3 |
| Water Heating | DTCWH | MEmployees | Water Heating | DTPWH | Mm3 |
| Space Cooling | DTCSC | MEmployees | Space Cooling | DTPSC | Mm3 |
| Other Electric Uses | DTCOEU | MEmployees | Other Electric Uses | DTPOEU | Mm3 |
| Tertiary – Private Offices | Tertiary – Shopping Buildings | ||||
| Space Heating | DTPOSH | MEmployees | Space Heating | DTPSH | Mm2 |
| Water Heating | DTPOWH | MEmployees | Water Heating | DTPWH | Mm2 |
| Space Cooling | DTPOSC | MEmployees | Space Cooling | DTPSC | Mm2 |
| Other Electric Uses | DTPOOEU | MEmployees | Other Electric Uses | DTPOEU | Mm2 |
| Tertiary – Healthcare | Tertiary – Schools | ||||
| Space Heating | DTHSH | MEmployees | Space Heating | DTPSH | Mm3 |
| Water Heating | DTHWH | MEmployees | Water Heating | DTPWH | Mm3 |
| Space Cooling | DTHSC | MEmployees | Other Electric Uses | DTPOEU | Mm3 |
| Other Electric Uses | DTHOEU | MEmployees | |||
Table 2.
Energy consumption of the residential sector by end-uses - year 2020 (TJ).
| Natural gas | LPG | Solar Thermal | Biomass | Electricity | Total | |
|---|---|---|---|---|---|---|
| Space Heating | 61 | 3.5 | 104 | 0.5 | 169 | |
| Water Heating | 26 | 1.8 | 1.2 | 3.3 | 32.3 | |
| Space Cooling | 0.7 | 0.7 | ||||
| Lighting | 3.2 | 3.2 | ||||
| Cooking | 13 | 1.8 | 0.9 | 15.7 | ||
| Other Electric Uses | 15 | 15 | ||||
| Total | 100 | 7.1 | 1.2 | 104 | 23.6 | 235.9 |
Table 3.
Sectoral end-use demands in Residential – year 2020.
| End-use demands | Unit of measure | Values |
| Space Heating | Mm2 | 0.423 |
| Water Heating | Mliters | 104.6 |
| Space Cooling | Mm2 | 0.212 |
| Cooking | Munit | 0.0072 |
| Lighting | Glumen | 0.064 |
| Other Electric Uses | PJ | 0.00083 |
Table 4.
Number of employees and energy consumption of the tertiary subsectors – year 2020.
| N. of Employees | Energy consumption (TJ) | |
|---|---|---|
| Accommodation | 18 | 0.82 |
| Food | 107 | 4.8 |
| Schools | 115 | 5.2 |
| Public Buildings | 142 | 6.4 |
| Private Offices | 1042 | 47 |
| Shopping Buildings | 704 | 32 |
| Healthcare | 76 | 3.4 |
| Total | 2,204 | 99 |
Table 5.
Energy consumption of different sub-sectors for type of end-use – year 2020 (TJ).
| Space Heating | Water Heating | Space Cooling | Other Electric Uses | Total | |
|---|---|---|---|---|---|
| Accommodation | 0.16 | 0.23 | 0.1 | 0.33 | 0.82 |
| Food | 0.94 | 1.3 | 0.6 | 2 | 4.8 |
| Schools | 4.6 | 0.04 | 0 | 0.57 | 5.2 |
| Public Buildings | 4.6 | 0.04 | 0.73 | 0.99 | 6.4 |
| Private Offices | 37 | 0.33 | 5.8 | 3.6 | 47 |
| Shopping Buildings | 14 | 2.3 | 7.9 | 7.7 | 32 |
| Healthcare | 1.3 | 0.25 | 0.23 | 1.6 | 3.4 |
| Total | 63 | 4.5 | 15 | 17 | 99 |
Table 6.
Energy consumption of tertiary sub-sectors, by end-use and energy source – year 2020 (TJ).
| Natural gas | Electricity | LPG | Diesel | Solar Thermal | Total | |
|---|---|---|---|---|---|---|
| Accommodation | 0.23 | 0.48 | 0.01 | 0.003 | 0.01 | 0.82 |
| Space Heating | 0.095 | 0.017 | 0.006 | 0.001 | 0.16 | |
| Water Heating | 0.13 | 0.024 | 0.009 | 0.002 | 0.01 | 0.22 |
| Space Cooling | 0.1 | 0.1 | ||||
| Other Uses | 0.335 | 0.33 | ||||
| Food | 1.33 | 2.84 | 0.09 | 0.02 | 0.06 | 4.8 |
| Space Heating | 0.55 | 0.1 | 0.04 | 0.01 | 0.93 | |
| Water Heating | 0.78 | 0.14 | 0.05 | 0.01 | 0.06 | 1.3 |
| Space Cooling | 0.6 | 0.6 | ||||
| Other Uses | 2 | 2 | ||||
| Schools | 2.7 | 1.1 | 0.2 | 0.032 | 0.002 | 5.2 |
| Space Heating | 2.7 | 0.49 | 0.18 | 0.03 | 4.5 | |
| Water Heating | 0.025 | 0.005 | 0.002 | 0.0003 | 0.002 | 0.04 |
| Other Uses | 0.6 | 0.6 | ||||
| Public Building | 2.8 | 2.2 | 0.2 | 0.033 | 0.002 | 6.4 |
| Space Heating | 2.7 | 0.5 | 0.18 | 0.0325 | 4.5 | |
| Water Heating | 0.026 | 0.0048 | 0.0017 | 0.0003 | 0.002 | 0.043 |
| Space Cooling | 0.7 | 0.7 | ||||
| Other Uses | 1 | 1 | ||||
| Private Offices | 22 | 14 | 1 | 0.3 | 0.02 | 47 |
| Space Heating | 22 | 4 | 1 | 0.3 | 36 | |
| Water Heating | 0.2 | 0.035 | 0.013 | 0.0023 | 0.02 | 0.32 |
| Space Cooling | 5.9 | 5.9 | ||||
| Other Uses | 3.7 | 3.7 | ||||
| Shopping Buildings | 9.6 | 18 | 0.62 | 0.11 | 0.11 | 32 |
| Space Heating | 8.2 | 1.5 | 0.53 | 0.097 | 14 | |
| Water Heating | 1.3 | 0.24 | 0.088 | 0.016 | 0.11 | 2.2 |
| Space Cooling | 8.1 | 8.1 | ||||
| Other Uses | 7.8 | 7.8 | ||||
| Healthcare | 0.94 | 2 | 0.06 | 0.01 | 0.01 | 3.4 |
| Space Heating | 0.8 | 0.14 | 0.052 | 0.009 | 1.3 | |
| Water Heating | 0.15 | 0.026 | 0.009 | 0.002 | 0.01 | 0.24 |
| Space Cooling | 0.2 | 0.2 | ||||
| Other Uses | 1.6 | 1.6 | ||||
| Total | 41 | 40 | 2.7 | 0.48 | 0.21 | 99 |
Table 7.
Local electricity production from photovoltaic systems.
| Localization | Capacity (kW) |
Electricity Production (TJ) | Self-consumption (TJ) | Transferred to the national grid (TJ) |
|---|---|---|---|---|
| Residential | 367 | 1.5 | 0.4 | 1 |
| Tertiary | 466 | 1.9 | 1 | 0.9 |
| Industrial-Ground | 17’942 | 72.4 | 72.5 | |
| Total | 18’775 | 75.8 | 1.4 | 74.4 |
Table 8.
Energy balance (TJ) – Year 2020.
| Flow/ Product | Natural gas | LPG | Diesel | Electricity | Biomass | Solar Thermal | Total |
|---|---|---|---|---|---|---|---|
| Import | 141 | 9.73 | 0.48 | 62 | 104 | 317.2 | |
| Local production | 3.4 | 1.4 | 4.8 | ||||
| Export | 2 | 2 | |||||
| Residential Consumption | 100 | 7.07 | 23.6 | 104 | 1.2 | 235.9 | |
| Tertiary Consumption | 41 | 2.66 | 0.48 | 40 | 0.2 | 84.4 |
Table 9.
Demographic drivers of end-use demand.
| Year | 2020 | 2021 | 2025 | 2030 | 2035 | 2040 | 2045 | 2050 | ||
| Population | 7162 | 7147 | 7083 | 6941 | 6740 | 6497 | 6333 | 6142 | ||
| Average number of member per family | 2.52 | 2.49 | 2.44 | 2.36 | 2.28 | 2.20 | 2.12 | 2.03 | ||
| Families | 2847 | 2868 | 2901 | 2941 | 2958 | 2957 | 2993 | 3020 | ||
Table 10.
Demand projections by end-use in the residential sector (2020-2050).
| Unit | 2020 | 2025 | 2030 | 2035 | 2040 | 2045 | 2050 | |
| Space Heating | Mm2 | 0.423 | 0.431 | 0.437 | 0.440 | 0.440 | 0.445 | 0.449 |
| Water Heating | MLiters | 105 | 116 | 127 | 123 | 119 | 116 | 112 |
| Space Cooling | Mm2 | 0.212 | 0.215 | 0.218 | 0.220 | 0.220 | 0.222 | 0.224 |
| Cooking | MUnit | 0.0072 | 0.0071 | 0.0069 | 0.0067 | 0.0065 | 0.0063 | 0.0061 |
| Lighting | Glumen | 0.063 | 0.065 | 0.066 | 0.066 | 0.066 | 0.067 | 0.067 |
| Other electric uses | PJ | 0.00083 | 0.00084 | 0.00085 | 0.00086 | 0.00086 | 0.00087 | 0.00088 |
Table 11.
Energy demand projections of the tertiary subsectors.
| Unit | 2020 | 2025 | 2030 | 2035 | 2040 | 2045 | 2050 | |
| Accommodation | MPresence | 0.017 | 0.022 | 0.023 | 0.024 | 0.025 | 0.026 | 0.027 |
| Food | MEmployees | 0.000107 | 0.000103 | 0.000105 | 0.000107 | 0.000109 | 0.000111 | 0.000113 |
| Schools | Mm3 | 0.0262 | 0.0262 | 0.0262 | 0.0262 | 0.0262 | 0.0262 | 0.0262 |
| Public Buildings | Mm3 | 0.0088 | 0.0088 | 0.0088 | 0.0088 | 0.0088 | 0.0088 | 0.0088 |
| Private Offices | MEmployees | 0.0010 | 0.0012 | 0.0013 | 0.0014 | 0.0016 | 0.0017 | 0.0018 |
| Shopping Buildings | Mm2 | 0.045 | 0.047 | 0.050 | 0.052 | 0.055 | 0.057 | 0.060 |
| Healthcare | MEmployees | 0.00008 | 0.00010 | 0.00013 | 0.00016 | 0.00018 | 0.00021 | 0.00024 |
Table 12.
Sensitivity analysis with increase in natural gas costs and 50% reduction in heat pump investment costs.
Table 12.
Sensitivity analysis with increase in natural gas costs and 50% reduction in heat pump investment costs.
| Cases | Increase in the purchase cost of natural gas | Investment costs for heating pumps |
|---|---|---|
| GASCOST+20%_50_HP | +20% | -50% |
| GASCOST+30%_50_HP | +30% | -50% |
| GASCOST+50%_50_HP | +50% | -50% |
| GASCOST+100%_50_HP | +100% | -50% |
Disclaimer/Publisher’s Note: The statements, opinions and data contained in all publications are solely those of the individual author(s) and contributor(s) and not of MDPI and/or the editor(s). MDPI and/or the editor(s) disclaim responsibility for any injury to people or property resulting from any ideas, methods, instructions or products referred to in the content. |
© 2025 by the authors. Licensee MDPI, Basel, Switzerland. This article is an open access article distributed under the terms and conditions of the Creative Commons Attribution (CC BY) license (http://creativecommons.org/licenses/by/4.0/).
Copyright: This open access article is published under a Creative Commons CC BY 4.0 license, which permit the free download, distribution, and reuse, provided that the author and preprint are cited in any reuse.


