
Submitted:
09 April 2025
Posted:
09 April 2025
You are already at the latest version
Abstract
The integration of energy sectors and the optimisation of resource use are fundamental elements of sustainable development. This study presents a model for analysing energy use based on the structure of Energy Cost Centres (ECCs). The model facilitates a systematic identification and optimisation of energy flows in industrial and urban environments. The developed methodology was tested on a case study of an energy-intensive industry, where we analysed the potential utilisation of renewable energy sources, hydrogen production, electricity storage, and the use of excess heat for the local community. The results indicate that the systematic application of the model could achieve total electricity savings of 9,598 MWh, alongside 4,116,850 Nm³ of natural gas savings through excess heat utilisation. These measures collectively contribute to an annual CO₂ emissions reduction of 10,984 tonnes. The approach enhances the integration of sustainable energy solutions, strengthens stakeholder collaboration, and increases the economic viability of projects. Moreover, the model can be adapted for use in other industrial and urban settings. Despite potential barriers such as data availability and initial implementation costs, the results confirm the approach´s value in the strategic planning of sustainable energy systems.
Keywords:
energy community
; energy sector coupling
; energy cost centre
; sustainable energy projects
1. Introduction
The energy transition, driven by the increased use of renewable energy sources, digitalisation, and the decentralisation of energy systems, presents new challenges in cost management and system optimisation. In this context, the concept of energy communities is gaining increasing significance [1], as it enables local energy production, sharing, and consumption, thereby contributing to greater sustainability and reducing dependence on centralised energy sources. Their role in energy democracy and the decentralisation of energy systems is crucial [2]. Energy communities hold considerable potential for the transition to renewable energy sources and the achievement of sustainability goals [3]. Sustainable development requires efficient energy management and continuous environmental stewardship. Ambitious environmental and energy targets cannot be achieved without systematic planning of sustainable energy infrastructure, integration of energy sectors, and the active involvement of local energy communities. Local authorities must support improved spatial planning and long-term investment policies for sustainable projects. Moreover, all stakeholders must collaborate in developing a portfolio of feasible sustainable projects and use their practical experience to propose regulatory changes that enhance the achievement of environmental and energy goals.
A systematic approach is essential for sustainable local planning and sector coupling. The realisation of energy and environmental objectives by individual stakeholders must be based on a thorough analysis of the business environment, relevant development plans, complex modelling, and simulations of selected solutions to determine the optimal system configuration and project parameters. The coupling of different energy sectors and the strategic alignment of infrastructure investments are key to ensuring economic viability and long-term sustainability.
As noted by Mišljenović et al. [4], energy management systems and appropriate organisational structures for prosumers are essential for the efficient operation of energy communities. Optimising the performance of these communities requires suitable economic evaluation methods. Bohvalovs et al. [5] propose differential evolutionary optimisation as a tool for improving cost efficiency. Organisational and economic mechanisms for enhancing energy cost management in the industrial sector have also been explored [6], providing a reference framework for analysing the cost structures of energy communities. In the industrial sector, energy cost management is of paramount importance [7,8,9]. The concept of Energy Cost Centres (ECC) facilitates a detailed analysis of energy consumption at various organisational levels [10]. Despite the proven effectiveness of this approach in industry, its application in energy communities and the coupling of energy sectors has not yet been systematically investigated. Integrating ECC could enable a more precise quantification of economic synergies and the development of effective business models.
Despite extensive research in the fields of energy communities and energy sector coupling, several critical questions remain unresolved. Firstly, existing methods for assessing the economic impacts of energy communities often focus on macroeconomic indicators or basic investment evaluations, frequently overlooking detailed analyses of operational costs and internal cost structures [11]. Lode et al. [12] observe that economic aspects are often neglected in favour of technical and social factors when analysing pilot projects of energy communities. Secondly, research on sector coupling in energy systems primarily concentrates on technical synergies and grid stability impacts, whereas the economic component is often of secondary importance [13]. However, comprehensive economic analyses, including cost structures of energy communities, are required for a holistic assessment of the sustainability of energy and climate policies in EU countries [14].
The central question addressed in this article is how the concept of ECCs can contribute to a more precise evaluation and optimisation of cost structures in energy communities and how its integration can enhance analysis in the context of energy sector coupling.
The primary objective of this article is to explore the applicability of the ECC model within energy communities and energy sector coupling and to assess how this approach can contribute to improved financial management and cost optimisation in decentralised energy systems. Specifically, the following aspects will be examined:
- Adaptation of the ECC model to the specific cost structures of energy communities;
- The application of ECCs for enhanced analysis of the integration of different energy sectors (electricity, heating, natural gas, hydrogen, renewable energy sources);
- Development of a methodological framework for quantifying sector synergies and assessing economic benefits in decentralised energy systems.
The subsequent sections of this article are structured as follows: Chapter 2 presents a review of research in the fields of energy communities, energy sector coupling, and the application of the ECC model. Chapter 3 describes the methodology used in this research, including approaches to modelling and analysing energy communities. Chapter 4 provides the results of the use case analysis and their interpretation, while Chapter 5 discusses the findings and compares them with existing studies. Finally, Chapter 6 outlines the main conclusions of the research and suggests possible directions for further work in this field.
The presented approach enables a more effective integration of sustainable energy solutions, strengthens stakeholder collaboration, and improves the economic viability of projects. Furthermore, the model can be adapted for use in other industrial and urban environments. While challenges such as data availability and initial implementation costs may arise, the findings of this study confirm its applicability and value in the strategic planning of sustainable energy systems.
2. Materials and Methods
At the outset of planning a sustainable energy project and assessing its feasibility, it is essential to identify and highlight the key processes and energy conversions that will be addressed in the project. Additionally, all relevant processes that act as sources or sinks of energy and material flows, as well as the stakeholders who own or manage these processes, must be identified. This step establishes the boundaries of the business or social environment encompassed by the planned sustainable energy project.
There are several possible methods for representing processes, their interconnections, and energy and material flows. One such approach is using the structure of ECCs. This procedure is symbolically illustrated in Figure 1.
2.1. Presentation of Systems with the Structure of Energy Cost Centres
When studying production processes, it can be observed that environmental impacts and pollution are the result of energy use and material processing. When energy or material is not used, there are no environmental impacts. If the use of energy and materials is optimised, the environmental impacts are minimal. The production process is a combination of people, equipment, raw materials, processing procedures, and the constraints imposed by the environment. The process is a planned sequence of activities that require space, time, knowledge, and input resources, which are transformed into an output value with added value based on the input resources. The dynamics of interactions between all these factors determine the energy efficiency and environmental impacts of the process under consideration. The scope of the output products determines the type and extent of environmental impacts. The process is also a source of data with which we can assess production results, resource use, energy efficiency, and environmental impacts [10].
The basis for managing energy and environmental impacts is regular measurement of energy use and other resources, linking them to production and activities within it, calculating efficiency factors, and comparing them to some standard or target value. The next step is decentralising responsibility for energy effects and environmental impacts across the production chain and determining responsibility centres for costs, energy effects, and environmental impacts. Since, in the context of energy and environmental management, energy costs can be unequivocally determined by measuring the amount of each type of energy used in the process, these responsibility centres are called ECCs. This approach also allows for the allocation of responsibility for the efficiency of each ECC to a specific person or group of people [10].
When studying processes, we must identify the physical processes or components of energy and production systems from the perspective of supply and demand in production. For this purpose, process flow diagrams and single-line diagrams are typically used. Single-line diagrams provide an overview of the entire energy system and show the rated capacities, production, distribution, and use of energy in forms characteristic of the current state of the system. A simplified single-line diagram can also be called an energy flow diagram. Process flow diagrams combine data from operational processes for the purpose of production management, record current operating conditions, and guide analysis in a logical direction from raw materials at the input, through various stages of production, to the final product. They also show the sequence of tasks with associated input and output values, activities, and opportunities for assigning responsibility. Such diagrams represent a simplified structured picture of processes and constitute the production chain and work process within a company. When combining the energy flow diagram and the process flow diagram, important information is obtained about where, why, and what type of energy is used. This scheme can be the basis for decisions about establishing ECCs. The leading principle when determining ECCs is to follow the phases of the production process as defined by the process flow diagram. ECCs are typically established to align with the boundaries of production control (e.g., departments). From an energy perspective, determining ECCs is straightforward, as each energy system can be treated as its own ECC (e.g., a boiler room, compressor station, air conditioning system, etc.). There are no strict rules for determining ECCs, but there are several criteria to consider:
- The process or activity requiring energy must have a measurable output value;
- Energy use and/or environmental impact can be measured directly;
- The cost of measurement should not exceed 10 to 20% of the annual costs for aligning;
- ECCs with environmental legislation requirements;
- Responsibility for energy effects and environmental impacts in a particular area can be assigned to the person working in or responsible for that area;
- A standardized performance metric can be defined;
- Realistic goals can be set, and efficiency improvements can be monitored [10].
The ECC model allows for systematic analysis and optimisation of resource use, but when determining the optimal structure, it is crucial to consider the model's sensitivity to various input parameters, such as seasonal variations in energy use, fluctuations in energy prices, and technological changes in industrial processes.
2.2. Model for Energy Use Analysis Based on Energy Cost Centres
Within the defined boundaries of the project, the energy field is integrated into process flow diagrams, which form the basis for decisions on the establishment of ECCs, the fundamental elements of the entire sustainable energy project model. At the conceptual level, the ECC-based approach falls into the family of integrated process planning or process synthesis methods [15]. Due to its simplicity and successful use in numerous industrial applications worldwide, pinch analysis is the most commonly used methodology for integrated process planning [16,17]. According to [15], an ECC can be any department, part of a department, or machine that converts large amounts of energy or creates significant environmental impacts. With the ECC structure, material and energy flows through the production process under consideration, their basic conversions, and input/output connections with the environment can be schematically represented. The ECC model structure is defined by a set of signals determined for each system segment. Modelling and process integration based on ECCs are often used to improve production control, explore flexibility, and record current operational conditions [15]. The ECC structure can also be used to identify environmental impacts from individual parts of the production process where various energy sources are used. The goal of designing sustainable energy projects is also to have a positive impact on the economic and social standing of people in the local community while simultaneously reducing negative environmental impacts. Therefore, the ECC structure can also include social and sociological impacts of the sustainable energy project.
Model validation was conducted through extensive data collection on current energy use and the simulation of various resource optimisation scenarios. Special attention was given to verifying the impact of different energy storage strategies and system flexibility on energy efficiency.
The system diagram in the form of ECC is a suitable starting point for creating a block diagram of the future system. A block diagram is a schematic representation of identified energy sources and sinks, all significant energy conversions, and the physical connections between them. The block diagram already indicates the scope and structure of the future system to be built within the framework of the sustainable energy project.
Recently, the importance of advanced simulation methods based on ECC integration has increasingly been recognised as key elements for improving control and optimising energy use. As stated by Sučić et al. [18], the use of such simulations allows for precise identification of energy flows and provides a realistic assessment of improvement potentials in existing and planned energy systems. The authors emphasise that the ECC structure, which includes the breakdown of energy consumption and production and its integration with control and analytical tools, significantly contributes to identifying and eliminating inefficiencies in complex urban energy networks. Furthermore, their approach highlights the importance of involving various stakeholders—from building managers and energy specialists to representatives of local communities and investors. Such collaboration not only increases the transparency of the entire process but also enables adjustments to system solutions according to specific needs and changes in the environment. The results of their research clearly demonstrate that a multidisciplinary approach, combining advanced simulations with ECC integration, provides a solid foundation for developing sustainable and adaptable energy systems, which is essential for the successful implementation of advanced energy community projects.
2.3. Case Study: Improving Energy Efficiency, Increasing RES Generation and Reducing CO₂ Emissions in the Local Community in Slovenia
The research was focused on improving energy efficiency, increasing electricity production from renewable energy sources (RES), and reducing emissions in energy-intensive industries in cooperation with the local community. The local community under consideration comprises 21,735 inhabitants (data for 2022). According to the Sustainable Energy and Climate Action Plan (SECAP) of the local community [19], the total final energy consumption in 2021 amounted to 1,063,662 MWh. Of this, the industrial and service sectors accounted for 813,765 MWh, households for 114,324 MWh, municipal public buildings for 8,225 MWh, transport (excluding transit traffic) for 126,820 MWh, and public lighting for 528 MWh. Among energy sources, natural gas ranked first in terms of energy quantity with 460,004 MWh, followed by electricity with 397,660 MWh, liquid fuels with 141,792 MWh, district heating with 38,421 MWh, and woody biomass with 25,786 MWh. The dominant use of natural gas and 88 % of electricity consumption is primarily due to the needs of the energy-intensive industrial sector. Steel production, one of the most energy-intensive industrial processes [20], prevails in this sector.
The development of the steel industry is largely influenced by decisions made by public institutions that regulate new standards and stimulate demand through investment in public infrastructure and construction [21]. The concept of joint planning of sustainable energy projects and energy infrastructure was tested through the collaboration between a major steel producer in Slovenia and the local community in which it operates. The steel plant and the local district heating operator provided a real-life testing environment and all the necessary data to validate the proposed concept. Furthermore, the project team participated in drafting the community’s SECAP. This particular steel plant is among the most advanced in Europe in terms of energy use and environmental impact. Nonetheless, even in such large-scale systems, there remains room for improvement. Due to intense international competition, all steel plants are seeking ways to optimise production processes and reduce operational costs. According to [22], the steel plant in question has succeeded in lowering CO₂ emissions, reaching only 373 kg of CO₂ per tonne of steel products in 2021. This achievement was made possible through measures aimed at improving energy efficiency and deploying the best available technologies. However, additional CO₂ emission reductions are still feasible through on-site renewable electricity generation, local green hydrogen production, electricity cost reduction via demand-side management and improved forecasting, and especially through the reduction of natural gas and electricity consumption by utilising excess heat from the production process. A portion of this excess heat could be used in the community’s district heating system. Most residential and commercial buildings currently use natural gas-fuelled district heating systems for space heating and domestic hot water preparation.
3. Results
At the beginning of the study, an extensive series of interviews was conducted with selected representatives from the steelworks, local authorities, network operators, and local residents. During the planning process of the sustainable project, the consumption of all energy resources was analysed, including electricity, natural gas, heat, and hydrogen.
3.1. Identification of Energy and Material Flows and Representation Using the ECC Structure
Optimisation of production activities can be particularly successful if, during the analysis of the current situation and search for potential improvements, new methodologies and a broader, perhaps different context are considered than those used previously. The research objectives were therefore as follows:
- To assess the feasibility of producing electricity from renewable sources (solar, hydro potential);
- To explore the possibility of producing green hydrogen;
- To examine the potential for regulating electricity demand;
- To determine whether the proposed concept, supported by data from the district heating operator, could be used to upgrade the existing district heating system and as a decision-making tool for the steelworks to enhance their production processes.
Based on the collected data, a schematic representation of the proposed sustainable energy project within the ECC structure was developed, incorporating the key energy and material transformation processes relevant to the project’s design. The resulting diagram depicts the desired end state and is presented in Figure 2. Technological units and the interconnections between them that are not currently present on-site are specifically highlighted.
ECCs not directly included in the sustainable project but forming an important part of the local community (ECC 1 to ECC 5) are marked in light green. These elements remain relevant to the project, as its outcomes have an indirect impact on them—for example, by increasing the availability of affordable heat within the district heating system, enhancing the share of renewable energy sources, and reducing the community’s carbon footprint.
Elements that were either directly involved in the project or identified as prospective for implementation within the local community—particularly in the broader area surrounding the steel plant—are marked in dark green (ECC 6 to ECC 13).
The schematic representation of the sustainable energy project simplifies what would otherwise be very complex technological systems, such as steel production, as the focus of the project is not altering the technological production process. The key energy transformations that are intended to be explored in the project are highlighted. These are formulated as elements of the diagram, with input energy sources (natural gas and electricity), output energy flows necessary for the production process, and the supply of heat to the local community, as well as emissions (CO2, excess heat generated during production). Schematic elements necessary for partial self-sufficiency with renewable energy sources (photovoltaic power plant, small hydroelectric plant integrated into the cooling water system) and the production of green hydrogen (partly for internal use in production, partly for injection into the gas network) have been added. Electricity demand regulation can be partly ensured through coordinated operation of the hydrogen production unit and a newly added battery storage system. The existing battery storage, which is not owned by the steelworks but is connected to the internal network, is also shown in the diagram, as it can significantly influence the demand curve and provide system services to the steelworks (demand adjustment). In addition to energy flows, the diagram roughly shows material flows of input materials and output products and services of entire industry and service sector. The impact of production on the local community (emissions) and the potential use of excess heat from the production processes in the steelworks and in the local district heating system are also indicated.
In the ECC structure shown in Figure 2, input and output energy, material, and service vectors are systematically organised. Input vectors are formed as guides to which primary energy supply paths, material inputs, and services on one side are connected via measurement points, while individual ECCs are connected on the other side. The output guide connects the results of the production processes occurring in the ECCs with stakeholders who are the users of the results or who are affected by the results or emissions. The boundary of the planned sustainable energy project in Figure 2 is marked with a red dashed line. Any crossing of this boundary represents the exchange of physical or non-physical quantities with the external environment, and thus each crossing is equipped with a measurement point. All measurement points are listed in Table 1. The colour of the measuring point on Figure 2 indicates the status of the measurement point. Some measurement points represent physical meters that have already been installed on-site (green), while others do not physically exist but have their state indirectly calculated (yellow). For the implementation of the project, the installation of additional physical meters (blue) is planned, which will allow further indirect calculations (purple). Some measured values do not represent physical quantities but the scope of (system) services (red).
3.1.1. Electricity Production from Renewable Sources and Demand Management
The study focused on an objective assessment of the potential of renewable energy sources (RES) and the evaluation of possibilities for the direct use of all produced energy at the site of an energy-intensive industrial facility, such as the steelworks under consideration. The proposed approach evolved from the idea of linking electricity production from renewable sources with actual consumption, allowing the installation of photovoltaic (PV) or small hydroelectric power plants (SHP) without causing unnecessary costs for the grid. The implementation requires the analysis of large amounts of data, the establishment of small PV test facilities on selected roofs to objectively assess the impact of dust from the production process on future electricity generation, the evaluation of available roof areas near existing transformer stations, actual data on the available capacity of existing transformer stations, and an assessment of the network with a focus on the potential for generating and consuming produced electricity on-site. The proposed approach supports the optimisation of energy efficiency based on smart metering technologies for innovative data processing and knowledge use. It can also assist in the development of appropriate business models by providing advanced energy services and facilitating energy management.
The study documented a total potential for electricity production from RES of 7,257.4 MWh, of which 6,460 MWh is from PV power plants and 797.4 MWh from a SHP. Although the potential from the high electricity consumption in steel production only represents 2.24 %, it is still economically viable and worth exploiting. Details of the RES potential at the steelworks site are presented in sections 3.1.8 and 3.1.9.
3.1.2. Household Energy Use – ECC 1
The majority of the population in the studied local community resides in a densely populated area served by both the electricity grid and an extensive natural gas distribution network, as well as a district heating system. Additionally, 14 % of households—mostly in rural areas—use woody biomass for heating. Households are represented by ECC 1 in Figure 2. In 2021, household energy consumption was as follows: electricity (MP 12) – 44,753 MWh; natural gas (MP 13) – 9,991 MWh; heating oil (MP 14) – 14,956 MWh; woody biomass (MP 15) – 25,786 MWh; district heating (MP 16) – 18,826 MWh. Considering the emission factors for 2021, household energy use resulted in 25,004 tonnes of CO₂ emissions (MP 17).

Table 2.
CO₂ Emission Factors by Energy Carrier for Slovenia (2021).
| Energy Carrier | CO₂ Emission Factor |
|---|---|
| Electricity | 0.350 t CO₂ / MWh |
| Natural Gas | 0.184 t CO₂ / MWh; 0.00185215 t CO₂ / Nm³ |
| Gasoline | 0.249 t CO₂ / MWh |
| Diesel | 0.267 t CO₂ / MWh |
| Heating Oil | 0.270 t CO₂ / MWh |
| Woody Biomass | 0 t CO₂ / MWh (non-net source of CO₂ according to IPCC 1) |
1 Intergovernmental Panel on Climate Change.
3.1.3. Energy Use in Municipal Public Buildings – ECC 2
Most municipal public buildings (schools, kindergartens, hospitals, sports halls, etc.) are connected to the district heating system, which represented the primary energy source in 2021 with 5,830 MWh (MP 22). To a lesser extent, heating oil (15 MWh, MP 20), electricity (2,367 MWh, MP 18), and natural gas (13 MWh, MP 19) were also used. Total CO₂ emissions from energy consumption in municipal buildings in 2021 amounted to 1,908 tonnes (MP 23).
3.1.4. Energy Use in Transport – ECC 3
In the transport sector, fossil liquid fuels remained the dominant energy source in 2021, with total consumption of 126,821 MWh (MP 27). The use of electricity in transport is gradually increasing but was limited to just 7 MWh at public charging stations in 2021 (MP 24). Total CO₂ emissions from transport in 2021 amounted to 33,417 tonnes (MP 28).
3.1.5. Existing Renewable Energy Sources – ECC 4
The local community is predominantly located in a narrow east-west-oriented Alpine valley, which generally limits its suitability for solar energy utilisation. Wind potential is modest and mostly confined to high-altitude areas, which lack appropriate grid infrastructure for connection. The region is, however, rich in small watercourses, which has historically led to the development of several small hydropower plants. In 2021, the total electricity production from RES reached 9,086 MWh (MP 29, MP 30), thereby reducing CO₂ emissions by 3,180 tonnes (MP 31).
3.1.6. Energy Use for Public Lighting – ECC 5
In 2021, public lighting consumed 528 MWh of electricity (MP 32), resulting in 185 tonnes of CO₂ emissions (MP 33).
3.1.7. Demand Management with Battery Energy Storage – ECC 6 and ECC 7
The steelworks under consideration is one of the largest energy consumers in Slovenia, with a total electricity consumption of 323,442 MWh in 2020. Together with the rest of the steel industry, it forms a single balancing group. The annual electricity consumption of the balancing group in 2020 was 478,617 MWh, with a measured peak capacity of 120.4 MW.
One of the key tasks for the steelworks' energy managers is minimising the costs associated with deviations in the balancing group’s electricity demand forecasts. In addition to more accurate demand planning, which is a significant challenge due to the specific and complex technological processes, one solution for reducing deviations is the installation of a large battery energy storage system. A battery storage system from an external partner is already connected to the steelworks’ internal network. It is shown in Figure 2 as ECC 6. Measurement of electricity exchange with the grid is labelled as MP 34, and the record of system services sold on the market is labelled as MP 35. The owner could also offer balancing services to the steelworks.
The study conducted a simulation of cost reduction through the installation of a battery owned by the steelworks. In Figure 2, it is represented as ECC 7. Measurement of electricity exchange with the grid is indicated by MP 36, and the record of system services that the steelworks could sell on the market or use for internal demand balancing is represented by MP 37. The use of balancing services (either owned or acquired from the market) is recorded by MP 58. The total electricity balance, calculated at a 15-minute interval, is 116,733.6 MWh. The quantity is calculated as the difference between the 15-minute electricity consumption and the forecasted values for the one-hour interval. The simulated monthly TAPE differences ranged from 22.9 % to 27.0 %. The term TAPE was named after mechanical tape with data on current prices and market trades used on stock exchanges in the late 18th and early 19th centuries. The following battery storage parameters were assumed in the simulation:
- C-rate ratio: 0.5;
- Charging/discharging efficiency: 85 %;
- Depth of discharge: 0.60 (ranging from 0.20 to 0.80);
- Simulations were performed for two storage capacities: 10.8 MWh and 22.0 MWh.
The role of the battery storage system is to minimise the difference between forecasted and actual electricity consumption. In the first scenario, a 10.8 MWh storage system was used. The simulation showed a reduction in deviations to 89,421.4 MWh, or 23.4 %, compared to the scenario without a storage system. The monthly TAPE ranged from 17.2 % to 21.3 %. In the case of a larger storage system (22.0 MWh), the deviations decreased to 68,280.4 MWh, representing a relative reduction of 41.5% compared to the scenario without a storage system. The realised monthly TAPE would range from 12.8 % to 17.1% with the larger storage system.
Simulations showed that using battery storage systems could reduce network balancing costs by up to 23.4 %, with a larger capacity resulting in a reduction of up to 41.5 %. The economic feasibility of installation depends on market conditions, but the current electricity prices and storage incentives indicate a high level of investment profitability.
3.1.8. Photovoltaic Power Plant – ECC 8
The geographical location of the steelworks is the most suitable site for installing large rooftop photovoltaic (PV) power plants within the relevant local community. The steelworks is directly connected to the transmission grid at a 110 kV voltage level. Electricity is distributed within the steelworks area via 27 transformer stations, with voltage levels of 35 kV, 20 kV, 5 kV, and 0.4 kV in use. A typical daily load diagram of the steelworks (Figure 3) shows that it could consume all the electricity generated by the PV system up to 18 MVA at any given time. Given the available roof space, a realistic PV installation capacity is up to 5 MVA.
Analysis of the impact of PV power plants on the grid showed that production up to 5 MVA could be integrated without the need for infrastructure upgrades, which is crucial for the economic sustainability of the project.
In Figure 2, a 5 MVA PV system is represented as ECC 8. The measurement of produced electricity is marked as MP 38, and the total production is also recorded as own renewable energy production (MP 39).
By installing PV systems, the steelworks would further improve its image in the local community and could offer interesting investment opportunities to local stakeholders if at least part of the PV capacity is allocated to establishing a "renewable energy community" and offering membership to local residents, employees, and small to medium-sized local businesses. This approach is fully in line with the National Energy and Climate Plan (NECP), where energy communities are recognised as an instrument for enabling sustainable urban energy transition and better integration of energy-intensive industries with local energy systems.
Industrial environments have specific characteristics that must be considered when planning the construction of large-scale PV installations. Large investments require risk management and must align with the company’s investment policy. Within extensive industrial areas, numerous potential locations exist for PV installations, necessitating the identification of optimal sites. Factors such as investment costs, site suitability regarding solar irradiation, the impact of dust emissions on electricity production, maintenance requirements (cleaning), and potential reductions in these requirements must all be taken into account.
3.1.3.1. Research on the Impact of Dust on Electricity Production
One of the objectives of the study was to examine the impact of the industrial environment on PV performance. Three small test PV systems were installed at different locations (on the roofs of two production halls and an administrative building). Each test PV system comprised:
- Two identical PV modules (280 Wp);
- Two identical microinverters (290 VA);
- Two advanced electricity meters;
- A support structure for two modules (21° tilt, south-facing), and
- An electrical cabinet containing all necessary components.
One of the locations was also equipped with a meteorological station with sensors for temperature, pressure, and solar radiation. The study investigated the influence of the industrial environment at micro-locations and compared the suitability of locations for large-scale PV installations. The research was conducted in three phases:
- Reference period: Both test PV panels were cleaned three times per week; no deviations in electricity production were observed during this time, confirming the suitability of the test environment;
- Test period: Continuous cleaning was performed on only one panel, three times per week, over a period of one and a half years. During this test period, dust samples were collected and subjected to chemical and electron microscopy analyses;
- Post-test cleaning period: Initially, both test panels were cleaned. Over one month, both panels underwent cleaning three times per week. This cleaning protocol was conducted to confirm the feasibility of cleaning the previously uncleaned PV panel and to assess potential panel degradation due to dust accumulation over one and a half years.
Throughout the research, all data and observations were collected within an energy management system. Valuable data were obtained for various analyses, which provided the following insights:
- The environmental impact on micro-locations and the required cleaning intervals to maintain the desired PV efficiency;
- The primary source of dust particles in the broader steel plant area;
- Solar irradiation levels at different locations and the expected PV yield;
- The impact of dust particles on electricity production near the main dust source (details in the following section);
- No panel degradation was detected due to dust accumulation after one and a half years, as no deviations in electricity production were observed following the equal cleaning of both test panels.
Based on measurements from the test PV system with both cleaned and uncleaned modules, a simulation of a 5 MVA PV plant’s production was conducted. The results of the one-year measurements are shown in Figure 4. Differences in production between the modules can be observed, with temporary reductions following heavy rainfall, yet a gradual long-term increase in disparity. If the modules were regularly cleaned, a 5 MVA PV plant at the selected location would have generated 6,460 MWh of electricity between 1 March 2021 and 28 February 2022 (MP 38). Electricity production from PV would increase RES production of community (MP 39) and reduce CO₂ emissions by 2,261 tonnes (MP 40). Without cleaning, the production would have been only 4,587 MWh, representing a 29 % decrease.
Since the research results indicated that dust accumulation on PV panels at the test site near the primary source of dust particles significantly affects electricity production, additional studies were conducted to examine the impact of a nano-coating on photovoltaic panels. This coating was intended to prevent or reduce dust accumulation on the panel. The test procedure followed these steps:
- Both test panels were cleaned, and their identical efficiency was confirmed;
- A nano-coating was applied to one of the test panels;
- The electricity production of both systems was monitored without cleaning over a one-year period.
No significant differences in electricity production were observed between the nano-coated and uncoated panels during the one-year testing period. Therefore, for the dust particles present at the test location, the selected nano-coating does not provide protection against dust accumulation or enhance the panel's self-cleaning ability with rain.
These results, along with other technical studies, contributed to the selection of priority locations for investments in PV systems. The first PV system, with a capacity of 166 kVA, was connected in 2023.
3.1.9. Small Hydropower Plant – ECC 9
The steel plant requires large quantities of cooling water for its operations. This plant is situated at the foot of a mountain range rich in water sources. A reservoir has been constructed on one of the streams, which, together with a pressure pipeline and the necessary equipment, ensures a stable and continuous supply of cooling water. The spatial integration and infrastructure development required for small hydropower plants pose significant challenges; therefore, the feasibility of installing a small hydropower plant (SHP) within the cooling water supply system was investigated. The SHP is represented as ECC 9 in Figure 2. The planned measurements include electricity production (MP 41), cooling water flow for the operation of a small hydroelectric power plant (MP 42), while the total electricity generation is recorded as on-site renewable energy production (MP 43).
Between the accumulation reservoir with a capacity of 12,000 m³ and the steel plant, there is a height difference of 50 metres, which is sufficient for the installation of a SHP. A portion of the water is currently used for technological purposes, while the remaining water overflows into the nearby riverbed. The powerhouse of the SHP would be positioned above the first cooling water basin, thereby fully utilising the available hydropower potential. The maximum water flow is 550 l/s (MP 42). Considering a system efficiency of 0.77, the theoretical potential amounts to 208 kVA. Based on hydrological data, the SHP could operate for 7,000 hours per year, generating 1,454 MWh of electricity (MP 41). Electricity production from SHP would increase RES production of community (MP 43) and reduce CO₂ emissions by 509 tonnes (MP 44).
3.1.10. Green Hydrogen Production – ECC 10
The primary objective of the planned green hydrogen production is to meet the steel plant’s internal requirements, with a secondary goal of injecting a portion of the green hydrogen into the gas grid. In Figure 2, hydrogen production is represented as ECC 10. The planned monitoring includes electricity consumption (MP 45) and hydrogen production (MP 46). The measurement of hydrogen injection into the gas grid (MP 03) would also provide data on its real-time consumption in the production process.
Green hydrogen is recognised as an essential component in the future decarbonisation of the natural gas system. It could also play a role in decarbonising local public transport. In line with the Slovenian National Energy and Climate Plan (NECP) [23], Slovenia aims to increase the share of renewable gases in its natural gas system by up to 10 % by 2030. In this context, local green hydrogen production is crucial, particularly at the intersections of electricity and gas networks, such as the steel plant in question. Slovenia plans to establish a robust support scheme for the production of green hydrogen and synthetic methane.
The initial assessment of local green hydrogen production potential indicates that the project is of interest to Slovenia’s largest natural gas trader. At present, the steel plant uses "grey" hydrogen as a technical gas in its production process, with an annual consumption of approximately 30 tonnes. Hydrogen production could also serve as an active load to balance electricity consumption within its balancing group or provide ancillary services to the transmission system operator, with the option of trading flexibility services.
For optimal operation of the production unit, it would be necessary to assess the green hydrogen production potential based on the actual hydrogen demand in production and the absorption capacity of the national natural gas transmission network at the site. The decision to invest in hydrogen production will also be influenced by the following factors and challenges identified during the planning phase of this sustainable energy project:
- What are the expected future price trends for hydrogen production technology?
- What is the maximum hourly hydrogen injection capacity at the steel plant site for the national gas grid?
- What government support is available for such projects?
- What is the most suitable business model for constructing a demonstration plant?
- What environmental and safety regulations must be met for hydrogen production?
- What are the prospects for developing a (local) hydrogen market, including its use in transport?
3.1.11. Reuse of Excess Heat in Energy-Intensive Production and District Heating – ECC 11 to ECC 13
The potential for utilising excess heat from energy-intensive production in district heating and for reuse within the production process was explored. From the perspective of district heating system operators, other options for upgrading the existing district heating system were also considered. The current district heating system primarily relies on natural gas cogeneration units, which could be replaced by biomass cogeneration units or heat pumps. However, in line with the energy efficiency principle of the Slovenian NECP [23], the reuse of industrial excess heat is the highest priority and should be pursued whenever it is economically viable.
To support such sector integration, the Slovenian NECP [23] includes a comprehensive set of policy instruments and initiatives promoting cooperation between energy-intensive industries and district heating providers. In this framework, investments in district heating networks will be supported by government incentives. However, under the current energy policy framework, energy-intensive industries must justify investments through additional revenues from excess heat sales, which could be a significant barrier to widespread adoption. Nonetheless, a promising example already exists in Slovenia, where excess heat is utilised through direct cooperation between a district heating operator and an energy-intensive industry without state or municipal subsidies [24].
For excess heat reuse in industrial processes, processes where excess heat can fully or partially replace the primary energy source are of particular interest. Various steel production processes generate excess heat (ECC 13, MP 64). Capturing and storing this excess heat requires a complex set of equipment (ECC 11). The captured excess heat (MP 47) is reintroduced as a heat source in various forms (hot water, steam, MP 60). Its priority use is in steel production, reducing electricity (MP 48) and natural gas (MP 49) consumption, leading to lower CO₂ emissions from the production process (MP 51). Any remaining heat is available for district heating (ECC 12, MP 52), reducing natural gas consumption for city heating (MP 53) and consequently contributing to lower CO₂ emissions (MP 54).
A detailed analysis of excess heat utilisation in production is provided in [25], and only key findings are summarised in this paper. The study found that annual excess heat recovery in production could reach 11,440 MWh, leading to savings of 1,684 MWh of electricity and 817,174 Nm³ of natural gas. The natural gas savings in the district heating system would amount to 3,299,676 Nm³, as the excess heat could cover up to 68.4% of the local community's heating needs, significantly reducing dependence on fossil fuels.
3.2. The Overall Contribution of the Energy Community to Achieving Sustainability Goals
A PV plant with a capacity of 5 MVA, when placed in an optimal location (with lower dust accumulation) or regularly cleaned, would generate approximately 6,460 MWh of electricity annually. A SHP would produce 1,454 MWh per year under average hydrological conditions. PV and SHP together would produce 7,914 MWh of electricity, which would represent an increase of as much as 87% compared to the existing production in the local community in 2021 (9,086 MWh). Additionally, considering the electrical energy savings from the utilisation of waste heat (1,684 MWh), the project would achieve an annual electricity saving of 9,598 MWh. Given Slovenia's electricity mix for the relevant year, with an emission factor of 0.35 t CO₂ per MWh, this would result in a reduction of 3,359 tonnes of CO₂ emissions per year.
The utilisation of excess heat in the steel plant would save 817,174 Nm³ of natural gas, while the reduction in gas consumption due to excess heat use in the district heating system would amount to 3,299,676 Nm³. In total, this represents a saving of 4,116,850 Nm³ of natural gas. Considering an emission factor of 0.00185215 t CO₂ per Nm³ of natural gas, this would lead to a CO₂ emissions reduction of 7,625 tonnes.
Overall, the planned energy community could achieve a total CO₂ emissions reduction of 10,984 tonnes per year. If we consider all CO₂ emissions due to energy use in the community in 2021: households (ECC1) 25,004 t, public buildings (ECC2) 1,908 t, transport (ECC3) 33,417 t and industry 207,833 t (ECC13), the realization of the planned project would reduce CO₂ emissions by 4 %.
3.3. Results of the Economic Feasibility Analysis
The structure of the ECC facilitates a simplified economic assessment of individual project segments. By considering the community as a whole, the analysis yields valuable insights into the interconnections and mutual impacts among ECC components, thereby guiding more targeted economic evaluations. For instance, when considering local hydrogen production, one can assess its potential use in steel manufacturing, while simultaneously adjusting the production unit's scale to match hydrogen demand in transport and possible injection into the gas grid, taking technical limitations into account. The specific findings of the analysed project are as follows:
- The provision of system services via an additional battery storage unit (ECC 7), assuming a required rate of return (RRR) of 5%, annual maintenance costs, and a 10-year lifespan, results in a payback period of 5.7 years under current deviation pricing.
- The investment in photovoltaics (ECC 8), based on a 15-year economic lifetime, 5 % RRR, and including maintenance and insurance costs, yields a payback period of 6.1 years.
- The small hydropower plant (ECC 9), with a 30-year economic lifetime, 5% RRR, and maintenance costs considered, achieves payback in 8 years.
- Hydrogen production (ECC 10), under current market conditions marked by high electricity prices, is not economically viable—even with 100% investment subsidies. However, should periods of very low or negative electricity prices from RES surpluses become more frequent and prolonged, hydrogen production may become justifiable, particularly as a means of providing system balancing services.
- The utilisation of excess heat (ECC 11 to ECC 13) was evaluated in three scenarios, varying in district heating system integration and the scope of heat recovery. Payback periods ranged from 9.2 to 18.9 years. With a 50% investment subsidy, these periods are reduced to between 4.6 and 9.2 years.
4. Discussion
The aim of this research, which addresses energy use analysis and sector coupling in the energy community, was to demonstrate theoretically and through a case study how targeted efforts can foster collaboration among key stakeholders in the local environment and improve the process of developing viable sustainable energy projects. The study provided valuable insights into the effective modelling and feasibility assessment of complex local energy projects involving multiple energy vectors.
The practical application of the developed energy consumption analysis model, based on the ECC framework, confirmed that effective communication and data accessibility are critical challenges and key success factors in planning complex energy communities. These findings align with the conclusions of Billereck et al. [26]. Standardised data collection protocols and the establishment of reliable data-sharing platforms could help overcome these challenges and further enhance the model’s replicability and scalability [27].
In the examined case study, key stakeholders recognised the need for coordinated actions and joint efforts in addressing national energy and climate challenges. The findings are in line with those of Fischer et al. [28], which emphasize the importance of involving different actors in energy efficiency planning. The review of Slovenia’s NECP also highlighted the necessity of a holistic approach to long-term energy infrastructure planning and project optimisation, as confirmed by Ceglia et al. [29].
The results of the proposed approach contribute to increasing the utilisation of renewable energy sources, hydrogen production, battery storage systems, and—most notably—the integration of industrial excess heat within the local community. Despite the model’s success in the analysed case, challenges remain regarding its replicability, primarily due to the required precision of input data and the reluctance of some industrial entities to share information. Future research should focus on developing automated data collection and processing systems and further integrating advanced digital tools such as artificial intelligence and machine learning. A more in-depth examination of the role of the Internet of Things (IoT), Artificial Intelligence (AI), and machine learning in real-time energy consumption monitoring is needed. These technologies have the potential to significantly enhance the model’s accuracy and responsiveness, leading to more effective decision-making in operational environments, in line with the findings of Olabi et al. [27].
A key premise of the ECC model is the concept of ownership over individual cost centres—not in a legal sense, but in terms of dedicated and competent responsibility for their operation and continuous improvement. This also extends to efforts in establishing ECCs identified as optimal additional components of the energy community. Both in the modelling phase and during implementation, public engagement is essential, following a transparent communication strategy that facilitates social acceptance and ensures a more equitable distribution of benefits among community members [30]. Furthermore, educational campaigns should be tailored to enhance understanding and support for energy efficiency measures [31].
The ECC model structure employed in the case study comprises a macro-level community assessment (ECC 1 to ECC 5 and ECC 12, ECC 13) alongside a focused evaluation of units pertinent to the project (ECC 6 to ECC 11, and partly ECC 12 and ECC 13). This configuration permits a streamlined overview of the entire community, while simultaneously enabling a more detailed examination of new elements and their impacts. In future analyses, additional elements—as well as novel energy and material vectors—could be incorporated, thereby adapting the model’s scope to meet evolving evaluative needs. Moreover, this structure facilitates the calculation of several notable sustainability indicators.
The proposed approach to sustainable energy planning incorporates advanced community-level energy consumption analysis (covering both energy sources and demand) using sophisticated ECC-based models. The integration of energy sectors, such as electricity and heat supply, necessitates the development of complex models for analysing the potential of excess heat recovery, renewable energy deployment, and energy conversion and energy storage. The study particularly underscores the importance of continuous and structured collaboration among key stakeholders in the pursuit of sustainable solutions, the development and testing of tools for improved local infrastructure planning, and the integration of energy sectors.
5. Conclusions
The concept of joint planning for sustainable energy projects and infrastructure was tested in a practical case study involving the integration of energy-intensive industries with local communities. The proposed model enables a detailed assessment of available energy sources and energy transformations within individual ECCs and, through comprehensive data flow management, empowers energy system planners to develop innovative solutions for improved resource and energy utilisation.
However, a significant challenge remains in establishing a mechanism for continuous improvements throughout the entire lifecycle of sustainable energy solutions. Future research should explore the impact of integrating this model into smart grids and assess the potential for broader implementation in mixed-use residential and commercial communities. Additionally, further investigation should be conducted into enhancing the model with environmental and sociological parameters, allowing for a more holistic approach to sustainable energy planning.
The transfer of best practices at local, regional, and national levels, as well as the establishment of an open knowledge base, represent key opportunities for further research and the advancement of this dynamic scientific field.
Author Contributions
Conceptualization, E. K.; methodology, E. K. and B. S.; software, E. K.; validation, E. K., B. S., M. L. and T. S.; formal analysis, E. K., B. S., M. L. and T. S.; investigation, E. K., M. L., T. S.; resources, B. S.; data curation, E. K., B. S., M. L. and T. S.; writing—original draft preparation, E. K.; writing—review and editing, E. K., B. S., M. L. and T. S.; visualization, E. K. All authors have read and agreed to the published version of the manuscript.
Funding
This research received no external funding.
Data Availability Statement
Data available on request due to restrictions (privacy).
Acknowledgments
The authors would like to thank the European Commission, the partners of the European Union’s Horizon 2020 research and innovation programme project »CREATORS - CREATing cOmmunity eneRgy Systems« (https://cordis.europa.eu/project/id/957815) and Slovenian Research and Innovation Agency (ARIS) under research program P2-00075 (Modelling and environmental impact assessment of processes and energy technologies) for their support.
Conflicts of Interest
The authors declare no conflicts of interest.
Abbreviations
The following abbreviations are used in this manuscript:
| ECC | Energy cost centre |
| CO₂ | Carbon dioxide |
| TSO | Transmission system operator |
| PV | Photovoltaic |
| MP | Measurement point |
| MWh | Megawatt hour |
| Nm3 | Normal cubic metre - the amount of dry gas that occupies a volume of one cubic meter at a temperature of 273.15 K |
| m3/s | Cubic metre per second |
| kg/s | kilogram per second |
| t | Tonne |
| RES | Renewable energy sources |
| IPCC | Intergovernmental Panel on Climate Change |
| TAPE | A record of stock (or energy price) transactions throughout the trading day |
| kV | Kilovolt |
| MVA | Megavolt ampere |
| Wp | Watt-peak |
| kVA | Kilovolt ampere |
| SHP | Small hydropower plant |
| NECP | National Energy and Climate Plan |
| RRR | Required rate of return |
| IoT | Internet of Things |
| AI | Artificial intelligence |
References
- Gjorgievski, V. Z.; Cundeva, S.; Georghiou, G. E. Social arrangements, technical designs and impacts of energy communities: A review. Renewable Energy 2021, 169, pp. 1138-1156. [CrossRef]
- Heldeweg, M. A.; Saintier, S. Renewable energy communities as ‘socio-legal institutions’: A normative frame for energy decentralization? Renewable and Sustainable Energy Reviews 2020, 119. [CrossRef]
- Dóci, G.; Vasileiadou, E.; Petersen, A. C. Exploring the transition potential of renewable energy communities, Futures 2015, 66, pp 85-95. [CrossRef]
- Mišljenović, N.; Žnidarec, M.; Knežević, G.; Šljivac, D.; Sumper, A. A Review of Energy Management Systems and Organizational Structures of Prosumers. Energies 2023, 16. [CrossRef]
- Bohvalovs, G.; Vanaga, R.; Brakovska, V.; Freimanis, R.; Blumberga, A. Energy Community Measures Evaluation via Differential Evolution Optimization. Environmental and Climate Technologies 2022, 26-1, pp. 606-615. [CrossRef]
- Makatora, D.; Makatora, A.; Zenkin, M.; Mykhalko, A.; Shostachuk, O. Organizational and Economic Mechanism of Improving Energy Costs in the Technological and Process Constant of the Printing Industry. Management Theory and Studies for Rural Business and Infrastructure Development 2024, 46-4, pp. 609-618. [CrossRef]
- Mickovic, A.; Wouters, M. Energy costs information in manufacturing companies: A systematic literature review, Journal of Cleaner Production 2020, 254. [CrossRef]
- Teplická, K.; Khouri, S.; Mehana, I.; Petrovská, I. Energy Cost Reduction in the Administrative Building by the Implementation of Technical Innovations in Slovakia. Economies 2024, 12, . [CrossRef]
- Sola, A. V. H.; Mota, C. M. M. Influencing factors on energy management in industries, Journal of Cleaner Production 2020, 248. [CrossRef]
- Morvaj, Z.; Gvozdenac, D.; Tomšić, Ž. Sustavno gospodarenje energijom i upravljanje utjecajima na okoliš u industriji; Energetika marketing: Zagreb, Croatia, 2016; pp. 130-135.
- Li, N.; Okur, Ö. Economic analysis of energy communities: Investment options and cost allocation, Applied Energy 2023, 336. [CrossRef]
- Lode, M. L.; Heuninckx, S.; Boveldt, G.; Macharis, C.; Coosemans, T. Designing successful energy communities: A comparison of seven pilots in Europe applying the Multi-Actor Multi-Criteria Analysis, Energy Research & Social Science 2022, 90. [CrossRef]
- Lowitzsch, J.; Hoicka, C. E.; Tulder, F. J. Renewable energy communities under the 2019 European Clean Energy Package – Governance model for the energy clusters of the future?, Renewable and Sustainable Energy Reviews 2020, 122. [CrossRef]
- Tutak, M.; Brodny, J.; Bindzár, P. Assessing the Level of Energy and Climate Sustainability in the European Union Countries in the Context of the European Green Deal Strategy and Agenda 2030, Energies 2021, 14. [CrossRef]
- Morvay, Z. K.; Gvozdenac, D. D. Applied Industrial Energy and Environmental Management; Wiley & Sons: Chichester, United Kingdom, 2008.
- Mikulčić, H.; Baleta, J.; Klemeš, J. J.; Wang, X. Energy transition and the role of system integration of the energy, water and environmental systems, Journal of Cleaner Production 2021, 292. [CrossRef]
- Klemeš, J. J.; Lam, H. L. Process integration for energy saving and pollution reduction, Energy 2011, 36 (8), pp. 4586-4587. [CrossRef]
- Sučić, B.; Košnjek, E.; Đorić, M.; Al_Mansour, F.; Matkovič, M.; Damjan, T. Innovative approach to implementing advanced energy projects in urban areas – from comprehensive simulation to actual implementation. In Proceedings of the 16th International Conference on Sustainable Energy & Environmental Protection, Vienna, Austria, 9th-12th September 2024.
- Občina Jesenice, Lokalni energetska concept občine Jesenice za obdobje 2022 do 2032, 2022. Available online: https://www.jesenice.si/obcina-jesenice/razvojni-dokumenti/item/24404-lokalni-energetski-koncept-2022-2032 (accessed on 10 March 2025).
- The International Energy Agency (IEA), World Energy Outlook 2021, Paris: IEA/OECD, 2021. Available online: https://www.iea.org/reports/world-energy-outlook-2021 (accessed on 25 February 2025).
- Rootzén, J.; Johnsson, F.; CO2 emissions abatement in the Nordic carbon-intensive industry – An end-game in sight?, Energy 2015, 80, pp. 715-730. [CrossRef]
- The International Energy Agency (IEA), Iron and Steel Technology Roadmap: Towards more sustainable steelmaking, IEA Publications, 2020. Available online: https://www.iea.org/reports/iron-and-steel-technology-roadmap (accessed on 25 February 2025).
- Ministry of Environment, Climate and Energy, Updated Integral National Energy and Climate Plan of the Republic of Slovenia, Ljubljana, 18.12.2024, 2024. Available online: https://www.energetika-portal.si/fileadmin/dokumenti/publikacije/nepn/dokumenti/nepn2024_final_dec2024.pdf (accessed on 5 February 2025).
- Malinauskaite, J.; Jouhara, H.; Egilegor, B.; Al-Mansour, F.; Ahmad, L.; Pusnik, M. Energy efficiency in the industrial sector in the EU, Slovenia, and Spain, Energy 2020, 208. [CrossRef]
- Košnjek, E.; Sučić, B.; Kostić, D.; Smolej, T. An energy community as a platform for local sector coupling: From complex modelling to simulation and implementation, Energy 2024, 286. [CrossRef]
- Billerbeck, A.; Fritz, M.; Aydemir, A.; Manz, P. Strategic Heating and Cooling Planning to Shape Our Future Cities, In Proceedings of the European Council for an Energy-Efficient Economy (ECEEE Summer Study) – Panel 5: Towards sustainable and resilient communities, Hyères, France, 6-11 June 2022.
- Olabi, A. G.; Abdelkareem, M. A.; Jouhara, H. Energy digitalization: Main categories, applications, merits, and barriers, Energy 2023, 271, 126899, . [CrossRef]
- Fischer, J.; Alimi, D.; Knieling, J.; Camara, C. Stakeholder Collaboration in Energy Transition: Experiences from Urban Testbeds in the Baltic Sea Region. Sustainability 2020, 12, 9645. [CrossRef]
- Ceglia, F.; Esposito, P.; Marrasso, E.; Sasso, M. From smart energy community to smart energy municipalities: Literature review, agendas and pathways, Journal of Cleaner Production 2020, 254. [CrossRef]
- Farid, H. M. A.; Iram, S.; Shakeel, H. M.; Hill, R. Enhancing stakeholder engagement in building energy performance assessment: A state-of-the-art literature survey, Energy Strategy Reviews 2024, 56, 101560, . [CrossRef]
- Biegańska, M. IoT-Based Decentralized Energy Systems. Energies 2022, 15, 7830. [CrossRef]
Figure 1.
Development of a Model for Energy Use Analysis Based on the ECC Structure.
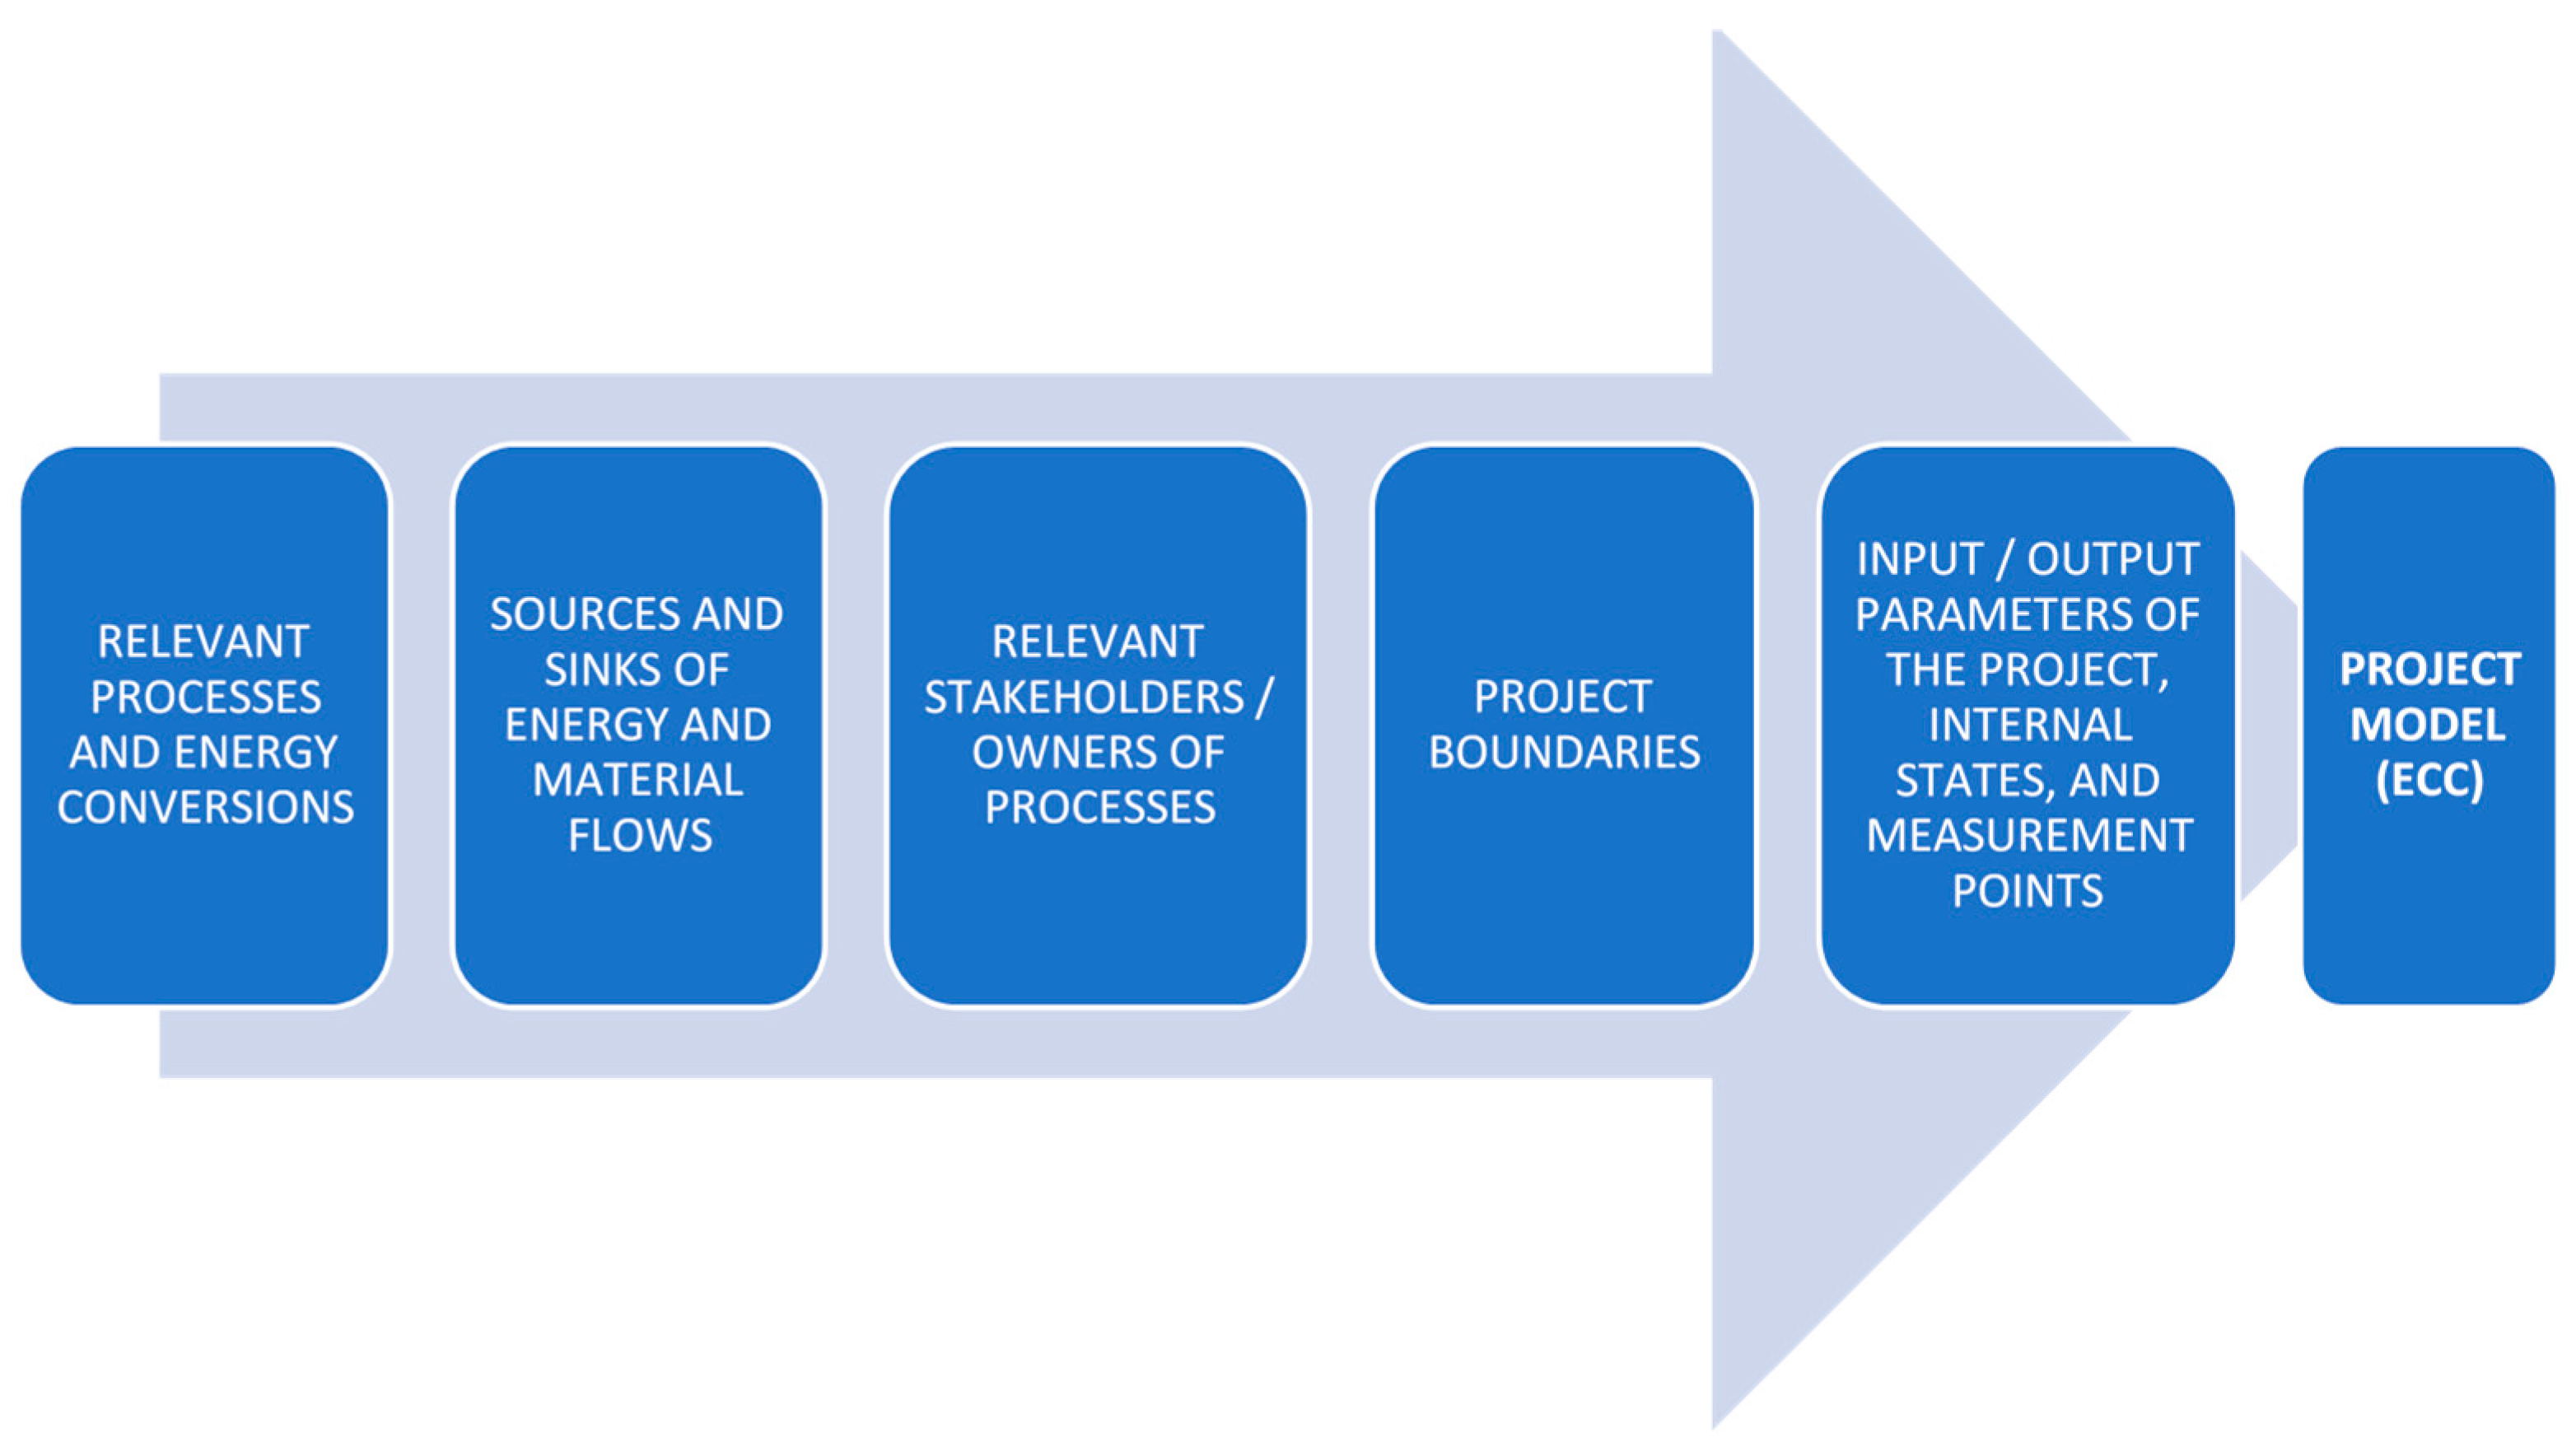
Figure 2.
Material and Energy Flows Represented Using the ECC Structure.
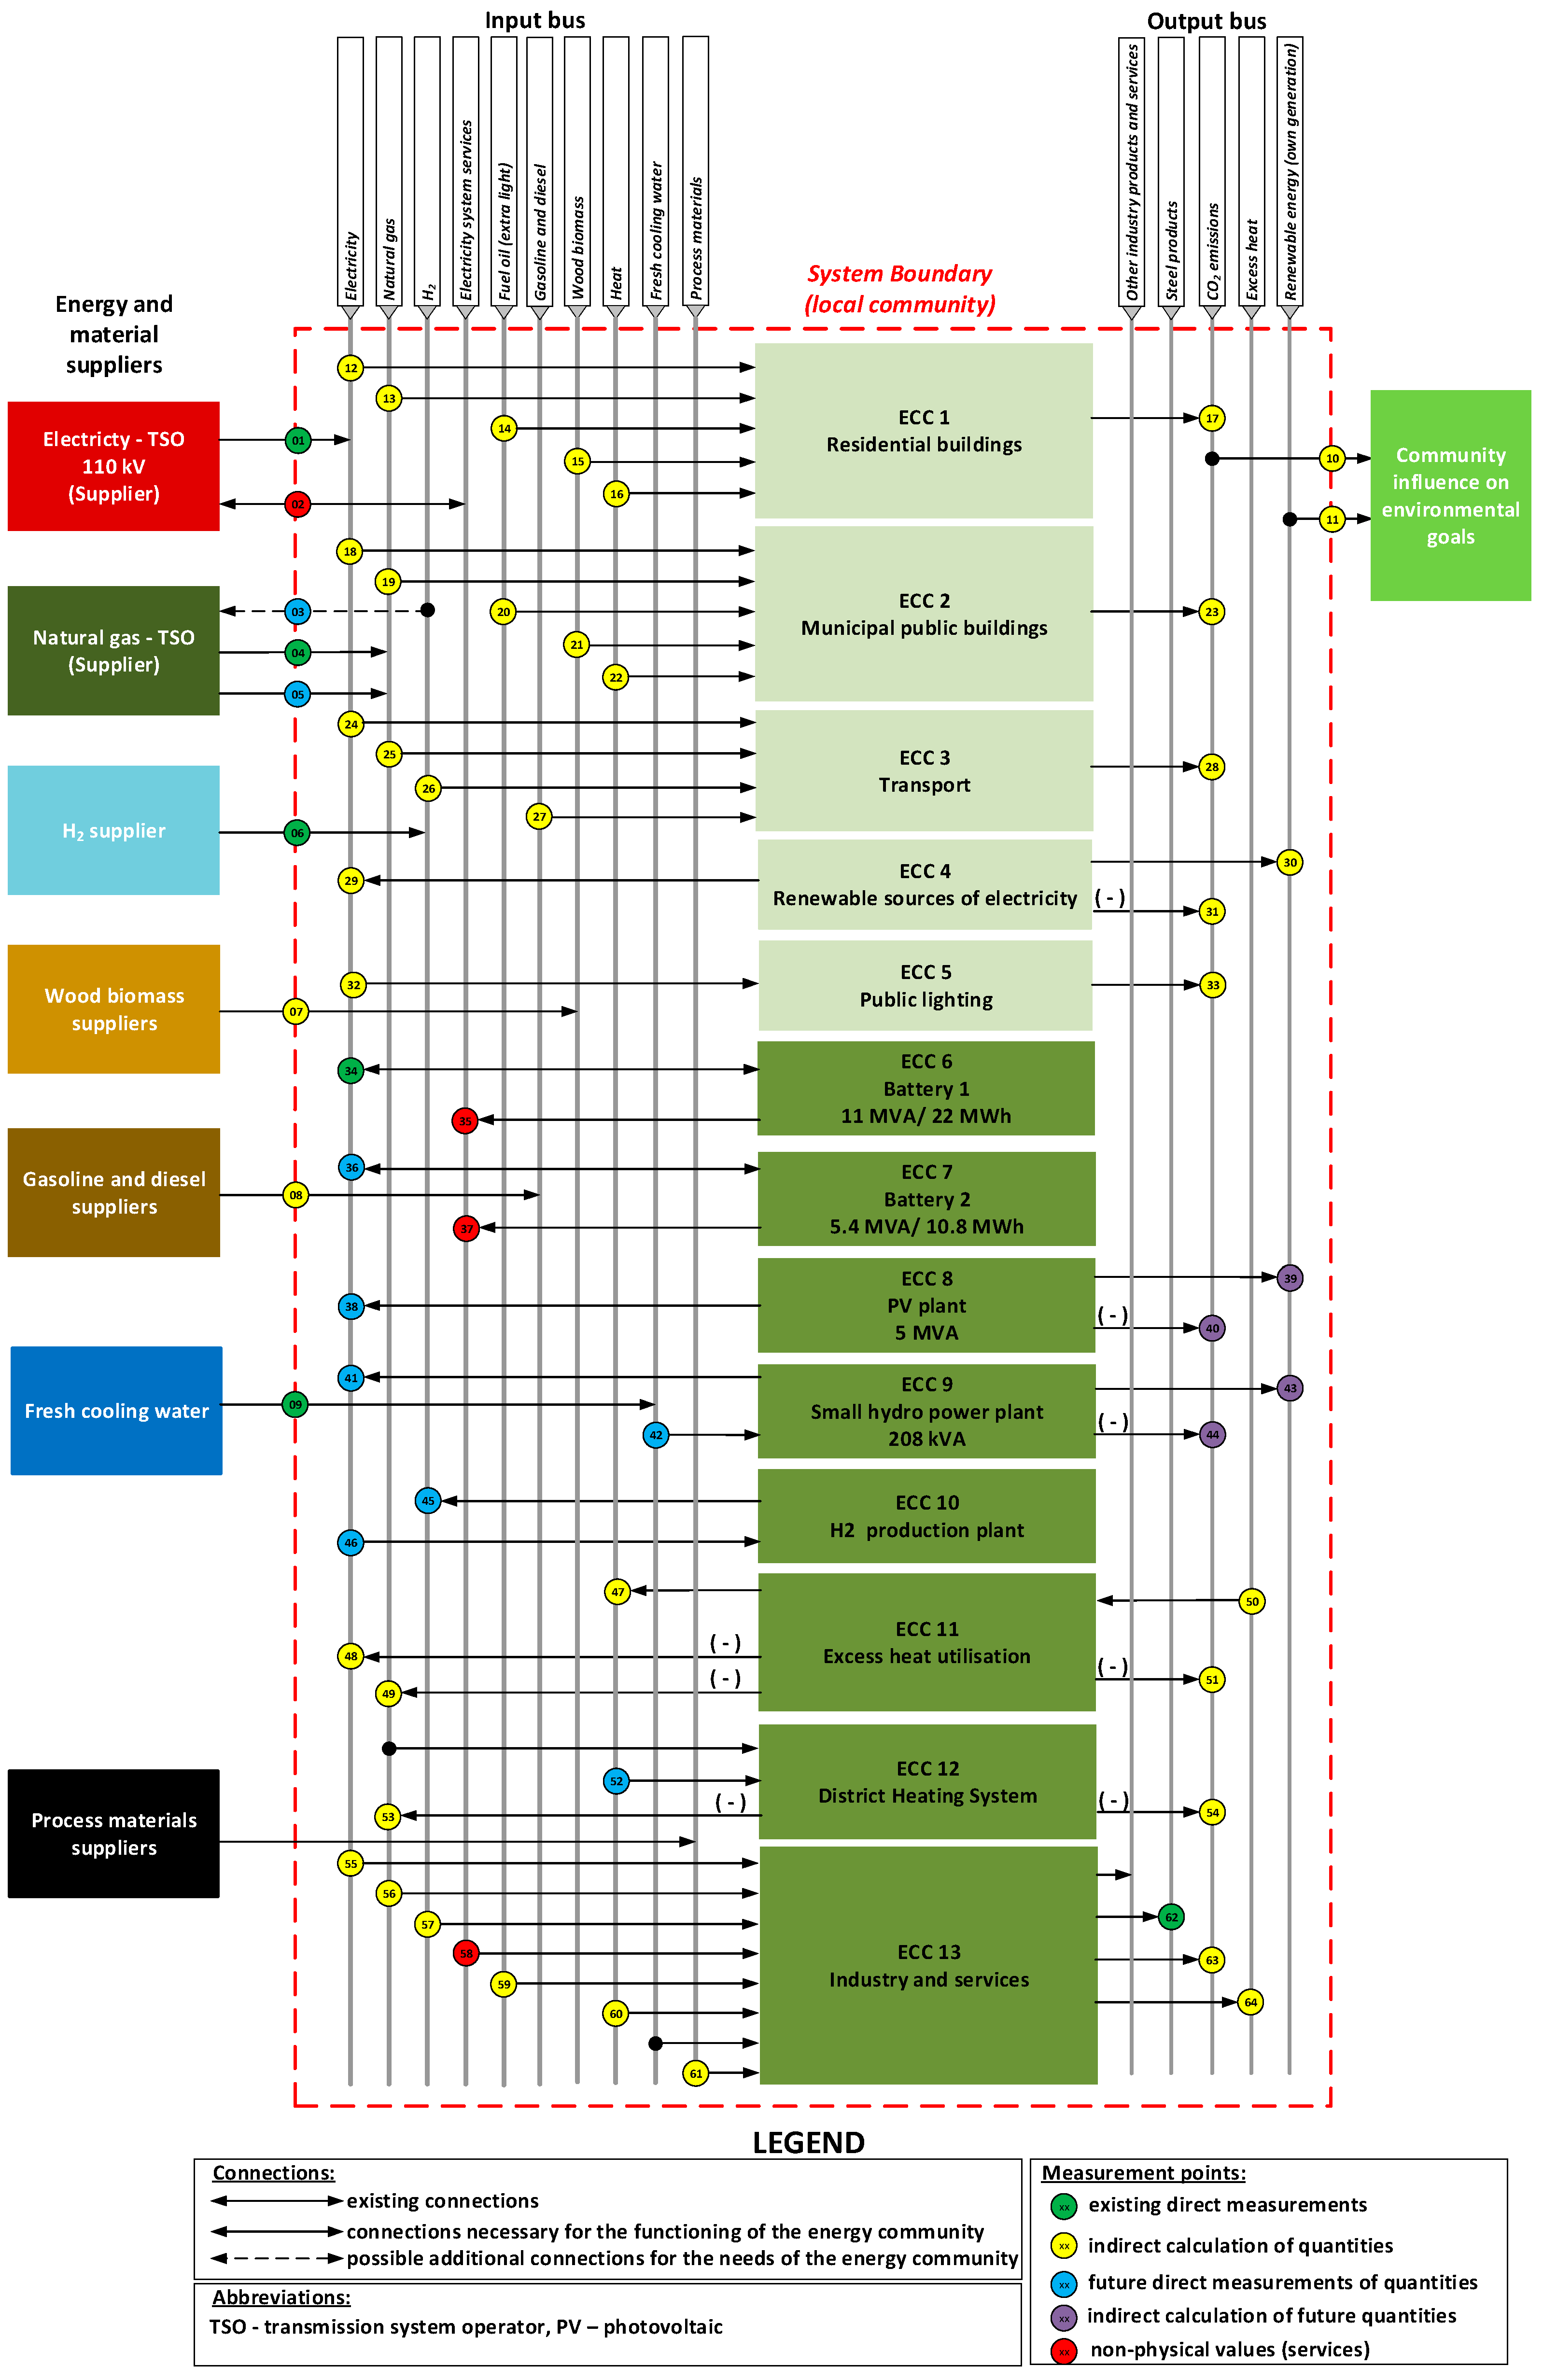
Figure 3.
Typical Hourly Electricity Consumption Diagram of the Steelworks.
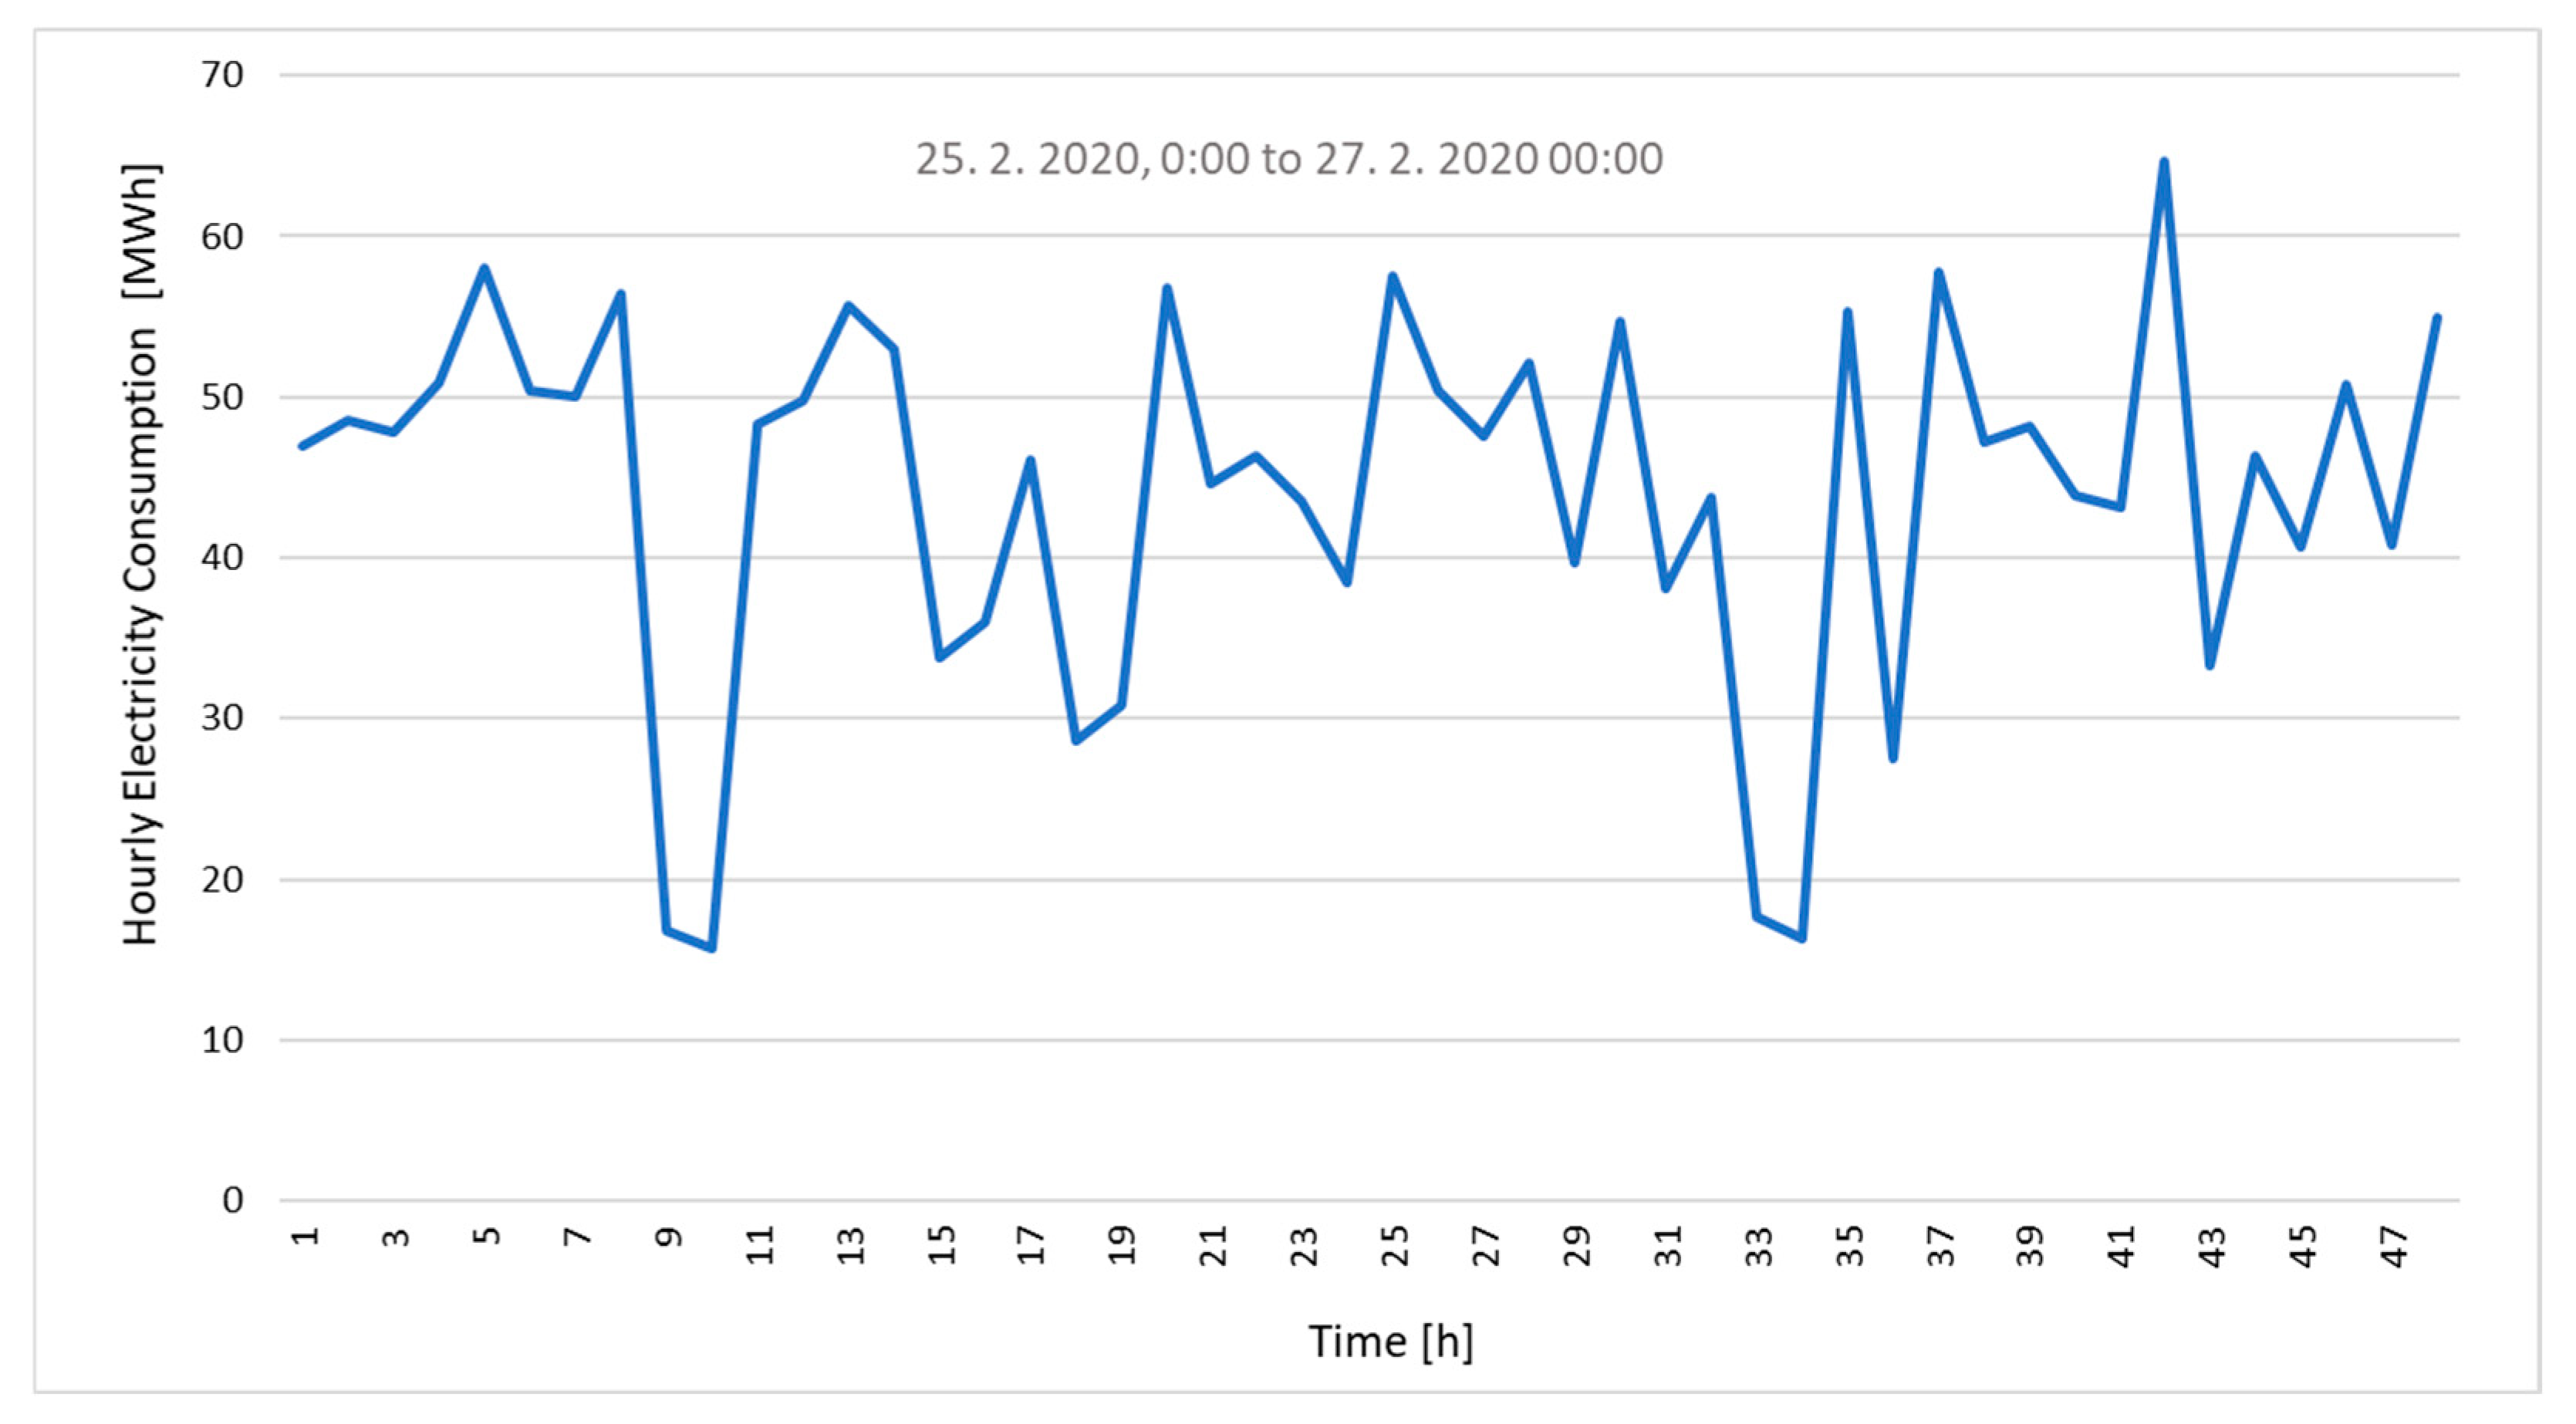
Figure 4.
Impact of Dust Particles on Electricity Production of the Test PV System.
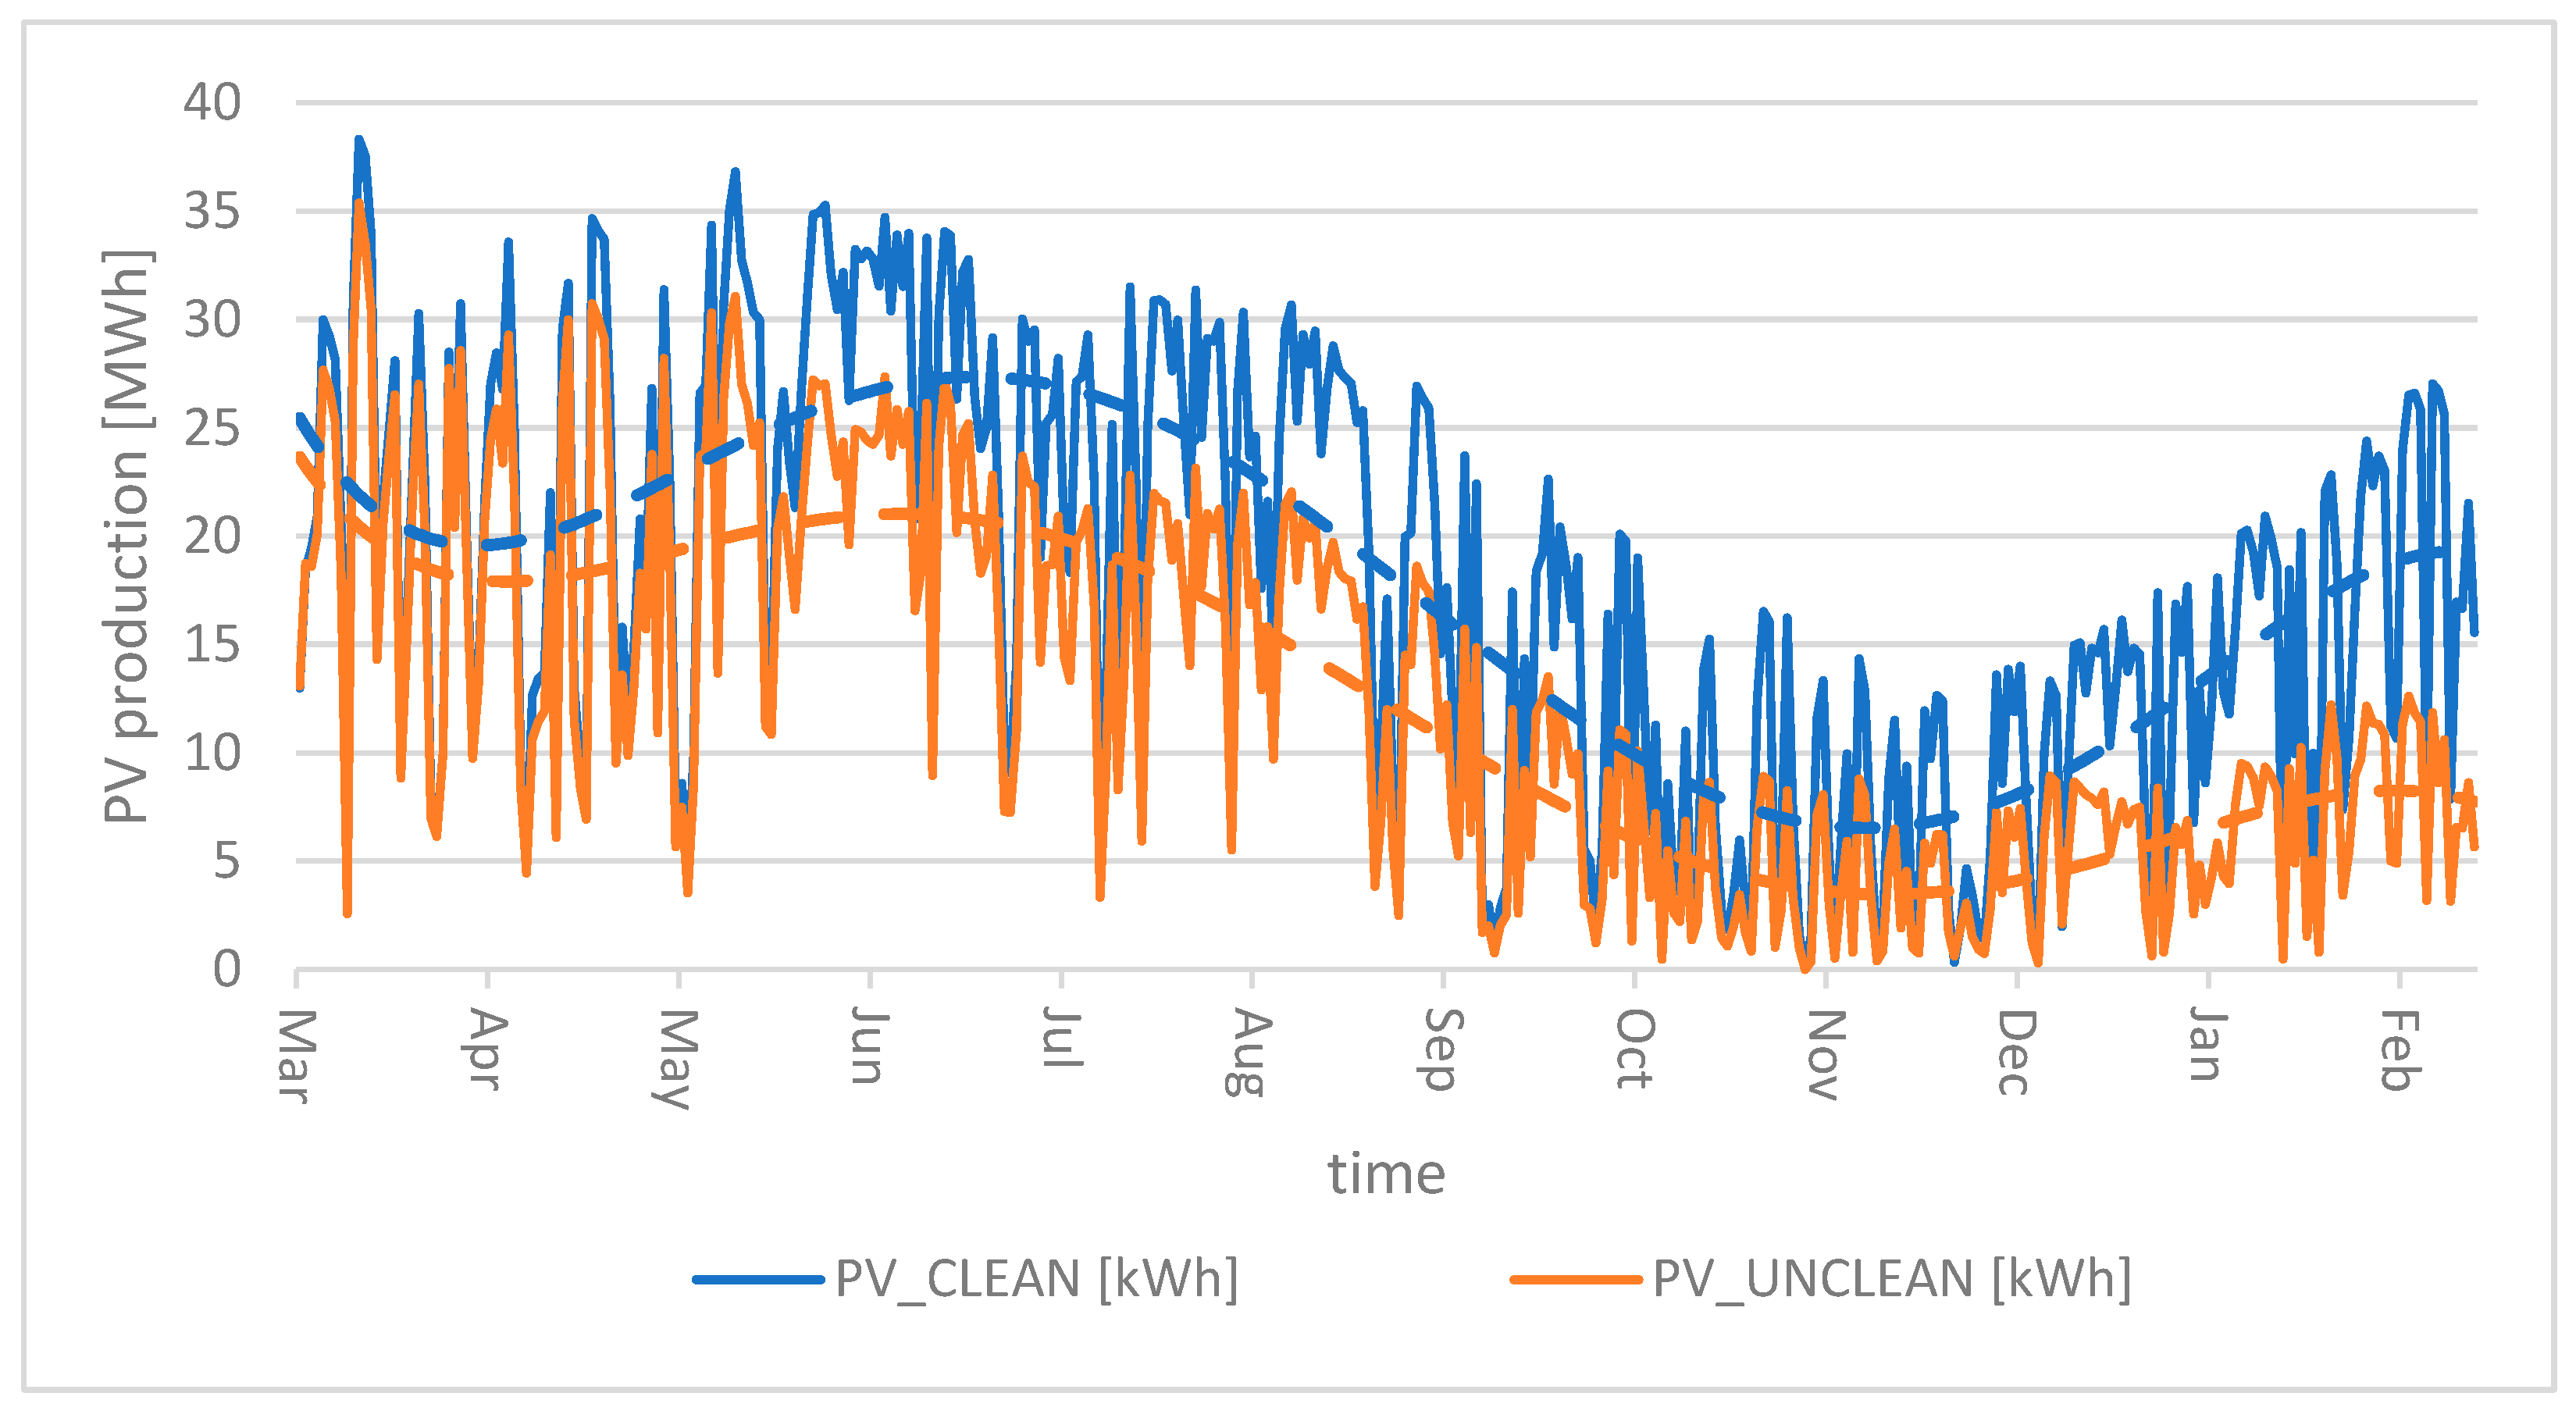
Table 1.
Measurement Points of the Model for Energy Usage Analysis Based on ECC.
| MP | Description of the Measurement Point (MP) Parameter | Unit |
|---|---|---|
| 01 | Electricity consumption from the electricity transmission grid | MWh |
| 02 | Provision/use of electricity system services by the TSO | |
| 03 | Locally produced hydrogen injected into the gas transmission network | Nm3 |
| 04 | Consumption of natural gas from the gas transmission network | Nm3 |
| 05 | Use of natural gas in the heating stations of the district heating system | Nm3 |
| 06 | Supply of "grey" hydrogen | Nm3 |
| 07 | Energy supply in the form of wood biomass | MWh |
| 08 | Energy supply in the form of gasoline and diesel | MWh |
| 09 | Cooling water flow | m3/s |
| 10 | Reduction in CO2 emissions due to new RES and the use of excess heat | MWh |
| 11 | The overall contribution of the project to achieving the national RES target | MWh |
| 12 | Electricity consumption in households | MWh |
| 13 | Natural gas consumption in households | Nm3 |
| 14 | Energy use in the form of heating oil in households | MWh |
| 15 | Energy use in the form of wood biomass in households | MWh |
| 16 | Heat use from district heating systems in households | MWh |
| 17 | CO2 emissions from energy use in households | t |
| 18 | Electricity consumption in municipal public buildings | MWh |
| 19 | Natural gas consumption in municipal public buildings | Nm3 |
| 20 | Energy use in the form of heating oil in municipal public buildings | MWh |
| 21 | Energy use in the form of wood biomass in municipal public buildings | MWh |
| 22 | Heat use from district heating systems in municipal public buildings | MWh |
| 23 | CO2 emissions from energy use in municipal public buildings | t |
| 24 | Electricity consumption in transport | MWh |
| 25 | Natural gas consumption in transport | Nm3 |
| 26 | Hydrogen consumption in transport | Nm3 |
| 27 | Energy use in the form of gasoline and diesel in transport | MWh |
| 28 | CO2 emissions from energy use in transport | t |
| 29 | Electricity generation from existing RES | MWh |
| 30 | Contribution of existing sources to achieving the national RES target | MWh |
| 31 | Reduction in CO2 emissions due to the use of RES | t |
| 32 | Electricity use for public lighting | MWh |
| 33 | CO2 emissions from electricity use for public lighting | t |
| 34 | Electricity consumption and discharge from battery storage unit 1 | MWh |
| 35 | Provision of system services with battery storage unit 1 | |
| 36 | Electricity consumption and discharge from battery storage unit 2 | MWh |
| 37 | Provision of system services with battery storage unit 2 | |
| 38 | Electricity production in the the PV | MWh |
| 39 | Contribution of the PV power plant to achieving the national RES target | MWh |
| 40 | Reduction of CO2 emissions due to electricity production in the PV | t |
| 41 | Used cooling water flow for operating a small hydroelectric power plant | m3/s |
| 42 | Electricity production in the small hydroelectric plant (SHP) | MWh |
| 43 | Contribution of the SHP to achieving the national RES target | MWh |
| 44 | Reduction of CO2 emissions due to electricity production in the SHP | t |
| 45 | Electricity consumption for hydrogen production | MWh |
| 46 | Hydrogen production | t |
| 47 | Total amount of useful excess heat used | MWh |
| 48 | Reduction in electricity consumption due to the use of excess heat | MWh |
| 49 | Reduction in natural gas consumption due to the use of excess heat | Nm3 |
| 50 | Useful excess heat used | MWh |
| 51 | Reduction in CO2 emissions due to the use of excess heat | t |
| 52 | Heat discharged into the district heating system | MWh |
| 53 | Reduction in natural gas consumption in the DH system due to the use of excess heat | Nm3 |
| 54 | Reduction in CO2 emissions due to the use of excess heat in the DH system | t |
| 55 | Electricity consumption in industry and services | MWh |
| 56 | Natural gas consumption in industry and services | Nm3 |
| 57 | Hydrogen consumption in industry and services | Nm3 |
| 58 | Use of system services in industry and services | |
| 59 | Energy use in the form of heating oil in industry and services | MWh |
| 60 | Heat use from district heating systems in industry and services | MWh |
| 61 | Supply of raw materials for steel production | t |
| 62 | Quantity of steel products produced | t |
| 63 | CO2 emissions from in industry and services | t |
| 64 | Generated excess heat in industry and services | MWh |
Disclaimer/Publisher’s Note: The statements, opinions and data contained in all publications are solely those of the individual author(s) and contributor(s) and not of MDPI and/or the editor(s). MDPI and/or the editor(s) disclaim responsibility for any injury to people or property resulting from any ideas, methods, instructions or products referred to in the content. |
© 2025 by the authors. Licensee MDPI, Basel, Switzerland. This article is an open access article distributed under the terms and conditions of the Creative Commons Attribution (CC BY) license (http://creativecommons.org/licenses/by/4.0/).
Copyright: This open access article is published under a Creative Commons CC BY 4.0 license, which permit the free download, distribution, and reuse, provided that the author and preprint are cited in any reuse.


