Submitted:
10 October 2025
Posted:
15 October 2025
You are already at the latest version
Abstract
Shiga toxin–producing Escherichia coli (STEC) are major foodborne pathogens responsible for severe gastrointestinal disease and hemolytic uremic syndrome (HUS). Here we report Click Detect, a novel diagnostic platform that leverages click display – an in vitro protein display technology – to generate uniform and covalently linked protein–cDNA conjugates for toxin detection. Using a DARPin (D#20) as the signal probe and a high-affinity nanobody (NG1) as the capture reagent, Click Detect achieves sandwich-style recognition of Shiga toxin 2 (Stx2). The captured protein–cDNA conjugates can be quantified by standard nucleic acid amplification assays. Click Detect reliably detected Stx2 at 600 fM by qPCR and 6 pM by LAMP. The assay maintained comparable sensitivity in matrices containing up to 40% public swimming pool water or lettuce extract, highlighting robustness in real-world contamination scenarios. Key advantages of Click Detect include simple, rapid, and cost-effective (~$0.04 per assay) probe preparation as well as versatile plug-and-play probe format for sensing other targets. We believe Click Detect has great potential as a novel sensing platform for food safety monitoring, environmental surveillance, and point-of-care diagnostics, with potentially broad applicability to other toxins and protein targets.
Keywords:
Click display
; diagnostic
; DARPin
; nanobody
; Shiga toxin
; environmental
Introduction
Shiga toxin-producing E. coli (STEC) is a significant zoonotic foodborne pathogen, causing approximately 265,000 STEC infections occur annually in the United States, and resulting in an estimated 3,600 hospitalizations[1]. Infection with STEC typically results from the consumption of contaminated raw or undercooked food (e.g. meats, vegetables, milk, juice), water, or through direct contact with infected animals or humans. STEC represents a considerable public health concern due to its capacity to cause both outbreaks and isolated cases of bloody diarrhea[2]. The economic impact of STEC infection in the US is estimated to be ~$280 million per year[3].
Unfortunately, there is currently no effective treatment for STEC. Approximately 4-15% of STEC cases progress to hemolytic uremic syndrome (HUS), a condition characterized by acute renal failure, thrombocytopenia, and microangiopathic hemolytic anemia[4,5,6], with a mortality rate between 5-20%[7,8]. The pathology of STEC stems from secreted toxins – Shiga toxin 1 (Stx1) and Shiga toxin 2 (Stx2) – both of which belong to the AB5 family of protein toxins and comprise an enzymatically active A subunit and a non-toxic pentameric B subunit[9,10]. Upon being secreted GI-tract and transported into the bloodstream, the B subunit binds the carbohydrate moiety of the glycosphingolipid Gb3, which is abundant on the extracellular leaflet of cell plasma membranes, and mediates the translocation of the A subunit into cell cytosol[11,12,13]. The catalytic A subunit is a ribosomal RNA (rRNA) N-glycosidase and removes a single adenine from the rRNA of the host cell, arresting protein translation and leading to cell death[14]. Importantly, Shiga toxins can also cross the epithelial cell barrier and enter the circulatory system, from where they can travel to the kidneys and damage Gb3-expressing glomerular endothelial cells, leading to the onset of HUS in some individuals[4].
Rapid and accurate detection of STEC is critical for food safety monitoring, environmental surveillance and clinical diagnostics for patient management and HUS risk prediction. However, accurate point-of-care STEC diagnosis remains a significant challenge. The gold standard for diagnosing STEC is through stool culturing (16-24 h at 37 ºC) on sorbitol-MacConkey agar (SMAC). Since E. coli O157:H7, one of the most notorious STEC serotypes, cannot ferment sorbitol, they form colorless (pale) colonies which can be easily distinguished from the commensal E. coli (pink/red). However, culture on SMAC is slow and misses non-O157 STEC strains which have been reported to also cause STEC illnesses in many places[15]. Multiple nucleic acid amplification tests (NAATs) that detect stx1 and stx2 genes have been developed, which provide extremely sensitive and specific results [16,17,18,19]. However, because NAAT detects DNA, not toxin itself, a positive test result merely indicates the presence of the gene but not whether active toxin was produced, potentially leading to false positives.
Since the Shiga toxin proteins are the culprit for disease, direct detection of toxins has the potential to provide more accurate diagnosis and environmental surveillance. A number of methods have been developed for Shiga toxin protein detection including ELISA[20], LC-MS[21], mouse bioassays[22], cell-based assays[23,24,25] and translation inhibition assay[26]. Sandwich enzyme-linked immunosorbent assay (ELISA) is one of the most widely used detection methods in clinical laboratories and has been reported to detect ~0.025ng/mL (0.4 pM) of toxin in ~2.5 hours. In a conventional sandwich ELISA, the target protein is “sandwiched” between an immobilized capture antibody and a second antibody that recognizes the same target via a different, non-overlapping epitope. After washing, the detection of this second antibody via enzymatic/fluorescent labels or additional enzyme/fluorescent label-conjugated antibodies constitutes the target protein sensing.
To improve the target detection sensitivity of ELISA, immuno-PCR (iPCR) assays were developed in which the second antibody is conjugated to a strand of DNA for subsequent detection via NAATs (e.g. conventional and real-time PCR, CRISPR-based detection, isothermal DNA amplification). Although iPCR has been reported to achieve ~5 orders of magnitude better sensitivity than ELISA[27], the practical application of iPCR is hampered by technical challenges associated with DNA-protein conjugation. Although covalent conjugation methods (e.g. using amine-reactive or thiol-reactive crosslinkers) are preferred to form stable DNA-protein conjugates, these reactions are not site-specific, resulting in a heterogenous population of conjugates with a broad distribution of DNA-to-protein ratio and significant batch-to-batch variation in detection sensitivity. Additionally, extensive purification is required to remove free (unconjugated) DNA, which can be detected in NAATs and produce false signals, as well as unconjugated proteins, which can compete with conjugated protein for the target, adding labor and cost, in addition to often incurring significant conjugate loss.
Our lab recently developed click display, an in vitro protein display technology that yields covalently linked protein-cDNA complexes in a one-pot format[28]. Starting from double-stranded input DNA, the protein display is completed within 2 hours with the cDNA covalently conjugated to the C-terminus of the linked protein via a puromycin molecule. Click display was originally developed to facilitate the directed evolution of binders from a large library (1011-1012) to a target protein of interest. However, the facile generation of site-specific protein-cDNA conjugates naturally lends itself to iPCR applications. In this study, we developed Click Detect to explore the use of click display in the sensing of Stx2 protein. We demonstrate the detection of Stx2 with LoD of 6pM using unpurified click display product and LoD of 600fM using purified click display product. Additionally, Click Detect is compatible with complex matrices such as pool water and lettuce that are often sources of STEC contamination. Given the high sensitivity and great simplicity, Click Detect offers a promising first step toward effective detection of STEC for food safety monitoring and environment surveillance.
Results
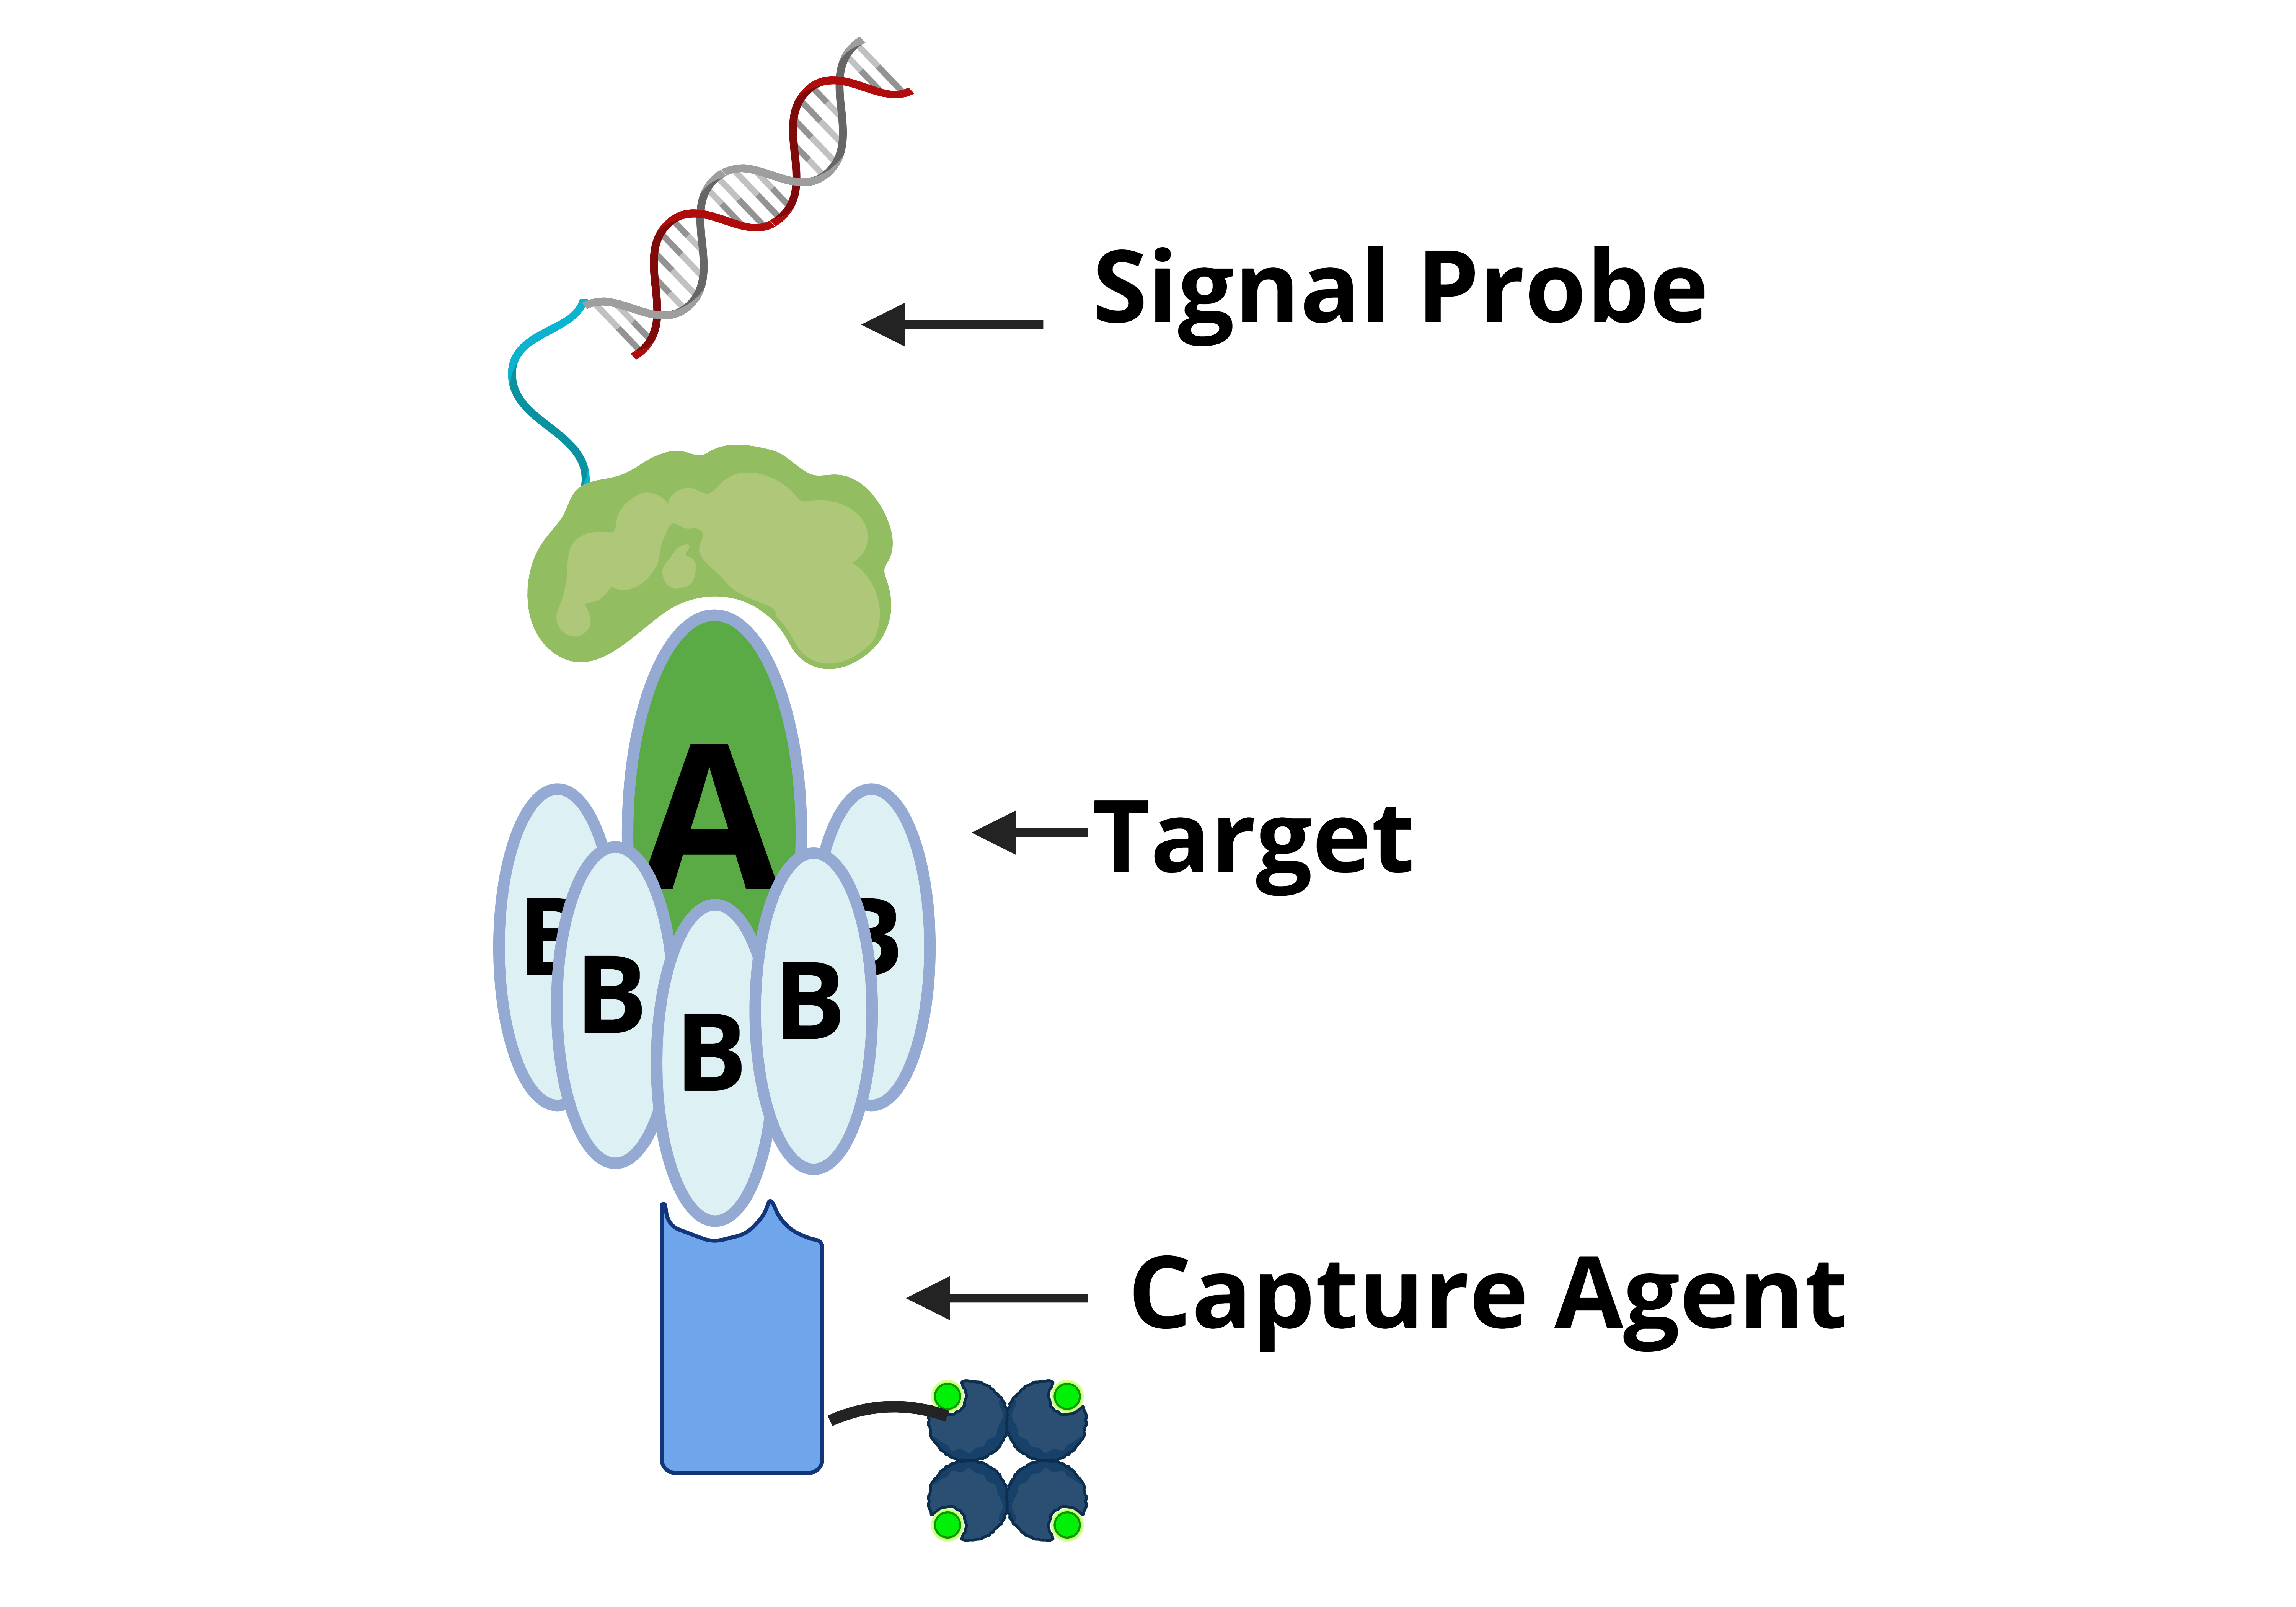
The overall design of Click Detect closely emulates that of iPCR, where two non-competitive Stx2 protein binders are employed (Figure 1A). Binder 1 (B1) is DARPin #20 (D#20), a designed ankyrin repeat protein (DARPin) previously engineered by us for neutralizing Stx2 toxicity[29]. D#20 showed very high binding affinity for the A-subunit of Stx2 (EC50 < 1 nM in ELISA). B1 forms the signal probe and is conjugated to its coding cDNA via click display (B1-cDNA) before incubation with the target protein. Binder 2 (B2) is nanobody G1 (NG1) and is reported to have high affinity (KD ~23 pM) and specificity toward the B subunit of Stx2[30]. B2 is the capturing reagent and is recombinantly purified (Figure S1), biotinylated via NHS chemistry, and immobilized on streptavidin-coated magnetic beads (B2-beads). After washing to remove unbound components, the cDNA pulled-down by B2-beads is amplified by NAATs for the detection of the target.
The B1-cDNA conjugate was produced by click display as described previously[28]. For each 12.5 µL of in vitro transcription/translation reaction, 500 ng of input template DNA encoding D#20 (Table S2) was used and the final product after reverse transcription was desalted, resuspended in 150 µL PBS, and stored at -80 ºC in single use aliquots. B2-beads were prepared by immobilizing biotinylated NG1 on streptavidin-coated magnetic beads.
Since excess cDNA may bind the streptavidin-coated beads non-specifically and produce false signals, we first determined the quantity of B1-cDNA that yields the optimum signal-to-noise ratio. In the first experiment, B1-cDNA after reverse transcription was simply desalted using size-exclusion chromatography with a Zeba column (40 k MWCO), diluted 75-600-fold in PTBD (PBS supplemented with 0.05% (v/v) Tween 20, 0.2% (w/v) BSA and 0.3 mg/mL salmon sperm DNA), and incubated in the presence or absence of Stx2 (final 600 pM) at room temperature for 30 minutes and then incubated with B2-beads for another 30 minutes followed by washing with PTBD to reduce non-specific binding. The amount of cDNA recovered from the B2-beads was quantified using qPCR. As anticipated, regardless of the presence of Stx2, lower dilutions resulted in higher amounts of non-specific binding manifested as lower cycle threshold (Ct) values in beads only (no target) samples (Figure 1B). The assays exhibit relatively high variability of the Δ Ct values (5-10) (Figure 1C), which were calculated from samples incubated in the absence and presence of Stx2, likely resulting from input template DNA (estimated to be ~486 kDa), which may also bind non-specifically to the beads and contribute to the background signal.
Since Zeba columns can only remove low-weight contaminants (e.g., salts and small molecules), the filtrate should retain all the input template DNA. To address this, B1-cDNA was purified by taking advantage of the 6xHis tag at the N-terminus of B1-cDNA (Table S1) using ultrafiltration (100 kDa cut-off) followed by immobilized metal affinity chromatography with Ni-NTA beads. At the same dilution fold, purified B1-cDNA showed slightly increased Ct for samples incubated in the presence of Stx2 than desalted B1-cDNA, especially at lower dilution (Figure 1D). However, the Ct for samples incubated in the absence of Stx2 increased significantly, resulting in greatly improved Δ Ct between samples containing and lacking Stx2 (Figure 1E) at all tested dilutions. The 150-fold dilution of B1-cDNA showed the most consistent Δ Ct values between batches and was selected for subsequent assays.
To determine the limit of detection (LoD) of our Stx2 sensing system, we first used desalted B1-cDNA as the signal probe. B1-cDNA was diluted 150-fold in PTBD and incubated with serially diluted Stx2. cDNA pulled down by B2-beads for the desalted samples can reliably detect 60 pM of Stx2 in qPCR although the detection of 6 pM Stx2 was unreliable (Figure 2A, C). Since thermocyclers are often unavailable in point-of-care settings, we also evaluated cDNA quantification by loop-mediated isothermal amplification (LAMP) and confirmed that LAMP can also reliably detect Stx2 at 60 pM (Figure 2B, D). The entire qPCR reaction takes approximately 1.5 hours to complete while the LAMP reaction takes less than 40 minutes (Mt).
Next, we repeated the assays using purified B1-cDNA. Purified B1-cDNA achieved significantly better Stx2 detection sensitivity with LoD of 0.6 pM for qPCR and 6 pM for LAMP (Figure 2E-H). The improved LoD largely stems from significantly reduced background signals from samples incubated with B2-beads in the absence of Stx2 (No Stx2). This is likely due to the absence of free DNA, enabling purified B1-cDNA to have a very low background signal with Ct ~ 36 in qPCR and Mt ~29 in LAMP. In contrast, desalted B1-cDNA is likely contaminated with free DNA and exhibits a background signal with Ct ~ 27 and Mt ~ 21. It is somewhat surprising that qPCR achieved slightly better detection sensitivity than LAMP since both have been reported to have similar sensitivity. In the current study, the LAMP primer set (Table S3) was designed using NEB LAMP Primer Design Tool. It is possible that, with better primer design, LAMP detection sensitivity may be improved.
Click Detect of Stx2 in Environmental/Food Matrices
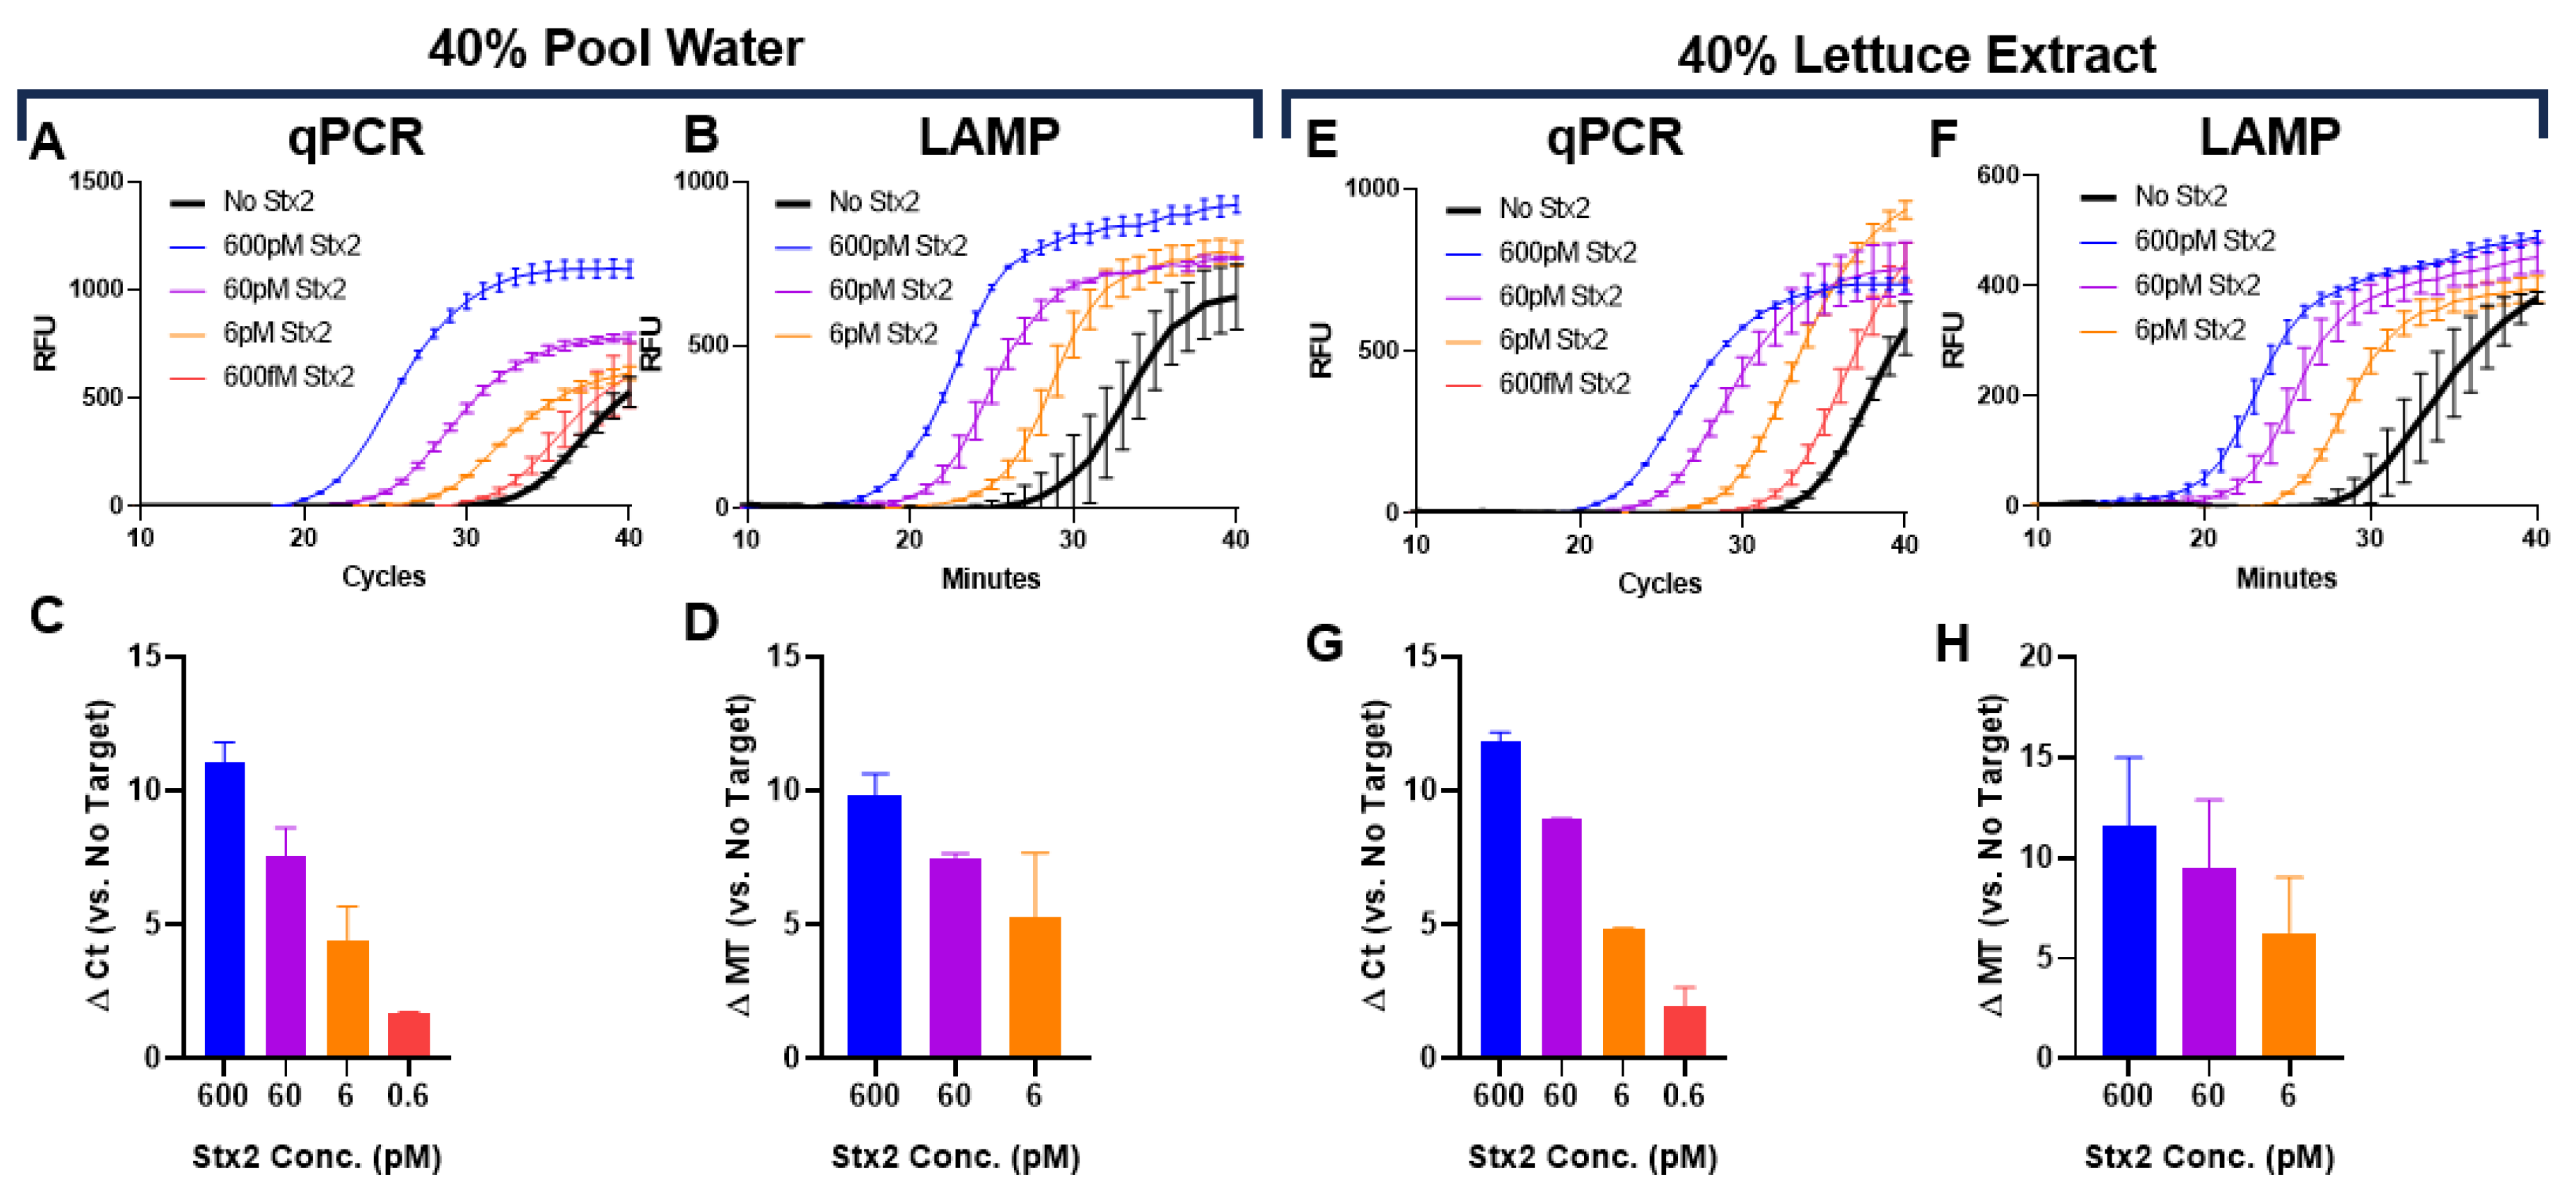
The sensitivity of many assays is often diminished when evaluated in challenging matrices, limiting their translation to real-world surveillance. To demonstrate the potential of Click Detect for monitoring, we determined the Stx2 sensing LoD in assay buffer spiked with water collected from a public swimming pool and lettuce extract from a local retailer, which are representative of environmental and food matrices containing chemical contaminants and disinfectants. Purified B1-cDNA was incubated with Stx2 serially diluted in PTBD and spiked with up to 40% pool water (Figure 3A-D, Figure S2) or lettuce extract (Figure 3E-H). The percentage represents the v/v ratio of environmental solutions used during incubation of B1-cDNA and Stx2. In both cases, similar LoDs were observed with qPCR achieving slightly better sensing LoD (0.6 pM) than LAMP (6 pM). Although the Stx2 sensitivity needed for water- and food- monitoring is unknown, the ability of Click Detect to sense Stx2 in these complex environmental and food matrices underscores the robust nature of Click Detect and its potential for field applications.
Discussion
STEC is a serious global public health concern causing sporadic outbreaks[31]. Currently, there is no effective cure for STEC. Although antibiotics can reduce the bacteria load, they can also activate Stx prophage[32], leading to increased toxin release and worsened patient outcome. Efficient and frequent food safety monitoring and environment surveillance is therefore critical for preventing or limiting the scale of STEC outbreaks, prompting quicker disease diagnosis, and identifying of the source(s) of infection.
In this study, we designed and demonstrated a proof-of-concept of Click Detect as surrogate immuno-PCR/LAMP assays for Stx2 detection. Click detect takes advantage of click display, which enables facile and rapid preparation of protein-DNA probes in a one-pot format (< 2 hours)[28]. A key advantage of using click display to prepare the signal probe is the formation of uniformly linked covalent protein-DNA conjugates, which is difficult to accomplish via conventional amine-/thiol-reactive chemical reactions or streptavidin(tetramer)-biotin reactions. Homogenous protein-DNA probes have the potential to greatly improve assay sensitivity and significantly reduce batch-to-batch assay variation. Similar protein-DNA probes were previously produced using cDNA display technology[33] and demonstrated high assay sensitivity and compatibility with serum samples[33]. Although both cDNA display and click display yield 1:1 covalent complex of a protein and its coding cDNA via puromycin, the use of click chemistry affords click display a simpler and more efficient linker preparation.
Significantly improved detection sensitivity was observed using Ni-NTA purified protein-DNA signal probe (i.e. B1-cDNA), mostly through reduction of background signal (Figure 2). Protein-DNA probes simply desalted via size-exclusion chromatography retain both the input, double-stranded DNA template used for transcription in the click display reaction as well as unconjugated cDNA. Since the primers for qPCR and LAMP cannot distinguish between the input DNA/unconjugated cDNA and cDNA conjugated to B1, DNA that non-specifically binds the B2-beads independent of Stx2 can also be amplified, leading to background signals. The 6xHis-tag appended to the N-terminus of B1 enables removal of template and unconjugated DNA via one-step immobilized metal affinity chromatography using Ni-NTA beads, and significantly reduced background signal and improved Stx2 sensing LoD.
In the current Click Detect format, Stx2 at 6 pM (~0.5 ng/mL) can be reliably detected by LAMP and 0.6 pM (~0.05 ng/mL) by qPCR. This LoD is similar to that of optimized ELISA (LoD 0.02-0.05 ng/mL)[20]. Since immuno-PCR has been reported to achieve up to 5-orders of magnitude better LoD than ELISA, the LoD of Click Detect can potentially be significantly improved if paired with alternative binders with higher Stx2 binding affinity. NG1 was biotinylated via NHS chemistry and since NHS indiscriminately reacts with the primary amine on surface exposed lysine residues, biotinylation of lysine at or near the binding interface on NG1 may result in reduced Stx2-binding efficiency. In the future, site-specific biotinylation techniques, such as those employing click chemistry-compatible non-natural amino acids, may be used for NG1 biotinylation to achieve improved assay sensitivity. D#20 is a DARPin previously engineered for Stx2 neutralization. We chose to conjugate cDNA to D#20 mainly due to its binding affinity, binding site, and compatibility with click display. To date, we have only used the NEB PURExpress in vitro Protein Synthesis Kit for click display of DARPins and have not attempted displaying proteins with disulfide bonds (e.g. single-chain variable fragments (scFvs)). It is possible that alternative in vitro protein synthesis formulations with disulfide bond enhancer can be used to generate signal probes with disulfide bond(s).
Contamination of STEC is a persistent issue as there are many reservoirs for STEC and Stx2 in the environment[34]. Leafy greens are among the most widely consumed vegetables and have been repeatedly associated with STEC outbreaks[35,36]. Sporadic outbreaks stemming from untreated water have also been reported[37]. Click Detect is a suitable method for certain environmental tests, as it can tolerate up to 40% pool water, and lettuce extract with similar LoD to that of assay buffer (PTBD, 0.6 pM for qPCR and 6 pM for LAMP). Another common source for STEC outbreaks in the US is ground beef[38]. Unfortunately, Click Detect failed to robustly detect Stx2 in samples containing >10% beef extract (data not shown). One possibility to explain the reduced performance is that components of beef extract samples may compromise the integrity of the signal probe (e.g. DNase), compete for binding to Stx2 (e.g. serum amyloid), or degrade D#20/NG1 (e.g. protease). However, additional reaction condition optimization may overcome these hurdles and facilitate Stx2 sensing by Click Detect in these complex samples.
In conclusion, we report the development of Click Detect for highly sensitive Stx2 detection. Although the current study used a thermocycler for DNA amplification and detection, a plethora of paper-based lateral flow assays have been reported recently for DNA amplification and detection at the point of care setting[39,40,41,42] and can potentially be integrated with Click Detect to achieve simpler/cheaper target sensing in the future. The estimated material cost of the signal probe is $0.04 per assay. Click detect offers simple and efficient target sensing and is compatible with complex matrices. We envision that our technology can be easily extended to other targets using analogous sandwich assays.
Materials and Methods
Protein expression and purification
NG1 was expressed in Shuffle® T7 cells (NEB, Cat# C3029J). The cells were cultured in Luria-Bertani (LB) broth supplemented with 50 μg/mL kanamycin and induced with isopropyl b-d-1-thiogalactopyranoside (IPTG, final 1 mM, Goldbio, Cat# I2481C) when the culture reached OD600 ~0.5. Proteins were purified using immobilized metal affinity chromatography (IMAC) with gravity Ni-NTA beads (PureCube 100 Ni-NTA Agarose, Cat# 74705) following standard protocol. The eluted protein was buffer exchanged into 1xPBS (11.9 mM phosphates, 137mM NaCl, and 2.7mM KCl, pH 7.4) and concentrated using Amicon ultrafiltration column (Millipore, MWCO 10 kDa, Cat# UFC9010). The purity was analyzed using 12% SDS-PAGE stain-free gel (Bio-Rad, Cat# 4568043) and are all > 90%. The protein concentration was quantified using Pierce BCA Protein assay (Thermo Scientific, Cat# PI23227).
Stx2 was similarly expressed and purified as previously described[29].
Preparation of B1-cDNA
Click display of D#20 (B1) was carried out exactly as described previously using PURExpress In Vitro Protein Synthesis Kit (NEB, Cat# E6800L) with 500ng of PCR amplified D#20 DNA as the template for each 12.5 µL transcription/translation reaction. After reverse transcription, the final product was buffer exchanged into 1xPBS (11.9 mM phosphates, 137mM NaCl, and 2.7mM KCl, pH 7.4) using a Zeba Spin Desalting Column (40 kDa MWCO, ThermoFisher Scientific, Cat# PIA57759). The resulting B1-cDNA was stored as ‘unpurified’ product at -80ºC in aliquots until use. For ‘purified’ click display product, the reverse transcription product was first desalted via ultrafiltration using Amicon (100 kDa MWCO, Cat# UFC510024) followed by pull-down using Ni-NTA agarose beads (ThermoFisher Scientific, Cat# PI78605), washing and elution using PBS supplemented with 250 mM imidazole.
Preparation of Biotinylated Proteins
IMAC purified NG1 was biotinylated using EZ-Link™ Sulfo-NHS-LC-Biotin (ThermoFisher Scientific Cat# 21335) at 1:4 molar ratio in PBS with 30 minutes incubation at room temperature followed by overnight incubation at 4 ºC. Excess biotin was removed by passing the mixture through 2 Zeba spin desalting columns (7K, MWCO, ThermoFisher) sequentially to collect NG1-biotin. BSA-biotin was prepared using the same condition except that Fraction V Bovine Albumin (company, Cat# J10857-22) was incubated with Sulfo-NHS-LC-Biotin at 1:20 molar ratio.
Preparation of B2-beads
To form B2-beads, MyOne (Thermo Fisher Scientific Cat# 65601) streptavidin-coated magnetic bead slurry was first washed thrice with PTBD (1xPBS supplemented with 0.05% tween-20, 0.2% BSA and 0.3 mg/mL salmon sperm DNA) and then incubated with 100 nM NG1-biotin in PTBD at 1:12 bead slurry to protein ratio at 4 ºC with rotation for 10 minutes. The supernatant was removed, and the beads were further incubated in 100 nM BSA-biotin in PTBD, at the same volume ratio as previous, at room temperature for 5 minutes to block any additional unoccupied streptavidin sites on the beads. After removal of the supernatant, the beads were resuspended in PTBD, aliquoted, and used immediately.
Target detection
For LoD determination, B1-cDNA was diluted 150-fold in PTBD, mixed with serially diluted Stx2 (in PTBD) at 9:1 volume ratio and incubated at room temperature for 30 minutes. Each 10 µL mixture was then mixed with 50 µL of B2-beads (equivalent of 5 µL bead slurry). After another 30 minutes of incubation at room temperature with rotation, the beads were pulled down using a magnetic stand, washed 4 times with 250 µL of PTBD, resuspended in 10 µL of 1xNEB ThermoPol buffer (Cat# B9004S), heated to 95 °C for 5 minutes, and finally, used for NAATs.
For target detection in environmental samples, B1-cDNA was diluted 75-fold in PTBD and mixed with serially diluted Stx2 and 100% pool water or lettuce extract at 5:1:4 volume ratio. Pool water collected from local recreation areas by collecting water several cm below the surface. Lettuce extract was obtained by collecting liquid released by compression of lettuce purchased from a local retailer.
NAATs
For LAMP detection, 1 μL of the resuspended B1-cDNA-Stx2-B2-beads mixture was added to 9 µL of LAMP mixture (0.2 µM of primers F3/B3, 1.6 µM FIP/BIP, 0.4 µL LF/LB, 0.4 mM of dNTP, 3.2 U of Bst Warmstart® 2.0 DNA polymerase (Cat # M0537S), 0.2X EvaGreen dye (Biotium, Cat# 31019), 6mM MgSO4 (NEB), 1×isothermal amplification buffer (NEB)). The reaction was carried out at 65 °C in a qPCR instrument (Bio-Rad CFX Duet Real-Time PCR).
For qPCR detection, 1 μL of the resuspended B1-cDNA-Stx2-B2-beads mixture was added to 9 μL qPCR mixture (200nM qF/ qR in 1x Forget-Me-Not™ EvaGreen® qPCR Master Mix (Cat #31041)). The reaction was carried out in the same qPCR instrument using the following program (95°C for 2 min, followed by 40 cycles of 95°C for 15 s, 60°C for 30 s and 72°C for 30 s, and final extension at 72°C for 5 min). The Ct/Mt values were determined using the regression method of CFX Manager software.
Supplementary Materials
The following supporting information can be downloaded at the website of this paper posted on Preprints.org
Author Contributions
Conceptualization, Z.C. and B.T.; funding acquisition, Z.C.; investigation, B.T., E.W., A.F., K.Y., and Z.C.; methodology, B.T., E.W., and Z.C.; supervision, B.T. and Z.C.; writing—original draft, B.T. and Z.C.; writing—review and editing, B.T. and Z.C. All authors have read and agreed to the published version of the manuscript.
References
- Prevention, C.f.D.C.a. Reports of Selected E. coli Outbreak Investigations (accessed April, 2024). Available online: https://www.cdc.gov/ecoli/outbreaks.html (accessed on.
- Tarr, P.I.; Gordon, C.A.; Chandler, W.L. Shiga-toxin-producing Escherichia coli and haemolytic uraemic syndrome. Lancet 2005, 365, 1073–1086. [Google Scholar] [CrossRef] [PubMed]
- Marshall, K.E.; Hexemer, A.; Seelman, S.L.; Fatica, M.K.; Blessington, T.; Hajmeer, M.; Kisselburgh, H.; Atkinson, R.; Hill, K.; Sharma, D.; et al. Lessons Learned from a Decade of Investigations of Shiga Toxin-Producing Escherichia coli Outbreaks Linked to Leafy Greens, United States and Canada. Emerg Infect Dis 2020, 26, 2319–2328. [Google Scholar] [CrossRef]
- Melton-Celsa, A.; Mohawk, K.; Teel, L.; O'Brien, A. Pathogenesis of Shiga-toxin producing escherichia coli. Curr Top Microbiol Immunol 2012, 357, 67–103. [Google Scholar] [CrossRef]
- Trofa, A.F.; Ueno-Olsen, H.; Oiwa, R.; Yoshikawa, M. Dr. Kiyoshi Shiga: discoverer of the dysentery bacillus. Clin Infect Dis 1999, 29, 1303–1306. [Google Scholar] [CrossRef]
- Dubos, R.J.; Geiger, J.W. Preparation and properties of Shiga toxin and toxoid. J Exp Med 1946, 84, 143–156. [Google Scholar] [CrossRef]
- Corrigan, J.J., Jr.; Boineau, F.G. Hemolytic-uremic syndrome. Pediatr Rev 2001, 22, 365–369. [Google Scholar] [CrossRef]
- Travert, B.; Dossier, A.; Jamme, M.; Cointe, A.; Delmas, Y.; Malot, S.; Wynckel, A.; Seguin, A.; Presne, C.; Hie, M.; et al. Shiga Toxin-Associated Hemolytic Uremic Syndrome in Adults, France, 2009-2017. Emerging infectious diseases 2021, 27, 1876–1885. [Google Scholar] [CrossRef]
- Fraser, M.E.; Fujinaga, M.; Cherney, M.M.; Melton-Celsa, A.R.; Twiddy, E.M.; O'Brien, A.D.; James, M.N. Structure of shiga toxin type 2 (Stx2) from Escherichia coli O157:H7. J Biol Chem 2004, 279, 27511–27517. [Google Scholar] [CrossRef] [PubMed]
- Fraser, M.E.; Chernaia, M.M.; Kozlov, Y.V.; James, M.N. Crystal structure of the holotoxin from Shigella dysenteriae at 2.5 A resolution. Nat Struct Biol 1994, 1, 59–64. [Google Scholar] [CrossRef]
- Sandvig, K.; Bergan, J.; Dyve, A.B.; Skotland, T.; Torgersen, M.L. Endocytosis and retrograde transport of Shiga toxin. Toxicon : official journal of the International Society on Toxinology 2010, 56, 1181–1185. [Google Scholar] [CrossRef] [PubMed]
- Sandvig, K.; Torgersen, M.L.; Engedal, N.; Skotland, T.; Iversen, T.G. Protein toxins from plants and bacteria: probes for intracellular transport and tools in medicine. FEBS Lett 2010, 584, 2626–2634. [Google Scholar] [CrossRef]
- Sandvig, K.; Pust, S.; Skotland, T.; van Deurs, B. Clathrin-independent endocytosis: mechanisms and function. Curr Opin Cell Biol 2011, 23, 413–420. [Google Scholar] [CrossRef] [PubMed]
- Tesh, V.L. Induction of apoptosis by Shiga toxins. Future Microbiol 2010, 5, 431–453. [Google Scholar] [CrossRef] [PubMed]
- Scallan, E.; Hoekstra, R.M.; Angulo, F.J.; Tauxe, R.V.; Widdowson, M.-A.; Roy, S.L.; Jones, J.L.; Griffin, P.M. Foodborne Illness Acquired in the United States—Major Pathogens. Emerging Infectious Diseases 2011, 17, 7–15. [Google Scholar] [CrossRef]
- Alfahl, Z.; O’Connor, L.; Morris, D.; Smith, T.J.; O'Dwyer, J.; Hynds, P.D.; Cormican, M.; Burke, L.P. A novel enrichment-free, low-volume filtration and rapid lysis (ELR) method in combination with real-time PCR for detection of Shiga toxin-producing Escherichia coli (STEC) in water. Access Microbiology 2025, 7. [Google Scholar] [CrossRef] [PubMed]
- Alfahl, Z.; Biggins, S.; Higgins, O.; Chueiri, A.; Smith, T.J.; Morris, D.; O'Dwyer, J.; Hynds, P.D.; Burke, L.P.; O'Connor, L. A rapid on-site loop-mediated isothermal amplification technology as an early warning system for the detection of Shiga toxin-producing Escherichia coli in water. Microbiology (Reading) 2024, 170. [Google Scholar] [CrossRef]
- Kim, J.H.; Oh, S.W. Development of a filtration-based LAMP-LFA method as sensitive and rapid detection of E. coli O157:H7. J Food Sci Technol 2019, 56, 2576–2583. [Google Scholar] [CrossRef]
- Cao, Y.; Fang, T.; Shen, J.; Zhang, G.; Guo, D.; Zhao, L.; Jiang, Y.; Zhi, S.; Zheng, L.; Lv, X.; et al. Development of Recombinase Aided Amplification (RAA)-Exo-Probe Assay for the Rapid Detection of Shiga Toxin-Producing Escherichia coli. J AOAC Int 2023, 106, 1246–1253. [Google Scholar] [CrossRef]
- He, X.; Kong, Q.; Patfield, S.; Skinner, C.; Rasooly, R. A New Immunoassay for Detecting All Subtypes of Shiga Toxins Produced by Shiga Toxin-Producing E. coli in Ground Beef. PLOS ONE 2016, 11, e0148092. [Google Scholar] [CrossRef]
- Silva, C.J.; Erickson-Beltran, M.L.; Skinner, C.B.; Dynin, I.; Hui, C.; Patfield, S.A.; Carter, J.M.; He, X. Safe and Effective Means of Detecting and Quantitating Shiga-Like Toxins in Attomole Amounts. Analytical Chemistry 2014, 86, 4698–4706. [Google Scholar] [CrossRef]
- Cheng, L.W.; Henderson, T.D.; Patfield, S.; Stanker, L.H.; He, X. Mouse in vivo neutralization of Escherichia coli Shiga toxin 2 with monoclonal antibodies. Toxins (Basel) 2013, 5, 1845–1858. [Google Scholar] [CrossRef]
- To, C.Z.; Bhunia, A.K. Three Dimensional Vero Cell-Platform for Rapid and Sensitive Screening of Shiga-Toxin Producing Escherichia coli. Front Microbiol 2019, 10, 949. [Google Scholar] [CrossRef]
- Hughes, A.C.; Patfield, S.; Rasooly, R.; He, X. Validation of a Cell-Based Assay for Detection of Active Shiga Toxins Produced by Escherichia coli in Water. Int J Environ Res Public Health 2020, 17. [Google Scholar] [CrossRef]
- Tam, C.C.; Wang, Y.; Du, W.X.; Flannery, A.R.; He, X. Development of a Rapid and Sensitive CANARY Biosensor Assay for the Detection of Shiga Toxin 2 from Escherichia coli. Toxins (Basel) 2024, 16. [Google Scholar] [CrossRef]
- He, X.; Quinones, B.; Carter, J.M.; Mandrell, R.E. Validation of a cell-free translation assay for detecting shiga toxin 2 in bacterial culture. J Agric Food Chem 2009, 57, 5084–5088. [Google Scholar] [CrossRef]
- He, X.; Qi, W.; Quinones, B.; McMahon, S.; Cooley, M.; Mandrell, R.E. Sensitive detection of Shiga Toxin 2 and some of its variants in environmental samples by a novel immuno-PCR assay. Appl Environ Microbiol 2011, 77, 3558–3564. [Google Scholar] [CrossRef]
- Zeng, Y.; Woolley, M.; Chockalingam, K.; Thomas, B.; Arora, S.; Hook, M.; Chen, Z. Click display: a rapid and efficient in vitro protein display method for directed evolution. Nucleic Acids Res 2023, 51, e89. [Google Scholar] [CrossRef] [PubMed]
- Zeng, Y.; Jiang, M.; Robinson, S.; Peng, Z.; Chonira, V.; Simeon, R.; Tzipori, S.; Zhang, J.; Chen, Z. A Multi-Specific DARPin Potently Neutralizes Shiga Toxin 2 via Simultaneous Modulation of Both Toxin Subunits. Bioengineering 2022, 9, 511. [Google Scholar] [CrossRef] [PubMed]
- Tremblay, J.M.; Mukherjee, J.; Leysath, C.E.; Debatis, M.; Ofori, K.; Baldwin, K.; Boucher, C.; Peters, R.; Beamer, G.; Sheoran, A.; et al. A single VHH-based toxin-neutralizing agent and an effector antibody protect mice against challenge with Shiga toxins 1 and 2. Infect Immun 2013, 81, 4592–4603. [Google Scholar] [CrossRef]
- Majowicz, S.E.; Scallan, E.; Jones-Bitton, A.; Sargeant, J.M.; Stapleton, J.; Angulo, F.J.; Yeung, D.H.; Kirk, M.D. Global Incidence of Human Shiga Toxin–ProducingEscherichia coliInfections and Deaths: A Systematic Review and Knowledge Synthesis. Foodborne Pathogens and Disease 2014, 11, 447–455. [Google Scholar] [CrossRef]
- Bielaszewska, M.; Idelevich, E.A.; Zhang, W.; Bauwens, A.; Schaumburg, F.; Mellmann, A.; Peters, G.; Karch, H. Effects of antibiotics on Shiga toxin 2 production and bacteriophage induction by epidemic Escherichia coli O104:H4 strain. Antimicrob Agents Chemother 2012, 56, 3277–3282. [Google Scholar] [CrossRef]
- Anzai, H.; Terai, T.; Jayathilake, C.; Suzuki, T.; Nemoto, N. A novel immuno-PCR method using cDNA display. Anal Biochem 2019, 578, 1–6. [Google Scholar] [CrossRef]
- Kim, J.-S.; Lee, M.-S.; Kim, J.H. Recent Updates on Outbreaks of Shiga Toxin-Producing Escherichia coli and Its Potential Reservoirs. Frontiers in Cellular and Infection Microbiology 2020, 10. [Google Scholar] [CrossRef]
- Luna-Guevara, J.J.; Arenas-Hernandez, M.M.P.; Martínez de la Peña, C.; Silva, J.L.; Luna-Guevara, M.L. The Role of Pathogenic E. coli in Fresh Vegetables: Behavior, Contamination Factors, and Preventive Measures. Int J Microbiol 2019, 2019, 2894328. [Google Scholar] [CrossRef] [PubMed]
- Lacombe, A.; Quintela, I.A.; Liao, Y.T.; Wu, V.C.H. Shiga toxin-producing Escherichia coli outbreaks in California's leafy greens production continuum. Front Food Sci Techn 2022, 2. [Google Scholar] [CrossRef]
- Osborn B, H.J. , Lanier W, et al. Shiga Toxin–Producing Escherichia coli O157:H7 Illness Outbreak Associated with Untreated, Pressurized, Municipal Irrigation Water — Utah, 2023.
- Heiman, K.E.; Mody, R.K.; Johnson, S.D.; Griffin, P.M.; Gould, L.H. Escherichia coli O157 Outbreaks in the United States, 2003-2012. Emerging infectious diseases 2015, 21, 1293–1301. [Google Scholar] [CrossRef] [PubMed]
- Jauset-Rubio, M.; Svobodová, M.; Mairal, T.; McNeil, C.; Keegan, N.; Saeed, A.; Abbas, M.N.; El-Shahawi, M.S.; Bashammakh, A.S.; Alyoubi, A.O.; et al. Ultrasensitive, rapid and inexpensive detection of DNA using paper based lateral flow assay. Scientific reports 2016, 6, 37732. [Google Scholar] [CrossRef]
- Kyung, K.; Lee, H.; Kim, S.K.; Kim, D.E. Nucleic Acid Lateral Flow Assay Implemented with Isothermal Gene Amplification of SARS-CoV-2 RNA. Biosensors (Basel) 2024, 14. [Google Scholar] [CrossRef]
- Jawla, J.; Kumar, R.R.; Mendiratta, S.K.; Agarwal, R.K.; Singh, P.; Saxena, V.; Kumari, S.; Kumar, D. A novel paper based loop mediated isothermal amplification and lateral flow assay (LAMP-LFA) for point-of-care detection of buffalo tissue origin in diverse foods. Journal of Food Safety 2023, 43, e13038. [Google Scholar] [CrossRef]
- Kim, S.; Kim, J.H.; Kim, S.; Park, J.S.; Cha, B.S.; Lee, E.S.; Han, J.; Shin, J.; Jang, Y.; Park, K.S. Loop-mediated isothermal amplification-based nucleic acid lateral flow assay for the specific and multiplex detection of genetic markers. Analytica Chimica Acta 2022, 1205, 339781. [Google Scholar] [CrossRef]
Figure 1.
Optimization of Click Detect assay for Stx2. (A) Schematic of click detect. Binder 1 (i.e. D#20) is linked to its coding cDNA via click display (B1-cDNA) and then incubated with the target Stx2 toxin. Binder 2 (i.e. NG1) is biotinylated and immobilized on streptavidin-coated magnetic beads (B2-beads). The presence of Stx2 mediates the pull-down of B1-cDNA by B2-beads and cDNA detection via NAAT assays following wash steps. (B-E) qPCR cycle threshold (Ct) of cDNA pull-down by B2-beads from samples incubated in the absence or presence of Stx2 (600 pM). B1-cDNA was either simply desalted (B, C) or desalted and purified via Ni-NTA beads (D, E) and serially diluted in PTBD. The ∆ Ct values are the average from two independent experiments with error bars representing standard deviation (SD).
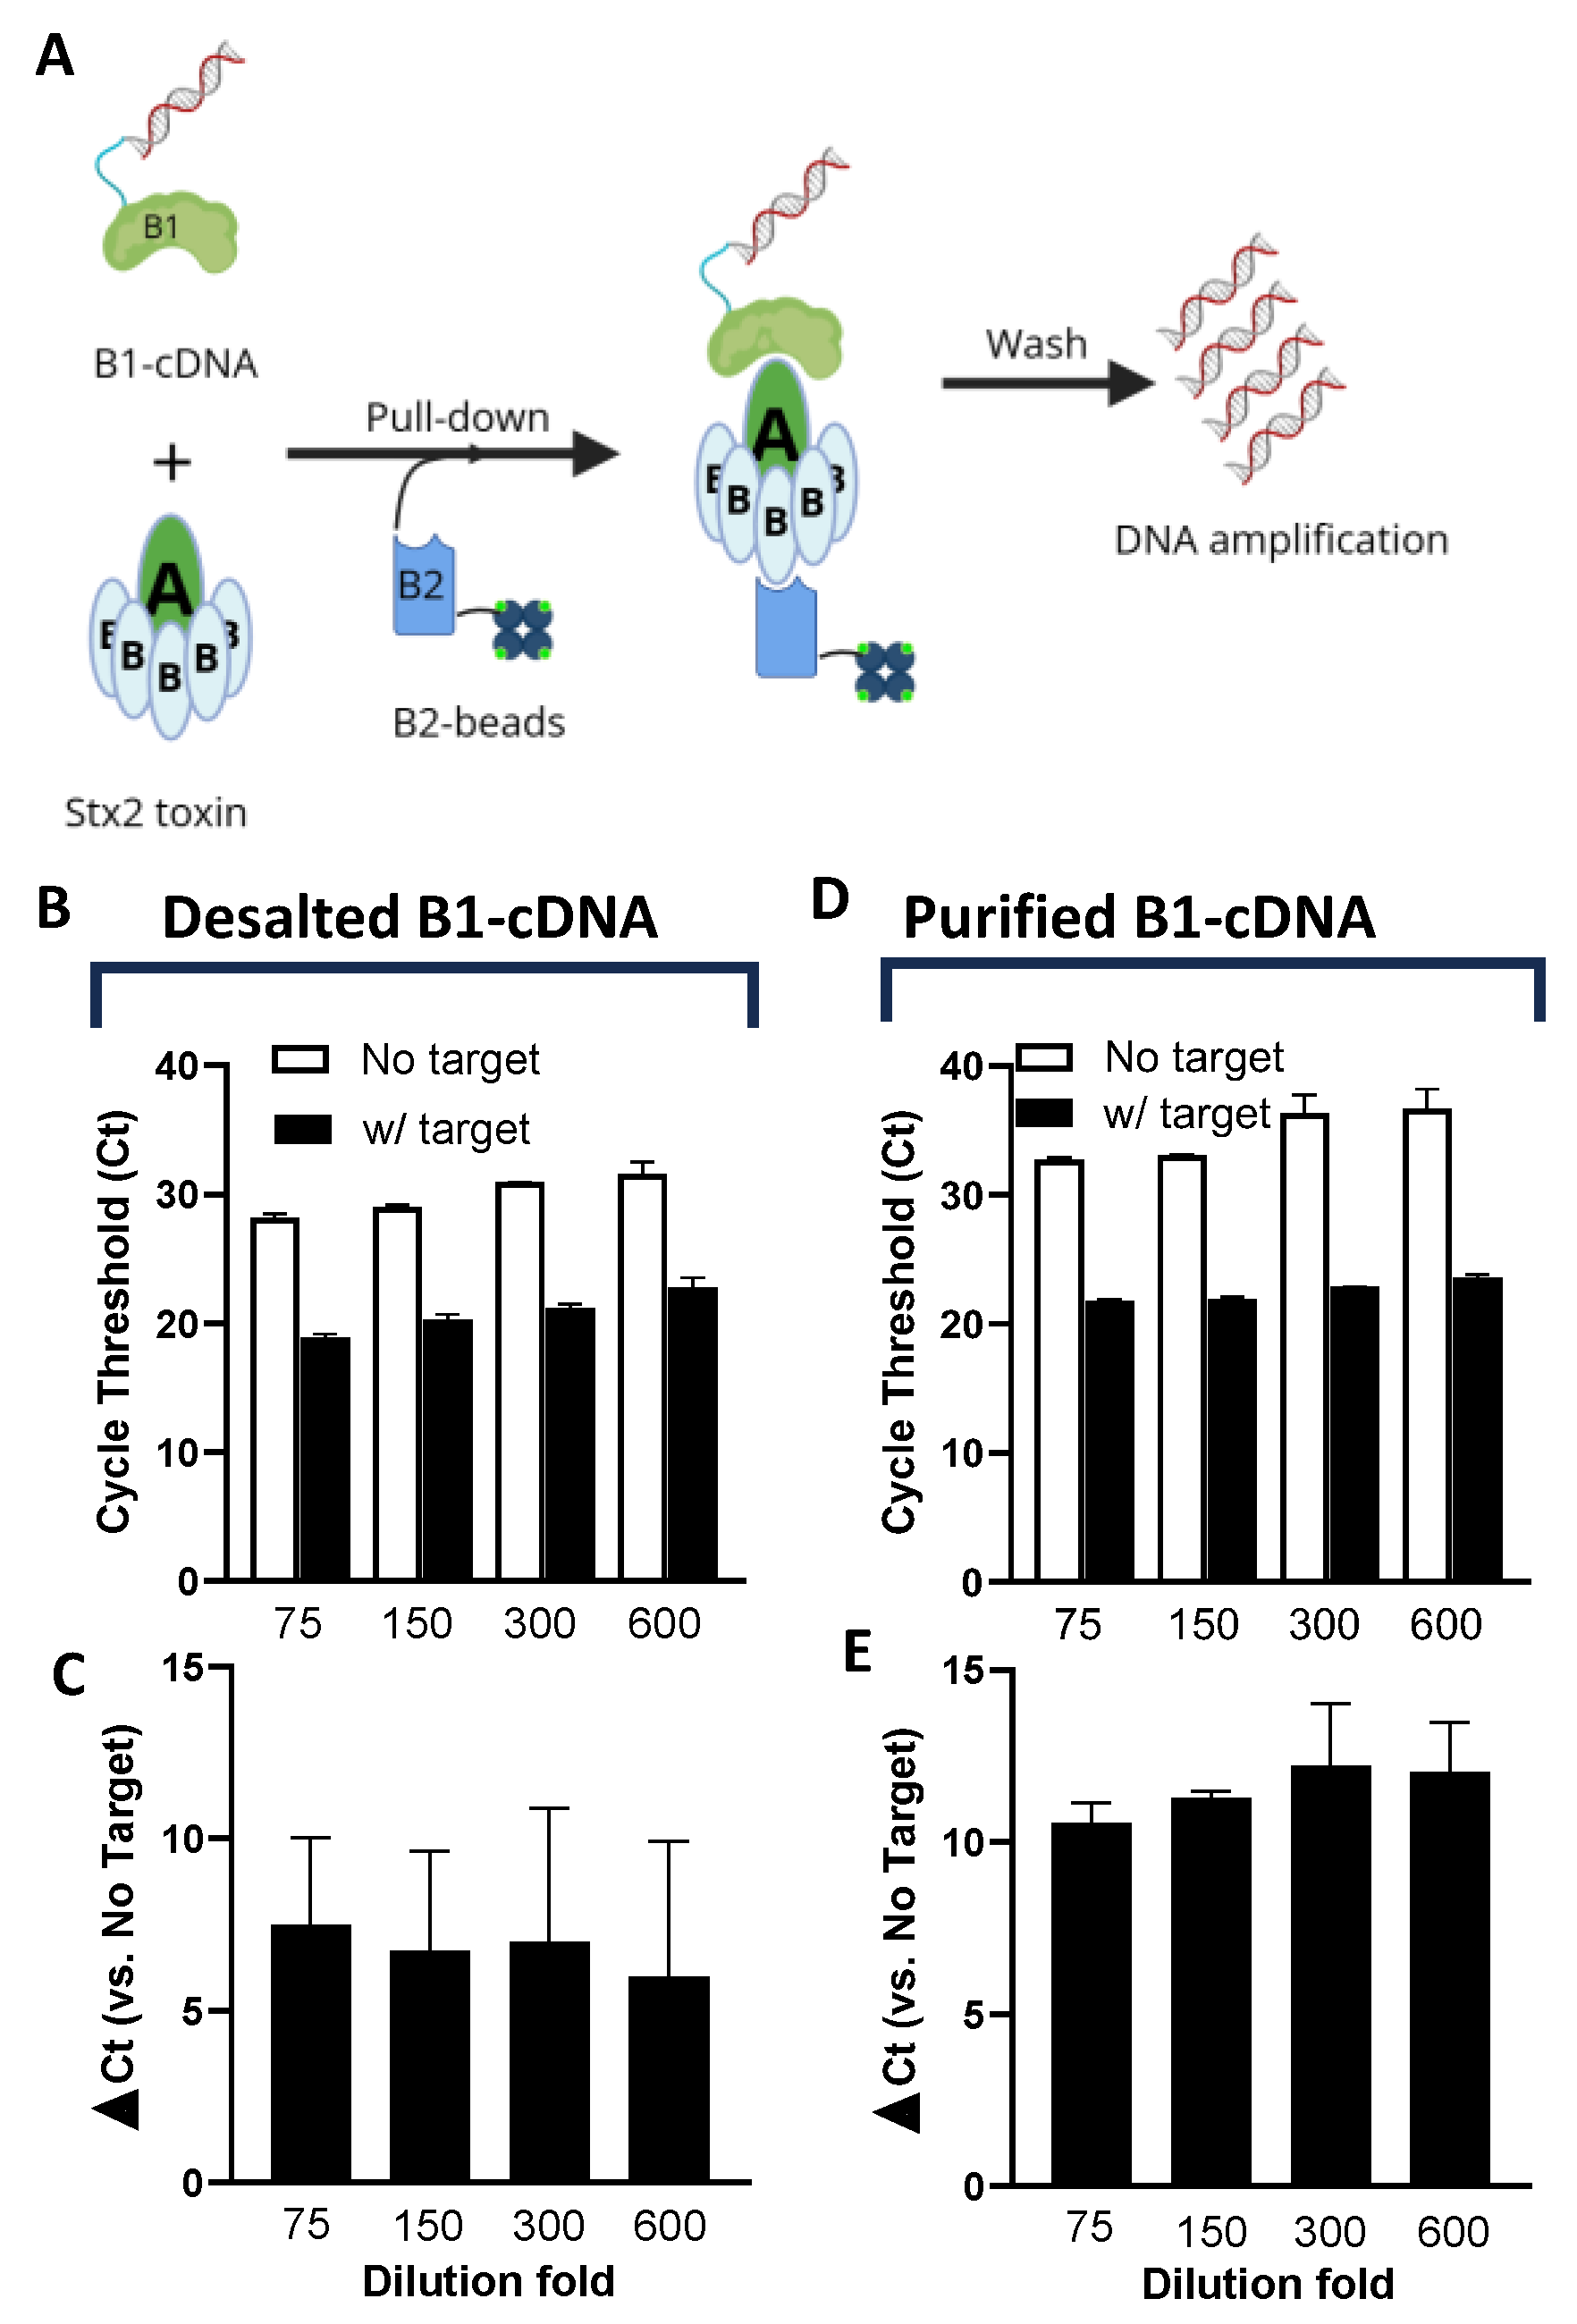
Figure 2.
Determination of Stx2 sensing LoD in assay buffers using desalted (A-D) or purified (E-H) B1-cDNA. Kinetic curves (A, E) and calculated Δ Ct (C, G) of qPCR reactions. Ct and minute (Mt) to detection were determined using regression. Kinetic curves (B, F) and calculated Δ Mt (D, H) of LAMP reactions. The kinetic curves from one representative experiment from at least 2 independent experiments were presented. The ∆ Ct or ∆ Mt values are the average from 2 independent experiments with error bars representing SD.
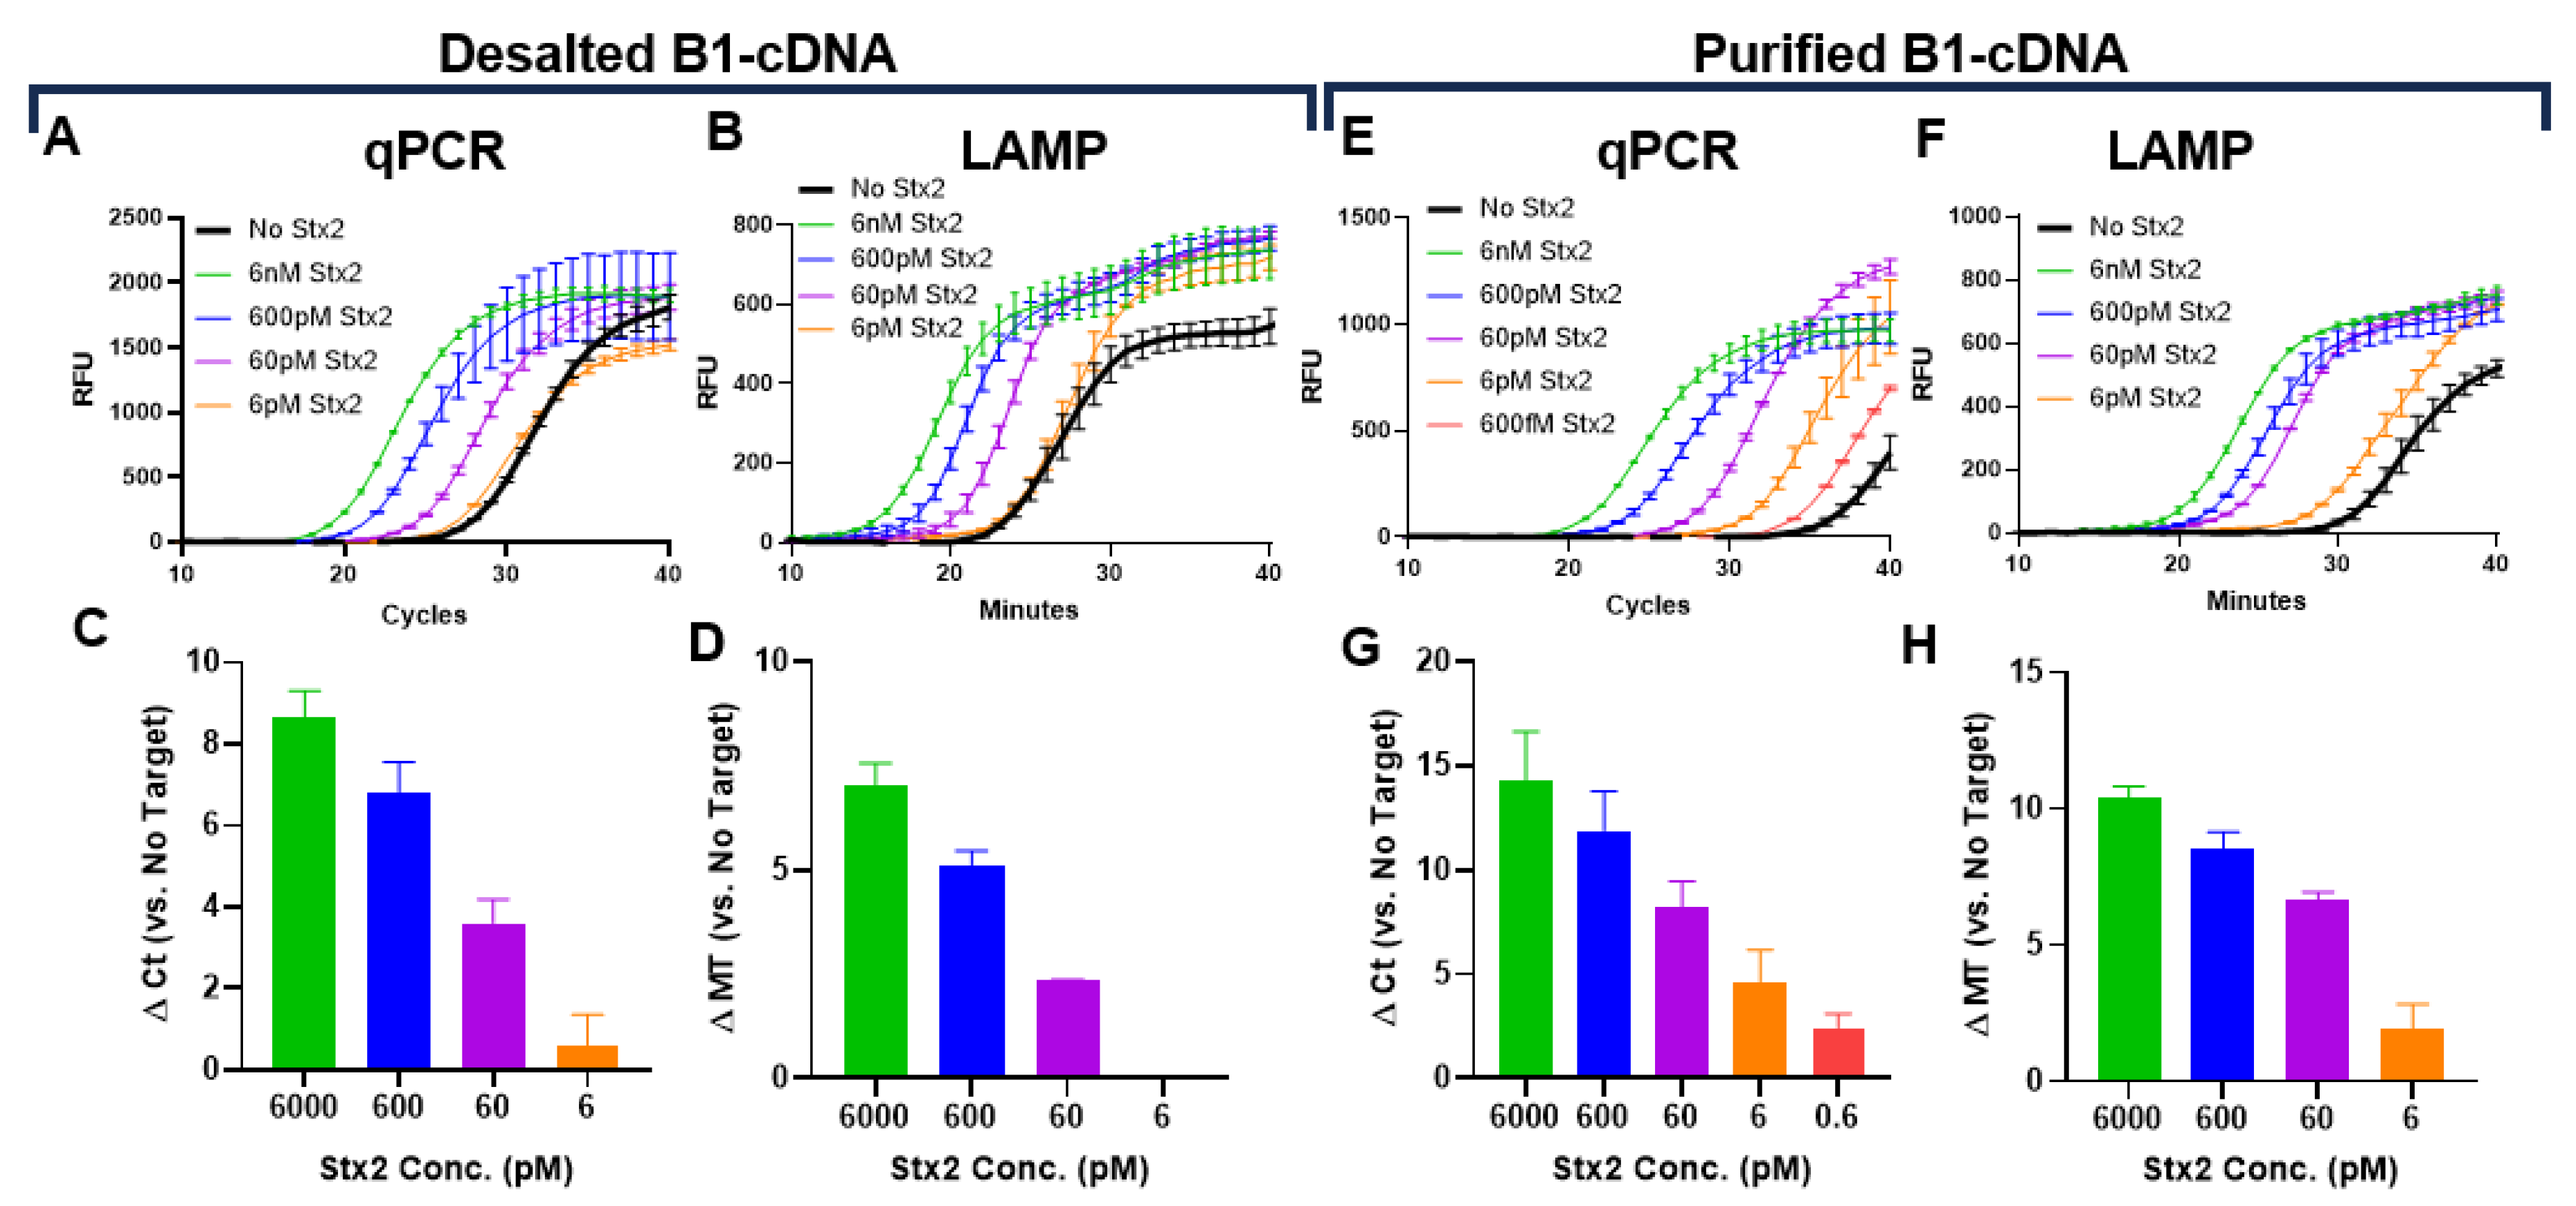
Figure 3.
Determination of Stx2 LoD in pool (A-D) or lettuce (E-H). Kinetic curves (A, E) and calculated ∆ Ct (C, G) of qPCR reactions. Ct and Mt were determined using regression. Kinetic curves (B, F) and calculated ∆ Mt (D, H) of LAMP reactions. The kinetic curves from one representative experiment from at least 2 independent experiments were presented. The ∆ Ct or ∆ Mt are the average from 2 independent experiments with error bars representing SD.
Disclaimer/Publisher’s Note: The statements, opinions and data contained in all publications are solely those of the individual author(s) and contributor(s) and not of MDPI and/or the editor(s). MDPI and/or the editor(s) disclaim responsibility for any injury to people or property resulting from any ideas, methods, instructions or products referred to in the content. |
© 2025 by the authors. Licensee MDPI, Basel, Switzerland. This article is an open access article distributed under the terms and conditions of the Creative Commons Attribution (CC BY) license (http://creativecommons.org/licenses/by/4.0/).
Copyright: This open access article is published under a Creative Commons CC BY 4.0 license, which permit the free download, distribution, and reuse, provided that the author and preprint are cited in any reuse.


