Submitted:
13 October 2025
Posted:
14 October 2025
You are already at the latest version
Abstract
This paper examines the dynamic interactions between national stock indexes of global significance and gold, a prominent safe haven asset, during the two most recent crises (the conflict between Russia and Ukraine and COVID-19). Daily data and the sophisticated Time-Varying Parameter Vector Autoregressive (TVP-VAR) approach are used to estimate how the dynamic relationship changes throughout the course of the crisis. According to research, gold is a net recipient of causal impacts from stock indices; this is particularly evident in the early phases of COVID-19 but considerably diminishes as the conflict progresses. Furthermore, it is discovered that the US and European stock indexes have a far greater impact on gold than do the Asian indices. They have an impact on the Nikkei225 index as well. In general, gold works well as a crisis buffer, and this is especially evident in the context of COVID-19. In a paradigm that compares crises, our findings offer fresh perspectives on the dynamic interplay between safe havens and conventional indexes. These results give investors and politicians a compass to help them make better decisions.
Keywords:
finance
; precious metals
; stock markets
; portfolio management
; TVP‐VAR
; crises
1. Introduction
The recent series of consequent crises have brought to the forefront the emergence of inflationary pressures that have urged people to look for alternative forms of investments. The Covid-19 health crisis and the Russia-Ukraine war have made investors reconsider the synthesis of their portfolios and question whether they should keep relying on traditional fiat currencies (like the US dollar and the Euro) and stock indices (like the Dow Jones) or prefer to return to safe assets like gold in order to protect themselves from inflationary pressures (Goodell et al., 2023; Rubbaniy et al., 2024). Gold is considered to be a safe haven against market downturns in times of crises and becomes increasingly popular when the remaining investments fail to be profitable. This implies that it renders a settler of financial markets in times of distress (Ruano and Barros, 2022; Ryan et al., 2024). Its ability to preserve and even increase its market value when other traditional investments devaluate make it the driving force of alterations in investor portfolios.
These considerations have given a significant boost to research about whether gold could function as a shield against inflation during health crises and geopolitical crises. Moreover, emphasis has been given on the optimal allocation of stock portfolios and the level by which precious metals should be included in these portfolios to ensure safety and prevent from poor performance and losses. Inspired by the need to provide answers to these questions of major importance, this study undertakes the task to investigate the dynamic connection among the most known precious metal (gold) and the most important national stock indices in a global level. This will shed light on whether the former influences the latter or the reverse holds and the extent by which this changes as time passes. This could provide a better understanding of investors’ decision-making when the assets they usually prefer suffer from value loss and urge investors to change preferences. Thereby, this study has implications for optimal asset selection. It provides a compass to interested investors so as to better allocate funds in portfolios consisting of traditional investments.
The present study is innovative by a considerable number of aspects. First of all, we employ the advanced Time-Varying Parameter Vector Autoregressive (TVP-VAR) methodology based on Ha et al. (2023) and Sevillano et al. (2024). This enables to provide the dynamic interplay among gold and the major stock indices both in the Covid-19 and the Russia-Ukraine war and examine how this evolves in the advent of time. This means that a better reflection of the interconnectedness in international financial markets during crises is obtained. Secondly, this paper is innovative as it examines international investment assets of major importance and looks into how pessimism in global currency markets (depreciation due to inflation) leads to re-sharing of the spheres of influence of alternative forms of conventional investments. Thirdly, this paper provides insights about whether gold –which is considered to be the safest haven- functions as a shield against fluctuations during crises. Finally, the examination in two distinct crisis periods makes feasible to conduct comparisons about the effectiveness of gold as a safe haven and the dynamic linkages between conventional assets in alternative types of crises. This provides a clearer view on influential factors of decision making and how these alter depending on whether the crisis is rooted in health issues or geopolitical matters. Whle previous bibliography mainly focuses on commodities or stock indices separately, this study is the first one to investigate how well-established financial assets (precious metals as well as stock indices) behave and are used for constructing optimal portfolios in times of crises. The dynamic connectedness framework employed provides a clear perspective on how investors should allocate funds in order to achieve the best combination or returns and volatility. The portfolio implications derived differ depending on the type of crises. This offers a compass for better decision making by investors in alternative types of crises.
Econometric findings provide evidence that gold acts as a receiver of spillover effects from shocks that take place in major national stock markets. It is obvious that these impacts are stronger during the Covid-19 health crisis than the Russia-Ukraine geopolitical crisis. More specifically, the early phase of the Covid-19 (in 2020) is clearly the period when stock indices affect the gold market. This implies that the early stages of a crisis make investors more hesitant to invest in conventional stock markets due to the great risk of losses. This motivates them to prefer gold rather than conventional stock indices. These impacts are weaker in more mature phases of the crises despite the inflation becoming more persistent as each crisis evolves. Notably, the US stock index and the major European stock indices are much more influential on gold than Asian stock indices and this implies their larger systemic importance in international markets. Apart from this, the US and European indices present considerable effects on the Japanese stock index and this reveals that advanced economies’ stock indices are linked among them despite their large geographical distance.
The remainder of this study is structured as follows. Section 2 provides the literature review on gold and its safe haven abilities. Furthermore, it presents the main research on major stock markets and their relation with alternative investments that shape their role in the global financial markets. Section 3 presents the data and methodology adopted. Furthermore, Section 4 offers the econometric results and the analysis of economic implications. Finally, Section 5 concludes and suggests paths for further research.
2. Literature Review
The examination of the gold markets with the remaining financial markets has attracted a respectable and still increasing bulk of academic research. The same holds regarding the investigation of how stock markets are related with other financial markets. The first stream of literature linked with our investigation focuses on the relationship between gold and stock markets.
In this field of research, Beckmann et al. (2015) support that gold acts as a safe haven as well as a hedge for stocks and these abilities depend on the stock markets considered. In a similar vein, Salisu et al. (2021) argue that gold acts as a safe haven in normal times and less effectively during the Covid-19. It is found to be a superior safe haven than other precious metals as well as from US stocks. Along with the findings of Beckmann et al. (2015) and Salisu et al. (2021), Ryan et al. (2024) document that gold acts as a safe haven against the S&P500 index during market crises. The safe haven character of gold is more powerful when crises in stock markets are caused by macroeconomic news rather than by other factors. Besides this, Shazhad et al. (2020) support that gold functions as a safe haven against the stock indices of advanced economies and behaves as a significantly superior hedge against stock markets than Bitcoin. Gold is revealed to be more efficient in bear markets and also offers diversification benefits.
Moreover, Singhal et al. (2019) provide evidence that higher international gold prices lead to higher stock prices in Mexico while higher international oil prices decrease Mexican stock prices. On the other hand, gold prices are not influential on exchange rates. Further corroborating findings about the importance of gold on stock markets, Triki and Maatoug (2021) highlight the benefits from using gold as hedging and diversifying instrument for investors and provide evidence that gold is less connected with the US stock markets in normal times with no war episodes. The relation though gets stronger when geopolitical risk is elevated. So gold is a good diversifier and safe haven in war times. Not far from this, Drake (2022) provides evidence of gold performance being negatively correlated with stock performance during the Global Financial Crisis and the Covid-19. Nevertheless, gold functions as a safe haven in terms of turmoil in stock markets and when interest rates are negative.
Additionally, Arfaoui and Rejeb (2017) show that gold is influenced by alterations in oil, stock markets and the US dollar and largely affects the latter. Benlagha and El Omari (2022) support that stock indices transmit shocks to the gold market during the pandemic while oil generates shocks to gold. These linkages are stronger in stressed periods than in normal conditions.
Partly abiding by earlier findings, Akhturuzzaman et al (2021) reveal that gold functions as a safe haven for stock markets in the early phase of the Covid-19 but loses its safe haven capacities in the middle phase of the pandemic. Gold acts beneficially for stock portfolio performance in the early Covid-19 but its beneficial impact fades out in the middle phase. In a similar mentality, Chkili (2016) demonstrate that gold presents both positive and negative correlations with stock markets. More specifically, gold serves as a safe haven during major financial crises as the low to negative correlations exhibit. This indicates that it can act as a safe haven against extreme market volatility. Moreover, gold improves the risk-return trade-off when included in stock portfolios.
On the other hand, there is literature supporting weak or no capacities of gold to act as a hedge or a safe haven. Shazhad et al. (2019) provide evidence that gold does not function as a safe haven against the stock and bond markets. In terms of higher precision, gold is less sensitive to bond market shocks while more sensitive to stock market shocks. Both bond and stock markets exert higher impacts on gold in bear market conditions. Similarly, Choudhry et al. (2015) reveal that gold fails to act as a safe haven during the Global Financial Crisis because it is closely connected with stock markets. It is argued though that gold could act as hedge against stock market fluctuations in normal conditions.
Another relevant strand of literature is about the connection of stock markets with alternative major investments like major international currencies, oil or cryptocurrencies. Rai and Garg (2022) reveal that the Covid-19 crisis has led to negative linkages between the stock prices and the exchange rates in developing (BRIICS) economies. This happens because risk is transmitted more intensely during the pandemic.
By focusing on the stock-oil relationship, Umar et al. (2021) argue that in general there is modest connection between oil shocks and stock markets and this is greatly enhanced during the Covid-19 crisis. Furthermore, Behera and Path (2024) argue that shocks stemming from stock markets in oil importing countries of major importance are significantly more influential than shocks from oil-importing countries. Thereby, the connection between stock markets and oil markets is important for stability in financial markets.
When investigating the stock-cryptocurrency nexus, Nguyen (2022) reveals that the US stock market performance is influential on Bitcoin performance not only during the Covid-19 but also generally in crisis periods. Moreover, Ha (2022) argues that the Asian stock indices act as consistent net receivers of spillover effects from major cryptocurrencies. The impacts of the cryptocurrency markets on the stock markets are stronger in the Covid-19 period and especially at the early stage of the pandemic. In a similar mentality, Ibrahim et al. (2024) support that stock markets are found to be threatened by the large fluctuations in Bitcoin markets and this connection is long-lasting. Short-term contagion from Bitcoin to Asian stock markets is significant in the Covid-19 period.
3. Data and Methodology
This study investigates the dynamic connection among gold and major national stock indices by using daily closing prices spanning i) the Covid-19 and ii) the Russia-Ukraine war. To be more precise, data from 2 January 2020 to 23 February 2022 (Covid-19) and from 24 February 2022 to 14 May 2025 (Russia-Ukraine war) are employed. Gold market prices are used to represent the markets of this precious metal. Moreover, market values of the Dow Jones Industrial Average (United States), DAX30 (Germany), CAC40 (France), FTSE100 (United Kingdom), Nikkei225 (Japan) and ChinaA50 (China) stock indices are adopted to stand for major national stock indices. All market values are expressed in US dollars. All data are downloaded from the Yahoo Finance database and are transformed into returns as to avoid heteroskedasticity problems.The AIC lag selection criterion is adopted, where and represents the number of parameters and is the log-likelihood.
In Figure 1, it is displayed how market values evolve along with time. It is noticeable that gold is the only asset that presents persistent tendencies to increase. Furthermore, the US and the European stock indices also increase in general and the same holds for the Japanese index. Nevertheless, all these indices begin to decrease at the very end of the war period examined. On the other hand, the Chinese stock index shows decreasing tendencies during the Covid-19 but partly remains stable during the war.
Moreover, Table 1a,b present the descriptive statistics of the variables examined i) in the Covid-19 and ii) the Russia-Ukraine war, respectively. Notably, gold (0.044) is the best performing and the least volatile (1.081) asset during the pandemic. Dow Jones (0.039) is the best performing stock index and the most volatile (2.915) in the same period. In contrast, FTSE100 (0.008) is the worst performing asset during the Covid-19. When it comes to the war period, gold (0.069) remains the most profitable investment and Nikkei225 (0.057) follows and is also the riskiest (1.927) one. Remarkably, ChinaA50 is the least profitable (0.00) asset and FTSE100 (0.677) and gold (0.940) are the safest assets. The variables present non-normality as shown by the Skewness, Excess Kurtosis and Jarque-Bera tests. The ERS tests shows that there is no unit root problem.
When it comes to the methodology adopted, the Time Varying Parameter –Vector Autoregressive dynamic connectedness approach is employed based on Zhang and Hamori (2021), Ha et al. (2023) and Sevillano et al. (2024) in order to examine how the dynamic relation between variables evolves over time. This model is preferable from alternative models that just provide an average of the impact that one variable exerts on the other.
The TVP-VAR model is expressed as:
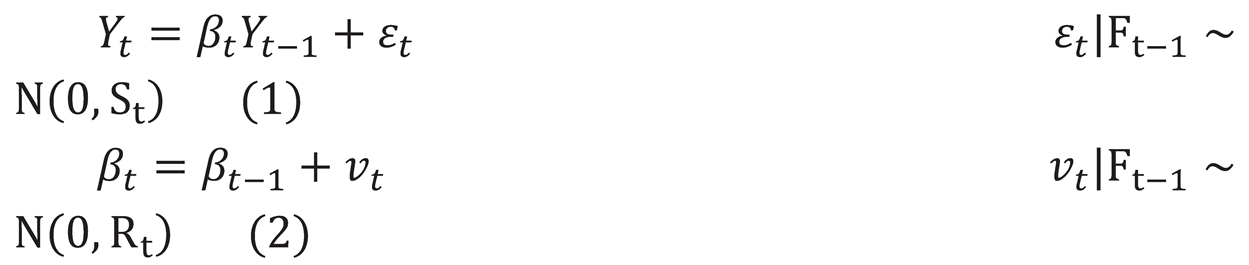
where stands for a vector of conditional volatilities with dimensions, is a lagged conditional vector with dimensions, is a time-varying coefficient matrix with dimensions and is a new disturbance vector with dimensions with a time varying variance-covariance matrix with dimensions. The parameters rely on their lagged values and on an error matrix with dimensions with a variance-covariance matrix with dimensions.
This type of connectedness demonstrates how a shock in a specific variable has spillover effects on other variable(s). In case the variable exerts influence on the group of the remaining variables, this is called the total directional connectedness to others and is defined as:
4. Empirical Outcomes
Econometric estimations by the TVP-VAR model have brought to the surface a number of interesting findings. Table 2a,b present the results about the averaged dynamic connectedness among gold and major national stock indices in i) the Covid-19 and ii) the Russia-Ukraine war, correspondingly. Furthermore, Figure 2a,b demonstrate the outcomes about the net pairwise directional connectedness among gold and major national indices in i) the Covid-19 and ii) the Russia-Ukraine war, respectively.
Table 2a reveals that gold is just weakly connected with the national stock indices of advanced and developing economies during the pandemic. This can be seen by the very low levels of spillover effects it exerts on Dow Jones (1.21), DAX30 (0.95), CAC40 (0.60), FTSE100 (0.61), Nikkei225 (1.41) and ChinaA50 (1.42). Besides this, there are low levels of spillover impacts that gold receives from stock indices. More specifically, it receives weak effects from Dow Jones (2.47), DAX30 (3.56), CAC40 (3.67), FTSE100 (2.23), Nikkei225 (1.01), ChinaA50 (1.65). Notably, gold receives larger total effects (14.48) from stock indices than the total impacts it exerts (6.20) towards these stock indices. So the result is that gold works as a net receiver (-8.29) of spillover effects. This indicates that it can be used to protect investors from risk that comes from national stock markets during the Covid-19.
It should be mentioned that national stock indices are more tightly linked with each other than with gold. In the case of the Dow Jones index, this exerts modest effects on DAX30 (18.03), CAC40 (17.97) and FTSE100 (15.91) and weaker effects on the Asian indices like Nikkei225 (10.00) and ChinaA50 (3.41). Both the Asian indices, which means the Nikkei225 (-10.73) and the ChinaA50 (-5.20) act as net receivers of spillover effects. Moreover, the total connectedness in this system is equal to 57.09 and this indicates modest to strong connections among the gold and stock markets.
In the case of averaged dynamic connectedness during the Russia-Ukraine war (Table 2b), it can be seen that gold (-4.90) remains a net receiver of effects and keeps having very weak relation with the national stock indices. Dow Jones (19.08) is the strongest net source of effects and the European stock indices are also net sources of impacts just as is the case also in the Covid-19 period. Notably, the Asian stock indices remain net receivers of effects during the war and even more intensely than in the Covid-19 period. Moreover, the total connectedness in this system becomes lower (46.51) than during the Covid-19.
By focusing on results about the Covid-19 based on the net pairwise directional connectedness methodology, it is obvious that the Dow Jones, DAX30, CAC40 and FTSE100 indices exert significant spillover effects on the gold markets. These effects are more pronounced in the later phase of the pandemic in the case of the Dow Jones but clearly in the initial phase of the Covid-19 in the cases of the European stock indices. This implies that gold could act as a significant hedge against fluctuations from major US and European stock indices in the pandemic. It should also be noted though that gold is very weakly related with the Nikkei225 and the ChinaA50 indices. This indicates that the Asian stock indices have almost no connection with gold in crises so gold cannot act as a hedge against Asian stock indices. Remarkably though, the almost non-existing relation between gold and the Asian indices permits to gold to function as a good diversifier against risk in these markets. Moreover, by focusing on the dynamic interplay in pairs of stock indices, it is revealed that all the indices of advanced US and European countries have a non-negligible effect on the Japanese Nikkei225 index. This makes the Dow Jones, DAX30, CAC40 and FTSE100 partly effective in acting as hedges against risk in Asian markets. Moreover, it is worth mentioning that there is a small to modest connection between the two Asian indices considered.
Moreover, examination among gold and major national stock indices takes place about the Russia-Ukraine war period, which has been characterized by even higher inflation than the Covid-19 period. Findings demonstrate that the connection in pairs of gold and each of the national stock indices has been very weak. This supports that gold could act as a diversifier against each of these stocks but not as a hedge against the risks coming from these national indices. Notably, gold could function more efficiently as a hedge against the Dow Jones index rather than the other indices. When it comes to the relation in pairs of national stock indices, it is found that the Dow Jones has the highest effect on all the other indices and this impact becomes stronger at the later phases of the war. The Dow Jones has the largest effect on the Japanese Nikkei 225 index. Apart from this, it is worth noticing that not only the US index but also the European indices present a non-negligible connection with the Nikkei 225 but they have very weak connection with the Chinese index. This is in accordance with the findings at the Covid-19 period where the major US and European stock indices were also more linked with the Japanese rather than the Chinese stock market. Notably, the Asian stock markets are less related between them in the war period than in the Covid-19 period.
Overall, it can be argued that gold serves as a hedge against risks from major national stock indices during the pandemic while mainly works as a diversifier in portfolios with these indices in war times. This implies that gold functions as a shield from fluctuations in major national stock indices in health crises but fails to work so efficiently for protection in war times when inflation is too high. In general, gold is more efficient for protecting from risk that comes from US and European stock indices rather than from Asian stock indices. Despite the weakening of its protective role in war times, gold still remains a useful instrument for investors that do not like risky stock indices in times of crises. Gold functioning for the protection of investors during crises is in accordance with previous studies like Beckmann et al. (2015) and Salisu et al. (2021) and Ryan et al. (2024).
Apart from this, the linkages between national stock indices are found to be modest. Notably, the US and the European stock indices present the strongest connection in pairs with the Japanese Nikkei 225 index but weaker connection between them or with the ChinaA50 index. The Dow Jones, DAX30, CAC40 and FTSE100 are partly effective in acting as hedges against risk in Asian markets. They are found to become more connected with the Nikkei 225 index in war periods. This is in accordance with the findings of Panda et al. (2021) that claim for strong linkages among stock markets and Gong et al. (2019) that support the connection being higher during crises. These findings provide useful information for investors to conduct better portfolio management and succeed optimal assets allocation during crises.
In general, the Covid-19 crisis has been found to be quite different from the Russia-Ukraine war crisis. Gold turns from an efficient hedge in the Covid-19 to just a diversifier in the war period while stock indices present tighter connection between them in war. This indicates that there are changes in the financial instruments used for investors to protect themselves from fluctuations during crises. Gold and major national indices of US and European economies play the central role for reducing the risk that appears during crises.
5. Conclusions
This paper investigates the dynamic relation among gold and major national stock indices during the Covid-19 and the Russia-Ukraine war periods. This study intends to cast light on the suitable financial instruments for protection against fluctuations during crises. Thereby, the examination covers each of the two crises by employing daily data and the innovative TVP-VAR methodology to estimate the net pairwise directional connectedness and show how these dynamic relations evolve as time passes. This informs about the role of gold and major national stock indices (Dow Jones, DAX30, CAC40, FTSE100, Nikkei225 and ChinaA50) as hedges or diversifiers against fluctuations that appear in financial markets during crises.
Findings reveal that gold serves as a hedge against risks from major national stock indices during the pandemic but mostly functions as a diversifier in portfolios with these stock indices during the war. So gold works to protect from fluctuations in major stock markets –mainly from US and European stock indices- in health crises but is less efficient but still useful in war periods with high inflation. As concerns the connection between national stock indices, it is found not to be strong. The US and the European stock indices are mostly connected with the Japanese index –and this relation increases in war times- and weakly linked between them and with the Chinese index. This indicates that these major indices are partly suitable means for protection from risk in Asian markets. These findings are crucial for investors to achieve optimal asset allocation and have significant implications for portfolio management during crises. The level of dynamic interconnectedness among assets enables investors to make better decisions about how to optimally allocate funds so as to minimize risk and maximize returns.
This paper makes easier for policymakers and investors to understand which the appropriate financial means for protecting investors during crises that come from the pandemic or geopolitical reasons. Findings from this study work as a compass for casting light on whether gold or major national stock indices could function as shields against risk in financial markets in periods of crises and how this changes in different types of crises. Potential avenues for further research could be the examination of how other popular forms of investments like precious metals or cryptocurrencies could work for improving the performance of investors in crises. Comparison with future crises would also be very interesting.
References
- Akhtaruzzaman, M., Boubaker, S., Lucey, B. M., & Sensoy, A. (2021). Is gold a hedge or a safe-haven asset in the COVID–19 crisis?. Economic Modelling, 102, 105588.
- Arfaoui, M., & Ben Rejeb, A. (2017). Oil, gold, US dollar and stock market interdependencies: a global analytical insight. European Journal of Management and Business Economics, 26(3), 278-293.
- Beckmann, J., Berger, T., & Czudaj, R. (2015). Does gold act as a hedge or a safe haven for stocks? A smooth transition approach. Economic Modelling, 48, 16-24.
- Behera, C., & Rath, B. N. (2024). The interconnectedness between crude oil prices and stock returns in G20 countries. Resources Policy, 91, 104950.
- Benlagha, N., & El Omari, S. (2022). Connectedness of stock markets with gold and oil: New evidence from COVID-19 pandemic. Finance Research Letters, 46, 102373.
- Chkili, W. (2016). Dynamic correlations and hedging effectiveness between gold and stock markets: Evidence for BRICS countries. Research in International Business and Finance, 38, 22-34.
- Choudhry, T., Hassan, S. S., & Shabi, S. (2015). Relationship between gold and stock markets during the global financial crisis: Evidence from nonlinear causality tests. International Review of Financial Analysis, 41, 247-256.
- Drake, P. P. (2022). The gold-stock market relationship during COVID-19. Finance research letters, 44, 102111.
- Gong, C., Tang, P., & Wang, Y. (2019). Measuring the network connectedness of global stock markets. Physica A: Statistical Mechanics and its Applications, 535, 122351.
- Goodell, J. W., Yadav, M. P., Ruan, J., Abedin, M. Z., & Malhotra, N. (2023). Traditional assets, digital assets and renewable energy: Investigating connectedness during COVID-19 and the Russia-Ukraine war. Finance Research Letters, 58, 104323.
- Ha, L. T. (2023). Interlinkages of cryptocurrency and stock markets during COVID-19 pandemic by applying a TVP-VAR extended joint connected approach. Journal of Economic Studies, 50(3), 407-428.
- Ibrahim, B. A., Elamer, A. A., Alasker, T. H., Mohamed, M. A., & Abdou, H. A. (2024). Volatility contagion between cryptocurrencies, gold and stock markets pre-and-during COVID-19: evidence using DCC-GARCH and cascade-correlation network. Financial Innovation, 10(1), 1-28.
- Nguyen, K. Q. (2022). The correlation between the stock market and Bitcoin during COVID-19 and other uncertainty periods. Finance research letters, 46, 102284.
- Panda, P., Vasudevan, S., & Panda, B. (2021). Dynamic connectedness among BRICS and major countries stock markets. Journal of Public Affairs, 21(3), e2265.
- Rai, K., & Garg, B. (2022). Dynamic correlations and volatility spillovers between stock price and exchange rate in BRIICS economies: Evidence from the COVID-19 outbreak period. Applied Economics Letters, 29(8), 738-745.
- Ruano, F., & Barros, V. (2022). Commodities and portfolio diversification: Myth or fact?. The Quarterly Review of Economics and Finance, 86, 281-295.
- Rubbaniy, G., Khalid, A. A., Syriopoulos, K., & Polyzos, E. (2024). Dynamic returns connectedness: Portfolio hedging implications during the COVID-19 pandemic and the Russia–Ukraine war. Journal of Futures Markets, 44(10), 1613-1639.
- Ryan, M., Corbet, S., & Oxley, L. (2024). Is gold always a safe haven?. Finance Research Letters, 64, 105438.
- Salisu, A. A., Raheem, I. D., & Vo, X. V. (2021). Assessing the safe haven property of the gold market during COVID-19 pandemic. International Review of Financial Analysis, 74, 101666.
- Sevillano, M. C., Jareño, F., López, R., & Esparcia, C. (2024). Connectedness between oil price shocks and US sector returns: Evidence from TVP-VAR and wavelet decomposition. Energy Economics, 131, 107398.
- Shahzad, S. J. H., Bouri, E., Roubaud, D., & Kristoufek, L. (2020). Safe haven, hedge and diversification for G7 stock markets: Gold versus bitcoin. Economic Modelling, 87, 212-224.
- Shahzad, S. J. H., Raza, N., Roubaud, D., Hernandez, J. A., & Bekiros, S. (2019). Gold as safe haven for G-7 stocks and bonds: a revisit. Journal of Quantitative Economics, 17(4), 885-912.
- Singhal, S., Choudhary, S., & Biswal, P. C. (2019). Return and volatility linkages among International crude oil price, gold price, exchange rate and stock markets: Evidence from Mexico. Resources policy, 60, 255-261.
- Triki, M. B., & Maatoug, A. B. (2021). The GOLD market as a safe haven against the stock market uncertainty: Evidence from geopolitical risk. Resources Policy, 70, 101872.
- Umar, Z., Trabelsi, N., & Zaremba, A. (2021). Oil shocks and equity markets: The case of GCC and BRICS economies. Energy Economics, 96, 105155.
- Zhang, Y., & Hamori, S. (2021). Do news sentiment and the economic uncertainty caused by public health events impact macroeconomic indicators? Evidence from a TVP-VAR decomposition approach. The Quarterly Review of Economics and Finance, 82, 145-162.
Figure 1.
Market values of gold and major stock indices during the Covid-19 and the Russia-Ukraine war.
Figure 1.
Market values of gold and major stock indices during the Covid-19 and the Russia-Ukraine war.
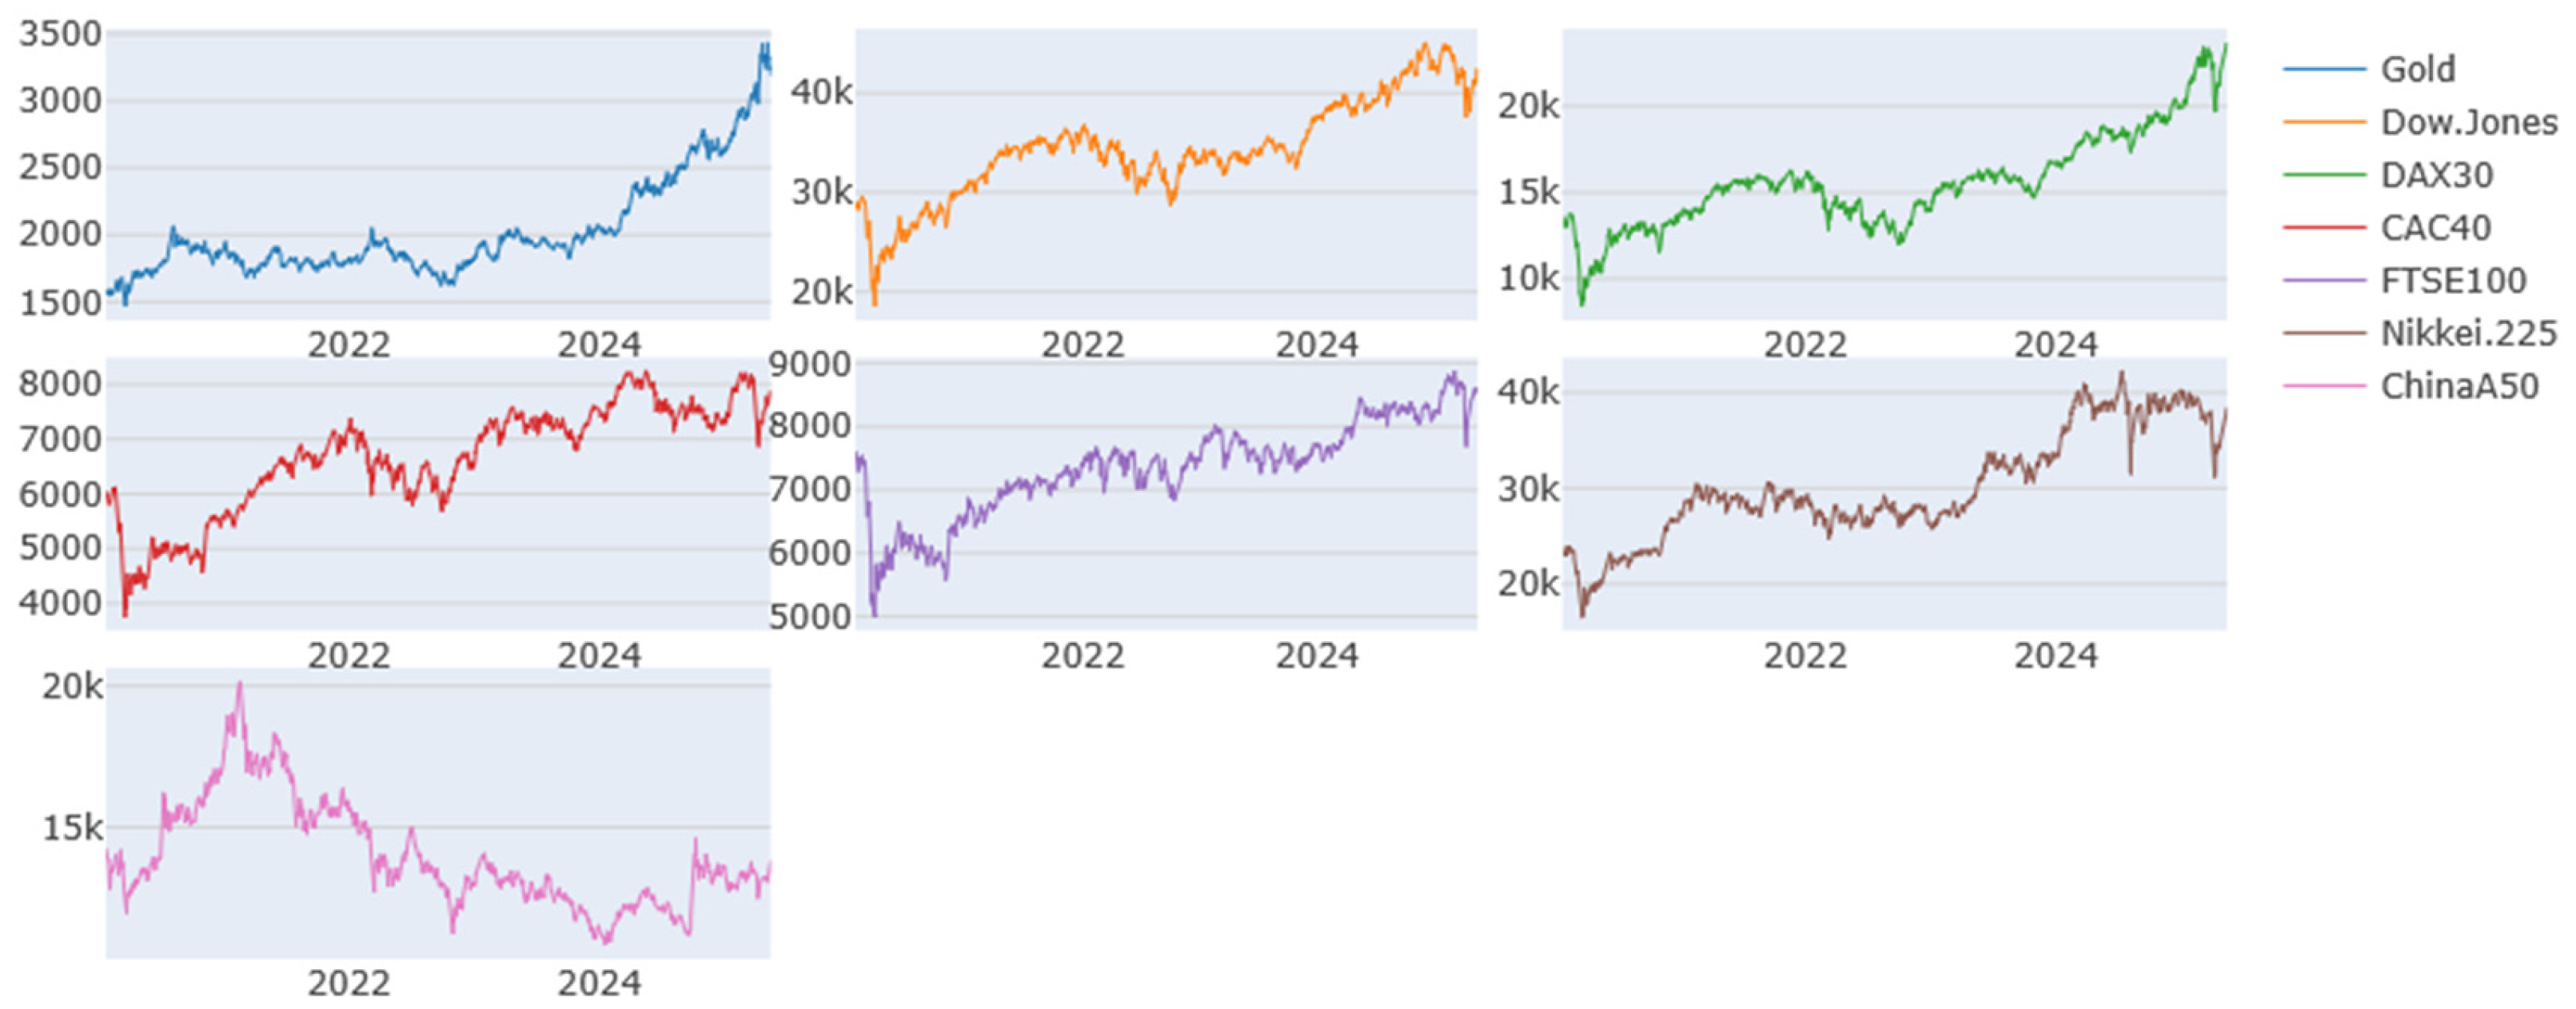
Figure 2.
(a). Net pairwise directional connectedness during the Covid-19. (b). Net pairwise directional connectedness during the Russia-Ukraine war.
Figure 2.
(a). Net pairwise directional connectedness during the Covid-19. (b). Net pairwise directional connectedness during the Russia-Ukraine war.
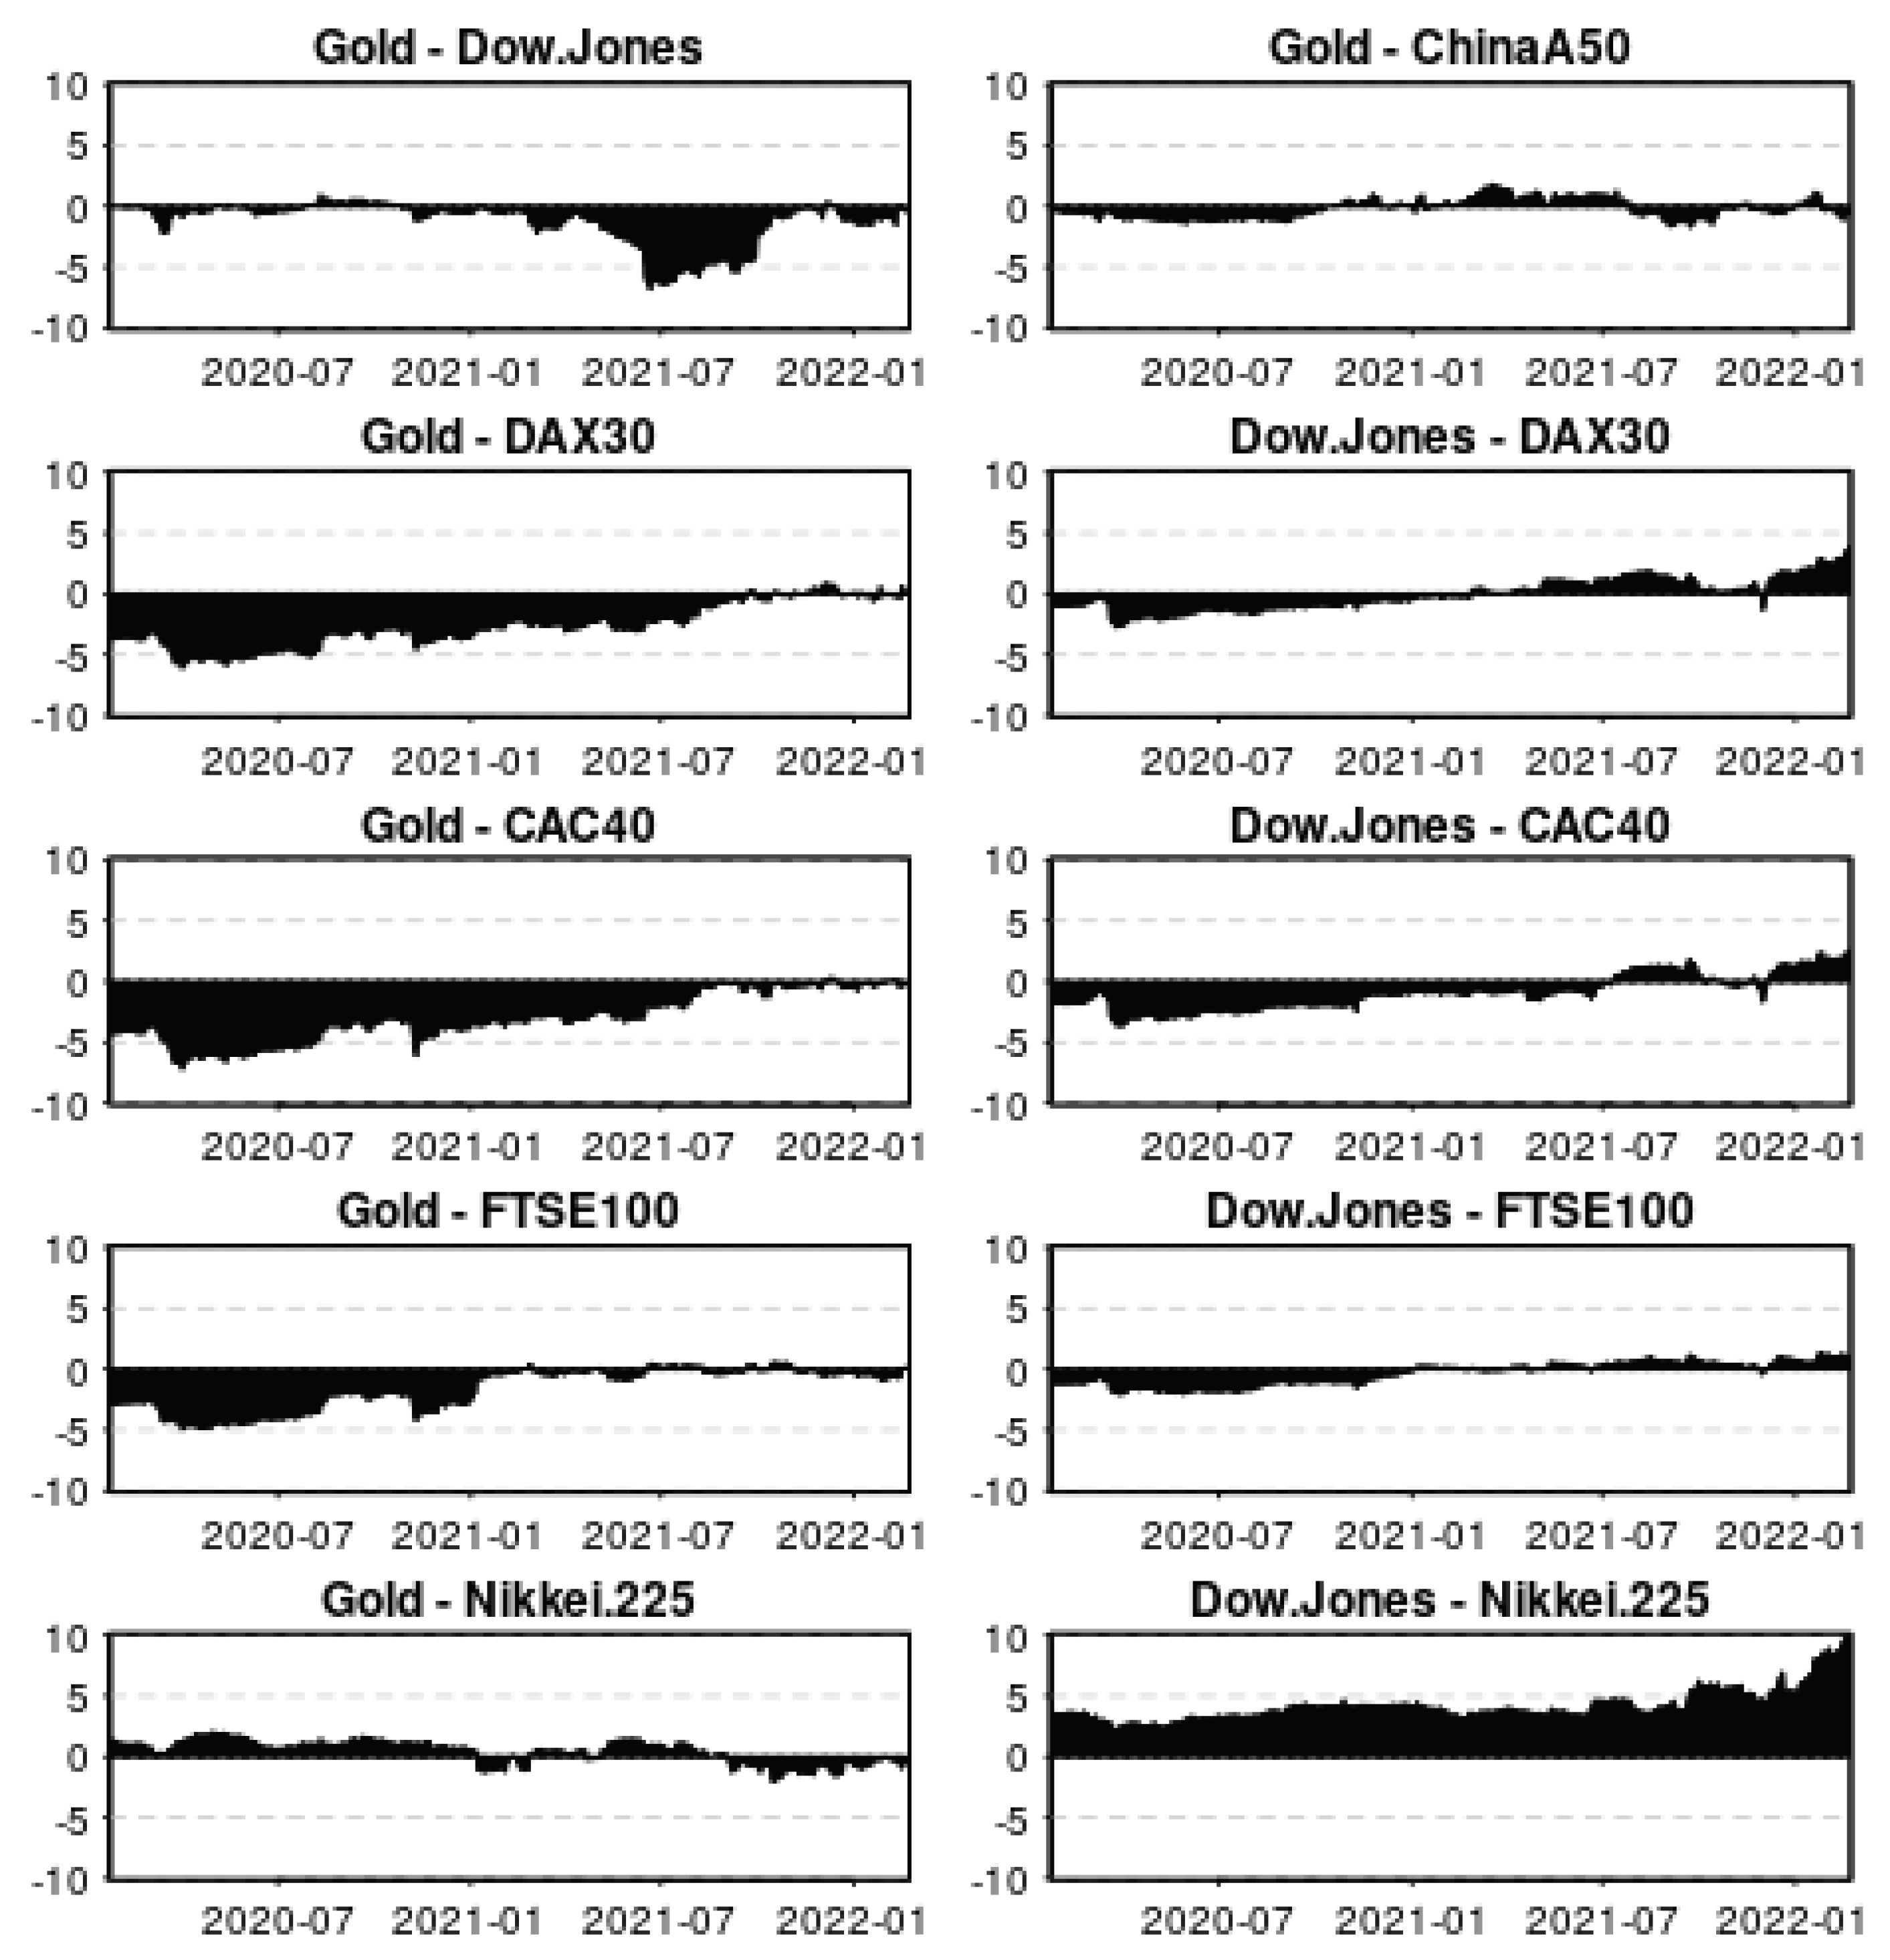
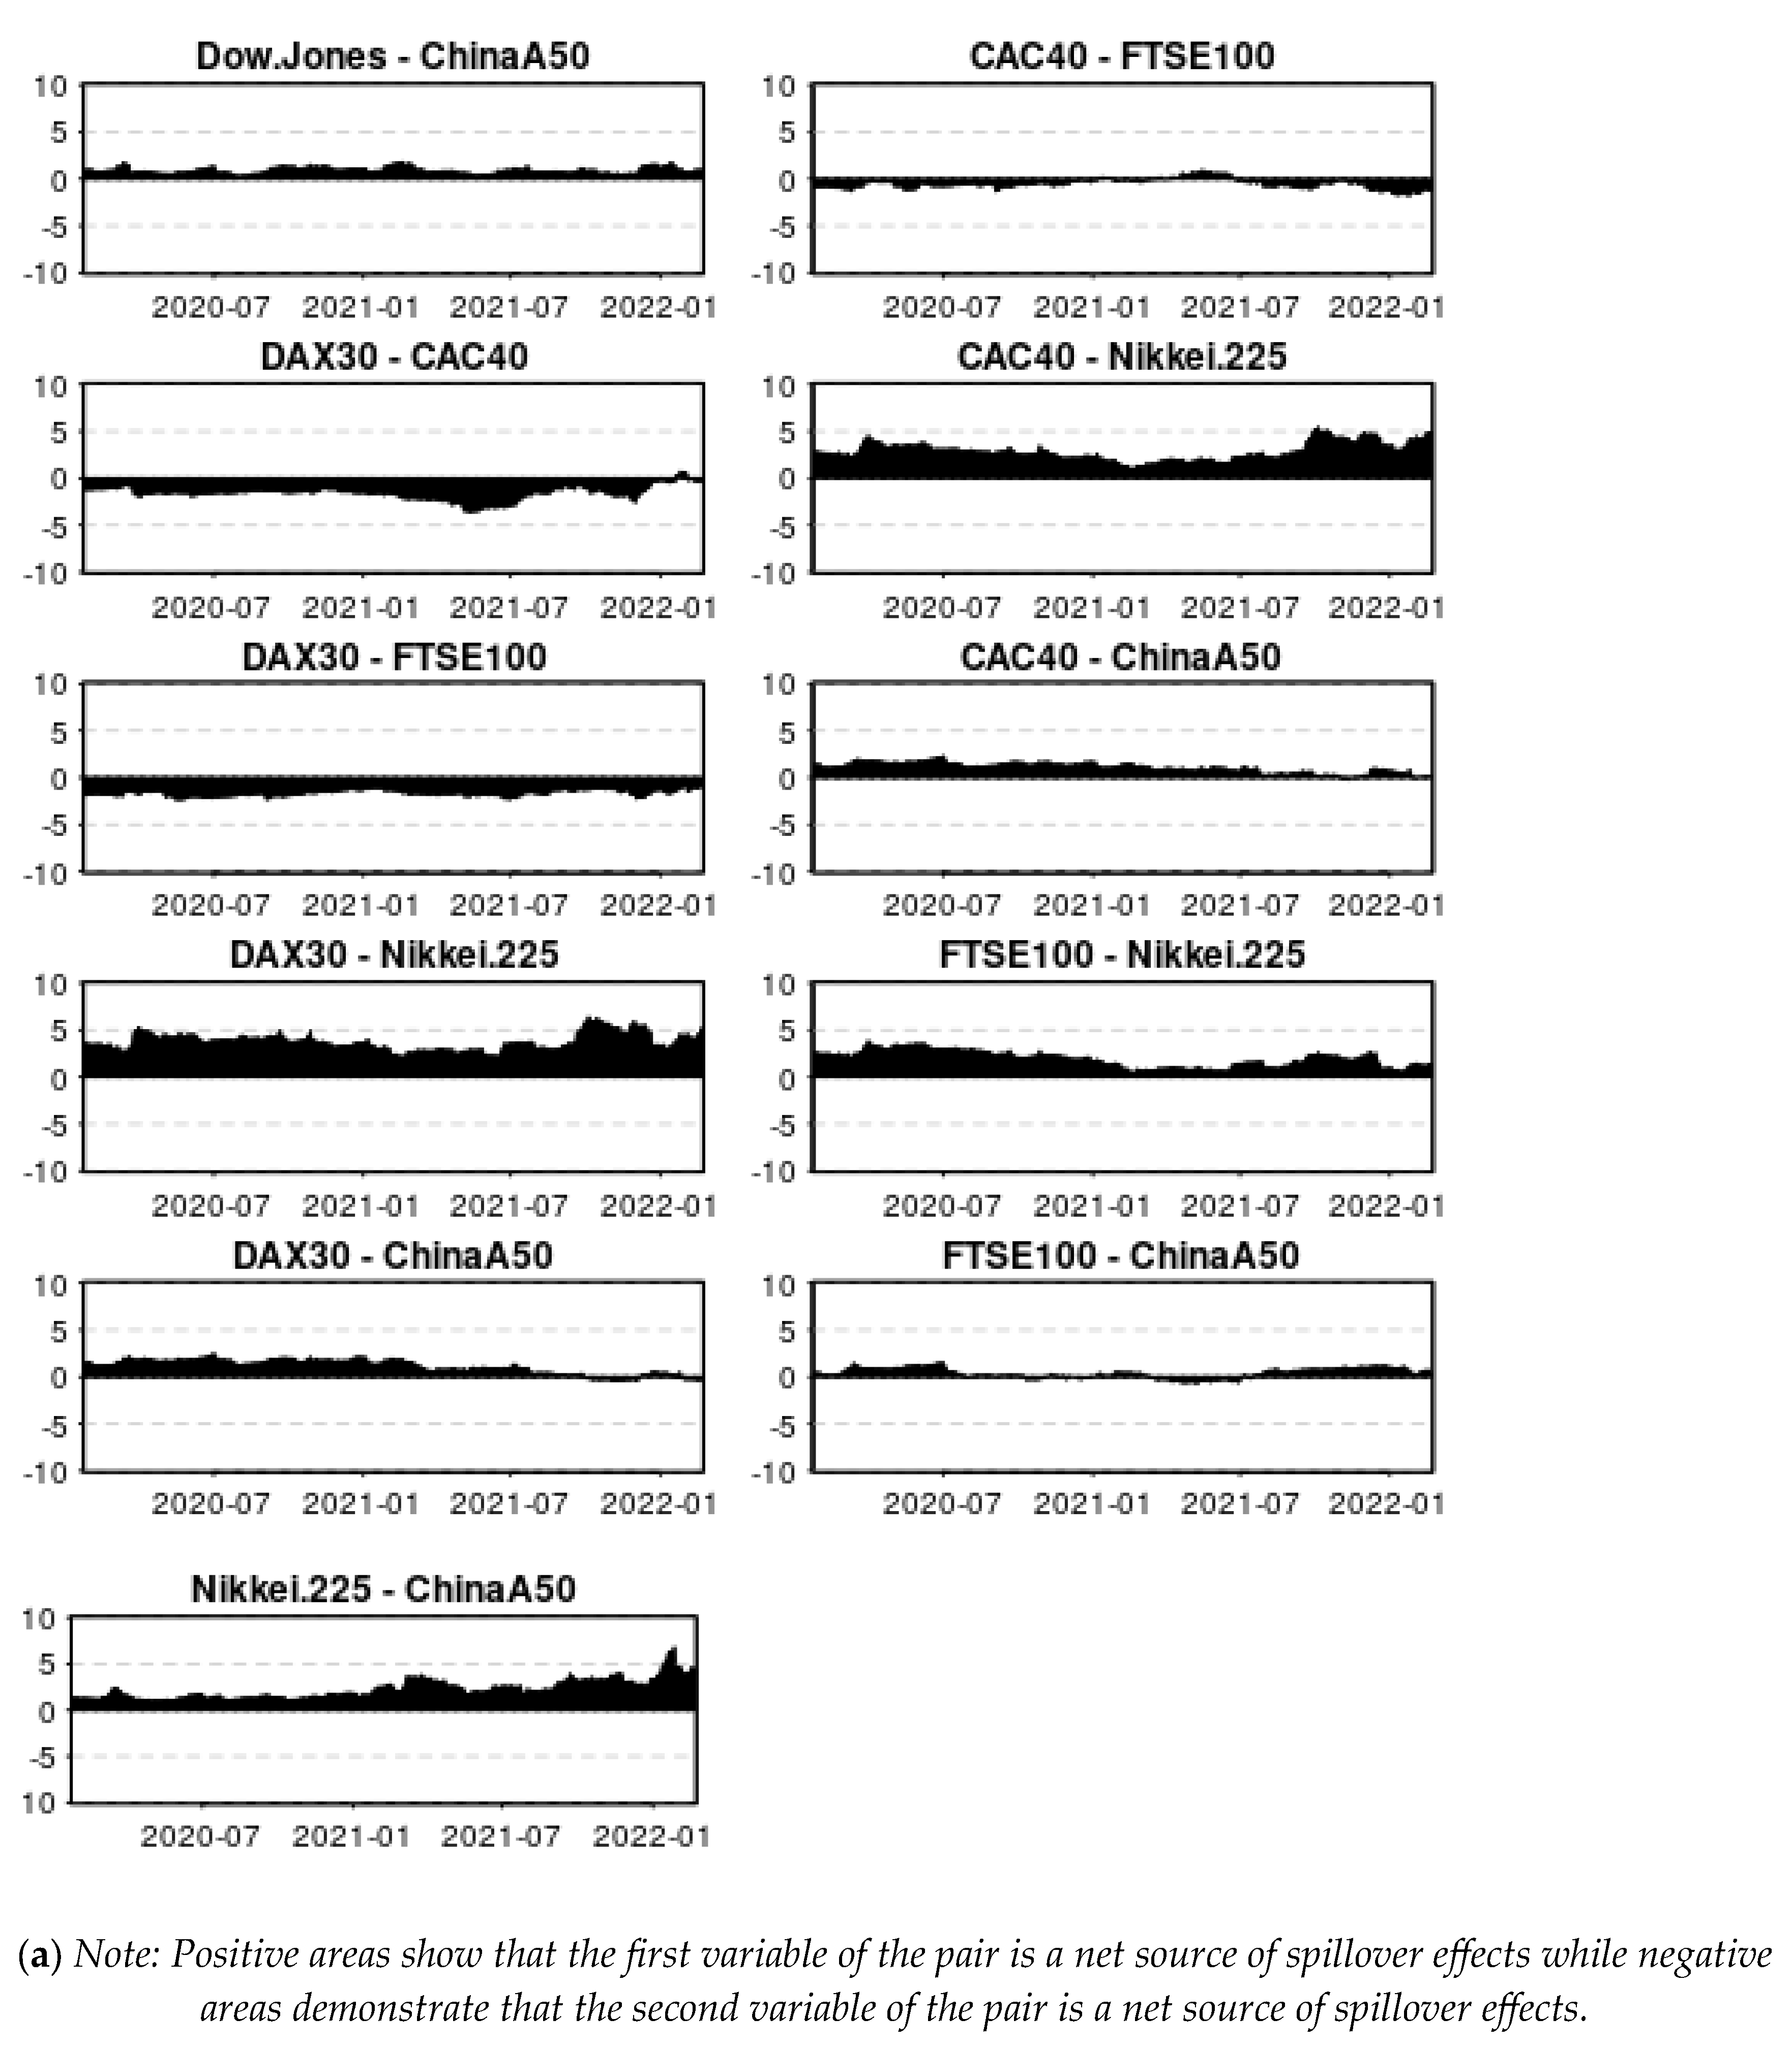
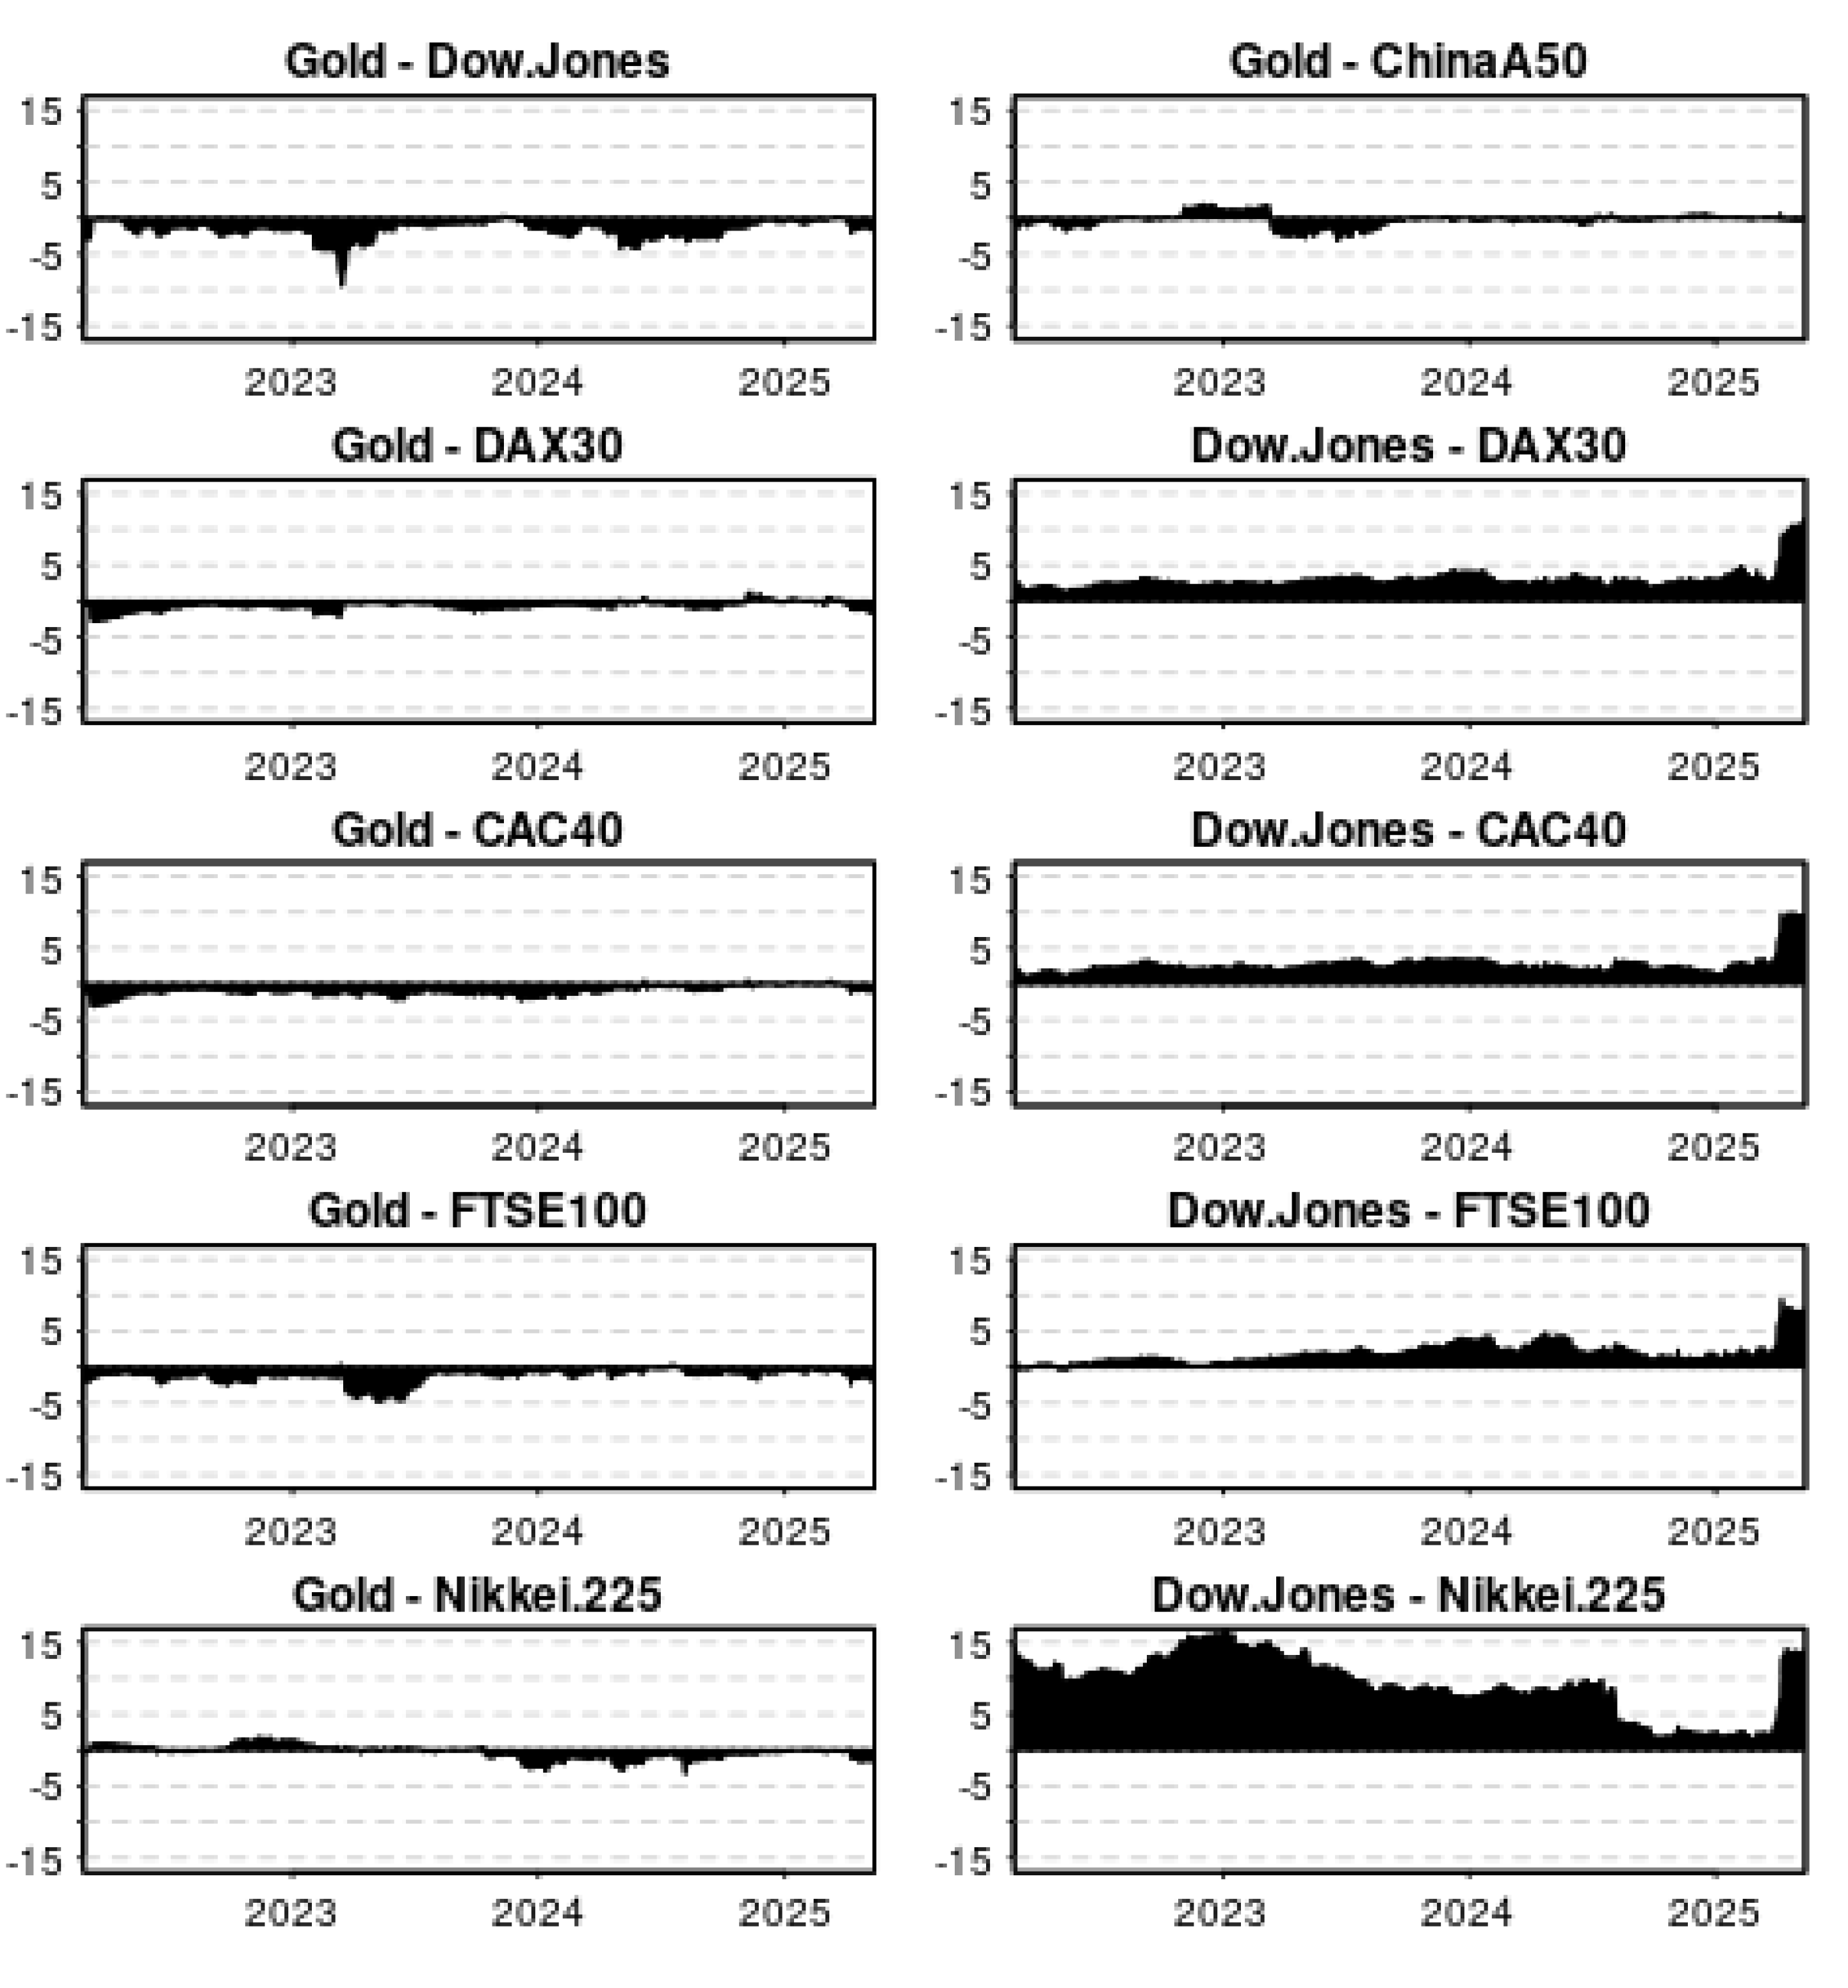
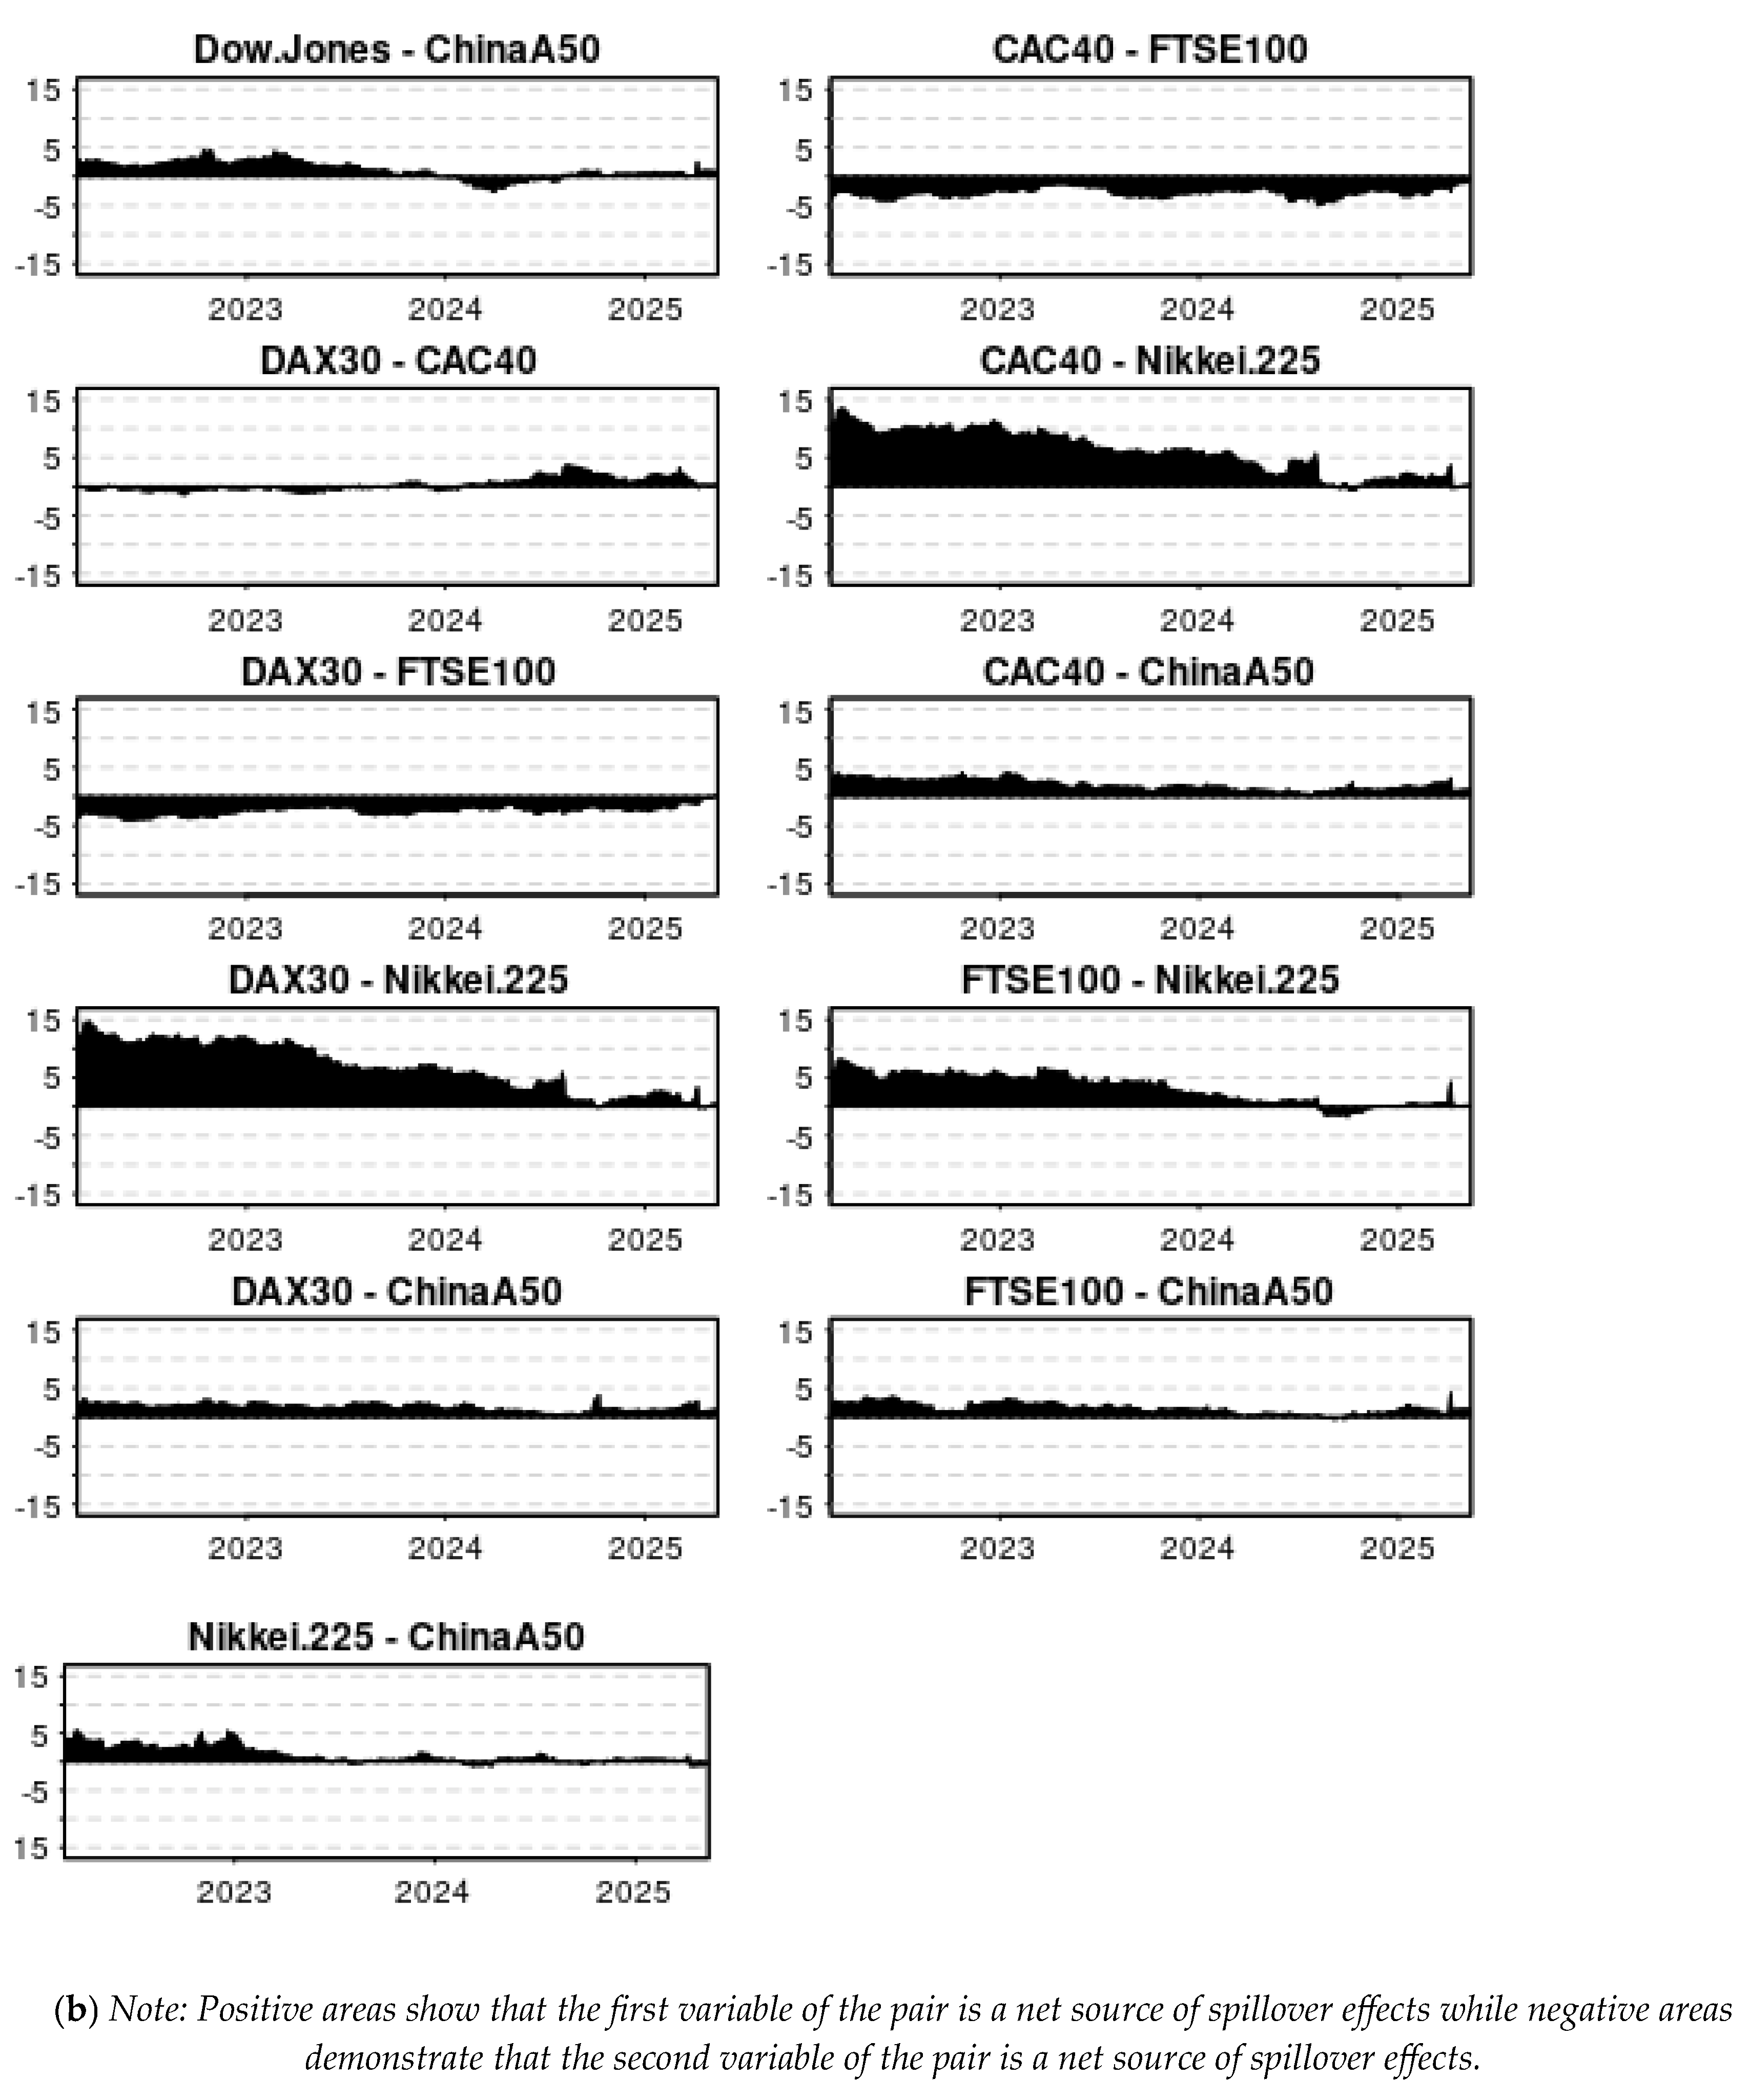

Table 1.
a. Descriptive statistics about the Covid-19 period. b. Descriptive statistics about the Russia-Ukraine war.
Table 1.
a. Descriptive statistics about the Covid-19 period. b. Descriptive statistics about the Russia-Ukraine war.
| a | ||||||||||||||
| Gold | Dow Jones | DAX30 | CAC40 | FTSE100 | Nikkei225 | ChinaA50 | ||||||||
| Mean | 0.044 | 0.039 | 0.028 | 0.035 | 0.008 | 0.028 | 0.018 | |||||||
| Variance | 1.081 | 2.915 | 2.564 | 2.489 | 1.97 | 1.999 | 1.831 | |||||||
| Skewness | -0.870*** | -0.553*** | -0.633*** | -1.012*** | -6.932*** | 0.286*** | -0.048 | |||||||
| Ex.Kurtosis | -3.673*** | 15.619*** | 12.232*** | 11.408*** | 11.970*** | 4.209*** | 4.761*** | |||||||
| JB | 335.636*** | 5383.709*** | 3320.367*** | 2947.654*** | 3222.355*** | 396.094*** | 498.038*** | |||||||
| ERS | -10.610*** | -9.736*** | -5.343*** | -6.506*** | -5.308*** | -5.562*** | -2.185** | |||||||
| Q(10) | 12.041** | 129.811*** | 23.663*** | 23.287*** | 22.066*** | 10.676* | 4.372 | |||||||
| Q2(10) | 33.373*** | 468.308*** | 90.230*** | 143.105*** | 130.357*** | 171.329*** | 7.456 | |||||||
| b | ||||||||||||||
| Gold | Dow Jones | DAX30 | CAC40 | FTSE100 | Nikkei225 | ChinaA50 | ||||||||
| Mean | 0.069 | 0.034 | 0.07 | 0.029 | 0.025 | 0.057 | 0 | |||||||
| Variance | 0.949 | 1.011 | 1.24 | 1.172 | 0.677 | 1.927 | 1.335 | |||||||
| Skewness | 0.041 | 0.215** | 0.152* | 0.036 | -0.550*** | -0.414*** | 0.221** | |||||||
| Ex.Kurtosis | 1.184*** | 6.579*** | 4.811*** | 4.131*** | 4.950*** | 14.955*** | 6.122*** | |||||||
| JB | 47.409*** | 1463.465*** | 782.495*** | 574.705*** | 865.700*** | 7553.075*** | 1268.429*** | |||||||
| ERS | -5.071*** | -2.260** | -1.773* | -1.748* | -1.329* | -3.598*** | -6.288*** | |||||||
| Q(10) | 4.567 | 4.534 | 9.070 | 6.491 | 6.214 | 18.258*** | 12.644** | |||||||
| Q2(10) | 59.229*** | 96.847*** | 152.390*** | 169.387*** | 234.512*** | 237.319*** | 94.593*** | |||||||
Notes: ***, ** and * reveal significance at 99%, 95% and 90% confidence levels, respectively. D’Agostino (1970) test is used to check for skewness and Anscombe and Glynn (1983) test to test for kurtosis. The Jarque and Bera (1980) test is adopted to check for normality. The ERS test is used to identify unit-root phenomena and the Fisher and Gallagher (2012) weighted portmanteau test controls for the existence of an adequately weighted ARCH process; Notes: ***, ** and * reveal significance at 99%, 95% and 90% confidence levels, respectively. D’Agostino (1970) test is used to check for skewness and Anscombe and Glynn (1983) test to test for kurtosis. The Jarque and Bera (1980) test is adopted to check for normality. The ERS test is used to identify unit-root phenomena and the Fisher and Gallagher (2012) weighted portmanteau test controls for the existence of an adequately weighted ARCH process.
Table 2.
a. Averaged dynamic connectedness during the Covid-19. b. Averaged dynamic connectedness during the Russia-Ukraine war.
Table 2.
a. Averaged dynamic connectedness during the Covid-19. b. Averaged dynamic connectedness during the Russia-Ukraine war.
| a | ||||||||||||||||
| Gold | Dow Jones | DAX30 | CAC40 | FTSE100 | Nikkei225 | ChinaA50 | FROM | |||||||||
| Gold | 85.52 | 2.47 | 3.56 | 3.67 | 2.23 | 1.01 | 1.65 | 14.48 | ||||||||
| Dow Jones | 1.21 | 37.11 | 18.10 | 18.87 | 16.27 | 5.86 | 2.57 | 62.89 | ||||||||
| DAX30 | 0.95 | 18.03 | 11.55 | 38.10 | 25.70 | 8.03 | 2.64 | 88.45 | ||||||||
| CAC40 | 0.60 | 17.97 | 31.55 | 11.00 | 27.30 | 8.57 | 3.01 | 89.00 | ||||||||
| FTSE100 | 0.61 | 15.91 | 24.08 | 26.81 | 22.31 | 7.42 | 2.86 | 77.69 | ||||||||
| Nikkei225 | 1.41 | 10.00 | 11.73 | 11.37 | 9.28 | 53.50 | 2.71 | 46.50 | ||||||||
| ChinaA50 | 1.42 | 3.41 | 3.69 | 4.01 | 3.23 | 4.88 | 79.36 | 20.64 | ||||||||
| TO | 6.20 | 67.79 | 92.71 | 97.72 | 84.02 | 35.77 | 15.44 | |||||||||
| NET | -8.29 | 4.90 | 4.26 | 8.72 | 6.33 | -10.73 | -5.20 | TCI=57.09 | ||||||||
| b | ||||||||||||||||
| Gold | Dow Jones | DAX30 | CAC40 | FTSE100 | Nikkei225 | ChinaA50 | FROM | |||||||||
| Gold | 88.90 | 3.26 | 1.87 | 1.87 | 1.90 | 0.75 | 1.45 | 11.10 | ||||||||
| Dow Jones | 1.70 | 65.48 | 11.46 | 10.47 | 8.77 | 1.62 | 0.49 | 34.52 | ||||||||
| DAX30 | 1.21 | 14.37 | 16.44 | 39.27 | 24.91 | 2.82 | 0.98 | 83.56 | ||||||||
| CAC40 | 0.94 | 13.09 | 39.60 | 15.53 | 27.47 | 2.28 | 1.08 | 84.47 | ||||||||
| FTSE100 | 0.68 | 10.63 | 22.57 | 24.75 | 37.28 | 2.58 | 1.50 | 62.72 | ||||||||
| Nikkei225 | 0.48 | 10.65 | 9.48 | 8.20 | 5.62 | 64.40 | 1.16 | 35.60 | ||||||||
| ChinaA50 | 1.18 | 1.59 | 2.61 | 3.01 | 2.90 | 2.30 | 86.40 | 13.60 | ||||||||
| TO | 6.20 | 53.60 | 87.60 | 87.57 | 71.57 | 12.35 | 6.66 | |||||||||
| NET | -4.90 | 19.08 | 4.04 | 3.10 | 8.86 | -23.24 | -6.94 | TCI=46.51 | ||||||||
Disclaimer/Publisher’s Note: The statements, opinions and data contained in all publications are solely those of the individual author(s) and contributor(s) and not of MDPI and/or the editor(s). MDPI and/or the editor(s) disclaim responsibility for any injury to people or property resulting from any ideas, methods, instructions or products referred to in the content. |
© 2025 by the authors. Licensee MDPI, Basel, Switzerland. This article is an open access article distributed under the terms and conditions of the Creative Commons Attribution (CC BY) license (http://creativecommons.org/licenses/by/4.0/).
Copyright: This open access article is published under a Creative Commons CC BY 4.0 license, which permit the free download, distribution, and reuse, provided that the author and preprint are cited in any reuse.


