
Submitted:
05 February 2025
Posted:
05 February 2025
You are already at the latest version
Preprints on COVID-19 and SARS-CoV-2
Abstract
This study examines the volatility and hedging effectiveness of commodities, specifically GOLD and OIL, on the Indian stock market, focusing on both aggregate and sectoral indices. Data has been collected from 1 Jan 2021 to 31 Dec 2024 to cover the post-COVID period. Utilising the Asymmetric Dynamic Conditional Correlation Generalized Autoregressive Conditional Heteroskedasticity (ADCC-GARCH) model, we analyse the volatility spillovers and time-varying correlations between commodity and stock market returns. The analysis of spillover connectedness reveals that both commodities exhibit limited and inconsistent hedging potential. GOLD demonstrates low and stable spillovers with most sectors, indicating its diminished role as a reliable safe-haven asset in Indian markets. OIL shows relatively higher but volatile spillover effects, particularly with sectors closely tied to energy and industrial activities, reflecting its dependence on external economic and geopolitical factors. The originality of this study lies in uncovering the nuanced, sector-specific interactions between GOLD, OIL, and the Indian stock market, emphasising the need to explore alternative hedging mechanisms or diversified approaches to risk management in the post-COVID recovery phase.
Keywords:
Commodity
; Indian financial sector
; hedging
; DCC-GARCH
1. Introduction
Over the past two decades, commodity markets have experienced a significant influx of capital, particularly from index funds [1,2]. This trend was primarily driven by the early 2000s stock market collapse triggered by a market bubble. The crisis heightened awareness of the negative correlation between commodity and stock returns, leading investors to view commodities as an effective means to reduce portfolio risk [3]. Consequently, substantial capital began flowing into commodity markets, with index funds playing a dominant role in commodity asset allocation—a phenomenon referred to as the financialisation of commodities [4]. This financialisation has brought a surge of capital into the commodity sector. For example, the Teucrium Corn Fund, an exchange-traded fund (ETF) tracking corn futures prices, had investments totalling $107 million in Corn futures contracts by 2011 [5]. Such financialisation has significantly amplified the trading volume of commodity markets, surpassing historical levels [6]. Moreover, many researchers have extensively covered the relationship between trading volume and market liquidity [7]. Numerous scholars often use Trading volume as a proxy for market liquidity [8,9,10], underscoring the integral role of financialisation in shaping market dynamics.
Research highlights various strategies for hedging risk exposure in stock markets. For instance, investments in OIL and GOLD futures effectively mitigate stock market risks in developed economies [11,12]. Similarly, Chkili et al. [13] investigate the interplay between US stock market volatility and crude OIL prices. Their findings suggest that incorporating both OIL and stock assets in a portfolio can help minimise overall portfolio risk. Moreover, volatility and hedging dynamics analysis of socially responsible investing (SRI) relative to OIL and GOLD prices using multivariate GARCH models show that SRI behaves similarly to the S&P 500, suggesting SRI investors would incur similar hedging costs with oil and gold as traditional S&P 500 investors [14]. Further studies extended the analysis of volatility spillovers to European stock markets at both aggregate and sectoral levels, employing a VAR-GARCH model to capture cross-market volatility transmissions to observe an uneven impact of OIL price changes across industries [15]. During financial crises, stock prices decline as investors gravitate toward safer assets like GOLD. Consequently, the GOLD and stock markets often exhibit co-movement and a well-balanced allocation across these markets offers significant hedging potential [16]. Expanding on this analysis, researchers have examined the evolving relationships among stock markets, bonds, and GOLD returns in the US, U.K., and Germany, emphasising the dual role of GOLD as a hedging instrument and a safe haven during periods of financial distress [17] These conclusions were further supported by research confirming consistent effectiveness of GOLD in portfolio risk management [18,19].
2. Literature Review
A significant body of literature has examined the volatility spillover between stock and commodity markets. For instance, Abdelhedi & Boujelbène-Abbes [20] explore the dynamics of volatility transmission between the Chinese stock market, investor sentiment, and the OIL market during the turbulent period of 2014–2016. Utilising the dynamic conditional correlation generalised autoregressive conditional heteroscedasticity (DCC-GARCH) model and wavelet decomposition techniques, their study identifies a bidirectional spillover effect between OIL market shocks and Chinese investor sentiment. This finding suggests that investor sentiment is the key channel through which volatility is transmitted between the OIL and stock markets.
Similarly, Vardar et al. [21] employ a vector autoregressive Baba-Engle-Kraft-Krone (VAR-BEKK)-GARCH model to examine the shock transmission and volatility spillover effects across the daily stock market indices of ten countries, including the US, U.K., France, Germany, Japan, Turkey, China, South Korea, South Africa, and India. The study incorporates data from five major commodity spot prices—crude OIL, natural gas, platinum, silver, and GOLD from 2005 to 2016. Their analysis reveals bidirectional spillover effects between stock market and commodity returns, underscoring the complex interdependencies between these markets. Creti et al. [22] examine the relationship between price returns for 25 commodities and stocks over 2001–2011, focusing on the energy sector. Using the dynamic conditional correlation (DCC) GARCH method, they revealed that the correlation between commodity and stock markets fluctuates over time, with heightened volatility observed, particularly following the 2007–2008 financial crisis. This finding underscores the evolving links between commodity and stock markets, highlighting the increasing financialisation of commodities.
Prior studies on the hedging properties of gold and other assets during market uncertainties offered varied perspectives on their roles across different crises and contexts [23,24]. Akhtaruzzaman et al. [24] identify a phase-dependent efficacy of gold, demonstrating that while gold initially acted as a safe haven during the early stages of the pandemic, its effectiveness diminished later as investors increasingly sought its “flight-to-safety” potential despite higher hedging costs. Salisu extends this argument by affirming the utility of GOLD futures against crude oil price volatility across pre- and post-pandemic periods, showcasing its robustness compared to other precious metals. These findings highlight the strategic relevance of GOLD during economic distress while underlining the complexities in its hedging efficiency.
Building on this, Tarchella et al. [25] broadened the scope by comparing gold with other assets. They emphasised the comparative advantage of gold as a diversifier across G7 equity markets in all conditions. At the same time, cryptocurrencies such as Bitcoin and Ethereum emerge as effective hedges during crisis periods, particularly in specific regions. On the other hand, some studies argue that gold stocks outperform platinum stocks as hedge assets during downturns, especially post-COVID, suggesting region-specific hedging dynamics [23,26]. Further research by Arfaoui et al. [27] refines these insights by exploring volatility spillovers between gold and energy commodities across distinct COVID-19 phases, claiming that hedging strategies are most effective during the COVID vaccination period and are influenced by external factors like market uncertainty and policy changes.
Similarly, Basher & Sadorsky [28] analyse the volatility spillover effects of OIL, GOLD, the volatility index (VIX), and bonds in emerging stock markets. Their findings argued that OIL provides a more effective hedge than GOLD when mitigating stock market risk. While much research has explored the roles of GOLD and OIL in portfolio diversification and hedging, there is a relative scarcity of studies focused on the post-COVID period, specifically in Indian sectoral indices. However, Indian stock markets have increasingly become attractive destinations for investors and asset managers seeking portfolio diversification [29,30,31,32].
A study by Jose & Jose [33] examined the hedging effectiveness of constant and dynamic hedge ratios in the Indian commodity market. They focused on 13 highly traded commodity futures contracts, including GOLD, silver, copper, zinc, aluminium, nickel, lead, cardamom, mentha OIL, cotton, crude palm OIL, crude OIL, and natural gas, spanning from 2008 to 2024. They claimed that agricultural futures contracts provided higher hedging effectiveness (approximately 30%) than non-agricultural commodity futures (around 20%), indicating that hedging strategies are more effective for agricultural commodities within the Indian market context. A similar study by Gupta et al. [34] examined agricultural commodities like castor se, guar seed, and non-agricultural commodities. It revealed that the Indian futures market provided higher hedging effectiveness for precious metals (65–75%) than industrial metals and energy commodities (less than 50%). Notably, hedging effectiveness for castor seed and natural gas was even lower than 10% in the Indian market.
Research on the hedging effectiveness of commodity futures contracts in the Italian field crop sector highlights their ability to mitigate price risks, though effectiveness varies by commodity and market conditions [35]. Similarly, a study on the Chinese market analysed 15 commodity futures using a quantile-based hedging framework, revealing that most futures products function as effective hedges and safe havens for spot prices [36]. The study further reported that hedge ratios followed a U-shaped pattern, increasing in both bearish and bullish markets. In terms of portfolio performance, metal commodities demonstrated the strongest results, followed by agricultural commodities, while energy commodities underperformed [36].
The existing literature on the volatility spillover and hedging effectiveness of commodities has primarily focused on global and regional market dynamics, with significant contributions examining the relationships between stock and commodity markets, mainly GOLD, OIL, and other key commodities like silver and natural gas [20,21,22]. These studies have highlighted the bidirectional spillover effects between stock markets and commodities like OIL and GOLD, with varying results depending on market conditions, geographical regions, and commodity types. Again, Basher & Sadorsky [28] emphasise the role of commodities in emerging markets, particularly in mitigating stock market risk. While these studies provide a comprehensive view of hedging effectiveness in developed and global markets, a notable gap exists in understanding the post-COVID hedging effectiveness of specific commodities, particularly within the Indian context. Moreover, while research has explored the hedging effectiveness of GOLD and OIL futures, there is limited analysis of how these hedging strategies perform across specific Indian sectoral indices post-COVID. The economic disruption caused by the pandemic has likely altered the relationships between these commodities and sectoral stock indices, warranting a fresh investigation into how GOLD and OIL futures can be used to hedge risks in various sectors like Energy, consumer goods, and financial services. The study aims to address this gap by focusing specifically on the post-COVID period and examining how hedging with GOLD and OIL futures can enhance risk management strategies for key Indian sectoral indices. This research will offer novel insights into these commodities' sector-specific hedging effectiveness, considering the unique market conditions and offering implications for portfolio diversification and risk mitigation strategies in the post-COVID era.
3. Methodology
The study utilises daily closing price data for GOLD and OIL futures, along with the Nifty 50 (Nifty) aggregate index and four sectoral indices: Auto, Energy, Finance, and Metal, covering the period from 1 Jan 2021 to 31 Dec 2024. As a broad-based benchmark index, the Nifty index captures the aggregate market sentiment and performance, making it an ideal proxy for overall market dynamics. The sectoral indices were chosen to provide a granular perspective on how GOLD and OIL futures influence specific industries that are closely linked to economic cycles and commodity price fluctuations. For instance, the Energy sector is directly impacted by OIL price movements, while the Metal sector is sensitive to global commodity trends, including GOLD. The Finance sector reflects macroeconomic conditions, such as inflation and interest rates, which are influenced by commodity markets, and the Auto sector represents a significant driver of industrial demand. The data was sourced from reliable platforms such as the National Stock Exchange (NSE) for stock indices and the Multi Commodity Exchange (MCX) or Bloomberg for GOLD and OIL futures. To ensure robustness, the price data was transformed into daily log returns. Stationarity of the return series was tested using the Augmented Dickey-Fuller (ADF) tests. Descriptive statistics and normality tests, such as the Jarque-Bera test, were performed to examine the distributional properties of the return series.
The study employs the following econometric models to analyse volatility dynamics, spillover effects, and hedging effectiveness.
Vector Autoregression (VAR): Used to capture the linear interdependencies among GOLD and OIL futures and the stock indices, providing insights into the lagged relationships between these variables.
Asymmetric Dynamic Conditional Correlation GARCH (ADCC-GARCH): A model that examines volatility spillovers and time-varying correlations between the commodity futures and stock indices, accommodating asymmetric shocks.
Diebold-Yilmaz Spillover Index: Measures the direction and magnitude of volatility spillovers among GOLD, OIL, and the stock indices, offering a comprehensive view of interconnected risks.
Dynamic Hedge Ratio and Hedging Effectiveness: The hedge ratio was computed dynamically using the time-varying covariance and variance obtained from the ADCC-GARCH model. The hedging effectiveness was evaluated by comparing the variance of a hedged portfolio against an unhedged portfolio.
4. Analysis
This section may be divided by subheadings. It should provide a concise and precise description of the experimental results, their interpretation, as well as the experimental conclusions that can be drawn.
4.1. Demographic Observations
Figure 1 and Figure 2 depict the price trends and log differentiated returns of different indices from January 2021 to December 2024. The Auto, Energy, Finance, Metal, and nifty indices show consistent upward trends, indicating growth in these sectors during the post-COVID recovery phase, likely driven by increased economic activity and investor confidence. In contrast, the GOLD index exhibits a general upward movement, though less pronounced, reflecting its role as a safe-haven asset. However, the OIL index demonstrates significant volatility with no clear upward trend, highlighting fluctuations in global OIL prices and demand-supply dynamics.
Table 1 presents the demographic information of the commodity and sectoral variables used in the study. The mean values suggest that Energy has the highest average return at 17.579, followed by Auto at 13.090. In contrast, GOLD has the lowest at 0.638. The standard deviations reveal varying levels of risk, with Energy exhibiting the highest volatility (387.833) and GOLD the lowest (18.338). Skewness values indicate that most of the series are negatively skewed. Energy (-2.614) shows the strongest negative skew, indicating a tendency towards more significant negative returns. Kurtosis values are high, particularly for Energy (41.939), suggesting fat tails or extreme outliers in the distribution. Jarque-Bera test results, marked with asterisks, confirm that all variables deviate significantly from normality. The Augmented Dickey-Fuller (ADF) test at the level indicates non-stationarity for most variables, except Finance, which is already stationary at the first difference, as indicated by the significant ADF values in the differenced data.
4.2. The VAR model
The VAR results at lag 1 presented in Table 2 show the interdependence among sectoral spot indices and gold futures, with key insights derived from the coefficients, standard errors, and t-statistics (given in square brackets). GOLD significantly impacts the Metal index positively (t = 2.28) and the Nifty index marginally (t = 1.87), indicating some spillover effects from GOLD to these indices. Auto has a statistically significant influence on itself (t = 2.03), showing strong persistence, but its impact on other indices remains weak or insignificant. Energy demonstrates a strong and negative influence on all indices, particularly the Metal (t = -4.97) and Finance (t = -4.61), indicating its critical role as a driver of sectoral performance. Finance on the other hand shows minimal impact across the indices, with all t-values insignificant, reflecting weak sectoral linkages. Metal significantly affects Energy positively (t = 3.34), hinting at interconnected movements between these sectors, while other relationships are less pronounced. Nifty exhibits some influence on Finance (t = 1.84) and marginally on Auto (t = 1.21), emphasising the index's role as a broad market indicator.
The impulse response plots in Figure 3 reveal that a one-standard deviation shock to GOLD induces varying short-term impacts on the other variables. Energy and Metal exhibit the strongest initial responses, with Energy peaking sharply before stabilising within 2-3 periods, while Metal shows a more gradual decline, indicating a slightly prolonged effect. Auto, Finance, and Nifty also respond positively but with lower intensity; their responses stabilise near zero within 2-4 periods, highlighting the short-lived influence of GOLD shocks. Overall, the impact of GOLD shocks across all variables is temporary, dissipating quickly, and does not result in long-term effects.
The VAR results provided in Table 3 indicate significant interdependencies among the variables, with several noteworthy observations. A one-period lag of OIL has a significant and strong positive impact on Energy (t=3.84) and Metal (t=4.67), while its influence on other variables is relatively weaker and statistically insignificant. Auto positively impacts itself (t=2.05), indicating some degree of autocorrelation, but its effects on other variables are marginal and not strongly significant. Energy demonstrates a significant negative impact across all variables, including itself (t=-5.60), suggesting a dominant adverse spillover effect. Conversely, Finance shows limited influence, with no significant impact on any variable. Metal positively impacts Energy (t=3.08), reflecting a significant relationship, while its effects on other variables are negligible. Nifty positively influences Finance (t=1.80) and itself (t=1.59), though its effects on other variables are not statistically significant. The constant terms indicate strong baseline values for Auto and Energy, suggesting inherent stability or other factors driving these sectors. Overall, the results highlight that OIL and Energy have the most pronounced effects, while Finance and Nifty exhibit weaker interactions.
The impulse response curves given in Figure 4 show the dynamic responses of sectoral indices (Auto, Energy, Finance, Metal, and Nifty) to a one standard deviation shock in the OIL index over 10 periods. Notably, Energy exhibits the strongest positive response, peaking sharply in the first period and gradually converging toward zero, indicating a highly sensitive yet short-lived impact of oil shocks. Metal also responds positively with a strong initial spike but stabilises faster compared to Energy. In contrast, Auto, Finance, and Nifty demonstrate relatively muted responses. Auto and Finance show small negative responses initially, which stabilise after 3 periods, while Nifty has a slight positive response that quickly diminishes. The overall results highlight that oil shocks significantly influence Energy and Metal, reflecting the dependence of these sectors on oil price fluctuations, whereas Auto, Finance, and Nifty are less affected.
4.3. The Diebold-Yilmaz Spillover Index
The Diebold-Yilmaz Spillover Connectedness Index plots presented in Figure 5 highlight the dynamic but relatively limited hedging abilities of GOLD and OIL with Indian sectoral indices. For GOLD, the spillover effects with sectors such as Auto, Finance, and Nifty are moderate, showing occasional spikes during periods of market volatility. However, the overall trends suggest that GOLD's traditional role as a safe-haven asset is not strongly evident in this period, likely due to evolving market conditions and diminished investor reliance on GOLD as a risk mitigation tool. The relatively stable and low spillovers with sectors like Energy and Metal further indicate that GOLD's hedging effectiveness is weak and fails to provide consistent protection against sectoral risks.
OIL, on the other hand, shows more pronounced spillovers with the Energy, Metal, and Auto sectors, reflecting its fundamental connection to these industries. However, the variability in spillover intensity across time suggests that OIL's ability to hedge against sectoral risks is context-dependent, with sharp spikes primarily driven by global supply-chain disruptions or geopolitical tensions. These fluctuations underline OIL's limited and inconsistent role as a hedging instrument during the post-COVID recovery period. The analysis demonstrates that neither GOLD nor OIL provides robust hedging capabilities for Indian sectoral indices in the studied timeframe, emphasising the need for diversified strategies to mitigate risks in the post-pandemic economic environment.
4.4. ADCC-GARCH Model
The ADCC-GARCH model results reveal significant insights into the volatility dynamics and asymmetries across the indices analysed. Starting with the mean return (μ), most indices exhibit statistically significant values, albeit small, highlighting modest average returns over the analysed period. For instance, the Nifty (μ=0.0008, p=0.002) and Metal (μ=0.0011, p=0.021) indices show notable returns, reflecting strong market performance. In contrast, GOLD and OIL show insignificant mean returns, indicating lower average returns or potential price stability. The AR(1) and MA(1) coefficients are significant for Energy and Metal, suggesting a stronger short-term dependence in returns and market adjustments in these indices, while others, like Nifty and Finance, show weaker autocorrelations.
The conditional variance parameters (ω, α1, β1) further highlight crucial volatility dynamics. The persistence of volatility (β1) is exceptionally high for GOLD (β1=0.9957), signalling those shocks to GOLD's volatility decay slowly, consistent with its traditional role as a safe haven. Similarly, high persistence is observed for OIL (β1=0.8701) and Finance (β1=0.8488), indicating prolonged volatility effects. The significant DCC parameters (DCC-α1=0.0195, DCC-β1=0.8876) confirm dynamic conditional correlations among the indices, suggesting that volatility transmission and time-varying co-movements are prevalent across the assets. Energy's notable α1=0.2222 suggests it reacts more quickly to new market information, making it sensitive to shocks. This is contrasted by GOLD, with a minimal α1=0.002, which implies minimal responsiveness to market shocks, aligning with its low-risk nature.
The asymmetric effect, represented by the parameter ω, provides insights into how shocks of different signs impact the volatility of the indices. Across the results, ω is statistically significant for Energy (p=0.009), Finance (p=0.011), GOLD (p=0.009), and OIL (p=0.005), indicating the presence of asymmetry in these markets. This implies that negative shocks (bad news) tend to affect volatility differently than positive shocks (good news), a characteristic often linked to investor sentiment and market risk aversion. For example, GOLD and OIL, as commodities, exhibit significant asymmetric effects due to their sensitivity to geopolitical events and macroeconomic uncertainties, which can amplify volatility during adverse market conditions. Conversely, indices like Auto and Nifty show insignificant ω values, suggesting relatively symmetric responses to shocks, which could reflect more stable investor behaviour and reduced sensitivity to market news. These observations highlight the diverse nature of volatility responses across asset classes, driven by their underlying economic and market characteristics.
The analysis reveals that the asymmetric effects, as represented by the parameter ω\omega, are significant for certain asset classes like GOLD, OIL, and Energy, indicating that negative shocks (e.g., adverse news or market downturns) have a more pronounced impact on volatility compared to positive shocks. This asymmetry aligns with the leverage effect observed in financial markets, where bad news tends to increase perceived risk and uncertainty, leading to heightened volatility [37,38]. Commodities such as GOLD and OIL, being highly sensitive to geopolitical and macroeconomic factors, exhibit strong asymmetric volatility responses due to their role as hedging instruments and their dependency on external factors like supply disruptions or inflationary pressures. On the other hand, sectoral indices like Auto and Nifty exhibit relatively symmetric behaviour, suggesting that these markets may experience more stable investor sentiment or are better diversified against external shocks. These findings underscore the heterogeneous nature of volatility dynamics across asset classes, emphasising the importance of considering asymmetry when modelling risk and making portfolio decisions.
4.5. Dynamic Hedge Ratio and Hedging Effectiveness
Table 6 presents the average dynamic hedge ratios and hedging effectiveness for various asset pairs, reflecting the ability of one asset to hedge the risk of another. Notably, Nifty exhibits high average hedge ratios (more than one for Nifty-Metal, Nifty-Finance, and Nifty-Energy) and strong hedging effectiveness (0.68 to 0.87), indicating its suitability as a robust hedging instrument against these indices. In contrast, GOLD shows relatively low hedge ratios and modest effectiveness, with GOLD-Metal (0.18) and GOLD-Finance (0.12) performing better compared to other pairs involving GOLD. OIL, across all its combinations, has minimal hedge ratios (all below 0.1) and poor effectiveness, suggesting limited potential as a hedge. Pairs like Metal-Finance and Metal-Energy demonstrate moderate hedge ratios (0.34 and 0.47) and effectiveness (0.76 and 0.62), indicating better hedging performance. Overall, indices like Nifty and Metal appear to be more effective for risk management, while OIL and GOLD are less efficient as hedging instruments.

Table 5.
Dynamic Hedge Ratio and Hedging Effectiveness.
| Pair | Average Hedge Ratio | Hedging Effectiveness |
|---|---|---|
| OIL-Nifty | 0.0319 | 0.79% |
| OIL-Metal | 0.0970 | 2.63% |
| OIL-Finance | 0.0338 | -0.49% |
| OIL-Energy | 0.0332 | 1.06% |
| OIL-Auto | 0.0465 | 0.20% |
| GOLD-Nifty | 0.0571 | 7.65% |
| GOLD-Metal | 0.2316 | 17.59% |
| GOLD-Finance | 0.0724 | 11.96% |
| GOLD-Energy | 0.0790 | 5.52% |
| GOLD-Auto | 0.0497 | 3.34% |
| Nifty-Metal | 1.3356 | 87.12% |
| Nifty-Finance | 1.1176 | 71.67% |
| Nifty-Energy | 1.0377 | 75.36% |
| Nifty-Auto | 0.9574 | 67.90% |
| Metal-Finance | 0.3422 | 76.54% |
| Metal-Energy | 0.4722 | 62.40% |
| Metal-Auto | 0.3699 | 44.29% |
| Finance-Energy | 0.6288 | 40.37% |
| Finance-Auto | 0.6004 | 37.80% |
| Energy-Auto | 0.5763 | 66.16% |
The findings suggest that both GOLD and OIL exhibit limited effectiveness as hedging instruments against Indian sectoral indices, with consistently low average hedge ratios and hedging effectiveness. GOLD's relatively higher hedging effectiveness with Metal (0.18) and Finance (0.12) compared to other pairs indicates some potential to mitigate sector-specific risks, likely due to its status as a traditional safe-haven asset during periods of economic uncertainty [39]. However, its overall weak performance across most indices highlights its limited applicability in the dynamic Indian market. Conversely, OIL demonstrates uniformly poor hedging effectiveness and minimal hedge ratios, reflecting its inability to offset sectoral risks effectively. This contradicts prior studies indicating that commodities like GOLD and OIL could be used as better hedging funds than sectoral indices [40]. On the other hand, crude OIL prices often exhibit greater volatility and weaker correlations with equity markets, reducing their hedging potential [41]. This observation provides an interesting aspect of the commodities market being poor in hedging ability even though they exhibit poor correlation with the sectoral indices [30]. These results underscore the need to explore alternative commodities or financial instruments to enhance risk mitigation strategies in sectoral portfolios.
5. Implications
This study holds very important implications for investors, policymakers, and portfolio managers since it reveals the weak hedging capacity of GOLD and OIL with Indian sectoral indices in the post-COVID period. It calls for diversification strategies to take into consideration the weak spillover effects between commodities and sectors, especially during market turbulence. Through targeted interventions, policymakers can use these findings to understand sector-specific vulnerabilities and improve financial market resilience. The research also highlights the importance of dynamic hedging strategies and motivates investors to look into alternative assets or commodities as a risk-reduction tool. This study provides a basis for further research on spillover dynamics in emerging markets, offering a strategic framework for decision-making in volatile economic environments.
6. Conclusions
The analysis of spillover connectedness between GOLD, OIL, and sectoral indices in India during the post-COVID period reveals that both commodities exhibit limited and inconsistent hedging potential. GOLD demonstrates low and stable spillovers with most sectors, indicating its diminished role as a reliable safe-haven asset in the context of Indian markets. OIL shows relatively higher but volatile spillover effects, particularly with sectors closely tied to energy and industrial activities, reflecting its dependence on external economic and geopolitical factors. Overall, the findings suggest that neither GOLD nor OIL consistently serves as an effective hedging tool for sectoral risks in the Indian market during the recovery period, highlighting the importance of exploring alternative hedging mechanisms or diversified approaches to risk management.
7. Limitations and Scope
This research has several limitations that should be acknowledged. Firstly, the study focuses solely on the post-COVID period (January 2021 to December 2024), which may not capture long-term trends or structural shifts in the market. Secondly, it examines only two commodities, GOLD and OIL, as hedging tools, potentially overlooking other assets or instruments that may offer better hedging potential. Additionally, the analysis is restricted to select sectoral indices, which may not fully represent the diversity of the Indian market. The methodology, while robust, relies on specific model assumptions, such as the Diebold-Yilmaz Spillover Index, which may not account for all complexities of financial spillovers. Lastly, external factors such as regulatory changes, geopolitical events, and macroeconomic shocks, which can significantly influence market dynamics, are not explicitly incorporated into the analysis.
Future studies could expand the scope by exploring additional commodities, such as silver or cryptocurrency, to assess their hedging potential against sectoral indices. Additionally, investigating the impact of external factors, such as geopolitical risks, interest rate changes, or policy interventions, would enhance the contextual understanding of market interactions. As such comparative analysis across multiple emerging markets could also offer valuable insights into regional variations in hedging and connectedness.
Author Contributions
For research articles with several authors, a short paragraph specifying their individual contributions must be provided. The following statements should be used “Conceptualization, N.M. and A.K.P.; methodology, software, N.M.; validation, N.M., and S.K.C.; formal analysis, N.M.; investigation, A.K.P.; resources, data curation, S.K.C.; writing—original draft preparation, writing—review and editing, N.M.; visualisation, S.K.C.; supervision, A.K.P.; project administration, N.M.; All authors have read and agreed to the published version of the manuscript.
Funding
This research received no external funding.
Conflicts of Interest
The authors declare no conflicts of interest.
References
- Hamilton, J.D.; Wu, J.C. Effects of Index-Fund Investing on Commodity Futures Prices. Int Econ Rev (Philadelphia) 2015, 56, 187–205. [Google Scholar] [CrossRef]
- Just, M.; Luczak, A. Assessment of Conditional Dependence Structures in Commodity Futures Markets Using Copula-GARCH Models and Fuzzy Clustering Methods. Sustainability (Switzerland) 2020, 12, 2571. [Google Scholar] [CrossRef]
- Tang, K.; Xiong, W. Index Investment and the Financialization of Commodities. Financial Analysts Journal 2012, 68, 54–74. [Google Scholar] [CrossRef]
- Irwin, S.H.; Sanders, D.R. Index Funds, Financialization, and Commodity Futures Markets. Appl Econ Perspect Policy 2011, 33, 1–31. [Google Scholar] [CrossRef]
- Irwin, S.H.; Sanders, D.R. Financialization and Structural Change in Commodity Futures Markets. Journal of Agricultural and Applied Economics 2012, 44, 371–396. [Google Scholar] [CrossRef]
- Ederer, S.; Heumesser, C.; Staritz, C. Financialization and Commodity Prices – an Empirical Analysis for Coffee, Cotton, Wheat and Oil. Int Rev Appl Econ 2016, 30, 462–487. [Google Scholar] [CrossRef]
- Chordia, T.; Subrahmanyam, A.; Anshuman, V.R. Trading Activity and Expected Stock Returns. J financ econ 2001, 59, 3–32. [Google Scholar] [CrossRef]
- Datar, V.T.; Y. Naik, N.; Radcliffe, R. Liquidity and Stock Returns: An Alternative Test. Journal of Financial Markets 1998, 1, 203–219. [Google Scholar] [CrossRef]
- Liu, G.; Guo, X. Forecasting Stock Market Volatility Using Commodity Futures Volatility Information. Resources Policy 2022, 75, 102481. [Google Scholar] [CrossRef]
- Rzayev, K.; Ibikunle, G. A State-Space Modeling of the Information Content of Trading Volume. Journal of Financial Markets 2019, 46, 100507. [Google Scholar] [CrossRef]
- Chkili, W. Dynamic Correlations and Hedging Effectiveness between Gold and Stock Markets: Evidence for BRICS Countries. Res Int Bus Finance 2016, 38, 22–34. [Google Scholar] [CrossRef]
- Khalfaoui, R.; Boutahar, M.; Boubaker, H. Analysing Volatility Spillovers and Hedging between Oil and Stock Markets: Evidence from Wavelet Analysis. Energy Econ 2015, 49, 540–549. [Google Scholar] [CrossRef]
- Chkili, W.; Aloui, C.; Nguyen, D.K. Instabilities in the Relationships and Hedging Strategies between Crude Oil and US Stock Markets: Do Long Memory and Asymmetry Matter? Journal of International Financial Markets, Institutions and Money 2014, 33, 354–366. [Google Scholar] [CrossRef]
- Sadorsky, P. Modeling Volatility and Conditional Correlations between Socially Responsible Investments, Gold and Oil. Econ Model 2014, 38, 609–618. [Google Scholar] [CrossRef]
- Arouri, M.E.H.; Jouini, J.; Nguyen, D.K. On the Impacts of Oil Price Fluctuations on European Equity Markets: Volatility Spillover and Hedging Effectiveness. Energy Econ 2012, 34, 611–617. [Google Scholar] [CrossRef]
- Coudert, V.; Raymond-Feingold, H. Gold and Financial Assets: Are There Any Safe Havens in Bear Markets? Economics Bulletin 2011, 31, 1613–1622. [Google Scholar]
- Baur, D.G.; Lucey, B.M. Is Gold a Hedge or a Safe Haven? An Analysis of Stocks, Bonds and Gold. Financial Review 2010, 45, 217–229. [Google Scholar] [CrossRef]
- Hood, M.; Malik, F. Is Gold the Best Hedge and a Safe Haven under Changing Stock Market Volatility? Review of Financial Economics 2013, 22, 47–52. [Google Scholar] [CrossRef]
- Ciner, C.; Gurdgiev, C.; Lucey, B.M. Hedges and Safe Havens: An Examination of Stocks, Bonds, Gold, Oil and Exchange Rates. International Review of Financial Analysis 2013, 29, 202–211. [Google Scholar] [CrossRef]
- Abdelhedi, M.; Boujelbène-Abbes, M. Transmission of Shocks between Chinese Financial Market and Oil Market. International Journal of Emerging Markets 2020, 15, 262–286. [Google Scholar] [CrossRef]
- Vardar, G.; Coşkun, Y.; Yelkenci, T. Shock Transmission and Volatility Spillover in Stock and Commodity Markets: Evidence from Advanced and Emerging Markets. Eurasian Economic Review 2018, 8, 231–288. [Google Scholar] [CrossRef]
- Creti, A.; Joëts, M.; Mignon, V. On the Links between Stock and Commodity Markets’ Volatility. Energy Econ 2013, 37, 16–28. [Google Scholar] [CrossRef]
- Salisu, A.A.; Vo, X.V.; Lawal, A. Hedging Oil Price Risk with Gold during COVID-19 Pandemic. Resources Policy 2021, 70, 101897. [Google Scholar] [CrossRef]
- Akhtaruzzaman, M.; Boubaker, S.; Lucey, B.M.; Sensoy, A. Is Gold a Hedge or a Safe-Haven Asset in the COVID–19 Crisis? Econ Model 2021, 102, 105588. [Google Scholar] [CrossRef]
- Tarchella, S.; Khalfaoui, R.; Hammoudeh, S. The Safe Haven, Hedging, and Diversification Properties of Oil, Gold, and Cryptocurrency for the G7 Equity Markets: Evidence from the Pre- and Post-COVID-19 Periods. Res Int Bus Finance 2024, 67, 102125. [Google Scholar] [CrossRef]
- Ntare, H.B.; Mwamba, J.W.M.; Adekambi, F. Dynamic Correlation and Hedging Ability of Precious Metals in Pre- and Post-COVID Periods. Cogent Economics and Finance 2024, 12, 2382375. [Google Scholar] [CrossRef]
- Arfaoui, N.; Yousaf, I.; Jareño, F. Return and Volatility Connectedness between Gold and Energy Markets: Evidence from the Pre- and Post-COVID Vaccination Phases. Econ Anal Policy 2023, 77, 617–634. [Google Scholar] [CrossRef]
- Basher, S.A.; Sadorsky, P. Hedging Emerging Market Stock Prices with Oil, Gold, VIX, and Bonds: A Comparison between DCC, ADCC and GO-GARCH. Energy Econ 2016, 54, 235–247. [Google Scholar] [CrossRef]
- Maharana, N.; Panigrahi, A.K.; Chaudhury, S.K. Volatility Persistence and Spillover Effects of Indian Market in the Global Economy: A Pre- and Post-Pandemic Analysis Using VAR-BEKK-GARCH Model. Journal of Risk and Financial Management 2024, 17, 22. [Google Scholar] [CrossRef]
- Maharana, N.; Panigrahi, A.K.; Chaudhury, S.K.; Uprety, M.; Barik, P.; Kulkarni, P. Economic Resilience in Post-Pandemic India: Analysing Stock Volatility and Global Links Using VAR-DCC-GARCH and Wavelet Approach. Journal of Risk and Financial Management 2025, 18, 18. [Google Scholar] [CrossRef]
- Yadav, N.; Singh, A.B.; Tandon, P. Volatility Spillover Effects between Indian Stock Market and Global Stock Markets: A DCC-GARCH Model. FIIB Business Review 2023, 23197145221141184. [Google Scholar] [CrossRef]
- Bouri, E.; Jain, A.; Biswal, P.C.; Roubaud, D. Cointegration and Nonlinear Causality amongst Gold, Oil, and the Indian Stock Market: Evidence from Implied Volatility Indices. Resources Policy 2017, 52, 201–206. [Google Scholar] [CrossRef]
- Jose, A.; Jose, N. Exploring the Effectiveness of Hedging in the Indian Commodity Market: A Comparative Analysis of Constant and Dynamic Hedge Ratios Across Agricultural and Non-Agricultural Commodities. International Journal For Multidisciplinary Research 2024, 6, 01–15. [Google Scholar] [CrossRef]
- Gupta, S.; Choudhary, H.; Agarwal, D.R. Hedging Efficiency of Indian Commodity Futures. Paradigm 2017, 21, 1–20. [Google Scholar] [CrossRef]
- Penone, C.; Giampietri, E.; Trestini, S. Hedging Effectiveness of Commodity Futures Contracts to Minimise Price Risk: Empirical Evidence from the Italian Field Crop Sector. Risks 2021, 9, 213. [Google Scholar] [CrossRef]
- Huang, H.; Xiong, T. A Good Hedge or Safe Haven? The Hedging Ability of China’s Commodity Futures Market under Extreme Market Conditions. Journal of Futures Markets 2023, 43, 968–1035. [Google Scholar] [CrossRef]
- Black, F. The Pricing of Commodity Contracts. J financ econ 1976, 3, 167–179. [Google Scholar] [CrossRef]
- Engle, R.F.; Ng, V.K. Measuring and Testing the Impact of News on Volatility. J Finance 1993, 48, 1749–1778. [Google Scholar] [CrossRef]
- Baur, D.G.; McDermott, T.K. Is Gold a Safe Haven? International Evidence. J Bank Financ 2010, 34, 1886–1898. [Google Scholar] [CrossRef]
- Pandey, V. Does Commodity Exposure Benefit Traditional Portfolios? Evidence from India. Investment Management and Financial Innovations 2023, 20, 36–49. [Google Scholar] [CrossRef]
- Filis, G.; Degiannakis, S.; Floros, C. Dynamic Correlation between Stock Market and Oil Prices: The Case of Oil-Importing and Oil-Exporting Countries. International Review of Financial Analysis 2011, 20, 152–164. [Google Scholar] [CrossRef]
Figure 1.
Trend of the selected commodity futures and sectoral indices.
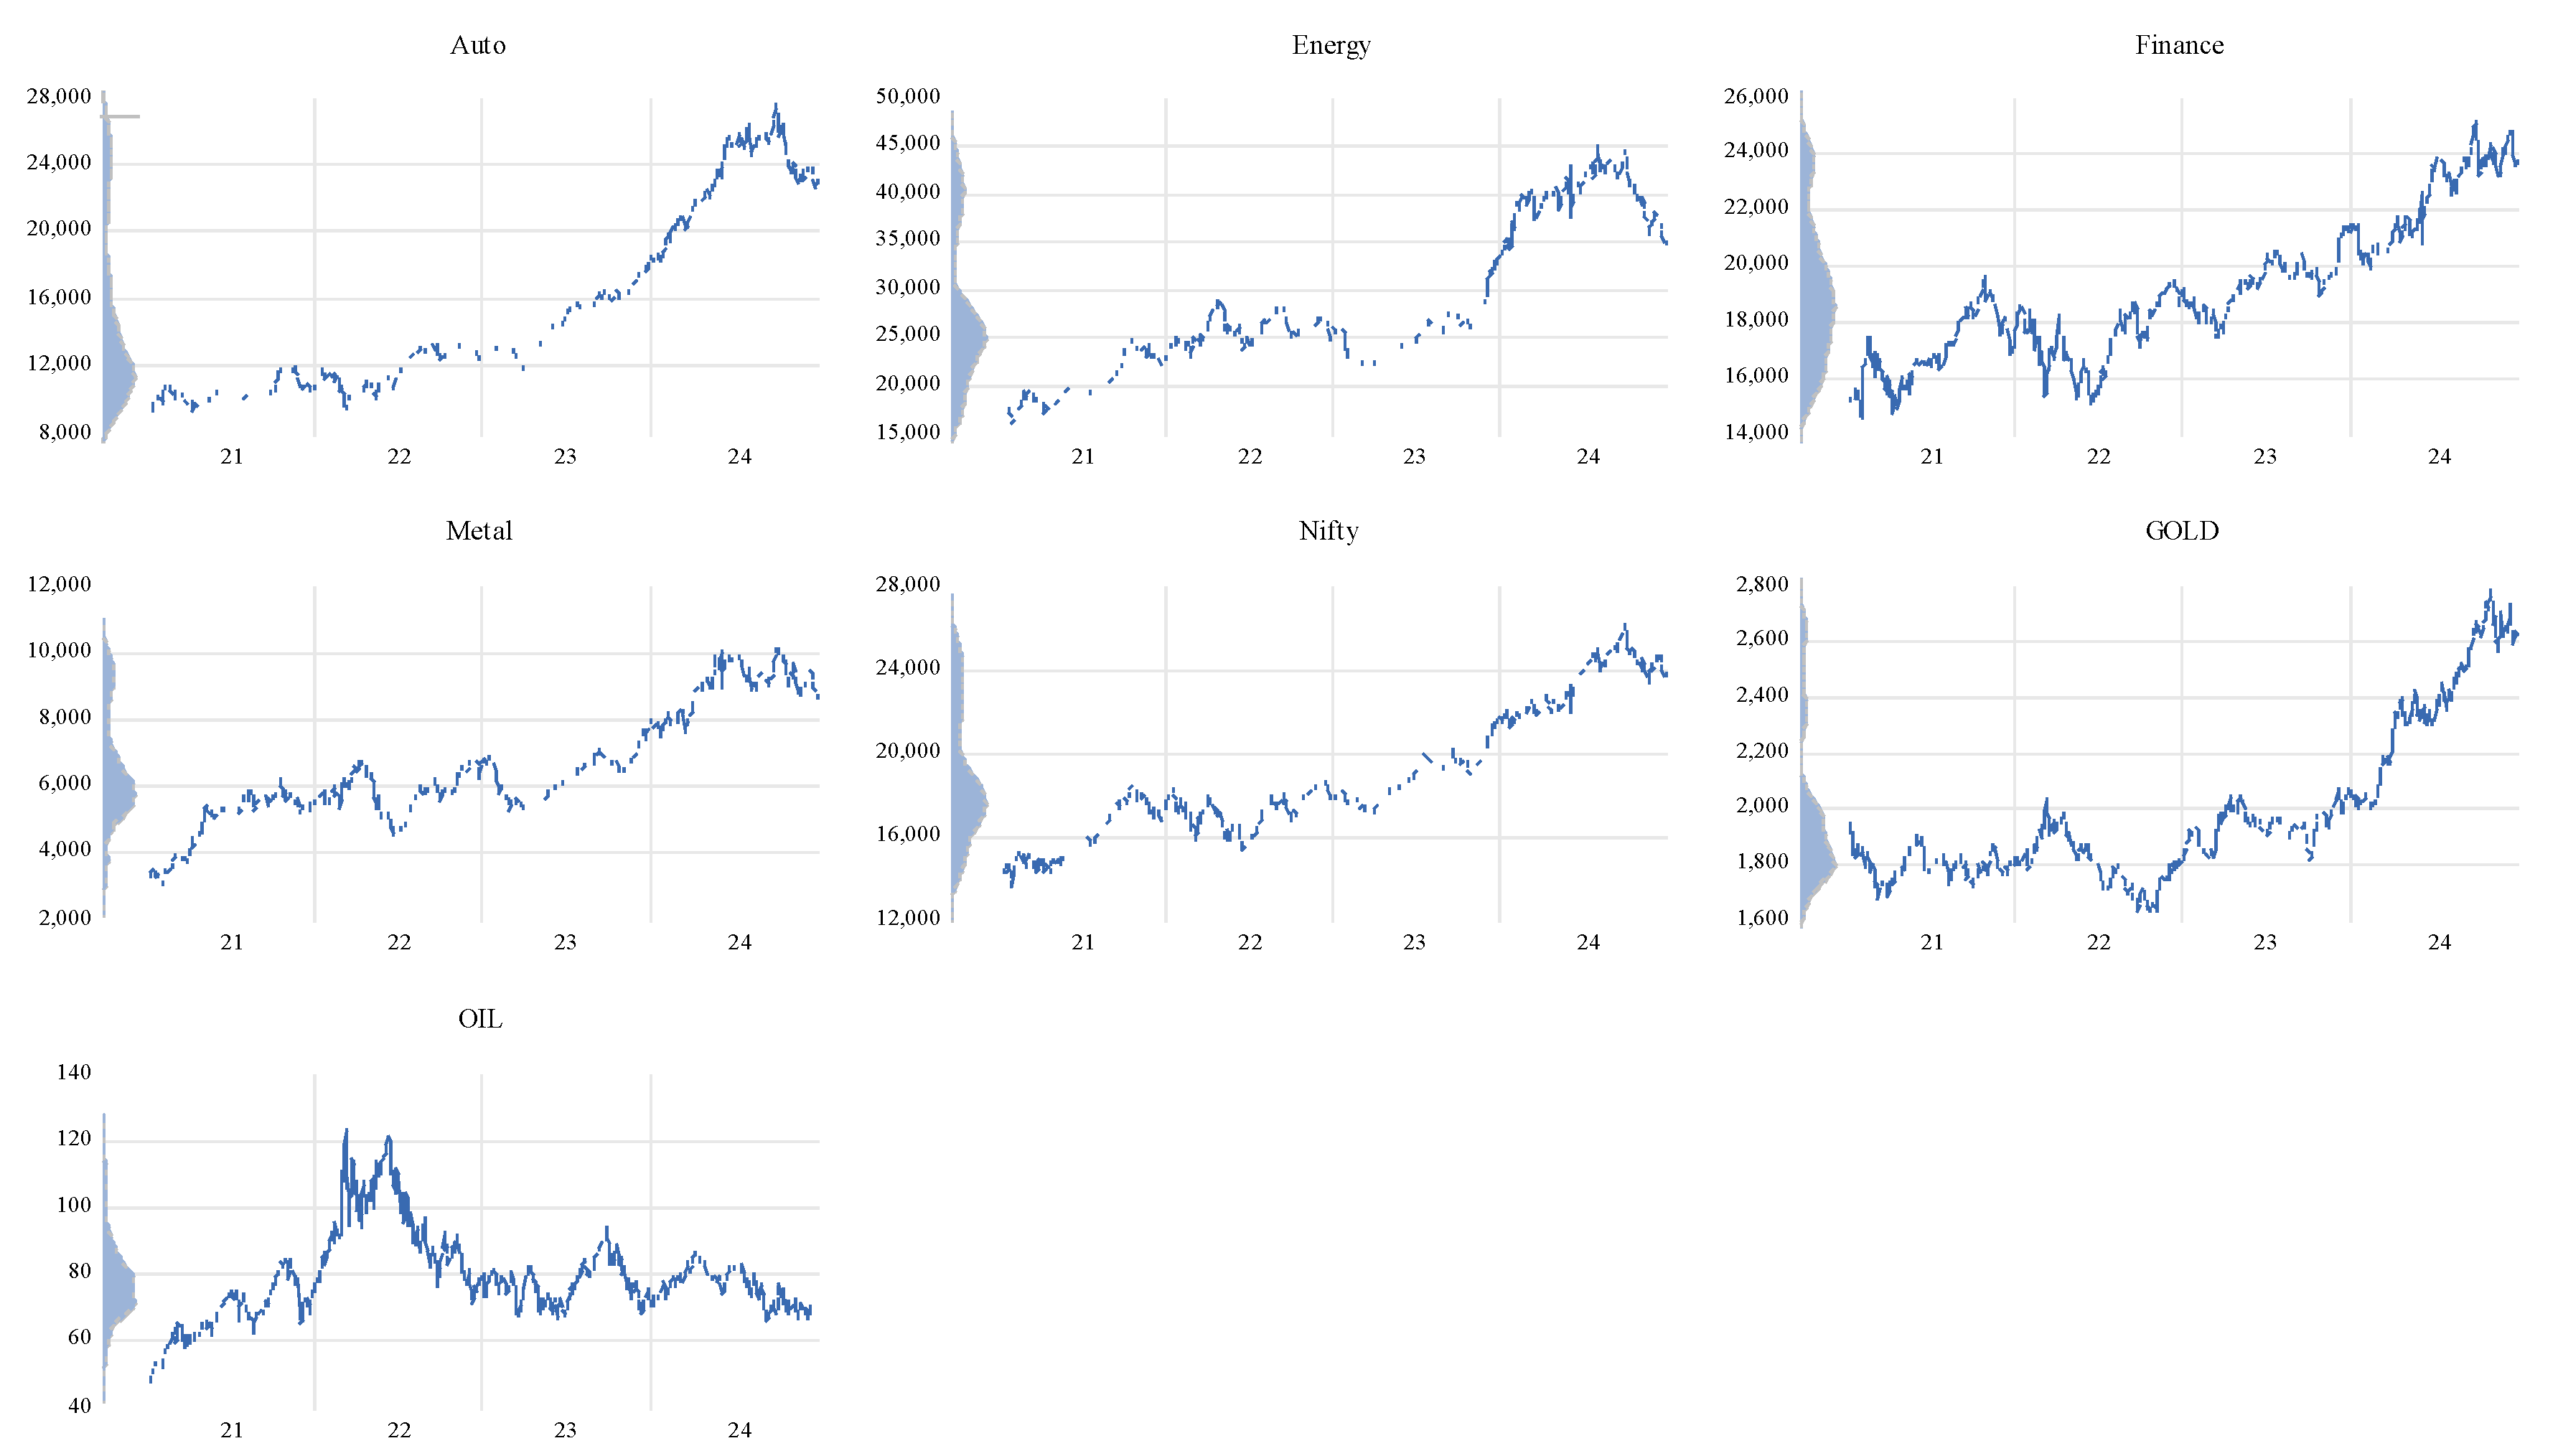
Figure 2.
Daily log differentiated Return plot of the selected sectors and commodity futures.
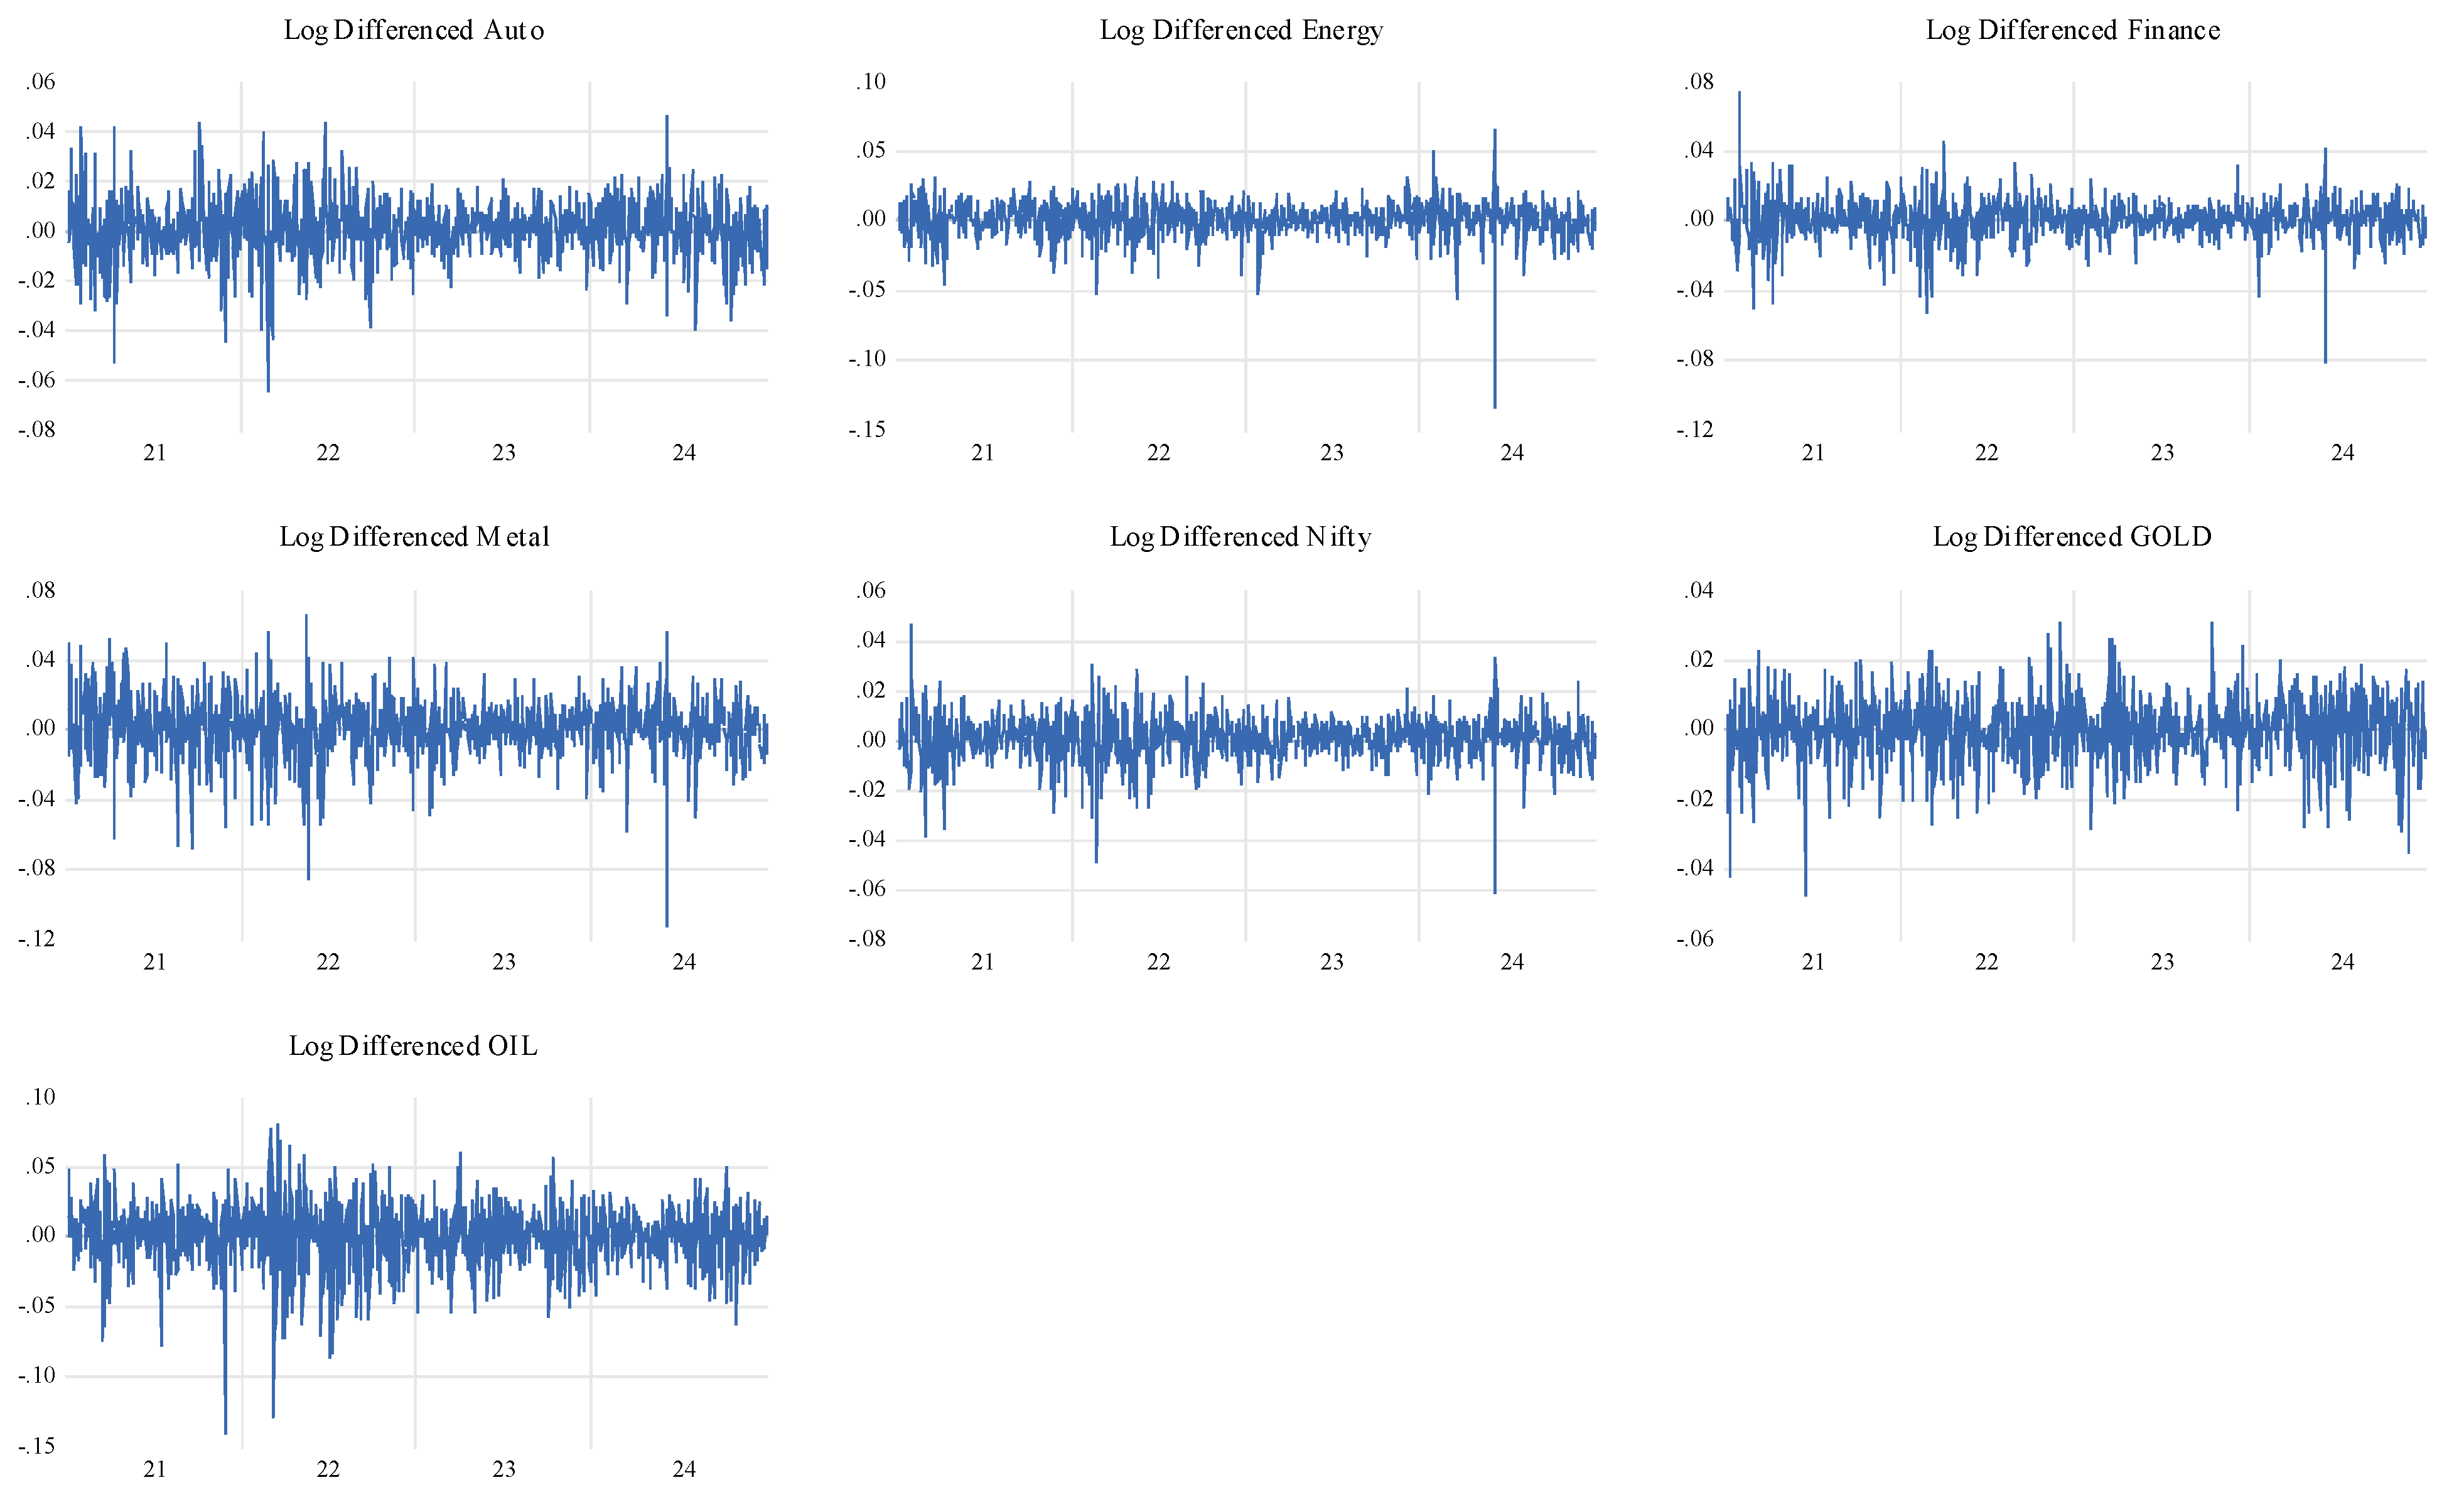
Figure 3.
Impulse response curve for the response of Sectors to the innovations of GOLD Future.
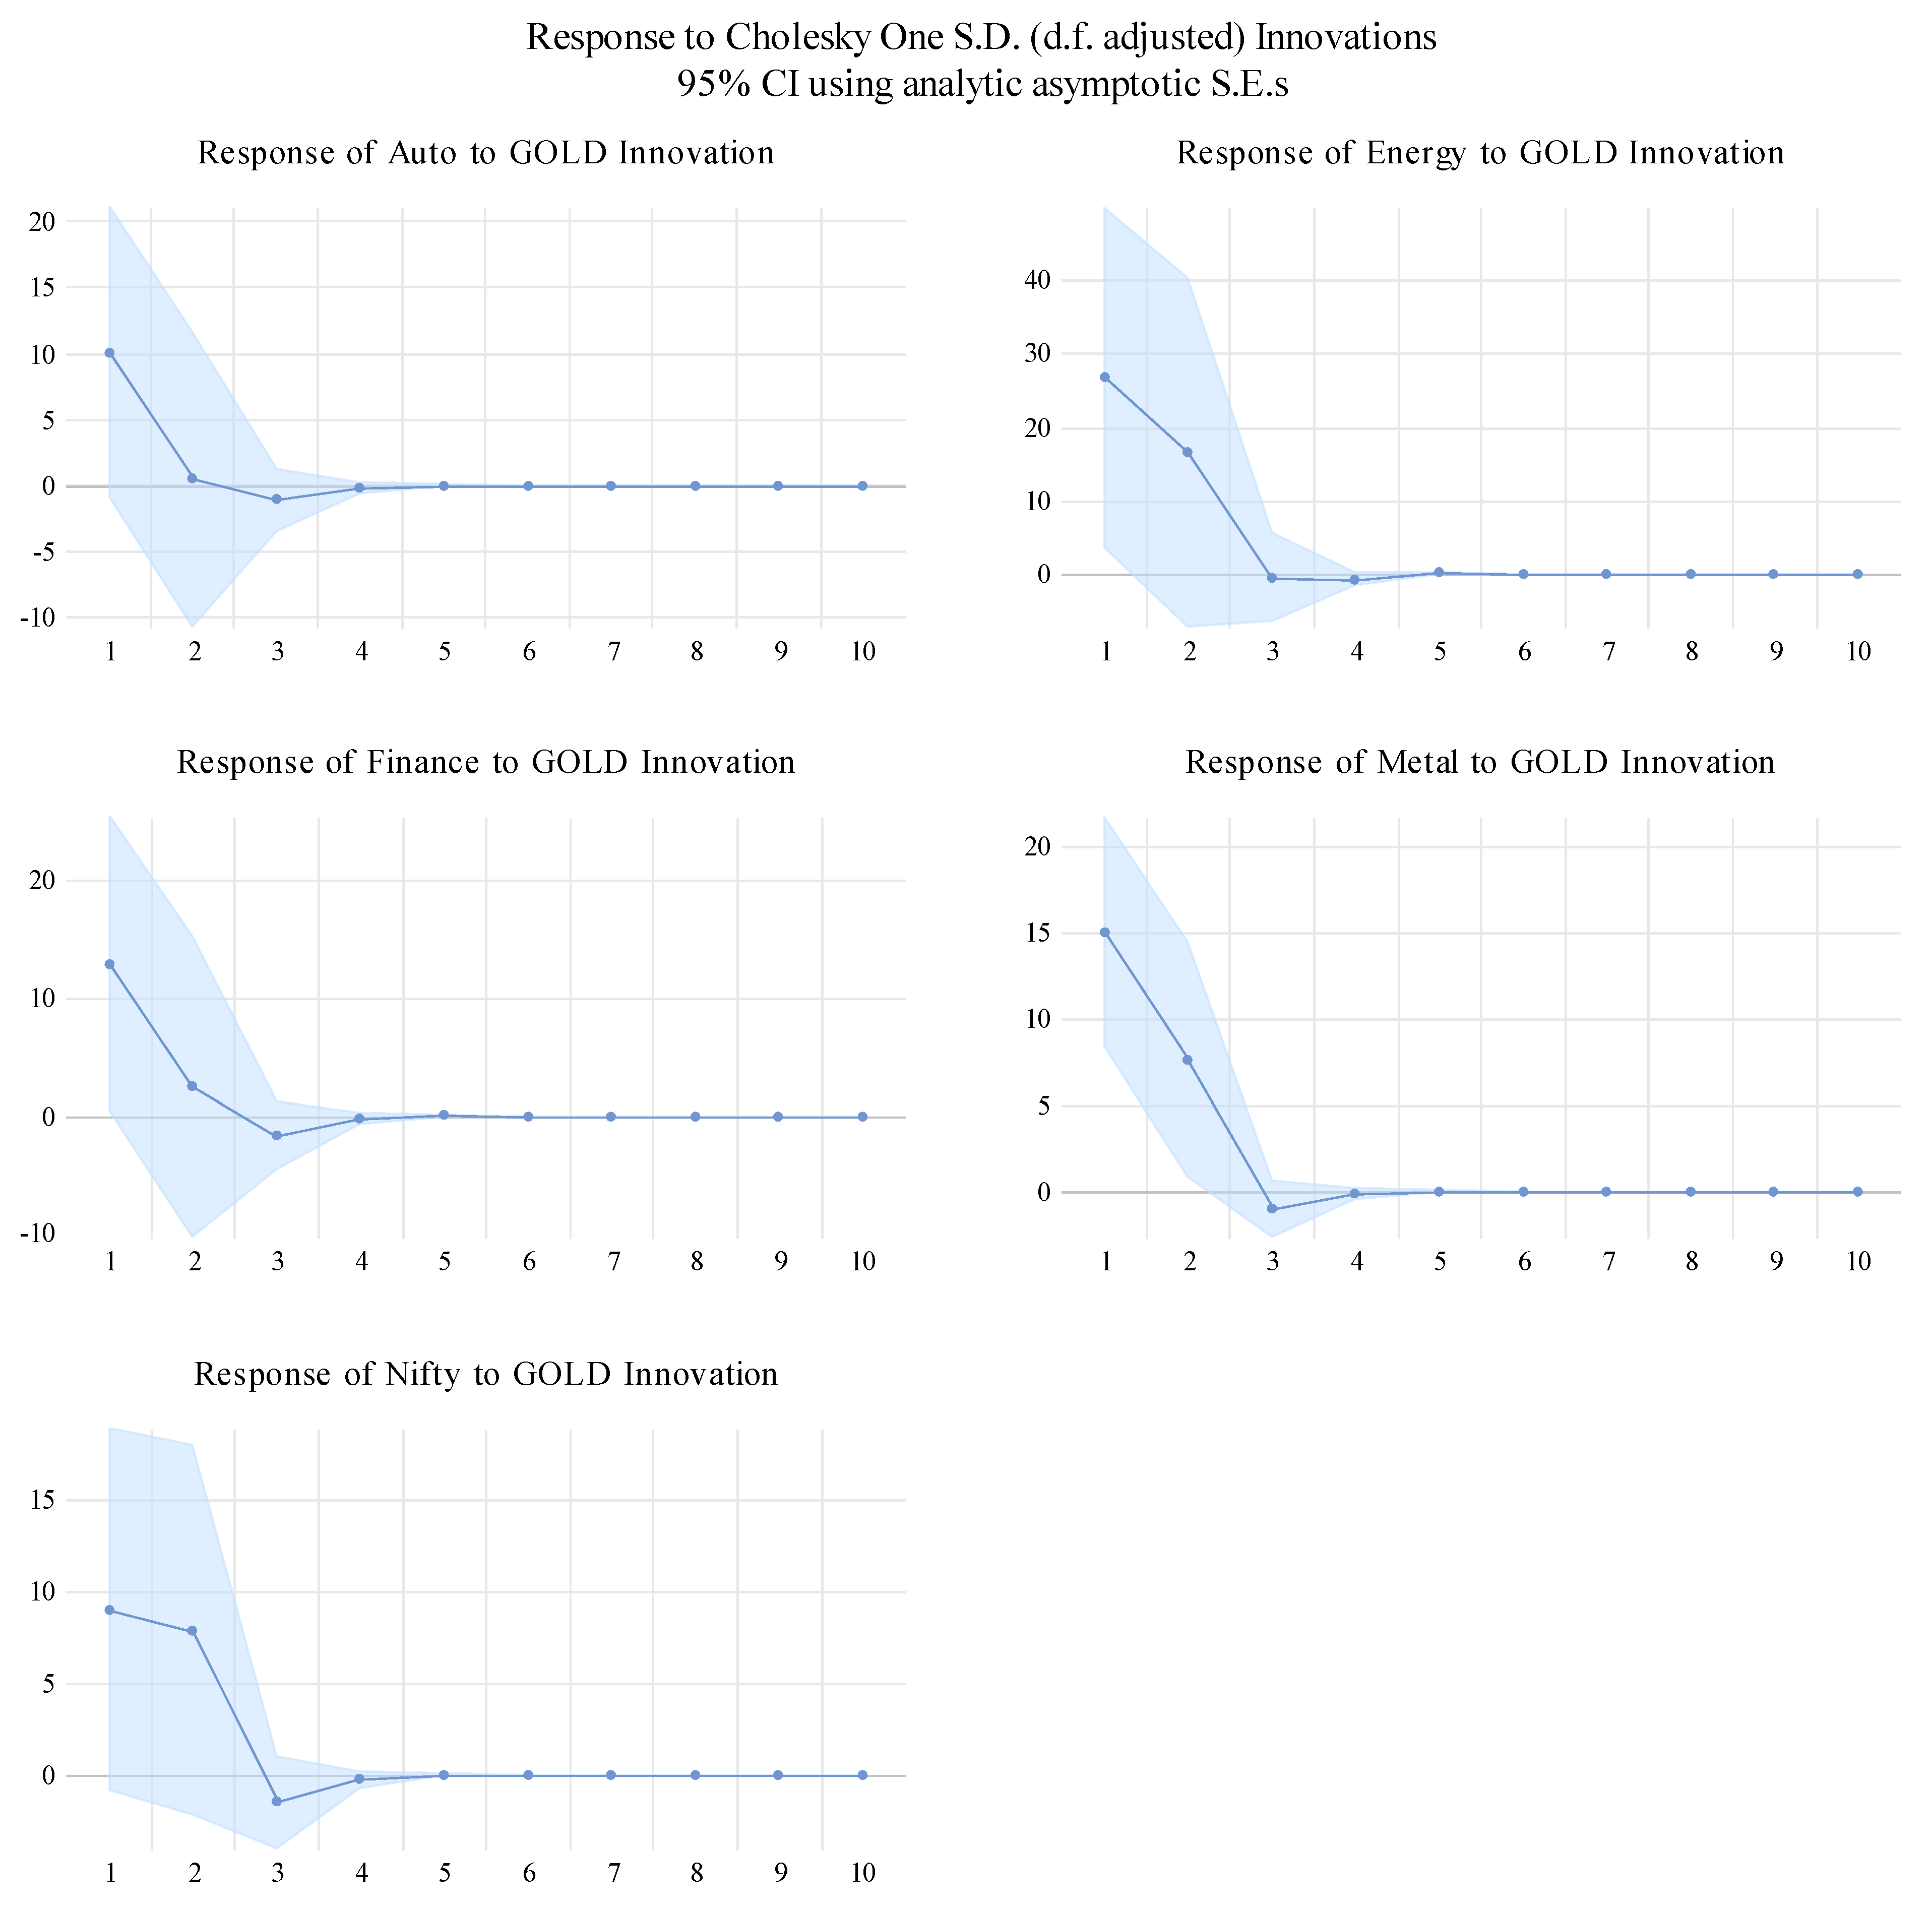
Figure 4.
Impulse response curve for the response of Sectors to the innovations of OIL Future.
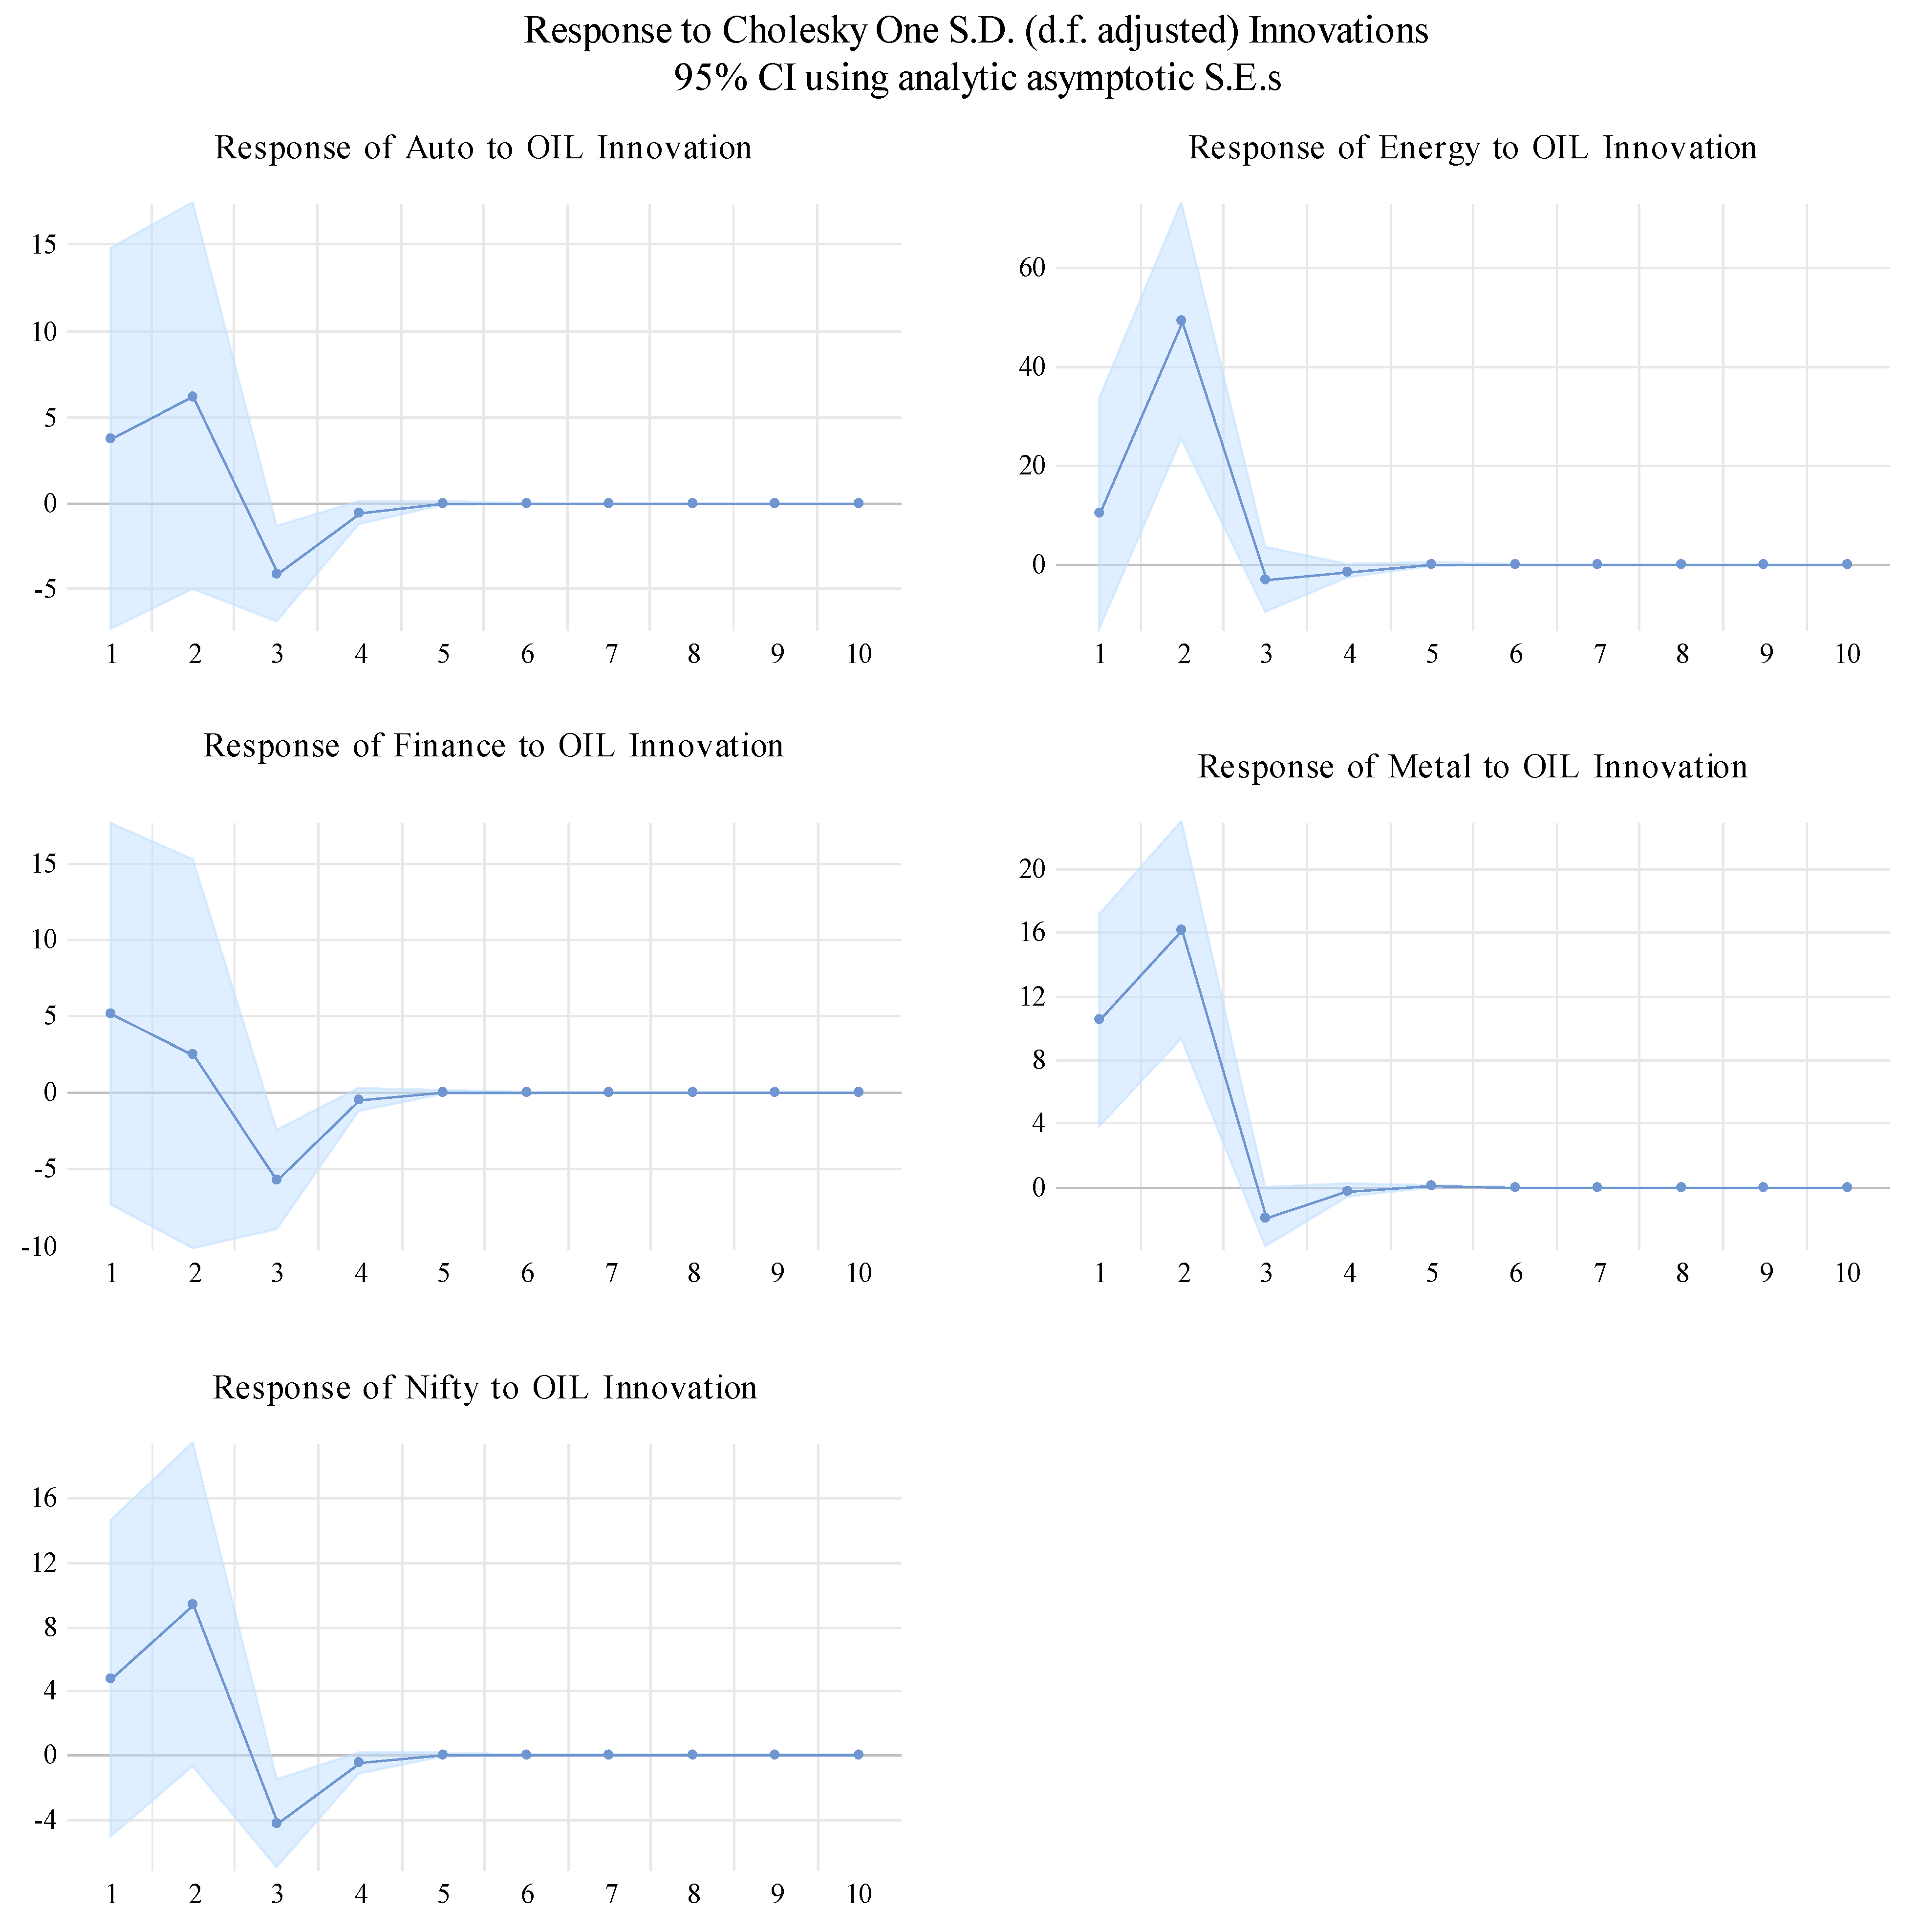
Figure 5.
Diebold-Yilmaz Spillover Index Plot (200-day windows, 10-step horizon.
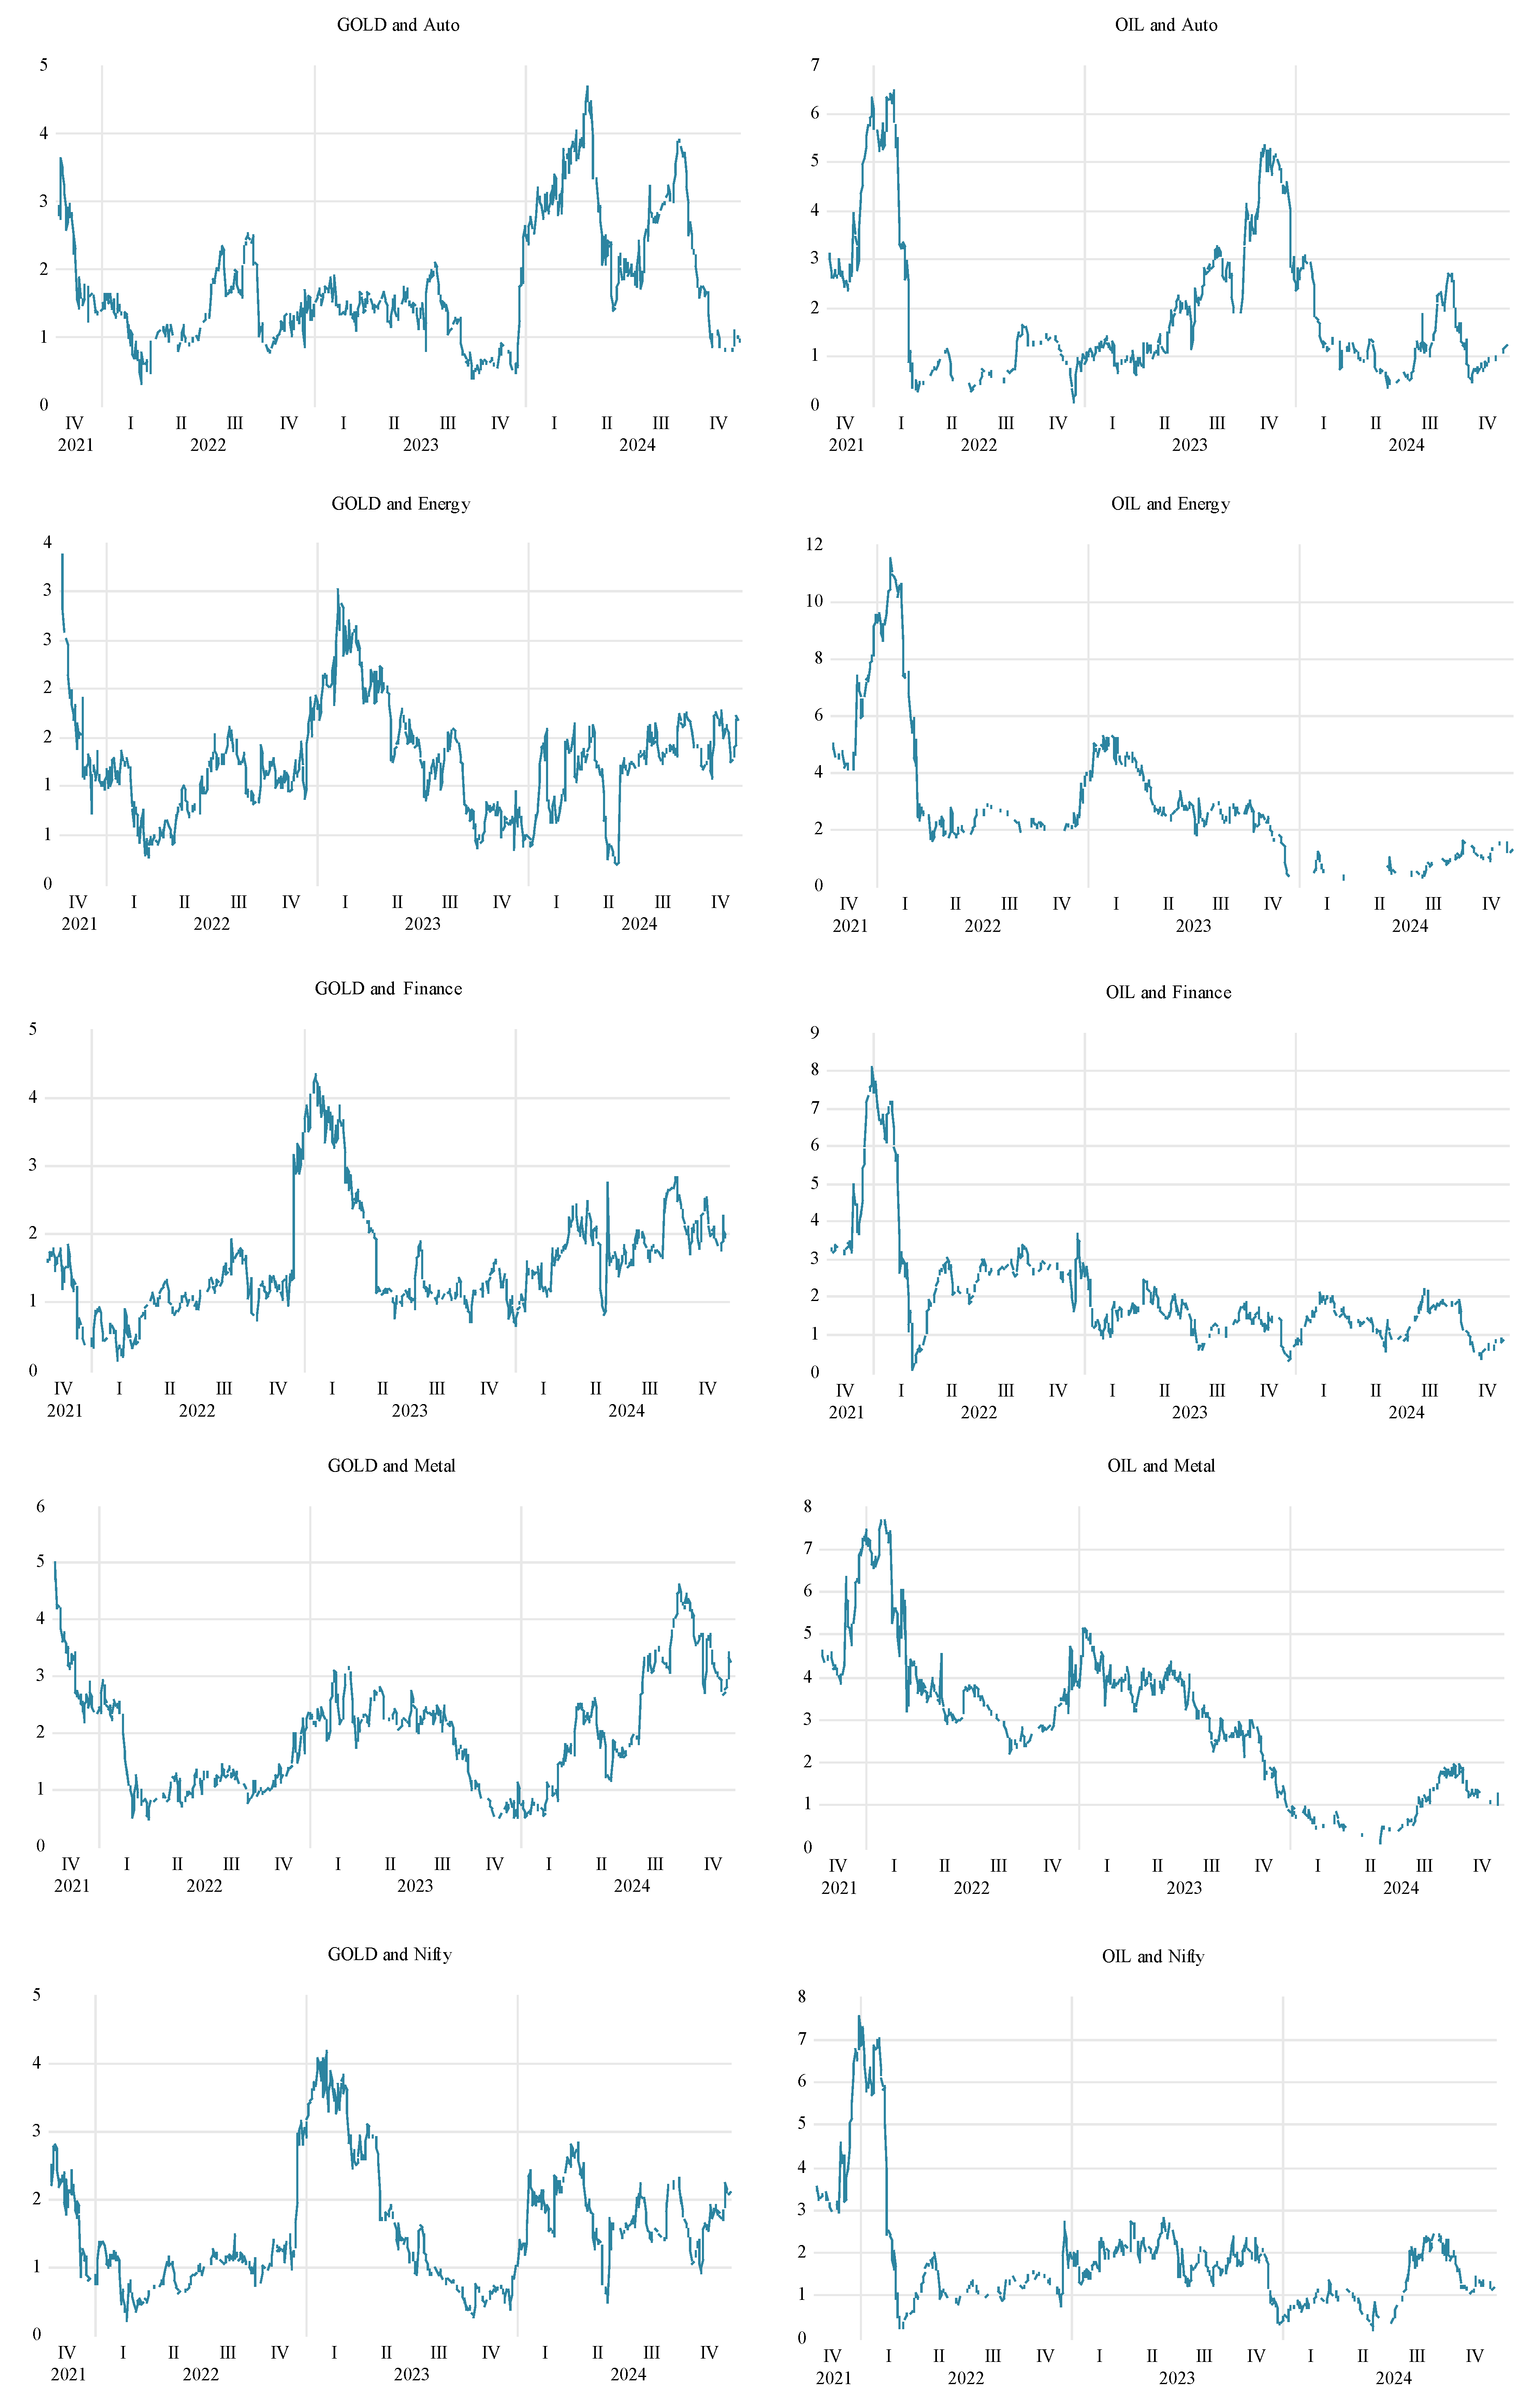
Table 1.
Descriptive statistics of the selected indices.
| Auto | Energy | Finance | Metal | Nifty | GOLD | OIL | |
|---|---|---|---|---|---|---|---|
| Mean | 13.090 | 17.579 | 8.039 | 5.204 | 9.292 | 0.638 | 0.023 |
| Median | 6.600 | 17.325 | 2.625 | 6.000 | 5.275 | 0.550 | 0.090 |
| Maximum | 1090.450 | 2726.400 | 1109.150 | 516.450 | 735.850 | 58.100 | 8.010 |
| Minimum | -1007.950 | -5357.800 | -1776.900 | -1068.400 | -1379.400 | -93.100 | -15.000 |
| Std. Dev. | 182.715 | 387.833 | 207.506 | 111.602 | 164.767 | 18.338 | 1.969 |
| Skewness | -0.392 | -2.614 | -0.646 | -1.133 | -0.710 | -0.602 | -0.814 |
| Kurtosis | 7.391 | 41.939 | 10.570 | 12.652 | 9.603 | 5.315 | 8.942 |
| Jarque-Bera | 858.918* | 66629.855* | 2546.040* | 4243.143* | 1968.809* | 293.884* | 1638.216* |
| ADF (Level) | -1.903 | -1.330 | -3.128 | -2.474 | -2.298 | -1.370 | -2.359 |
| ADF(1-Diff.) | -7.416* | -35.511* | -11.029* | -33.503* | -32.672* | -8.743* | -10.380* |
Table 2.
VAR Model presented for GOLD and all sectoral indices.
| GOLD | Auto | Energy | Finance | Metal | Nifty | |
|---|---|---|---|---|---|---|
| GOLD(-1) | -0.0616 | 0.0997 | 0.7442 | 0.2954 | 0.4304 | 0.5184 |
| 0.0315 | 0.3099 | 0.6553 | 0.3510 | 0.1886 | 0.2774 | |
| [-1.95638] | [ 0.32179] | [ 1.13558] | [ 0.84145] | [ 2.28212] | [ 1.86905] | |
| Auto(-1) | 0.0046 | 0.0938 | 0.1366 | 0.0682 | 0.0317 | 0.0589 |
| 0.0047 | 0.0462 | 0.0976 | 0.0523 | 0.0281 | 0.0413 | |
| [ 0.99076] | [ 2.03097] | [ 1.39952] | [ 1.30488] | [ 1.12975] | [ 1.42428] | |
| Energy(-1) | 0.0007 | -0.1118 | -0.2896 | -0.1260 | -0.0729 | -0.1244 |
| 0.0024 | 0.0241 | 0.0510 | 0.0273 | 0.0147 | 0.0216 | |
| [ 0.29638] | [-4.63883] | [-5.68278] | [-4.61740] | [-4.97144] | [-5.76622] | |
| Finance(-1) | 0.0052 | -0.0038 | 0.0162 | -0.0213 | 0.0201 | -0.0037 |
| 0.0063 | 0.0625 | 0.1322 | 0.0708 | 0.0380 | 0.0559 | |
| [ 0.81382] | [-0.06074] | [ 0.12232] | [-0.30032] | [ 0.52969] | [-0.06704] | |
| Metal(-1) | 0.0068 | -0.0261 | 0.5399 | -0.1302 | 0.0687 | -0.0195 |
| 0.0078 | 0.0763 | 0.1615 | 0.0865 | 0.0465 | 0.0683 | |
| [ 0.87924] | [-0.34187] | [ 3.34372] | [-1.50547] | [ 1.47893] | [-0.28474] | |
| Nifty(-1) | -0.0140 | 0.1293 | 0.1082 | 0.2226 | 0.0106 | 0.1613 |
| 0.0108 | 0.1064 | 0.2249 | 0.1205 | 0.0647 | 0.0952 | |
| [-1.29530] | [ 1.21549] | [ 0.48083] | [ 1.84764] | [ 0.16442] | [ 1.69375] | |
| C | 0.6584 | 12.5679 | 16.2142 | 7.9092 | 5.0002 | 8.8685 |
| 0.5722 | 5.6343 | 11.9161 | 6.3824 | 3.4295 | 5.0434 | |
| [ 1.15068] | [ 2.23060] | [ 1.36070] | [ 1.23921] | [ 1.45801] | [ 1.75844] |
Table 3.
VAR Model presented for OIL and all sectoral indices.
| OIL | Auto | Energy | Finance | Metal | Nifty | |
|---|---|---|---|---|---|---|
| OIL(-1) | 0.017385 | 3.443406 | 23.22171 | 2.027948 | 8.112974 | 4.99203 |
| 0.03134 | 2.871299 | 6.037013 | 3.255168 | 1.734898 | 2.571482 | |
| [ 0.55474] | [ 1.19925] | [ 3.84656] | [ 0.62299] | [ 4.67634] | [ 1.94130] | |
| Auto(-1) | 0.000353 | 0.0946 | 0.14253 | 0.069429 | 0.034304 | 0.061175 |
| 0.000503 | 0.046127 | 0.096985 | 0.052294 | 0.027871 | 0.041311 | |
| [ 0.70041] | [ 2.05084] | [ 1.46961] | [ 1.32766] | [ 1.23082] | [ 1.48086] | |
| Energy(-1) | -0.00039 | -0.11097 | -0.28412 | -0.12554 | -0.07098 | -0.12317 |
| 0.000263 | 0.024092 | 0.050653 | 0.027312 | 0.014557 | 0.021576 | |
| [-1.47729] | [-4.60621] | [-5.60910] | [-4.59656] | [-4.87634] | [-5.70848] | |
| Finance(-1) | 0.000589 | -0.00295 | 0.022688 | -0.01804 | 0.024383 | 0.001771 |
| 0.00068 | 0.062344 | 0.131081 | 0.070679 | 0.03767 | 0.055834 | |
| [ 0.86614] | [-0.04733] | [ 0.17308] | [-0.25525] | [ 0.64729] | [ 0.03172] | |
| Metal(-1) | 0.001114 | -0.03318 | 0.494394 | -0.12701 | 0.058128 | -0.0181 |
| 0.000831 | 0.07616 | 0.160128 | 0.086342 | 0.046017 | 0.068207 | |
| [ 1.33971] | [-0.43561] | [ 3.08748] | [-1.47101] | [ 1.26317] | [-0.26536] | |
| Nifty(-1) | -0.00084 | 0.128487 | 0.101064 | 0.216407 | 0.004034 | 0.151043 |
| 0.001157 | 0.106036 | 0.222944 | 0.120212 | 0.064069 | 0.094963 | |
| [-0.72607] | [ 1.21173] | [ 0.45332] | [ 1.80022] | [ 0.06297] | [ 1.59053] | |
| C | 0.021576 | 12.56595 | 16.2421 | 8.043138 | 5.107227 | 9.079113 |
| 0.06143 | 5.62809 | 11.83327 | 6.38052 | 3.400608 | 5.040414 | |
| [ 0.35123] | [ 2.23272] | [ 1.37258] | [ 1.26058] | [ 1.50186] | [ 1.80126] |
Table 4.
ADCC-GARCH Model.
| Indices | Parameters | Estimate | Std. Error | t-value | Sig. |
|---|---|---|---|---|---|
| Auto | μ | 0.0010 | 0.0004 | 2.3907 | 0.017 |
| AR1 | 0.3146 | 0.3548 | 0.8867 | 0.375 | |
| MA1 | -0.2511 | 0.3460 | -0.7255 | 0.468 | |
| ω | 0.0000 | 0.0000 | 0.1175 | 0.906 | |
| α1 | 0.0657 | 0.1979 | 0.3319 | 0.740 | |
| β1 | 0.9187 | 0.2338 | 3.9301 | 0.000 | |
| Energy | μ | 0.0010 | 0.0005 | 2.0334 | 0.042 |
| AR1 | 0.9042 | 0.0952 | 9.4941 | 0.000 | |
| MA1 | -0.8738 | 0.1105 | -7.9074 | 0.000 | |
| ω | 0.0000 | 0.0000 | 2.6261 | 0.009 | |
| α1 | 0.2222 | 0.0666 | 3.3359 | 0.001 | |
| β1 | 0.4771 | 0.1469 | 3.2486 | 0.001 | |
| Finance | μ | 0.0006 | 0.0003 | 1.7607 | 0.078 |
| AR1 | -0.1356 | 0.1542 | -0.8792 | 0.379 | |
| MA1 | 0.1978 | 0.1445 | 1.3691 | 0.171 | |
| ω | 0.0000 | 0.0000 | 2.5524 | 0.011 | |
| α1 | 0.1088 | 0.0202 | 5.3851 | 0.000 | |
| β1 | 0.8488 | 0.0314 | 27.0056 | 0.000 | |
| Metal | μ | 0.0011 | 0.0005 | 2.3131 | 0.021 |
| AR1 | -0.8764 | 0.1186 | -7.3875 | 0.000 | |
| MA1 | 0.8557 | 0.1289 | 6.6402 | 0.000 | |
| ω | 0.0000 | 0.0000 | 1.2522 | 0.211 | |
| α1 | 0.1569 | 0.0874 | 1.7958 | 0.073 | |
| β1 | 0.6969 | 0.1848 | 3.7720 | 0.000 | |
| Nifty | μ | 0.0008 | 0.0003 | 3.1082 | 0.002 |
| AR1 | -0.1435 | 0.2159 | -0.6650 | 0.506 | |
| MA1 | 0.1962 | 0.2086 | 0.9407 | 0.347 | |
| ω | 0.0000 | 0.0000 | 1.1233 | 0.261 | |
| α1 | 0.1345 | 0.0317 | 4.2364 | 0.000 | |
| β1 | 0.8207 | 0.0422 | 19.4436 | 0.000 | |
| GOLD | μ | 0.0002 | 0.0003 | 0.8673 | 0.386 |
| AR1 | 0.1738 | 0.1713 | 1.0149 | 0.310 | |
| MA1 | -0.2229 | 0.1686 | -1.3223 | 0.186 | |
| ω | 0.0000 | 0.0000 | 2.6143 | 0.009 | |
| α1 | 0.0020 | 0.0002 | 12.3944 | 0.000 | |
| β1 | 0.9957 | 0.0002 | 5546.0452 | 0.000 | |
| OIL | μ | 0.0009 | 0.0006 | 1.3661 | 0.172 |
| AR1 | -0.3345 | 0.2131 | -1.5700 | 0.116 | |
| MA1 | 0.3705 | 0.2073 | 1.7868 | 0.074 | |
| ω | 0.0000 | 0.0000 | 2.8025 | 0.005 | |
| α1 | 0.0947 | 0.0199 | 4.7605 | 0.000 | |
| β1 | 0.8701 | 0.0211 | 41.2270 | 0.000 | |
| Joint | DCC- α1 | 0.0195 | 0.0040 | 4.8484 | 0.000 |
| Joint | DCC- β1 | 0.8876 | 0.0232 | 38.2811 | 0.000 |
Disclaimer/Publisher’s Note: The statements, opinions and data contained in all publications are solely those of the individual author(s) and contributor(s) and not of MDPI and/or the editor(s). MDPI and/or the editor(s) disclaim responsibility for any injury to people or property resulting from any ideas, methods, instructions or products referred to in the content. |
© 2025 by the authors. Licensee MDPI, Basel, Switzerland. This article is an open access article distributed under the terms and conditions of the Creative Commons Attribution (CC BY) license (http://creativecommons.org/licenses/by/4.0/).
Copyright: This open access article is published under a Creative Commons CC BY 4.0 license, which permit the free download, distribution, and reuse, provided that the author and preprint are cited in any reuse.


