
Submitted:
17 January 2025
Posted:
20 January 2025
You are already at the latest version
Preprints on COVID-19 and SARS-CoV-2
Abstract
Amid heightened geopolitical risk (GPR) shocks this study empirically investigates the dynamic
interconnectedness among key commodities—namely crude oil, natural gas, and gold
markets—to evaluate their potential resilience to unfolding crises, including the Russia-Ukraine
conflict, Middle Eastern supply chain disruptions, the COVID-19 pandemic, and the ongoing
global economic recession. Utilizing a comprehensive daily dataset spanning January 2, 2008, to
November 30, 2024, this research examines a significant time period that encompasses multiple
global and regional financial crises. For empirical validation, the study employs the advanced
econometric framework of TVP-VAR modeling. The findings reveal that commodity indices and
gold primarily function as transmitters of volatility and spillovers, while the crude oil and natural
gas—serves as the principal recipient of external shocks. The results from net—spillover
estimation highlight that GPR, especially those arising from the United States and Russian
Federations exert a more pronounced influence on the interconnectedness of commodity markets
compared to GPR at global-level. This study observed that net volatility spillovers varies across
underlined markets where GPR-Russ found to negatively influence net spillovers in the energy
sector, while exerting a positive effect on gold markets. The study provides practical
market—based insights for policymakers, investors, and stakeholders seeking to navigate periods
of uncertainty where this study underscores the critical role of global and regional GPR in
shaping the interconnected dynamics of global commodity markets.
Keywords:
Geopolitical Risk
; Ukraine–Russia War
; COVID-19
; Commodity
; Crude Oil
; Natural Gas
; Gold
1. Introduction
Since the onset of the global financial crisis, the COVID-19 pandemic and escalating global and regional geopolitical risks (GPR) in response to these multiple crises the commodity prices have undergone significant fluctuations. Governed by the fundamental principles of supply and demand, the commodity market price variations are primarily driven by macroeconomic supply-demand dynamics. These fluctuations exhibit distinct characteristics across different economic cycles, shaped by the temporal and frequency-specific stages of economic development and market responses. During periods of recession and recovery after COVID-19 pandemic, market activities remain subdued, whereas economic expansion and stagflation phases are marked by increased demand and heightened market activity. The evolving configuration of the global economic landscape, particularly influenced by emerging economies, has intensified commodity price volatility by reshaping patterns of demand. Similarly, uncertainty shocks have played a pivotal role in driving turbulence within commodity markets. At this crucial timeline this study assess the impact of multiple crises such as COVID-19 and GPR shocks and the resilience from commodity, crude oil, natural gas, and gold markets using Network Connectedness estimations.
Previous research studies predominantly examined the influence of economic uncertainty on stock markets [1,2,3,4,5]. Recently GPR and associated uncertainty has emerged as a particularly critical factor for financial market. Geopolitical tensions, which have become increasingly frequent in resource-rich regions, often lead to substantial disruptions in commodity markets [6]. For example the Russia-Ukraine conflict, that began in February 2022 considered as major shock transmitter [7]. Meanwhile the Russia and Ukraine are the major global exporter of commodities and energy indices in this critical situation Russia’s geopolitical tension (GPR-Russ) have triggered sharp increases in the prices of crude oil, gold and natural gas. These unforeseen geopolitical events have profoundly affected commodity supply-demand dynamics, resulting in heightened market volatility [8,9,10]. This study specifically evaluates the impact of COVID-19 and GPR on the commodity market, with a particular focus on commodity market, crude oil, natural gas, and precious metals. The findings aim to enhance understanding of how such crises shape market behaviors, providing insights for policymakers, investors, and other stakeholders.
Economic policy uncertainty frequently triggers the policy level changes and adjustments that significantly influence investor sentiment across various markets including financial and commodity sectors [11,12]. GPR exacerbate uncertainty, often intensifying extreme events that lead to abnormal market volatility and pose significant challenges to the long-term stability of commodity markets [13]. Despite the critical importance of GPR, most existing studies focus on the effects of geopolitical uncertainty on individual markets. For example, [14,15] emphasizes this relationship among conventional financial assets during Russian Ukraine conflict focusing on Russian commodity market, while [16] demonstrate that persistent increases in geopolitical uncertainty drive up energy commodity prices. Similarly, Khan et al. [17] explored global GPR varying impacts on oil prices over different time periods.
In term of empirical assessment commodity markets are inherently more complex compared to other markets, such as oil and energy. This complexity arises from several factors, including financialization, storability, transportation logistics, supply flexibility, and dependency on weather conditions, all of which contribute to the distinct characteristics of individual commodity markets [18]. Such intricacies underscore the importance of analyzing spillover effects between various commodity markets in the context of GPR. However, assessment of commodity markets under GPR at conditions of global and regional levels remains limited, with even fewer studies addressing their dynamic relationships comprehensively.
In response to the rapid changes in global and regional commodity markets, this study conducts an empirical assessment of the network connectedness among key commodities, including crude oil prices, gold futures and natural gas prices. It employs an enhanced Time-Varying Parameter Vector Autoregressive (TVP-VAR) estimation method proposed by Diebold and Yilmaz [19,20,21] to evaluate the interconnectedness of these critical assets. The time period selected for the analysis enhances the practical relevance of the findings, as the data reflect ongoing market dynamics and crises, ensuring their applicability to contemporary decision-making processes.
This study aims to address a significant gap in the literature by investigating the interconnectedness within the commodity sector during a period of unprecedented challenges. The global commodity market continues to grapple with the long-term repercussions of the COVID-19 pandemic (2020) and geopolitical tensions such as the conflict between Russia and Ukraine (2022). These events have profoundly affected global commodity supplies, particularly in food commodities [22]. Furthermore, the study examines the supply chain disruptions caused by GPR, including the recent unrest in the Middle East, which disrupted operations around the Suez Canal—a critical trade route—in 2024 [23].
To further explore the intricate dynamics of commodity markets, the study utilizes a network volatility and spillover estimation model to analyze the relationship between GPR and commodity market behavior across varying levels of GPR. This methodological approach provides several key contributions to the literature. By adopting the improved Diebold and Yilmaz method, the study offers real-time measurements of volatility and spillovers while addressing limitations of traditional approaches. Specifically, this advanced methodology eliminates the influence of subjective window-width selection and prevents the loss of initial sample data, ensuring robust and reliable results.
The TVP-VAR estimation framework facilitates a more precise evaluation of dynamic connectedness among the examined commodities. The findings not only quantify volatility spillovers across commodity markets but also shed light on the implications of GPR, thereby offering valuable insights for policymakers, investors, and stakeholders navigating the complexities of contemporary commodity markets. In contrast to prior research that predominantly examines the effects of GPR on stock market or oil market volatility, or focuses on price fluctuations within individual markets, this study adopts a novel approach. It incorporates GPR at three levels—global, Russian, and U.S.—as a determinant of dynamic volatility spillovers across multiple commodity markets. This innovative approach integrates mixed-frequency historical data analysis by utilizing daily frequency data to explore the interplay between GPR and volatility spillover across underlined assets.
The empirical findings of this study reveal that rising global geopolitical risk (GPR-Global) significantly intensifies the overall interconnectedness among commodity markets. However, the effects of GPRs originating from Russia (GPR-Russ) and the U.S. (GPR-USA) vary across different commodity categories. For instance, GPR stemming from Russia negatively impacts energy markets, whereas U.S.-related GPR exerts a detrimental effect on precious metals markets. These results underscore the nuanced nature of GPR transmission and its differentiated impacts on commodity markets.
The structure of the research study is set as Section 2 provides review literature, establishing the theoretical foundation for the analysis. Section 3 describes the data utilized and details the estimation methodology employed to quantify GPR and analyze its implications. Section 4 delves into the relationship between GPR and commodity market interconnectedness, offering detailed empirical insights. Finally, Section 5 presents the study’s conclusions, policy implications, limitations, and suggestions for future research directions.
2. Review of Literature
Geopolitical affairs profoundly influence economic conditions and market performance, particularly through its impact on macroeconomic stability and investor confidence [24]. For example, major geopolitical events such as the September 11 attacks led to a 7% drop in the S&P 500 index, while gold futures rose by 6.5% as a safe-haven asset. Similarly, the Madrid train bombings, Paris attacks, BR-Exit, COVID-19 pandemic and GPR escalating between Russia and Ukraine 2021 have all amplified GPR, significantly affecting global financial markets. Numerous empirical studies have investigated both the combined and individual effects of GPRs, revealing strong correlations with asset prices [25], financial market dynamics and stock returns [26], market volatility and spillovers [27], and politically sensitive sectors such as energy markets [28]. These findings highlight the pervasive impact of geopolitical uncertainty across various facets of economic activity.
Geopolitical risk not only influence corporate performance but also affects government investment instruments. For instance, they can increase corporate debt costs [29] and shape investor sentiment and trading behaviors in financial markets [30,31]. Decision-makers, including entrepreneurs, market participants, and policymakers, recognize GPR as a critical determinant of investment strategies and stock market trends [32]. During the COVID-19 pandemic, the crude oil market showcased its pivotal role in global economic recovery through initiatives such as OPEC-led negotiations and collaborative actions by major oil-producing nations. Policymakers faced unprecedented challenges during this crisis, particularly due to the pervasive uncertainty surrounding the pandemic's long-term economic impacts [33,34].
The exploration of commodity price volatility began with the seminal work of [35], which identified synchronized trends in commodity prices. Their findings highlighted potential volatility linkages and underscored the use of commodities as tools for hedging and diversification. This discovery catalyzed a wave of research into the spillover effects of commodities, focusing on price dynamics, net returns, and volatility behavior across various commodity categories [36,37,38]. Recent studies, such as [39], have primarily examined volatility spillovers within individual commodities, revealing the distinct characteristics of different commodity classes. The gold market is an exception, as it is typically regarded as a hedging and diversification instrument, deviating from general commodity trends [31].
Moreover, commodities such as crude oil, which serve as critical inputs for production processes, are especially vulnerable to demand shocks. This susceptibility results in closely linked price dynamics across related commodity markets [20]. Understanding these interdependencies is vital for stakeholders aiming to navigate the complexities of commodity markets during periods of heightened economic and geopolitical uncertainty. The price variations of certain commodities, such as crude oil, natural gas, and gold, are significantly influenced by supply-side factors, often driven by unique determinants specific to each commodity. For instance, the supply of energy products is subject to short-term influences such as GPRs and international relations. Factors like sanctions, national policies, and regulatory frameworks play a pivotal role in shaping price dynamics. In contrast, the supply of precious metals such as gold and crude oil is largely governed by the export policies of major producing nations [40].
Since 2004, investments in commodity futures fostered an attractive market creating synergies across various sectors. Commodities such as industrial metals, agriculture, and livestock have increasingly become investable assets. This financialization has amplified cross-sectorial volatility and strengthened co-movements among commodities [41]. Among these, crude oil exhibits the highest degree of financialization, enabling shocks in the crude oil sector to propagate to other sectors, including industrial metals, energy, and agricultural commodities [20]. Over time, the interconnections between markets—particularly crude oil, energy, precious metals, and natural gas—have intensified [42,43,44]. Some investigations have focused on the relationships between conventional financial assets, such as stocks, bonds, and crude oil commodities [45,46]. Others have examined broader cross-category interactions, incorporating digital assets such as cryptocurrencies and their connections with commodity markets [47,48]. The financialization of commodities has further expanded research into spillovers and volatilities between commodity and financial markets, with a focus on risk assessment and management [49,50]. This evolving body of research underscores the growing complexity of commodity markets and their integration with broader financial systems, emphasizing the need for comprehensive risk management strategies in a rapidly changing global economic environment.
In the realm of econometric estimation, significant advances in analytical techniques have facilitated a deeper understanding of commodity market fluctuations and provided valuable insights for future price prediction. Early methodologies included co-integration and Granger causality analyses, which were instrumental in exploring long-term relationships and causality within commodity markets [51,52]. More recently, wavelet coherence estimation has enabled time-frequency domain analysis, offering a nuanced view of market dynamics over time [53,54,55]. Meanwhile, traditional models such as VAR and GARCH remain widely used for examining market volatility and structural dynamics [56]. Since the increasing GRP creates concerns about the interconnectedness of commodity markets with other financial assets have driven research toward systematic network analyses of volatility spillover effects. Diebold et al. [57,58] pioneered the Time-Varying Parameter Vector Autoregressive (TVP-VAR) estimation framework, offering a robust empirical approach for analyzing dynamic connectedness. This innovation has been complemented by multi-time-frequency network techniques developed by [59] and further extensions of the [18,19,20,60] Diebold & Yilmaz method.
Geopolitical uncertainty faced to single market volatility and inter-market spillover effects has also been extensively studied. For example, [61] analyzed conflicts between 1974 and 2004, linking them to financial assets such as stocks, oil, and commodities. Their findings revealed that international conflicts often strengthen the U.S. currency role as a safe-haven asset, while having a limited effect on gold futures prices. Similarly, [62,63,64] utilized enhanced event study methodologies to examine the effects of recent crises. Their results indicate that such events significantly elevate uncertainty in commodity markets, further emphasizing the importance of understanding GPR in the context of market volatility and interconnectedness. These advancements underscore the critical need for sophisticated econometric tools to analyze the increasingly complex relationships between GPR, market volatility, and inter-market dynamics in a globalized economic landscape.
The existing literature on commodity markets predominantly examines the relationship between uncertainties and individual commodities, often neglecting a holistic perspective that captures the interconnected impacts of uncertainties across multiple commodity markets. This study aims to bridge this gap by exploring the dynamic connectedness among key commodities—crude oil, natural gas, and gold—under conditions of peak GPR transmission at both global and regional levels. Expanding beyond the metals industry, Colon et al. [65] examined the influence of macroeconomic uncertainty on commodity prices, highlighting that industrial markets exhibit heightened sensitivity to such uncertainty. Dyck et al. [66] extended this line of inquiry by exploring various economic uncertainties, identifying credit risk potentials and financial firms’ stock fluctuations as critical predictors of commodity market behavior. Additionally, studies by [67,68] validated the predictive power of GPR on energy indices and price volatility within precious metal markets. These findings underscore the need for a comprehensive approach that captures cross-commodity linkages and their responses to geopolitical and macroeconomic uncertainties, particularly under heightened risk scenarios. This study contributes to the evolving discourse by providing insights into the interconnectedness of commodity markets, offering implications for policymakers, investors, and stakeholders navigating volatile global markets. GPR is one of the most significant transmitters of uncertainty across financial assets, with extensive implications for both commodity and energy markets [69,70,71]. Despite its critical importance, research exploring the link between GPR and commodity markets remains limited, especially in the context of the ongoing geopolitical crises that heighten such risks.
For example, [72] utilized basic GARCH estimations to analyze the influence of GPR on energy, commodities market but their study did not address the interconnectedness among different commodities. Similarly, Liu et al. [73] applied the [19] framework to examine the linkages between GPR, economic policy uncertainty (EPU), and price fluctuations in international commodity markets. By focusing on representative commodities like soybean, crude oil futures, and gold, their findings revealed macroeconomic factors influencing commodity markets but fell short of exploring the direct influence of GPR on the interconnectedness of these markets. In contrast, the present study situates GPR at a global level, alongside GPR originating from Russia and the United States, as critical exogenous shock factors influencing the interconnectedness of commodity markets. This approach facilitates a more precise, real-time analysis of how these GPRs impact commodity market dynamics.
The existing body of research addressing spillover effects between GPR and commodity markets, particularly with GPR positioned as a global driver of market connectedness remains sparse. This paper fills these gaps by providing a comprehensive and empirical investigation into the interplay between GPR—both globally and regionally (Russia and the USA)—and the interconnectedness of commodity markets. The findings offer a more nuanced understanding of the mechanisms through which GPRs propagate across commodity markets, contributing valuable insights for policymakers, investors, and market participants navigating an increasingly volatile global landscape.
3. Methods, Model and Materials
Data and Materials
To examine the strategic commodity indices deviations and analyses dynamic changes in crude oil price volatility, as well as variations in natural gas and gold prices this study empirically examines their responses to multiple crises such as COVID-19 pandemic and the Russia-Ukraine conflict started in 2022 during periods of heightened GPR this study provides significant insights. The S&P commodity index (COMD) was selected as a benchmark due to its status as the most widely tracked global commodity index, with the ability to attract substantial investor capital following the studies [74,75]. The proposed index for commodities comprises five major commodity market sectors, ensuring broad representation. To represent conventional energy, this study employs WTI crude oil futures and natural gas futures, while for precious and industrial metals, the gold Index is used. Table 1 provides a detailed description of the data sources and variables utilized. The S&P commodity index incorporates production-weighted categories, making it a robust indicator of the beta coefficient for commodity markets [76]. The study utilizes total return data across all selected variables, including crude oil, natural gas, gold, and the composite commodity index. This study selected an important time period to this study spanning January 2008 to November 30, 2024 carefully chosen to capture the volatility and spillover effects of multiple global crises, such as the 2008 global financial crisis, European banking Crisis (2009–12), Chinese Stock Market Crash (2015–16) while the most distractive economic downturn of COVID-19 Pandemic (2020), and the ongoing Russia-Ukraine conflict (2022-present) and the emerging Middle East Crisis (2024) are examined in this study.
To ensure reliability to the estimation frequency data volatility calculated using closing prices from Monday to Friday excluding weekends with providing a 5-day-per-week dataset. These calculations enable precise volatility and spillover assessments, reflecting how GPRs transmitted by dominant global players, such as the USA and Russia, impact commodity markets following the seminal work [76]. The Time-Varying Parameter Vector Autoregressive (TVP-VAR) model proposed by [18,19,20] is applied to evaluate the commodity market’s responses to GPR. Figure 1 presents weekly time series volatility for each commodity market. The findings reveal distinct volatility patterns, with notable peaks corresponding to specific global crises. For instance, the commodity and natural gas markets exhibit their highest volatility during the COVID-19 pandemic and the Russia-Ukraine conflict 2022 respectively that reflects the profound impacts of these crises on market dynamics. This comprehensive analysis underscores the importance of understanding commodity market behavior under heightened GPR that provides valuable insights for policymakers and investors in navigating such turbulent periods.
4. Results and Discussion
4.1. Preliminary Model Estimation
To validate the suitability of the collected data for empirical analysis, this study conducted several pre-estimation assessments, including summary statistics, Skewness, Kurtosis, JB and the Augmented Dickey-Fuller (ADF) test, among other diagnostic evaluations presented in Table 2. The descriptive statistics for the volatility series reveal that the commodity market exhibits the highest mean volatility, followed by other markets with comparatively lower mean values. Following geopolitical risk (GPR) events, the commodity index demonstrates the largest standard deviation in volatility, with the energy and gold markets ranking next in order. Notably, the standard deviations for all markets exceed 50%, yet remain lower than their respective means. This pattern suggests that the volatility distribution across these markets approximates a normal distribution.
The results of the Augmented Dickey-Fuller (ADF) test confirm that all volatility series are stationary, thereby validating their suitability for the application of network connectedness volatility and spillover empirical analyses. Furthermore, Skewness and kurtosis analyses indicate that the volatility distributions exhibit Skewness and "fat tails," suggesting a higher likelihood of extreme volatility due to GPR events than would be expected under a normal distribution. Based on these pre-estimation findings, this study employs the Time-Varying Parameter Vector Autoregressive (TVP-VAR) model proposed by [19,20,21]. This model is particularly well-suited for assessing the connectivity among the underlying variables, focusing on their dynamic interactions rather than strict dependency or interdependency relationships by following the methodology [14]. These preliminary evaluations reinforce the robustness of the selected methodology, laying a strong foundation for analyzing volatility and spillover effects in commodity markets under heightened GPR.
4.2. Commodity Market and Geopolitical Risk Assessment
Geopolitical Risk (GPR) refers to sum of the market uncertainties arising from the current ongoing political conflicts that disrupts the normal course of international affairs. Despite the significance of GPR on the financial cycle and macroeconomic conditions has largely been assessed [14,31,32,37]. While there is still a lack of systematic empirical research in this area particularly to assess the commodities, crude oil, natural gas and gold prices volatility in response to both crises such as COVID-19 and Russian Ukraine crisis (2022) during heightened GPR. Where several key aspects are missing such as consistent measurement of commodity market, long-term indicator for GPR, as well as a real-time measure that reflects the public sentiments—such indicators are missing from deep assessment using the current data timeline from January of 2008 to November 30, 2024. The analysis risk and volatility spillover has relied on modeling conducting event studies focused on specific incidents, limiting the ability to assess risk over extended periods.
To cover these limitations this study employed the GPR index proposed by [32] leveraged the text-based analysis to create this index. This index defines GPR which can disturb the peaceful functioning of international relations. This index provides a more nuanced measure of GPR, it capture greater volatility and allow us for more accurate assessment. This index is openly available for a user that provides global and country specific GPR. The data for this index is calculated from articles world famous articles that are frequently monitored the world wide geopolitical event. Data for global level are collected from 11 major international newspapers, including the Washington Post, Financial Times, The Guardian, Globe and Post, New York Times, Times, Wall Street Journal, Chicago Tribune, Los Angeles Times, Boston Globe, and Daily Telegraph. Similarly, the data for the country level GPR follow the national level newspapers that cover the geopolitical event for each individual country. The GPR index is available for almost all the countries that are share in global politics at some level. Further, to ensure the reliability of the GPR index and to identify relevant content in the collected data, the search focuses on articles containing keywords from six predefined groups consisting of terms directly related to geopolitical events types. GPRs encompass threats stemming from military tensions, particularly those involving the US or other global powers, as well as nuclear threats. The categorization of GPRs is further divided into distinct groups from one to 6 for the purpose to capture various forms of uncertainty. Similarly, group 1 focuses on tensions directly linked to military conflicts involving the US or major global powers.
To examine the relationship between GPR and commodity market volatility, this study adopted the GPR index developed by Caldara and Lacoviello [32] as a measure of GPR. In conducting this study, where Russia related GPR is a continues threat for Western countries, in respond to capture this uncertain situation and volatility of the GPR this study not only famous on GPR at global level but also focusing on GPR related to Russia and USA. The Figure 2 represents the variation among all the selected GPR levels, where the GPR from Russia shows a clear difference in comparison to global and USA related GPR. Figure 2 illustrates the monthly fluctuations of the GPR index from January of 2008 to November 30, 2024, the peaks in 2008 presents the GFC, 2011 align with Syria, in 2013 correspond to the political unrest in Egypt. The annexation of Crimea by Russia in March 2014 and the resulting Ukrainian crisis led to another peak, followed by rising tensions between the US and Russia, culminating in economic sanctions by the European Union around September 2014. The end of 2015 saw another significant peak in Paris unrest, 2016 the US baking crisis along with global GPRs continued to intensify, with volatility reaching new levels. In 2017 this study observed Spain crisis wile in 2018 Russia Crimea conflict and the May 2018 developments involving the US withdrawal from the Iran nuclear deal and escalating conflicts in the Middle East like the bombing of Syria. The largest peak since 2008 occurred with the emergence of the COVID-19 pandemic, further amplifying global GPR and 2020 the COVID-19 and 2022 the Russia Ukraine and 2023 the Israel Gaza crises has been captured and depicted with massive abnormal spikes.
4.3. TVP VAR Estimation Model
The concept of time-varying parameter (TVP) was first introduced by [77] they assess the relationship between inflation and unemployment in the USA the post-World War-II. The TVP model that extended by [78] to address the existing limitations. More recently [78] further refined the model that correlations between underlined variables remained constant with incorporating the expansions of Vector Autoregressive (VAR) along with the TVP Vector Autoregressive with Stochastic Volatility model. In this expanded version, the coefficients and co-variance methods are employed for estimation by [19,20,21]. Since then, numerous empirical studies have utilized the TVP-VAR framework, such as the work by [14,31,32,37]. Similarly, Antonakakis and Gabauer [80] extended the TVP-VAR estimations with estimation the additional spillover estimations along with outliers and Kalman filter improvements and robustness. Using this estimation in the current study has several reasons such as this estimation assess the relationship in from of “To”, “From” and “Total” connectedness among the commodity market, crude oil, natural gas and gold markets. In addition, this estimation has potential to overcome compressed parameter using rolling window estimation that eliminates outliers. More importantly, TVP-VAR model includes all the observation without excluding observations with the help of Kalman filter and variance and covariance methods. Finally, this TVP-VAR estimation has potential to assess high-frequency data for example this current study using daily base data. Estimating TVP VAR supposes is a relationship matric in case of () elements vector possibly be expressed as:
represents the commodity market and time-varying () element coefficient matrix respectively. and coefficient error term explained by the vectors of () and (), respectively.
and are (), and squired () matrixes examines the TVP variance and covariance terms in form of and , where this study uses generalized forecast error along with variance decomposition following the study Kayani et al., (2024)
To assess the crisis of COVID-19 and Russian Ukraine crisis shocks in the commodity market at global level the econometric equation can formulate as:
With the help of GFEVD estimations thus study assess connectedness in term of TO others, total connectedness, and connectedness FROM others, i and j denote underlined variables, and the volatility and spillover is assessed by the model is derives as:
Finally, the results of these forecasted econometric estimation are provided to the dynamic connectedness in the findings section that indices the nodes and arrows in connectedness of total, To and from formation.
4.4. Commodity Markets Volatility Spillover
The objective to assess the volatility spillover between currents GPR and commodity markets linking these commodity markets during COVID19 and Russian Ukrainian peace crisis. By considering such sophisticated estimations this study builds a comprehensive understanding of the potential volatility transmission across different commodity markets over frequency and time dynamic along with providing insights into the dynamic relationships and interconnectedness between the underlined commodities by sonsidering global and regional level of GPR.
In this section we incorporated dynamic VAR estimation model to assess the Diebold & Yilmaz volatility and spillover the entire sample period for all underlined assess in Table 3. This estimation allows us to evaluate the volatility spillover effects among the energy sector, gold, natural gas and commodity markets. Additionally, this section assessed the connectedness among underlined assets at static and dynamic conditions considering crises and of the full sample periods. The volatility and spillover estimation findings are presented in Table 3. The value located in column and rows at their combination reflects the contribution of the market to assess connectedness in the commodity market. For instance, the commodity index contributes 2.44% volatility due to GPR spreading from Russia. Additionally, volatility from each asses "To" market shows that GPR contributes 70.95% to commodity, crude oil, natural gas and gold markets. Similarly, the volatility "From" other assets to impact on each market from others the GPR contribute 51.66% to the in the entire market volatility spillover. Following the same commodity market receives the spillover transmission of 46.6% followed by crude oil, natural gas and gold markets. Finally, the NET spillover effect of the underlined assets calculated by difference of "From" and "To" for each class of assets. The total volatility and spillover represents the above than average spillover effect among underlined assets. Base on this estimation this study provides key insights derived from the volatility spillover index where the overall volatility and spillover estimations index for the markets average are observed 27.78%. The proportion of volatility determined within a single market ranges between 85.37%, 89.24%, 73.51% 53.4% and 87.34% all these indicating that volatility spillover effects are substantial market in each other within the current level of GPR.
At the level of individual markets, the crude oil exhibits the highest volatility spillover at 46.97%, follow by commodity index which is 26.06% compared to the other four markets. The study observed extreme level of volatility spillover from GPR transmitting from Russia. The spillover from crude oil shows significant effect on other markets commodity index with its net spillover effect being the highest at 20.49%, indicating a significant increase. Gold prices experiences substantial volatility spillover from all four other markets, totaling 15.7%. This suggests that the metal industry is not that much volatile in comparison to commodity market. Similarly, this study observed that gold contributes resilience to external shocks in metal industry. This reciprocal volatility spillover between the commodity market and gold markets highlights their linkage and dependency, where changes in volatility in one market can influence the other.
Such linkages among the tow dynamic markets for example in case of this study may stem from the growing importance of various commodities in financial market and their dynamic roles to utilized as hedging tools during periods of market instability like the current GPR related to Russia Ukraine conflict. Similarly, gold and commodity market are widely recognized for their hedging properties [9,12,39]. Furthermore, trading of commodity and gold are priced in US dollars and fluctuations in the value of the US dollar driven by the USA economic monetary policies has potential that may further amplify the volatility dynamics in both markets [14,31]. The gold stability and price resilience may act as safe-haven assets during periods of uncertainty in other commodity markets [14] as it transmits the higher volatility spillover ranking second at 15.7%.
Interestingly, the natural gas experienced volitility in terms of receiving volatility from other commodity market ranking third in both categories. As a result, the natural gas exhibits a small positive net spillover index of 3.71%. The natural gas is closely linked to both the commodity and gold market, a finding consistent with [73] they note that energy, metal, and health care markets exhibit notable combined interdependencies during crises. The natural gas, while playing a smaller role in the variation process, forms a balanced spillover effect. Gong [1] further confirm that, in the context of current crisis such as COVID-19 and GPRs between Russia and Ukraine 2024, natural gas show strong volatility spillovers at high, medium and low frequencies, with other energy products taking over as the primary source of spillover in the long run. This conclusion aligns with our findings, suggesting a significant shift in spillover dynamics between natural gas and crude oil markets over time.
The net spillover indexes of the natural gas shows positive values, indicating that natural gas market act as information transmitters and receiving the volatility. This behavior contributes to the volatility spillover in the broader commodity markets. These markets not only transmit significant volatility to others but also play a key role in shaping the overall dynamics of the commodity market system. The possible reason of Russian natural gas supply to the European Union impact the industrial sector [9]. On the other hand, the GPR exhibit negative net spillover indexes, signifying that natural gas primarily act as information receivers in the volatility transmission process.
The Table 4 represents dynamic volatility connectedness analysis with utilizing the fully sample to examines the level of GPR during the Russia and Ukraine conflict and COVID-19 and normal due course of commodity market. In a similar vein to the two-way spillover observed among all the underlined assets that exhibit significant lower spillovers receiving and transmitting substantial volatility from each other. The commodity market connection attributed to the growing role with time and frequency where demands for commodity for example natural gas create a direct linkage between the energy and commodity product markets [8,11]. Furthermore, the influence of GPRs and market sentiment exacerbates the spillover effects between commodity, crude oil, gold and natural gas products. This connection is particularly pronounced under conditions of GPR, as market sentiment amplified volatility spillovers between natural gas and commodity markets [17]. Thus, natural gas and commodity markets are intertwined, with their volatility linked by both market fundamentals and broader economic or geopolitical factors. The full sample analysis provides a static view of the volatility connectedness between commodity, crude oil, gold and natural gas products, revealing average spillover effects over the entire sample period that is observed lower in comparison to the crisis of GPR during the Russia and Ukraine conflict and COVID-19. However, commodity markets a full sample observed as dynamic in nature, with normal volatility connectedness changing over time such as its changed during GPR during the Russia and Ukraine conflict and COVID-19.
4.5. Dynamic Network Connectedness and Volatility Spillover Estimation
Figure 3, Figure 4 and Figure 5 presents the dynamic network connectedness and volatility spillover estimation based on network model to assess the time-varying spillover patterns among the underlined asserts. Figure 3 depicts the total dynamic network connectedness of commodity market to GPR volatility and spillover using downward trend in spillover for the full sample data where all markets experienced a massive decline in spillover effects. This is likely due to the global economic crisis and more recently of COVID-19 and Russian Ukraine conflict, which affected the interconnectedness of commodity markets. This study further observed a small peak around 2008-2009 that practically the market faced in shape of global financial crisis GFC which further created the volatility spillover across commodity markets. To more precise the volatile conditions observed in 2015-2016 likely due to specific market conditions and policy changes from USA. More recently, the COVID-19 pandemic starting in 2020, volatility spillovers intensified, reflecting the unprecedented disruptions caused by the COVID-19 pandemic as numerous studies capture the similar impact [31]. The pandemic had a profound impact on the on commodity index making this period a period of high volatility and uncertainty in particular for the underlined commodities.
The time-varying spillover analysis highlights how volatility spillovers between strategic commodities deviations, dynamic changes in crude oil price volatility and variation in natural gas and gold prices in response to both crises i.e. COVID-19 an Russian Ukraine crisis during heightened GPR that shows change over time. These dynamic shifts are crucial to understand the market inter-linkage external events can influence the volatility transmission mechanisms.
4.6. Global and Regional Geopolitical Risk and Commodity Markets
Results from Figure 4 presents the dynamic network connectedness volatility and spillover transited from single asset “To” other underlined assets using fully sample data from 2008 to 2024 which incorporates GPR at global level alongside presenting the GPR from Russia and USA to evaluate its impact on the volatility spillover among commodity index.
Global and regional GPR has impact on the net volatility spillover of these underlined markets. Political instability and attention to geopolitical threats often lead to heightened sensitivity, particularly in the commodity, crude oil and natural gas. The gold market is particularly lower responsive to geopolitical shocks leading to increased spillovers. In addition, the crude oil market reacts most strongly to political instability, likely due to the critical role energy resources play in global geopolitics. Similarly, natural gas and commodity markets are also affected by GPRs, with heightened volatility spillovers observed during periods of political instability or uncertainty. Furthermore, the findings suggest that the type of GPR matters in determining how commodity markets are interconnected, with geopolitical at Russian countersued having a stronger impact on long-term spillovers than GPR from the global level. The resents the dynamic network connectedness volatility and spillover transited from single asset “to” other underlined assets indicates that GPR—al all the underlined levels significantly influences volatility spillovers between commodity markets, the impact are observed direct and long-lasting effect on market dynamics. The sensitivity of markets such as energy to geopolitical instability further emphasizes the complex relationship between political events and commodity market behavior. The results are in line with [14,31].
Figure 5 shows the dynamic network connectedness volatility and spillover transited “From” single asset to other underlined assets using fully sample data from 2008 to 2024. In particular, the crude oil (WTI) plays a central role in the commodity maker, and its volatility spillover significantly affects other commodity markets, such as natural gas. This is particularly true during periods of economic crises, political uncertainty and supply shocks faced to the financial market at global level these include the ongoing repercussions of the COVID-19 pandemic and the geopolitical tensions, such as the conflict between Russia and Ukraine, both of which are major contributors to global commodities supplies, particularly in grains like wheat [22]. Similarly, this estimation captures the supply chain disruptions faced by the commodity market due to geopolitical instability, such as the recent unrest in the Middle East that has affected operations around the Suez Canal, a crucial trade route [23]. The dynamic network connectedness volatility and spillover transited “From” single asset to other underlined assets increases due to GPRs (GPR-Global, Russia and USA), which in turn amplifies the volatility in the commodity market. Crude oil and natural gas markets are more pronounced in times of economic crises and political instability, leading to greater spillovers across these markets. This supports the idea that fluctuations in commodity prices, especially crude oil, natural gas, and gold have significant ripple effects on other commodities. GPR has varying effects across different commodity markets, with natural gas and crude oil markets showing the highest levels of spillover, especially in times of geopolitical instability from Russia. Most interestingly, gold market responds less to GPRs due to their potential usage as a hedging tool leading to lower spillover effects from geopolitical events and COVID-19. This overall analysis highlights the complexity of GPR from global level and from Russia and USA impacts on commodity markets and underscores the need to consider market-specific characteristics when assessing the potential spillover effects.
5. Conclusions
This study presents a comprehensive investigation into the role of various types of geopolitical risk (GPRs) in shaping the interconnectedness of commodity markets and their impact on spillovers between these markets. Key commodities, including crude oil, natural gas, and gold, are selected for analysis due to their significant roles in investment strategies, hedging, and risk diversification within the global financial market. The study focuses on an important and extensive timeline, utilizing daily data from January 2008 to November 2024. This period captures critical crises, such as the global financial crisis, health crises, and peace crises, to assess their potential impacts on commodity markets. Advanced and sophisticated methodologies are employed, particularly network connectedness estimation, to analyze volatility and spillover dynamics among the selected commodities in the context of contemporary GPRs at global, Russian, and U.S. levels.
The study conceptualizes GPR as encompassing disruptive events which destabilize international relations and pose significant threats to market stability. With the increasing "financialization" of commodity markets—where these markets are increasingly intertwined with financial markets—GPRs are hypothesized to have a profound influence on market interconnectedness and spillover effects. To facilitate this analysis, the study constructs a commodities index alongside individual evaluations of crude oil, natural gas, and gold prices. Employing the Time-Varying Parameter Vector Auto Regression (TVP-VAR) model developed by Diebold and Yilmaz, the study provides a rigorous estimation of volatility connectedness and spillover dynamics among these assets. This approach contributes to understanding the intricate interplay between GPRs and commodity market behavior, offering valuable insights for policymakers, investors, and stakeholders navigating an increasingly complex global financial landscape.
This study presents key findings on volatility and spillover connectedness along with important practical policy implications. The study finds that the gold and precious metal markets serve as information volatility and spillover transmitters represents that shocks in these markets tend to influence other markets. On the other side, the commodity market and crude oil markets are volatility and spillover information receivers suggesting that volatility from the market is more susceptible to being affected by changes in the other markets. More interestingly, the study observed that there is strong volatility connectedness between crude oil, and natural gas, while the precious metals are observed least effect assets present in the markets. These findings underscore the importance of considering multiple markets in the study of commodity price fluctuations, especially in the context of COVID-19 and global crises along with inter-market linkages.
This study differentiates the findings from the other similar studies as this study considers the impact of GPR (GPR) transmits from global level and GPR from Russia and USA on that impacts the commodity market. The TVT-VAR estimation model is used to assess the impact of dynamic GPR represented by daily data on commodity markets along with crude oil, natural gas, and gold prices volatility that are examined at daily frequencies. The effect of global GPR significantly affect the entire commodity market on the net spillovers of crude oil and commodity markets meaning that increased geopolitical tensions at a global level lead to greater volatility transmission across these markets in fully sample analysis from 2008 to 2014. Similarly, global GPR has a lower impact on the precious metal markets such as gold which is less sensitivity to GPR in terms of volatility spillovers. The findings are confirmed by several other similar studies. This is likely because these markets are often seen as safe havens (precious metals like gold) or have more stable, diversified supply chains.
Hon the other hand, the GPR disseminates from Russia and USA this study further divides GPR into two sub-indices as GPR-Russ and GPR-USA to assess their distinct impacts on commodity market connectedness. The findings suggests that this sub-index focuses on examined the potential of specific geopolitical events for example the situation which is on-going until the collection of this research data sample (e.g., actual conflicts, military actions, and political disruptions between Russia and Ukraine. The GPR-Russ and GPR-USA assessment is crucial as both countries has significant role in commodity market for example Russia is great exporter of commodity item while USA provides world leading financial market and trading platform to deal the commodity sources. This study provides key findings such as the connectedness effects between GPR-Russ and commodity markets are often more pronounced through PRG at global level, than through GPT USA. Russian GPR represents more immediate, tangible risks (e.g., wars or military actions), leading to more direct and significant impacts on commodity market that further creates higher volatility and spillovers. These findings suggests that while GPR-USA may affect market sentiment and cause uncertainty while the GRP-Russ occurrence of actual wars and physical attacks on cross border that has further more substantial and observable effect on commodity market volatility.
This study offers practical policy implications, emphasizing GPRs—particularly those at the global level, as well as those originating from Russia and the United States—should be carefully assessed and continuously monitored due to their substantial influence on market volatility and spillover effects across commodity markets. Specifically, the research highlights the significance of cross-market analysis, such as those involving crude oil, natural gas, and gold investment markets, given that shocks in one market can propagate widely and impact others markets. Moreover, the study underscores the importance of commodity-specific responses to GPRs. Crude oil and natural gas markets, for instance, exhibit heightened sensitivity to geopolitical disruptions, while precious metals like gold often demonstrate relative stability or even negative spillover effects in response to external shocks. These findings emphasize the need for a nuanced understanding of how different commodities react to geopolitical events.
Empirically, this research elucidates the complex interrelationships between GPRs and commodity market dynamics. It stresses the importance of incorporating multiple markets and considering the timing and nature of geopolitical events to comprehensively analyze volatility and spillover effects. Additionally, the study’s differentiation of GPRs by source—global, Russian, and U.S. levels—provides deeper insights into how distinct types of GPRs influence commodity market interconnectedness. However, the authors acknowledge certain limitations in their analysis. For example, the exclusion of sentiment analysis and the lack of examination of alternative assets, such as digital assets, represent areas for future exploration.
References
- Gong, X. , & Xu, J. Geopolitical risk and dynamic connectedness between commodity markets. Energy Economics 2022, 110, 106028. [Google Scholar] [CrossRef]
- Joets, M. , Mignon, V., Razafindrabe, T., Does the volatility of commodity prices reflect macroeconomic uncertainty? Energy Econ. 2017, 68, 313–326. [Google Scholar] [CrossRef]
- Güngo¨r, A. , Tas¸ tan, H., On macroeconomic determinants of co-movements among international stock markets: evidence from DCC-MIDAS approach. Quant. Financ. Econ. 2021, 5, 19–39. [Google Scholar] [CrossRef]
- Huang, C. , Deng, Y., Yang, X., Cao, J., Yang, X., A network perspective of comovement and structural change: evidence from the Chinese stock market. Int. Rev. Financ. Anal. 2021, 76, 101782. [Google Scholar] [CrossRef]
- Tang, Y. , Xiao, X., Wahab, M.I.M., Ma, F., The role of oil futures intradayinformation on predicting US stock market volatility. J. Manag. Sci. Eng. 2021, 6, 64–74. [Google Scholar]
- Hong, S. H. , & Nam, S. Technical Innovation and Export Activities of Small and Medium-Sized Firms in Korea. Korean Social Science Journal 2021, 48, 13–23. [Google Scholar]
- Aruga, K. , & Wakamatsu, H. Investigating the Consumption Patterns of Japanese Seafood during the COVID-19 Pandemic. Commodities 2024, 3, 182–196. [Google Scholar] [CrossRef]
- Su, C.W. , Khan, K., Tao, R., Nicoleta-Claudia, M., Does geopolitical risk strengthen or depress oil prices and financial liquidity? Evidence from Saudi Arabia. Energy 2019, 187, 116003. [Google Scholar] [CrossRef]
- Altinbas, H. Volatility in the Turkish stock market: an analysis of influential events. Journal of Asset Management 2024, 1–14. [Google Scholar] [CrossRef]
- Fall, M. Portfolio optimization in deformed time. Journal of Asset Management 2024, 1–10. [Google Scholar] [CrossRef]
- Asai, M. , Gupta, R., McAleer, M., Forecasting volatility and co-volatility of crude oil and gold futures: effects of leverage, jumps, spillovers, and geopolitical risks. Int.J. Forecast. 2020, 36, 933–948. [Google Scholar] [CrossRef]
- Pacelli, V. , Di Tommaso, C., Foglia, M., & Povia, M. M. Spillover effects between energy uncertainty and financial risk in the Eurozone banking sector. Energy Economics 2024, 108082. [Google Scholar]
- Tiwari, A.K. , Boachie, M.K., Suleman, M.T., Gupta, R., Structure dependence between oil and agricultural commodities returns: the role of geopolitical risks. Energy 2021, 219, 119584. [Google Scholar] [CrossRef]
- Ullah, M. , Sohag, K., Khan, S., & Sohail, H. M. 2023. Impact of Russia–Ukraine conflict on Russian financial market: Evidence from TVP-VAR and quantile-VAR analysis. [CrossRef]
- Chenghao, Y. , Mayburov, I. A., & Ying, W. Fiscal Effects of Environmental Tax Reform: A Comparative Analysis of China, Germany and the United Kingdom. Journal of Tax Reform 2024, 10, 258–270. [Google Scholar] [CrossRef]
- Abdel-Latif, H. , El-Gamal, M., Financial liquidity, geopolitics, and oil prices. Energy Econ. 2020, 87, 104482. [Google Scholar] [CrossRef]
- Khan, K. , Su, C.W., Tao, R., 2021. Does oil prices cause financial liquidity crunch?
- Perspective from geopolitical risk. Def. Peace Econ. 32.
- Lyu, Y. , Yi, H., Hu, Y., Yang, M., Economic uncertainty shocks and China’s commodity futures returns: a time-varying perspective. Res. Policy 2021, 70, 101979. [Google Scholar] [CrossRef]
- Diebold, F.X. , Yilmaz, K., Better to give than to receive: predictive directional measurement of volatility spillovers. Int. J. Forecast. 2012, 28, 57–66. [Google Scholar] [CrossRef]
- Diebold, F.X. , Yilmaz, K., On the network topology of variance decompositions: measuring the connectedness of financial firms. J. Econ. 2014, 182, 119–134. [Google Scholar]
- Diebold, F.X. , Liu, L., Yilmaz, K., 2017. Commodity Connectedness.
- Olshanska, O. , Bebko, S., & Budiakova, O. Solving the food crisis in the context of developing the bioeconomy of the agro-industrial complex of Ukraine. Economics, Finance and Management Review. [CrossRef]
- Tyczewska, A. , Twardowski, T., & Woźniak-Gientka, E. Agricultural biotechnology for sustainable food security. Trends in biotechnology 2023, 41, 331–341. [Google Scholar] [CrossRef]
- Guidolin, M. , La Ferrara, E., The economic effects of violent conflict: evidence from asset market reactions. J. Peace Res. 2010, 47, 671–684. [Google Scholar] [CrossRef]
- Xu, J. , & Baek, J. 2024. A new look at exchange rate dynamics and the bilateral trade balance: The case of South Korea. The Singapore Economic Review.
- Yie, M. S. , & Nam, S. J. The impact of ICT sector on economic output and growth. Informatization Policy 2019, 26, 24–45. [Google Scholar] [CrossRef]
- Liu, J. , Zhang, Z., Yan, L., Wen, F. Forecasting the volatility of EUA futures with economic policy uncertainty using the GARCH-MIDAS model. Fin. Innov. 2021, 7, 1–19. [Google Scholar]
- Datta, D.D. , Londono, J.M., Ross, L.J., Generating options-implied probability densities to understand oil market events. Energy Econ. 2017, 64, 440–457. [Google Scholar] [CrossRef]
- Aysan, AF, Canga, M. , & Kayani, UN A Comparative Analysis between Islamic Economics and Environmental Economics: Historical Development and its Significance for Contemporary Challenges. Journal of Balkan Economies and Management 2024, 1, 27–52. [Google Scholar]
- Song, Y. , Ji, Q., Du, Y.-J., Geng, J.-B., The dynamic dependence of fossil energy, investor sentiment and renewable energy stock markets. Energy Econ. 2019, 84, 104564. [Google Scholar] [CrossRef]
- Ullah, M. , Sohag, K., Doroshenko, S. et al. Examination of Bitcoin Hedging, Diversification and Safe-Haven Ability During Financial Crisis: Evidence from Equity, Bonds, Precious Metals and Exchange Rate Markets. Comput Econ. [CrossRef]
- Caldara, D. , Iacoviello, M.F.R.B., 2018. Measuring Geopolitical Risk. Working Papers – U. S, pp. 1–47.
- Sharif, A. , Aloui, C., Yarovaya, L., 2020. COVID-19 Pandemic, Oil Prices, Stock Market, Geopolitical Risk and Policy Uncertainty nexus in the US. Fresh, economy.
- Wen, F. , Cao, J., Liu, Z., Wang, X., Dynamic volatility spillovers and investment strategies between the Chinese stock market and commodity markets. Int. Rev. Financ. Anal. 2021, 76, 101772. [Google Scholar] [CrossRef]
- Pindyck, R.S. , Rotemberg, J.J., The excess co-movement of commodity prices. Econ. J. 1990, 100, 1173–1189. [Google Scholar]
- Aysan, A. F. , Batten, J., Gozgor, G., Khalfaoui, R., & Nanaeva, Z. Metaverse and financial markets: A quantile-time-frequency connectedness analysis. Research in International Business and Finance 2024, 72, 102527. [Google Scholar]
- Ullah, M. , Sohag, K., & Haddad, H. Comparative investment analysis between crypto and conventional financial assets amid heightened geopolitical risk. 2024, 10. [Google Scholar] [CrossRef]
- Adhikari, R. , & Putnam, K. J. Financial Market Stress and Commodity Returns: A Dynamic Approach. Commodities 2024, 3, 39–61. [Google Scholar] [CrossRef]
- Kayani, U. , Ullah, M., Aysan, A. F., Nazir, S., & Frempong, J. Quantile connectivity among digital assets, traditional assets, and renewable energy prices during extreme economic crisis. Technological Forecasting and Social Change 2024, 208, 123635. [Google Scholar] [CrossRef]
- Kang, S.H. , McIver, R., Yoon, S.-M., Dynamic spillover effects among crude oil, precious metal, and agricultural commodity futures markets. Energy Econ. 2017, 62, 19–32. [Google Scholar] [CrossRef]
- Prokopczuk, M. , Wese Simen, C., Wichmann, R., The dynamics of commodity return comovements. J. Futur. Mark. 2021, 41, 1597–1617. [Google Scholar] [CrossRef]
- Bahmani-Oskooee, M. , & Baek, J. 2021. Exchange rate volatility and domestic investment in G7: Are the effects asymmetry? Empirica.
- Syarif, M. F. , & Aysan, A. F. 2024. Sharia crowdfunding in Indonesia: a regulatory environment perspective. Journal of Science and Technology Policy Management.
- Yang, J. , Li, Z., Miao, H.,. Volatility spillovers in commodity futures markets: a network approach. J. Futur. Mark. 2021, 41, 1959–1987. [Google Scholar] [CrossRef]
- Kupabado, M.M. , Kaehler, J., Financialization, common stochastic trends, and commodity prices. J. Futur. Mark. 2021, 41, 1988–2008. [Google Scholar] [CrossRef]
- Ahmed, F. , Gurdgiev, C., Sohag, K., Islam, M. M., & Zeqiraj, V. Global, local, or glocal? Unravelling the interplay of geopolitical risks and financial stress. Journal of Multinational Financial Management 2024, 75, 75–100871. [Google Scholar]
- Aristovnik, A. , Keržič, D., Ravšelj, D., Tomaževič, N., & Umek, L. Impacts of the COVID-19 Pandemic on Life of Higher Education Students: A Global Perspective. Sustainability. [CrossRef]
- Colombo, F. , Pesenti, M., Araniti, F., Pilu, S. R., & Nocito, F. F. An Integrated and Multi-Stakeholder Approach for Sustainable Phosphorus Management in Agriculture. Agronomy. [CrossRef]
- Haase, M. , & Henn, J. Time-Varying Deterministic Volatility Model for Options on Wheat Futures. Commodities 2024, 3, 334–354. [Google Scholar] [CrossRef]
- Hoshisashi, K. , & Yamada, Y. Pricing Multi-Asset Bermudan Commodity Options with Stochastic Volatility Using Neural Networks. Journal of Risk and Financial Management. [CrossRef]
- Hu, Y. , Lang, C., Corbet, S., Hou, Y. (Greg), & Oxley, L. Exploring the dynamic behaviour of commodity market tail risk connectedness during the negative WTI pricing event. Energy Economics 2023, 125, 106829. [Google Scholar] [CrossRef]
- Koelmel, B. , Fischer, L., Juraschek, E., Peuker, L., Stemmler, N., Vielsack, A., Bulander, R., Hinderer, H., Kilian-Yasin, K., Brugger, T., Kühn, A., & Brysch, T. Navigating the Challenges of Commodity Traps and Platform Economies: An Assessment in the Context of the Northern Black Forest Region and Future Directions. Commodities 2024, 3, 314–333. [Google Scholar] [CrossRef]
- Koelmel, B. , Haug, T., Klein, L., Schwab, L., Bulander, R., Hinderer, H., Weyer, M., Brugger, T., Kuehn, A., & Brysch, T. Are German Automotive Suppliers in the Commodity Trap? Risks and Potentials of the Taiwanese Platform MIH EV Open. Commodities 2024, 3, 389–420. [Google Scholar] [CrossRef]
- Kostaridou, E. , Siatis, N., & Zafeiriou, E. Resource Price Interconnections and the Impact of Geopolitical Shocks Using Granger Causality: A Case Study of Ukraine–Russia Unrest. Journal of Risk and Financial Management. [CrossRef]
- Kyriazis, N. A. Optimal Portfolios of National Currencies, Commodities and Fuel, Agricultural Commodities and Cryptocurrencies during the Russian-Ukrainian Conflict. International Journal of Financial Studies 2022, 10. [Google Scholar] [CrossRef]
- Liaw, K. T. Benefits of Property Assessed Clean Energy Programs and Securitization of Property Assessed Clean Energy Loans. Commodities 2024, 3, 421–430. [Google Scholar] [CrossRef]
- Sohag, K. , Vasilyeva, R., Urazbaeva, A., & Voytenkov, V. Stock market synchronization: The role of geopolitical risk. Journal of Risk and Financial Management 2022, 15, 204. [Google Scholar]
- Tissaoui, K. , Abidi, I., Azibi, N., & Nsaibi, M. Spillover Effects between Crude Oil Returns and Uncertainty: New Evidence from Time-Frequency Domain Approaches. Energies. [CrossRef]
- Zhu, S. , Xia, Y., Li, Q., & Chen, Y. Global geopolitical risk and financial stability: Evidence from China. Finance Research Letters.
- Yilmazkuday, H. Geopolitical risk and stock prices. European Journal of Political Economy 2024, 83, 102553. [Google Scholar] [CrossRef]
- Wang, Y. , & Lin, T. A Novel Deterministic Probabilistic Forecasting Framework for Gold Price with a New Pandemic Index Based on Quantile Regression Deep Learning and Multi-Objective Optimization. Mathematics. [CrossRef]
- Shahzad, U. , Mohammed, K. S., Tiwari, S., Nakonieczny, J., & Nesterowicz, R. Connectedness between geopolitical risk, financial instability indices and precious metals markets: Novel findings from Russia Ukraine conflict perspective. Resources Policy 2023, 80, 103190. [Google Scholar]
- Micallef, J. , Grima, S., Spiteri, J., & Rupeika-Apoga, R. Assessing the Causality Relationship between the Geopolitical Risk Index and the Agricultural Commodity Markets. 2023, 11. [Google Scholar] [CrossRef]
- Chaudhary, R. , Bakhshi, P., & Gupta, H. Volatility in International Stock Markets: An Empirical Study during COVID-19. Journal of Risk and Financial Management. [CrossRef]
- Conlon, T. , & McGee, R. Safe haven or risky hazard? Bitcoin during the Covid-19 bear market. Finance Research Letters 2020, 35, 101607. [Google Scholar] [CrossRef]
- Dyck, A. , Lins, K. V., Roth, L., & Wagner, H. F. Do institutional investors drive corporate social responsibility? International evidence. Journal of Financial Economics 2019, 131, 693–714. [Google Scholar] [CrossRef]
- Liu, N. , Liu, C., Da, B., Zhang, T., & Guan, F. Dependence and risk spillovers between green bonds and clean energy markets. Journal of Cleaner Production 2021, 279, 123595. [Google Scholar] [CrossRef]
- Loxton, M. , Truskett, R., Scarf, B., Sindone, L., Baldry, G., & Zhao, Y. Consumer Behaviour during Crises: Preliminary Research on How Coronavirus Has Manifested Consumer Panic Buying, Herd Mentality, Changing Discretionary Spending and the Role of the Media in Influencing Behaviour. Journal of Risk and Financial Management. [CrossRef]
- Malhi, G. S. , Kaur, M., & Kaushik, P. Impact of Climate Change on Agriculture and Its Mitigation Strategies: A Review. Sustainability. [CrossRef]
- Mazur, M. , Dang, M., & Vega, M. COVID-19 and the march 2020 stock market crash. Evidence from S&P1500. Finance Research Letters 2021, 38, 101690. [Google Scholar] [CrossRef]
- Srivinay, Manujakshi, B. C., Kabadi, M. G., & Naik, N. A Hybrid Stock Price Prediction Model Based on PRE and Deep Neural Network. Data. [CrossRef]
- Staugaitis, A. J. , & Vaznonis, B. Financial Speculation Impact on Agricultural and Other Commodity Return Volatility: Implications for Sustainable Development and Food Security. Agriculture 2022, 12. [Google Scholar] [CrossRef]
- Zhang, D. , Hu, M., & Ji, Q. Financial markets under the global pandemic of COVID-19. Finance Research Letters 2020, 36, 101528. [Google Scholar] [CrossRef]
- Aruga, K. , & Wakamatsu, H. Investigating the Consumption Patterns of Japanese Seafood during the COVID-19 Pandemic. Commodities 2024, 3, 182–196. [Google Scholar]
- Adhikari, R. , & Putnam, K. J. Financial Market Stress and Commodity Returns: A Dynamic Approach. Commodities 2024, 3, 39–61. [Google Scholar]
- Lu, Q., Ullah, F., Amin, F., Ullah, M., (2024) Dynamic Connectedness between Geopolitical Risk and Flow of Foreign Remittances with application of NARDL estimation approach. Transnational Corporation Review 200106 . [CrossRef]
- Cogley, T. , Sargent, T.J., 2001. Evolving post–World War II U.S. inflation dynamics.
- NBER/Macroeconomics Annual (MIT Press) 16, 331–373.
- Cogley, T. , Sargent, T.J., Drifts and volatilities: monetary policies and outcomes in the post WWIIUS. Rev. Econ. Dyn. 2005, 8, 262–302. [Google Scholar] [CrossRef]
- Primiceri, G. , Time varying structural vector autoregressions and monetary policy. Rev. Econ. Stud. 2005, 72, 821–852. [Google Scholar] [CrossRef]
- Antonakakis, N. , Gupta, R., Kollias, C., Papadamou, S. Geopolitical risks and the oil-stock nexus over 1899–2016. Financ. Res. Lett. 2017, 23, 165–173. [Google Scholar]
Figure 1.
Volatility and Spillover from Geopolitical Risk Transmitted Russia to Countryside Commodity market Source: Authors Calculation using data from 2008 to 2024.
Figure 1.
Volatility and Spillover from Geopolitical Risk Transmitted Russia to Countryside Commodity market Source: Authors Calculation using data from 2008 to 2024.
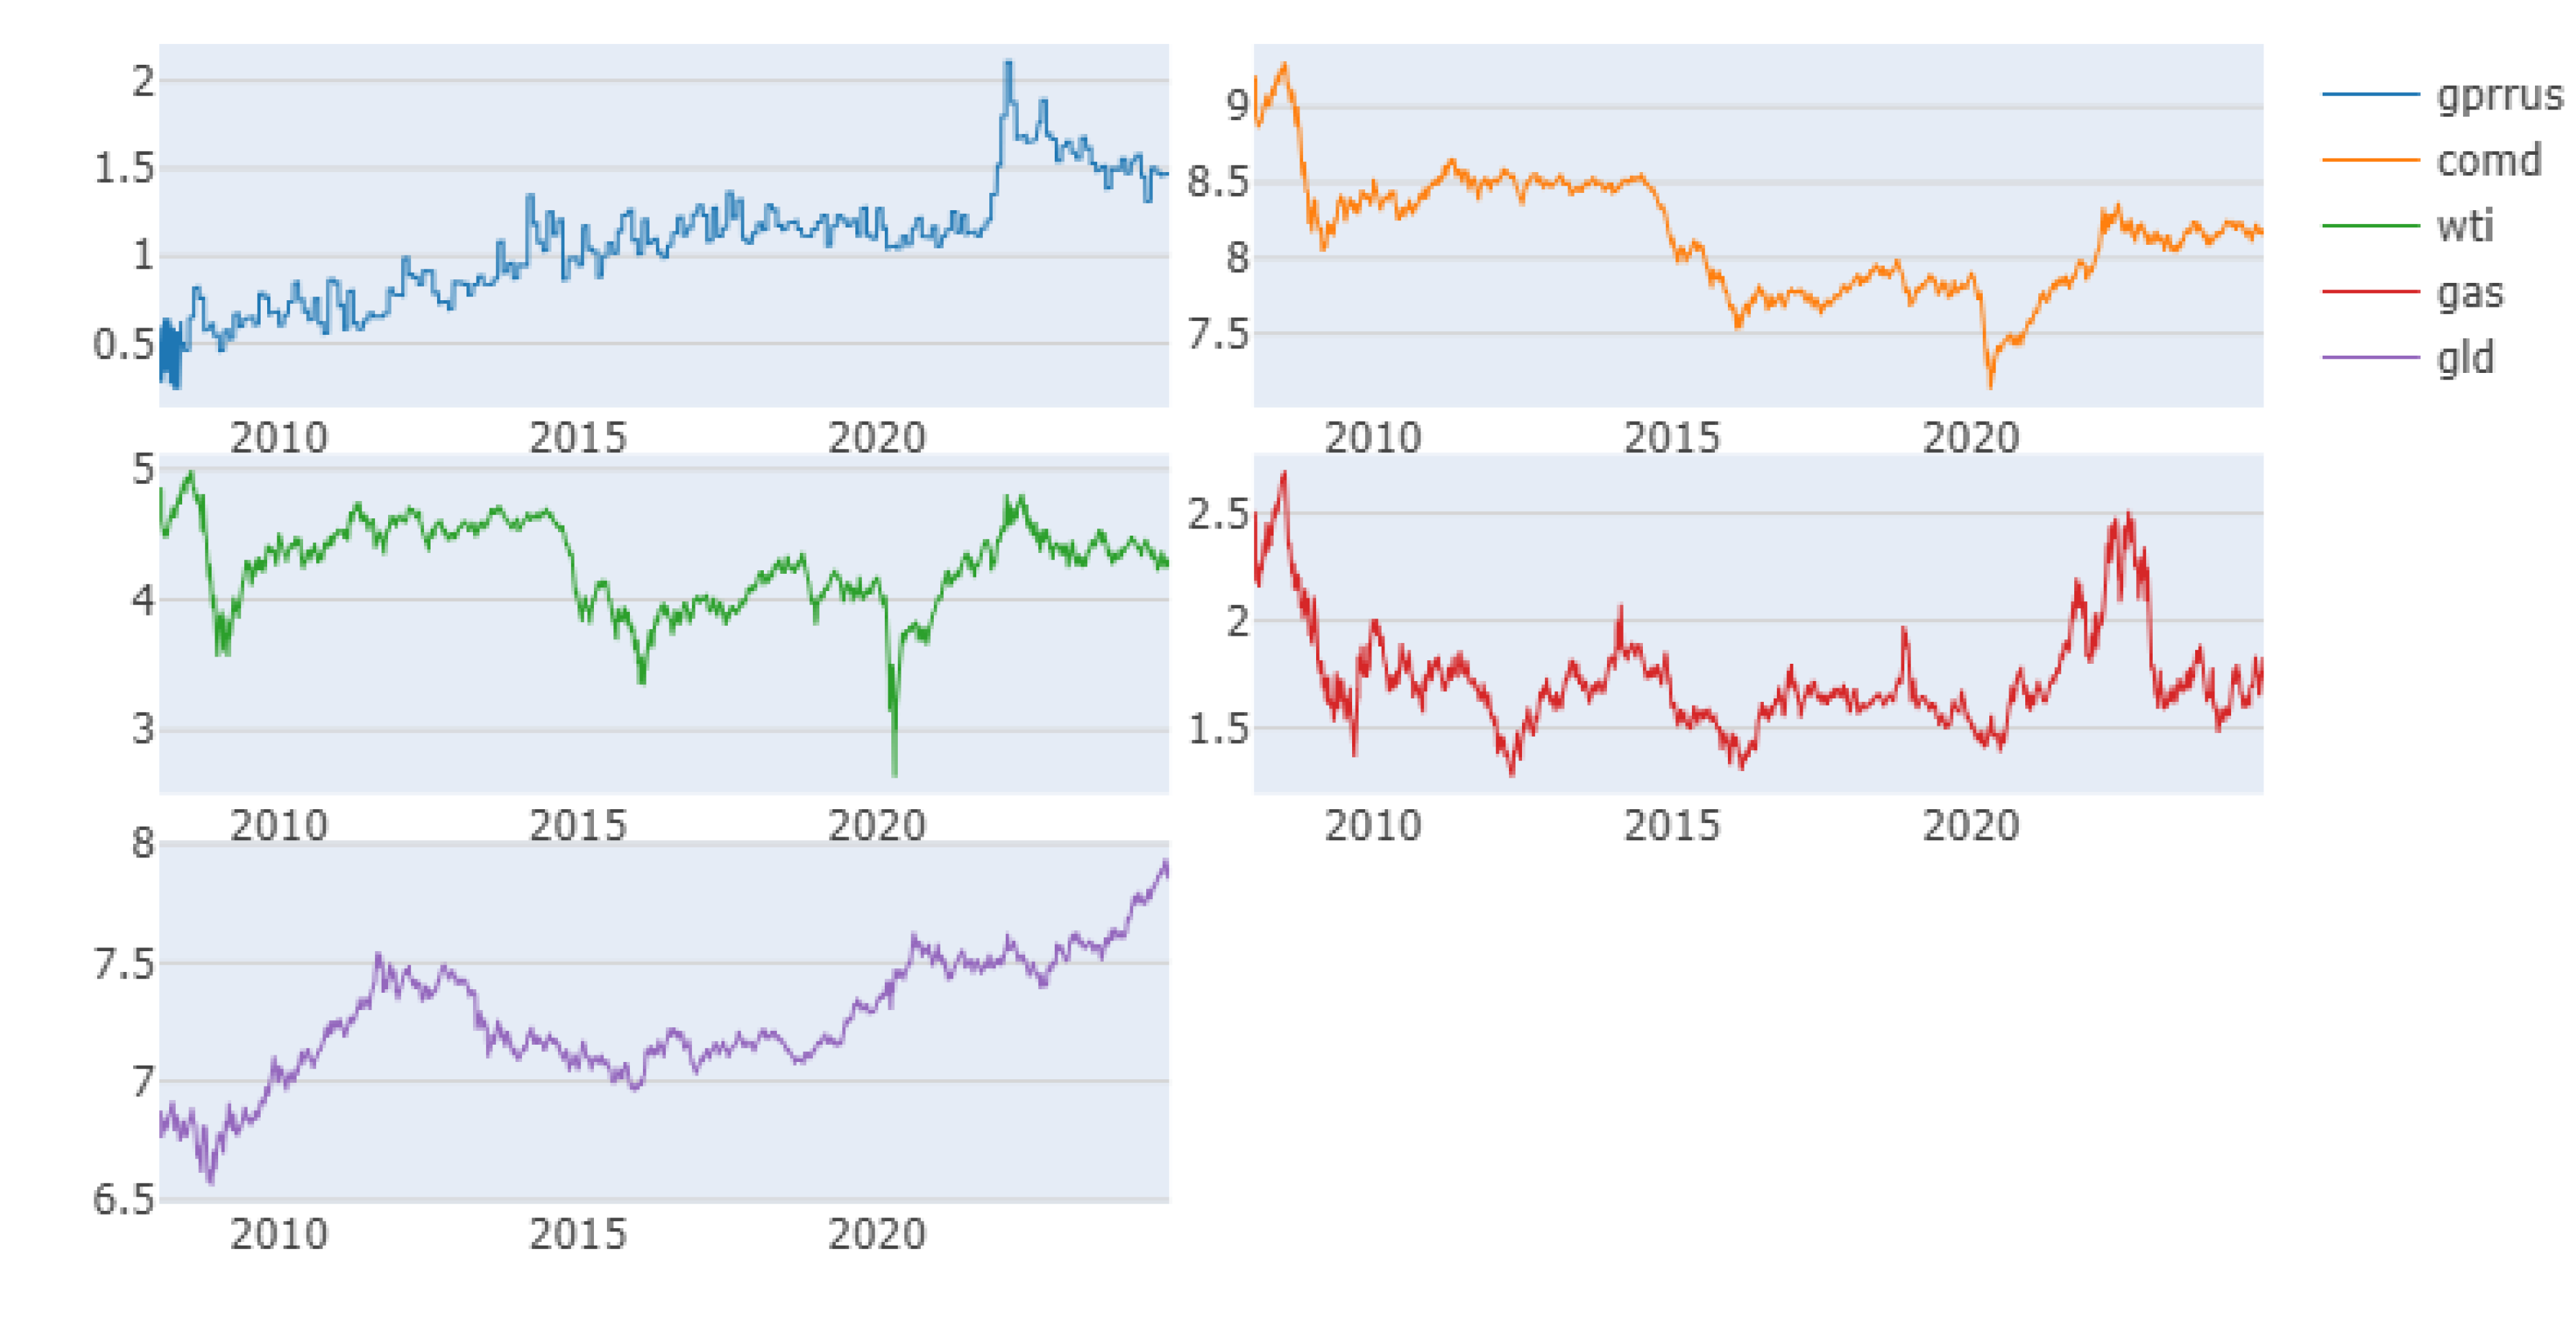
Figure 2.
Volatility and Spillover of Commodity market to Geopolitical Risk Transmitted from International level, Russia and USA Countryside Source: Authors Calculation using fully sample data from 2008 to 2024.
Figure 2.
Volatility and Spillover of Commodity market to Geopolitical Risk Transmitted from International level, Russia and USA Countryside Source: Authors Calculation using fully sample data from 2008 to 2024.
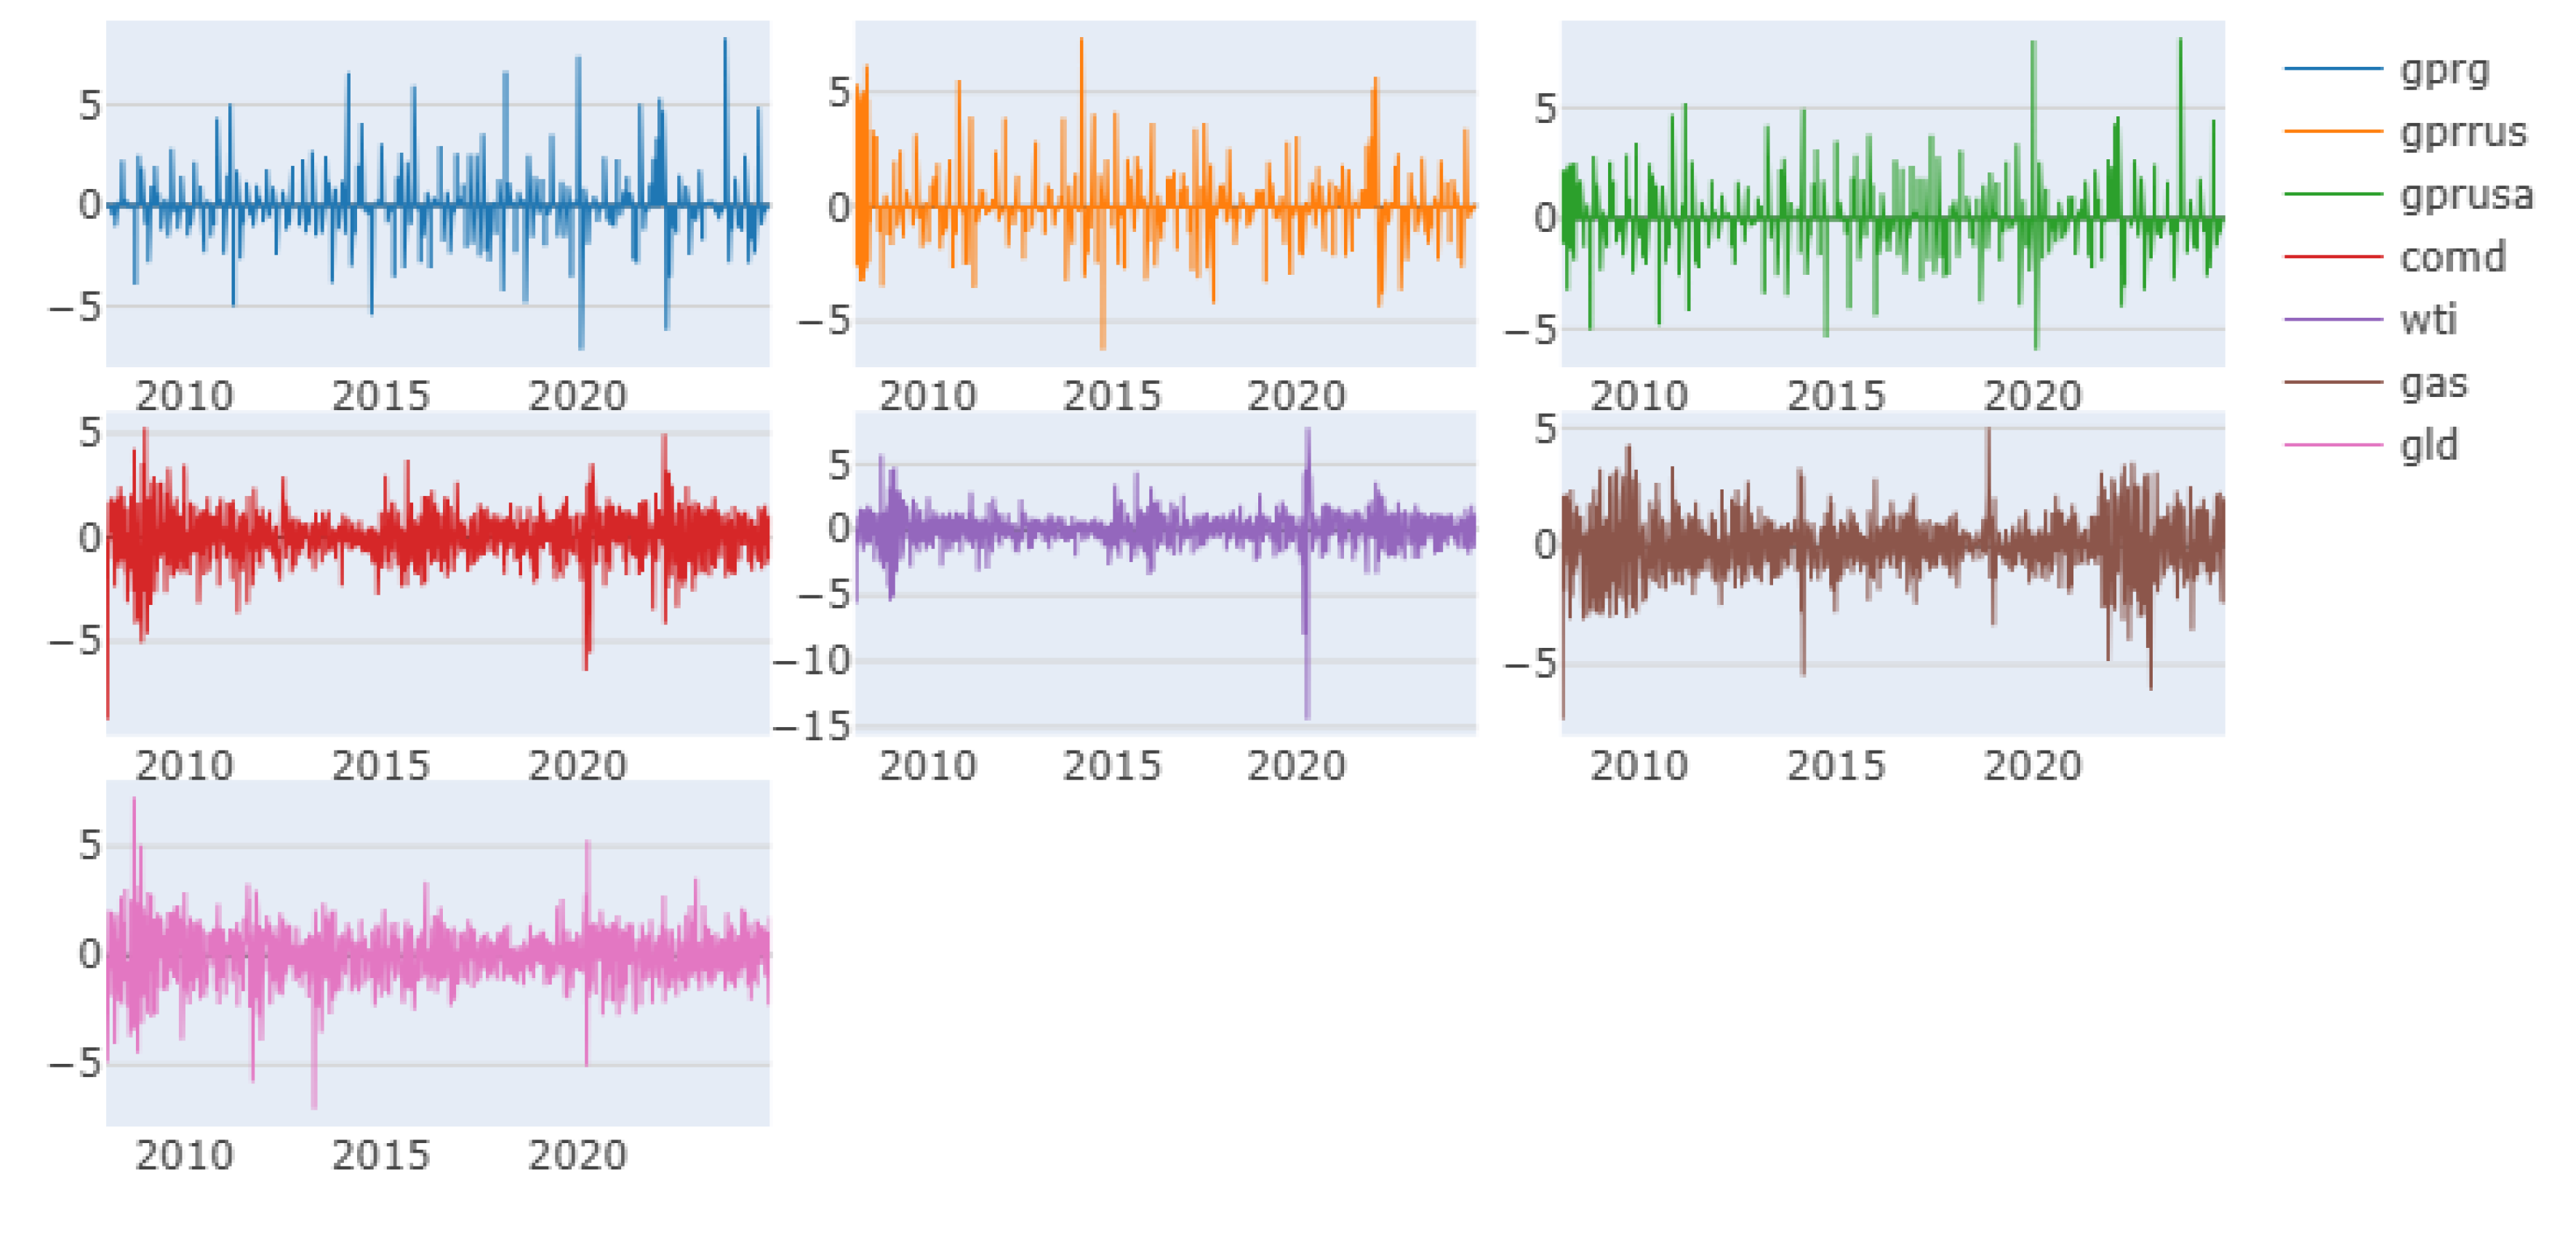
Figure 3.
Total Dynamic Connectedness of Commodity market to GPR Volatility and Spillover Source: Authors Calculation using fully sample data from 2008.
Figure 3.
Total Dynamic Connectedness of Commodity market to GPR Volatility and Spillover Source: Authors Calculation using fully sample data from 2008.
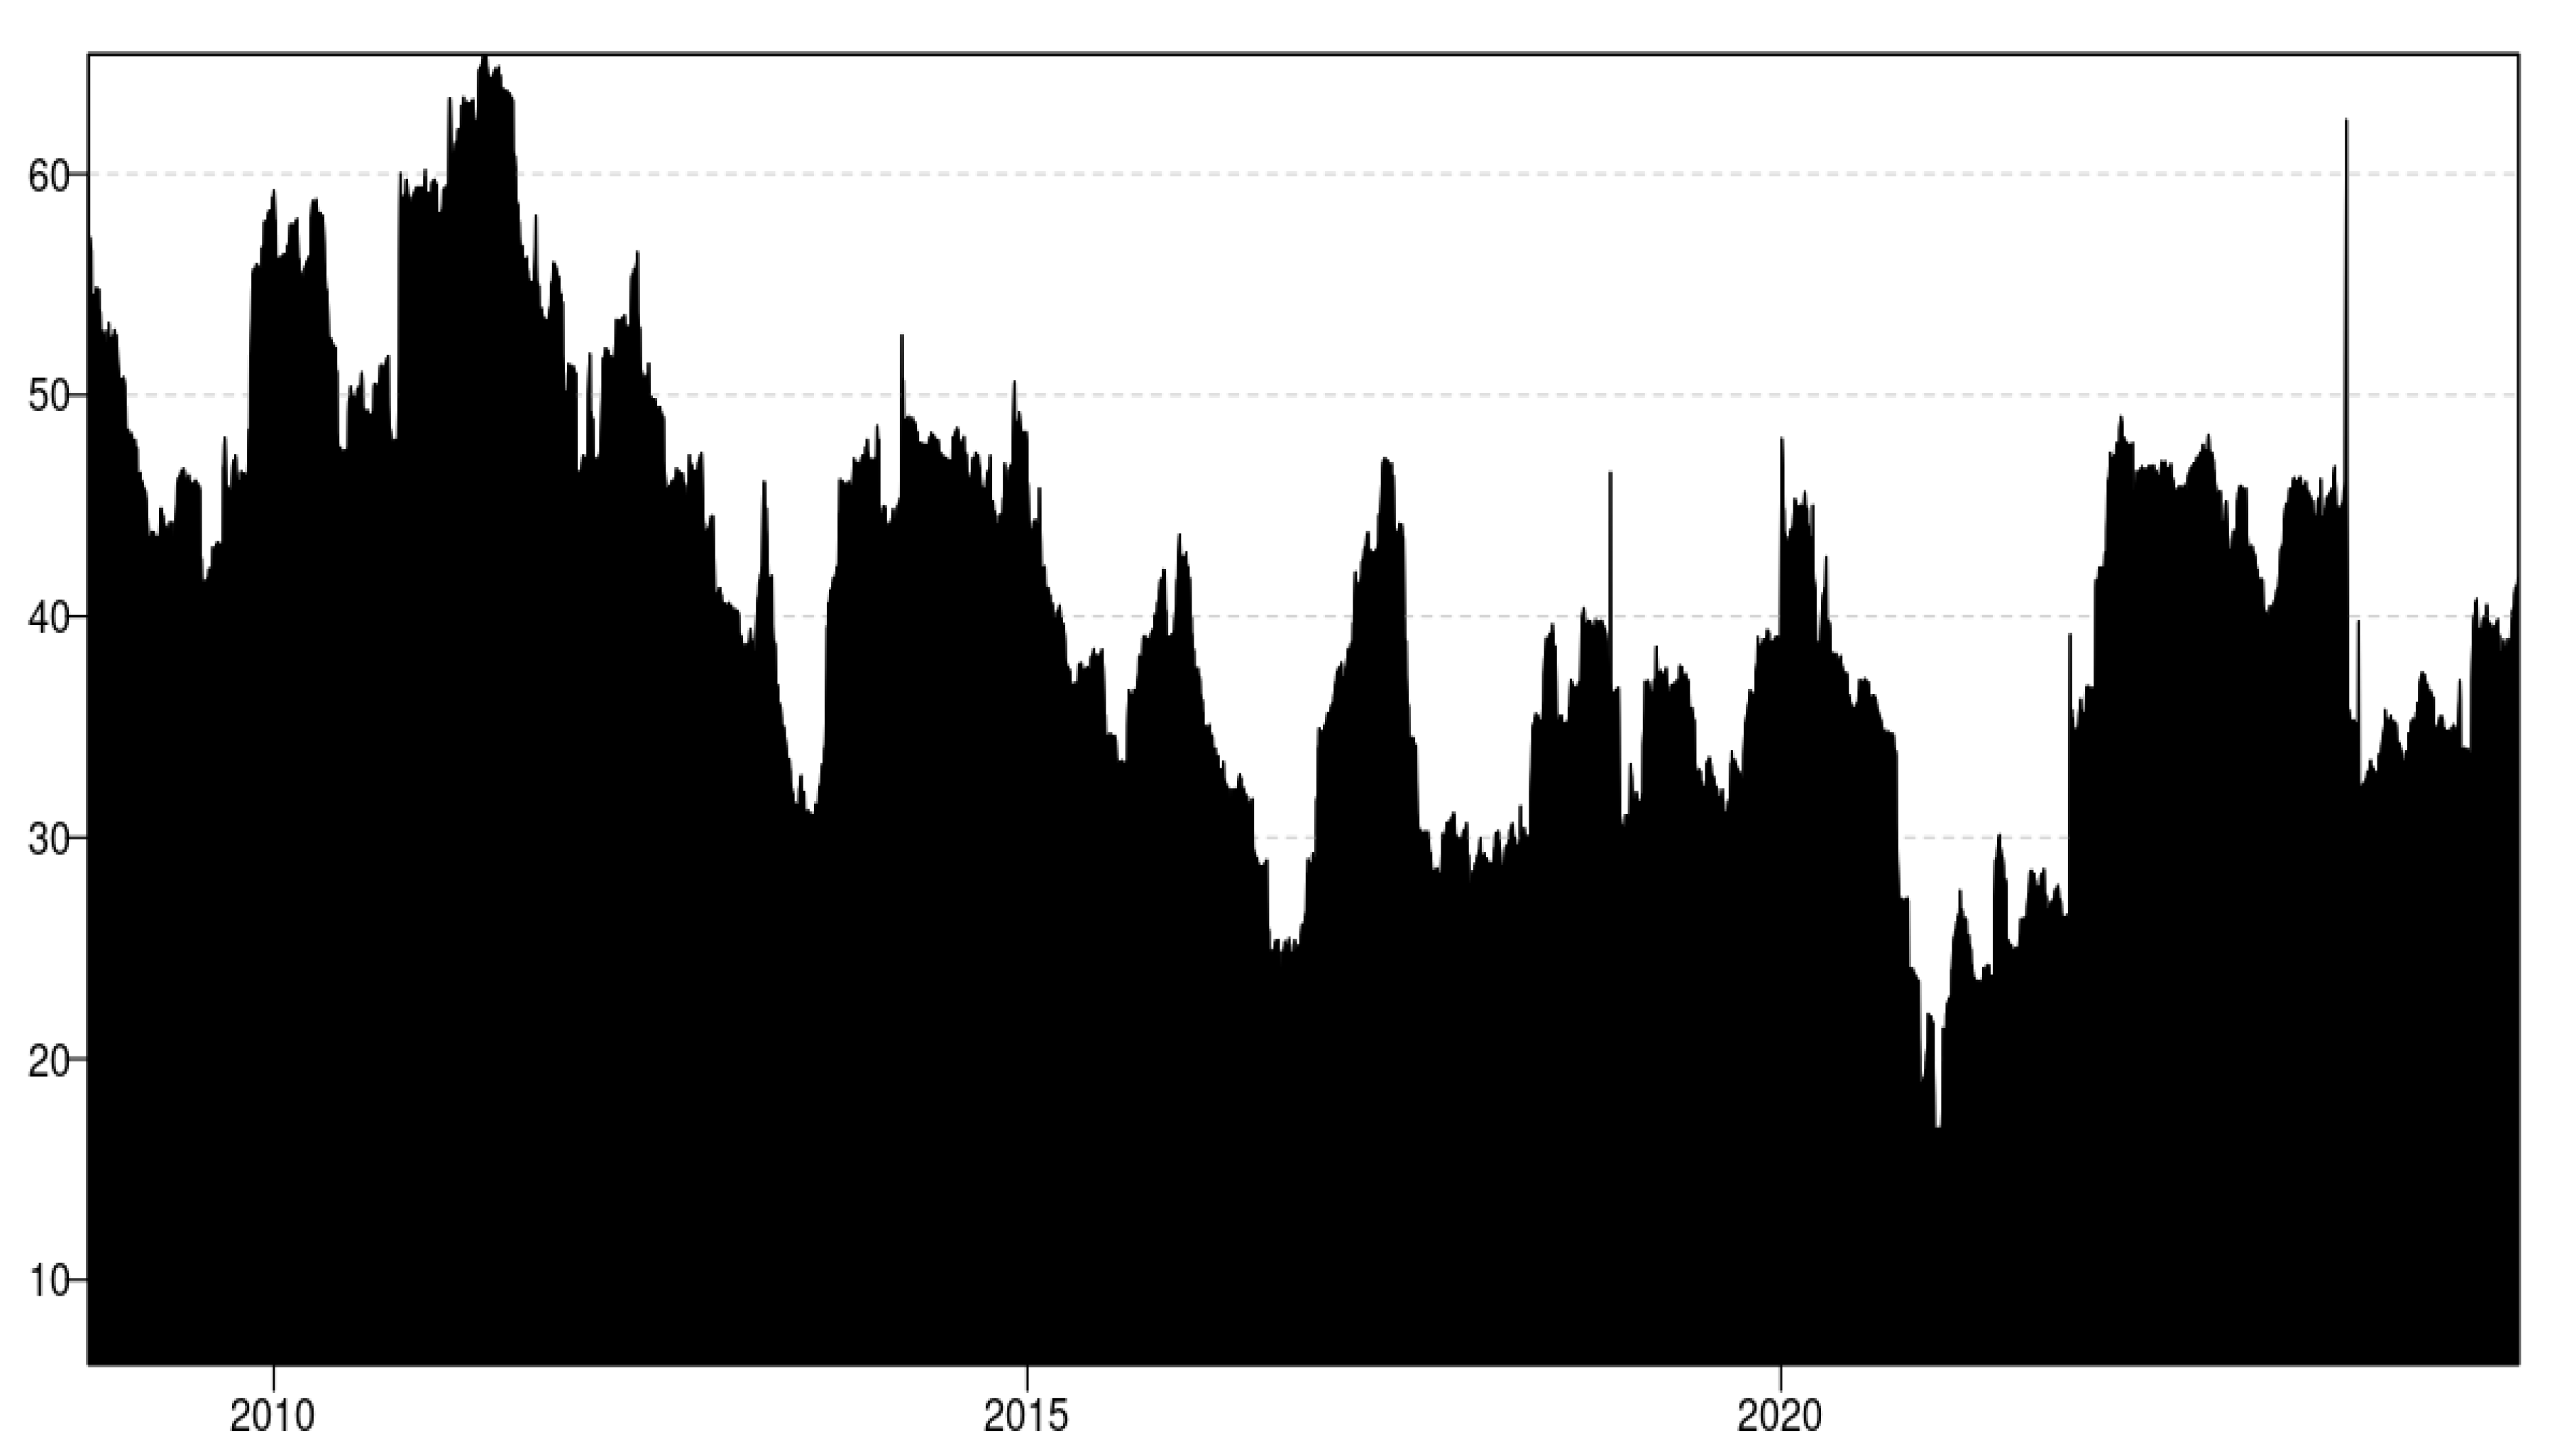
Figure 4.
Dynamic Network Connectedness Volatility and Spillover Transited from Single Asset “TO” other Underlined Assets. Source: Authors Calculation using fully sample data from 2008 to 2024.
Figure 4.
Dynamic Network Connectedness Volatility and Spillover Transited from Single Asset “TO” other Underlined Assets. Source: Authors Calculation using fully sample data from 2008 to 2024.
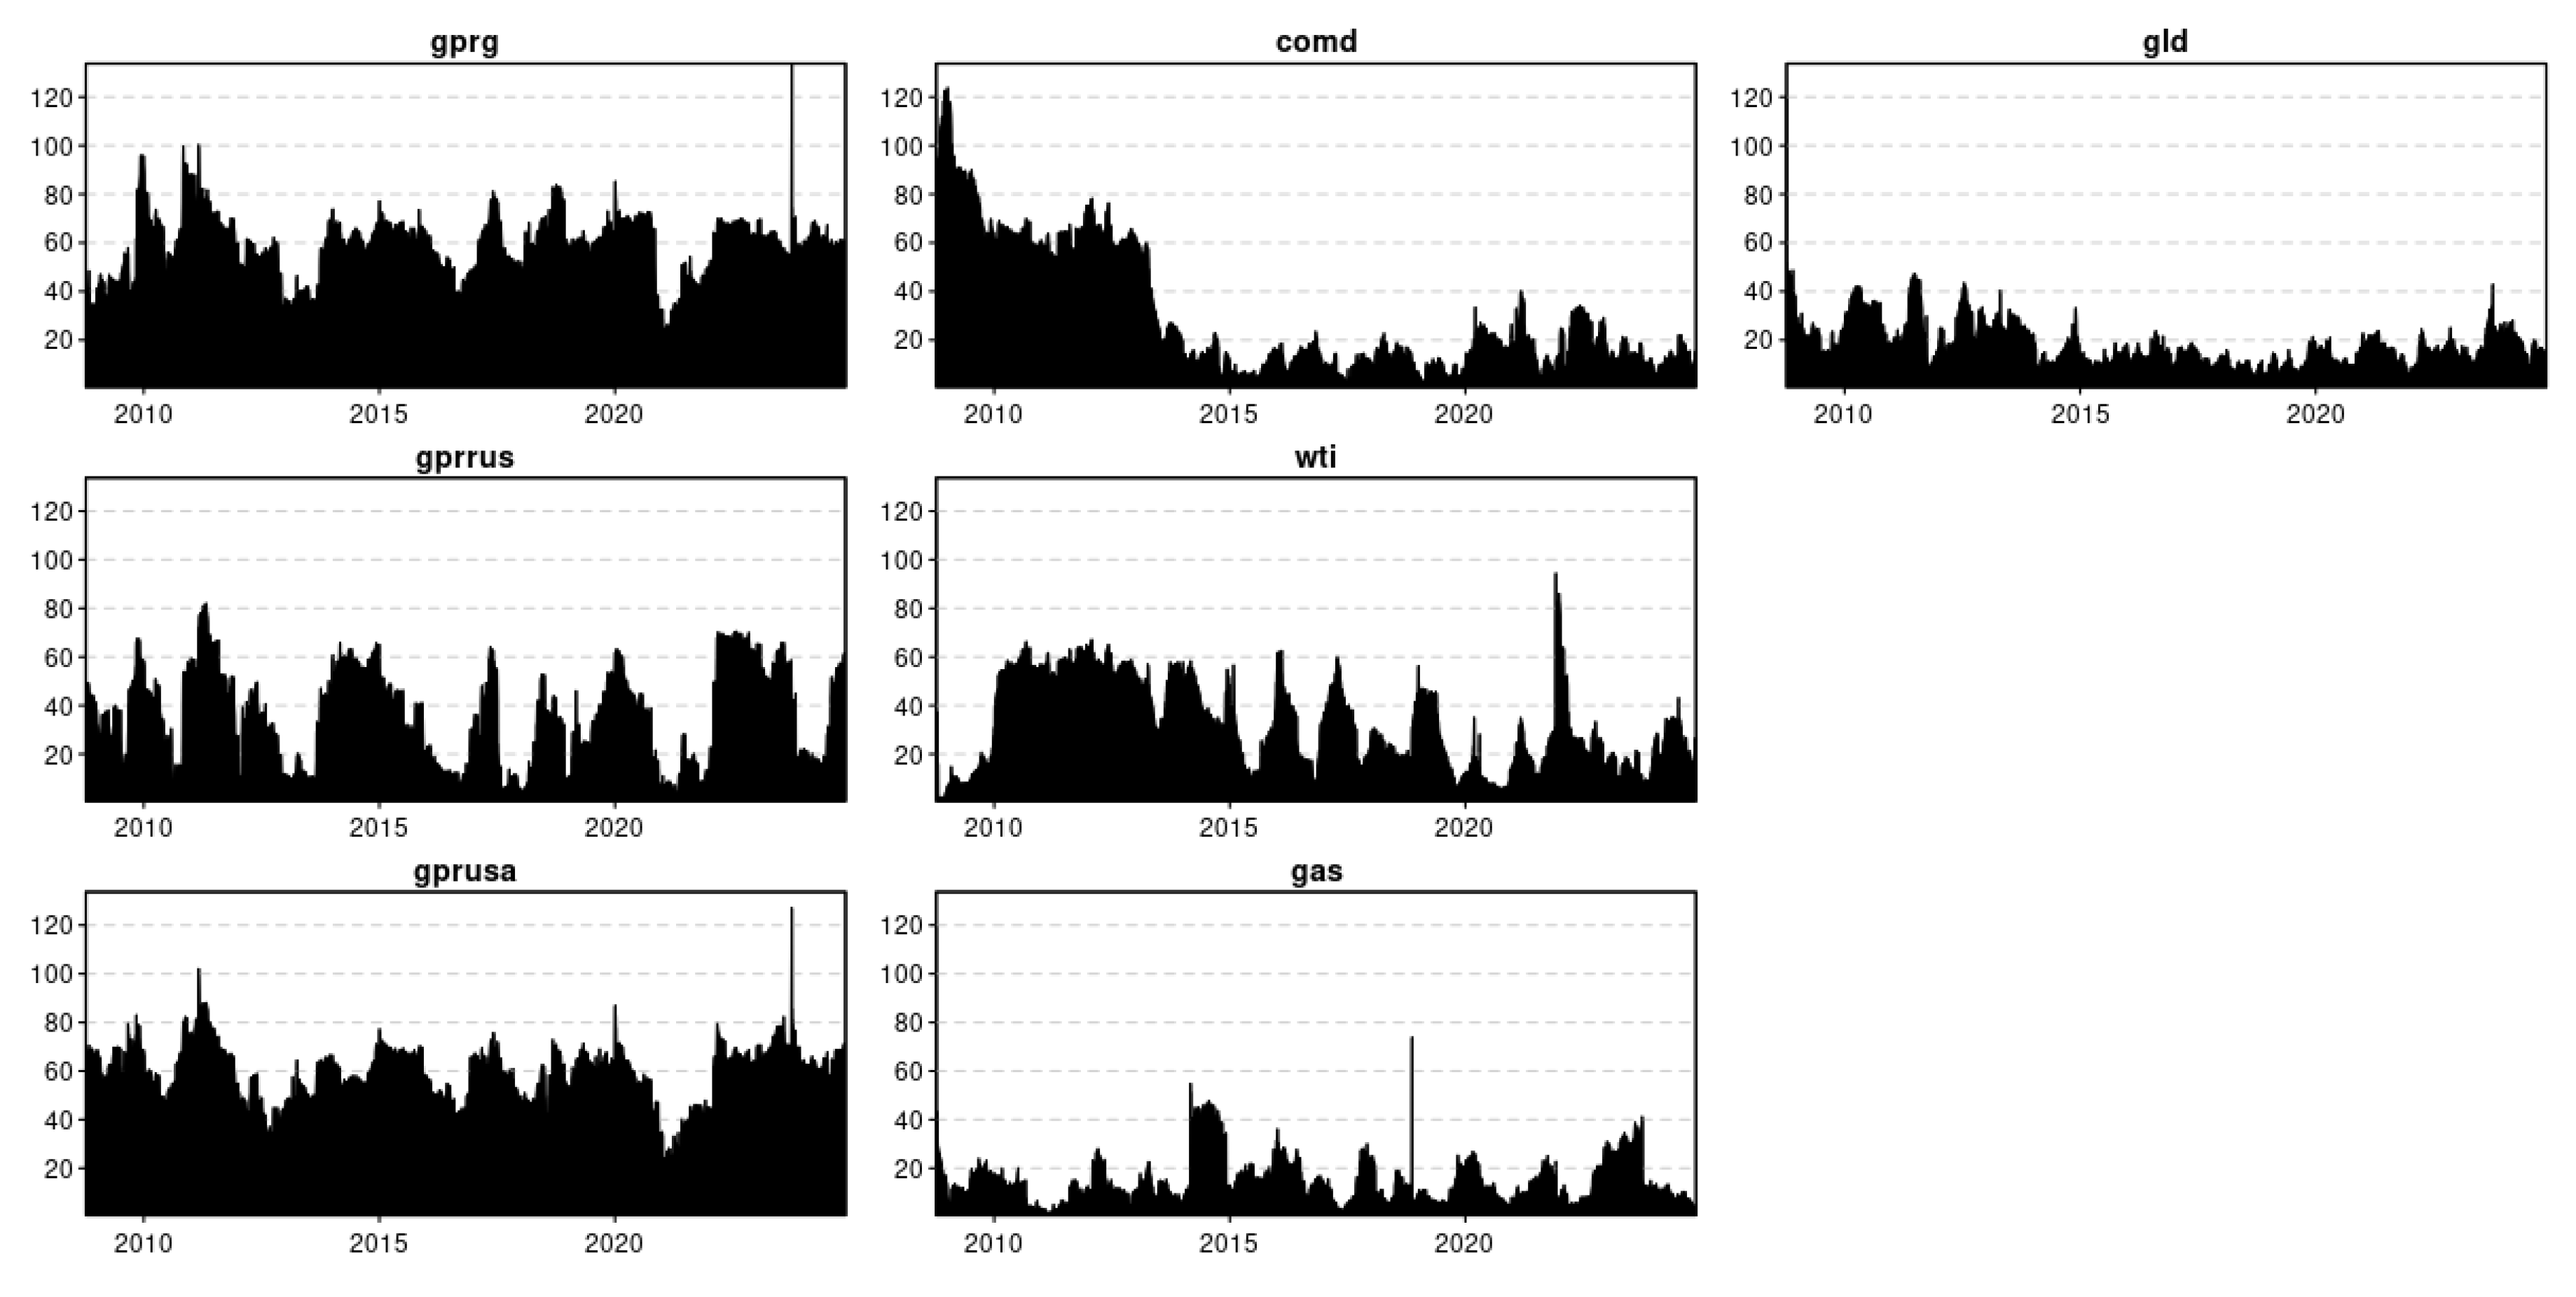
Figure 5.
Dynamic Network Connectedness Volatility and Spillover Transited “FROM” Single Asset to other Underlined Assets. Source: Authors Calculation using fully sample data from 2008 to 202.
Figure 5.
Dynamic Network Connectedness Volatility and Spillover Transited “FROM” Single Asset to other Underlined Assets. Source: Authors Calculation using fully sample data from 2008 to 202.
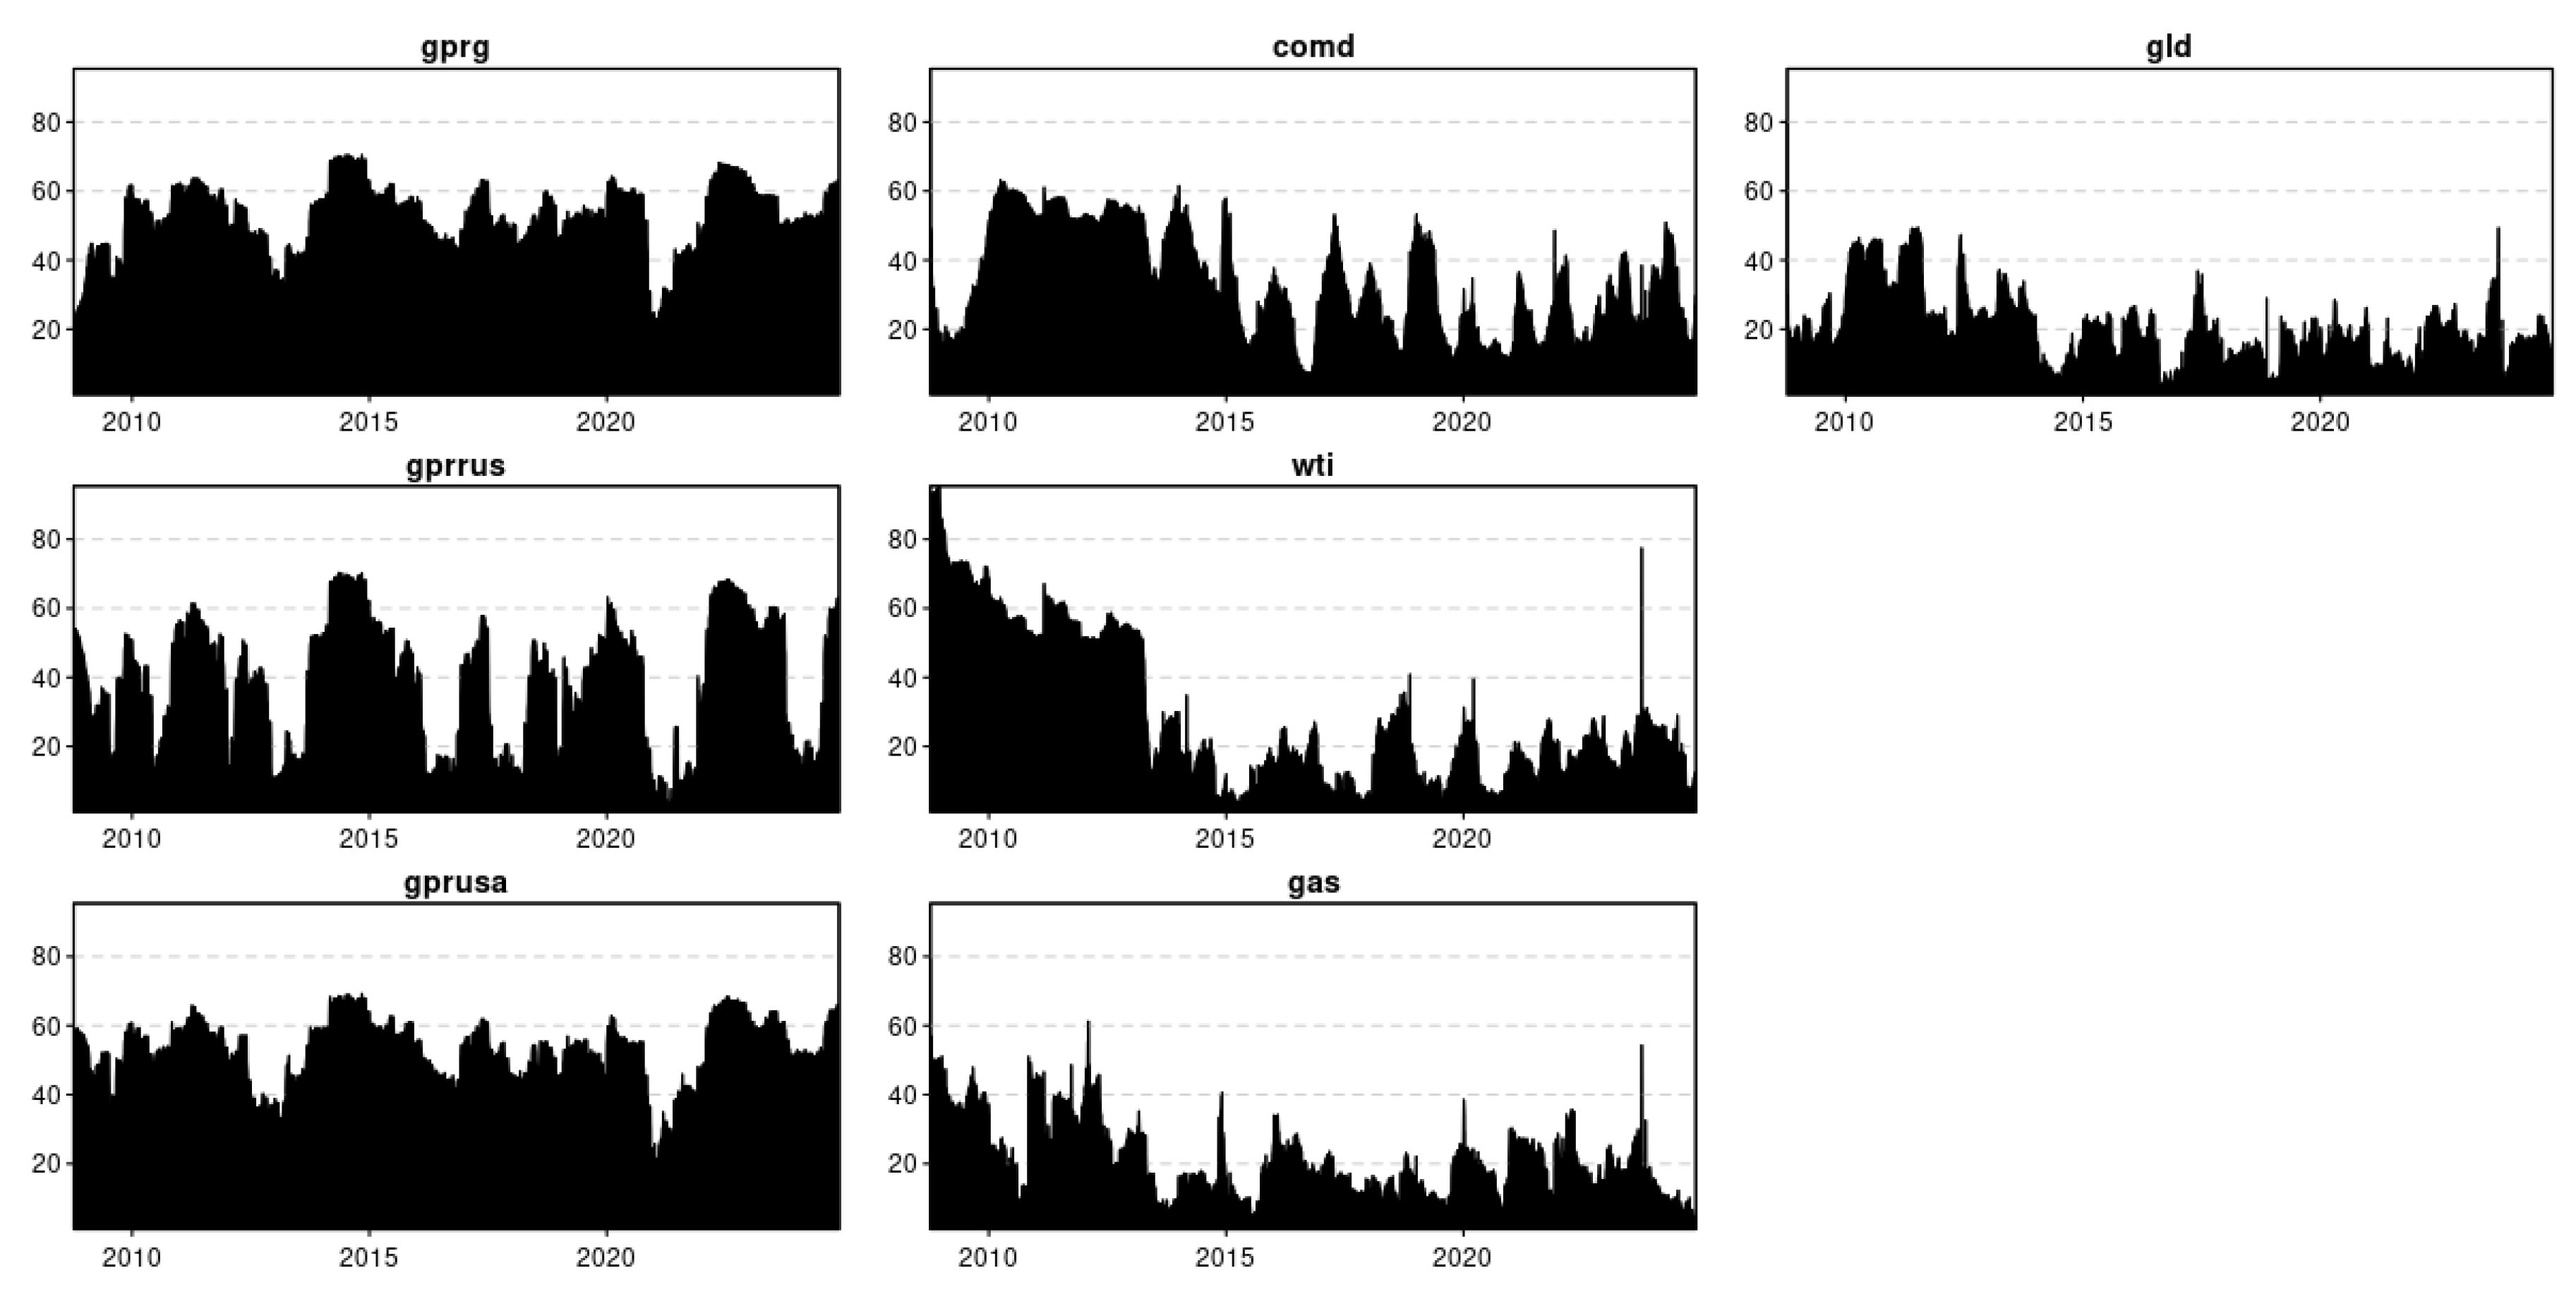

Table 1.
Variables Description and Data Sources.
| Variable | Representation | Unit Of Measurement | Data Source |
|---|---|---|---|
| Commodity Index | Comd. | Current spot price in US Dollar | S&P Goldman Sachs Commodity Index (S&P GSCI), Garman and Klass (1980) |
| Crude Oil Futures | WTI | US Dollar Per Barrel | Energy Information Administration https://www.eia.gov |
| Natural Gas Futures | GAS | Dollars Per Million Btu | Energy Information Administration https://www.eia.gov |
| Gold | GLD | Current Price of Gold Per Ounce in US Dollar | https://goldprice.org/spot-gold.html |
| Geopolitical Risk Global | GPR | Frequency of Newspaper Stories and Features Worldwide | https://www.matteoiacoviello.com/gpr.htm Caldara and Iacoviello (2018) |
| Geopolitical Risk Russia | GPR-RUS | Frequency of Newspaper Stories and Features related to Russia | https://www.matteoiacoviello.com/gpr.htm Caldara and Iacoviello (2018) |
| Geopolitical Risk USA | GPR-USA | Frequency of Newspaper Stories and Features related to USA | https://www.matteoiacoviello.com/gpr.htm Caldara and Iacoviello (2018) |
| Date January 01, 2008, to November 25, 2024 | Data time Span | Crises Measurement | Volatility and Spillover |
| COVID-19 | Event-1 | Crises Measurement | WHO announced COVID-19 (March 11, 2020) |
| Russia Ukraine Conflict | Event-2 | Crises Measurement | Russia Ukraine Conflict (Feb 24, 2022) |
Source: Author’s Calculation.
Table 2.
Summary Statistics.
| GPR-RUS | COMD | WTI | GAS | GLD | |
|---|---|---|---|---|---|
| Mean | 1.068 | 8.146 | 4.272 | 1.734 | 7.258 |
| Variance | 0.111 | 0.147 | 0.102 | 0.059 | 0.065 |
| Skewness | 0.289*** | 0.273*** | -0.533*** | 1.478*** | 0.001 |
| 0 | 0 | 0 | 0 | -0.975 | |
| Ex.Kurtosis | -0.163** | -0.052 | -0.058 | 2.375*** | -0.323*** |
| -0.019 | -0.504 | -0.451 | 0 | 0 | |
| JB | 66.169*** | 55.091*** | 209.333*** | 2636.992*** | 19.148*** |
| 0 | 0 | 0 | 0 | 0 | |
| ERS | -0.246 | -0.062 | -1.074 | -0.658 | 0.83 |
| -0.805 | -0.951 | -0.283 | -0.511 | -0.407 | |
| Q(10) | 23508.930*** | 23909.399*** | 23587.762*** | 23339.532*** | 23874.570*** |
| 0 | 0 | 0 | 0 | 0 | |
| Q2(10) | 23598.807*** | 23892.272*** | 23622.239*** | 23325.317*** | 23870.574*** |
| 0 | 0 | 0 | 0 | 0 | |
| ADF | 16.833*** | 14.132*** | 15.309*** | 14.004*** | 7.910*** |
Note: The *, ** and *** represents the significance level at 99%, 95% and 90%. Source: Authors Calculation using fully sample data from 2008 to 2024.
Table 3.
Dynamic Volatility and Spillover Estimation.
| GPRRUS | COMD | WTI | GAS | GLD | FROM | |
|---|---|---|---|---|---|---|
| GPRRUS | 87.34 | 2.44 | 2.62 | 4.14 | 3.46 | 51.66 |
| COMD | 1.66 | 53.4 | 36.82 | 3.53 | 4.59 | 46.6 |
| WTI | 1.84 | 16.05 | 73.51 | 4.48 | 4.12 | 26.49 |
| GAS | 2.08 | 2.33 | 2.83 | 89.24 | 3.52 | 10.76 |
| GLD | 2.37 | 5.24 | 4.69 | 2.32 | 85.37 | 14.63 |
| TO | 70.95 | 26.06 | 46.97 | 14.46 | 15.7 | 111.14 |
| INC.OWN | 95.29 | 79.46 | 120.47 | 103.71 | 101.07 | cTCI/TCI |
| NET | -4.71 | -20.54 | 20.47 | 3.71 | 1.07 | 27.78/22.23 |
| NPT | 0 | 2 | 3 | 3 | 2 | --- |
Source: Authors Calculation using fully sample data from 2008 to 2024.
Table 4.
Dynamic Volatility and Spillover Estimation (Fully sample Analysis).
| GPRRUS | COMD | WTI | GAS | GLD | FROM | |
|---|---|---|---|---|---|---|
| GPRRUS | 67.34 | 2.79 | 12.62 | 14.14 | 13.46 | 31.66 |
| COMD | 11.66 | 43.4 | 16.82 | 13.53 | 14.59 | 26.6 |
| WTI | 10.84 | 12.05 | 23.51 | 24.48 | 14.12 | 16.49 |
| GAS | 21.08 | 12.33 | 12.83 | 49.24 | 13.52 | 30.76 |
| GLD | 12.37 | 15.24 | 14.69 | 12.32 | 75.37 | 24.63 |
| TO | 51.95 | 16.06 | 26.91 | 11.46 | 15.7 | 91.14 |
| INC.OWN | 91.29 | 39.46 | 10.47 | 10.71 | 10.07 | cTCI/TCI |
| NET | -3.71 | -10.54 | 10.47 | 3.71 | 1.07 | 21.78/22.23 |
| NPT | 1 | 2 | 3 | 4 | 5 | --- |
Source: Authors Calculation using fully sample data from 2008 to 2024.
Disclaimer/Publisher’s Note: The statements, opinions and data contained in all publications are solely those of the individual author(s) and contributor(s) and not of MDPI and/or the editor(s). MDPI and/or the editor(s) disclaim responsibility for any injury to people or property resulting from any ideas, methods, instructions or products referred to in the content. |
© 2025 by the authors. Licensee MDPI, Basel, Switzerland. This article is an open access article distributed under the terms and conditions of the Creative Commons Attribution (CC BY) license (http://creativecommons.org/licenses/by/4.0/).
Copyright: This open access article is published under a Creative Commons CC BY 4.0 license, which permit the free download, distribution, and reuse, provided that the author and preprint are cited in any reuse.


