

Submitted:
07 June 2023
Posted:
08 June 2023
You are already at the latest version
Abstract
This study investigates the relationship between clean and dirty energy markets, specifically focusing on clean energy stock indexes and their potential as hedging assets and safe havens during periods of global economic uncertainty. The research analyzes five clean energy indexes and five dirty energy indexes from May 2018 to May 2023, considering events like the global pandemic and the Russian invasion of Ukraine. The main objective is to examine the causal relationship among different stock indexes pertaining to dirty and clean energy by using the Granger causality test (VAR Granger Causality/Block Exogeneity Wald Test) to determine whether clean energy indexes can predict future prices of dirty energy indexes. However, the findings reveal that clean and dirty energy indexes do not exhibit hedging characteristics or serve as safe havens during times of economic uncertainty, rejecting the research question. These results have important implications for investment strategies, as assets lacking safe haven characteristics may not preserve portfolio efficiency in uncertain times. The study's insights provide valuable guidance for investors, poli-cymakers, and participants in energy financial markets. It highlights the need to adapt investment approaches and seek alternative options to navigate uncertain economic conditions effectively.
Keywords:
clean energy
; dirty energy
; dependency
; hedge
; safe haven
1. Introduction
Throughout the last two centuries, the use of dirty energy sources, namely coal, oil, and gas, has been instrumental in fostering economic growth and industrial advancement. Nevertheless, this model has made a considerable contribution to climate change and various environmental predicaments, prompting mounting apprehensions regarding its sustainability. The increasing worldwide attention towards mitigating carbon emissions and the shift towards sustainable energy sources have resulted in substantial funding for renewable energy technologies like solar, wind, hydro, and geothermal. The emergence of clean energy has been identified as a pivotal sector that propels economic growth in numerous countries. The WilderHill Clean Energy Index was instituted in 2004 with the aim of overseeing the advancement of the clean energy industry. The present index monitors the progress of open-source enterprises that are engaged in the creation and manufacturing of sustainable energy solutions, including but not limited to solar panels, wind turbines, and biofuels. The index is widely acknowledged as the main benchmark for evaluating the clean energy industry and has emerged as a crucial instrument for investors seeking to allocate resources to this fast-growing domain. The scope includes entities of varying magnitudes, ranging from nascent startups to expansive multinational corporations, and includes a wide range of clean energy technologies and services. Notwithstanding certain challenges, such as uncertainties in the political and regulatory spheres and the intermittent nature of certain renewable energy sources, the clean energy industry is persistently growing, powered by decreasing expenses and increasing market interest. The WilderHill Clean Energy Index has exhibited substantial progress over the last ten years, as evidenced by its impressive gains. The adoption of sustainable energy sources is of the utmost importance in addressing the effects of climate change and establishing a viable path towards sustainability [1,2,3]. Top of FormTop of Form
Also, in recent years, a number of additional indexes pertaining to clean energy have surfaced. The financial markets for clean energy have provided investors with the chance to synchronize their financial objectives with climate goals. Amidst the global focus on mitigating climate risks and transitioning towards a carbon-resistant economy, investors have shown considerable interest in clean energy investments. This trend is observed as policymakers worldwide prioritize the reduction of carbon emissions [4,5].
Presently, the clean energy sector is among the fastest-expanding segments of the energy industry. According to recent statistical data, the clean energy industry demonstrated a yearly growth rate of 5% during the period of 2009 to 2019, in contrast to the annual growth rate of 1.7% observed in the non-renewable energy sector. Consequently, a significant amount of capital is being reallocated from traditional energy sources towards clean energy. An instance of noteworthy growth can be observed in the clean energy sector's global investments, which increased from $120.1 billion to $363.3 billion during the period of 2009 to 2019. Despite the COVID-19 pandemic, there was a 2% rise in investments in clean energy. The surge in demand for environmentally friendly energy sources has resulted in heightened attention from market players towards clean energy stock investments (Bloomberg New Energy Finance, 2019).
Although the clean energy sector has experienced remarkable expansion, conventional fossil fuels continue to dominate as the primary source of energy on a global scale. Furthermore, clean energy sources are frequently regarded as substitutes for polluting energy sources, thereby implying that the advancement and endurance of the clean energy industry are inextricably linked to conventional energy markets. Furthermore, the notion of decarbonization is experiencing increasing momentum on a global scale, particularly in the wake of the Paris climate accord of 2015 and the 26th Conference of the Parties (COP26). Efforts have been made by regulatory bodies, corporations, financial institutions, and investors to substitute dirty energy with clean energy alternatives. According to a number of experts, it is widely believed that the attainment of the desired progress at COP26 hinges significantly on the investment in clean energy [6,7,8,9].
The extant literature on the markets for dirty and clean energy reveals the existence of two predominant perspectives. The initial perspective places emphasis on the replacement of conventional energy sources with cleaner alternatives [10,11,12,13]. The prior theory posits that an increase in oil prices incentivizes energy investors to transition towards renewable energy sources, thereby resulting in a surge in the adoption of clean energy. The transition ultimately leads to a rise in the profits of the renewable energy industry, culminating in a robust showing of clean energy stocks in the capital markets. The second perspective, known as the dissociation hypothesis, posits that clean energy and conventional energy function within distinct markets and are not amenable to direct comparison [14,15,16].
The present study makes a valuable contribution to the existing body of literature in several respects. Prior research has primarily focused on examining the links between the crude oil market and clean energy stocks in the context of the relationship between dirty and clean energy markets [17]. Insufficient consideration has been given to understanding the links between clean energy initiatives and fossil fuels, including but not limited to natural gas and diesel. This research expands upon existing literature by investigating the transitions between markets for both environmentally harmful and environmentally friendly energy sources. This study presents a broad sample of fossil fuel markets, including Brent Crude Spot, WTI, Saudi Arabian Oil, FTSE 350 Oil, Gas & Coal, and Euro Stoxx Oil & Gas, alongside clean energy indexes such as Nasdaq Clean Edge Green Energy, WilderHill Clean Energy, S&P Global Clean Energy, iShares Global Clean Energy ETF, and Clean Energy Fuels. The purpose of this analysis is to investigate the association between clean and dirty energy stock indexes. This study represents a pioneering effort in documenting the influence of the events of 2020 and 2022 on the structural dynamics and correlations between markets for dirty and clean energy. The authors [18], [19], and [20] have conducted a thorough investigation into the impact of the outbreak on energy prices and energy stock markets. However, the effects of the 2020 and 2022 events on the correlation between clean energy reserves and dirty energy have yet to be examined. The study employs a time-frequency approach to examine the linkages between the markets for dirty and clean energy. Specifically, the sample will be partitioned into two subperiods. Between May 3, 2018, and December 31, 2019, the designation "Tranquil" was employed. Subsequently, from January 1, 2020, to May 2, 2023, the designation "Stress" was utilized, encompassing the events of both 2020 and 2022.
The present study is structured as follows: Section 2 provides an overview of the relevant literature pertaining to the subject matter. Section 3 of the paper outlines the specifics of the data utilized and expounds upon the econometric methods employed in the investigation. Section 4 presents the empirical findings and corresponding discussion. Section 5 of the paper outlines the main findings of the study and provides insight into potential avenues for future investigation.
2. Literature Review
The shift towards a carbon-resilient economy has garnered significant attention from both academic circles and various stakeholders, including investors and financial institutions, in the past few decades. The process of transition entails a shift from conventional carbon-intensive energy sources, such as coal and oil, to cleaner and more sustainable alternatives, such as solar and wind energy. The Paris climate accord, ratified in 2015, has been a significant catalyst for this transition, as it established the objective of restricting the increase in global temperatures to below 2 degrees Celsius from pre-industrial levels, with the aim of capping the rise at 1.5 degrees. Attainment of this objective necessitates substantial curtailment of greenhouse gas emissions, particularly those emanating from the energy domain. COP26, held in November 2021, represented a pivotal juncture in the worldwide endeavor to address the issue of climate change. One of the primary obstacles to this transition pertains to the imperative of striking a balance between the immediate economic advantages of conventional energy sources and their enduring environmental consequences. In recent times, there has been a notable increase in consciousness among multiple companies and investors regarding the risks associated with investments in coal-intensive industries. This is primarily due to the anticipated rise in the cost of carbon emissions in the future, which is expected to render such investments less appealing. Simultaneously, the shift towards sustainable energy sources presents notable prospects, particularly in domains such as sustainable energy, energy efficiency, and eco-friendly transportation. The mentioned industries are anticipated to experience noteworthy expansion in the forthcoming years, owing to the escalating requirement for sustainable energy. In general, the shift towards a carbon-resilient economy is a multifaceted and demanding undertaking, yet it is increasingly acknowledged to be crucial in tackling the worldwide predicament of climate change. With the upcoming COP26 and beyond, there is an increasing impetus to expedite the transition towards sustainable practices, and investors are poised to assume a pivotal function in propelling this transformation [21,22].
The authors, [23], argue that an increase in traditional energy prices and/or the implementation of a carbon emissions fee would incentivize the allocation of financial resources towards clean energy companies. The authors underscore the independent impact of oil prices and technology stock prices on the stock prices of clean energy firms. [24] conducted an analysis to examine the relationships among oil prices, clean energy stock prices, and technology stock prices. The findings suggest the occurrence of a structural modification towards the conclusion of 2007, coinciding with a notable escalation in oil costs. The authors' findings reveal a positive relation between clean energy prices and oil prices subsequent to structural breaks, which differs from prior research. There appears to be a parallelism in the market reaction to the stock prices of clean energy and technology.
Recent research has shown that the performance of clean energy stock markets can be substantially influenced by political and climate-related occurrences. The study conducted by [15] revealed that the implementation of clean energy initiatives can be affected by political uncertainty and climate-related occurrences, such as extreme weather events. [25] posits that clean energy initiatives have recently emerged as a novel investment categorization, with clean energy enterprises garnering substantial interest from financial industry participants. The proliferation of clean energy funds and investment products accessible to investors is indicative of this trend. Investing in clean energy stocks presents an opportunity for investors to allocate their investments towards companies that are leading the way in the shift towards a low-carbon economy. Investing in clean energy stocks presents an opportunity for investors to allocate their funds towards companies that are leading the way in the shift towards a low-carbon economy. The mentioned enterprises are engaged in the advancement and manufacture of clean energy developments, including photovoltaic cells and wind power generators, and are favorably situated to reap the rewards of the escalating call for eco-friendly energy sources.
The global objective of transitioning to clean energy sources has become increasingly significant in light of mounting apprehensions regarding climate change and the imperative to curtail carbon emissions. The clean energy sector has garnered considerable interest from scholars, investors, and policymakers in the past few years. The majority of academic investigations in this domain have prioritized examining the relationship between crude oil prices and clean energy stocks while overlooking the potential shocks that may arise between the market for clean energy and other markets for non-renewable energy stocks. Exploring the relationship between indexes of clean and dirty energy is of paramount importance in knowing the intricacies of the energy market. This analysis can offer valuable insights into investment prospects and risks within this domain. The term "dirty energy stock indexes" pertains to corporations that engage in the production or extraction of energy from non-renewable resources, such as coal, oil, and gas. Conversely, "clean energy stocks" refer to companies that generate renewable energy through means such as wind, solar, and hydropower. The current literature lacks a theoretical framework regarding the relationship between clean energy indexes and dirty energy. Addressing this void can yield significant insights into the prospects for integration and diversification between these markets. The goal of this research topic is to make an academic contribution by analyzing short-term co-movements between indexes for both clean and dirty energy.
2.1. Studies Related to the Links Between Clean and Dirty Energies
In recent years, there has been a growing interest in understanding the relationship between dirty and clean energy, especially in the context of occurrences such as the COVID-19 pandemic in 2020 and the volatility of energy markets in 2022. The identification of renewable energy sources as a critical element in tackling energy and climate change concerns has been established. The advancement of renewable energy sources is frequently constrained by the traditional prices associated with fossil fuels. Therefore, it is essential to explore the interconnections between these two energy sources in order to foster the expansion of renewable energy and accomplish sustainable energy objectives.
The authors [10] conducted an empirical investigation into the relationship between the prices of alternative energy stocks, technology equities, oil, and interest rates. The study conducted by the authors demonstrates the impact of technology stock prices and oil prices on the price of alternative energy companies’ stocks, as evidenced by the Granger causality test. [13] investigated the interactive relationships between crude oil prices and the performance of alternative energy companies, revealing that from late 2006 onwards, the performance of alternative energy companies has been considerably influenced by fluctuations in oil prices.
The authors [11] and [12], as well as [26], conducted research on the synchronization trends between oil prices, technology, financial variables, and clean energy indexes. According to [11], the stock prices of alternative energy companies are subject to the influence of technology companies' stock prices, oil prices, and short-term interest rates. As noted by [12], there is evidence to suggest that crude oil prices are not the main driver of the stock market performance of renewable energy companies, both in the short and long term. This finding implies that there is a disconnection between the alternative energy sector and the conventional energy market. [26] assert that the carbon market has the power to explain the movements in the stock prices of clean energy companies, while the stock prices of clean power companies also exert an impact on the carbon market.
As stated by [27], there exists a weak connection between oil markets and renewable energy markets, suggesting that shocks in oil prices have a limited impact on the development of the renewable energy industry. On the other hand, [9] investigated the shocks between clean energy indexes and cryptocurrencies, taking into account their respective energy consumption levels. The authors discovered that clean energy is a more reliable safe haven for "dirty" cryptocurrencies than for "clean" ones, particularly during periods of uncertainty.
In a more recent study, [20] investigated the impact of fossil energy market shocks on clean energy stock markets during the COVID-19 pandemic. The authors discovered that the crash in crude oil prices led to significant shocks in the clean energy market. Meanwhile, the declaration of COVID-19 as a global pandemic caused an increase in the prices of natural gas and renewable energy sources following a substantial crash. [15] conducted an analysis on the spillovers of volatility among the renewable energy, oil, and technology stock markets spanning from 2004 to 2020. The study revealed that the oil and clean energy markets exhibit a bidirectional spillover effect, with the oil market acting as the main receiver of volatility.
The authors, [28], conducted a study on the impact of shocks between renewable energy prices and clean energy on the stock prices of the green economy. The study analyzed data from December 2010 to July 2021 and revealed that negative shocks were more prevalent than positive shocks in the renewable and clean power generation markets. The study revealed that the prices associated with the generation of renewable energy have a significant influence, either positively or negatively, on the stock prices of markets operating within the green economy. [6] conducted a study on the co-movements between clean energy and dirty energy stocks, both before and during the COVID-19 pandemic. The study used an extensive range of dirty energy stocks, including crude oil, heating oil, diesel, gasoline, and natural gas, while clean energy stocks were represented by the S&P Global Clean Energy Index and WilderHill Clean Energy Index. The findings suggest that there are feeble shocks between the stocks of clean energy and dirty energy indexes in both the short and long term. Significantly, there exists a notable dissociation trend between the markets for clean and dirty energy. Furthermore, the results demonstrate that the clean energy market remained largely insulated from the effects of the COVID-19 pandemic in 2020, highlighting the advantages of diversifying portfolios across both clean and dirty energy markets.
The significance of examining the interconnections between clean and dirty energy indexes has been underscored by recent occurrences in 2020 and 2022. Recent research indicates that there is a weak linkage between these two types of energy in the short term. However, there is a possibility of significant co-movements in the long term. The interconnections between fossil energy markets and clean energy stock markets call for an in-depth understanding of the potential impact that shocks in the former may have on the latter. Lastly, understanding the relationship between clean and dirty energy actions is crucial to improving the progress of renewable energy and attaining sustainable energy objectives, particularly in light of worldwide predicaments such as climate change and pandemics.
3. Materials and Methods
3.1. Materials
The daily price index constitutes the data used for the study. The study includes a total of 9 energy indexes consisting of 4 indexes related to dirty energy, namely Brent Crude Spot, WTI, FTSE 350 Oil, Gas & Coal, Euro Stoxx Oil & Gas, and 5 indexes related to clean energy, namely Nasdaq Clean Edge Green Energy, WilderHill Clean Energy, S&P Global Clean Energy, iShares Global Clean Energy ETF, and Clean Energy Fuels.

Table 1.
A summary of the indexes used in this study.
| Indexes | Description |
|---|---|
| Brent Crude Spot | The index represents the spot price of Brent Crude, a crucial benchmark for worldwide oil prices. |
| Clean Energy Fuels | The index indicates the stock prices pertaining to companies that operate in the clean energy markets, with a particular emphasis on alternative fuel sources and sustainable energy solutions. |
| Euro Stoxx Oil & Gas | The index monitors the operational efficiency and financial performance of oil and gas corporations operating within the Eurozone. |
| FTSE 350 Oil, Gas & Coal | The index includes companies based in the UK and serves as a metric for evaluating the performance of the oil, gas, and coal industries. |
| iShares Global Clean Energy ETF | The index is an exchange-traded fund that is designed to track the financial performance of global clean energy companies. |
| Nasdaq Clean Edge Green Energy | The index focuses on the stock prices of corporations operating in the green energy industry that are officially registered on the Nasdaq stock exchange. |
| S&P Global Clean Energy | The index refers to the performance of global clean energy corporations and constitutes an element of the S&P Dow Jones Indexes. |
| WilderHill Clean Energy | The purpose of this index is to accurately represent the performance of United States clean energy companies. |
| WTI | The West Texas Intermediate (WTI) crude oil price index is a significant benchmark used for the determination of oil prices. |
Source: Own elaboration.
The temporal scope of this study covers a period spanning from May 3, 2018, to May 2, 2023. To enhance the robustness of the findings, the sample was partitioned into two distinct subperiods: a Tranquil period characterized by apparent stability in the international financial markets and a Stress period marked by events of high complexity for the global economy, including the COVID-19 pandemic, the oil price war between OPEP members (Russia and Saudi Arabia), and the armed conflict between Russia and Ukraine in 2022. The data was obtained via the Thomson Reuters Eikon platform and is expressed in US dollars.
The decision was made to use a series of returns instead of a price series based on an examination of the behavior of the clean and dirty energy markets. According to [29] and [30], investors tend to prioritize information regarding the profitability of a specific asset or asset portfolio. Furthermore, the series of returns exhibits statistical characteristics that aid in their analysis and comprehension, with emphasis on stationarity, denoting that the mean and variance remain relatively constant over time. The aforementioned characteristic holds significance in the context of implementing econometric models, as it enables investors to acquire more valuable insights pertaining to the conduct of assets that are frequently absent in price series.
Where is the return on day , and and are the closing prices of the series at periods and , respectively.
3.2. Methods
The present study was conducted at different stages. Initially, the sample was characterized through the use of the main measures of descriptive statistics and the [31] adherence test, which assumes the null hypothesis of data normality. In order to verify the stationarity assumption of the data, specifically whether the series follows a white noise process characterized by a mean of 0 and constant variance, we will employ panel unit root tests from [32], with Fisher Chi-square transformation, and the [33] test, which posit identical hypotheses (). To validate the results, we will use the [34] test, which proposes an opposing null hypothesis (). The concurrent application of the tests will facilitate a more rigorous evaluation of the time series' stationarity. The Augmented Dickey-Fuller (ADF) test is a commonly employed tool in the evaluation of financial time series. It encompasses multiple variants, including the ADF Fisher Chi-square and ADF Choi Z-stat tests. The ADF Fisher Chi-square test is a version that employs a test statistic derived from the difference between the estimated and hypothetical coefficient values in the regression model. The ADF Choi Z-stat version uses a distinct methodology whereby the statistical values are obtained from the maximum likelihood estimation of the autoregressive model. Both iterations are used to evaluate the existence or non-existence of a unit root within the time series. Furthermore, the [34] test relies on the estimation of the regression coefficient between differences in series and a set of instrumental variables, which are employed to detect the presence of a deterministic trend in time series. In addition, residue stability tests have been employed to validate the presence of disturbances in variance for both the clean and dirty energy stock indexes. This test enables the identification of significant changes in variance over the sample period, while considering the occurrences in 2020 and 2022.
The research question will be addressed through the use of the Granger VAR (vector autoregressive) causality econometric model. This model is founded on the examination of the causal relationship among variables within a time series framework that encompasses multiple variables. The Granger causality principle, as applied in a Vector Autoregressive (VAR) framework, posits that the predictive accuracy of a particular variable can be enhanced by incorporating its past values, provided that the variable is deemed to be the causal factor, or "Granger cause," of another variable. The Granger causality test enables the evaluation of the magnitude and direction of causal relationships among the variables. Typically, the following steps are pursued when implementing the application: Initially, it is necessary to ascertain the suitable lag sequence for the Vector Autoregression (VAR) model, which will denote the number of past periods used for predicting the current value of the variables. The criteria for selecting the lag order in a vector autoregression model are commonly referred to as "VAR Lag Order Selection Criteria" in academic literature. Subsequently, the parameters of the Vector Autoregressive (VAR) model ought to be estimated through the use of the minimum ordinary squares (OLS) and/or maximum likelihood estimation (MLE) techniques. The VAR Residual Serial Correlation LM test is employed to determine whether the residues exhibit temporal autocorrelation. To acquire a more comprehensive understanding, it is recommended to study the works of [35] and [36].
4. Results
4.1. Descriptive Statistics
Figure 1 displays the evolution, in daily returns, of two distinct energy stock indexes, namely, the dirty and clean energy indexes. The indexes included in the analysis are Brent Crude Spot, Clean Energy Fuels, Euro Stoxx Oil & Gas, FTSE 350 Oil, Gas & Coal, iShares Global Clean Energy ETF, Nasdaq Clean Edge Green Energy, S&P Global Clean Energy, Saudi Arabian Oil, WilderHill Clean Energy, and WTI. The period considered for the analysis covers May 3, 2018, to May 2, 2023. Based on graphical analysis, it can be inferred that the mean return exhibits a certain degree of stability, as indicated by its proximity to zero. However, the data exhibits notable fluctuations, indicating the volatility to which these markets have been exposed, particularly during the initial months of 2020, a period that coincided with the repercussions of the COVID-19 pandemic on the global economy.
Table 2 displays a summary of the main descriptive statistical measures, in daily returns, for the time series of the dirty and clean indexes, namely, Brent Crude Spot, Clean Energy Fuels, Euro Stoxx Oil & Gas, FTSE 350 Oil, Gas & Coal, iShares Global Clean Energy ETF, Nasdaq Clean Edge Green Energy, S&P Global Clean Energy, WilderHill Clean Energy, and WTI. The period used for the analysis extends from May 3, 2018, to May 2, 2023. Upon examination of the statistical summary table, it is evident that the mean returns exhibit a positive trend. Additionally, it is noteworthy that the Clean Energy Fuels stock index displays the highest standard deviation (0.040084). In order to ascertain the presence of Gaussian distributions, it is essential to observe that skewness reveals values different from the reference value of 0. Upon analysis, it is observed that Brent exhibits the most prominent value (-11.31994). In addition, it was observed that all stock indexes exhibit values exceeding 3, with particular emphasis on the Brent stock index (418.9986). The findings are further corroborated by the [31] test, which also leads to rejection of the null hypothesis at a significance level of 1%. These results were anticipated as a consequence of the existence of "fat tails," which denote extreme values, that emerged from the events of 2020 and 2022.
The Q-Q Plots chart for the clean and dirty energy stock indexes, namely, Brent Crude Spot, Clean Energy Fuels, Euro Stoxx Oil & Gas, FTSE 350 Oil, Gas & Coal, iShares Global Clean Energy ETF, Nasdaq Clean Edge Green Energy, S&P Global Clear Energy, WilderHill Clean Energy, and WTI, is depicted in Figure 2. The period considered for the analysis spans from May 3, 2018, to May 2, 2023. The findings from the Q-Q plots show that the examined stock indexes' return distribution is both leptokurtic and asymmetric. This is due to the observed data distribution failing to align accurately with the 45-degree straight line, which represents a normal distribution. In light of the unavailability of precise information regarding the distribution of the time series being examined, it is possible to deduce an approximately normal distribution using the Central Limit Theorem (CLT), given that the data sets were comprised of a sufficiently large number of observations.
4.2. Descriptive Statistics
4.2.1. Time Series Stationarity
The study aimed to verify the stationarity assumption of different stock indexes, namely Brent Crude Spot, Clean Energy Fuels, Euro Stoxx Oil & Gas, FTSE 350 Oil, Gas & Coal, iShares Global Clean Energy ETF, Nasdaq Clean Edge Green Energy, S&P Global Clear Energy, WilderHill Clean Energy, and WTI. To achieve this, the panel unit root test of [32], Fisher Chi-square, and Choi Z-stat, as well as the [34] test, were employed. The intersection of the tests with different hypotheses is robust enough to pinpoint the level of dephasing of each time series until we reach the balance (average 0 and variance 1). The findings indicate that the time series exhibits unit roots upon estimation of the original price series. To attain stationarity, a logarithmic transformation was conducted on the first differences. This transformation facilitated the rejection of the null hypothesis in the [32] test, as evidenced by the Fisher Chi-square and Choi Z-stat. Based on the results of [34] test, it was observed that the null hypothesis was not rejected, thereby confirming the fundamental assumptions required for the estimation of VAR models (see Table 3 and Table 4).
4.2.2. Time Series Stationarity
Figure 3 shows the residue stability charts for different stock indexes, including Brent Crude Spot, Clean Energy Fuels, Euro Stoxx Oil & Gas, FTSE 350 Oil, Gas & Coal, iShares Global Clean Energy ETF, Nasdaq Clean Edge Green Energy, S&P Global Clean Energy, WilderHill Clean Energy, and WTI. By means of graphical analysis of the stability charts, it is possible to evaluate the existence of disruptions in the variance of residues. Furthermore, the presence of unstable behavior in the time series is confirmed by breaches of the 95% probability limits. The results suggest that the analyzed stock indexes exhibit fluctuating and uncertain trends, underscoring the significance of factoring in these variables when making investment decisions.
4.3. Methodological Results
4.3.1. VAR Granger Causality/Block Exogeneity Wald Test
The objective of this study is to examine the causal relationship structures among different stock indexes pertaining to dirty and clean energy. The indexes under consideration include Brent Crude Spot, Clean Energy Fuels, Euro Stoxx Oil & Gas, FTSE 350 Oil, Gas & Coal, iShares Global Clean Energy ETF, Nasdaq Clean Edge Green Energy, S&P Global Clean Energy, WilderHill Clean Energy, and WTI. The research period spanned from May 3, 2018, to May 2, 2023. The Granger causality test was employed to evaluate the predictive capacity of certain markets for the future prices of their peers. The present assessment endeavors to estimate an autoregressive vector and facilitate the identification of causal relationships among indexes.
To assess the effects of specific events on market relationships, the sample was partitioned into two distinct subperiods: Tranquil (May 3, 2018, to December 31, 2019) and Stress (January 1, 2020, to May 2, 2023), with the latter encompassing the COVID-19 pandemic crisis of 2020 and the armed conflict between Russia and Ukraine in 2022.
In order to mitigate the presence of autocorrelation in serial residues, we use a number of information criteria, as shown by the results of Table 5. During the Tranquil period, we employed the information criteria LR (Likelihood Ratio) to assess the sequentially modified LR test statistics. Our findings, at a 5% level of significance, revealed that there was a requirement for an 8-day lag in the estimation of VAR (Vector Autoregressive). The VAR residual serial correlation test was used to validate and ensure robustness, as well as to verify the absence of autocorrelation. The findings presented in Table 6 demonstrate that the detection of autocorrelation was not significant when using 9 lags. The findings confirm the validity of the Lag VAR's order selection criteria, which identified 8 as the optimal number of lags for conducting the analysis. The reliability and validity of the subsequent analysis can be ensured by eliminating autocorrelation and ascertaining the suitable lag order for the VAR model.
Table 7 shows the outcomes of the VAR Granger Causality/Block Exogeneity Wald test for the Tranquil period, which includes the Brent Crude Spot, WTI, FTSE 350 Oil, Gas & Coal, Euro Stoxx Oil & Gas indexes. The clean energy indexes are represented by Clean Energy, Nasdaq Clean Edge Green Energy, WilderHill Clean Energy, and S&P Global Clean Energy. The findings indicate the presence of 30 movements, out of a total of 72, that exert an influence on their peers. Notably, the WilderHill Clean Energy stock index has an influence on the price formation of 7 stock indexes out of a possible 8, while the
Brent causes 5 shocks. The Euro Stoxx Index and S&P Global Clean influence 4 shocks among their peers. Additionally, the stock indexes WTI (3), Clean Energy Fuels (2), iShares Global (2), Nasdaq Clean (2), and FTSE 350 (1). Furthermore, an analysis was conducted to determine the indexes that are most caused in the Grangerian sense, specifically those that experience the greatest effects. The results indicate that the Euro Stoxx Oil & Gas and FTSE 350 Oil, Gas & Coal indexes are the most influenced (7 out of 8 possible). This holds true regardless of whether the indexes relate to clean or dirty energy. The iShares Global (5), Nasdaq Clean (3), S&P Global (3), WilderHill (2), WTI (2), and Clean Energy (1) exhibit different levels of influence in smaller dimension, while the Brent (dirty energy index) is not influenced by any of the stock indexes under consideration. The findings indicate that the performance of clean energy indexes is not entirely isolated from general market conditions, even in a time of stability in global financial markets. The aforementioned statement suggests that portfolio managers who solely depend on clean energy stocks for diversification may need to reconsider their strategy. Specifically, they should reassess their risk profiles since clean stock indexes do not consistently exhibit the attributes of a safe haven or hedge. Consequently, this indicates that their risk exposure may be more substantial than previously perceived. To summarize, the results suggest that portfolio managers operating in the clean energy markets ought to implement a more exhaustive and distinct method when constructing portfolios, evaluating risks, and devising hedging strategies. In order to optimize performance and manage risks effectively, it is essential for individuals to take into account diversification, critically evaluate risk profiles, comprehend industry interdependence, explore hedge opportunities, and adapt to changing market conditions.
The analysis of the information criteria during the Stress period is presented in Table 8. The study used the LR (Likelihood Ratio) information criterion to determine the appropriate lag for estimating the VAR model. The results indicated that, at a significant level of 5%, the sequential modified LR test statistics recommended a 9-day lag. To ensure the reliability and validity of the analysis, the residual serial correlation test VAR was performed to confirm and ensure the absence of autocorrelation. The results of the test are presented in Table 9, which reveals that the absence of significant autocorrelation was observed with 10 lags. This finding is considered a fundamental requirement for a reliable estimation of VAR.
Table 10 presents the results of the VAR Granger Causality/Block Exogeneity Wald test for the Stress period, which covers the events of 2020 and 2022. The findings indicate that 59 out of 72 potential movements have an influence on the indexes of clean and dirty energy stocks. This suggests that during the recent period of financial turbulence in global markets, the co-movements between these stock indexes have intensified considerably. As a result, the assumptions of coverage and safe haven have been called into question.
The stock indexes that exert the greatest influence on the price formation of other indexes can be characterized as follows: The Euro Stoxx, S&P Global, and WilderHill indexes have achieved 8 out of 8 possible shocks. The Brent and FTSE 350 indexes have caused 7, while the iShares Global and Nasdaq Clean indexes have caused 6 shocks in their peers. The WTI index has caused 5, while the Clean Energy index has caused 4 movements. It is worth noting that the indexes for clean and dirty energy stocks are not independent. To corroborate these results, we conducted an analysis of the stock indexes that these entities assimilate, thereby identifying the most dominant among their peers. The identified indexes are as follows: WTI (8), FTSE 350 (8), Euro Stoxx (7), iShares Global (7), S&P Global (7), WilderHill (6), Clean Energy (6), Nasdaq Clean (5), and Brent (5). The findings suggest that there exists a significant correlation between the performance of clean energy stock indexes and that of dirty energy stock indexes, with each exerting an influence on the other. In brief, the results underscore the interconnected nature of clean energy stock indexes, their dependence on dirty energy indexes, and the assimilation of the impact of the scrutinized stock indexes. It is recommended that investors with portfolios operating within the clean energy markets engage in vigilant monitoring of prominent indexes, conduct thorough evaluations of price dynamics, adopt a comprehensive approach to risk management, and make suitable changes to their investment strategies. Through a comprehensive analysis of the wider market environment and the interdependence between different variables, portfolio managers can enhance the effectiveness and long-term viability of their clean energy portfolios by making well-informed decisions.
5. Discussion
The objective of this investigation was to examine the potential of clean energy indexes as coverage assets and safe havens in comparison to their dirty energy peers, particularly in times of economic uncertainty, specifically during the events of 2020 and 2022. The present study involved an analysis of different clean energy stock indexes, including Nasdaq Clean Edge Green Energy, WilderHill Clean Energy, S&P Global Clean Energy, the iShares Global Clean Energy ETF, and Clean Energy Fuels. In addition, the study also examined dirty energy stocks, such as Brent Crude Spot, WTI, FTSE 350 Oil, Gas & Coal, and Euro Stoxx Oil & Gas. In order to enhance the robustness of our analysis, we partitioned the sample into two distinct subperiods. The first subperiod, which we refer to as "Tranquil," spans from May 3, 2018, to December 31, 2019. The second subperiod, which we refer to as the "Stress" period, covers the period from January 2020 to May 2023. Upon comparing the two subperiods, it becomes evident that the frequency of influence movements between the aforementioned indexes has risen from 30 to 59 movements out of a total of 72 possible. This indicates a substantial increase in the interdependence between the said indexes. Dirty energy stock indexes such as Brent Crude Spot (5 to 7), Euro Stoxx Oil & Gas (4 to 8), FTSE 350 Oil, Gas & Coal (1 to 7), and WTI (3 to 5) began to influence the remaining indexes more significantly during the Stress period. Furthermore, the clean energy indexes exhibit analogous features when comparing the two distinct subperiods. Specifically, the WilderHill Clean Energy indexes (7 to 8), iShares Global Clean Energy ETF (2 to 6), Nasdaq Clean Edge Green Energy (2 to 6), and S&P Global Clean Energy (4 to 8), Clean Energy Fuels (2 to 4). demonstrate comparable characteristics. The results of this study indicate that during times of economic uncertainty on an international level, both clean energy and dirty energy stocks lack coverage and safe haven attributes. In general, it can be emphasized that assets lacking safe haven characteristics are deemed unsuitable for investment during periods of economic instability in the global market. The absence of safe haven investment properties suggests that the valuation of said assets is more vulnerable to fluctuations in the market, thereby reducing their appeal as a means of portfolio diversification. The absence of safe haven properties from display has noteworthy consequences for investment strategies, as investors may need to reassess their portfolio structure and seek out substitute assets that can offer stability in times of unpredictable nature.
6. Conclusions
The objective of this investigation was to examine the potential of clean energy stock indexes as hedge assets and safe havens for dirty energy indexes particularly during times of economic uncertainty, with a specific focus on events occurring in 2020 and 2022. Several clean energy indexes were analyzed, namely Nasdaq Clean Edge Green Energy, WilderHill Clean Energy, S&P Global Clean Energy, iShares Global Clean Energy ETF, and Clean Energy Fuels. In addition, we take into account indexes pertaining to energy stocks that are associated with high levels of pollution, including but not limited to Brent Crude Spot, WTI, FTSE 350 Oil, Gas & Coal, and Euro Stoxx Oil & Gas. In order to enhance the robustness of our analysis, we partitioned the sample into two distinct subperiods. The first subperiod, referred to as the Tranquil period, spans from May 3, 2018, to December 31, 2019. The second subperiod, known as the Stress period, covers the period from January 2020 to May 2023. Upon comparing these subperiods, it was observed that there was an evident increase in the degree of influence between the indexes. The number of movements also exhibited an upward trend, increasing from 30 to 59 out of a total of 72 possible movements. This suggests a significant increase in the level of interdependence among these indexes. During the Stress period, it was observed that there was a notable influence of the dirty energy stock indexes, namely, Brent Crude Spot, Euro Stoxx Oil & Gas, FTSE 350 Oil, Gas & Coal and WTI, on the other indexes. There was an increase in the number of significant influences observed for the dirty energy indexes when compared to the Tranquil period. The two subperiods exhibited comparable features in terms of the clean energy indexes. During the Stress period, WilderHill Clean Energy, iShares Global Clean Energy ETF, Nasdaq Clean Edge Green Energy, S&P Global Clean Energy, and Clean Energy Fuels exhibited a notable upsurge in their level of influence. To conclude, the results suggest that both clean energy indexes and dirty energy indexes do not possess the characteristics of a hedge or safe haven during times of economic uncertainty on a global level. Typically, assets lacking safe haven properties are not regarded as desirable investment alternatives during periods of economic uncertainty. The lack of safe haven properties suggests the vulnerability of these assets' values to market fluctuations is higher, rendering them less appealing for the purpose of portfolio diversification. The implications of these findings are noteworthy for investment strategies, as investors might have to rethink the structure of their portfolio and consider alternative assets that provide stability during periods of ambiguity.
Author Contributions
The four authors, R.D., N.T., P.A. and M.C., contributed equally to this work. All authors have read and agreed to the published version of the manuscript.
Funding
This paper is financed by the Instituto Politécnico de Setúbal.
Data Availability Statement
The authors confirm that the data supporting the findings of this study are available within the article.
Acknowledgments
This work would not have been possible without the financial support of the Instituto Politécnico de Setúbal.
Conflicts of Interest
The authors declare no conflict of interest.
References
- Elie, B.; Naji, J.; Dutta, A.; Uddin, G.S. Gold and Crude Oil as Safe-Haven Assets for Clean Energy Stock Indices: Blended Copulas Approach. Energy 2019, 178. [Google Scholar] [CrossRef]
- Sharif, A.; Brahim, M.; Dogan, E.; Tzeremes, P. Analysis of the Spillover Effects between Green Economy, Clean and Dirty Cryptocurrencies. Energy Econ 2023, 120. [Google Scholar] [CrossRef]
- Dias, R.; Horta, N.; Chambino, M. Clean Energy Action Index Efficiency: An Analysis in Global Uncertainty Contexts. Energies 2023 2023, 16, 18. [Google Scholar] [CrossRef]
- Lee, D.; Baek, J. Stock Prices of Renewable Energy Firms: Are There Asymmetric Responses to Oil Price Changes? Economies 2018, 6. [Google Scholar] [CrossRef]
- Xia, T.; Ji, Q.; Zhang, D.; Han, J. Asymmetric and Extreme Influence of Energy Price Changes on Renewable Energy Stock Performance. J Clean Prod 2019, 241. [Google Scholar] [CrossRef]
- Farid, S.; Karim, S.; Naeem, M.A.; Nepal, R.; Jamasb, T. Co-Movement between Dirty and Clean Energy: A Time-Frequency Perspective. Energy Econ 2023, 119. [Google Scholar] [CrossRef]
- Papageorgiou, C.; Saam, M.; Schulte, P. Substitution between Clean and Dirty Energy Inputs: A Macroeconomic Perspective. Review of Economics and Statistics 2017, 99. [Google Scholar] [CrossRef]
- Ren, B.; Lucey, B. A Clean, Green Haven?—Examining the Relationship between Clean Energy, Clean and Dirty Cryptocurrencies. Energy Econ 2022, 109. [Google Scholar] [CrossRef]
- Ren, B.; Lucey, B.M. A Clean, Green Haven?- Examining the Relationship between Clean Energy, Clean and Dirty Cryptocurrencies. SSRN Electronic Journal 2021. [Google Scholar] [CrossRef]
- Henriques, I.; Sadorsky, P. Oil Prices and the Stock Prices of Alternative Energy Companies. Energy Econ 2008, 30. [Google Scholar] [CrossRef]
- Bondia, R.; Ghosh, S.; Kanjilal, K. International Crude Oil Prices and the Stock Prices of Clean Energy and Technology Companies: Evidence from Non-Linear Cointegration Tests with Unknown Structural Breaks. Energy 2016, 101. [Google Scholar] [CrossRef]
- Ferrer, R.; Shahzad, S.J.H.; López, R.; Jareño, F. Time and Frequency Dynamics of Connectedness between Renewable Energy Stocks and Crude Oil Prices. Energy Econ 2018, 76. [Google Scholar] [CrossRef]
- Huang, A.Y.H.; Cheng, C.M.; Hu, W.C.; Chen, C.C. Relationship between Crude Oil Prices and Stock Prices of Alternative Energy Companies with Recent Evidence. Economics Bulletin 2011, 31. [Google Scholar]
- Ahmad, W. On the Dynamic Dependence and Investment Performance of Crude Oil and Clean Energy Stocks. Res Int Bus Finance 2017, 42. [Google Scholar] [CrossRef]
- Attarzadeh, A.; Balcilar, M. On the Dynamic Connectedness of the Stock, Oil, Clean Energy, and Technology Markets. Energies (Basel) 2022, 15. [Google Scholar] [CrossRef]
- Yilanci, V.; Ozgur, O.; Altinsoy, A. THE DEPENDENCE OF CLEAN ENERGY STOCK PRICES ON THE OIL AND CARBON PRICES: A NONLINEAR PERSPECTIVE. Econ Comput Econ Cybern Stud Res 2022, 56. [Google Scholar] [CrossRef]
- Reboredo, J.C. Is There Dependence and Systemic Risk between Oil and Renewable Energy Stock Prices? Energy Econ 2015, 48. [Google Scholar] [CrossRef]
- Mzoughi, H.; Urom, C. Energy, Environment, and Financial Markets Under the COVID-19 Pandemic. In COVID-19 Pandemic and Energy Markets; 2021.
- Ouden, B.A. Den Stock Market Performance of the Retail Industry under the COVID-19 Pandemic. University of Twente 2021. [Google Scholar]
- Ghabri, Y.; Ayadi, A.; Guesmi, K. Fossil Energy and Clean Energy Stock Markets under COVID-19 Pandemic. Appl Econ 2021, 53. [Google Scholar] [CrossRef]
- Luo, J.; Ali, S.A.; Aziz, B.; Aljarba, A.; Akeel, H.; Hanif, I. Impact of Natural Resource Rents and Economic Growth on Environmental Degradation in the Context of COP-26: Evidence from Low-Income, Middle-Income, and High-Income Asian Countries. Resources Policy 2023, 80. [Google Scholar] [CrossRef]
- Lei, X.; Yang, Y.; Alharthi, M.; Rasul, F.; Faraz Raza, S.M. Immense Reliance on Natural Resources and Environmental Challenges in G-20 Economies through the Lens of COP-26 Targets. Resources Policy 2022, 79. [Google Scholar] [CrossRef]
- Kumar, S.; Managi, S.; Matsuda, A. Stock Prices of Clean Energy Firms, Oil and Carbon Markets: A Vector Autoregressive Analysis. Energy Econ 2012, 34. [Google Scholar] [CrossRef]
- Managi, S.; Okimoto, T. Does the Price of Oil Interact with Clean Energy Prices in the Stock Market? Japan World Econ 2013, 27. [Google Scholar] [CrossRef]
- Fahmy, H. The Rise in Investors’ Awareness of Climate Risks after the Paris Agreement and the Clean Energy-Oil-Technology Prices Nexus. Energy Econ 2022, 106. [Google Scholar] [CrossRef]
- Wang, Y.; Cai, J. Structural Break, Stock Prices of Clean Energy Firms and Carbon Market. In Proceedings of the IOP Conference Series: Earth and Environmental Science; 2018; Vol. 120.
- Vrînceanu, G.; Horobeț, A.; Popescu, C.; Belaşcu, L. The Influence of Oil Price on Renewable Energy Stock Prices: An Analysis for Entrepreneurs. Studia Universitatis „Vasile Goldis” Arad – Economics Series 2020, 30. [Google Scholar] [CrossRef]
- Shakhabiddinovich, A.S.; Yakob, N.A. Bin; Yeap, L.W. Asymmetric Effect of Renewable Energy Generation and CleaEnergy on Green Economy Stock Price: A Nonlinear ARDL Approach. International Journal of Energy Economics and Policy 2022, 12. [Google Scholar] [CrossRef]
- Tsay, R.S. Analysis of Financial Time Series; 2002.
- Campbell, J.Y.; Lo, A.W.; MacKinlay, A.C. The Econometrics of Financial Markets. The Econometrics of Financial Markets 2012, 1–611. [Google Scholar] [CrossRef]
- Jarque, C.M.; Bera, A.K. Efficient Tests for Normality, Homoscedasticity and Serial Independence of Regression Residuals. Econ Lett 1980, 6. [Google Scholar] [CrossRef]
- Dickey, D.; Fuller, W. Likelihood Ratio Statistics for Autoregressive Time Series with a Unit Root. Econometrica 1981, 49, 1057–1072. [Google Scholar] [CrossRef]
- Choi, I. Unit Root Tests for Panel Data. J Int Money Finance 2001, 20, 249–272. [Google Scholar] [CrossRef]
- Hadri, K. Testing for Stationarity in Heterogeneous Panel Data. Econom J 2000. [Google Scholar] [CrossRef]
- Granger, C.W.J. Investigating Causal Relations by Econometric Models and Cross-Spectral Methods. Econometrica 1969, 37, 424. [Google Scholar] [CrossRef]
- Granger, C.W.J.; Newbold, P. Spurious Regressions in Econometrics. J Econom 1974, 2, 111–120. [Google Scholar] [CrossRef]
Figure 1.
Evolution, returns, of the financial markets under study during the period from May 3, 2018, to May 2, 2023.
Figure 1.
Evolution, returns, of the financial markets under study during the period from May 3, 2018, to May 2, 2023.
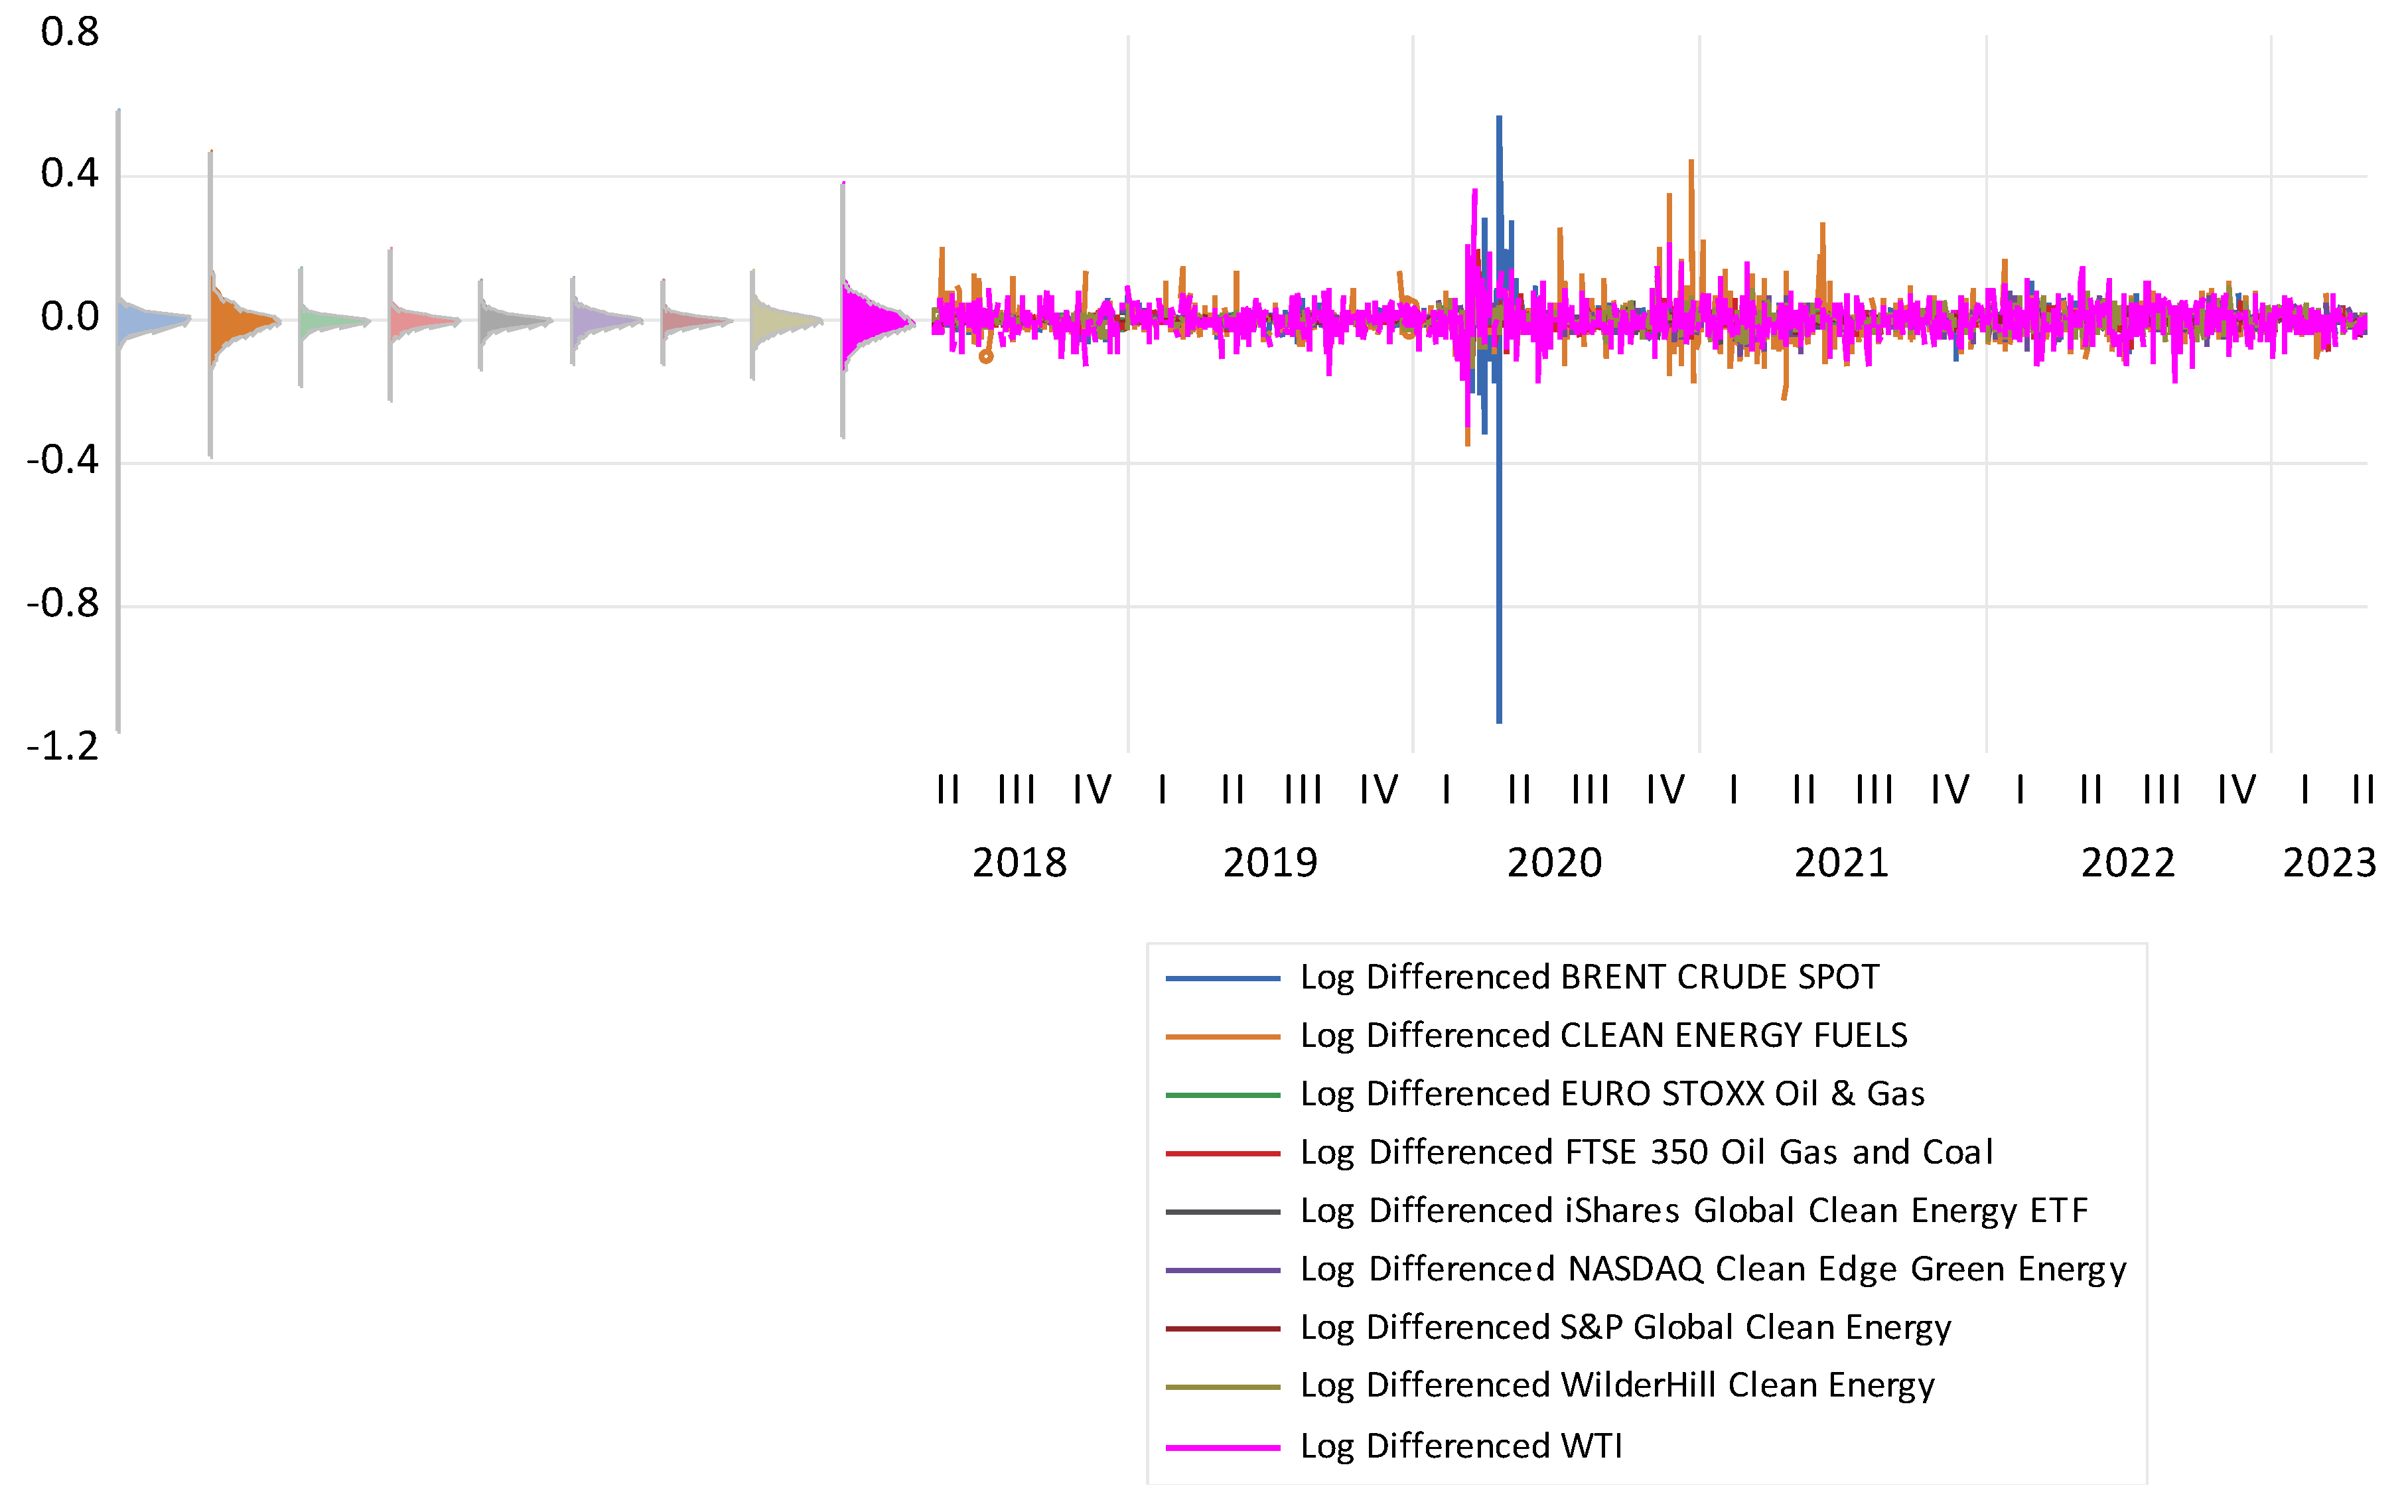
Figure 2.
Q-Q Plots, in returns, of the financial markets under study during the period from May 3, 2018, to May 2, 2023.
Figure 2.
Q-Q Plots, in returns, of the financial markets under study during the period from May 3, 2018, to May 2, 2023.
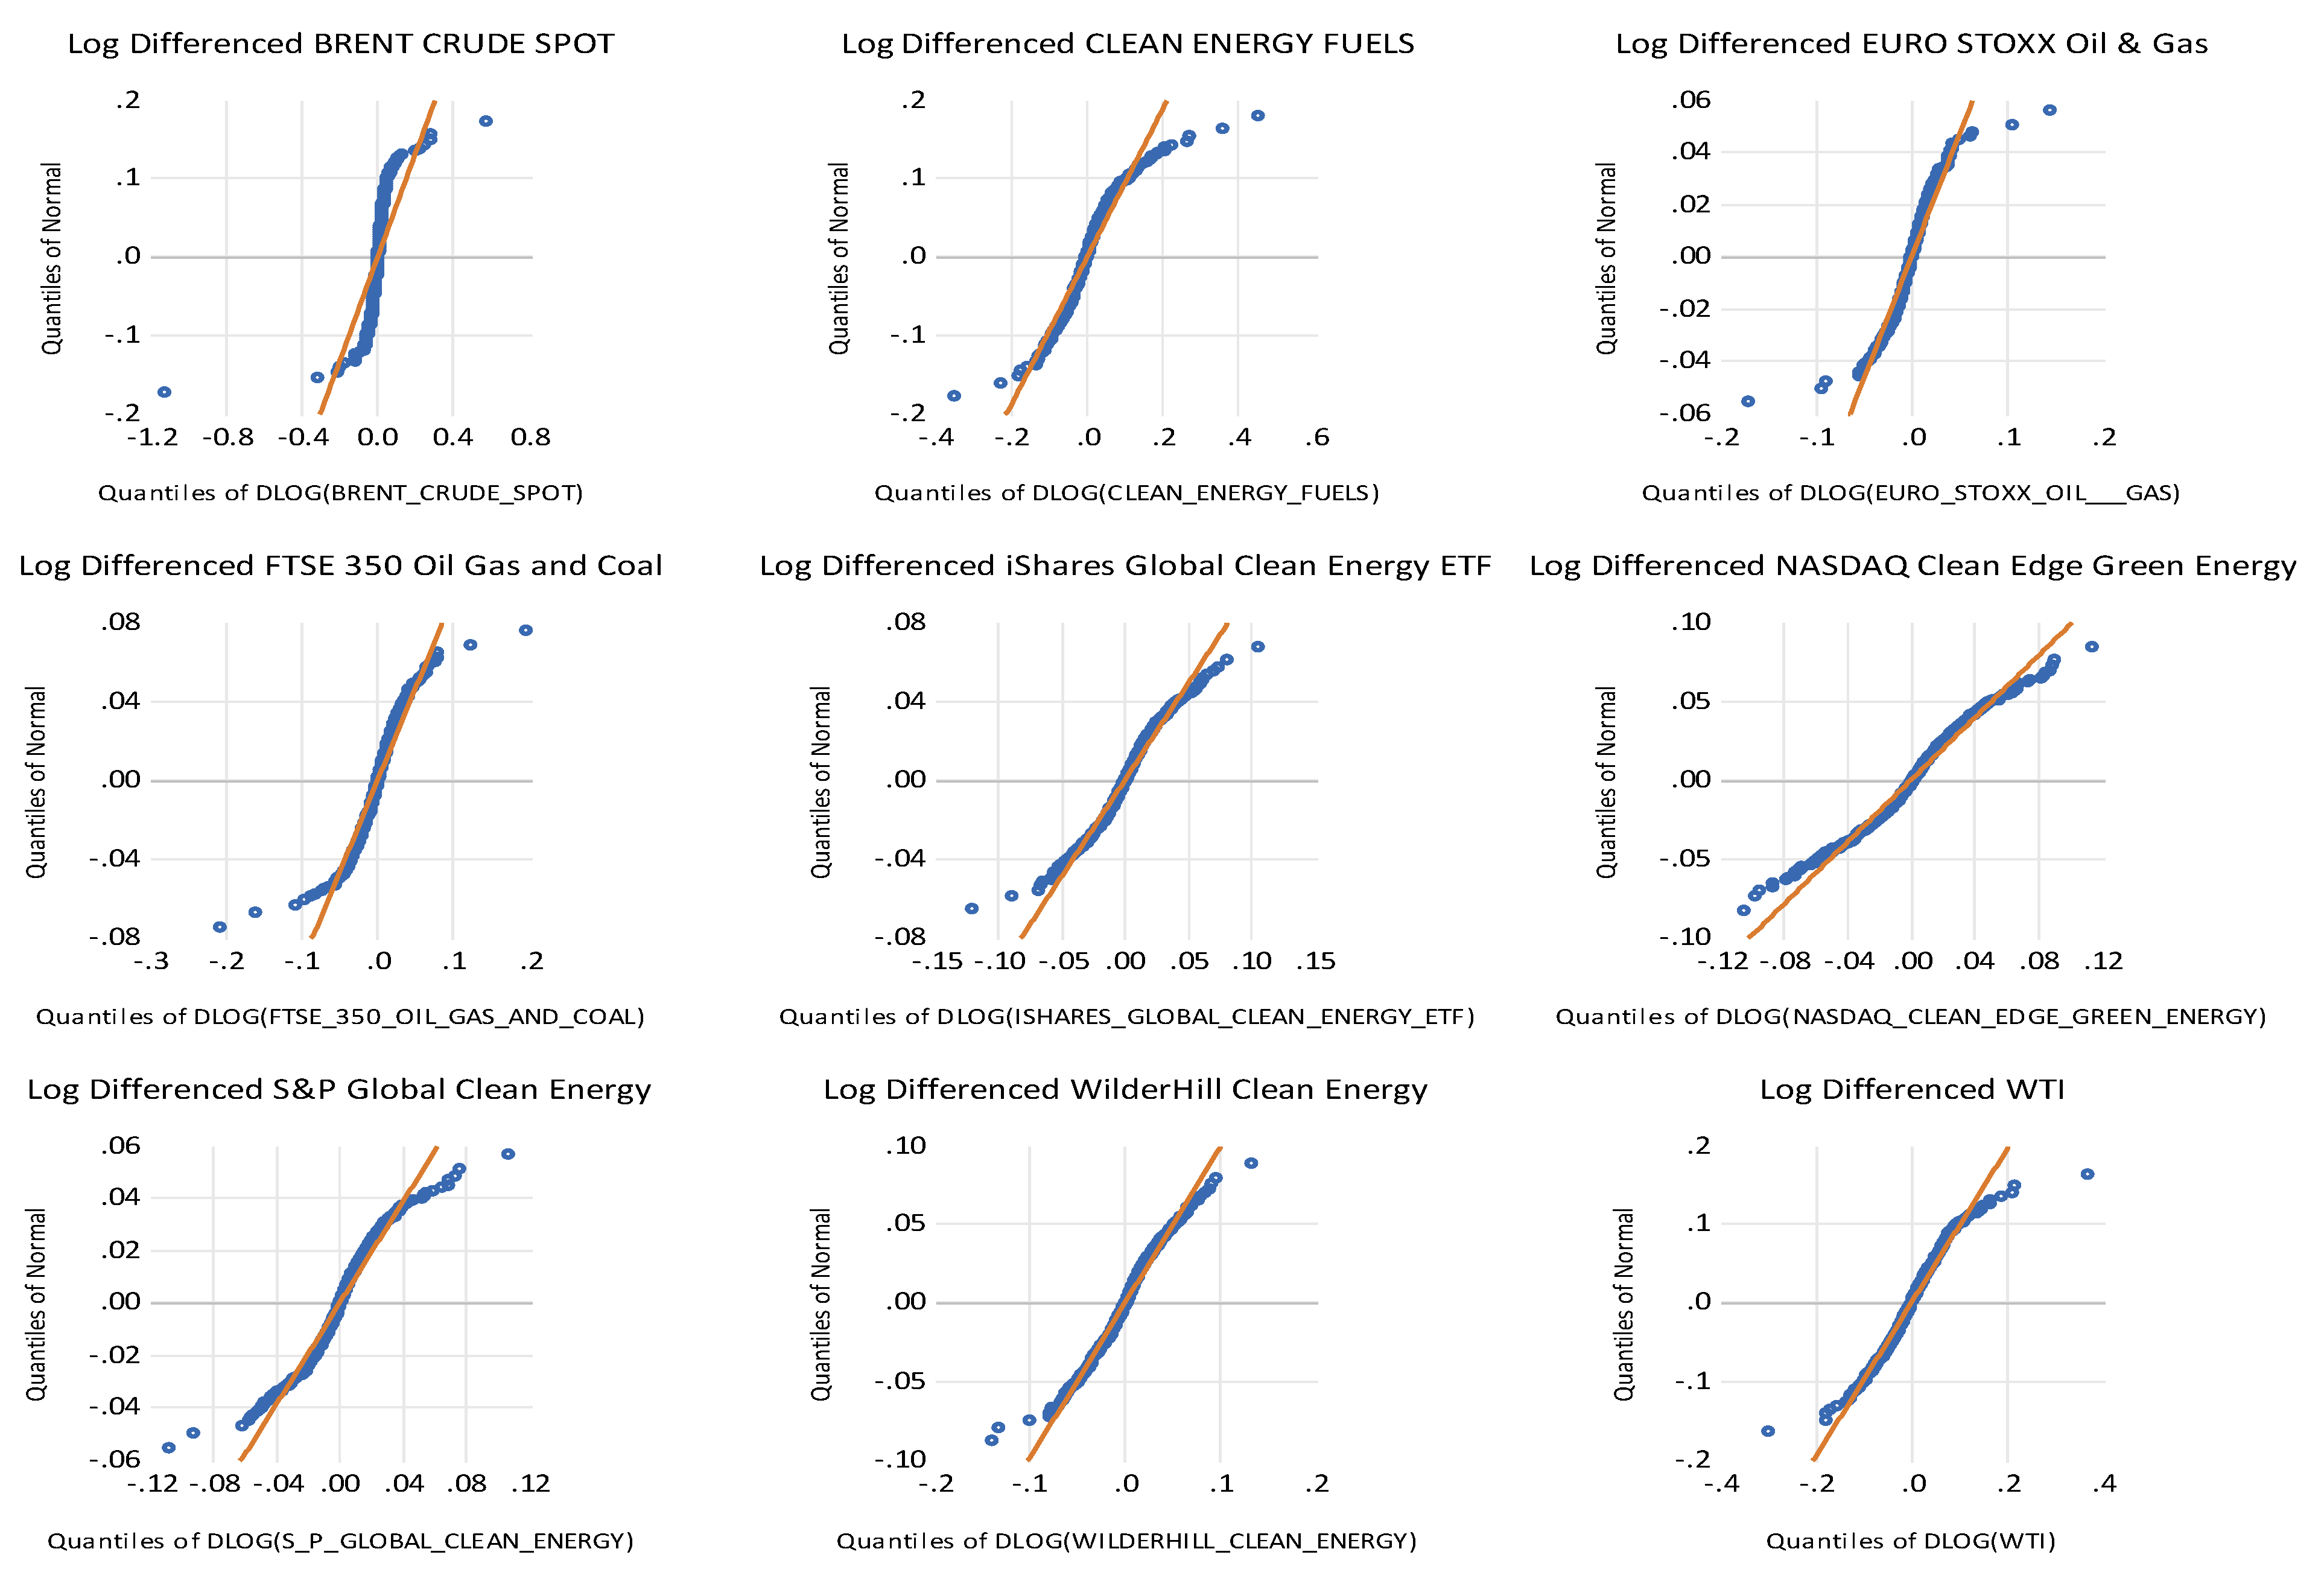
Figure 3.
Stability tests for residues of the financial markets under study during the period from May 3, 2018, to May 2, 2023.
Figure 3.
Stability tests for residues of the financial markets under study during the period from May 3, 2018, to May 2, 2023.
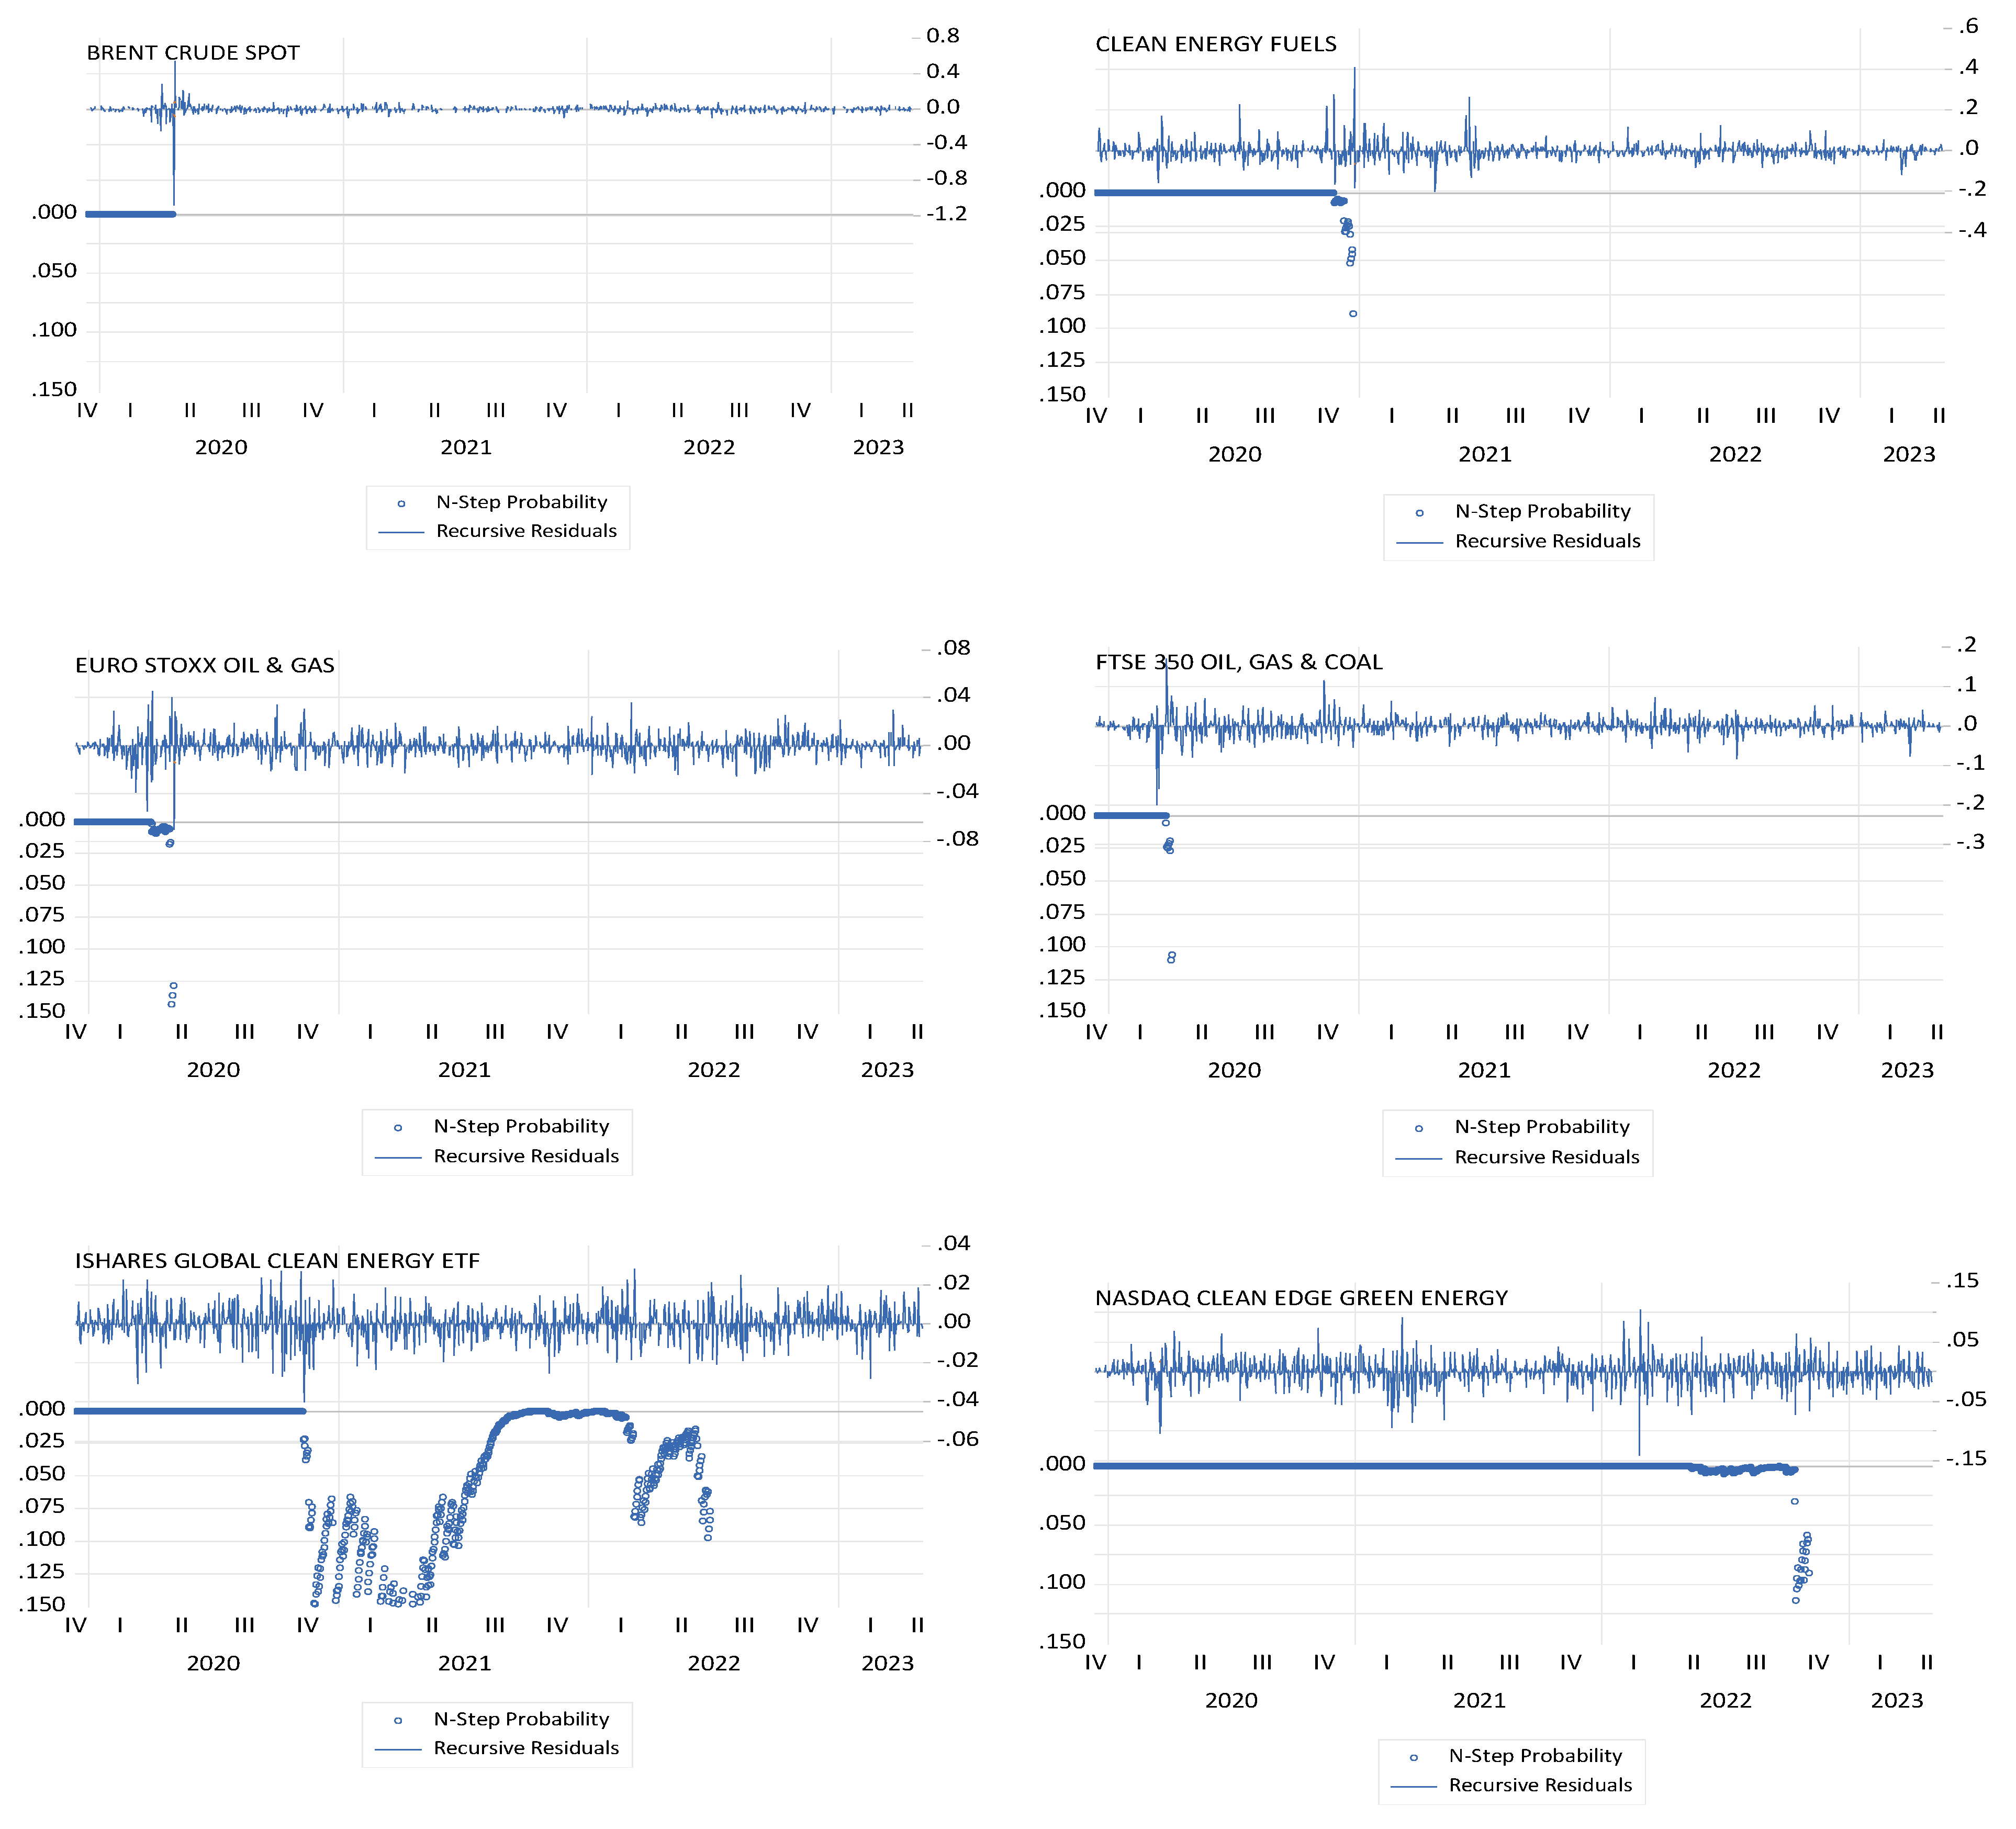
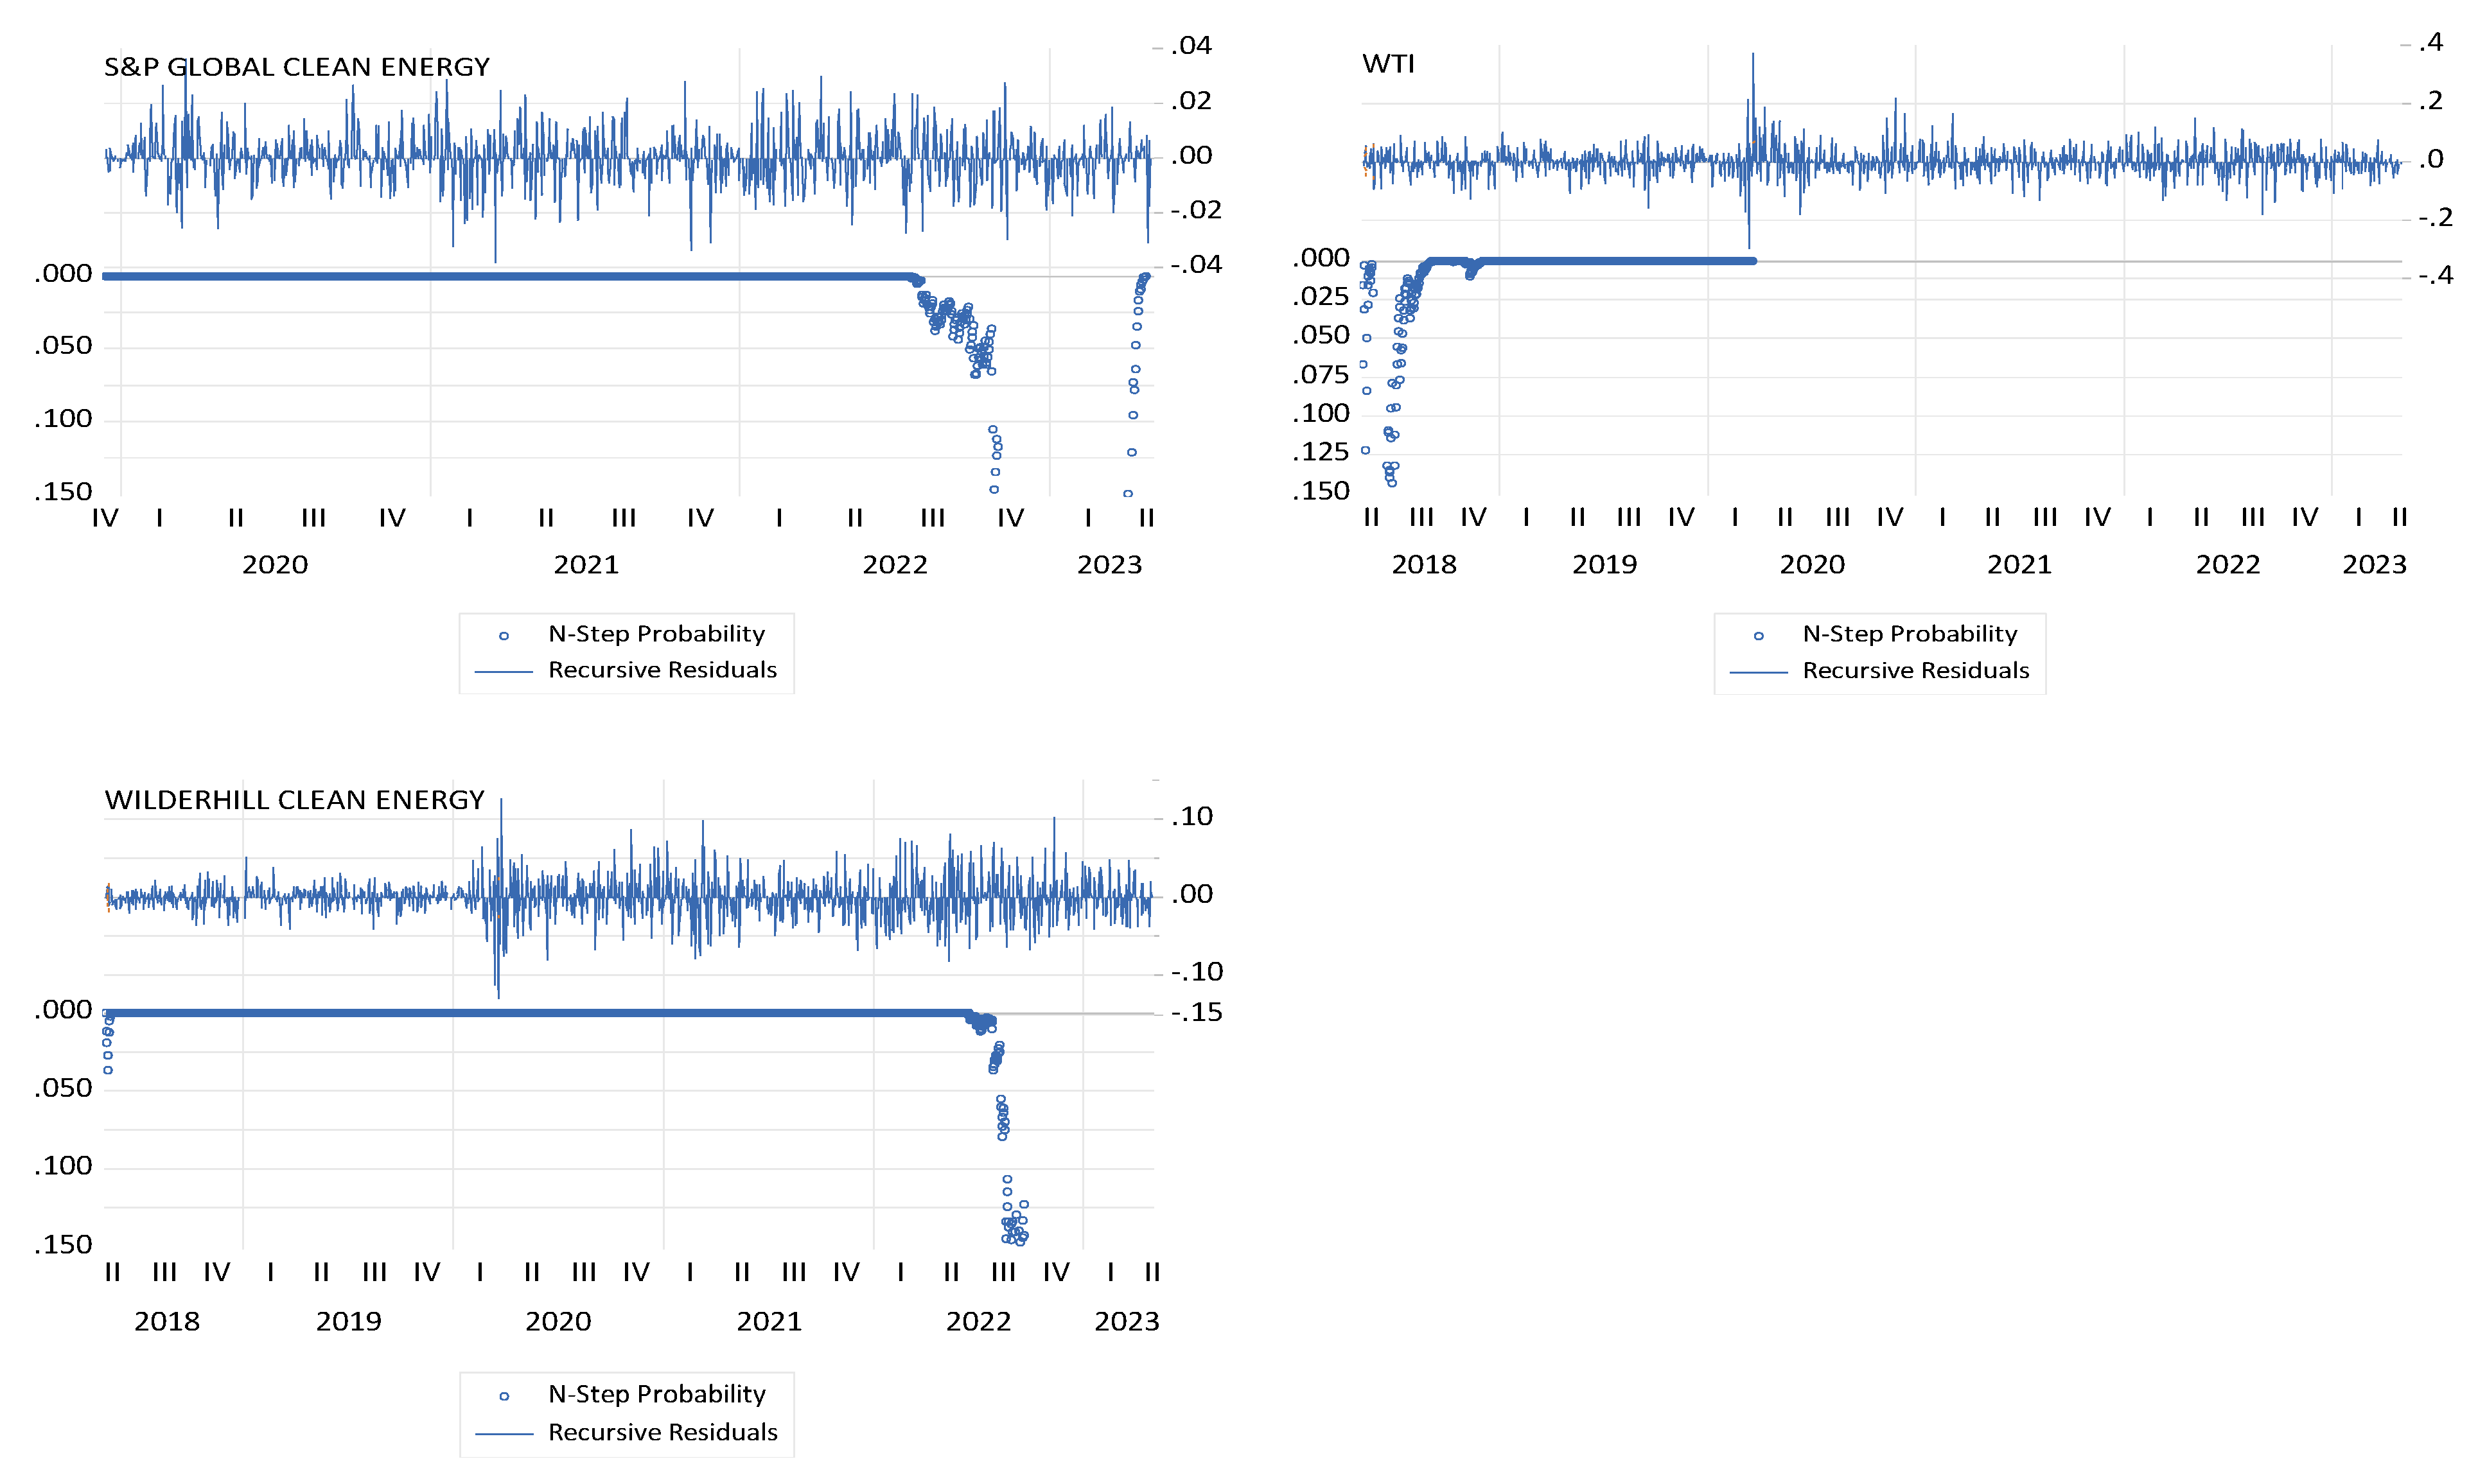
Table 2.
Descriptive statistics of the financial markets under study during the period from May 3, 2018, to May 2, 2023.
Table 2.
Descriptive statistics of the financial markets under study during the period from May 3, 2018, to May 2, 2023.
| Mean | Std. Dev. | Skewness | Kurtosis | Jarque-Bera | Probability | Obs. | |
|---|---|---|---|---|---|---|---|
| Brent | 0.000431 | 0.038992 | -11.31994 | 418.9986 | 13205589 | 0.000000 | 1826 |
| Clean Energy | 0.000482 | 0.040084 | 1.459962 | 24.10483 | 34537.25 | 0.000000 | 1826 |
| Euro Stoxx Oil Gas | 0.000104 | 0.012673 | -0.602354 | 37.57033 | 91038.18 | 0.000000 | 1826 |
| FTSE 350 | 0.000165 | 0.016858 | -0.616905 | 34.92591 | 77664.82 | 0.000000 | 1826 |
| iShares Global Clean | 0.000369 | 0.014837 | -0.088204 | 11.75285 | 5831.294 | 0.000000 | 1826 |
| Nasdaq Clean | 0.000571 | 0.018702 | -0.138421 | 9.279764 | 3006.210 | 0.000000 | 1826 |
| S&P Global Clean | 0.000412 | 0.012749 | 0.055932 | 15.16997 | 11269.51 | 0.000000 | 1826 |
| WilderHill Clean | 0.000125 | 0.019707 | -0.094281 | 10.20693 | 3954.463 | 0.000000 | 1826 |
| WTI | 2.17E-05 | 0.036812 | 0.412903 | 15.11180 | 11212.98 | 0.000000 | 1826 |
Source: Own elaboration.
Table 3.
Dickey and Fuller (1981) panel unit root test, in returns, concerning the financial markets under analysis, from May 3, 2018, to May 2, 2023.
Table 3.
Dickey and Fuller (1981) panel unit root test, in returns, concerning the financial markets under analysis, from May 3, 2018, to May 2, 2023.
| Null Hypothesis: Unit root (individual unit root process) | ||||
| Method | Statistic | Prob.** | ||
| ADF - Fisher Chi-square | 1451.63 | 0.0000 | ||
| ADF - Choi Z-stat | -37.0456 | 0.0000 | ||
| Series | Prob. | Lag | Max Lag | Obs. |
| Brent Crude Spot | 0.0000 | 19 | 24 | 1805 |
| Clean Energy Fuels | 0.0000 | 20 | 24 | 1804 |
| Euro Stoxx Oil Gas | 0.0000 | 19 | 24 | 1805 |
| FTSE 350 Oil Gas & Coal | 0.0000 | 19 | 24 | 1805 |
| iShares Global Clean Energy ETF | 0.0000 | 19 | 24 | 1805 |
| Nasdaq Clean Edge Green Energy | 0.0000 | 19 | 24 | 1805 |
| S&P Global Clean Energy | 0.0000 | 20 | 24 | 1804 |
| WilderHill Clean Energy | 0.0000 | 19 | 24 | 1805 |
| WTI | 0.0000 | 19 | 24 | 1805 |
Source: Own elaboration. Note ** Probabilities for Fisher tests are computed using an asymptotic Chi-square distribution. All other tests assume asymptotic normality.
Table 4.
Hadri (2000) panel unit root test, in returns, concerning the financial markets under analysis, from May 3, 2018, to May 2, 2023.
Table 4.
Hadri (2000) panel unit root test, in returns, concerning the financial markets under analysis, from May 3, 2018, to May 2, 2023.
| Null Hypothesis: Stationarity | ||||
| Method | Statistic | Prob.** | ||
| Hadri Z-stat | -2.98073 | 0.9986 | ||
| Heteroscedastic Consistent Z-stat | -3.08617 | 0.9990 | ||
| Series | LM | Variance | Bandwidth | Obs. |
| HAC | ||||
| Brent Crude Spot | 0.0185 | 64.79990 | 50.0 | 1825 |
| Clean Energy Fuels | 0.0249 | 0.242582 | 49.0 | 1825 |
| Euro Stoxx Oil Gas | 0.0202 | 1038.727 | 50.0 | 1825 |
| FTSE 350 Oil Gas & Coal | 0.0263 | 624396.0 | 50.0 | 1825 |
| iShares Global Clean Energy ETF | 0.0127 | 3.529977 | 50.0 | 1825 |
| Nasdaq Clean Edge Green Energy | 0.0123 | 5444.951 | 50.0 | 1825 |
| S&P Global Clean Energy | 0.0250 | 27308.31 | 51.0 | 1825 |
| WilderHill Clean Energy | 0.0247 | 219.5319 | 50.0 | 1825 |
| WTI | 0.0225 | 0.289815 | 50.0 | 1825 |
Source: Own elaboration. Note: *High autocorrelation leads to severe size distortion in Hadri test, leading to over-rejection of the null. .
Table 5.
VAR Lag Order Selection Criteria for the Tranquil subperiod.
| Lag | LogL | LR | FPE | AIC | SC | HQ |
|---|---|---|---|---|---|---|
| 0 | 19778.94 | NA | 9.14e-42 | -66.11685 | -66.04338* | -66.08825 |
| 1 | 20058.71 | 549.2449 | 5.01e-42* | -66.71808* | -65.90990 | -66.40343* |
| 2 | 20111.22 | 101.3386 | 5.88e-42 | -66.55927 | -65.01637 | -65.95856 |
| 3 | 20137.01 | 48.91383 | 7.54e-42 | -66.31109 | -64.03347 | -65.42432 |
| 4 | 20171.64 | 64.49973 | 9.39e-42 | -66.09244 | -63.08011 | -64.91962 |
| 5 | 20236.84 | 119.2761 | 1.06e-41 | -65.97604 | -62.22900 | -64.51718 |
| 6 | 20309.57 | 130.6295 | 1.16e-41 | -65.88485 | -61.40310 | -64.13993 |
| 7 | 20408.50 | 174.3655 | 1.17e-41 | -65.88127 | -60.66480 | -63.85030 |
| 8 | 20493.48 | 146.9367* | 1.24e-41 | -65.83103 | -59.87985 | -63.51401 |
| 9 | 20550.26 | 96.28122 | 1.44e-41 | -65.68649 | -59.00059 | -63.08341 |
| 10 | 20577.84 | 45.83760 | 1.85e-41 | -65.44427 | -58.02365 | -62.55514 |
Source: Own elaboration. Note: * indicates lag order selected by the criterion: LR: sequential modified LR test statistic (each test at 5% level), FPE: Final prediction error, AIC: Akaike information criterion, SC: Schwarz information criterion, HQ: Hannan-Quinn information criterion.
Table 6.
VAR Residual Serial Correlation LM Tests for the Tranquil subperiod.
| Lag | LRE* stat | df | Prob. | Rao F-stat | df | Prob. |
|---|---|---|---|---|---|---|
| 1 | 94.09899 | 100 | 0.6474 | 0.940426 | (100, 3591.7) | 0.6476 |
| 2 | 64.30582 | 100 | 0.9979 | 0.640039 | (100, 3591.7) | 0.9979 |
| 3 | 49.91748 | 100 | 1.0000 | 0.495848 | (100, 3591.7) | 1.0000 |
| 4 | 51.68848 | 100 | 1.0000 | 0.513565 | (100, 3591.7) | 1.0000 |
| 5 | 100.7474 | 100 | 0.4602 | 1.007794 | (100, 3591.7) | 0.4604 |
| 6 | 67.81874 | 100 | 0.9943 | 0.675330 | (100, 3591.7) | 0.9943 |
| 7 | 127.2454 | 100 | 0.0343 | 1.277524 | (100, 3591.7) | 0.0343 |
| 8 | 113.6012 | 100 | 0.1665 | 1.138391 | (100, 3591.7) | 0.1667 |
| 9 | 89.87137 | 100 | 0.7563 | 0.897652 | (100, 3591.7) | 0.7564 |
Source: Own elaboration.
Table 7.
Granger causality/Block Exogeneity Wald Tests, of the financial markets under analysis, in the Tranquil subperiod.
Table 7.
Granger causality/Block Exogeneity Wald Tests, of the financial markets under analysis, in the Tranquil subperiod.
| Brent Crude Spot | Clean Energy Fuels | Euro Stoxx Oil & Gas | FTSE 350 Oil, Gas & Coal | iShares Global Clean Energy ETF | Nasdaq Clean Edge Green Energy | S&P Global Clean Energy | WilderHill Clean Energy | WTI | |
|---|---|---|---|---|---|---|---|---|---|
| Brent Crude Spot | 1,39064 | 0,87183 | 0,86521 | 0,96945 | 0,83874 | 0,82249 | 0,97842 | 1,58858 | |
| Clean Energy Fuels | 1,60007 | 0,72183 | 0,70908 | 0,61744 | 0,70552 | 1,37836 | 2,91225*** | 0,73159 | |
| Euro Stoxx Oil & Gas | 14,1548*** | 2,25743** | 1,10889 | 3,86084*** | 4,51593*** | 6,52167*** | 7,58047*** | 4,53169*** | |
| FTSE 350 Oil, Gas & Coal | 13,3539*** | 2,51606** | 1,51785 | 3,24214*** | 3,57241*** | 3,50362*** | 4,40622*** | 4,39322*** | |
| iShares Global Clean Energy ETF | 1,25952 | 1,46159 | 2,06409** | 2,11719** | 0,22516 | 20,2295*** | 15,0090*** | 1,68806* | |
| Nasdaq Clean Edge Green Energy | 0,83257 | 0,52036 | 2,35237** | 1,64448 | 0,95913 | 9,17023*** | 26,3694*** | 1,22674 | |
| S&P Global Clean Energy | 1,88706* | 0,67424 | 1,94370* | 0,84198 | 0,09090 | 0,39098 | 2,18513** | 0,98459 | |
| WilderHill Clean Energy | 2,39103** | 0,35838 | 2,48903** | 1,00458 | 0,50769 | 1,12847 | 0,85974 | 0,92135 | |
| WTI | 3,65746*** | 1,32239 | 1,63314 | 0,64393 | 0,41154 | 0,51433 | 1,48187 | 4,45433*** |
Source: Own elaboration. Notes: ***, **, * the statistical significance levels observed were 1%, 5%, and 10%, respectively.
Table 8.
VAR Lag Order Selection Criteria for the Stress subperiod.
| Lag | LogL | LR | FPE | AIC | SC | HQ |
|---|---|---|---|---|---|---|
| 0 | 31980.79 | NA | 4.87e-36 | -52.93176 | -52.88957 | -52.91588 |
| 1 | 32666.56 | 1359.053 | 1.85e-36 | -53.90158 | -53.43748* | -53.72682* |
| 2 | 32797.17 | 256.6834 | 1.75e-36* | -53.95227* | -53.06625 | -53.61862 |
| 3 | 32860.71 | 123.8111 | 1.86e-36 | -53.89190 | -52.58396 | -53.39937 |
| 4 | 32918.94 | 112.5170 | 2.00e-36 | -53.82275 | -52.09290 | -53.17134 |
| 5 | 32994.09 | 143.9591 | 2.08e-36 | -53.78161 | -51.62985 | -52.97132 |
| 6 | 33089.42 | 181.0249 | 2.10e-36 | -53.77387 | -51.20020 | -52.80471 |
| 7 | 33223.98 | 253.2958 | 1.98e-36 | -53.83109 | -50.83550 | -52.70304 |
| 8 | 33314.69 | 169.2644 | 2.01e-36 | -53.81571 | -50.39821 | -52.52879 |
| 9 | 33387.51 | 134.6642* | 2.11e-36 | -53.77071 | -49.93129 | -52.32490 |
| 10 | 33435.51 | 87.98158 | 2.30e-36 | -53.68462 | -49.42329 | -52.07994 |
Source: Own elaboration. Note* indicates lag order selected by the criterion: LR: sequential modified LR test statistic (each test at 5% level); FPE: Final prediction error; AIC: Akaike information criterion; SC: Schwarz information criterion; HQ: Hannan-Quinn information criterion.
Table 9.
VAR Residual Serial Correlation LM Tests for the Stress subperiod.
| Lag | LRE* stat | df | Prob. | Rao F-stat | df | Prob. |
|---|---|---|---|---|---|---|
| 1 | 78.94107 | 100 | 0.9407 | 0.788451 | (100, 7880.4) | 0.9407 |
| 2 | 86.62977 | 100 | 0.8273 | 0.865665 | (100, 7880.4) | 0.8273 |
| 3 | 88.93548 | 100 | 0.7781 | 0.888834 | (100, 7880.4) | 0.7781 |
| 4 | 85.29619 | 100 | 0.8526 | 0.852267 | (100, 7880.4) | 0.8526 |
| 5 | 162.0517 | 100 | 0.0001 | 1.627072 | (100, 7880.4) | 0.0001 |
| 6 | 180.4160 | 100 | 0.0000 | 1.813564 | (100, 7880.4) | 0.0000 |
| 7 | 154.9874 | 100 | 0.0004 | 1.555448 | (100, 7880.4) | 0.0004 |
| 8 | 176.6897 | 100 | 0.0000 | 1.775688 | (100, 7880.4) | 0.0000 |
| 9 | 140.7629 | 100 | 0.0045 | 1.411422 | (100, 7880.4) | 0.0045 |
| 10 | 94.88605 | 100 | 0.6257 | 0.948662 | (100, 7880.4) | 0.6258 |
Source: Own elaboration.
Table 10.
Granger causality/Block Exogeneity Wald Tests, of the financial markets under analysis, in the Stress subperiod.
Table 10.
Granger causality/Block Exogeneity Wald Tests, of the financial markets under analysis, in the Stress subperiod.
| Brent Crude Spot | Clean Energy Fuels | Euro Stoxx Oil & Gas | FTSE 350 Oil, Gas & Coal | iShares Global Clean Energy ETF | Nasdaq Clean Edge Green Energy | S&P Global Clean Energy | Wilderhill Clean Energy | WTI | |
|---|---|---|---|---|---|---|---|---|---|
| Brent Crude Spot | 1,20908 | 4,49021*** | 3,81802*** | 0,33076 | 1,35892 | 1,67729* | 1,65719* | 2,83028*** | |
| Clean Energy Fuels | 0,90543 | 2,85100*** | 2,80939*** | 2,24056** | 1,88466* | 15,2611*** | 25,0161*** | 1,22985 | |
| Euro Stoxx Oil & Gas | 12,9899*** | 4,80739*** | 1,36396 | 6,53173*** | 5,21309*** | 12,7973*** | 9,40650*** | 11,2146*** | |
| FTSE 350 Oil, Gas & Coal | 15,1841*** | 4,92783*** | 3,72192*** | 5,36956*** | 4,29655*** | 9,11746*** | 6,10365*** | 17,0124*** | |
| iShares Global Clean Energy ETF | 2,23915** | 1,89602** | 2,89943*** | 3,40501*** | 1,74145* | 54,1585*** | 45,2291*** | 1,28080 | |
| Nasdaq Clean Edge Green Energy | 2,55345*** | 1,58845 | 8,01029*** | 1,84119* | 1,63478 | 47,3940*** | 66,0114*** | 1,60241 | |
| S&P Global Clean Energy | 3,32992*** | 1,47178 | 2,11570** | 5,65429*** | 2,45833*** | 1,76011* | 1,85775* | 3,13360*** | |
| Wilderhill Clean Energy | 3,05354*** | 1,57140 | 6,34781*** | 4,70017*** | 1,64098* | 1,14656 | 2,06878** | 2,59538*** | |
| WTI | 4,04397*** | 1,86902* | 2,52073*** | 1,97931** | 2,95658*** | 2,28115** | 5,10181*** | 6,75158*** |
Source: Own elaboration. Notes: ***, **, * the statistical significance levels observed were 1%, 5%, and 10%, respectively.
Table 11.
Comparison of index movements in both subperiods under analysis.
| Indexes | Tranquil subperiod | Stress subperiod | Evolution | |||
|---|---|---|---|---|---|---|
| Brent Crude Spot | 5/8 possible | Euro Stoxx Oil & Gas; FTSE 350 Oil, Gas & Coal; S&P Global Clean Energy; WilderHill Clean Energy; WTI | 7/8 possible | Euro Stoxx Oil & Gas; FTSE 350 Oil, Gas & Coal; iShares Global Clean Energy ETF; Nasdaq Clean Edge Green Energy; S&P Global Clean Energy; WTI | ↑ | |
| Clean Energy Fuels | 2/8 possible | Euro Stoxx Oil & Gas; Ftse 350 Oil, Gas & Coal | 4/8 possible | Euro Stoxx Oil & Gas; iShares Global Clean Energy ETF; WTI | ↑ | |
| Euro Stoxx Oil & Gas | 4/8 possible | iShares Global Clean Energy ETF; Nasdaq Clean Edge Green Energy; S&P Global Clean Energy; WilderHill Clean Energy | 8/8 possible | Brent Crude Spot; Clean Energy Fuels; FTSE 350 Oil, Gas & Coal; iShares Global Clean Energy ETF; Nasdaq Clean Edge Green Energy; S&P Global Clean Energy; WilderHill Clean Energy; WTI | ↑ | |
| FTSE 350 Oil, Gas & Coal | 1/8 possible | iShares Global Clean Energy ETF | 7/8 possible | brent crude spot; clean energy fuels; iShares Global Clean Energy ETF; Nasdaq Clean Edge Green Energy; S&P Global Clean Energy; WilderHill Clean Energy; WTI | ↑ | |
| iShares Global Clean Energy ETF | 2/8 possible | Euro Stoxx Oil & Gas, FTSE 350 Oil, Gas & Coal | 6/8 possible | Clean Energy Fuels; Euro Stoxx Oil & Gas; FTSE 350 Oil, Gas & Coal; S&P Global Clean Energy; WilderHill Clean Energy; WTI | ↑ | |
| Nasdaq Clean Edge Green Energy | 2/8 possible | Euro Stoxx Oil & Gas; FTSE 350 Oil, Gas & Coal | 6/8 possible | Clean Energy Fuels; Euro Stoxx Oil & Gas; FTSE 350 Oil, Gas & Coal; iShares Global Clean Energy ETF; S&P Global Clean Energy; WTI | ↑ | |
| S&P Global Clean Energy | 4/8 possible | Euro Stoxx Oil & Gas; FTSE 350 Oil, Gas & Coal; iShares Global Clean Energy ETF; Nasdaq Clean Edge Green Energy | 8/8 possible | Brent Crude Spot; Clean Energy Fuels; Euro Stoxx Oil & Gas; FTSE 350 Oil, Gas & Coal; iShares Global Clean Energy ETF; Nasdaq Clean Edge Green Energy; WilderHill Clean Energy; WTI | ↑ | |
| WilderHill Clean Energy | 7/8 possible | Clean Energy Fuels; Euro Stoxx Oil & Gas; FTSE 350 OIL, GAS & COAL; iShares Global Clean Energy ETF; Nasdaq Clean Edge Green Energy; S&P Global Clean Energy; WTI | 8/8 possible | Brent Crude Spot; Clean Energy Fuels; Euro Stoxx Oil & Gas; FTSE 350 Oil, Gas & Coal; iShares Global Clean Energy ETF; Nasdaq Clean Edge Green Energy; S&P Global Clean Energy; WTI | ↑ | |
| WTI | 3/8 possible | Euro Stoxx Oil & Gas; FTSE 350 Oil, Gas & Coal; iShares Global Clean Energy ETF | 5/8 possible | Brent Crude Spot; Euro Stoxx Oil & Gas; FTSE 350 Oil, Gas & Coal; S&P Global Clean Energy; WilderHill Clean Energy | ↑ | |
Source: Own elaboration.
Disclaimer/Publisher’s Note: The statements, opinions and data contained in all publications are solely those of the individual author(s) and contributor(s) and not of MDPI and/or the editor(s). MDPI and/or the editor(s) disclaim responsibility for any injury to people or property resulting from any ideas, methods, instructions or products referred to in the content. |
© 2023 by the authors. Licensee MDPI, Basel, Switzerland. This article is an open access article distributed under the terms and conditions of the Creative Commons Attribution (CC BY) license (http://creativecommons.org/licenses/by/4.0/).
Copyright: This open access article is published under a Creative Commons CC BY 4.0 license, which permit the free download, distribution, and reuse, provided that the author and preprint are cited in any reuse.


