Submitted:
22 October 2024
Posted:
24 October 2024
You are already at the latest version
Abstract
This research paper investigated the hedging effectiveness, dynamic dependence, safe haven ability, and portfolio diversification benefits of alternative assets (precious metals) with conventional and Islamic stock indices. The data covered the period from March 2011 to March 2021, and a copula model with switching dependence was utilized. The estimated transition probabilities demonstrated a high persistence of the same dependence regime in all estimated pairs. The research found that the use of precious metals with stocks for diversification is a favorable choice, proving them to be the best suitable solution to avoid risks. They also provide a save haven effect along with diversification benefits and reveal that risk reduction benefits vary with respect to portfolio types. The findings of the research indicate that negative shocks prompt investors to seek refuge in safe haven assets to safeguard their investments from extreme negative shocks. For most of the situations studied, precious metals provide the best and most effective hedge to stock returns. Overall, the addition of alternative assets to the stock portfolio reduces risks and provides better diversification benefits. Results vary depending on the circumstances of the country. These findings have practical implications for policymakers, fund managers, investors, and risk management practitioners, guiding them in their investment and risk management decisions.
Keywords:
Precious Metals
; Islamic stocks
; Portfolio Management Strategies
; Regimes Switching Copula
; Risk Diversification
1. Introduction
Today's world is a global village due to the increasing interconnectedness of countries. Conditions in other countries are affected when conditions in one country change. Changes in one country's circumstances have an active or passive effect on the economies of its trading partners and its surrounding countries. These changes include all types of physical and economic changes like law-in-order situations, political environment, economic policies, and climatic conditions, among others. The interdependence between economies has increased their financial dependence also (Azimli 2022, Baker et al. 2021, Khalfaoui et al. 2021, Lee et al. 2022). Countries invest or purchase from different countries to get competitive edge; they want to get the best at the lowest prices to make a profit and be prosperous. There are two distinct schools of thought for investment; one is conventional, and the second is Islamic. The conventional school of thought does not impose any restrictions on investment. As their main concern is profit making, so they do not impose any limits or walls for the use of their money. On the other hand, the Islamic school of thought follows a specified dimensional pattern for their investments. As few things are prohibited by religion, they avoid investing in those businesses taking care of Halal and Haram.
A mutual fund works as a money pool made by the collection of small amounts from individual investors, which then invests in different assets or securities to maximize the wealth of shareholders. They made investments in various stocks of different companies and countries across the globe to get maximum from the market with minimum loss or risk. This phenomenon is called diversification. The relationship between equity markets and asset classes reveals a safe measure for policy makers during uncertainty and improves the stability of financial markets (Azimli 2022, Selmi et al. 2018). The interdependence of global commodity classes and equity markets is reported to be significantly high in the short term (Bossman and Agyei 2022). Bossman and Agyei (2022) investigated local dependence among different markets, e.g., agriculture, energy and metal, using the copula model. The findings highlight a strong dependence between commodity markets and energy stocks at the lower tail. Findings from previous studies demonstrated that the relationship between stocks of economies is primarily responsible for global market integration. It is important to research the connections between the stock market and alternative assets as well as its long-term effects on financial markets. For all market participants, including policymakers, the connection between the stock market and precious metals is of utmost importance. Financial investors use a variety of portfolio diversification strategies to reduce the risk load brought on by the uncertainty of future investment values. Low asset correlations are necessary for these methods to achieve lower risk levels.
The abilities and characteristics of Islamic assets are of great concern and focus for researchers in current financial and economic environment due to rapid growth in its size and importance and behavior in crisis. The financial system has experienced immense growth in Islamic investment and finance over the last century as an alternative solution to traditional counterparts for both non-Muslim and Muslim countries across the world. There was huge pressure on Muslim economists to develop a compatible financial system to fulfill the needs of growing industries and economies of Muslim countries. After World War II, many Muslim countries gained independence. Muslim economists started experimenting with an interest-free financial system at a modest level and expanded it afterward. In the early 1960s, the emergence of banking institutions in Islamic countries began. The "Nasser Social Bank", the first interest-free institution, was established in Egypt in 1971. The first Islamic bank was established by a private initiative in 1975, named "Dubai Islamic Bank". It was established by business people with surplus funds (Iqbal et al. 2005). Islamic Development Bank (IDB) was established in 1975 and has been considered another milestone in the history of Islamic finance. It was established by member countries of the Organization of Islamic Conference (OIC) as an international financial institution to deal with the financial needs of Islamic countries. In the first 10 years of this century, Shariah-compliant funds grew at an annualized 26% rate, according to a study by consulting firm PricewaterhouseCoopers (PwC) in 2011. Global Islamic assets under management (AUM) were $47 billion in 2008 and $70.8 billion at the end of 2017, according to Malaysia Islamic International Financial Center's report.
Nevertheless, the market size of Islamic financial services in the mid-1990s was just around $150 billion. There are hundreds of Islamic stock indices offered by Standard & Poor's, FTSE, Dow Jones and MSCI Barra. They are currently offering more than 700 Islamic mutual funds in multiple assets (e.g., equity, real estate, Islamic shares and commodities). Diversification is a strategy used for risk management. A diversified portfolio is made by mixing different types of assets with various characteristics to minimize the risk of the portfolio. Diversification is a technique used to construct a portfolio with optimum benefits. The purpose of using a diversification technique is to build a portfolio by using different types of assets and securities, which help lower the risk and increase the long-term returns of holdings on average. In today's competitive and interconnected world, diversification plays a key role in fund managers' getting potential benefits (Tiwari et al. 2018).
Financial contagion refers to "the spread of market disturbances, mostly on the downside from one country to the other, a process observed through co-movements in exchange rates, stock prices, sovereign spreads, and capital flows". The economies integrating their financial systems internationally with financial institutions and markets may face the risk of potential financial contagion. The contagion effect is the transmission of economic crisis to other countries across neighbors or expands across regions directly or indirectly. Several classification branches describe the process of financial contagion. The first is "Spillover results", which are negative externalities often referred to as contagion based on basics. They can have a huge effect on neighboring nations, regionally and even internationally. While co-movement does not necessarily constitute contagion, it happens during a time of crisis, and its impact is adverse; it can be expressed as contagion.
Nobel Prize Economist, Markowitz (1952) made the case that portfolio risk should be the focus of attention rather than the risk or volatility of any one item. Additionally, he claimed that a diversified portfolio is less erratic than the sum of its constituent components, even though each asset may be extremely erratic on its own. The whole portfolio's volatility may actually be relatively low. Precious metals are defined as rare metals that carry a high economic value due to their features. These features include their scarcity, industrial usage, hedging ability against inflation, and their historic role as a store of value. The most famous precious metals for investments are gold, silver and platinum. In early times, precious metals were imperative as currency, but nowadays, they are mainly regarded as raw materials for investment and industrial purposes. Gold, platinum, palladium and silver have ISO currency codes. They were mainly traded as portfolio diversifiers and hedgers for inflation. Investors and traders purchase precious metals through multiple mechanisms, such as owning physical coins or bullion, derivatives or ETFs. There is a relationship between precious metals and stocks. The basic difference is that stocks are classified as "equities," interpreted as the stockholder owning a portion of a stock issuing company. Moreover, they are classified as "commodities," which means that metal owners hold a distinct, physical product. Investors in precious metals make money from the rise in demand for them. An immense increase in demand and price of precious metals has been witnessed during the last few years. This demand has been mainly caused by loose monetary policy by governments like the USA, which inject large quantities of cash into the economy, which boosts commodities prices, increases the money supply, causes fear of inflation, and increases volatality in the market. Whenever stock markets face extreme volatility, investors switch to commodities such as silver and gold for hedging and reduction in risk, as well as for financial reasons.
The fear of debt also drives the precious metals market. For example, when Europe was on the verge of collapse due to its high levels of leverage and debt, investors flocked to gold and silver for safety as they worried about the consequences of a big nation failing, like Greece. The alleged threat of conflict or other geopolitical turbulence also contributes to this fear. Traditional equities have a place in every portfolio. However, since the problems mentioned above seem to be near are solution, gold and silver are seen as a wiser and safer bet than the stock market.
The purpose of this study is to investigate the diversification dimensions of portfolios with Islamic stocks and conventional stocks to decrease the risks and maximize returns. As Islamic financial markets are growing rapidly, their characteristics have become a topic of research. Due to the increasing volume of stock funds, researchers are trying to find the links and co-movements between Islamic and conventional equity markets to reduce risks and improve returns. This study intends to help investors and policymakers make investment choices and assess the behavior of alternative assets; in the context of crises and portfolio diversification. This research will help investors by providing a picture of the diversification ability of Islamic stock markets themselves and their characteristics when combined with precious metals for diversification. It will also provide evidence on the transfer of crisis to markets by the Islamic stock index and how they act during a crisis, as they are not believed to transfer risk but cushion providers during a financial downturn. The role of precious metals is checked, and they are classified as "safe", by mixing them with stock portfolios. This research will help investors in optimize returns and reduce risks by diversifying stock portfolios with precious metals and monitoring risk adaptability and transferability. The behavior of correlations among asset classes during different market conditions is analyzed. The impact of regime shifts on portfolio diversification benefits and risk management strategies is assessed. Furthermore, we offer insights into how the risk structure of financial asset returns varies across different correlation regimes and implications for portfolio construction and risk management.
These approaches will provide valuable insights into the diversification benefits of mixing Islamic and conventional stocks with precious metals, as well as the risk structure of financial asset returns in different correlation regimes. Our results will help investors model their investments during periods of economic turmoil. In this sense, it is particularly relevant to fund managers and policymakers and helps develop a consensus in the literature. The objectives can be narrated as:
- To investigate the potential diversification benefits of Islamic and conventional stocks when combined with precious metals.
- In a regime of positive and negative correlation, what is the risk structure of the financial assets?
2. Literature Review
The related literature is reviewed in this section. The efficacy and efficiency of traditional stock markets and Islamic stock markets are verified, along with the literature on the role of precious metals. The related literature examining connections between stock markets and precious metals is also discussed, as well as the literature showing the possible use of Islamic stock funds as diversifiers for traditional stock risk when invested with alternative assets. After that, literature on the contagion effect of stocks, both conventional and Islamic stocks, is explored, and lastly, the diversification ability of Islamic funds with safe heaven asset classes is explored. Several studies tried to examine the relationship between stock indices and alternative assets. According to some studies, Islamic stock markets are considered less efficient than their conventional counterparts. Asset allocation is an issue of vital importance for the entire industry of asset management to get the best possible return-risk portfolio. These linkages are important for tactful asset allocation, especially in the case of a positive correlation between stock and assets.
Relatedly, Rizvi et al. (2015) examined the nature and behavior of time-varying systematic risk in sector indices for Islamic and non-Islamic indices. They found that both Islamic and conventional indices follow a similar cyclical pattern over time. According to Hammoudeh et al. (2014), the international Islamic equity indices market shows a significant dependence on three main global conventional equity indices: the United States, Europe and Asia. They also found a positive significant tail dependence between Islamic stocks. This positive dependence showed that they cannot be used for hedging extreme movements in conventional stock in disturbance periods. (Sensoy et al. 2015) made a comparison between non-linear time-varying patterns of predictability of Islamic and conventional stock markets. They also analyzed the weak-form efficiency in these markets. It is indicated that the markets under study exhibit various degrees of time-varying predictability. The authors also acknowledged that conventional markets are overall more efficient than Islamic ones.
Other studies demonstrated that Islamic stocks can be utilized to hedge against conventional stocks. Azmi et al. (2019) investigated the Islamic sustainability equity indices and compared them with benchmarks of the global equity market. They found that investors are not supposed to pay the price for their investment in sustainable or Islamic equity indices. By the combination of Islamic equity indices and sustainability investing strategies, an investor can get more benefits, especially during a boom economic period, bullish markets and subprime crises. (Saâdaoui et al. 2017) investigated the dynamic relationship among Islamic and conventional stock markets. They used a wavelet analysis approach. Their study's results indicated the existence of a clear low-level relationship between emerging markets, especially in short-term horizons. This weak relationship provides portfolio managers with opportunities for diversification and offers different alternatives for investment.
El Mehdi and Mghaieth (2017) examined the links of volatility between conventional and Islamic markets and confirm the effective use of Islamic stocks for hedging. They found that an investor can achieve the benefit of risk adjustment in a portfolio by diversifying it. Diversification can be achieved by including Islamic and conventional indices in the portfolio. Kenourgios et al. (2016) Investigated the contagion effects of the Eurozone Sovereign Debt Crisis (ESDC) and the Global Financial Crisis (GFC) on Islamic bond and equity markets. They used a sample comprising Islamic stock indices of various emerging and developed markets, global Islamic stock indices, and bond indices (Sukuk). They explored the dynamics of conditional correlation asymmetries across stable and crisis periods and also across the two crises. Their results suggest that Islamic securities can function as a cushion against the risks and instabilities of the market, especially in periods of turmoil. Ho et al. (2014) made a comparison of Islamic and conventional stock indices markets. They used the risk-adjusted performance of stocks and found that Islamic indices performed better than conventional counterparts during their crisis period. Likewise, Rizvi et al. (2015) investigated the co-movements in Asia-Pacific, Islamic and US equity markets. The results suggested that Islamic equities and their composition can be taken as buffers in times of financial downturns. The contagious impact of ESDC and GFC on Islamic stock and bond markets was examined by Kenourgios et al. (2016). However, they did not identify evidence of significant contagion between Islamic and traditional bonds and stock indices. Their findings suggest that Islamic bonds and equities, especially in periods of volatility, may provide a buffer against market uncertainty and risk.
Concerning connectedness, Michis (2014) studied the contribution of gold to portfolio risk. He made a comparison of the risk of treasury bills, gold and government bonds and suggested that gold contributes the lowest portfolio risk compared to treasury bills and bonds. Additionally, Maghyereh and Awartani (2016) investigated dynamic connectedness between gold, Sukuk and Islamic equities at multiple investment horizons. They reported that investors can get diversification benefits in the short term by adding gold to the portfolios of Islamic equities. The poor connection between gold and Islamic stocks was identified by (Nguyen and Bhatti 2012). Ciner et al. (2013) investigated the return relations among major asset classes. They identified a dynamic correlation between gold, oil, currency, bond and stock markets. These authors also propose, based on data from both US and UK markets, that the gold market is a hedger for fluctuations in exchange rate.
Worldwide financial and economic shocks were explored (Ajmi et al. 2014, Hammoudeh et al. 2014). According to these studies, gold serves as a solid hedge against financial market losses and excessive oscillations. According to Beckmann et al. (2015), depending on the particular economic situation under consideration, gold functions as a hedge and a safe haven. The study by Baur and Lucey (2010) examined the hedging and safe haven properties of yellow metals. They also analyzed correlations between the stock, bond, and gold returns in the US, UK, and Germany and found that gold is a stock hedger and a safe refuge during stressful times. Hillier et al. (2006) looked into the possibility of using gold or other precious metals as a hedge under highly unpredictable market conditions. They discovered a weak link between stock indices and precious metals, demonstrating their potential as a diversification tool. Lucey and Tully (2006) evaluated the effect of gold prices on the FTSE and NASDAQ indices from 1980–2003, and reported that gold helped with portfolio diversification. Smith (2002) looked at how gold fits into diversifying portfolios. The author researched 17 European stock exchanges. His results provide credence to earlier research that claimed there was a weak or inverse relationship between stock indices and gold prices. Sherman (1982) discovered that gold does not correlate strongly with other assets. Considering this, adding gold to a portfolio is advantageous for investors. Decades ago, Solnik and McDonald (1977) conducted a study to look at how gold affects portfolio diversity and found no correlation between gold and stock prices. However, for portfolio diversification, they reported that gold and gold mining equities were both profitable.
3. Data and Methodology
3.1. Data
The sample period ranges from March 2011 to March 2021, yielding a total of 2501 daily observations. All the data was sourced from Thomson Reuters. In this research, data consists of two stock indices and the global precious metals index (GSPM) as an alternative asset. The selected stocks include Islamic stocks and conventional stocks. The countries that make up the sample include Belgium, France, Germany, Hong Kong, India, Ireland, Italy, Japan, Malaysia and Mexico. The dynamic dependences between stock indices (Islamic stock and conventional stock) and precious metals are modeled using a time-varying copula model with a switching dependence. The joint distribution of stock indices and alternative assets is obtained to estimate risk spillover across markets.
3.2. Copula Modeling
A copula is a multivariate distribution function on the interval of (0, 1) with uniform distributions for its margins. The marginal distribution functions of these two random variables are as follows: (Sklar 1996) theorem states that given bivariate time series rₜ = (r₁,ₜ, r₂,ₜ), their joint distribution F may be described in terms of a copula function.
where Cₜ is the copula dependence structure, F₁ and F₂ are the marginal distribution functions of returns r₁ and r₂, respectively, and parameter θ = (θ₁′, θ₂′, θc′)′. As a result, the joint density has the following expression:
where ƒ₁ and ƒ₂ are the marginal densities of r₁ and r₂, respectively, and cₜ is the copula density.
F (r₁, r₂; θ) = Cₜ (F₁ (r₁; θ₁), F₂ (r₂; θ₂); θс)
ƒ(r₁; r₂; θ| Ƒₜ-₁) = cₜ (F₁(r₁; θ₁), F₂ (r₂; θ₂); θc) ∙ ƒ₁ (r₁; θ₁) ∙ƒ₂ (r₂; θ₂)
3.3. Dependence-Switching Modeling
A fluctuating link between stock indices and alternative asset dependence is typically found, which transitions between positive and negative regimes while modeling the dependence structure between Islamic stock indices and, conventional stock indices and alternative assets. The investing substitution impact is associated with the negative regime, whereas the portfolio-linked effect is associated with the positive regime. Consequently, Wang et al. (2013)'s Markov-switching copula model, which establishes the unobserved state variable in both copula function and marginal models, is introduced to represent these two regimes.
Next, the design of a state-varying copula is as follows: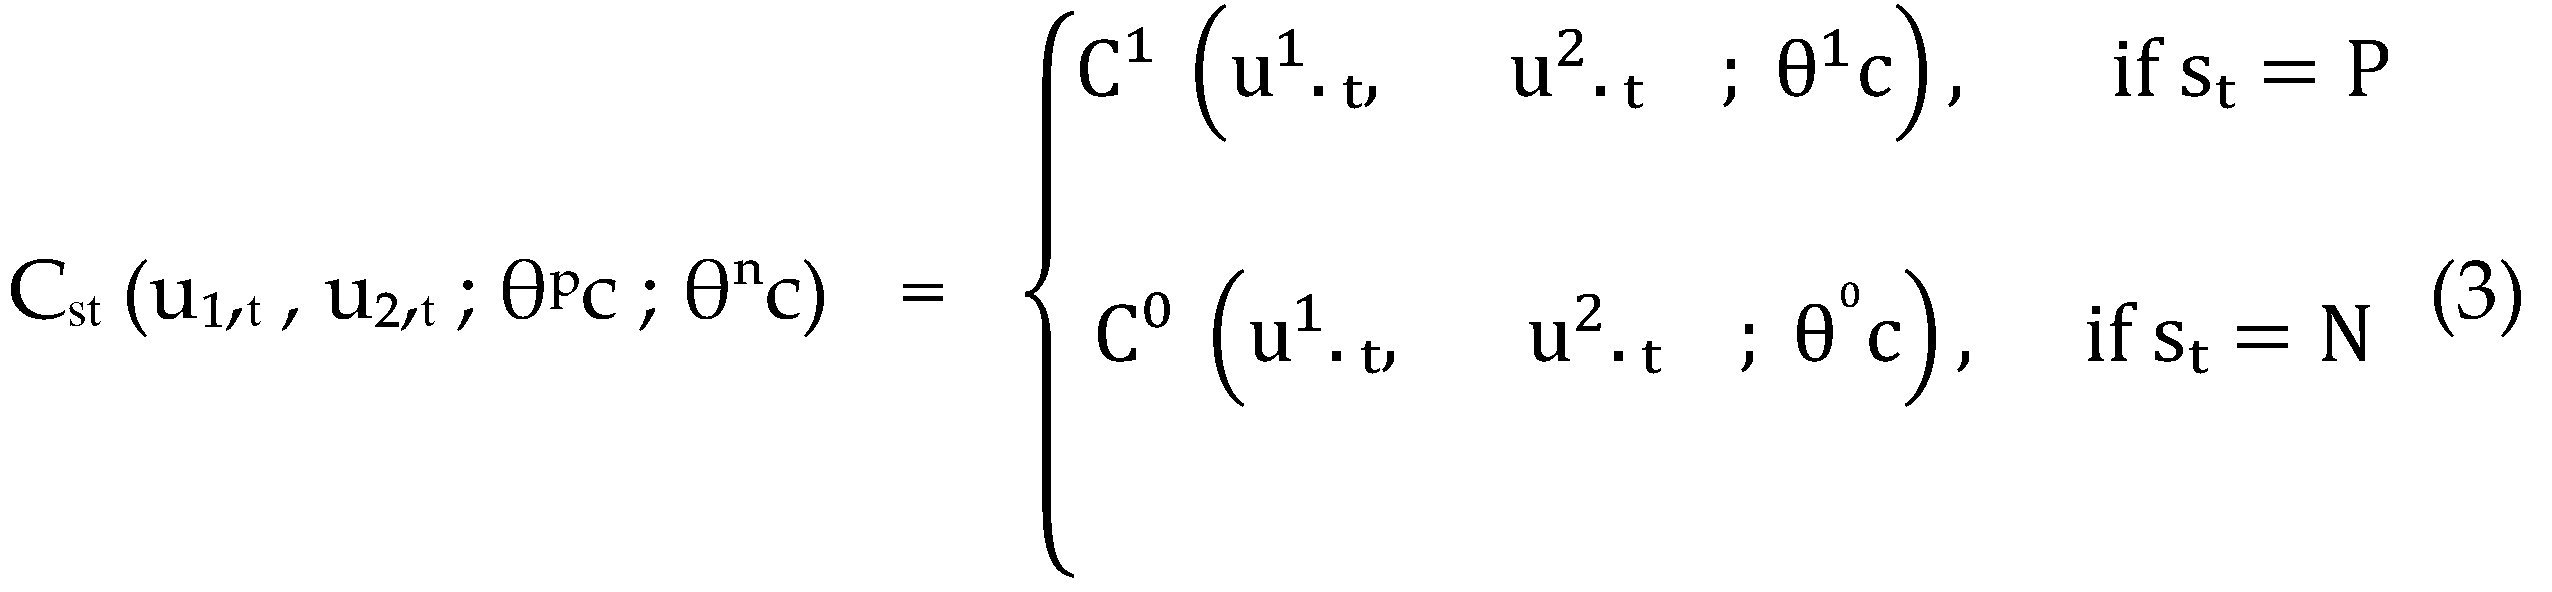
Moreover, according to their marginal distribution functions, r₁,ₜ, r₂,ₜ, and u₁,ₜ, u₂,ₜ are probability integral transforms of those values. Sₜ ∈ (P, N) , where St is the state variable. The regime of positive dependence is indicated by P. On the other hand, the regime of negative dependence is shown by N. Two mixed copulas having positive and negative dependence structures, respectively, are Cₒ(⋅) and C₁(⋅). Equation illustrates how the state variable St is subject to an order-one Markov chain that is parameterized by a transition probability matrix:
Where, Pij = Pr[Sₜ= j|Sₜ = i] The probability of being in the negative dependency regime at time t, conditional on being in the same regime at t−1, is Pₙₙ for i, j=N, P. probability of the positive dependency regime in a continuous two-day period is denoted by Pₚₚ. In particular, the Clayton copula and its transformational copulas are selected to capture the asymmetric tail dependence. According to Liu et al. (2017) the 180-degree Clayton copula can capture asymmetric positive dependency, but the Clayton copula merely has a lower tail dependence. Nonetheless, the negative reliance, which has an upper-lower tail dependence and a lower-upper tail dependence, can be captured by a 270-degree and 90-degree rotated Clayton, respectively. As a result, to represent positive dependency, the 180-degree and 90-degree rotating Clayton copulas are mixed as C₁(. ), and to represent negative dependence, the 270- and 90-degree rotating Clayton copulas are mixed as Cₒ(.) (Liu et al. 2017, Wang et al. 2013).
where Cc (u, v; α) = (u-ꟹ + v-ꟹ−1)ˉ¹/ꟹ, CSC (u, v; α) = u + v−1 + Cc(1− u,1− v; α) and α ∈ (0, ∞).
C₁ (u₁,ₜ, u₂,ₜ ; θ¹C ) = 0.5 Cc (u₁,ₜ, u₂,ₜ ; α₁) + 0.5 CSC (u₁,ₜ , u₂,ₜ ; α₂)
Cₒ (u₁,ₜ, u₂,ₜ ; θ¹C ) = 0.5 Cc (1−u₁,ₜ, u₂,ₜ ; α3) + 0.5 CSC (1− u₁,ₜ , u₂,ₜ ; α4 )
Two positive scenarios in which both markets are bullish or bearish may be measured by C₁(⋅), and two negative scenarios in which one market is bullish while the other is bearish can be measured by Cₒ(⋅). Additionally, by changing the copula parameters αi with τi = αi/(2 + αi), ρi = sin (π×τi/2) and φi = 0.5×2ˉ1/αi for i = 1, 2, 3, and 4, one can obtain Kendall's τi, the correlation coefficient ρi, and the tail dependency φi (Wang et al. 2013). Consequently, the following is the joint density function that considers the unobserved regime variable sₜ:
where cj(⋅) is the copula under regime j, θʲc is its parameter set, and θʲ is the parameter set of the marginal distribution under regime j.
ƒ( r₁,ₜ,r₂,ₜ; θᵖc, θⁿc, θᵖ, θᵏ) = {Σj∈(P=N) Pr(Sₜ = j) cj(u₁,ₜ, u₂,ₜ; θʲc) X
ᴨ²ₖ₌₁ {Σj∈(P=N) Pr(Sₜ = j) ƒₖ(rₖ,ₜ; θʲ, Sₜ= j)}
3.4. Model Estimation
Individual estimates are made for the copula density and marginal densities in accordance with Li et al. (2019) estimations technique. As suggested by (Joe and Xu 1996), the inference for the margins (IFM) is used for the mixed copula model estimations. The parameters in the marginal models are estimated in the first stage of this two-step IFM approach, and the copula parameters are estimated in the second step based on the marginal parameters. Combinations of the lag parameters m, n, p, and q are used to estimate the marginal ARMA(m,n)-GARCH(p,q) models, each of which has a skewed Student-t distribution. The values of the lags range from zero to a maximum of three. Using AIC, the optimal lag combination for each marginal model.
In theory, it is known how to alter the standardized residuals using a certain distribution. Since the precise distribution of the standardized residuals cannot be determined empirically, transforming the standardized residuals using a particular distribution might not provide a uniform distribution. The transformation of standardized residuals based on an empirical CDF will asymptotically always produce a uniform distribution, irrespective of the specification of the marginal models, as the canonical maximum likelihood (CML) approach emphasizes. The following empirical marginal cumulative distribution function is used in the CML technique to convert the standardized residuals into a uniform distribution to prevent misspecification in the marginal models:
where I(.) is an indicator function that is one if η^k;t≤ω and zero otherwise. Next, cumulative probability for each observation of η^k;tbyu^k;j=^Fk(η^k;j), k =1,2, j=1, 2,…,T. is obtained. Given the estimated marginal parameters, the copula is estimated using parameters ψ by maximizing the log-likelihood function Lc(ψ1). Because the dependence structure follows a Markov-switching process, Hamilton's filtered system is used to transform the log-likelihood function of the model as follows:
Fˆk(ω)= (1/T+1)∑ᵀₜ₌₁ I (η^k≤ω)
Lc (ψ1) = log (^ξ' t/t −1ηt)
The copula parameters ψ1=(α1,α2,α3,α4,P11,P00)′ can then be estimated by maximizing Lc(ψ1)3;
ψ1= argψ1max∑ₜ₌₁TLc (ψ1 )b
4. Results and Discussion
The study's methodology is driven by the observation that, although returns are detrimentally low during times of market stress, the conditional variance of the stock portfolio, which consists of conventional and Islamic equities separately, increases at those times. Investor focus has shifted to alternative assets because of this fact, either to obtain safe haven benefits during economic downturns or to minimize risk through hedging. This study is based on the argument that no research has previously been conducted to analyze the asymmetric dynamics of financial asset returns, hedging effectiveness, safe haven ability and diversification benefits of the GSPM.
4.1. Descriptive Statistics
The descriptive statistics of the countries' stock indices returns and alternative asset returns are reported in Table 1. In this research, data consists of two stock indices and four alternative assets. The selected stocks include Islamic stocks and conventional stocks. The selected countries include Belgium, France, Germany, Hong Kong, India, Ireland, Italy, Japan, Malaysia and Mexico, and the chosen alternative asset was GSPM. The sample period ranges from March 2011 to March 2021, yielding a total of 2501 daily observations. The majority of the means of the returns are positive during the sample period for selected stocks and precious metals, with Islamic stocks having the largest standard deviation. All the standard deviations of the returns are positive during the sample period.
The descriptive statistics reported in Table 1 show that the average daily mean returns of all stock indices and precious metals ranged from 0.001 to 0.025. Average returns for Islamic stock indices ranges from 0.001 to 0.011 and from 0.002 to 0.012 for conventional stock indices. The mean is highest for GSPM, with 0.025. However, the standard deviation ranges from 0.006 to 0.016. The highest standard deviation is reported for Italy for Islamic stock indices, and Malaysia reported the lowest standard deviation. The values range from 0.007 to 0.017 for Islamic stock indices and 0.006 to 0.015 for conventional stock indices. Islamic stock markets have a larger range for the maximum and minimum than conventional stock markets, and their behavior is more volatile than conventional stocks. The return distributions for the stock indices (Islamic and conventional) and GSPM are positively skewed. The right tail is longer; the mass of the distribution is concentrated on the left of the distribution. All the return series exhibit excess kurtosis and are rejected following a normal distribution. The kurtosis coefficient and Jarque-Bera test statistics show that the return series are not normally distributed. The null hypothesis of normality is rejected at the significance level of 1%. The unit root tests of ADF are calculated. These tests show consistent results: each variable is stationary by significant ADF.
4.2. Marginal Model's Estimations
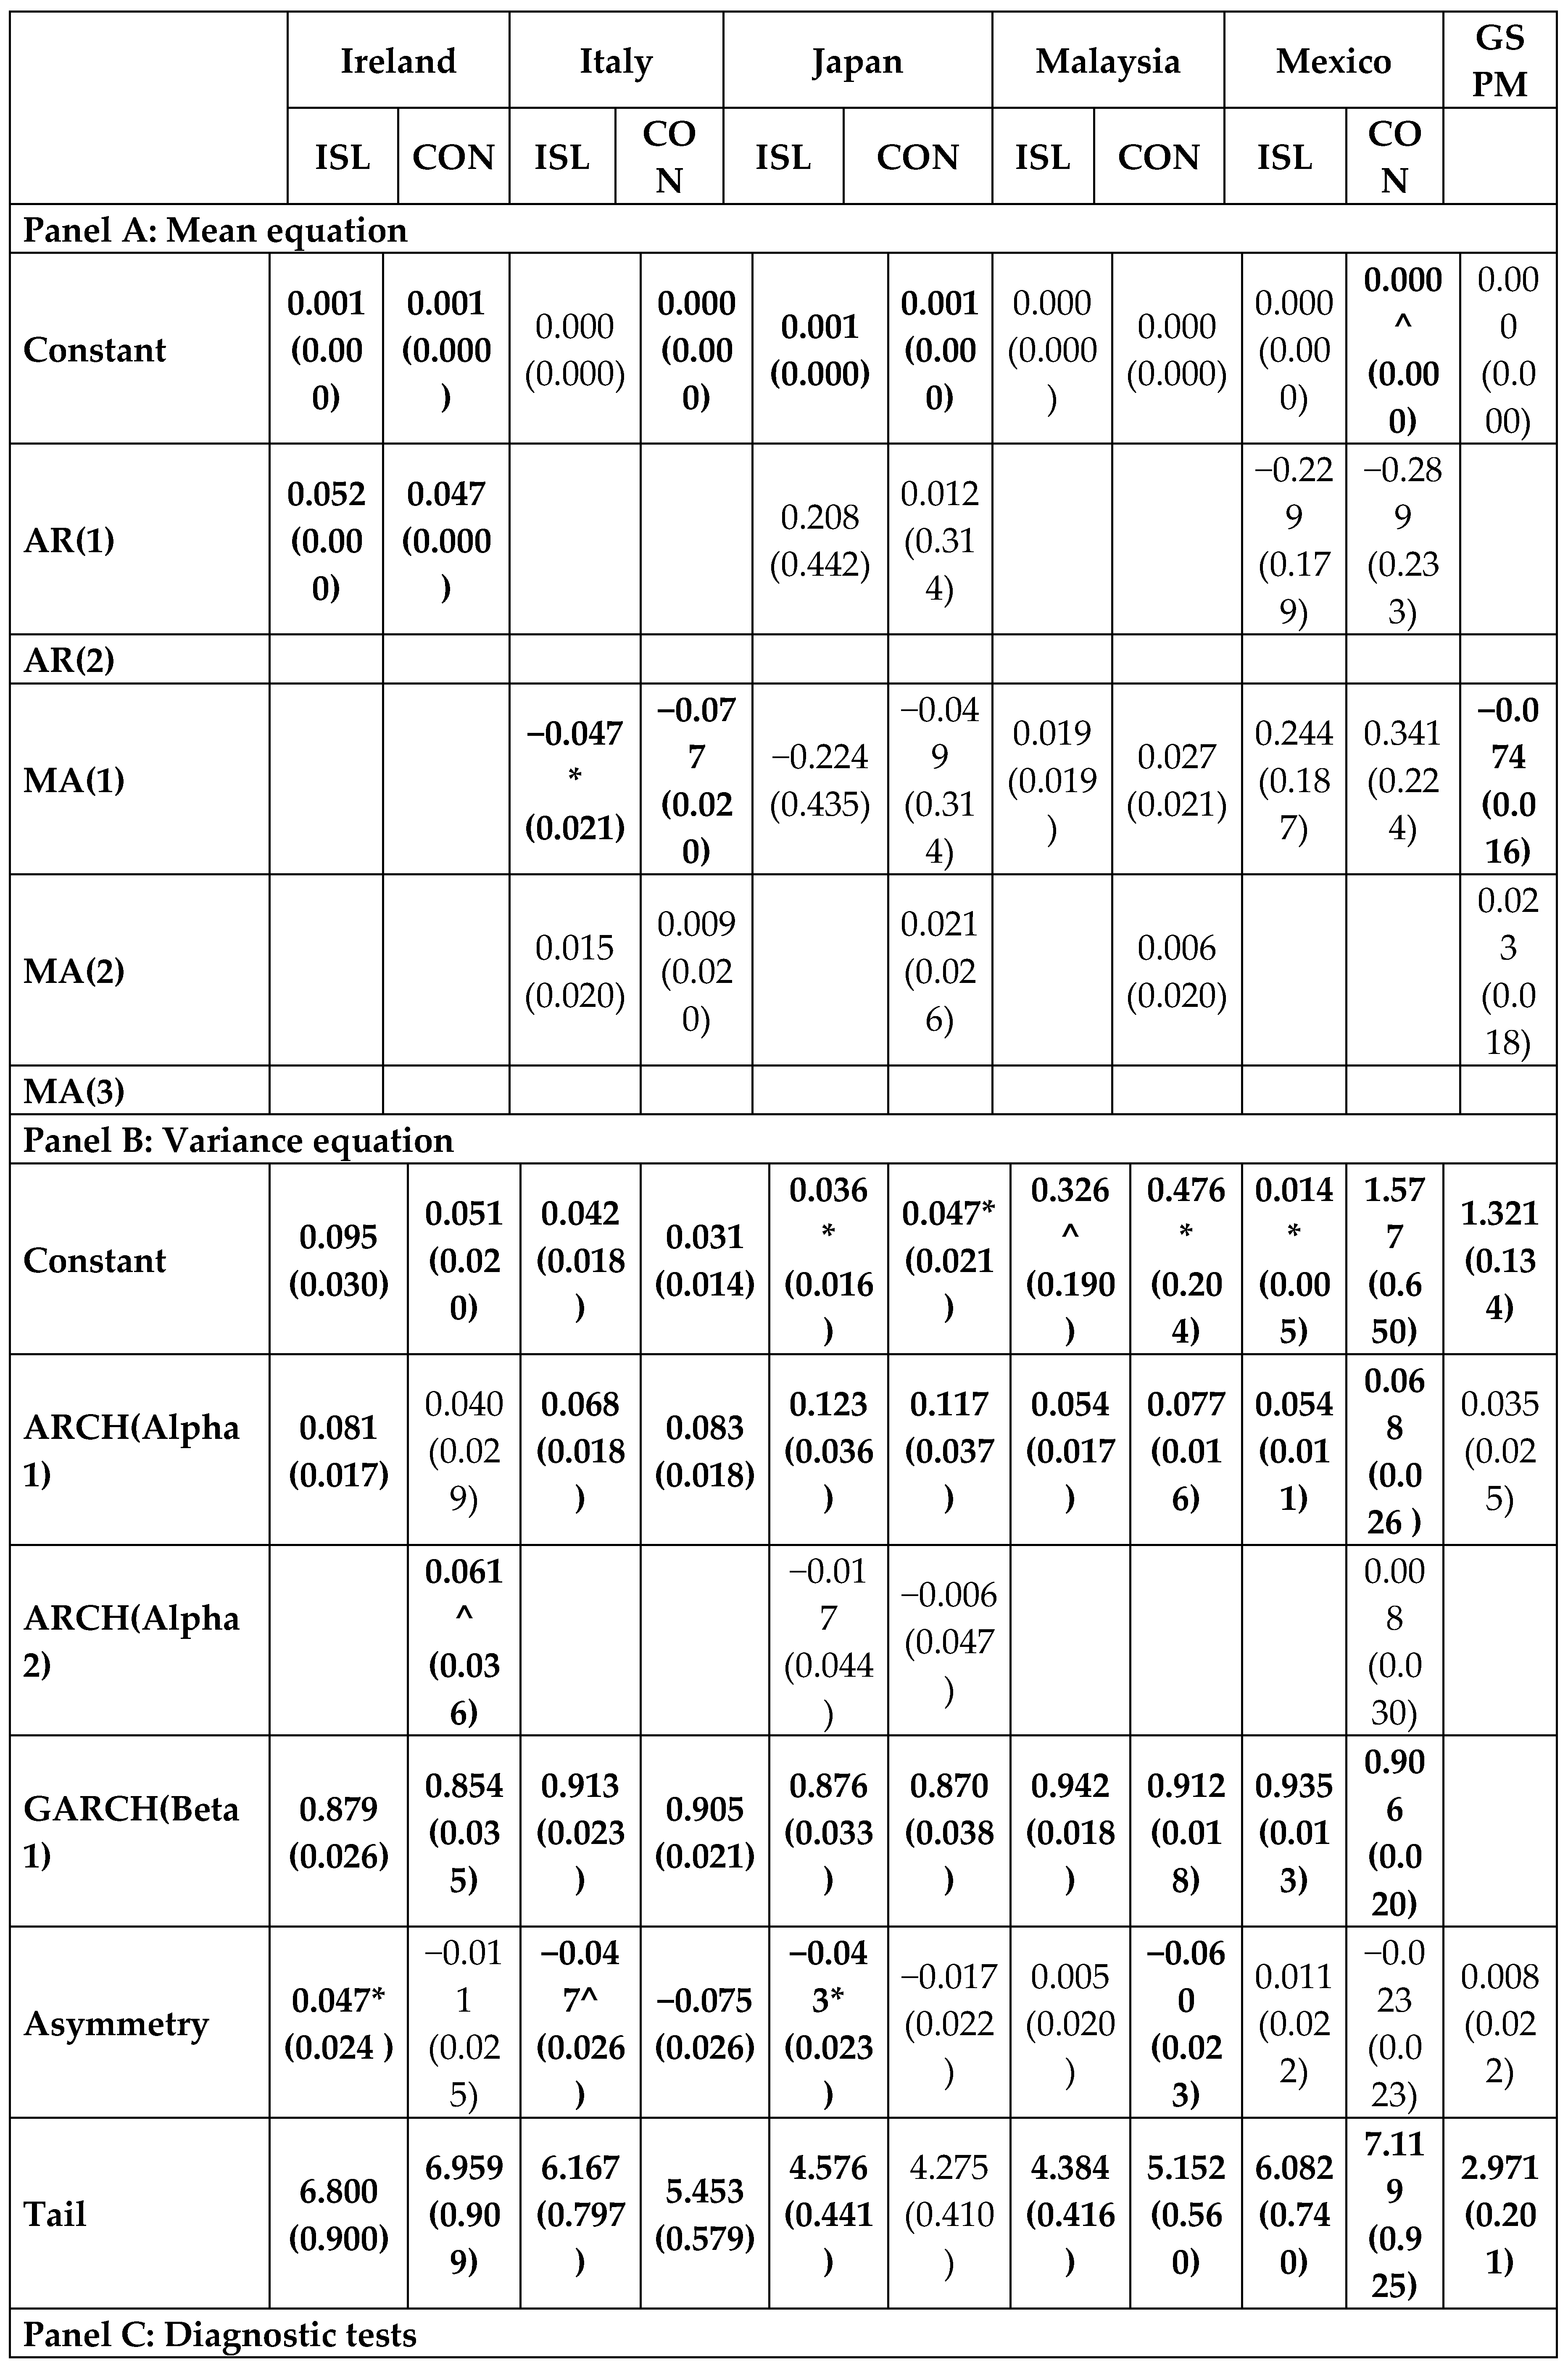
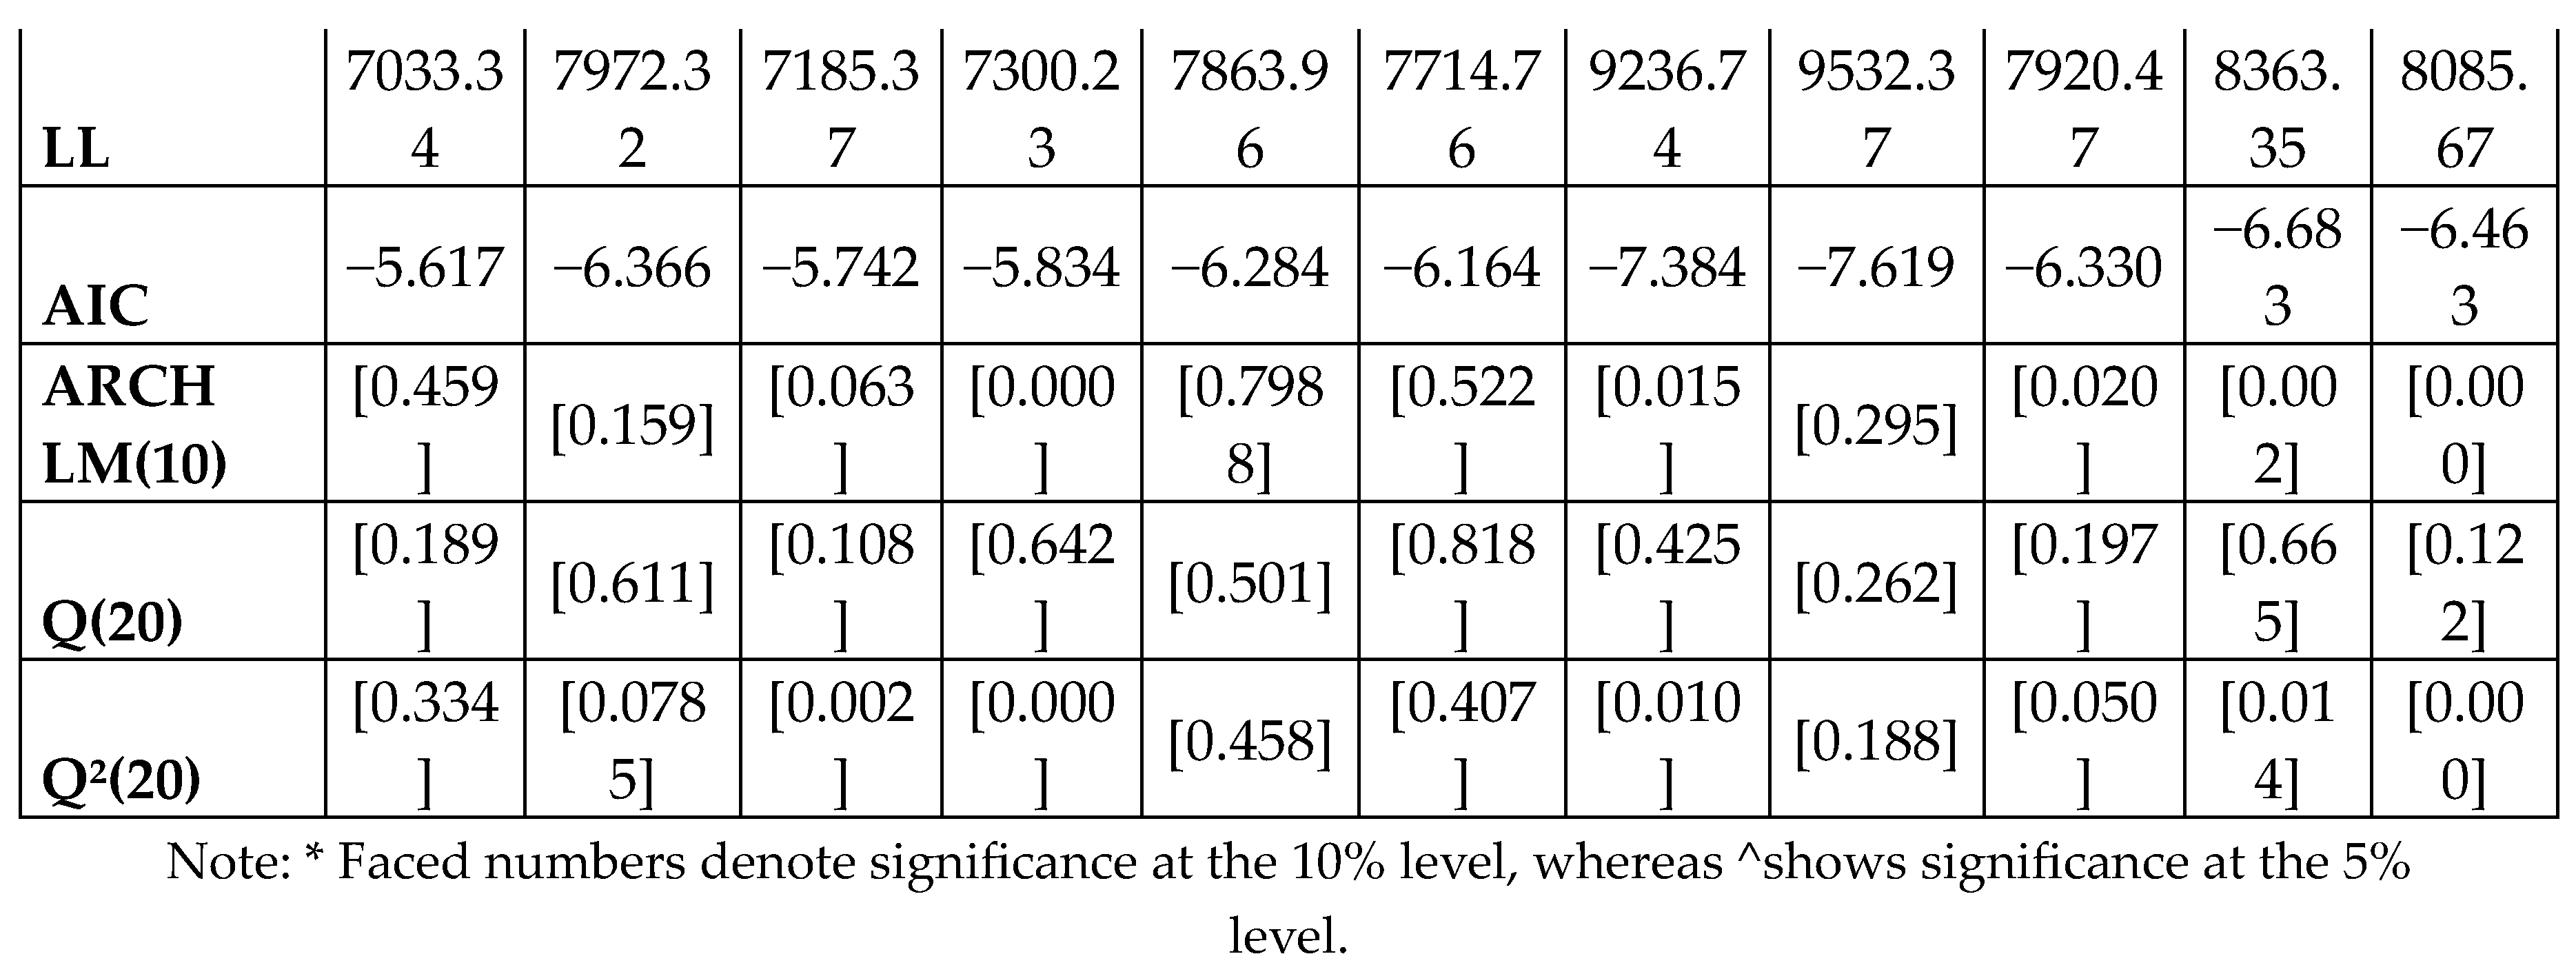
The results of the parameter estimation using the marginal specification of the ARMA-GARCH skewed-t model, the most appropriate estimation model for the methodology under study, are shown in Table 2. The AIC for the various combinations of values between zero and three establishes the ideal lagged order of the model for each return. The findings demonstrate that while each return adheres to a distinct set of ARMA (m, n) type mean equations, the majority of coefficients are significant at the 1% level. For each volatility equation, the total of the ARCH and GARCH terms approaches one, suggesting strong volatility persistence. The skewed-t distribution's values degree of freedom, which varies from 2 to 8, shows that the error terms were non-normal and had a heavy tail.

Table 2.
A): Marginal Model's Estimations between Islamic/Conventional Stock Indices and Precious Metals.
Table 2.
A): Marginal Model's Estimations between Islamic/Conventional Stock Indices and Precious Metals.
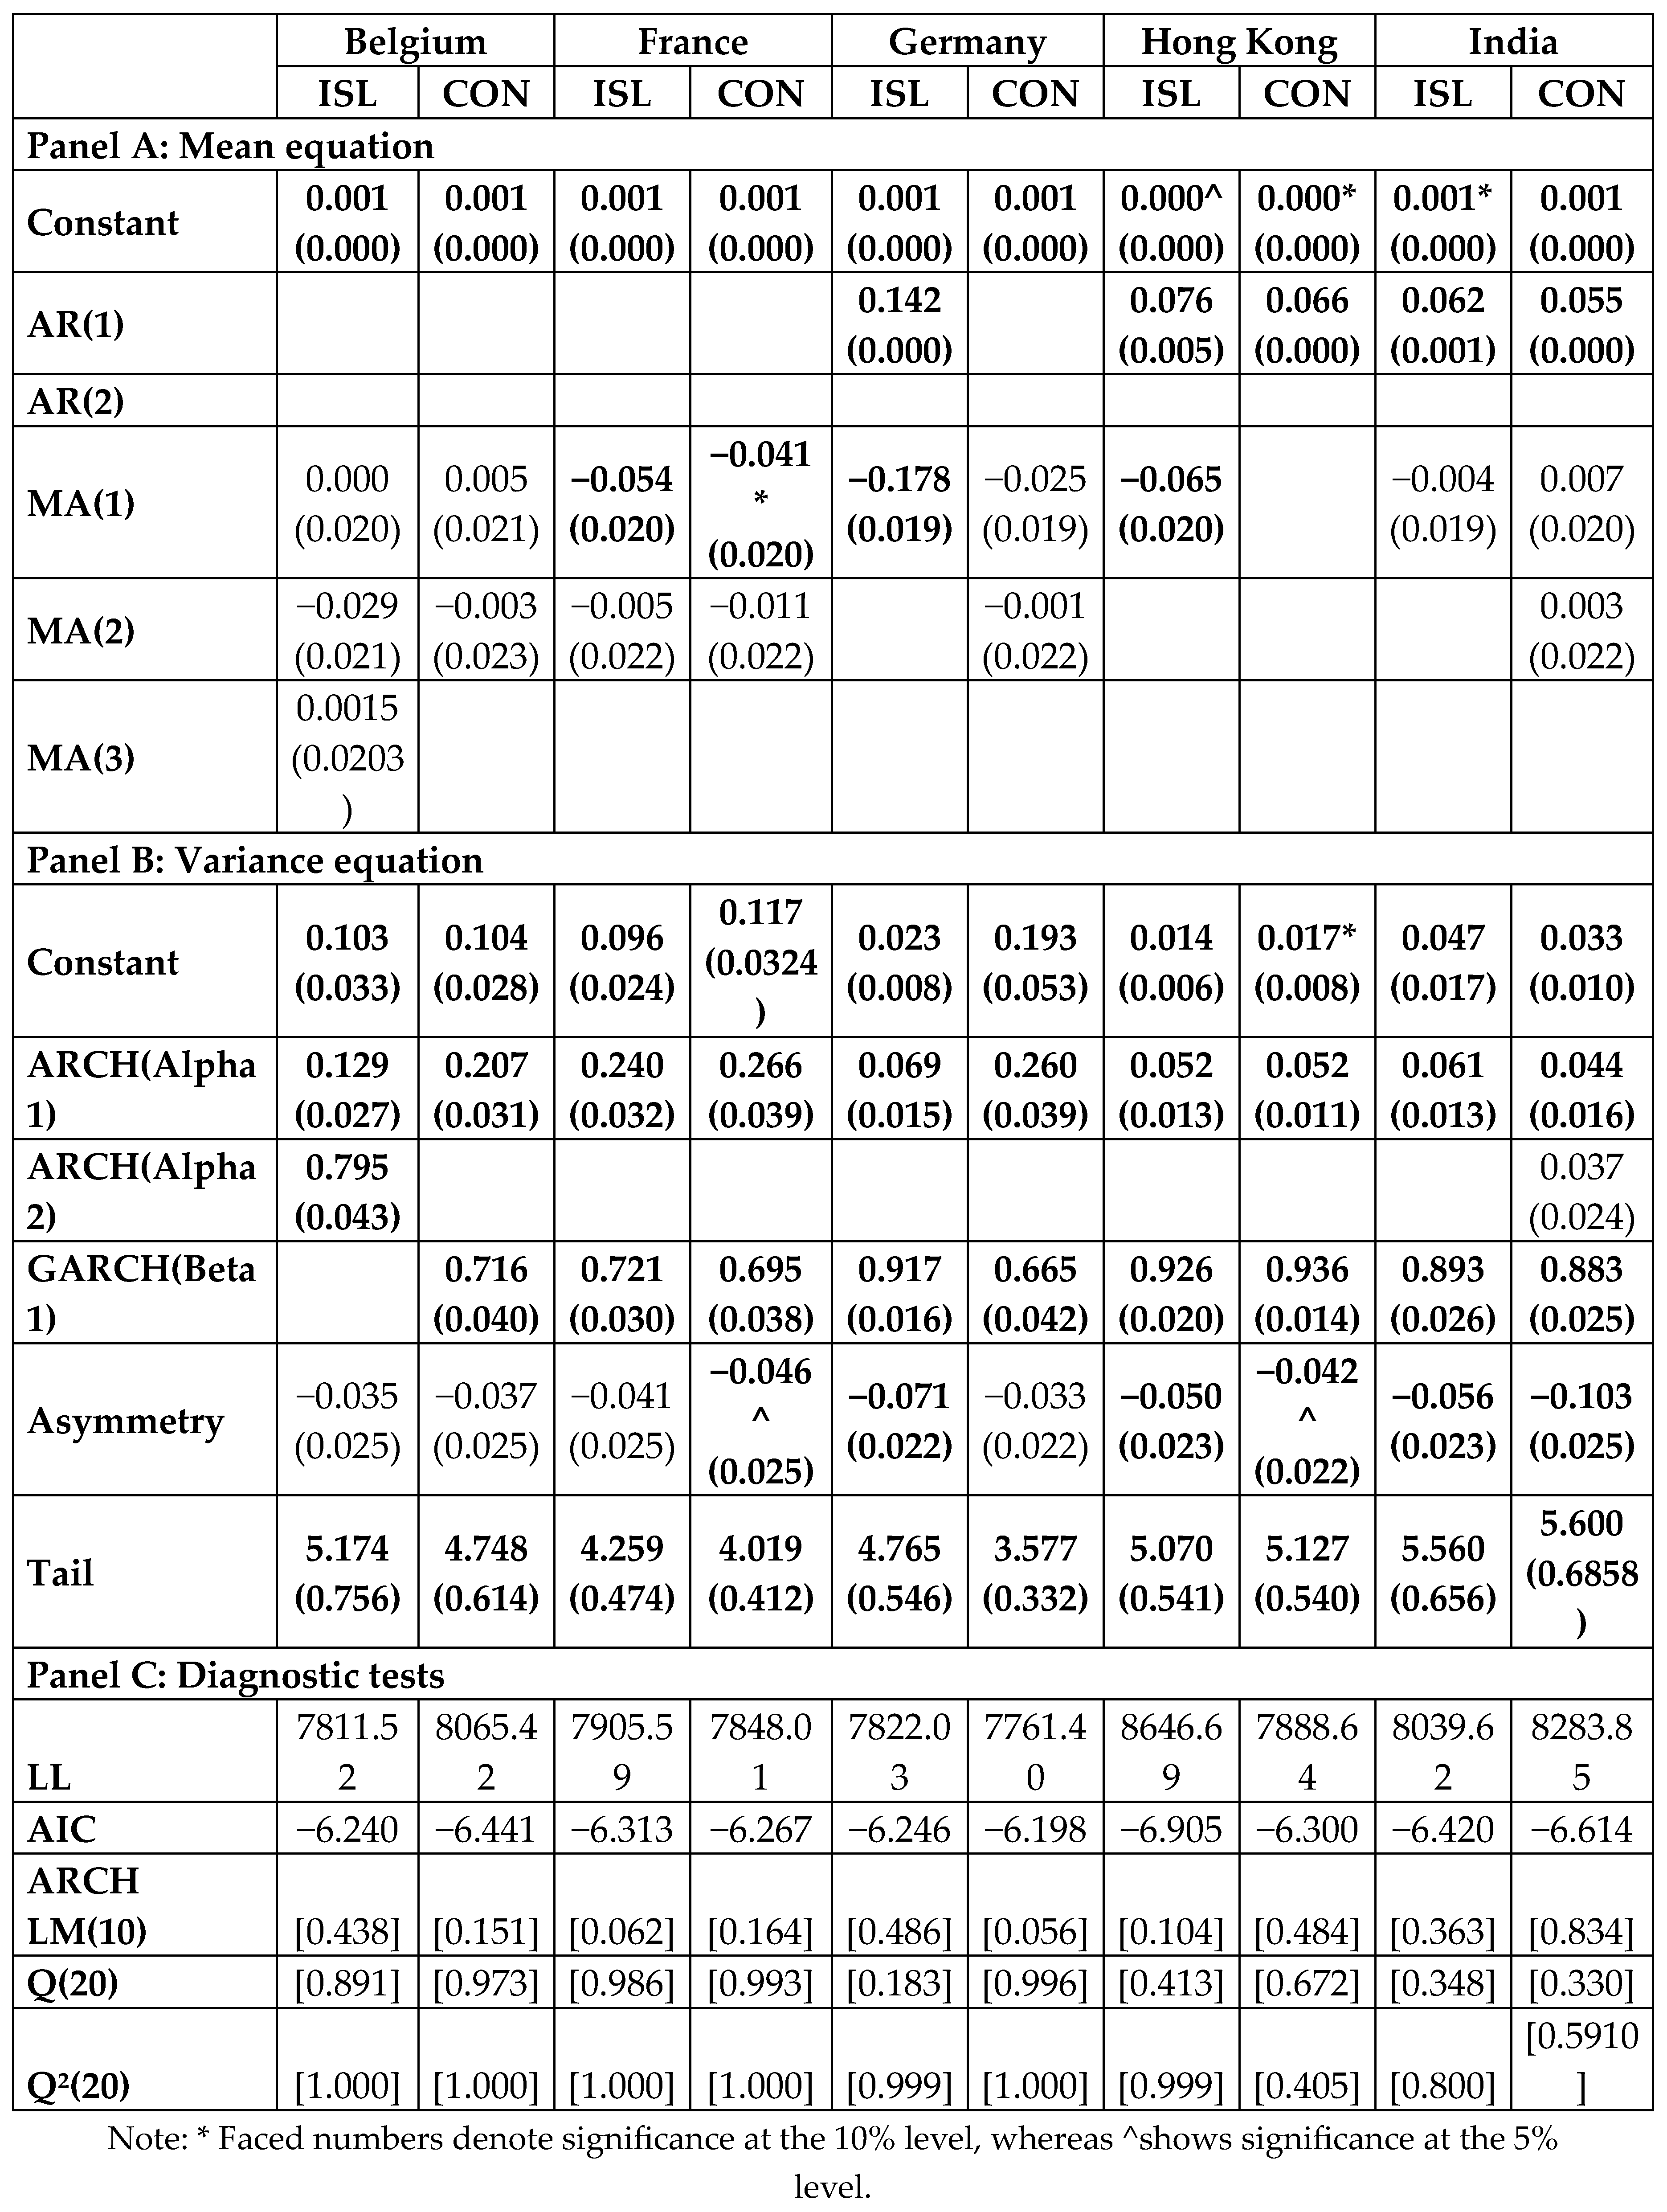 |
Table 2.
(B): Marginal Model's Estimations between Islamic/Conventional Stock Indices and Precious Metals.
Table 2.
(B): Marginal Model's Estimations between Islamic/Conventional Stock Indices and Precious Metals.
|
All series have a positive and substantial asymmetry coefficient at the 1% level, which further supports the heavy tail's rightward skew. Large positive returns are, therefore, more probable than large negative returns. At the 1% significant level, the null hypothesis that there is no serial correlation and conditional heteroscedasticity is not rejected by the ARCH-LM tests, the Ljung-Box statistics of Q(20) and Q²(20), and the Ljung-Box statistics. The developed ARMA-GARCH skewed-t models shown in Table 2 provide well-specified marginal distributions as compared to descriptive statistics.
4.2.1. Single-Copula Models between Stock Indices and Precious Metals Index
To quantify the dependence between stocks and alternative assets (precious metals), six single-copula models, including normal, t, and four different versions of the Clayton copula, are initially employed (Wang et al. 2013). The GSPM and the coefficient estimates for each pair of stock indices are shown in Table 3. The findings demonstrate the significance of the parameters calculated by the t, normal, 180-degree, and Clayton methods at the 1%, 5%, and 10% levels for each pair. Except for Mexico, all pairs are significant for GSPM and Islamic stock; pairs with conventional stock alone are insignificant for Malaysia.
Table 3.
A): Estimation of Single-copula Model between Stock Indices and Precious Metals.
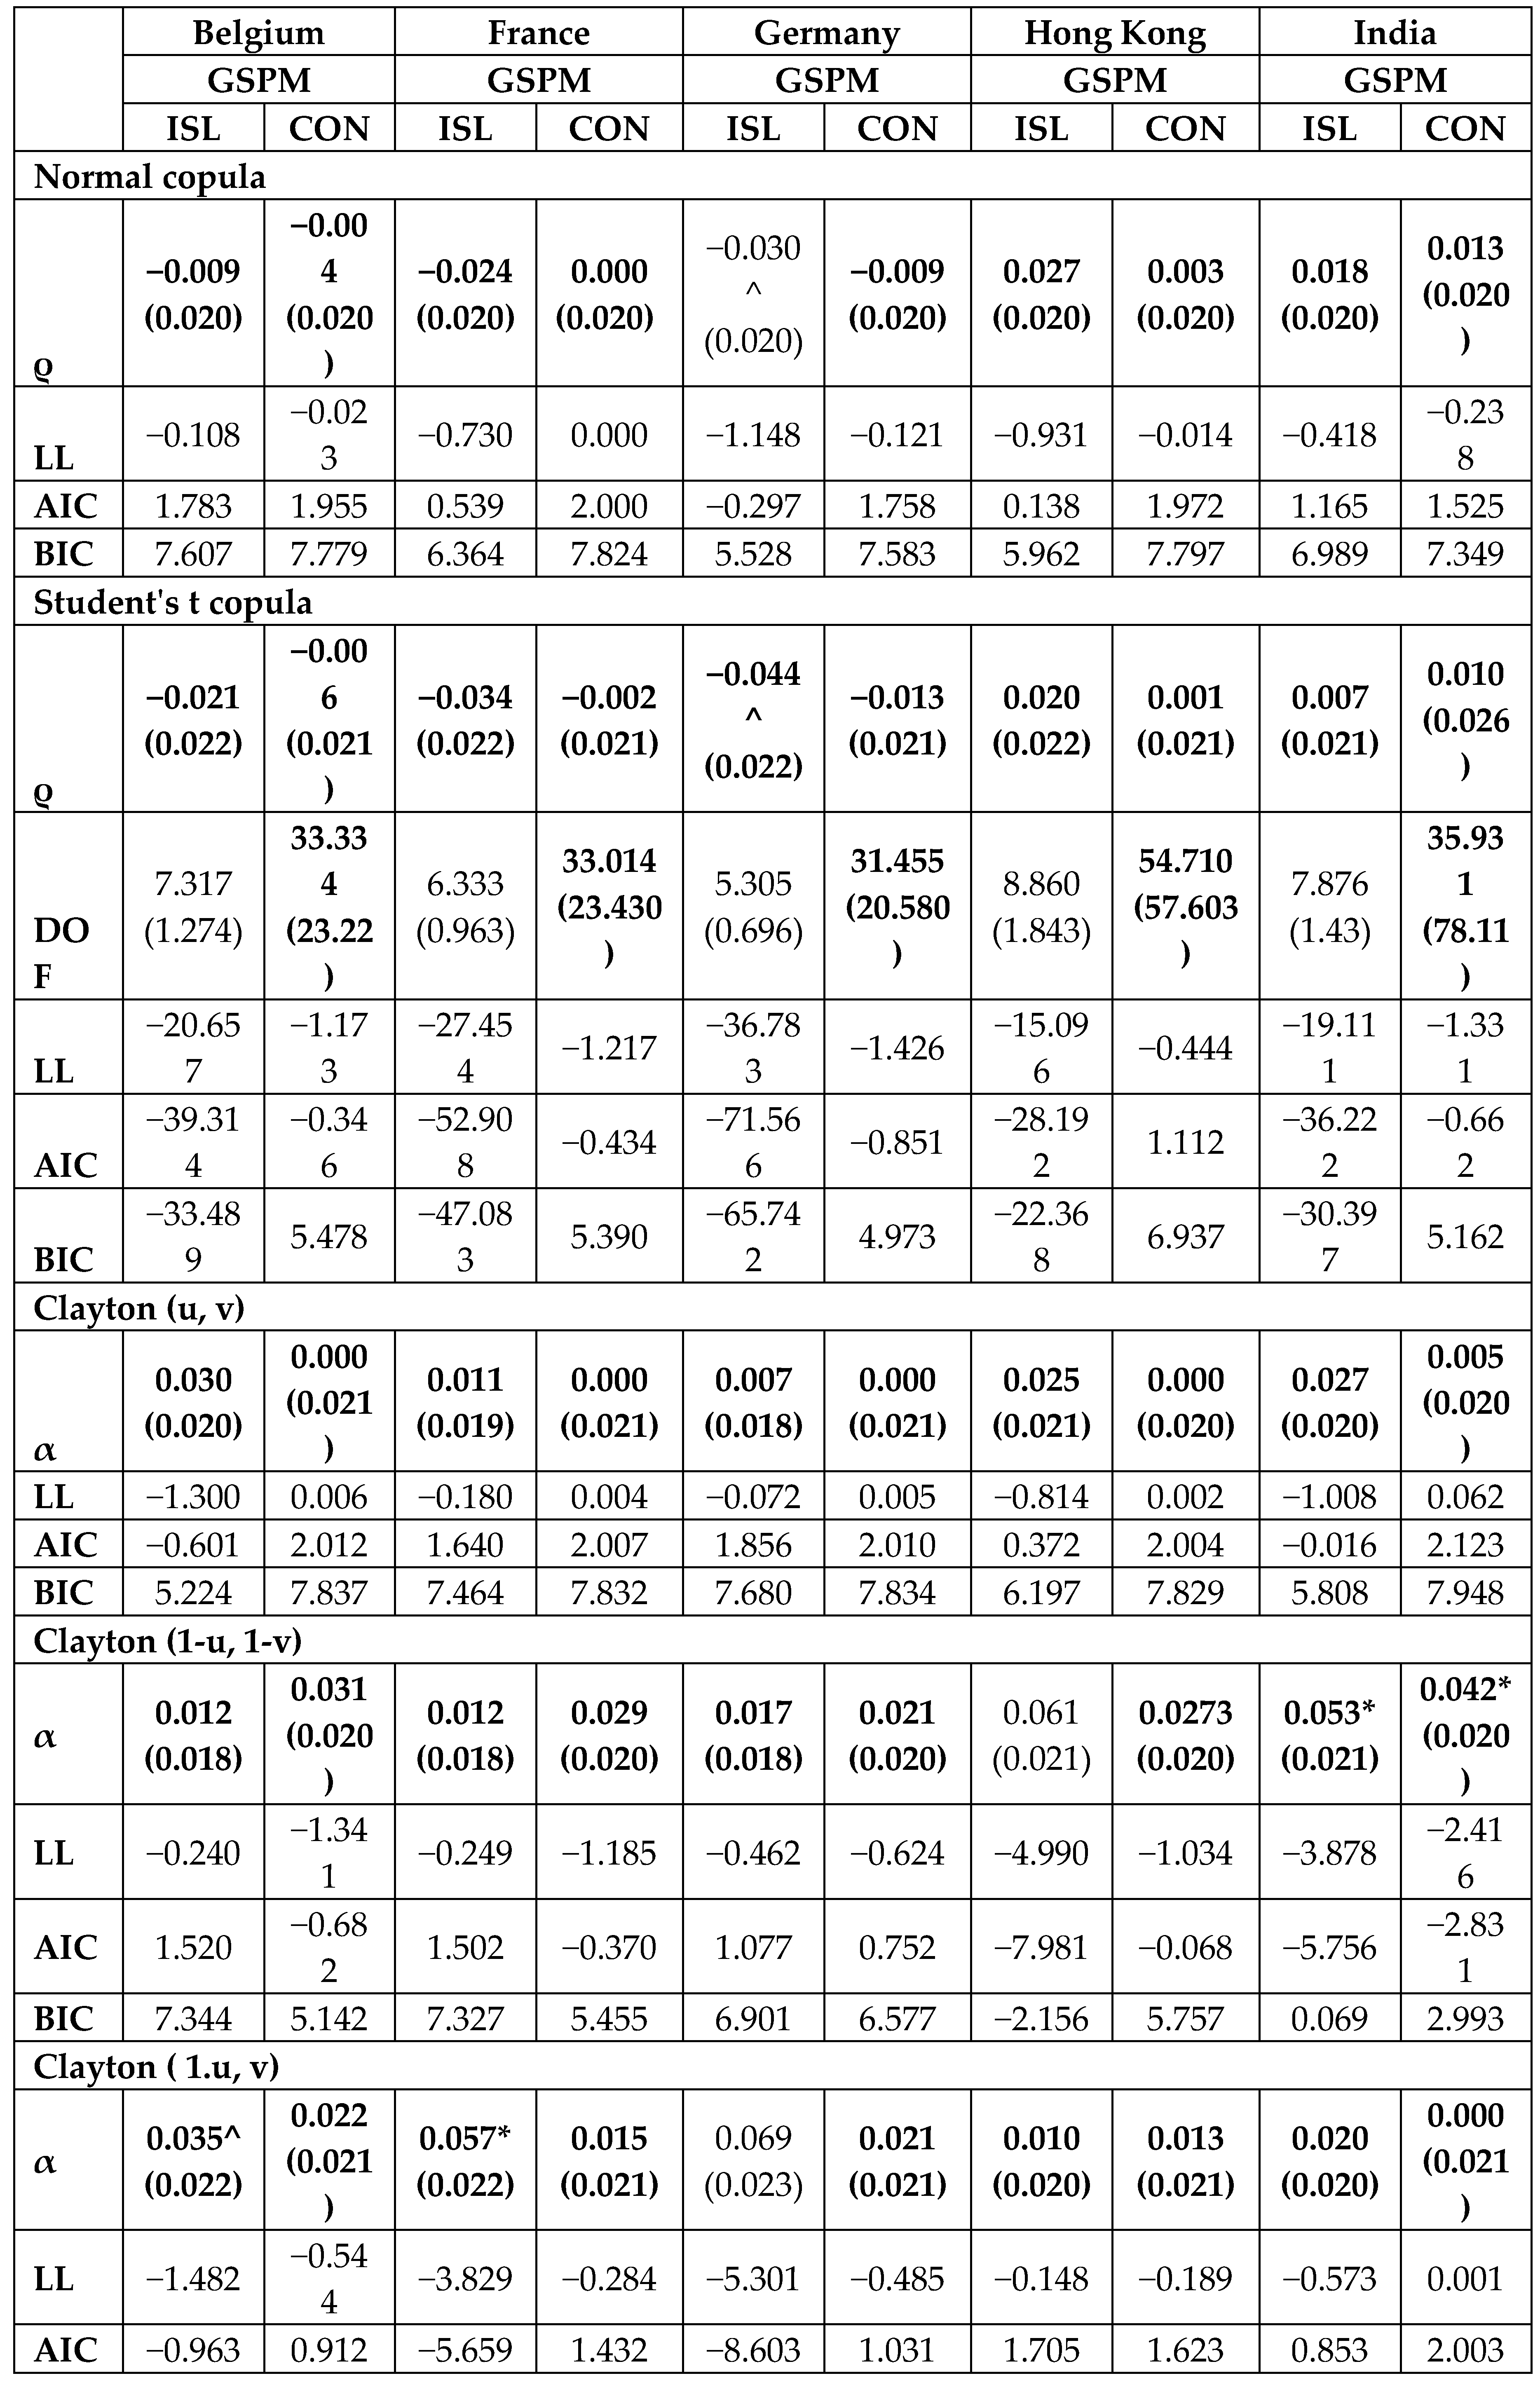 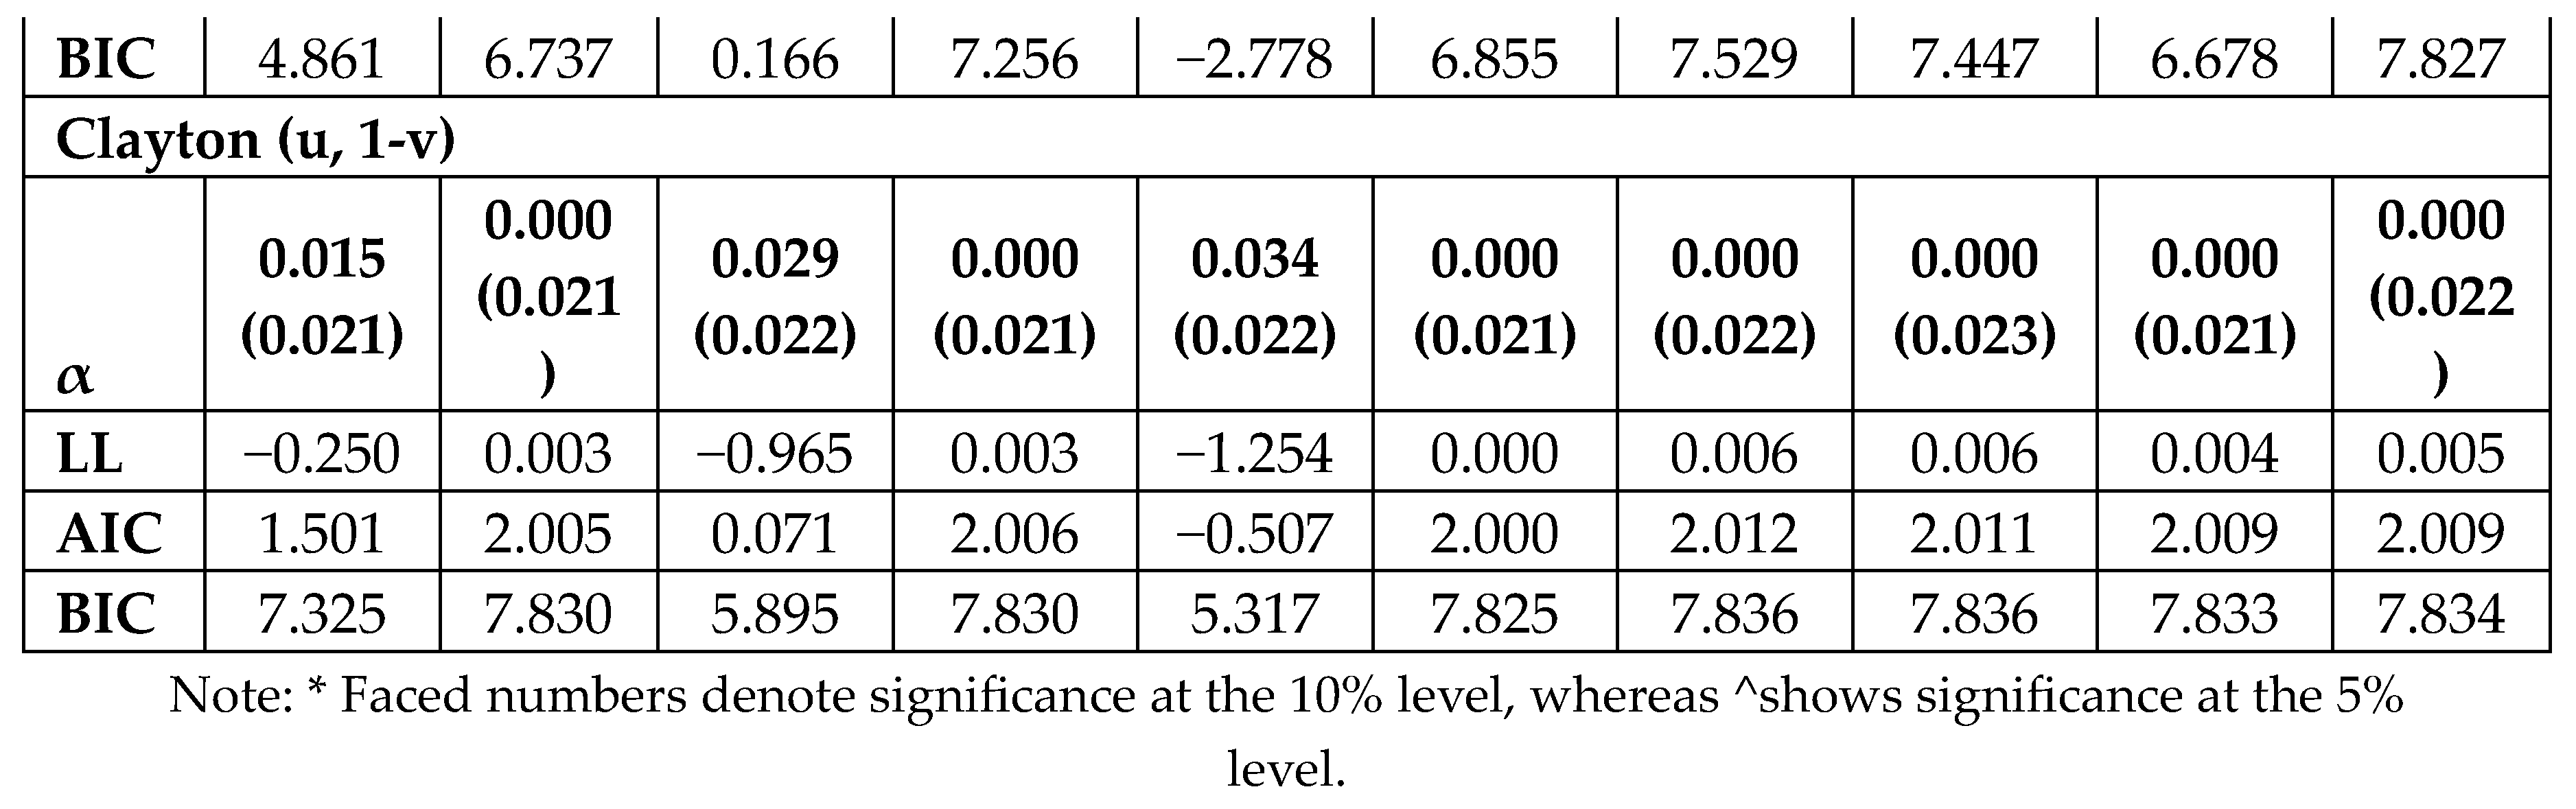
|
Table 3.
B): Estimation of Single-copula Model between Stock Indices and Precious Metals.
 |
Upon comparing the log-likelihood, AIC, and BIC values of various copulas for every pair, it is evident that no copula outperforms the others. Liu et al. (2017) state that while the t copula and normal copula may both express symmetric positive and negative dependence, the t copula has symmetric tail dependence and the normal copula has no tail dependence. Consequently, the mixed Clayton copulas are further employed for the dependent-switching copula model to capture the asymmetric tail dependence.
4.2.2. Switching Copula Estimation between GSPM and Islamic Stocks
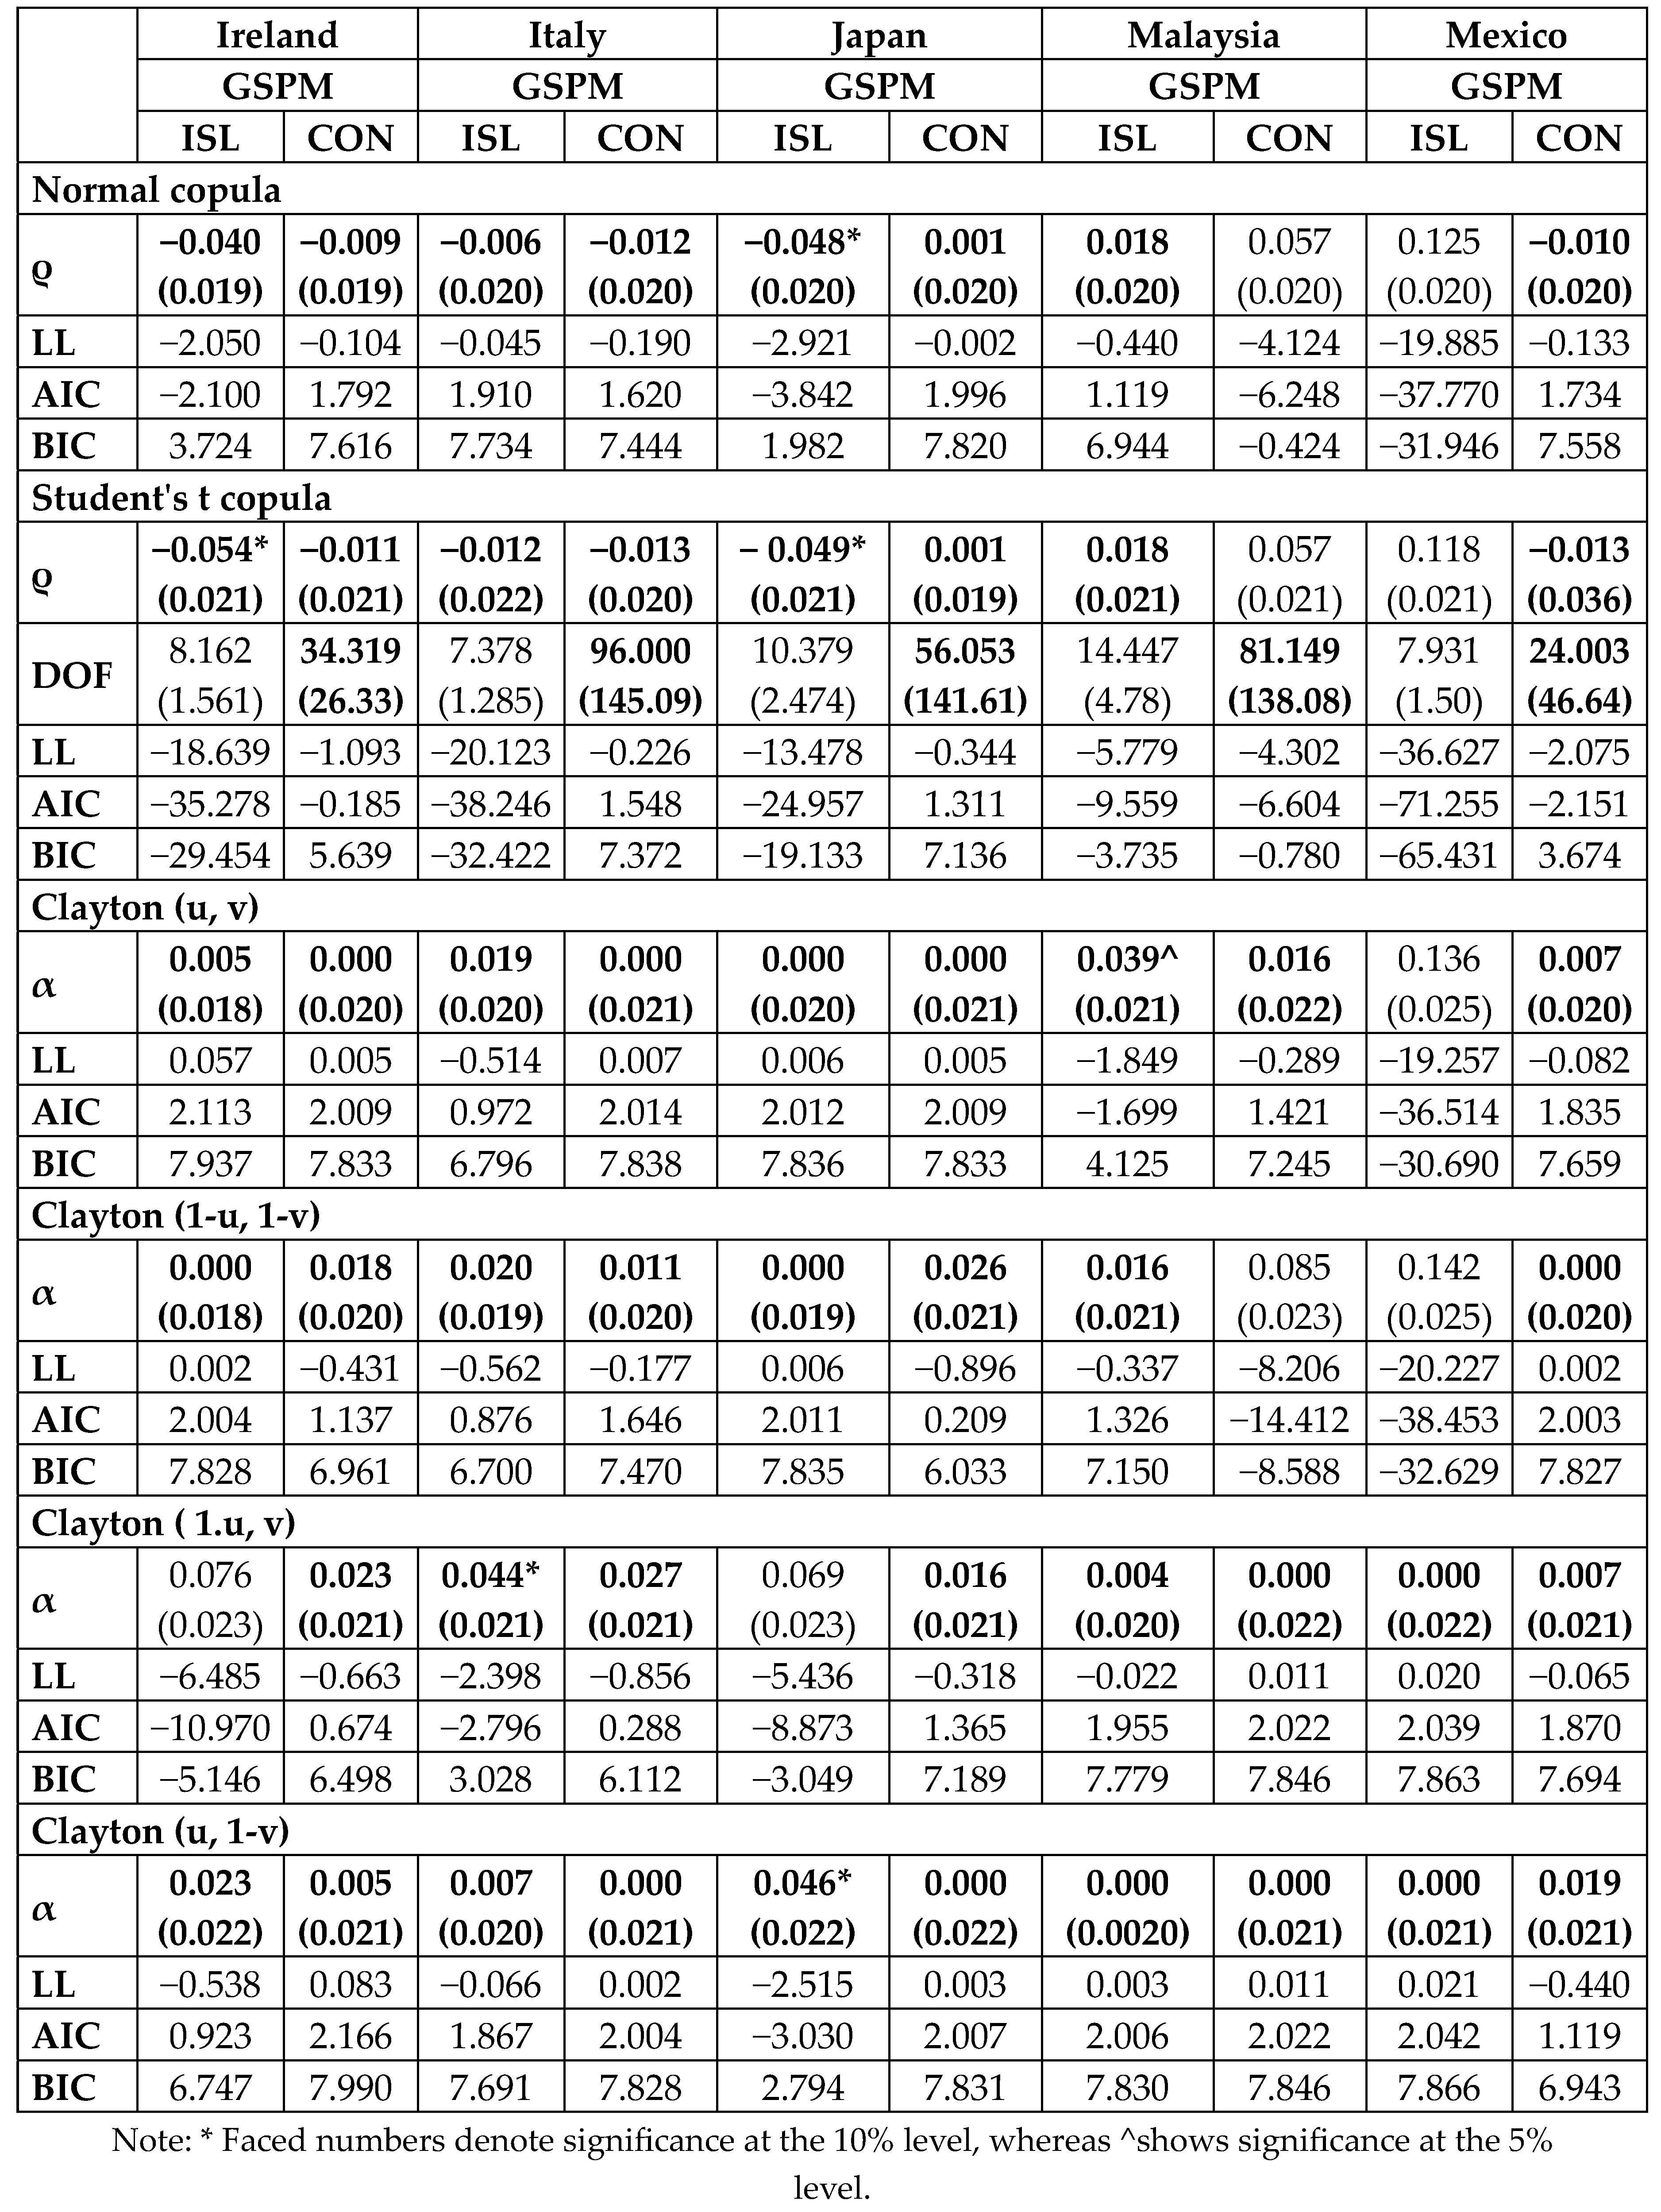
The estimated transition probabilities are shown by Pnn and Ppp, which are close to 1, indicating a high persistence of the same dependence regime in all estimated pairs. All the copula parameters are significant in the positive correlation regime when stock and GSPM are bearish, for Hong Kong, India, Japan and Malaysia.
This negative relationship indicates that portfolio risk can be minimized by the inclusion of precious metals in Islamic stock portfolios. It also provides a safe haven asset for equity markets in the United States (Hood and Malik 2013). Positive significant dependence is reported for Hong Kong, India, Japan, and Malaysia, and it ranges from 0.047 to 0.204, with a tail dependence value ranging from 0.000 to 0.122. No dependence is reported for Belgium, France, Germany, Ireland, Italy, and Mexico. Hillier et al. (2006) also found a low correlation value between stock indices and precious metals. Similarly, Ghazali et al. (2015) and Raza et al. (2019) concluded that precious metals do not serve as a safe haven or hedger during downturns in the equity market. Hence, the absence of significant positive dependence among the majority of countries makes GSPM suitable for risk reduction of the portfolio, as GSPM is in a bearish market and has a dependence on Islamic stocks in a bearish market. In this case, when both the stock index and GSPM are in bullish market states under a positive correlation regime, significant positive dependence is reported for Ireland, Italy, Japan and Malaysia. The value for dependence ranges from 0.029 to 0.218, and tail dependence ranges from 0.000 to 0.127. It shows that both stock indices and alternative assets are facing spikes in prices at the same time in these countries, and a rise in the price of precious metals stocks can add more value to the revenues of Islamic stock portfolios of these countries. On the other hand, no significant dependence is found for Belgium, France, Germany, Hong Kong, India and Mexico, resulting in Islamic stock investors in these countries not getting any benefit from the rise in revenues of precious metals.
Most importantly, this research also studies market dependence, where Islamic stock index is in a bearish market state (lower tail), and GSPM is in a bullish state (upper tail). Findings show a significant dependence between the lower tails of the Islamic stock market and the upper tail of GSPM for Hong Kong, Malaysia and Mexico. Positive dependence was found in Hong Kong, Malaysia, and Mexico. The value ranges from 0.066 to 0.306, and tail dependence ranges from 0.000 to 0.151. At the same time, this indicates that losses in the Islamic stock index can be offset by investment in GSPM. Additionally, these findings suggest that GSPM can be regarded as a safe haven asset for Islamic stock indices, a result consistent with Saiti et al. (2014). (Raza et al. 2019) also documented that precious metals could provide the Islamic stock portfolio with diversification advantages. Saiti et al. (2014) reported that, during crisis times, precious metals serve as a hedging asset. Chkili (2017) reported that precious metals can be used as weak hedgers and a strong safe haven for drastic fluctuations in the Islamic stock market. Maghyereh and Awartani (2016) found that precious metals play a role in hedging and diversifying Islamic equities. Abdullah et al. (2016) investigated the dynamic connectedness between precious metals and Islamic equities. Their results also indicated that a low level of correlation among them, proved gold as a good diversifier. Negative significant dependence can be interpreted as the losses in that country's stocks not being safeguarded by profits in precious metals.
In the case when the Islamic stock index is bullish and GSPM is bearish, significant dependence is reported for all countries other than France. There is negative dependence found for Hong Kong and India, with values ranging from −0.032 to −0.041. A negative dependence means that the bearish market state of the GSPM will have no impact on the Islamic stock portfolio. On the other hand, positive dependence is found between pairs of GSPM and Islamic stock in Belgium, Germany, Ireland, Italy, Japan, Malaysia and Mexico, with values ranging from 0.061 to 0.213. The value of tail dependence ranges from 0.000 to 0.311. This dependence is inferred as the lower tail of GSPM will impact the upper tail of the Islamic stock of these countries. Thus, for the investors of these countries, the GSPM is not a viable choice to include in their portfolio, as its losses will decrease the benefits of the portfolio.
4.2.3. Switching Copula between GSPM and Conventional Stocks
In the second part, while studying the relationship between the conventional stocks index and GSPM in bearish market states under a positive correlation regime, significant dependence is reported for all sample countries. A negative dependence is documented in Belgium, France, India, Ireland, Italy, Japan, and Malaysia. The value for dependence ranged from −0.018 to −0.074. The tail dependence value ranges from 0.000 to 0.632. Negative dependence is inferred when both markets are experience extreme losses; they are not following each other. According to Baur and Lucey (2010), precious metal is a safe haven for stocks. Smith (2002) also examined the role of precious metals in portfolio diversification. The author found the existence of a weak or negative correlation between precious metals and stock indices. Sherman (1982) documented that addition of precious metals to portfolios is profitable for investors. Recently, Beckmann et al. (2015) made a broad study of precious metals as a safe haven. They found that precious metals are a safe haven and also serve as a hedger. Jawad et al. (2019) found precious metals to be an undisputable hedge and safe haven for many stock indices. Since significant positive dependence is reported for Germany, Hong Kong, and Mexico, with a range from 0.012 to 0.089, and because positive dependence suggests they follow each other, the inclusion of precious metals in the portfolio will add more risk to it. Hence, for countries with positive dependence, GSPM is not an option for investment for the managers of conventional portfolios. Choudhry et al. (2015) also found interdependence between precious metals and the stock market; accordingly, precious metals cannot be used as a safe haven during a financial crisis period.
When both the stock index and GSPM are in bullish market trends under a positive correlation regime, results are significant for France, Ireland, Italy, Japan and Mexico. Positive dependence is found in France, Ireland, Italy, and Japan, while negative dependence is repoted in Mexico. The values of positive dependence ranged from 0.011 to 0.393. The tail dependence ranges from 0.000 to 0.435. Positive dependence among the pairs of these countries shows that both stock indices and alternative assets are earning profit at the same time. It will lead to the conclusion that when GSPMs are in a bullish market and included in conventional stock portfolios in a boom market, investors can get additional benefits because both markets will earn profits in positive episodes. Negative dependence is found among the pairs of GSPM and conventional stocks in a bullish market in Mexico, with a value of −0.003. This result indicates that traditional stock portfolio investors do not benefit from GSPM in a bullish market state.
In the second part of this research, market dependence, where conventional stock index is in bearish market state (lower tail) and GSPM is in a bullish state (upper tail), is studied. The findings show a significant dependence between the lower tail of conventional and the upper tail of GSPM for most of the sample countries except for India and Mexico. Positive dependence was found in Belgium, France, Germany, Hong Kong, Ireland, Italy, and Japan. The value of positive dependence ranges from 0.055 to 0.275, and tail dependence lies within the range of 0.000 to 0.289. This result indicates that, at the same time, losses in conventional stock index can be offset by investing in GSPM. Previous studies also documented that conventional stock indices are riskier and not resilient in episodes of negative downturn. Additionally, these findings suggest that GSPM can be regarded as safe haven for conventional stock indices. Beckmann et al. (2015) reported that precious metals are a safe haven and serve as a hedger. Diebold and Yilmaz (2012) and (Mensi et al. 2017) also studied the spillover of volatility between stock markets and precious metals. They reported that precious metals receive volatility spillover shocks from the selected stock markets during financial crises. Baur and Lucey (2010) documented precious metals as hedgers for stocks and also a safe haven for stress periods. Negative significance dependence is found for Malaysia, with a value of −0.090. This negative dependence demonstrates that the episodes of negative downturn in stock markets cannot be safeguarded with the investment in GSPM. They do not provide hedging benefits, as a boom in the GSPM market cannot be used to get some benefit in an Islamic stock portfolio.
When the conventional stock index is bullish, and GSPM is bearish, significant dependence is reported in all the countries evaluated except for Japan. There is negative dependence found for France, Hong Kong, India, Ireland, and Italy, with values ranging from −0.016 to −0.077. The values of tail dependence range from 0.000 to 0.818. A negative dependence means that the bearish market state of GSPM will have no impact on the conventional stock portfolio. On the other hand, positive dependence is found between pairs of GSPM and conventional stock in Belgium, Germany, Malaysia, and Mexico, with values from 0.000 to 0.120. Based on this dependence, it is inferred that the lower tail of GSPM will impact the upper tail of conventional stock of these countries. Thus, for the investors of these countries, GSPMs are not a viable choice to include in their portfolio, as their losses will decrease the benefits of the portfolio. A study made by Solnik and McDonald (1977) also reported that precious metals are profitable for portfolio diversification. Michis (2014) studied the contribution of precious metals in determining the risk of portfolio. He found that precious metals contribute the least to portfolio risk. Studies also showed the ability of gold to be a safe haven in a financial crisis
Table 4.
A): Estimation of Dependence-Switching Copula Model between Stocks and Precious Metals.
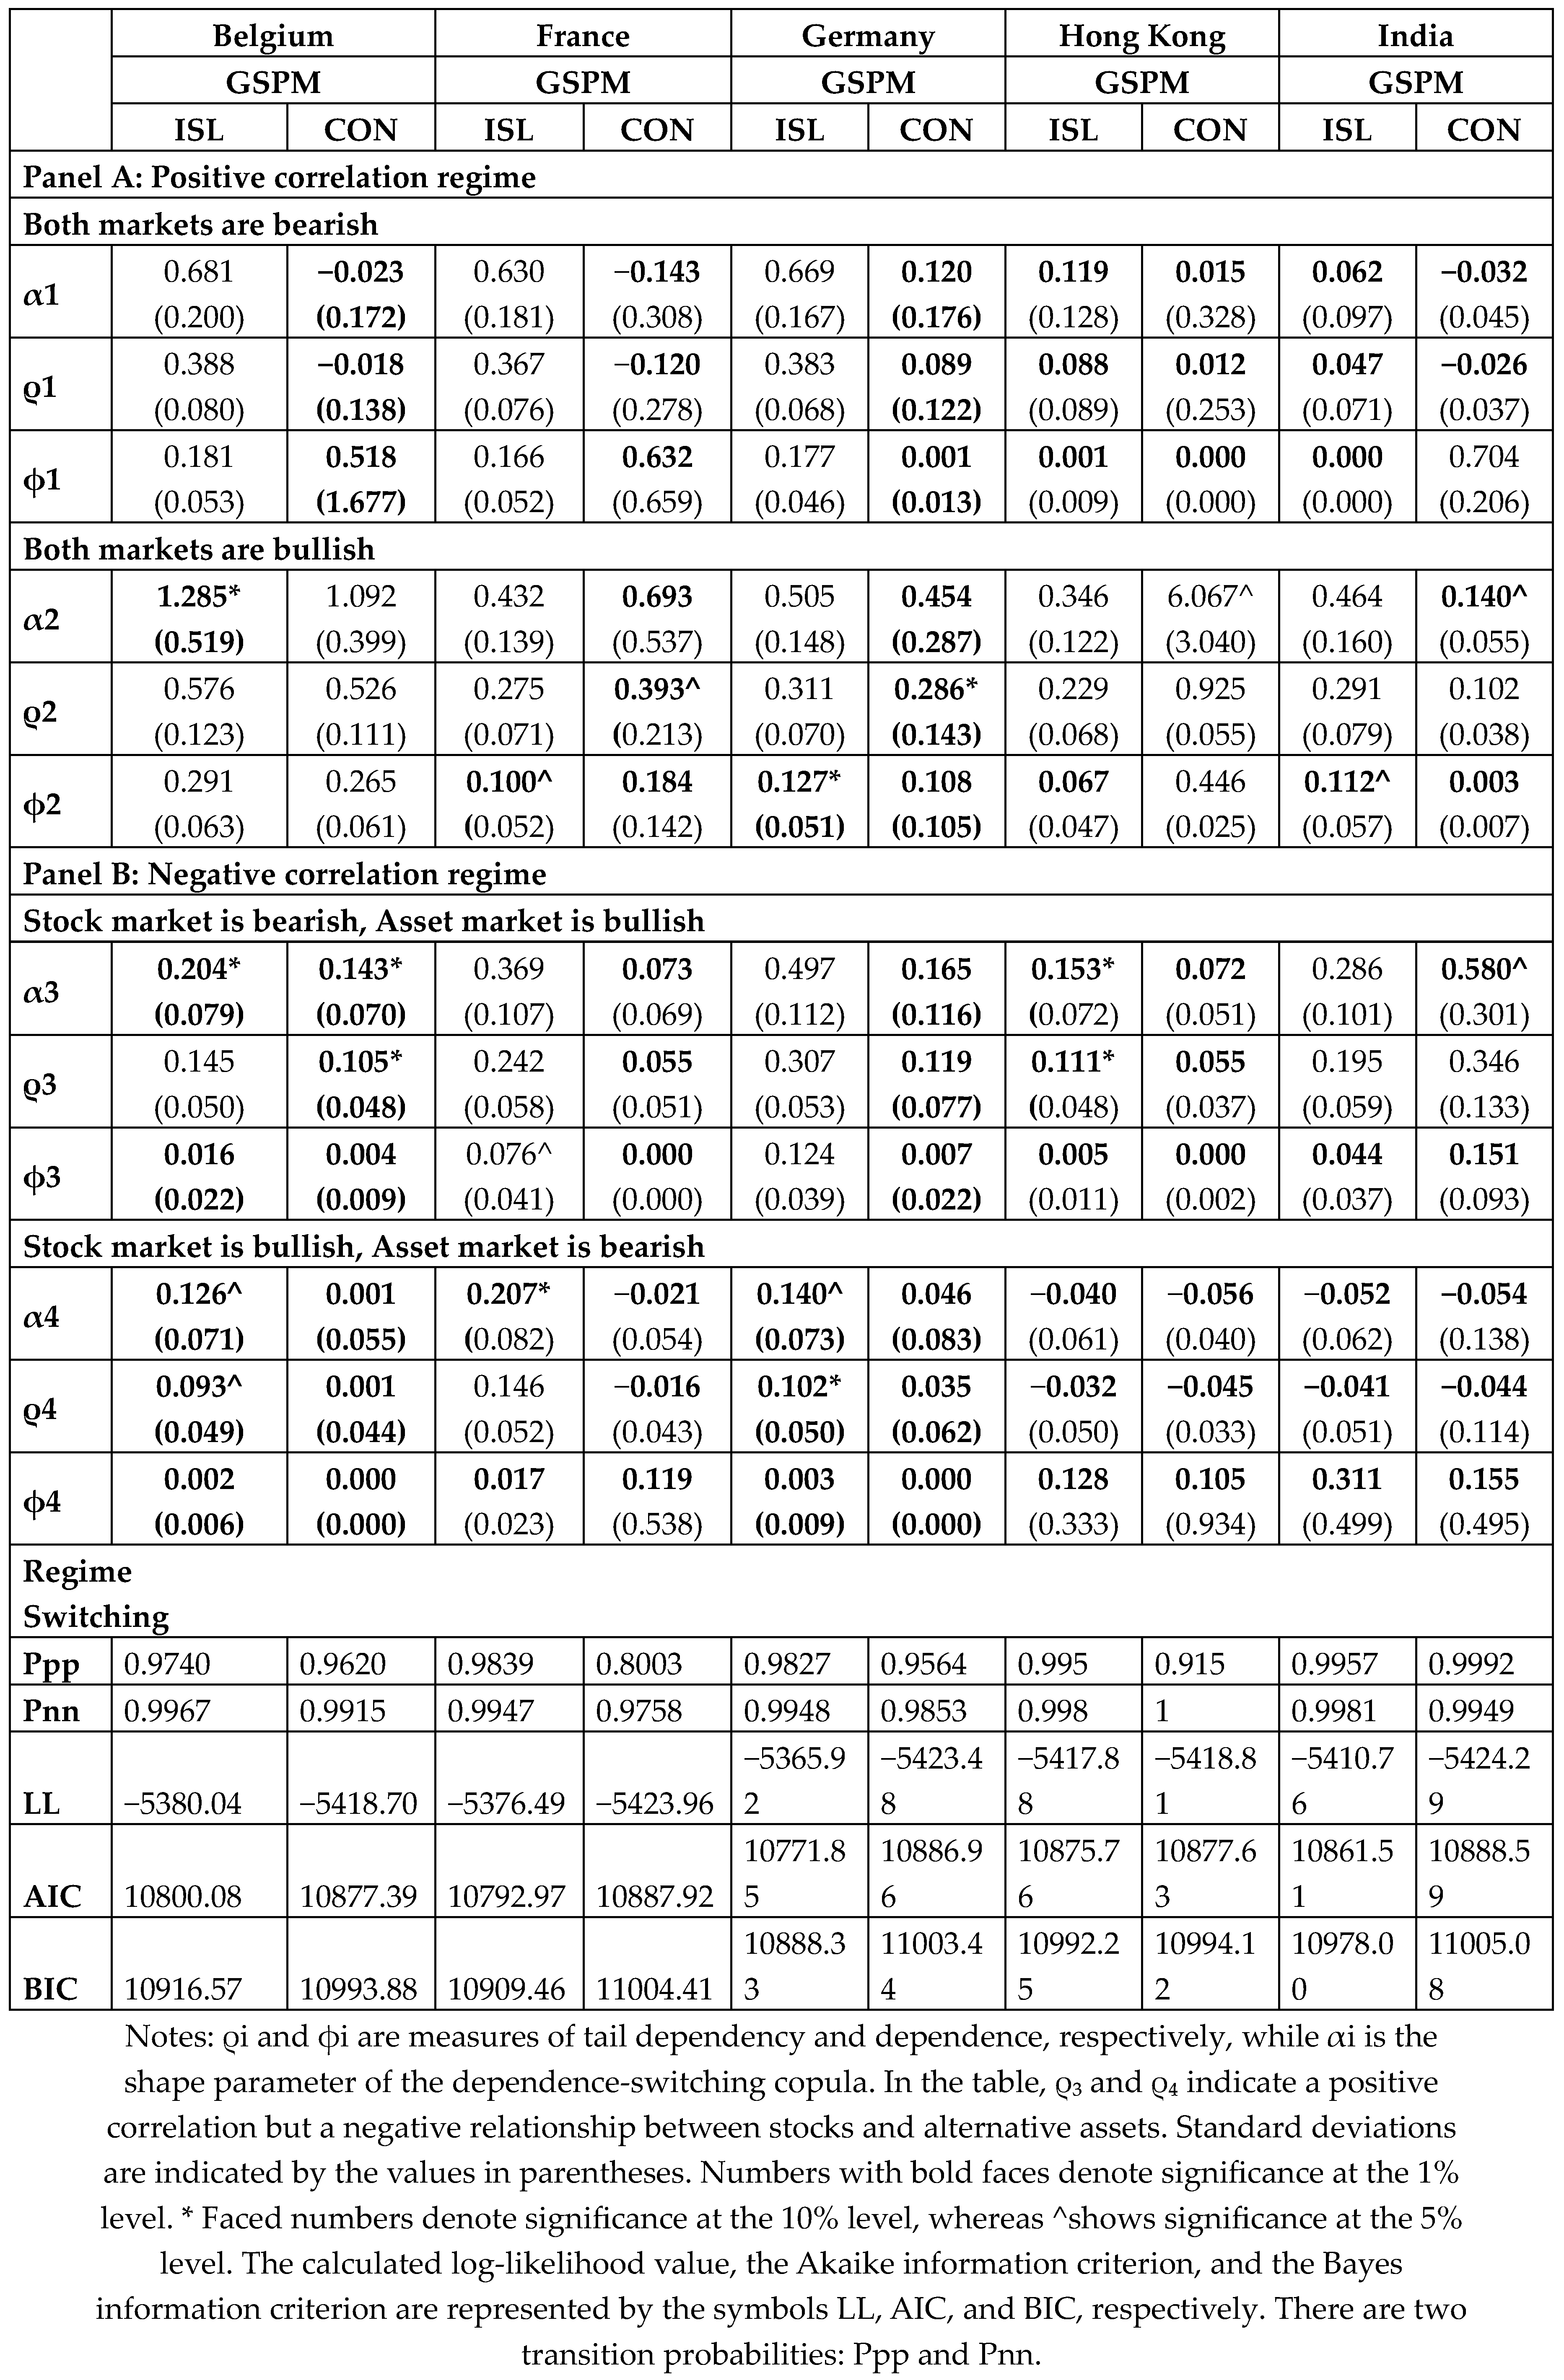 |
Table 4.
B): Estimation of Dependence-Switching Copula Model between Stocks and Precious Metals.
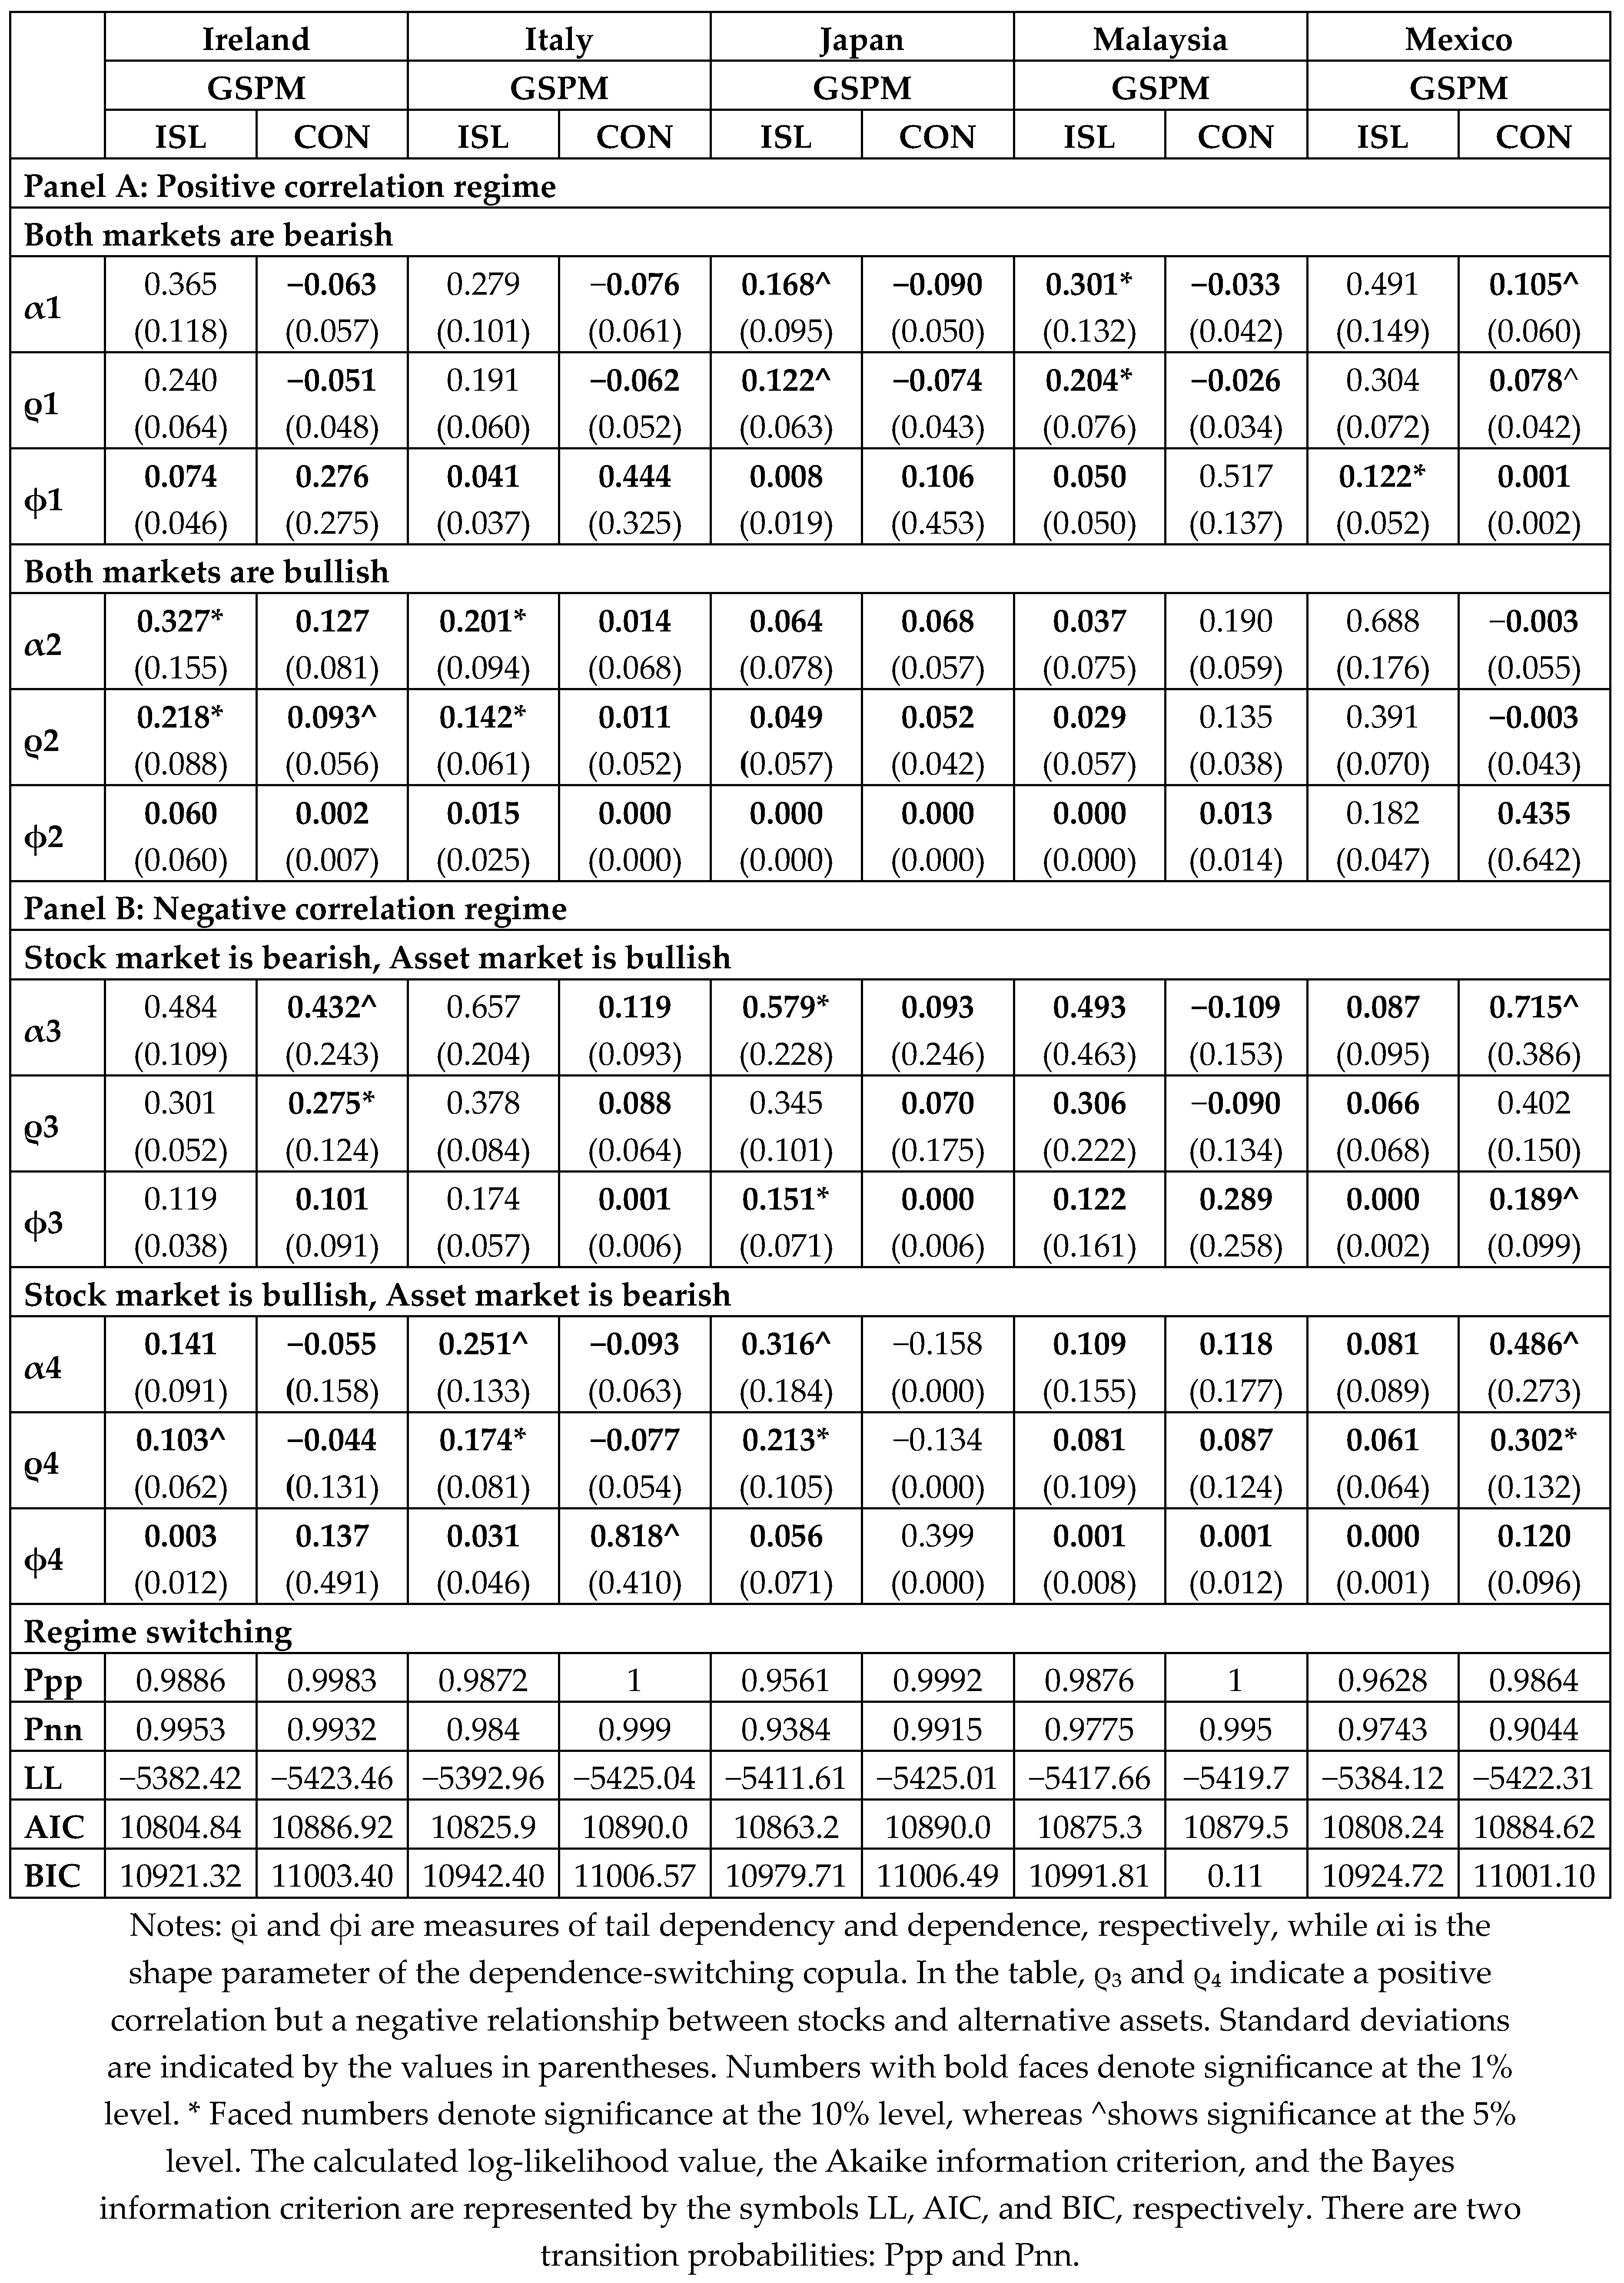 |
Results of the dependence switching copula models for each pair of stocks and precious metals are documented in Table 4, presented above. The precious metals are subsequently paired with the Islamic stock indices and their conventional counterparts. Overall, it shows that adding GSPM to an Islamic stock portfolio can safeguard the stock portfolios in extreme loss periods. This outcome is favorable for investors, as the assets can provide a cushion during financial crises. When they are moving independently in their respective trend, they will not intensify losses. On the other hand, positive dependence is interpreted as following each other, so their inclusion in the portfolio will add more risks to the portfolio. In bullish market trend, a positive dependence among the pairs of stocks and precious metals will lead to the conclusion that investors can get additional benefits. These findings are supported by several studies (Azmi et al. 2019, Dewandaru et al. 2017, Ho et al. 2014, Raza et al. 2019, Rizvi et al. 2015) . GSPM has a positive dependence on the Islamic stock portfolio, providing them an opportunity to earn additional returns in a boom market. For a negative market regime, when GSPM is moving upward, and the Islamic stock is moving downward, significant dependence is reported for Islamic stocks, making GSPM a good hedger for the Islamic stock portfolio in a downturn. It is a viable choice for investors to include precious metals as alternative assets in their portfolios as they provide safe haven and hedging benefits.
5. Conclusions and Recommendations
The study's methodology is driven by the observation that, although returns are detrimentally low during times of market stress, the conditional variance of the stock portfolio consisting of conventional and Islamic equities separately increases at those times. Due to this fact, investors' focus has shifted to alternative assets to hedge risk or obtain a safe haven advantage in case of an economic downturn. This study is predicated on the claims that no prior research has examined the asymmetric dynamics of financial asset returns, the efficacy of these alternative assets as a safe haven, their capacity to hedge, and their benefits for diversification. In this research, data consist of two stock indices and alternative assets. The selected stocks include Islamic stocks and conventional stocks from Belgium, France, Germany, Hong Kong, India, Ireland, Italy, Japan, Malaysia, and Mexico. The chosen alternative asset is GSPM. The sample period ranges from March 2011 to March 2021.
The majority of the means of the returns are positive during the sample period for selected stocks and alternative assets, and Islamic stocks have the largest mean and largest standard deviation. All the standard deviations of the returns are positive during the sample period. Islamic stock markets have a larger range for the maximum and minimum than conventional stock markets, and their behavior is more volatile than conventional stocks. The return distributions for the stock indices (Islamic and conventional) and alternative assets (GSPM) are positively skewed. The mass of the distribution is concentrated on the left side of the distribution, with the right tail being longer. After a normal distribution, all of the return series show excess kurtosis and are rejected to follow a normal distribution. For each volatility equation, the total of the ARCH and GARCH terms approaches one, suggesting strong volatility persistence. The skewed-t distribution's values degree of freedom, which varies from 2 to 8, shows that the error terms were non-normal and had a heavy tail. All series have a positive and substantial asymmetry coefficient at the 1% level, which further supports the heavy tail's rightward skew. Large positive returns are, therefore, more probable than large negative returns. To quantify the dependence between stocks and precious metals, six single-copula models, including normal, t, and four various forms of the Clayton copula(Wang et al. 2013). For every pair of stock indices and precious metals (alternative assets), the coefficient estimations are shown. The findings demonstrate the significance of the parameters calculated by the t, normal, 180-degree, and Clayton methods at the 1%, 5%, and 10% levels for each pair. Except for Mexico, all pairs are important for GSPM and Islamic stock. Upon comparing the log-likelihood, AIC, and BIC values of various copulas for every pair, it is evident that no copula outperforms the others.
Liu et al. (2017) state that while the t-copula and normal copula may both express symmetric positive and negative reliance, the t-copula has symmetric tail dependence and the normal copula has no tail dependence. Consequently, the mixed Clayton copulas are further employed for the dependent-switching copula model to capture the asymmetric tail dependence. For every pair of stocks and precious metals, the outcomes of reliance-switching copula models are estimated. The precious metals are paired first with Islamic stock indices. The predicted transition probabilities in all assessed pairs are close to 1, indicating strong persistence of the same dependence regime. For Hong Kong, India, Japan, and Malaysia, all the copula parameters are significant in the positive correlation regime when the Islamic stock and GSPM are in a bearish state. However, there have been reports of positive reliance on Malaysia, Japan, India, and Hong Kong. Therefore, most of the countries have positive dependence, which renders GSPM inappropriate for reducing portfolio risk. When the Islamic stock index and the GSPM are both experiencing bullish market conditions under a regime of positive correlation, Ireland, Italy, Japan, and Malaysia are found to have strong positive dependence, indicating a simultaneous price jump.
Above all, this study examines the relationship between the Islamic stock index and the market, with the former in a bullish state (upper tail) and the latter in a bearish market state (lower tail). Results indicate a strong correlation between the upper tail of GSPM for Hong Kong, Malaysia, and Mexico and the lower tails of Islamic. Positive dependence is found in Hong Kong, Malaysia and Mexico. This result indicates that, at the same time, losses in the Islamic stock index can be offset by investment in GSPM. These findings suggest that GSPM can be regarded as a safe haven asset for Islamic stock indices. When the Islamic stock index is bullish and the GSPM is bearish, significant dependence is reported for all countries. There is negative dependence found for Hong Kong and India, showing that the bearish market state GSPM will have no impact on the Islamic stock portfolio. On the other hand, positive dependence is found between pairs of GSPM and Islamic stock in Belgium, Germany, Ireland, Italy, Japan, Malaysia, and Mexico, showing that the lower tail of GSPM will impact the upper tail of Islamic stock of these countries, making GSPM are not a viable choice.
Secondly, when the conventional stocks index and GSPM are in bearish market states under a positive correlation regime, significant dependence is reported for all countries. A negative dependence is documented in Belgium, France, India, Ireland, Italy, Japan, and Malaysia. Significant positive dependence is reported in Germany, Hong Kong, and Mexico. When both the stock index and GSPM are in bullish market trends under a positive correlation regime, results for countries are significant except Belgium, Germany, Hong Kong, India and Malaysia. Positive dependence is found in France, Ireland, Italy, and Japan. It will lead to the conclusion that GSPM in a bullish market is beneficial for investors to be included in the conventional stock portfolio in a boom market. Negative dependence is found among the pairs of GSPM and conventional stocks in a bullish market in Mexico, showing no benefit.
Furthermore, findings show significant dependence between the lower tail of conventional stocks and the upper tail of GSPM for sample countries except India and Mexico. Positive dependence is found in Belgium, France, Germany, Hong Kong, Ireland, Italy, and Japan. This result indicates that, at the same time, losses in conventional stock index can be offset by investment in GSPM. Negative significance dependence is found for Malaysia. When the conventional stock index is bullish and GSPM is bearish, significant dependence is reported for all countries except for Japan. Negative dependence is found in France, Hong Kong, India, Ireland, and Italy, and positive dependence is found between pairs of GSPM and conventional stock in Belgium, Germany, Malaysia, and Mexico. This finding is inferred as the lower tail of GSPM will impact the upper tail of conventional stock of these countries, making GSPM unfavorable.
To represent the conditional dependency between traditional stock indices and Islamic stock indices and alternative assets (precious metals) in a more realistic way than the previous studies, a relatively new modeling technique, a time-varying copula with switching dependence, is used. A dependence-switching copula represents a reliance structure more accurately and realistically than a single copula regime because the dependence may alter between positive and negative correlation regimes with time. The fluctuating behavior of markets has a significant impact on economic variables, especially the downward trend during a crisis. There is growing interest in portfolio management to safeguard investors from risks and avoid market turmoil. Conditional dependence between stock indices and alternative assets such as GSPM is examined. Overall, the addition of alternative assets to the stock portfolio reduces risks and provides better diversification benefits. However, the results vary depending on the circumstances of the country.
Author Contributions
Conceptualization, H.A., F.A. and P.F.; methodology, H.A., F.A. and P.F.; formal analysis, H.A., F.A. and P.F.; resources, H.A., F.A. and P.F.; data curation, H.A., M.A., F.A. and P.F.; writing—original draft preparation, H.A., F.A. and P.F.; writing—review and editing, H.A., F.A. and P.F. All authors have read and agreed to the published version of the manuscript.
Funding
This research was funded by Fundação para a Ciência e a Tecnologia (grant UIDB/05064/2020).
Data Availability Statement
Data will be made available on request.
Conflicts of Interest
“The authors declare no conflicts of interest.”.
References
- Ajmi, Ahdi Noomen, Shawkat Hammoudeh, Duc Khuong Nguyen, and Soodabeh Sarafrazi. How strong are the causal relationships between Islamic stock markets and conventional financial systems? Evidence from linear and nonlinear tests. Journal of International Financial Markets, Institutions and Money 2014, 28, 213–27. [Google Scholar] [CrossRef]
- Azimli, A. Degree and structure of return dependence among commodities, energy stocks and international equity markets during the post-COVID-19 period. Resources Policy 2022, 77, 102679. [Google Scholar] [CrossRef] [PubMed]
- Azmi, Wajahat, Adam Ng, Ginanjar Dewandaru, and Ruslan Nagayev. Doing well while doing good: The case of Islamic and sustainability equity investing. Borsa Istanbul Review 2019, 19, 207–18. [Google Scholar] [CrossRef]
- Baker, H Kent, Satish Kumar, Kirti Goyal, and Anuj Sharma. International review of financial analysis: A retrospective evaluation between 1992 and 2020. International Review of Financial Analysis 2021, 78, 101946. [Google Scholar] [CrossRef]
- Baur, Dirk G, and Brian M Lucey. Is gold a hedge or a safe haven? An analysis of stocks, bonds and gold. Financial review 2010, 45, 217–29. [Google Scholar] [CrossRef]
- Beckmann, Joscha, Theo Berger, and Robert Czudaj. Does gold act as a hedge or a safe haven for stocks? A smooth transition approach. Economic Modelling 2015, 48, 16–24. [Google Scholar] [CrossRef]
- Bossman, Ahmed, and Samuel Kwaku Agyei. Interdependence structure of global commodity classes and African equity markets: A vector wavelet coherence analysis. Resources Policy 2022, 79, 103039. [Google Scholar] [CrossRef]
- Chkili, Walid. Is gold a hedge or safe haven for Islamic stock market movements? A Markov switching approach. Journal of Multinational Financial Management 2017, 42, 152–63. [Google Scholar]
- Ciner, Cetin, Constantin Gurdgiev, and Brian M Lucey. Hedges and safe havens: An examination of stocks, bonds, gold, oil and exchange rates. International Review of Financial Analysis 2013, 29, 202–11. [Google Scholar] [CrossRef]
- Dewandaru, Ginanjar, Rumi Masih, Obiyathulla Ismath Bacha, and A Mansur M Masih. The role of Islamic asset classes in the diversified portfolios: Mean variance spanning test. Emerging Markets Review 2017, 30, 66–95. [Google Scholar] [CrossRef]
- El Mehdi, Imen Khanchel, and Asma Mghaieth. Volatility spillover and hedging strategies between Islamic and conventional stocks in the presence of asymmetry and long memory. Research in International Business and Finance 2017, 39, 595–611. [Google Scholar] [CrossRef]
- Ghazali, Mohd Fahmi, Hooi Hooi Lean, and Zakaria Bahari. Sharia compliant gold investment in Malaysia: Hedge or safe haven? Pacific-Basin Finance Journal 2015, 34, 192–204. [Google Scholar] [CrossRef]
- Hammoudeh, Shawkat, Walid Mensi, Juan Carlos Reboredo, and Duc Khuong Nguyen. Dynamic dependence of the global Islamic equity index with global conventional equity market indices and risk factors. Pacific-Basin Finance Journal 2014, 30, 189–206. [Google Scholar] [CrossRef]
- Hillier, David, Paul Draper, and Robert Faff. Do precious metals shine? An investment perspective. Financial analysts journal 2006, 62, 98–106. [Google Scholar] [CrossRef]
- Ho, Catherine Soke Fun, Nurul Afiqah Abd Rahman, Noor Hafizha Muhamad Yusuf, and Zaminor Zamzamin. Performance of global Islamic versus conventional share indices: International evidence. Pacific-Basin Finance Journal 2014, 28, 110–21. [Google Scholar] [CrossRef]
- Hood, Matthew, and Farooq Malik. Is gold the best hedge and a safe haven under changing stock market volatility? Review of Financial Economics 2013, 22, 47–52. [Google Scholar] [CrossRef]
- Iqbal, Munawar, Philip Molyneux, Munawar Iqbal, and Philip Molyneux. Efficiency in Islamic banking. Thirty Years of Islamic Banking: History, Performance and Prospects: 2005, 88-104.
- Joe, Harry, and James Jianmeng Xu. 1996. The estimation method of inference functions for margins for multivariate models.
- Kenourgios, Dimitris, Nader Naifar, and Dimitrios Dimitriou. . Islamic financial markets and global crises: Contagion or decoupling? Economic Modelling 2016, 57, 36–46. [Google Scholar] [CrossRef]
- Khalfaoui, Rabeh, Eduard Baumöhl, Suleman Sarwar, and Tomáš Výrost. Connectedness between energy and nonenergy commodity markets: Evidence from quantile coherency networks. Resources Policy 2021, 74, 102318. [Google Scholar] [CrossRef]
- Lee, Chien-Chiang, Zihao Yuan, and Shan-Ju Ho. How does export diversification affect income inequality? International evidence. Structural Change and Economic Dynamics 2022, 63, 410–21. [Google Scholar] [CrossRef]
- Li, Buyu, Yu Liu, and Xiaogang Wang. Year. Gradient harmonized single-stage detector. Paper presented at the Proceedings of the AAAI conference on artificial intelligence.
- Liu, Bing-Yue, Qiang Ji, and Ying Fan. A new time-varying optimal copula model identifying the dependence across markets. Quantitative Finance 2017, 17, 437–53. [Google Scholar] [CrossRef]
- Lucey, Brian M, and Edel Tully. 2006. Seasonality, risk and return in daily COMEX gold and silver data 1982–2002. Applied Financial Economics 16: 319-33.
- Maghyereh, Aktham I, and Basel Awartani. Dynamic transmissions between Sukuk and bond markets. Research in International Business and Finance 2016, 38, 246–61. [Google Scholar] [CrossRef]
- Markowitz, Harry. The utility of wealth. Journal of political Economy 1952, 60, 151–58. [Google Scholar] [CrossRef]
- Mensi, Walid, Shawkat Hammoudeh, Idries Mohammad Wanas Al-Jarrah, Ahmet Sensoy, and Sang Hoon Kang. Dynamic risk spillovers between gold, oil prices and conventional, sustainability and Islamic equity aggregates and sectors with portfolio implications. Energy Economics 2017, 67, 454–75. [Google Scholar] [CrossRef]
- Michis, Antonis A. Investing in gold: Individual asset risk in the long run. Finance Research Letters 2014, 11, 369–74. [Google Scholar] [CrossRef]
- Nguyen, Cuong C, and M Ishaq Bhatti. Copula model dependency between oil prices and stock markets: Evidence from China and Vietnam. Journal of International Financial Markets, Institutions and Money 2012, 22, 758–73. [Google Scholar] [CrossRef]
- Raza, Naveed, Sajid Ali, Syed Jawad Hussain Shahzad, Mobeen Ur Rehman, and Aneel Salman. Can alternative hedging assets add value to Islamic-conventional portfolio mix: Evidence from MGARCH models. Resources Policy 2019, 61, 210–30. [Google Scholar] [CrossRef]
- Rizvi, Syed Aun R, Shaista Arshad, and Nafis Alam. Crises and contagion in Asia Pacific—Islamic v/s conventional markets. Pacific-Basin Finance Journal 2015, 34, 315–26. [Google Scholar] [CrossRef]
- Saâdaoui, Foued, Nader Naifar, and Mohamed S Aldohaiman. Predictability and co-movement relationships between conventional and Islamic stock market indexes: A multiscale exploration using wavelets. Physica A: Statistical Mechanics and its Applications 2017, 482, 552–68. [Google Scholar] [CrossRef]
- Saiti, Buerhan, Obiyathulla I Bacha, and Mansur Masih. The diversification benefits from Islamic investment during the financial turmoil: The case for the US-based equity investors. Borsa Istanbul Review 2014, 14, 196–211. [Google Scholar] [CrossRef]
- Selmi, Refk, Walid Mensi, Shawkat Hammoudeh, and Jamal Bouoiyour. Is Bitcoin a hedge, a safe haven or a diversifier for oil price movements? A comparison with gold. Energy Economics 2018, 74, 787–801. [Google Scholar] [CrossRef]
- Sensoy, Ahmet, Guler Aras, and Erk Hacihasanoglu. Predictability dynamics of Islamic and conventional equity markets. The North American Journal of Economics and Finance 2015, 31, 222–48. [Google Scholar] [CrossRef]
- Sherman, Eugene J. Gold: A conservative, prudent diversifier. The Journal of Portfolio Management 1982, 8, 21–27. [Google Scholar]
- Sklar, Abe. 1996. Random variables, distribution functions, and copulas: a personal look backward and forward. Lecture notes-monograph series: 1-14.
- Smith, Graham. London gold prices and stock price indices in Europe and Japan. World Gold Council 2002, 9, 1–30. [Google Scholar]
- ((Solnik and McDonald 1977) Solnik, Bruno H, and J McDonald. 1977. Valuation and Strategy for Gold Stocks. Journal of Portfolio Management.
- Tiwari, Aviral Kumar, Rabeh Khalfaoui, Sakiru Adebola Solarin, and Muhammad Shahbaz. Analyzing the time-frequency lead–lag relationship between oil and agricultural commodities. Energy Economics 2018, 76, 470–94. [Google Scholar] [CrossRef]
- Wang, Yu-Min, Chia-Fei Lin, and Yu-Hsien Li. The correlation and hedging effects between commodity and stock markets. Journal of Applied Finance and Banking 2013, 3, 269. [Google Scholar]
Table 1.
Descriptive Statistics.
| Sym | Mean | St.Dev | Kurtosis | Skewness | Min | Max | J-B | ADF | |
|---|---|---|---|---|---|---|---|---|---|
| Belgium | ISL | 0.001 | 0.012 | 138.00 | 31.91 | −0.128 | 0.071 | 198.00 | −100.69 |
| CON | 0.002 | 0.011 | 233.00 | 47.45 | −0.142 | 0.076 | 567.00 | −270.75 | |
| France | ISL | 0.002 | 0.012 | 239.00 | 48.40 | −0.117 | 0.095 | 597.00 | −345.10 |
| CON | 0.003 | 0.012 | 244.00 | 49.21 | −0.123 | 0.084 | 624.00 | −490.31 | |
| Germany | ISL | 0.003 | 0.012 | 246.00 | 49.43 | −0.116 | 0.091 | 632.00 | −579.30 |
| CON | 0.004 | 0.012 | 247.00 | 49.64 | −0.122 | 0.110 | 639.00 | −731.06 | |
| Hong Kong | ISL | 0.004 | 0.008 | 249.00 | 49.85 | −0.072 | 0.047 | 646.00 | −20.82 |
| CON | 0.005 | 0.011 | 248.00 | 49.83 | −0.058 | 0.056 | 645.00 | −19.93 | |
| India | ISL | 0.006 | 0.011 | 248.00 | 49.84 | −0.116 | 0.097 | 646.00 | −21.18 |
| CON | 0.007 | 0.010 | 249.00 | 49.89 | −0.128 | 0.077 | 647.00 | −21.23 | |
| Ireland | ISL | 0.007 | 0.017 | 249.00 | 49.89 | −0.132 | 0.119 | 647.00 | −970.18 |
| CON | 0.008 | 0.012 | 249.00 | 49.90 | −0.099 | 0.069 | 648.00 | −19.82 | |
| Italy | ISL | 0.008 | 0.016 | 249.00 | 49.85 | −0.169 | 0.145 | 646.00 | −51.61 |
| CON | 0.009 | 0.015 | 249.00 | 49.88 | −0.169 | 0.089 | 647.00 | −53.93 | |
| Japan | ISL | 0.009 | 0.012 | 249.00 | 49.92 | −0.073 | 0.080 | 648.00 | −18.94 |
| CON | 0.010 | 0.013 | 249.00 | 49.93 | −0.079 | 0.080 | 648.00 | −52.40 | |
| Malaysia | ISL | 0.010 | 0.007 | 249.00 | 49.96 | −0.052 | 0.058 | 650.00 | −22.38 |
| CON | 0.011 | 0.006 | 249.00 | 49.97 | −0.053 | 0.069 | 650.00 | −18.74 | |
| Mexico | ISL | 0.011 | 0.011 | 249.00 | 49.95 | −0.068 | 0.077 | 649.00 | −18.38 |
| CON | 0.012 | 0.010 | 249.00 | 49.96 | −0.064 | 0.049 | 650.00 | −18.56 | |
| GSPM | GSPM | 0.025 | 0.011 | 249.00 | 49.97 | −0.096 | 0.059 | 650.00 | −24.74 |
Note: J-B is the Jarque–Bera normality test. Significance level is 1%.
Disclaimer/Publisher’s Note: The statements, opinions and data contained in all publications are solely those of the individual author(s) and contributor(s) and not of MDPI and/or the editor(s). MDPI and/or the editor(s) disclaim responsibility for any injury to people or property resulting from any ideas, methods, instructions or products referred to in the content. |
© 2024 by the authors. Licensee MDPI, Basel, Switzerland. This article is an open access article distributed under the terms and conditions of the Creative Commons Attribution (CC BY) license (http://creativecommons.org/licenses/by/4.0/).
Copyright: This open access article is published under a Creative Commons CC BY 4.0 license, which permit the free download, distribution, and reuse, provided that the author and preprint are cited in any reuse.


