
Submitted:
27 March 2025
Posted:
28 March 2025
You are already at the latest version
Abstract
This paper examines the impact of various uncertainty channels on stock market returns in Saudi Arabia, with a focus on the Tadawul All Share Index (TASI). It examines factors such as Saudi-specific Geopolitical Risk, Global Oil Price Uncertainty, Climate Policy Uncertainty, and U.S. Monetary Policy Uncertainty. Using monthly data and the Local Projections (LP) methodology, the study examines how these uncertainties impact market returns across various time horizons, taking into account potential structural breaks and non-linear dynamics. Our findings indicate significant variations in the market's response to the uncertainty measures across two distinct periods. During the first period, geopolitical risks have a strong positive impact on market returns. Conversely, the second period reveals a reversal, with negative cumulative effects, suggesting a shift in risk-return dynamics. Oil price uncertainty consistently exhibits a negative impact in both periods, highlighting the changing nature of oil dependency in the Saudi market. Additionally, climate policy uncertainty is becoming more significant, reflecting increased market sensitivity to global environmental policy changes. Our analysis reveals significant asymmetries in the effects of various uncertainty shocks, with monetary policy uncertainty exhibiting non-linear effects that peak at intermediate horizons, while commodity-related uncertainties exhibit more persistent impacts. These findings, which remain robust across various tests, offer critical insights for portfolio management, policy formulation, and risk assessment in emerging markets undergoing substantial economic changes.
Keywords:
Geopolitical Risk
; Economic Uncertainty
; Stock Returns
; Local Projections
; Saudi Arabia
; Market Efficiency
; Risk Transmission
1. Introduction
The complex relationship between financial markets and various forms of uncertainty has become increasingly prominent in contemporary economic discourse, particularly in emerging markets where geopolitical dynamics and global economic shifts can trigger substantial market movements. The Saudi Arabian stock market, represented by the Tadawul All Share Index (TASI), serves as a compelling case study at the intersection of multiple uncertainty channels due to its unique position as both the largest market in the Middle East and a crucial link between global energy markets and emerging economy dynamics.
In an era marked by unprecedented global challenges — from transitions in climate policy to geopolitical realignments — understanding the transmission mechanisms of various uncertainty measures becomes crucial for investors, policymakers, and academics alike. The Saudi market’s unique characteristics, including its recent integration into global indices, considerable energy sector exposure, and ongoing economic diversification efforts under Vision 2030, create a rich environment for examining how different forms of uncertainty interact with market returns. This investigation is particularly timely as the global economic landscape undergoes significant transformations, with emerging markets increasingly influencing global financial flows and policy decisions.
Our study offers several notable contributions to the existing literature by incorporating a comprehensive suite of uncertainty measures that capture distinct yet interconnected aspects of risk. The Saudi-specific Geopolitical Risk Index (GPRHC) enables us to quantify the market’s response to regional political dynamics, particularly relevant given the Kingdom’s central role in Middle Eastern geopolitics and global energy markets. The addition of Global Oil Price Uncertainty (OPU) is especially pertinent given Saudi Arabia’s status as the world’s leading oil exporter and the significant influence of the oil sector on both market capitalization and economic activity.
Integrating Climate Policy Uncertainty (CPU) into our analysis provides a forward-looking perspective that acknowledges the growing importance of environmental policies in shaping market expectations, particularly in hydrocarbon-dependent economies facing pressures for transition. Similarly, incorporating U.S. Monetary Policy Uncertainty (MPU) highlights the significant influence of global financial conditions on emerging market dynamics, especially relevant given the Saudi Riyal’s peg to the dollar and the kingdom’s substantial dollar-denominated assets.
Our analytical framework further enriches the investigation by incorporating traditional safe-haven assets, such as gold, and measures of inflation. This provides a more nuanced understanding of how investors navigate different forms of uncertainty. Including crude oil prices as a control variable helps to separate pure price effects from the impacts of uncertainty, resulting in a more refined analysis of the transmission mechanisms involved.
This comprehensive approach enables us to tackle several crucial questions: How do different forms of uncertainty influence market returns across various time horizons? Are these effects symmetric and consistent over time, or do they show significant nonlinearities and temporal variations? How has the Saudi market’s response to different forms of uncertainty evolved as the kingdom pursues its economic transformation agenda? The answers to these questions carry substantial implications for portfolio management, risk assessment, and policy formulation in emerging markets in general and resource-rich economies in particular.
Our investigation utilizes a methodological framework based on Local Projections. This framework enables us to capture the dynamic and potentially nonlinear responses of market returns to various uncertainty shocks while considering the complex interactions between different risk measures. This approach offers a more nuanced understanding of how uncertainty effects evolve over time and how the prevailing economic environment may influence them.
The results of our analysis have significant implications for various stakeholders. For investors, understanding the dynamic response patterns to different types of uncertainty can guide portfolio allocation decisions and risk management strategies. For policymakers, our findings offer insights into the market’s resilience to different shocks and the effectiveness of current policy frameworks in addressing uncertainty’s impacts. For academics, our thorough examination of multiple uncertainty channels enriches the expanding literature on uncertainty effects in emerging markets and offers a framework for analyzing similar markets.
This study arrives at a pivotal moment as emerging markets face increasing exposure to global uncertainty shocks while also engaging in domestic economic transformations. By examining Saudi Arabia—a market undergoing significant structural changes while maintaining its vital position in global energy markets—our analysis provides valuable insights into how evolving market structures interact with various forms of uncertainty. This contributes to both the theoretical understanding of uncertainty transmission mechanisms and the practical implementation of risk management strategies in emerging markets.
The remainder of this paper is organized as follows. Section 2 presents a theoretical literature review that establishes the conceptual framework linking economic uncertainties and geopolitical risks to financial market behavior. Section 3 synthesizes the empirical literature, highlighting key findings and methodological approaches in related studies while identifying research gaps. Section 4 details our empirical methodology and model specification, with particular emphasis on the local projections approach used to capture dynamic effects. Section 5 provides a descriptive analysis of key variables, including trends in Saudi stock market returns and measures of economic and geopolitical uncertainties. Section 6 presents our empirical results, documenting the dynamic responses of market returns to various shocks. Section 7 offers a comprehensive discussion of our findings, contextualizing them within the broader literature and the unique economic landscape of Saudi Arabia. Section 8 summarizes the conclusions drawn from our analysis, while Section 9 outlines policy implications, recommendations, and directions for future research.
2. Theoretical Literature Review
The complex relationships among geopolitical risks, economic uncertainties, and financial markets have drawn considerable attention in the financial economics literature. This section synthesizes the theoretical foundations that elucidate the interactions among these factors and their impact on stock market returns, with a particular focus on emerging economies such as Saudi Arabia.
2.1. Theoretical Foundations
The theoretical framework connecting geopolitical risks and stock market performance is primarily rooted in several complementary paradigms:
1. Efficient Market Hypothesis (EMH): According to Fama’s (1970) seminal work, markets rapidly incorporate all available information into asset prices. Geopolitical events, as significant information signals, should, therefore, be promptly reflected in stock valuations. However, the semi-strong form of EMH acknowledges that information asymmetry and processing limitations may cause delayed market reactions to complex geopolitical developments (Lo, 2004; Malkiel, 2003).
2. Uncertainty and Risk Aversion Theory: Building on Knight’s (1921) distinction between risk and uncertainty, Bloom (2009) and Pastor and Veronesi (2012) developed frameworks explaining how policy uncertainty affects asset pricing. When faced with heightened geopolitical uncertainties, investors typically demand higher risk premiums, leading to lower equity valuations and increased market volatility (Baker et al., 2016; Pástor & Veronesi, 2013).
3. Behavioral Finance Perspective: Contrary to purely rational models, Kahneman and Tversky’s (1979) prospect theory suggests that investors exhibit asymmetric responses to gains and losses. During periods of geopolitical tension, loss aversion may intensify, causing disproportionate market reactions to negative geopolitical developments compared to positive ones (Barberis & Thaler, 2003; Shefrin & Statman, 2000).
4. International Capital Asset Pricing Model (ICAPM): Building on the domestic CAPM, Solnik’s (1974) ICAPM incorporates international factors that affect asset returns. Geopolitical risks represent systematic factors that cannot be diversified away within a single market, thus commanding risk premiums in international portfolios (Bekaert & Harvey, 2003; Carrieri et al., 2007).
5. Global access to equity markets: Recent studies have highlighted the interplay between geopolitical risk, market uncertainties, and the openness of stock markets (Yilmazkuday, 2024). The theoretical foundation rests on the premise that more open markets, characterized by cross-border capital flows and diversified investor bases, may experience amplified sensitivity to geopolitical events. This sensitivity arises because open markets are more connected to the global financial system; hence, adverse geopolitical shocks in one region can transmit volatility across borders, affecting investor sentiment and, ultimately, returns (Baker et al., 2016). Conversely, some theories suggest that the integration of diverse information sources in open economies may serve as a buffer, allowing for quicker assimilation of and adjustments to risks compared to more closed markets (Pastor & Veronesi, 2013). This dual effect creates a nuanced landscape where the benefits of global diversification might be offset by heightened volatility during periods of geopolitical instability.
6. Stock market segmentation: Research suggests that geopolitical events create asymmetric impacts across market sectors, with certain industries exhibiting heightened vulnerability while others demonstrate remarkable resilience (Caldara & Iacoviello, 2022; Yilmazkuday, 2023). This sectoral heterogeneity arises from varying exposure to international trade, reliance on global supply chains, and sensitivity to fluctuations in commodity prices. The defense and energy sectors, for instance, often experience countercyclical movements during periods of geopolitical tension, while the consumer discretionary and technology sectors may suffer from risk aversion and reduced global demand (Brounen & Derwall, 2010). The transmission mechanism operates through both direct channels — disruption of operations in conflict zones — and indirect channels — shifts in investor sentiment and risk premia across the broader market (Berkman, Jacobsen, & Lee, 2011). This sectoral lens offers a more nuanced understanding of market behavior during turbulent geopolitical periods, challenging the conventional wisdom that uniform market responses are the norm in the face of uncertainty. Moreover, the evolving nature of global value chains and the increasing prominence of intangible assets in corporate valuations have transformed traditional sectoral vulnerabilities, necessitating dynamic theoretical frameworks that account for these structural shifts in assessing the relationship between geopolitical risk and market performance (Carney, 2016).
2.2. Transmission Mechanisms
The theoretical literature identifies several channels through which geopolitical risks and economic uncertainties affect stock markets:
1. Discount Rate Channel: Geopolitical instability often prompts monetary policy responses, which in turn affect interest rates and, consequently, the discount rates used in equity valuation models (Bernanke & Kuttner, 2005; Rigobon & Sack, 2004).
2. Cash Flow Channel: Political instability can disrupt business operations, supply chains, and consumer confidence, ultimately reducing expected future cash flows and dividends (Julio & Yook, 2012; Gulen & Ion, 2016).
3. Risk Premium Channel: Heightened geopolitical tensions increase the equity risk premium investors demand for holding stocks, depressing current valuations (Damodaran, 2018; Graham & Harvey, 2018).
4. Liquidity Channel: During periods of elevated geopolitical risk, market liquidity often deteriorates as investors seek safe-haven assets, amplifying price movements (Amihud & Mendelson, 1986; Brunnermeier & Pedersen, 2009; Chordia et al., 2005).
5. Sentiment Channel: Beyond rational risk assessment, geopolitical events can trigger shifts in investor sentiment, leading to herding behavior and potential market overreactions (Baker & Wurgler, 2006; De Long et al., 1990).
2.3. Theoretical Considerations Specific to Oil-Exporting Economies
For oil-dependent economies like Saudi Arabia, additional theoretical considerations apply:
1. Resource Curse Theory: The “resource curse” literature (Sachs & Warner, 1995; Auty, 2001) suggests that resource-rich countries may experience greater economic volatility due to fluctuations in commodity prices, which can amplify the effects of geopolitical shocks on financial markets.
2. Dutch Disease Models: These models explain how resource-dependent economies may develop structural vulnerabilities that make their financial markets particularly sensitive to external shocks, including geopolitical developments (Corden & Neary, 1982; Frankel, 2010).
3. Rentier State Theory: This framework explains how oil-exporting states with particular political economies may respond differently to geopolitical pressures, creating unique risk profiles for their financial markets (Beblawi & Luciani, 1987; Mahdavy, 1970; Ross, 2001).
The theoretical literature thus provides a multifaceted framework for understanding how geopolitical risks and economic uncertainties might affect stock market returns in Saudi Arabia. It suggests complex and potentially nonlinear relationships that are mediated by the country’s specific economic structure and its position in global geopolitics.
3. Empirical Literature Review
The empirical literature examining the relationships between geopolitical risks, economic uncertainties, and stock market returns has expanded considerably in recent years, employing increasingly sophisticated methodologies. This section, along with Table 1, reviews key empirical findings, focusing specifically on studies relevant to Saudi Arabia and other similar emerging markets.
3.1. Global Evidence on Geopolitical Risk and Stock Markets
Caldara and Iacoviello’s (2018) innovative work in developing the Geopolitical Risk (GPR) index has facilitated a quantitative analysis of the geopolitical impacts on financial markets. By utilizing this index, they documented significant negative effects of geopolitical shocks on stock returns across 23 countries, with emerging markets displaying greater sensitivity than developed markets.
Building on this foundation, Balcilar et al. (2018) employed a nonparametric causality-in-quantiles approach to demonstrate that geopolitical risks affect stock market returns and volatility differently across various market conditions. Their findings revealed stronger effects during extreme market states, suggesting nonlinear relationships that simple correlation analyses may overlook.
In a comprehensive study of 18 emerging markets, Apergis et al. (2018) found that geopolitical risk serves as a significant pricing factor, commanding a premium of approximately 2-4% annually, with considerable cross-country variation. Similarly, Antonakakis et al. (2017b) documented time-varying spillover effects between geopolitical risk and stock market returns using dynamic conditional correlation models.
3.2. Economic Policy Uncertainty and Market Performance
The economic policy uncertainty (EPU) literature offers complementary insights. Baker et al. (2016) demonstrated that heightened policy uncertainty correlates with increased stock market volatility and decreased investment across multiple countries. Building on this research, Liu and Zhang (2015) found that EPU significantly enhances forecasts of stock market volatility, surpassing traditional predictors.
Focusing on emerging markets, Christou et al. (2017) documented asymmetric effects of U.S. economic policy uncertainty on stock returns across 15 emerging economies, revealing that negative shocks have a more pronounced impact than positive developments. This asymmetry aligns with behavioral finance theories that predict stronger market reactions to negative news (Barberis, 2013; Veronesi, 1999).
3.3. Middle East and Saudi Arabian Context
Research focusing specifically on Middle Eastern markets has identified distinctive patterns. Chau et al. (2014) found that MENA (Middle East and North Africa) stock markets demonstrate unique responses to political events compared to other emerging markets, exhibiting greater persistence of shocks and stronger contagion effects.
In Saudi Arabia, Alqahtani et al. (2019) documented significant negative impacts of regional geopolitical events on Tadawul (Saudi Stock Exchange) returns, with particularly strong effects observed in the energy and financial sectors. Their event study approach revealed average cumulative abnormal returns of -3.8% following major regional conflicts.
More recently, Alsagr and van Hemmen (2021) employed a GARCH-MIDAS framework to demonstrate that geopolitical risks significantly increase stock market volatility in Saudi Arabia, with effects lasting approximately 3 to 4 months after major events. Their findings suggest that the Saudi market has become more efficient in incorporating geopolitical information over time, although significant inefficiencies remain.
3.4. Oil Price Dynamics as a Mediating Factor
Given Saudi Arabia’s economic structure, the correlation between geopolitical risks and stock returns is frequently mediated by oil price dynamics. Kang et al. (2017) demonstrated that geopolitical risks in the Middle East impact global oil supply uncertainty, which in turn influences stock markets in oil-exporting nations.
In a study focused on Saudi Arabia, Alqahtani et al. (2020) found that oil price volatility exacerbates the adverse effects of geopolitical risks on stock returns, with a 10% increase in oil volatility associated with an approximate 1.2% additional decline in market returns following geopolitical shocks. This oil-market connection represents a distinctive characteristic of Saudi Arabian market dynamics when compared to non-resource-dependent economies (Mohanty et al., 2011; Arouri & Rault, 2012).
3.5. Methodological Advances and Recent Findings
Recent methodological innovations have improved our understanding of these relationships. A wavelet analysis conducted by Bouoiyour et al. (2018) revealed that geopolitical risks impact Saudi stock returns across various time horizons, with stronger effects observed in the medium term (3-6 months) compared to both the very short and long horizons. Machine learning techniques have also provided valuable insights. By applying random forests and neural networks to Saudi market data, Alshammari (2020) found that including geopolitical risk indicators enhances return prediction accuracy by about 18% compared to models that rely solely on traditional factors, underscoring the significance of these variables for market forecasting.
Most recently, Shahzad et al. (2022) utilized a time-varying parameter vector autoregression (TVP-VAR) approach to illustrate that the influence of geopolitical risks on Saudi stock returns has intensified since 2016, coinciding with the kingdom’s economic diversification efforts and increased integration with global financial markets (Mensi et al., 2020; Alotaibi & Mishra, 2017).
3.6. Research Gaps
Despite these advances, significant gaps remain in empirical literature. First, most studies use linear models that may not fully capture the complex, potentially nonlinear relationships between geopolitical risks, economic uncertainties, and stock returns (Balcilar et al., 2018; Aloui et al., 2016). Second, the interaction between domestic and international geopolitical factors remains underexplored, particularly in the context of Saudi Arabia, which faces both regional and global geopolitical pressures (Al-Khazali et al., 2021).
The empirical literature, therefore, provides substantial evidence that geopolitical risks and economic uncertainties have a significant impact on stock market returns in Saudi Arabia. It also emphasizes the need for more nuanced approaches that take into account the country’s unique economic structure and geopolitical position.
4. Empirical Methodology and Model Specification
To investigate the dynamic effects of geopolitical risks and uncertainties on stock market returns, as discussed in Caldara and Iacoviello (2022) and Yilmazkuday (2024), we employ the Local Projections (LP) method developed by Jordà (2005) to quantify both the impulse responses and the cumulative impulse responses of stock prices to a unit shock in geopolitical risk and uncertainties and where all the variables are normalized to one standard deviation. This methodology presents several advantages for our analysis. First, it offers a flexible framework that does not impose the dynamic restrictions typically found in Vector Autoregressions (VARs). Second, it is more resilient to model misspecification and accommodates state-dependent nonlinearities in the response functions. Third, it permits the direct estimation of impulse responses at each horizon without necessitating the recursive estimation of the system’s dynamics.
Our baseline specification for each horizon h follows the form:
where represents the standardized TASI returns at horizon h, denotes our standardized risk/uncertainty measures, is the horizon-specific intercept, captures the cumulative response coefficient at horizon h, and are the coefficients on the control variables, and is the horizon-specific error term. All variables are normalized to one standard deviation.
To enhance the precision of our estimates and mitigate potential end-point issues, we implement a smoothed version of the Local Projections (SLP) using a Gaussian kernel:
where is the Gaussian kernel function, is the bandwidth parameter (set to 2.0 in our implementation), are the original LP estimates. The standard errors are computed using a kernel-weighted sum of the original variance estimates:
Our empirical analysis covers horizons h = 0, 1, ..., 12, allowing us to trace the cumulative effects over a one-year period. We assess the statistical significance of the responses using standard t-statistics, with significance levels marked at 1%, 5%, and 10%. To account for potential structural breaks in the relationships, we divide our sample into two sub-periods and estimate the model separately for each period.
The choice of the Local Projections (LP) methodology is particularly suitable for our investigation for several reasons. Unlike VARs, which can amplify specification errors over longer horizons, LPs are more robust because they estimate each horizon independently. This is crucial for analyzing the complex relationships between geopolitical risks and market returns. Furthermore, the method naturally accommodates potential non-linearities in the response functions, which is essential due to the asymmetric nature of market reactions to geopolitical events and uncertainty shocks. Moreover, the flexibility of LPs enables us to capture potential changes in the transmission mechanisms of various types of risks across our sub-periods, offering insights into the evolving nature of market responses. Additionally, the method provides direct estimates of cumulative responses at each horizon, making it ideal for analyzing the persistent effects of risk shocks on market returns. Finally, the smoothed variant (SLP) enhances the efficiency of our estimates while retaining the flexibility of the original LP framework, leading to more precise estimates of the cumulative responses.
5. Data and Descriptive Analysis
Our research dataset comprises 308 monthly observations from November 1998 to June 2024, focusing on eight primary variables: the Tadawul All Share Index return (TASI), the Saudi-specific Geopolitical Risk Index (GPRHC), the Global Oil Price Uncertainty Index (OPU), the Climate Policy Uncertainty Index (CPU), the U.S. Monetary Policy Uncertainty Index (MPU), fluctuations in gold prices (Gold), inflation rates (Inflation), and changes in crude oil prices (Crude Oil). All variables are sourced from Tadawul, the Geopolitical Risk Index website by Caldara and Iacoviello (2022), FRED Economic Data, the OECD database, the Economic Policy Uncertainty website, and the World Gold Council, ensuring data quality and consistency.
Our primary dependent variable is the Tadawul All Share Index (TASI) returns, representing the broad market performance of the Saudi stock exchange.
The first set of variables includes uncertainty measures impacting Saudi market dynamics. The Historical Geopolitical Risk Index for Saudi Arabia (GPRHC) captures domestic and regional political tensions influencing market sentiment. Global Oil Price Uncertainty (OPU) reflects the kingdom’s exposure to energy markets, while Climate Policy Uncertainty (CPU) addresses risks from global energy transition policies. Lastly, the U.S. Monetary Policy Uncertainty (MPU) accounts for monetary policy spillovers due to the Saudi riyal’s peg to the U.S. dollar.
The second set features macroeconomic and financial variables like gold prices, inflation rates, and crude oil prices, which historically explain stock market movements in resource-rich economies and serve as essential controls.
5.1. Temporal Analysis
The time-based analysis of these variables, as shown in Figure 1, reveals compelling patterns of market behavior and risk dynamics.
The TASI returns exhibit clear volatility clustering, with particularly severe disruptions during the 2008-2009 Global Financial Crisis and the 2020 COVID-19 pandemic, during which returns experienced substantial negative deviations. The Geopolitical Risk Index (GPRHC) exhibits notable sensitivity to regional events, with significant spikes during the Arab Spring period (2010-2012) and a marked increase following the onset of the Russia-Ukraine conflict in 2022. Oil Price Uncertainty (OPU) reflects a fascinating evolution, with peak levels observed during the 2015-2016 oil price collapse and the unprecedented market conditions of early 2020, highlighting the index’s responsiveness to both supply-side shocks and broader market disruptions. Climate Policy Uncertainty (CPU) shows a general upward trend since 2015, reflecting the growing importance of environmental considerations in policy frameworks, with notable intensification during the post-COVID recovery period. Monetary Policy Uncertainty (MPU) displays distinct episodes of heightened uncertainty, particularly during the Global Financial Crisis and the recent crisis involving SVB and Credit Suisse in 2023, underscoring the interconnectedness of global financial markets. The crude oil price trajectory reveals remarkable volatility, with the 2015-2016 collapse and the COVID-19 shock distinguished as periods of extreme price stress. Notably, gold prices display a steadier upward path, confirming its status as a safe-haven asset during times of market turbulence. The inflation pattern exhibits significant fluctuations, with pronounced spikes following the COVID-19 pandemic and the onset of the Russia-Ukraine conflict, reflecting both global supply chain disruptions and heightened geopolitical tensions. These findings emphasize the complex interplay between global events, policy uncertainties, and market dynamics in shaping Saudi Arabia’s financial landscape.
5.2. Descriptive Analysis
The descriptive analysis reveals interesting patterns in the relationship between market returns and risk factors in Saudi Arabia. The TASI returns show a mean of 0.89% and a standard deviation of 6.63%, indicating moderate market volatility over the sample period. This relatively contained volatility suggests a degree of market stability, although the presence of extreme values (a minimum of -25.75% and a maximum of 19.60%) highlights instances of significant market stress.

Table 2.
Descriptive statistics.
| TASI RETURN | GPRHC | OPU | CPU | MPU | GOLD | INFLATION | CRUDE OIL | |
|---|---|---|---|---|---|---|---|---|
| mean | 0.009 | 0.238 | 113.879 | 119.586 | 129.393 | 0.008 | 0.021 | 0.010 |
| std | 0.066 | 0.174 | 69.012 | 65.891 | 71.695 | 0.039 | 0.028 | 0.090 |
| min | -0.258 | 0.018 | 18.295 | 28.162 | 19.749 | -0.117 | -0.032 | -0.390 |
| 25% | -0.026 | 0.112 | 64.657 | 72.580 | 81.810 | -0.016 | 0.003 | -0.045 |
| 50% | 0.013 | 0.199 | 101.250 | 100.798 | 113.614 | 0.002 | 0.019 | 0.020 |
| 75% | 0.047 | 0.304 | 143.880 | 150.538 | 155.768 | 0.031 | 0.033 | 0.070 |
| max | 0.196 | 1.160 | 367.732 | 411.289 | 407.365 | 0.174 | 0.111 | 0.260 |
| skew | -0.448 | 1.686 | 1.316 | 1.281 | 1.325 | 0.591 | 0.830 | -0.580 |
| kurtosis | 1.481 | 3.874 | 1.914 | 1.511 | 1.862 | 1.876 | 0.877 | 1.470 |
| ADF Test Stat. | -15.347 | -3.848 | -6.178 | -3.478 | -4.214 | -12.786 | -1.752 | -13.627 |
| P-value | 0.000 | 0.0143 | 0.000 | 0.0418 | 0.0043 | 0.000 | 0.727 | 0.000 |
| corr_with_TASI | 1.00 | -0.01 | -0.07 | -0.03 | -0.05 | -0.08 | -0.13 | 0.29 |
| Observations | 308 | 308 | 308 | 308 | 308 | 308 | 308 | 308 |
The distributional characteristics of the risk factors are of particular interest. The Historical Geopolitical Risk Index for Saudi Arabia (GPRHC) shows notable variability, with a mean of 0.238 and a standard deviation of 0.174. The pronounced positive skewness (1.686) and excess kurtosis (3.874) in this measure suggest that geopolitical risk events tend to appear as sudden, sharp increases rather than gradual changes. This asymmetric behavior has important implications for risk management strategies, as it indicates that geopolitical risks may arise more abruptly than they dissipate.
The uncertainty indices—oil price (OPU), climate policy (CPU), and monetary policy (MPU)—exhibit similar distributional characteristics, with means centered around their respective scales while demonstrating significant variation. The OPU index, particularly relevant to the Saudi market, has a mean of 113.88 and a standard deviation of 69.01, indicating the substantial uncertainty surrounding oil prices during the sample period. The positive skewness (1.316) in OPU implies that extreme uncertainty events in oil markets are more likely to occur on the upside, supporting findings in the literature concerning commodity price dynamics.
Inflation and crude oil returns exhibit distinct patterns, with inflation presenting a moderate positive mean (2.11%) and relatively low volatility (2.78%). In contrast, crude oil returns show significantly higher volatility (9.02%) and negative skewness (-0.580), indicating a tendency for sharp downward movements. This asymmetric behavior in oil returns could have significant implications for the Saudi market, considering its economic reliance on oil revenues.
Finally, the results of the Augmented Dickey-Fuller (ADF) test indicate that all of our variables are stationary except for inflation.
5.3. Correlation Analysis
The correlation results depicted in Figure 2 reveal a nuanced perspective on the interplay among the variables. Notably, the TASI Return shows a moderate positive correlation with crude oil (r = 0.29), indicating that changes in energy prices are partially reflected in market performance. The GPRHC index exhibits a moderate correlation with Monetary Policy Uncertainty (MPU) (r = 0.34) and a modest positive relationship with Climate Policy Uncertainty (CPU) (r = 0.16) while also maintaining a slightly negative relationship with inflation (r = –0.24). Oil Price Uncertainty (OPU) displays a weak overall connection with other variables, except for a modest positive correlation with inflation (r = 0.27), suggesting that fluctuations in oil prices may influence inflationary pressures. The CPU and MPU indices exhibit a relatively strong positive correlation (r = 0.49), indicating that uncertainty in climate policy closely mirrors changes in monetary policy uncertainty. Gold shows very weak correlations overall, hinting at its potential role as a safe haven unaffected by these dynamics.
Figure 3 also offers a visual and statistical insight into the relationships between TASI returns and the selected variables. The findings align with and corroborate the quantitative correlation coefficients reported earlier while also elucidating the nature of these associations.
First, crude oil displays the most significant positive relationship with TASI returns (Pearson’s r = 0.29). The regression slope is clearly upward, supported by a relatively tight clustering of data points around the trend line, indicating a moderate but statistically significant association. This sharply contrasts with the relationships observed for geopolitical risk (GPRHC; r = -0.01), climate policy uncertainty (CPU; r = -0.03), and monetary policy uncertainty (MPU; r = -0.05). For these variables, the regression lines are nearly horizontal, and the scatter patterns show considerable dispersion, suggesting statistically insignificant explanatory power over TASI returns.
Similarly, gold shows a modest inverse association with TASI returns (r = -0.08), although the diffuse scatter distribution indicates limited practical or statistical significance. Inflation, on the other hand, exhibits a clearer negative correlation (r = -0.13), as demonstrated by a moderately steep downward-sloping regression line. While the relationship remains weak, the pattern is visually more coherent than that of gold. Finally, oil price uncertainty (OPU; r = -0.07) reveals a marginal negative correlation with TASI returns, however the considerable variability in its scatter plot highlights the instability of this relationship.
6. Empirical Results
6.1. Local Projections and Smooth Local Projections: The Baseline Effects
Our analysis employing Local Projections reveals that Saudi stock market returns respond heterogeneously to various economic shocks, with particularly strong and immediate effects stemming from oil market dynamics. Figure 4 and Table 3 clearly show that a one-standard-deviation shock in crude oil prices induces a significant positive response in TASI returns at horizon zero, with the coefficient reaching 0.287 (p < 0.01). This pronounced initial effect, followed by persistently significant positive responses over the early horizons, underscores the critical role of oil prices in shaping market performance, which is not altogether surprising given Saudi Arabia’s economic structure. Yet, an interesting mean-reverting behavior is observed at later horizons, suggesting that while crude oil shocks transmit strong immediate signals, their impact eventually tapers off as market adjustments play out.
The inflation shock exhibits a markedly different profile. Figure 4 indicates a significant immediate negative impact (approximately -0.131, p < 0.05), with these adverse effects persisting across several subsequent periods. This dynamic is consistent with the theoretical framework in which inflation erodes real asset values through higher discount rates, thereby exerting a lasting deleterious influence on equity returns.
Uncertainty measures—specifically related to oil price uncertainty—demonstrate a gradual build-up in their negative influence. While the immediate effect of oil price uncertainty (OPU) appears modest, the graph shows statistically significant negative responses emerging after the second horizon, peaking around horizon seven. This delayed adjustment suggests that the market may require time to fully assimilate the uncertainty related to oil prices, potentially indicating a lag in investors’ reactions to evolving global uncertainties.
In contrast, the geopolitical risk index (GPRHC) displays largely insignificant responses across horizons, which might indicate that either the Saudi market is well insulated from geopolitical shocks or that this index does not capture the nuances of region-specific geopolitical risks as effectively as expected. Similarly, monetary policy uncertainty (MPU) and climate policy uncertainty (CPU) exert selective or sporadic effects, hinting at a more complex, condition-dependent transmission mechanism that warrants further investigation.
Table 4 and Table 5 summarize all the effects and results. In addition, the cumulative impulse response functions, constructed as the sum of these individual horizon effects, reinforce these observations by illustrating how the initial shocks gradually integrate over time. The cumulative responses in Figure 5 highlight that while some shocks (e.g., crude oil) have a strong, concentrated impact, others (e.g., inflation and oil price uncertainty) impart a more protracted influence on market dynamics.
These findings not only contribute to our understanding of the transmission channels of economic shocks in the Saudi market but also emphasize the need for policymakers and investors to consider both immediate and delayed effects when formulating strategies to mitigate risks associated with these variables.
6.2. Nonlinear Effects: Subsample Analysis of Asymmetric Market Responses
The analysis of geopolitical risk (GPRHC) also shows distinct patterns across two subperiods, with a breakpoint occurring in August 2011, the year of the Arab Spring events. The empirical results in Figure 6, Table 6, and Table 7 suggest a notable shift in the relationship between geopolitical risk and stock market returns in Saudi Arabia. During Period 1 (pre-August 2011), the local projections indicate a predominantly positive response of TASI returns to GPRHC shocks, with coefficients ranging from 0.058 to 0.237, and several horizons exhibiting statistical significance (particularly at horizons 3, 5, 7, and 11, with significance levels varying between 10% and 5%). The smooth local projections for this period corroborate these findings, showing a more stable positive trajectory in the response pattern. In contrast, Period 2 (post-August 2011) demonstrates a marked reversal in this relationship. The estimates reveal predominantly negative coefficients, with values ranging from -0.114 to -0.024, and statistical significance is evident in the medium-term horizons (2-4). This structural break in the relationship could be attributed to the evolving nature of geopolitical risks following global policy shifts and regional geopolitical events. The confidence bands, represented by the shaded areas in both periods, suggest greater precision in the estimates for Period 2, as evidenced by the narrower confidence intervals. These findings contribute to our understanding of how the Saudi stock market’s sensitivity to geopolitical risks has evolved, potentially reflecting the market’s increased sophistication in pricing such risks and the kingdom’s enhanced strategy to deal with them in the post-2011 era.
The results for inflation indicate a pronounced disruption in market dynamics between the subperiods. In Period 1, the local and smooth local projection estimates exhibit significant negative responses to inflation shocks, suggesting that rising inflation was systematically associated with an immediate decline in stock market returns. This negative impulse response was both statistically significant and persistent across multiple horizons, indicating that short-term increases in inflation had a detrimental impact on investor sentiment and market performance. In contrast, Period 2 reveals a significantly attenuated relationship where the inflation shock’s influence on returns is both muted and statistically insignificant for most horizons. Such a dampening effect may reflect improved inflation expectations management and altered monetary policy frameworks in the post-transition period.
For oil price uncertainty, the first subperiod is characterized by pronounced responses where shocks contributed to volatility in TASI returns, as captured by both the LP and SLP estimates. The coefficients in Period 1 were relatively large and statistically significant over multiple horizons, indicating that heightened uncertainty in oil prices had substantial immediate and dynamic effects on market behavior. However, in Period 2, the magnitude of these responses shrank considerably, and the significance levels were notably lower. The results suggest that as market participants became more adept at managing oil price risks—or perhaps due to structural changes in global energy markets—the sensitivity of Saudi stock returns to oil price uncertainty decreased.
In the analysis of climate policy uncertainty, the dynamics exhibit a clear regime shift over the two subperiods. For Period 1, both the local and smooth local projections reveal that an increase in CPU shocks has a statistically significant and positive effect on market returns. This suggests that, in the early period, heightened uncertainty surrounding climate policy may have been interpreted by market participants as an indicator of impending policy adjustments or regulatory interventions, prompting a risk premium in asset pricing. In contrast, Period 2 shows a considerably subdued response with coefficients of much smaller magnitude and statistical insignificance across most horizons. This change can be attributed to an evolving policy environment and improved market integration of climate risk information, which reduces uncertainty and its impact on asset prices.
Monetary policy uncertainty demonstrates distinct time-varying effects on the Saudi equity market. In the first subperiod, shocks related to MPU are characterized by significant effects, with both local and smooth local projection estimates indicating pronounced, often statistically significant, movements in market returns. This implies that early market reactions were particularly sensitive to the ambiguity in monetary policy, likely to reflect the challenges investors faced in forecasting central bank actions. However, as the sample transitions into Period 2, the market’s response to MPU shocks diminishes markedly. The smaller coefficient magnitudes and lack of statistical significance suggest that policymakers’ actions have become more predictable or that improved communication and transparency have mitigated uncertainty, thereby reducing its disruptive effects on asset valuations.
The response of market returns to gold price shocks presents a nuanced picture across the two subperiods. During Period 1, the projections suggest that gold-related shocks have a modestly positive impact on returns—a finding consistent with the traditional view of gold as a safe haven during turbulent times. This positive association suggests that investors may have used gold price signals as a hedge against broader market volatility. Moving into Period 2, however, the relationship becomes less straightforward. The estimates generally indicate a reduced or even slightly negative impact, accompanied by wider confidence intervals and lower levels of statistical significance. This shift may reflect changes in market behavior, where gold’s role as a safe haven becomes less dominant in an environment characterized by more diversified investment strategies and increased global financial integration.
The dynamic relationship between crude oil prices and stock returns is particularly noteworthy in the context of the Saudi market. During Period 1, shocks to crude oil prices generate strong, statistically significant negative responses in market returns—a relationship underscoring the Saudi economy’s high sensitivity to fluctuations in energy markets. In the second subperiod, even though the negative impact remains present, it is both diminished in magnitude and statistical significance. This attenuation perhaps indicates an evolving economic structure with reduced reliance on oil revenues or improved market mechanisms that better absorb oil market volatility.
Overall, the empirical analysis reveals compelling evidence of time-varying relationships between geopolitical risks, economic uncertainties, and stock market returns in Saudi Arabia. Furthermore, through the lens of Local Projections (LP) and their smoothed variants (SLP), we document several noteworthy patterns in the cumulative impulse responses of the TASI index to standardized shocks.
Our findings, presented in Figure 7 and Table 8, demonstrate a significant structural break in the transmission of geopolitical risk to market returns. In the first subperiod, a one-standard-deviation increase in the Saudi Arabian Geopolitical Risk Index (GPRHC) is associated with a significant cumulative increase in returns, reaching 2.029 standard deviations (SE = 0.020) over a twelve-month horizon. However, this relationship inverts in the second subperiod, where an equivalent shock generates a cumulative decline of 1.038 standard deviations (SE = 0.012). This striking reversal suggests a fundamental shift in how market participants price geopolitical risk, possibly reflecting evolving institutional frameworks or changes in market structure.
The analysis of global uncertainty measures yields equally intriguing results. Climate policy uncertainty (CPU) exhibits a particularly notable pattern: its initial strongly negative impact (-1.835, SE = 0.027 at the twelve-month horizon in Period 1) transforms into a positive effect (0.334, SE = 0.005) in the second period. This transformation may reflect the market’s adaptation to climate-related policy initiatives and the growing integration of environmental considerations into investment strategies. Similarly, monetary policy uncertainty (MPU) displays a sign reversal across periods, transitioning from positive (0.093, SE = 0.013) to negative (-0.477, SE = 0.007) cumulative effects at the twelve-month horizon.
Commodity-related uncertainties maintain more consistent directional effects, though with varying magnitudes. Oil price uncertainty (OPU) consistently exhibits negative cumulative responses across both periods (-1.003, SE = 0.013 and -0.984, SE = 0.012, respectively, at the twelve-month horizon), underscoring the persistent vulnerability of the Saudi market to global oil market dynamics. The response to crude oil prices remains positively significant across periods, albeit with moderate magnitudes (0.330, SE = 0.016 and 0.379, SE = 0.012, respectively), suggesting a nuanced relationship between oil price levels and market returns.
Perhaps most striking is the dramatic reversal in the market’s response to inflation uncertainty. The first period shows a strong negative cumulative effect (-2.227, SE = 0.021 at twelve months), while the second period reveals an equally strong positive effect (1.730, SE = 0.017). This finding may reflect evolving monetary policy frameworks and their interaction with market expectations, or changes in the broader macroeconomic environment affecting inflation-return dynamics.
These results have significant implications for both academic research and practical applications. First, they emphasize the importance of considering temporal instability in risk-return relationships when modeling the dynamics of emerging markets. Second, they indicate that the Saudi market’s integration with global financial markets may be evolving, as shown by the changing nature of its responses to international risk factors. Finally, these findings highlight the complexity of risk management in emerging markets, where the impact of various uncertainty measures can shift significantly over time.
Our analysis contributes to the expanding literature on geopolitical risk and market behavior by providing detailed evidence of time-varying risk transmission channels. The observed patterns of response reversals and varying magnitudes across different types of risk measures provide valuable insights for portfolio management and policy formulation in emerging market settings. These findings also raise significant questions about the underlying mechanisms driving these changes, indicating fertile ground for future research into the evolving nature of risk-return relationships in emerging markets.
6.3. Time-Varying Parameter Local Projections (TVP-LP) Method
To capture the evolution of the parameters of the Local Projections regression over time, we estimate the model using a rolling window approach. In this framework, parameters like and are re-estimated for each subsample (window) of data of fixed length (here, 60 observations). As a result, the coefficients become functions of time, thereby providing a continuous measure of the impulse responses: where is an implicitly estimated function through the sequence of rolling regressions. This formulation allows us to visualize the evolution of over time and across horizons, effectively capturing the dynamic nature of market responses. This framework offers a flexible and powerful approach to monitoring shifts in market sensitivity over time, providing crucial insights for both economic analysis and practical risk management.
The TVP-LP graph in Figure 8 visualizes the evolving relationships between TASI returns and our macroeconomic and uncertainty variables—GPRHC, INFLATION, OPU, CPU, MPU, GOLD, and CRUDE OIL—over 12 forecast horizons. It demonstrates evidence of complex, time-varying relationships. In these heatmaps, rows represent the forecast horizon, while columns indicate the temporal dimension. The color gradients reflect the estimated coefficients from rolling regressions, making it easier to identify both the magnitude and direction of the impulse responses over time. The shifting color patterns across horizons and time illustrate variations in the sensitivity of market returns to these shocks, emphasizing periods of structural change or heightened volatility in the underlying relationships.
The TVP-LP estimates reveal substantial time variation in the impact of geopolitical risk on TASI returns. The coefficient patterns exhibit a notable regime shift, transitioning from predominantly positive responses (warm colors) in the early sample period to more negative responses (cool colors) in later periods, particularly at intermediate horizons (4-8). This structural change suggests an evolution in how the Saudi market assesses geopolitical risks, possibly reflecting increased market sophistication or a shift in the strategic importance of this factor. This finding aligns with theoretical expectations that investors’ sensitivity to geopolitical developments may fluctuate in response to changing regional dynamics and global risk sentiment.
The response of TASI to inflation shocks exhibits notable heterogeneity across both time and forecast horizons. The heatmap reveals clusters of negative coefficients (represented by cool colors) during periods of increased global economic uncertainty, particularly at shorter horizons (0-4). This pattern suggests that the Saudi market’s sensitivity to inflation has been episodic rather than constant, with the relationship becoming more pronounced during times of global economic stress. The varying intensity of these responses across horizons indicates that the market’s pricing of inflation risk is dependent on the horizon. This aligns with the theoretical ambiguity regarding inflation’s impact on equity markets—potentially beneficial during moderate economic expansion but detrimental during episodes of stagflation.
The relationship between oil price uncertainty and market returns exhibits notable temporal instability. The heatmap shows alternating bands of positive and negative coefficients across different horizons, with particularly strong negative responses (darker blue regions) emerging during periods of global oil market turbulence. This pattern underscores the complex and evolving nature of oil price uncertainty’s impact on the Saudi market, reflecting both the economy’s oil dependence and its ongoing diversification efforts.
The TVP-LP estimates for CPU reveal an increasingly important role of climate policy uncertainty in driving market returns. The coefficients reveal asymmetric effects across horizons, with more pronounced negative relationships at shorter horizons gradually attenuating at longer forecast periods. While in more recent periods, the coefficient patterns show a gradual intensification of market responses, particularly at medium-term horizons (6-10). This evolution might reflect growing market awareness of climate-related risks and their potential impact on Saudi Arabia’s economic transition plans.
The impact of monetary policy uncertainty shows clear temporal variation and exhibits intriguing horizon-specific effects, with stronger impacts observed at medium-term horizons (4-8 months). This temporal structure may reflect the gradual transmission of monetary policy signals through the financial system, where market participants need time to fully incorporate policy uncertainty into asset valuations. Additionally, the pattern suggests that the market’s sensitivity to monetary policy uncertainty has become more pronounced in recent years, possibly indicating increased integration with global financial markets and heightened attention to international monetary policy developments.
The relationship between gold price movements and TASI returns shows interesting temporal dynamics. The heatmap reveals periods of both positive and negative correlations, with the strength of the relationship varying considerably over time. This pattern suggests that gold’s role as a safe-haven asset or risk hedge has not been constant for the Saudi market; instead, it varies with broader market conditions and risk regimes.
The crude oil price coefficients display relatively stable patterns. This highlights the structural significance of oil price movements for the Saudi equity market. Simultaneously, they show some of the most significant time variations among all variables examined. The heatmap illustrates distinct regimes of positive and negative responses, with particularly strong impacts during periods of oil market stress. This, reflects the changing nature of the Saudi market’s relationship with oil prices, possibly indicating the ongoing economic diversification efforts and shifts in global energy market dynamics.
6.4. Robustness Check
In addition to our primary methodological framework, we employ wavelet coherence analysis to provide deeper insights into the time-frequency relationships between TASI returns and various uncertainty measures. This approach enables us to capture both temporal and frequency variations in the relationships, providing a more nuanced understanding of the dynamic interdependencies.
The wavelet coherence methodology begins with the continuous wavelet transform (CWT) of a two-time series. For a time series , the CWT is defined as:
where s represents the scaling parameter, is the translation parameter, and denotes the complex conjugate of the Morlet wavelet function. The Morlet wavelet is selected as our mother wavelet due to its optimal joint time-frequency localization properties, defined as:
where ω₀ represents the central frequency of the wavelet. The wavelet coherence between two-time series and is then computed as:
where S denotes a smoothing operator in both time and scale, and represents the cross-wavelet transform:
The smoothing operator S is implemented through a convolution in time and scale:
where denotes smoothing along the wavelet scale axis and represents smoothing in time. The smoothing is performed using a weighted moving average with a Gaussian window.
For our empirical implementation, we utilize scales (s) ranging from 1 to 128, corresponding to different frequency bands, and normalize our time series prior to analysis.
The resulting wavelet coherence measure takes values between 0 and 1, where: indicates strong co-movement between the series, and suggests weak or no relationship. To quantify the overall strength of the relationship, we compute both the mean and maximum coherence statistics.
This methodological framework enables us to first identify time-varying relationships across different frequency bands, second detect periods of strong co-movement between market returns and uncertainty measures, third distinguish between short-term and long-term dependencies, and finally capture nonlinear and evolving relationships that traditional time-domain approaches might miss.
The implementation of this methodology complements our Local Projections framework by providing additional insights into the frequency-dependent nature of uncertainty transmission in financial markets. This multidimensional approach enables us to better understand how different types of uncertainties impact market returns across various time horizons and frequencies, thereby providing a more comprehensive view of the complex dynamics at play in the Saudi stock market.
Figure 9 and Table 9 provide strong support for our earlier findings. Our wavelet coherence analysis provides a visualization of the time-varying, frequency-dependent relationships between TASI returns and the other variables. The resulting coherence maps reveal that the interdependence between TASI returns and the Saudi Geopolitical Risk index, Global Oil Price Uncertainty, and Global Climate Policy Uncertainty is highly dynamic. For instance, the coherence between TASI returns and the Saudi Geopolitical Risk Index exhibits strong relationships at longer time scales, with maximum coherence values reaching as high as 0.987. This finding highlights the enduring impact of geopolitical risks on market returns, particularly during periods of heightened regional tension.
Similarly, the analysis reveals that oil price uncertainty consistently exerts a considerable influence on TASI returns, as indicated by moderate mean coherence values and a peak coherence of nearly 0.979. The time-frequency plots further indicate that episodes of strong coherence appear intermittently, suggesting that while the influence of oil market fluctuations persists over time, its impact may be concentrated within specific periods of market stress. In contrast, the coherence between TASI returns and the Global Climate Policy Uncertainty index, although comparable in magnitude, highlights an evolving pattern with increasing strength in recent years—a trend that aligns with the rising prominence of climate-related risks in global markets.
Notably, our analysis of the U.S. Monetary Policy Uncertainty index reveals the highest peak coherence at nearly 0.990. This pronounced coherence suggests that domestic monetary policy shocks may have both immediate and persistent effects on the Saudi market, with significant dynamics evident at intermediate scales. The examined market variables—including GOLD, INFLATION, and CRUDE OIL—also display periods of marked coherence, albeit with varying intensities across scales. In particular, crude oil exhibits periods of strong co-movement despite having a lower average coherence, suggesting that abrupt shifts in the oil market can trigger robust responses in TASI returns.
Collectively, these findings from wavelet coherence analysis not only corroborate our prior standard and nonlinear tests but also enrich our understanding of the complex, multi-scale interactions at play. The results affirm that the dynamic responses of Saudi stock market returns to diverse economic uncertainties and geopolitical risks are both time-varying and frequency-specific. This nuanced insight reinforces the necessity of employing advanced econometric frameworks — such as Local Projections and smoothed variants — to fully capture the evolving nature of market behavior amid persistent uncertainty and global volatility.
7. Discussion of Findings
Our comprehensive analysis of the dynamic effects of economic uncertainties and geopolitical risks on Saudi stock market returns yields several important insights that contribute to both the academic literature and policy discourse. The results reveal complex, time-varying relationships between various uncertainty measures and market returns, with significant implications for market participants, policymakers, and regulatory frameworks.
The empirical evidence demonstrates substantial heterogeneity in how different forms of uncertainty affect the Saudi stock market. The geopolitical risk index (GPRHC) exhibits a particularly noteworthy pattern, with its impact shifting dramatically between the two analyzed periods. The initial positive relationship (coefficient: 2.029, significant at 1% level) in the first period suggests that the market had developed resilience mechanisms to geopolitical tensions, possibly reflecting investors’ confidence in the authorities’ ability to manage regional challenges. However, the reversal to negative effects (-1.038, significant at 1% level) in the second period indicates an evolution in market sensitivity to geopolitical events, potentially linked to increased global market integration and the kingdom’s economic transformation initiatives.
The oil price uncertainty (OPU) results underscore the market’s complex relationship with global energy markets. The persistent negative effects across both periods, albeit with varying magnitudes, suggest that despite diversification efforts, the Saudi market remains significantly exposed to oil price volatility. This finding is particularly relevant to ongoing economic diversification strategies under Vision 2030.
Climate policy uncertainty (CPU) emerges as an increasingly significant factor, with its growing impact reflecting the market’s forward-looking nature and increasing awareness of global environmental policy shifts. This trend aligns with Saudi Arabia’s recent emphasis on sustainable development and green initiatives, though it also highlights potential vulnerabilities in the transition period.
The monetary policy uncertainty (MPU) results reveal non-linear effects that peak at intermediate horizons, suggesting that market participants require time to fully process and incorporate global monetary policy shifts into their investment decisions. This finding has important implications for market efficiency and the transmission of international monetary policy effects to emerging markets.
8. Conclusions
Our findings contribute to the growing body of literature on the effects of uncertainty in emerging markets, while highlighting several unique aspects of the Saudi market. The evidence of significant temporal variations in risk-return relationships, coupled with the identification of non-linear dynamics through our diagnostic tests, suggests that simple linear models may be insufficient for capturing the complex nature of uncertainty transmission in emerging markets.
The results also demonstrate the evolving nature of the Saudi market’s integration with global financial systems. The increasing sensitivity to international factors, such as climate policy and monetary policy uncertainty, alongside traditional regional influences, including geopolitical risk and oil price uncertainty, reflects the market’s ongoing transformation from a primarily regional player to a more globally integrated financial center.
9. Policy Implications, Recommendations, and Future Research Directions
Several policy recommendations arise from our analysis. Firstly, regulatory authorities should develop more advanced monitoring systems that incorporate the identified non-linear relationships between various forms of uncertainty and market returns. Secondly, while efforts toward economic diversification are ongoing, our findings suggest the need for accelerated development of non-oil sectors to mitigate market sensitivity to oil price uncertainty. Thirdly, financial institutions should adjust their risk management practices to consider the varying effects of different uncertainty measures across various time horizons. Fourthly, given the substantial impact of monetary policy uncertainty, improved communication frameworks between monetary authorities and market participants could help minimize policy-induced market volatility. Lastly, the increasing significance of climate policy uncertainty highlights the need for clearer policy frameworks regarding the kingdom’s energy transition strategy.
Finally, our findings open several promising avenues for future research:
- Investigation of threshold effects in uncertainty transmission, particularly examining whether certain levels of uncertainty trigger regime changes in market behavior.
- Exploration of sector-specific responses to different uncertainty measures, which could provide more granular insights for portfolio management.
- Analysis of the interaction between different uncertainty measures and their combined effects on market returns.
- Examination of the role of market microstructure in mediating uncertainty effects, particularly in light of recent market reforms.
- Investigation of spillover effects between the Saudi market and other regional/global markets under different uncertainty regimes.
- Development of early warning systems based on the identified relationships between uncertainty measures and market returns.
These research directions would further enhance our understanding of uncertainty transmission in emerging markets and contribute to the development of more effective policy frameworks for managing market stability in an increasingly complex global financial system.
Author Contributions
Conceptualization, E.A. and N.B.M.; methodology, E.A.; software, E.A.; validation, E.A. and N.B.M.; formal analysis, E.A. and N.B.M.; investigation, E.A. and N.B.M.; resources, E.A.; data curation, E.A. and N.B.M.; writing—original draft preparation, E.A. and N.B.M.; writing—review and editing, E.A. and N.B.M.; visualization, E.A.; supervision, E.A. and N.B.M. All authors have read and agreed to the published version of the manuscript.
Funding
This research was supported and funded by the Deanship of Scientific Research at Imam Mohammad Ibn Saud Islamic University (IMSIU) (Grant number IMSIU-DDRSP2504).
Institutional Review Board Statement
Not applicable.
Informed Consent Statement
Not applicable.
Data Availability Statement
All variables are sourced from the Saudi Exchange Market “Tadawul”, the Geopolitical Risk Index website, FRED Economic Data, the OECD database, the Economic Policy Uncertainty website, and the World Gold Council.
Conflicts of Interest
The authors declare no conflicts of interest. The funders had no role in the design of the study; in the collection, analyses, or interpretation of data; in the writing of the manuscript; or in the decision to publish the results.
References
- Aastveit, K. A., Natvik, G. J., & Sola, S. (2021). Economic effects of geopolitical uncertainty shocks. European Economic Review, 132, 103646.
- Ahmad, F., Shahbaz, M., & Rehman, I. (2023). Geopolitical risks and stock market performance in Pakistan: A threshold regression approach. Applied Economics Letters, 30(1), 1–10.
- Alam, M. S., & Uddin, M. G. S. (2020). Geopolitical risks and stock market dynamics in GCC countries. Research in International Business and Finance, 54, 101295.
- Al-Khazali, O., Eun, C. S., & Choi, D. S. (2021). The impact of geopolitical risk on emerging stock markets: Evidence from the Arab Spring. Journal of International Financial Markets, Institutions and Money, 73, 101356.
- Alotaibi, A. R., & Mishra, A. V. (2017). Time varying international financial integration for GCC stock markets. The Quarterly Review of Economics and Finance, 63, 66-78. [CrossRef]
- Aloui, C., Hammoudeh, S., & Hamida, H. B. (2016). Co-movement between sharia stocks and sukuk in the GCC markets: A time-frequency analysis. Journal of International Financial Markets, Institutions and Money, 41, 150-163. [CrossRef]
- Alqahtani, A., Bouri, E., & Vo, X. V. (2020). Predictability of GCC stock returns: The role of geopolitical risk and oil price uncertainty. Economic Analysis and Policy, 68, 239-249.
- Alqahtani, A., Klein, T., & Khalid, A. (2019). The impact of oil price uncertainty on GCC stock markets. Resources Policy, 61, 166-174.
- Alsagr, N., & van Hemmen, S. F. (2021). The impact of geopolitical risks and the 2014 oil price slump on the volatility spillovers between the Saudi Arabian stock market and other GCC stock markets. The Quarterly Review of Economics and Finance, 80, 639-657.
- Alshammari, T. S. (2020). Predicting Saudi stock market returns using machine learning and geopolitical risk indicators. Journal of Risk and Financial Management, 13(11), 283.
- Al-Yahyaee, K. H., Mensi, W., & Yoon, S. M. (2018). Regime shifts in volatility and correlations during geopolitical tensions: Evidence from Omani stock market. Journal of Multinational Financial Management, 46, 1–15.
- Amihud, Y., & Mendelson, H. (1986). Asset pricing and the bid-ask spread. Journal of Financial Economics, 17(2), 223-249. [CrossRef]
- Antonakakis, N., Chatziantoniou, I., & Gabauer, D. (2017). Refined measures of dynamic connectedness based on time-varying parameter vector autoregressions. Journal of International Financial Markets, Institutions and Money, 50, 126–149. [CrossRef]
- Antonakakis, N., Gupta, R., Kollias, C., & Papadamou, S. (2017). Geopolitical risks and the oil-stock nexus over 1899–2016. Finance Research Letters, 23, 165-173. [CrossRef]
- Apergis, N., Bonato, M., Gupta, R., & Kyei, C. (2018). Does geopolitical risks predict stock returns and volatility of leading defense companies? Evidence from a nonparametric approach. Defence and Peace Economics, 29(6), 684-696. [CrossRef]
- Arouri, M. E. H., & Rault, C. (2012). Oil prices and stock markets in GCC countries: Empirical evidence from panel analysis. International Journal of Finance & Economics, 17(3), 242-253. [CrossRef]
- Auty, R. M. (2001). Resource abundance and economic development. Oxford University Press.
- Baker, M., & Wurgler, J. (2006). Investor sentiment and the cross-section of stock returns. The Journal of Finance, 61(4), 1645-1680. [CrossRef]
- Baker, S. R., Bloom, N., & Davis, S. J. (2016). Measuring economic policy uncertainty. The Quarterly Journal of Economics, 131(4), 1593–1636.
- Balcilar, M., Bonato, M., Demirer, R., & Gupta, R. (2018). Geopolitical risks and stock market dynamics of the BRICS. Economic Systems, 42(2), 295-306. [CrossRef]
- Balcilar, M., Demirer, R., & Hammoudeh, S. (2016). Investor herds and regime-switching: Evidence from Gulf Arab stock markets. Journal of International Financial Markets, Institutions and Money, 45, 146–163. [CrossRef]
- Barberis, N. (2013). Psychology and the financial crisis of 2007-2008. Financial innovation: Too much or too little, 15-28.
- Barberis, N. (2013). Thirty years of prospect theory in economics: A review and assessment. Journal of Economic Perspectives, 27(1), 173–196.
- Barberis, N., & Thaler, R. (2003). A survey of behavioral finance. Handbook of the Economics of Finance, 1, 1053-1128.
- Barnichon, R. & Brownlees, C. (2019). Impulse Response Estimation by Smooth Local Projections, The Review of Economics and Statistics, 101(3), 522-530. [CrossRef]
- Beblawi, H., & Luciani, G. (1987). The rentier state. Croom Helm.
- Bekaert, G., & Harvey, C. R. (2003). Emerging markets finance. Journal of Empirical Finance, 10(1-2), 3-55.
- Bekaert, G., Harvey, C. R., & Lundblad, C. T. (2005). Does Financial Liberalization Spur Growth? Journal of Financial Economics, 77(1), 3–55.
- Berkman, H., Jacobsen, B., & Lee, J. B. (2011). Time-Varying Rare Disaster Risk and Stock Returns. Journal of Financial Economics, 101(2), 313-332. [CrossRef]
- Bernanke, B. S., & Kuttner, K. N. (2005). What explains the stock market’s reaction to Federal Reserve policy? The Journal of Finance, 60(3), 1221-1257.
- Bloom, N. (2009). The impact of uncertainty shocks. Econometrica, 77(3), 623–685.
- Bouoiyour, J., Selmi, R., & Wohar, M. E. (2018). Measuring the response of gold prices to uncertainty: An analysis beyond the mean. Economic Modelling, 75, 105-116. [CrossRef]
- Brounen, D., & Derwall, J. (2010). The Impact of Terrorist Attacks on International Stock Markets. European Financial Management, 16(4), 585-598. [CrossRef]
- Brunnermeier, M. K., & Pedersen, L. H. (2009). Market liquidity and funding liquidity. The Review of Financial Studies, 22(6), 2201-2238.
- Caballero, Ricardo J., and Arvind Krishnamurthy. (2008). Collective Risk Management in a Flight to Quality Episode. Journal of Finance 63 (5): 2195-2230. [CrossRef]
- Caldara, D., & Iacoviello, M. (2018). Measuring geopolitical risk. FRB International Finance Discussion Paper, (1222).
- Caldara, D., & Iacoviello, M. (2022). Measuring Geopolitical Risk. American Economic Review 112 (4): 1194-1225.
- Carhart, Mark M. (1997). On Persistence in Mutual Fund Performance. Journal of Finance 52 (1): 57-82.
- Carney, M. (2016). Uncertainty, the Economy and Policy. Speech delivered at the Bank of England, London, June 30, 2016. http://tiny.cc/1dhd001.
- Carrieri, F., Errunza, V., & Hogan, K. (2007). Characterizing world market integration through time. Journal of Financial and Quantitative Analysis, 42(4), 915-940. [CrossRef]
- Chau, F., Deesomsak, R., & Wang, J. (2014). Political uncertainty and stock market volatility in the Middle East and North African (MENA) countries. Journal of International Financial Markets, Institutions and Money, 28, 1-19. [CrossRef]
- Chen, Y., Li, X., & Zhang, Z. (2020). The impact of geopolitical risk on Chinese stock markets: Evidence from the U.S.-China trade war. Emerging Markets Review, 45, 100737.
- Chordia, T., Sarkar, A., & Subrahmanyam, A. (2005). An empirical analysis of stock and bond market liquidity. The Review of Financial Studies, 18(1), 85-129. [CrossRef]
- Christou, C., Cunado, J., Gupta, R., & Hassapis, C. (2017). Economic policy uncertainty and stock market returns in PacificRim countries: Evidence based on a Bayesian panel VAR model. Journal of Multinational Financial Management, 40, 92-102. [CrossRef]
- Christou, C., Gupta, R., & Hassapis, C. (2018). Economic policy uncertainty and stock market returns: Evidence from European countries. Economic Modelling, 73, 287–295.
- Corden, W. M., & Neary, J. P. (1982). Booming sector and de-industrialisation in a small open economy. The Economic Journal, 92(368), 825-848. [CrossRef]
- Damodaran, A. (2018). Equity risk premiums: Determinants, estimation and implications–The 2018 edition. NYU Stern School of Business.
- Darrell, D. & Epstein L. G. (1992). Stochastic Differential Utility. Econometrica 60 (2): 353-394.
- De Long, J. B., Shleifer, A., Summers, L. H., & Waldmann, R. J. (1990). Noise trader risk in financial markets. Journal of Political Economy, 98(4), 703-738. [CrossRef]
- Diebold, F. X., & Yilmaz, K. (2012). Better to give than to receive: Predictive directional measurement of volatility spillovers. International Journal of Forecasting, 28(1), 57–66. [CrossRef]
- Fama, E. F. (1970). Efficient capital markets: A review of theory and empirical work. The Journal of Finance, 25(2), 383-417. [CrossRef]
- Fama, E. F., & Kenneth R. F. (1993). Common Risk Factors in the Returns on Stocks and Bonds. Journal of Financial Economics 33 (1): 3-56.
- Forbes, K. J., & Rigobon, R. (2002). No contagion, only interdependence: Measuring stock market comovements. The Journal of Finance, 57(5), 2223–2261. [CrossRef]
- Frankel, J. A. (2010). The natural resource curse: A survey. National Bureau of Economic Research.
- Graham, J. R., & Harvey, C. R. (2018). The equity risk premium in 2018. SSRN Electronic Journal.
- Gulen, H., & Ion, M. (2016). Policy uncertainty and corporate investment. The Review of Financial Studies, 29(3), 523-564. [CrossRef]
- Hamilton, J. D. (1989). A new approach to the economic analysis of nonstationary time series and the business cycle. Econometrica, 57(2), 357–384. [CrossRef]
- Hirshleifer, D., & Siew Hong T. (2009). Thought and Behavior Contagion in Capital Markets. Review of Financial Studies, 22 (1), 37-78.
- Hoque, H., Najand, M., & Zong, W. (2022). Geopolitical risk and stock market volatility spillovers: Evidence from Asia-Pacific economies. International Review of Economics & Finance, 77, 1–16.
- Jordà Ò. (2005). Estimation and Inference of Impulse Responses by Local Projections. American Economic Review, 95 (1), 161–182. [CrossRef]
- Julio, B., & Yook, Y. (2012). Political uncertainty and corporate investment cycles. The Journal of Finance, 67(1), 45-83. [CrossRef]
- Kahneman, D., & Tversky, A. (1979). Prospect theory: An analysis of decision under risk. Econometrica, 47(2), 263–291. [CrossRef]
- Kang, W., & Ratti, R. A. (2013). Oil shocks, policy uncertainty, and stock market return. Journal of International Financial Markets, Institutions and Money, 26, 305–318.
- Kang, W., Ratti, R. A., & Vespignani, J. L. (2017). Oil price shocks and policy uncertainty: New evidence on the effects of US and non-US oil production. Energy Economics, 66, 536-546. [CrossRef]
- Kelly, Bryan, Ľuboš Pástor, and Pietro Veronesi. (2016). The Price of Political Uncertainty: Theory and Evidence from the Option Market. Journal of Finance 71 (5): 2417-2480. [CrossRef]
- Kilian, L. (2009). Not all oil price shocks are alike: Disentangling demand and supply shocks in the crude oil market. American Economic Review, 99(3), 1053–1069. [CrossRef]
- Knight, F. H. (1921). Risk, uncertainty and profit. Houghton Mifflin.
- Kozlowski, Julian, Laura Veldkamp, and Venky Venkateswaran. 2020. “The Tail That Wags the Economy: Beliefs and Persistent Stagnation.” Journal of Political Economy 128 (8): 2839-2879. [CrossRef]
- Kumar, D., & Dash, S. R. (2021). Structural breaks and geopolitical risks: Evidence from Indian stock markets. Global Finance Journal, 49, 100678.
- Li, X., & Peng, L. (2023). Time-varying impacts of geopolitical risks on BRICS stock markets: A wavelet coherence analysis. Finance Research Letters, 50, 103349.
- Lieven, B., Bekaert, G., Inghelbrecht, K., & Wei, M. (2020). Flights to Safety. Review of Financial Studies 33 (2): 689-746.
- Liu, L., & Zhang, T. (2015). Economic policy uncertainty and stock market volatility. Finance Research Letters, 15, 99-105. [CrossRef]
- Lo, A. W. (2004). The adaptive markets hypothesis. The Journal of Portfolio Management, 30(5), 15-29.
- Mahdavy, H. (1970). The patterns and problems of economic development in rentier states: The case of Iran. Studies in Economic History of the Middle East, 428-467.
- Malkiel, B. G. (2003). The efficient market hypothesis and its critics. Journal of Economic Perspectives, 17(1), 59-82. [CrossRef]
- Mensi, W., Al-Yahyaee, K. H., & Kang, S. H. (2021). Quantile connectedness between geopolitical risks and energy prices: Evidence from oil-importing and oil-exporting countries. Energy Economics, 95, 105125.
- Mensi, W., Hammoudeh, S., Shahzad, S. J. H., & Al-Yahyaee, K. H. (2020). Asymmetric impacts of public and private investments on the non-oil GDP of Saudi Arabia. International Economics, 164, 127-137. [CrossRef]
- Mohanty, S. K., Nandha, M., Turkistani, A. Q., & Alaitani, M. Y. (2011). Oil price movements and stock market returns: Evidence from Gulf Cooperation Council (GCC) countries. Global Finance Journal, 22(1), 42-55. [CrossRef]
- Omrane, B., Ftiti, Z., & Louhichi, W. (2020). Dynamic conditional correlation analysis of MENA stock markets under geopolitical risks. Economic Systems, 44(3), 100755.
- Pástor, L., & Veronesi, P. (2012). Uncertainty about government policy and stock prices. The Journal of Finance, 67(4), 1219-1264. [CrossRef]
- Pástor, Ľ., & Veronesi, P. (2013). Political uncertainty and risk premia. Journal of Financial Economics, 110(3), 520-545. [CrossRef]
- Rigobon, R., & Sack, B. (2004). The impact of monetary policy on asset prices. Journal of Monetary Economics, 51(8), 1553-1575. [CrossRef]
- Rjoub, H., Bekiros, S., & Selcuk, F. (2022). Geopolitical risks and stock market dynamics in Turkey: A quantile-on-quantile approach. North American Journal of Economics and Finance, 60, 101651.
- Ross, M. L. (2001). Does oil hinder democracy? World Politics, 53(3), 325-361.
- Sachs, J. D., & Warner, A. M. (1995). Natural resource abundance and economic growth. National Bureau of Economic Research.
- Shahzad, S. J. H., Naifar, N., Hammoudeh, S., & Roubaud, D. (2022). Directional predictability from oil market uncertainty to sovereign credit spreads of oil-exporting countries: Evidence from rolling windows and cross-quantilogram analysis. Energy Economics, 104, 105631. [CrossRef]
- Shefrin, H., & Statman, M. (2000). Behavioral portfolio theory. Journal of Financial and Quantitative Analysis, 35(2), 127-151.
- Solnik, B. H. (1974). An equilibrium model of the international capital market. Journal of Economic Theory, 8(4), 500-524. [CrossRef]
- Tarek A., H., Hollander, S., Van Lent, L., & Tahoun, A. (2019). Firm-Level Political Risk: Measurement and Effects. Quarterly Journal of Economics 134 (4): 2135-2202.
- Veronesi, P. (1999). Stock market overreactions to bad news in good times: A rational expectations equilibrium model. The Review of Financial Studies, 12(5), 975-1007. [CrossRef]
- Yilmazkuday, H., (2023). Geopolitical risks and energy uncertainty: Implications for global and domestic energy prices, Available at SSRN 4656332. [CrossRef]
- Yilmazkuday, H., (2024). Geopolitical risk and stock prices, European Journal of Political Economy, Volume 83.
Figure 1.
Variables measures.
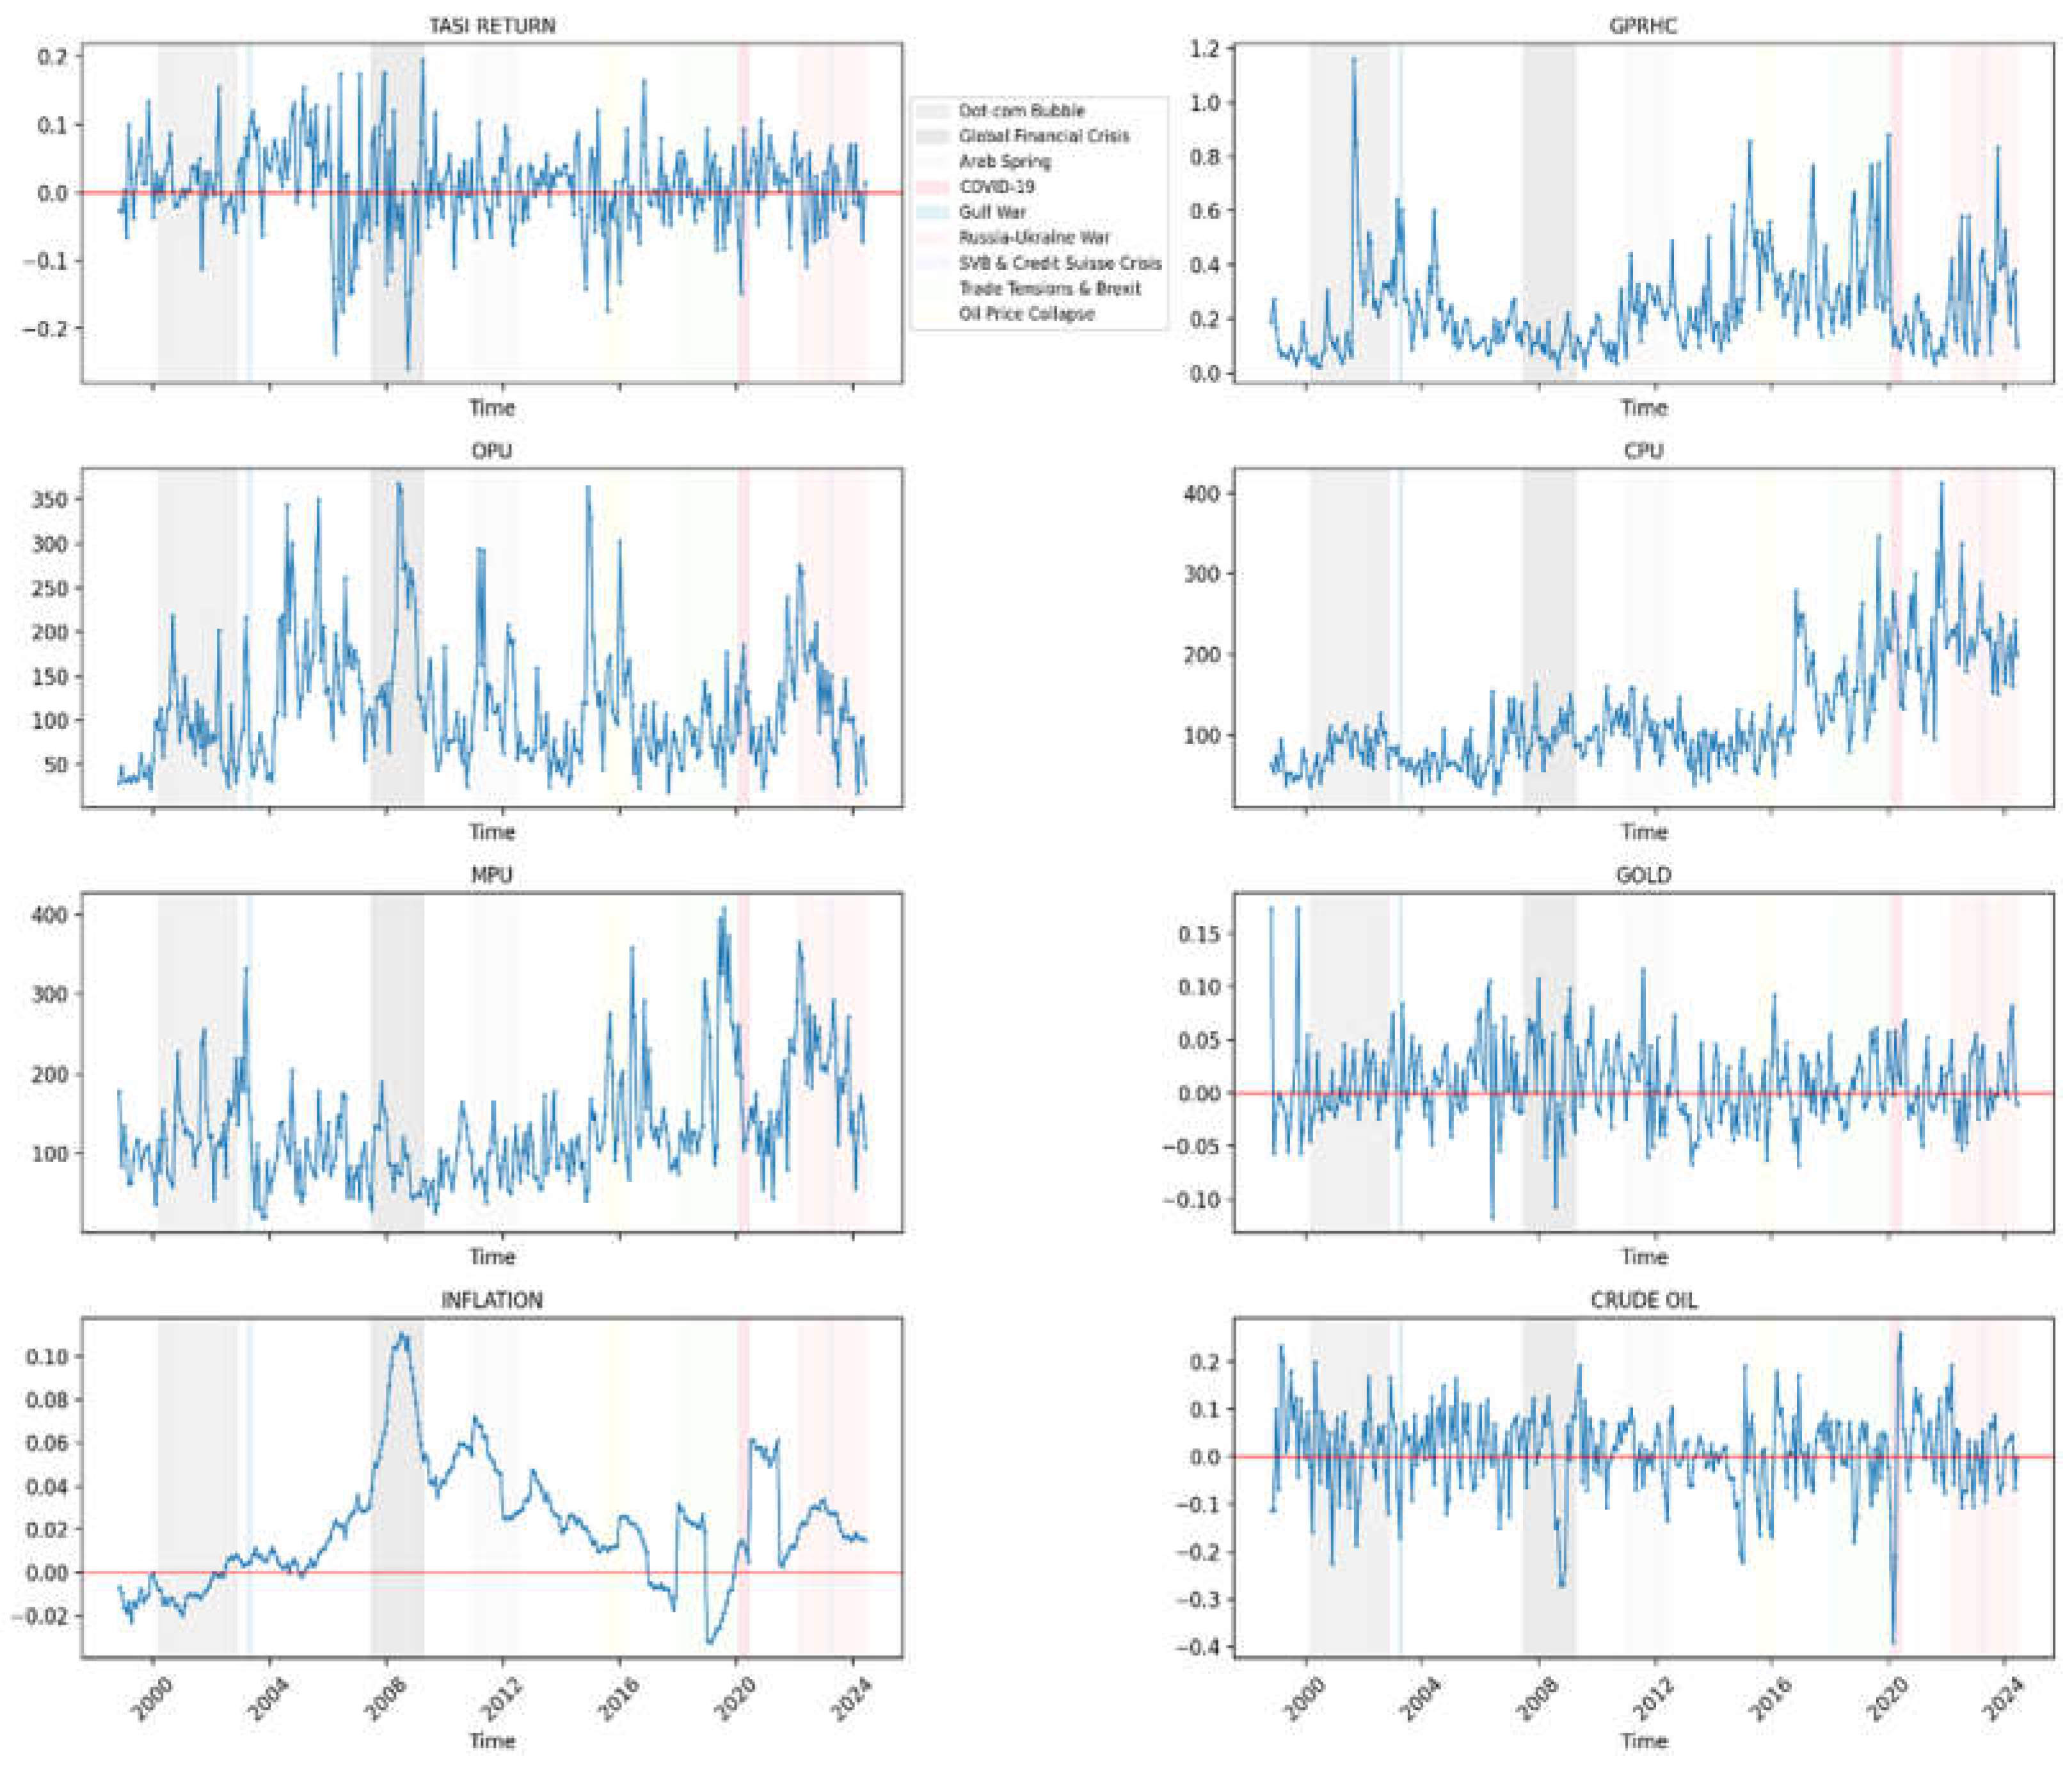
Figure 2.
Correlation heatmap.
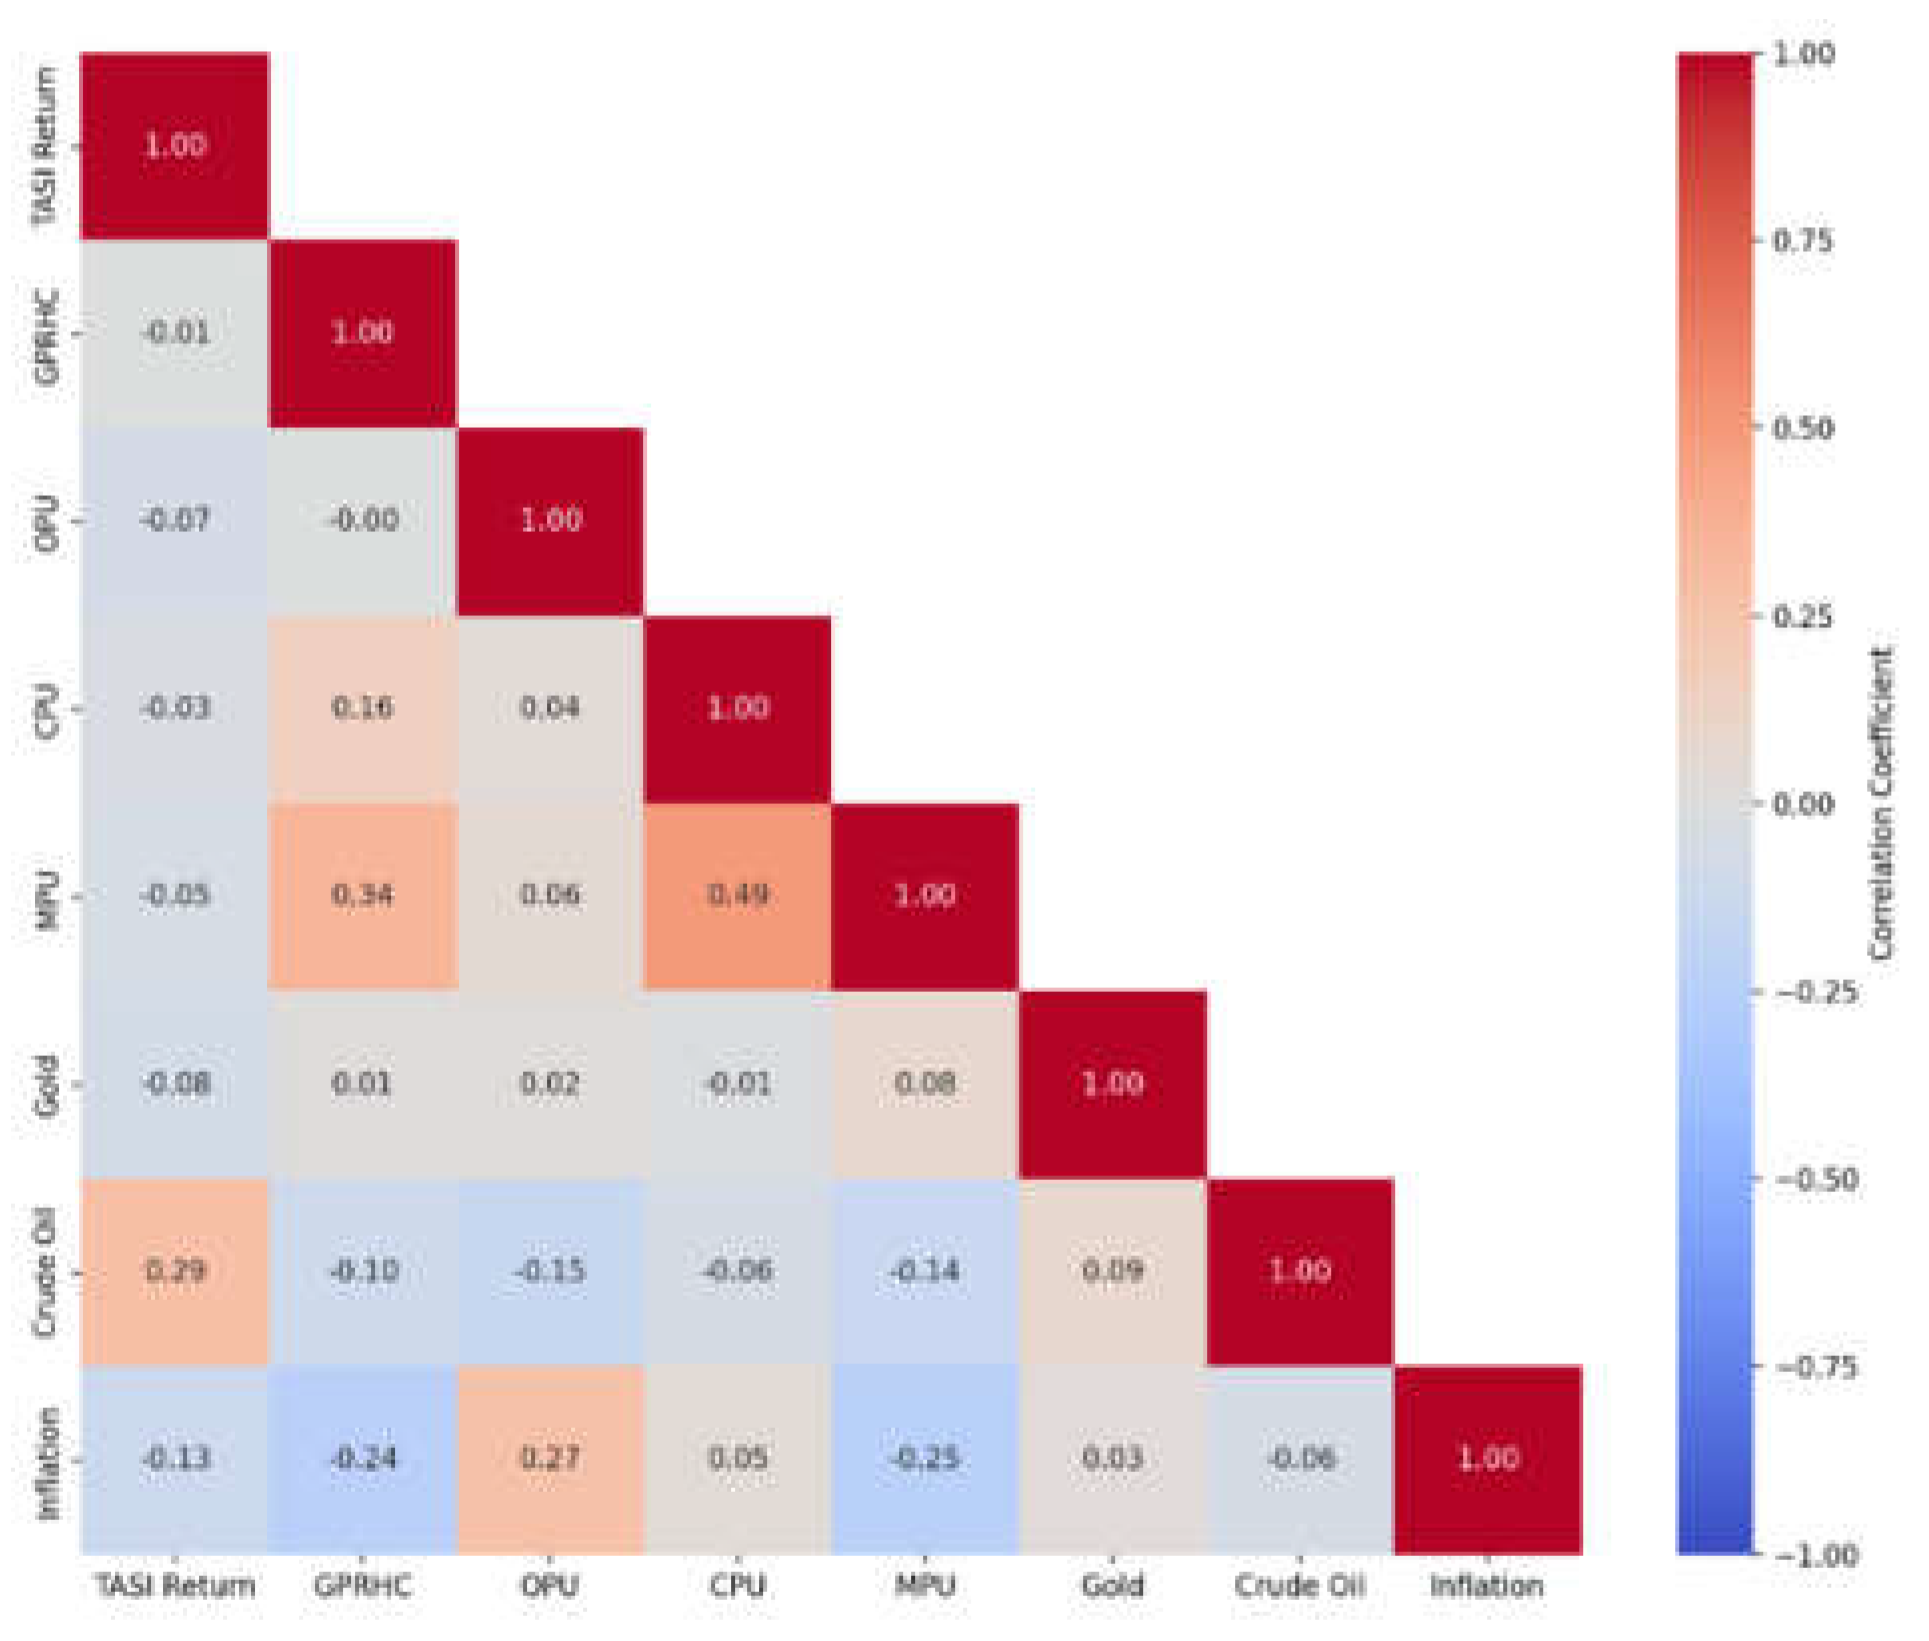
Figure 3.
Graphical and Correlational Dynamics of Saudi Market Returns.
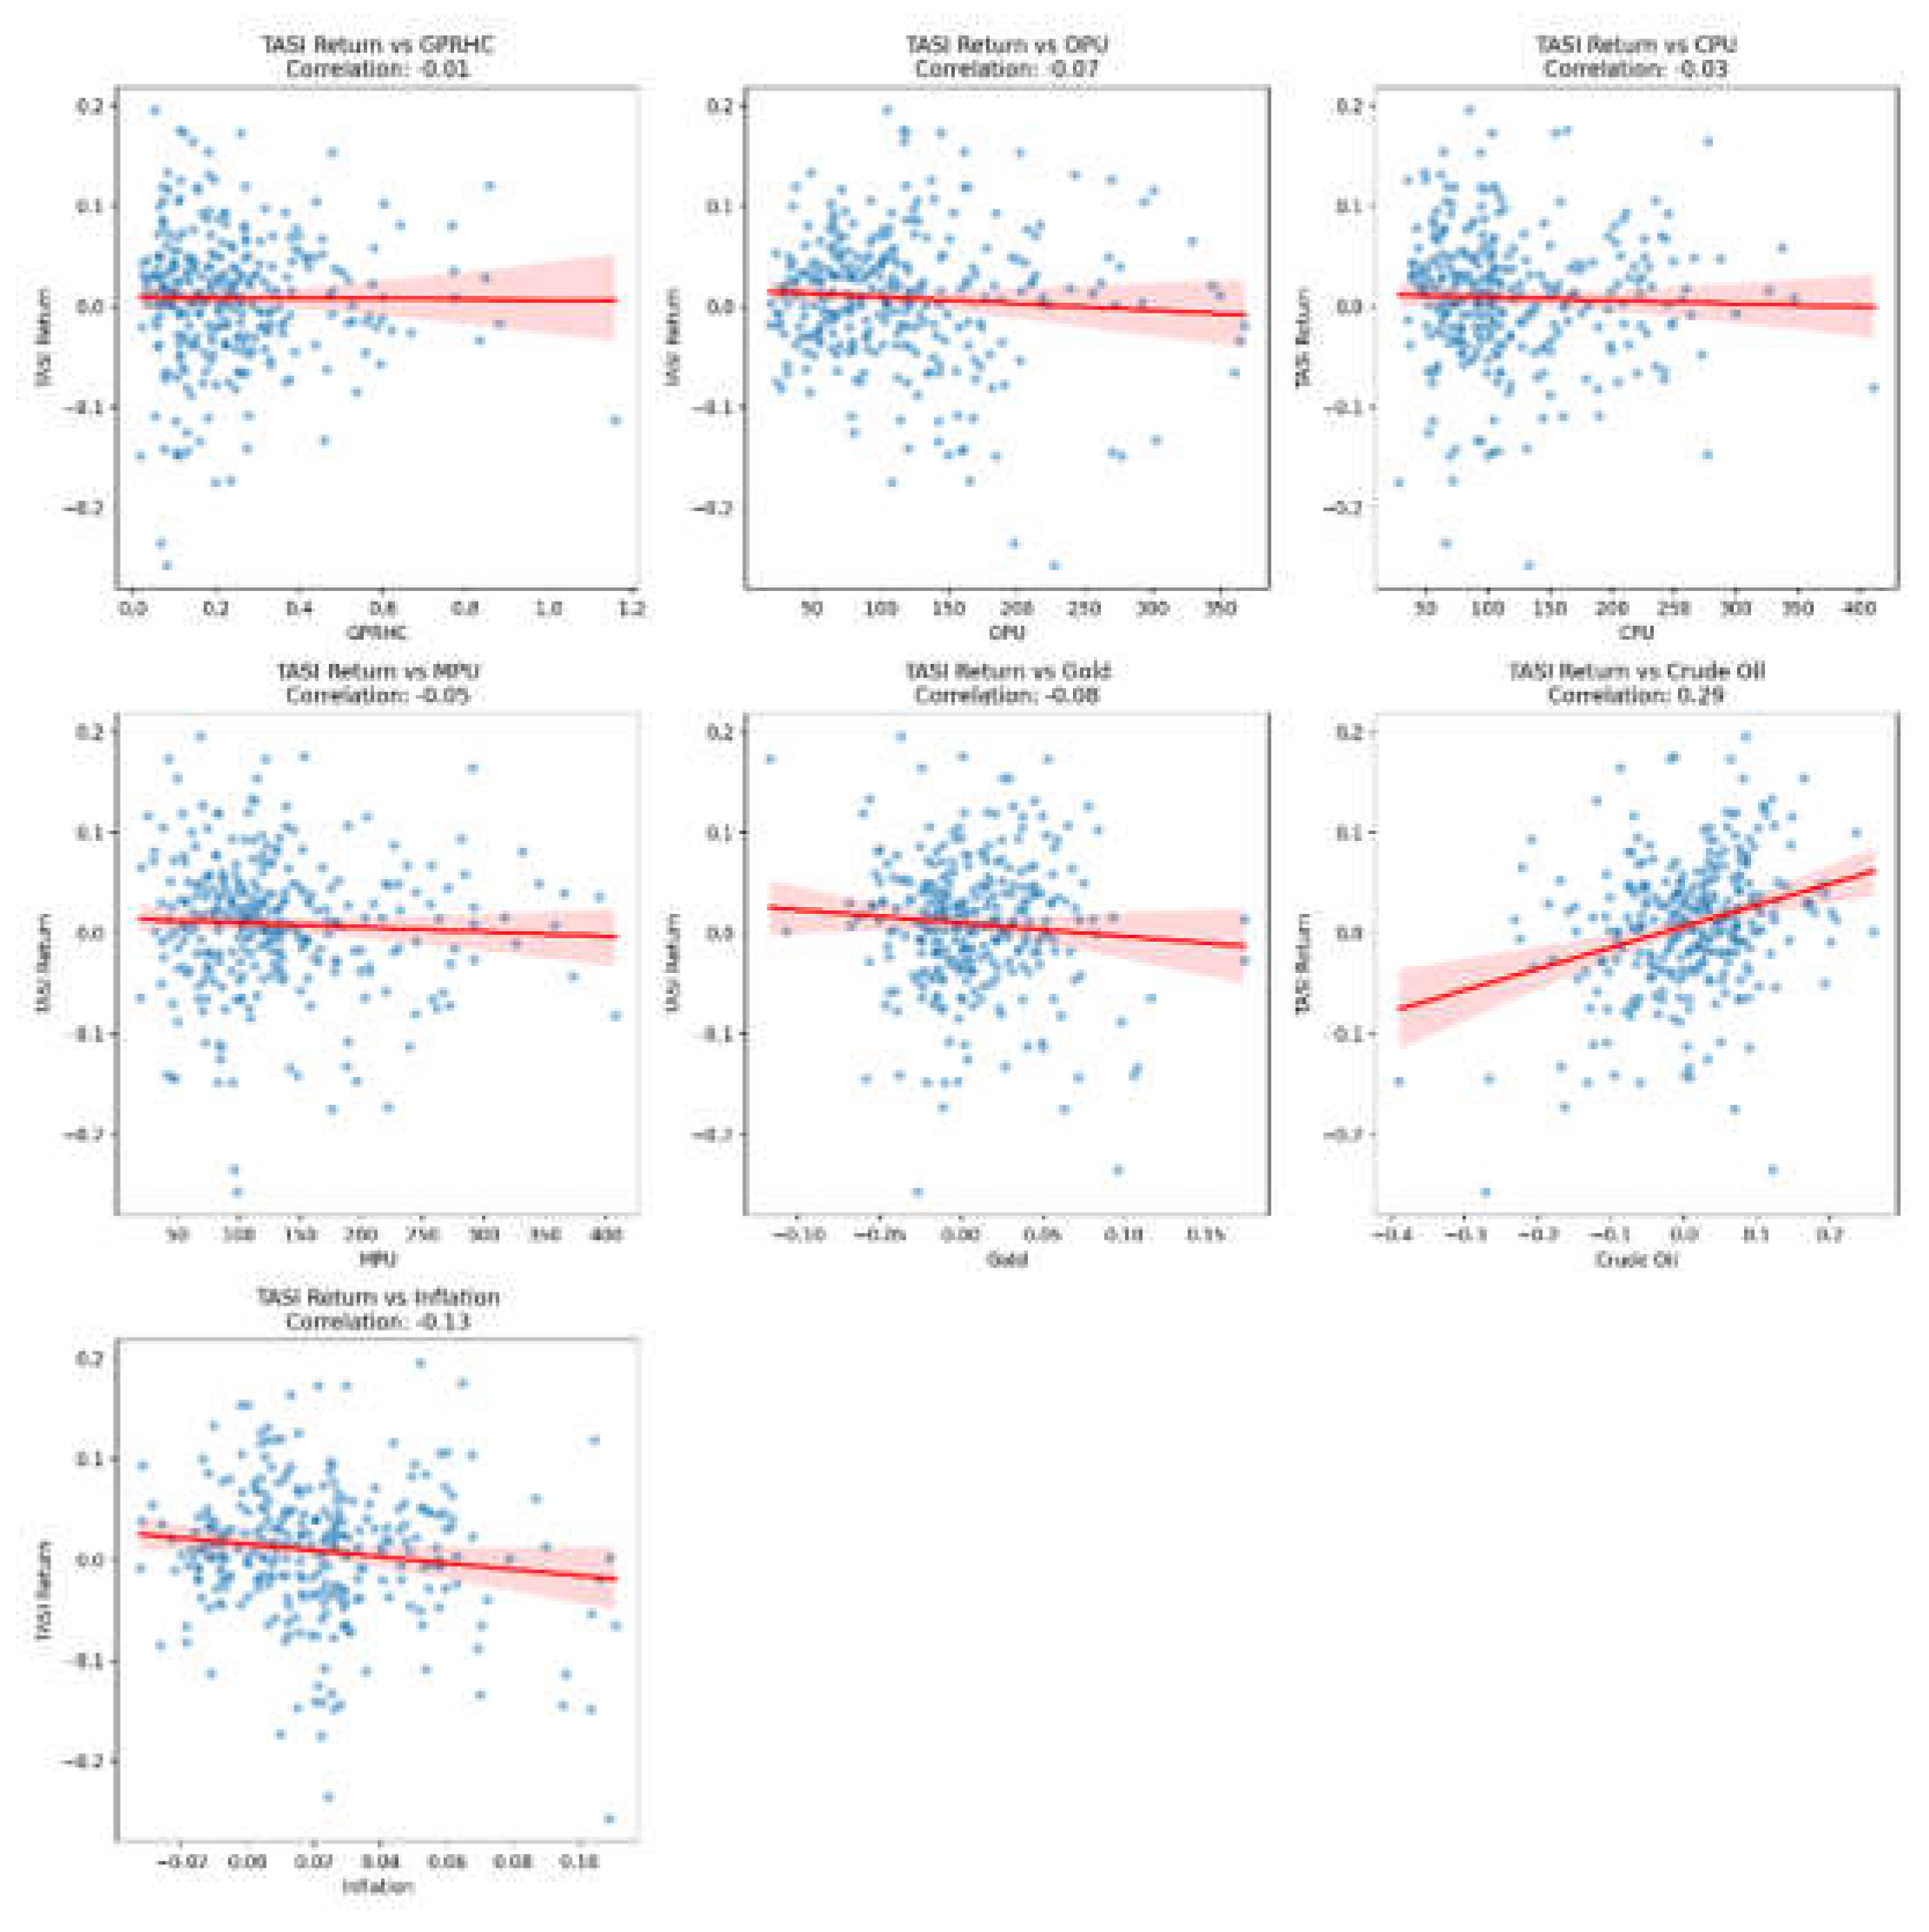
Figure 4.
Local Projections impulse response graph.
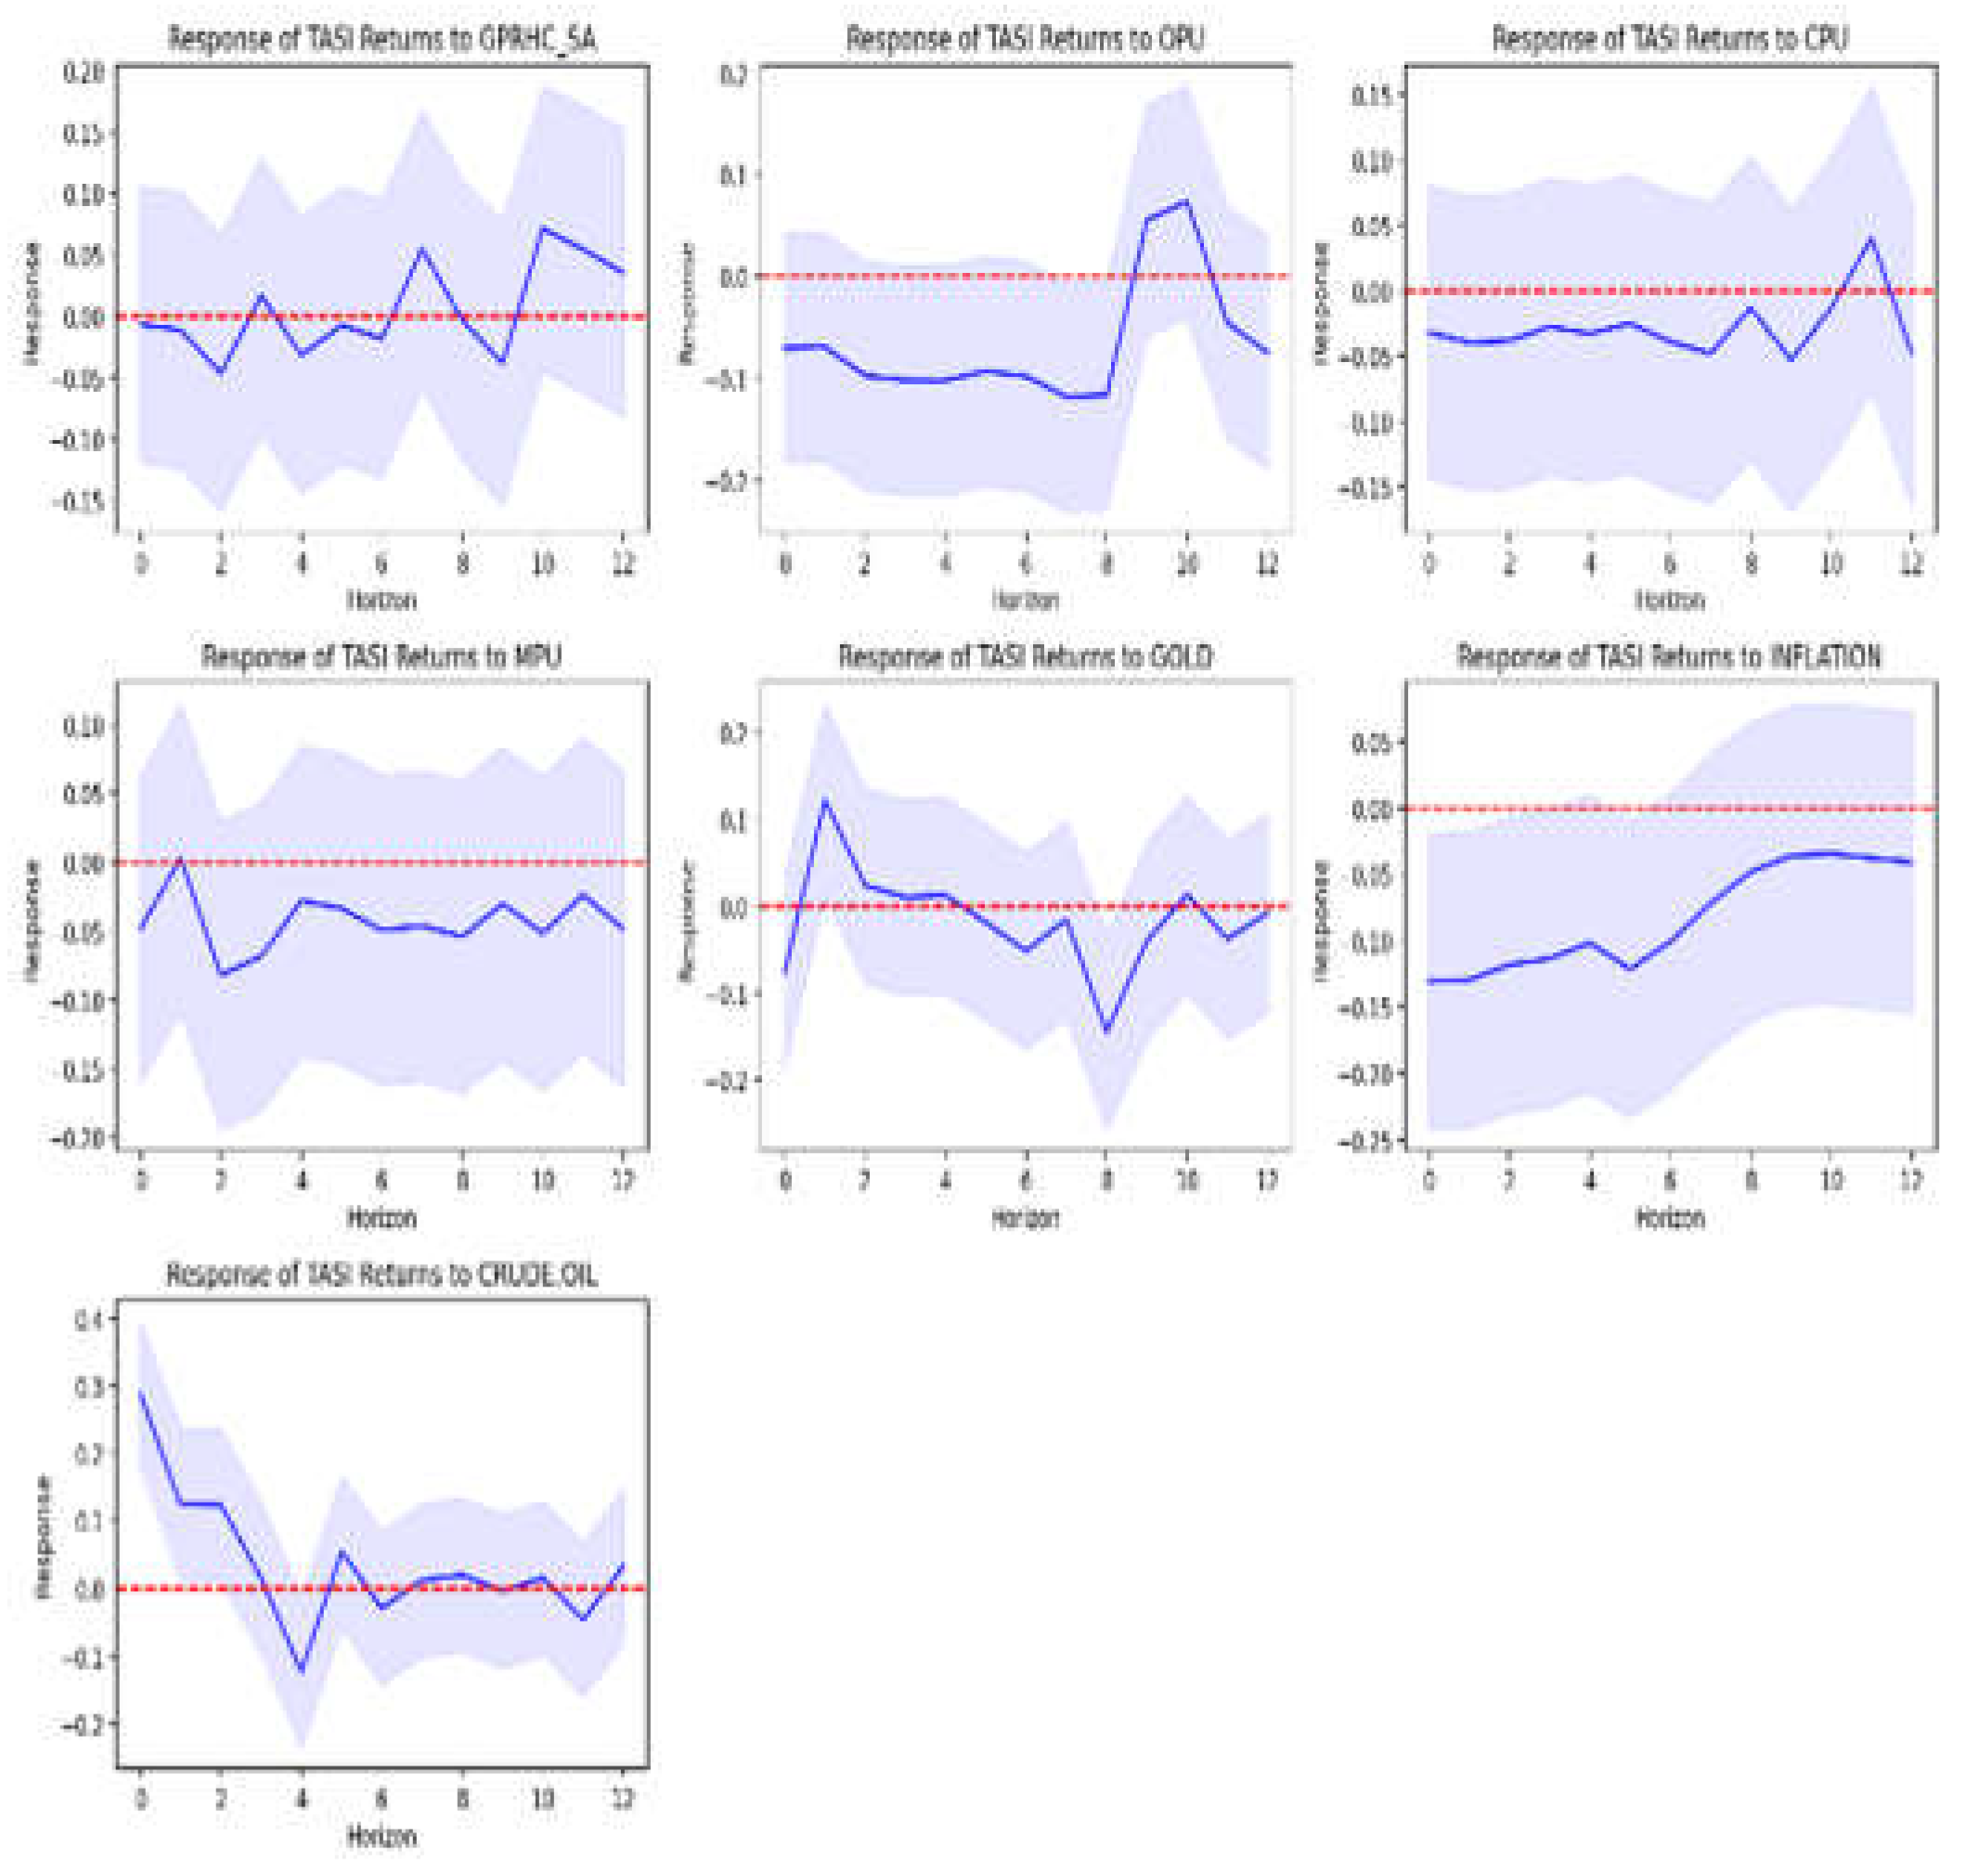
Figure 5.
Local Projections cumulative impulse response graph.
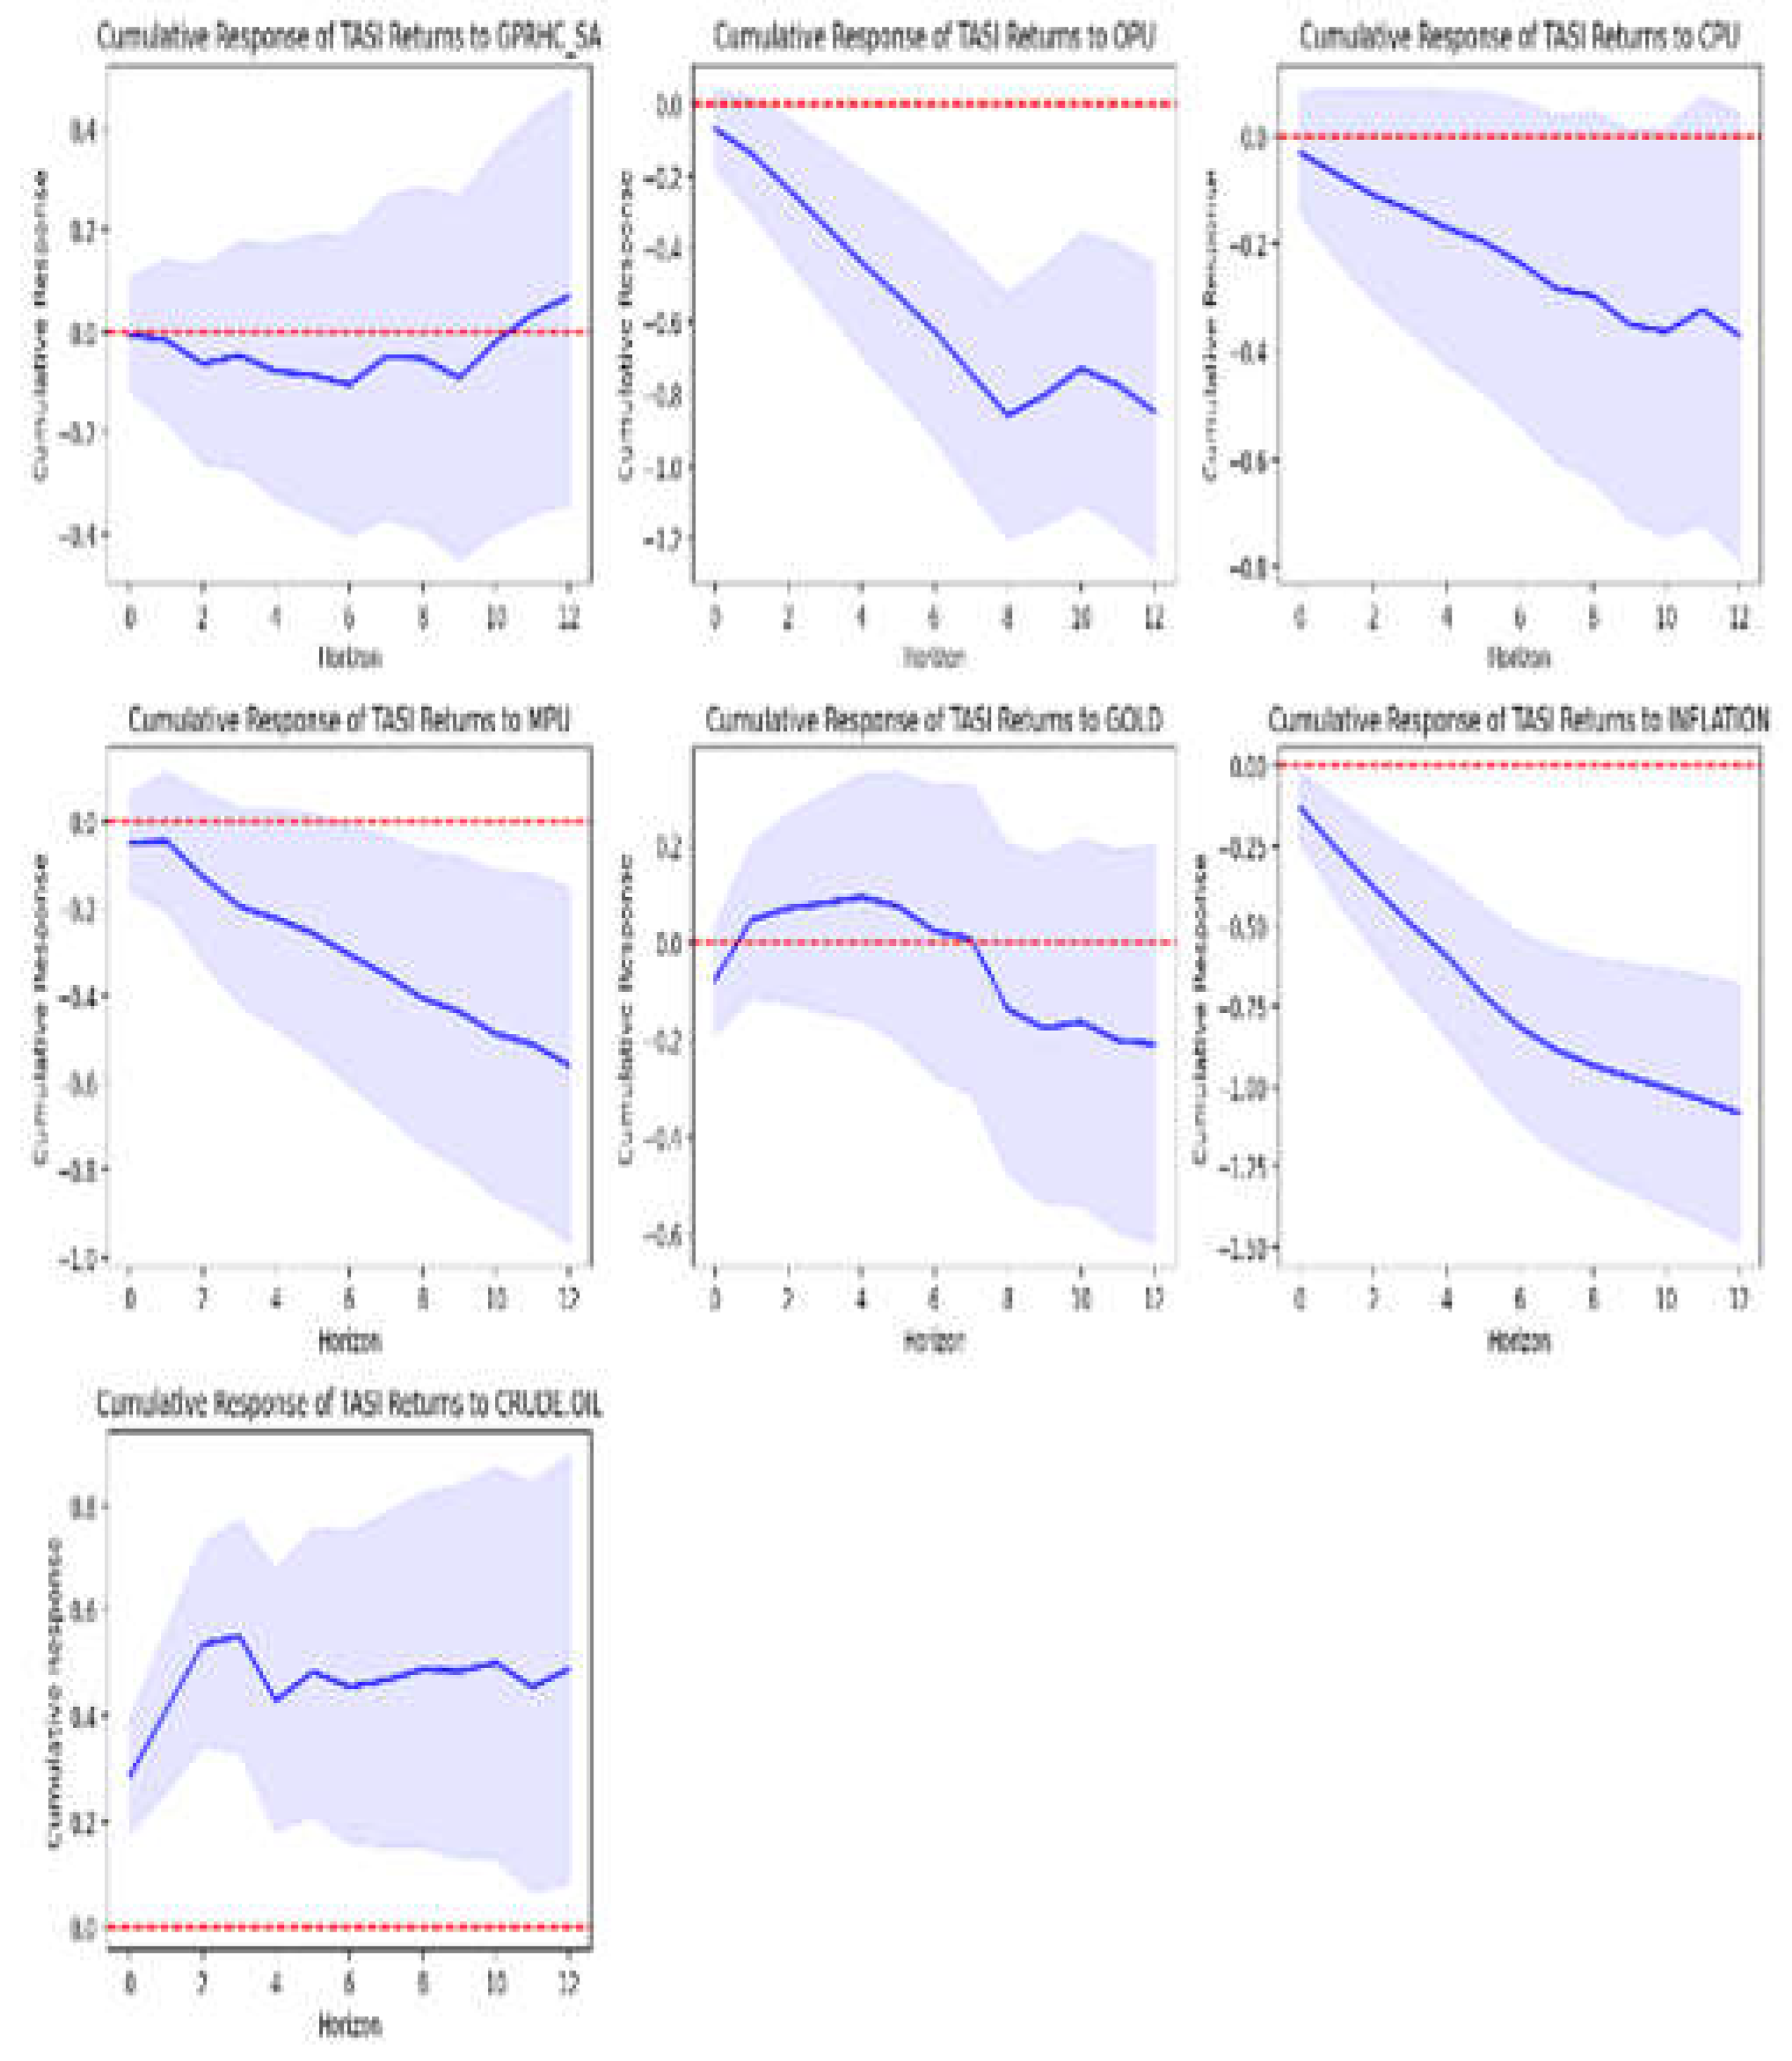
Figure 6.
Subsample Local Projections impulse response graph.
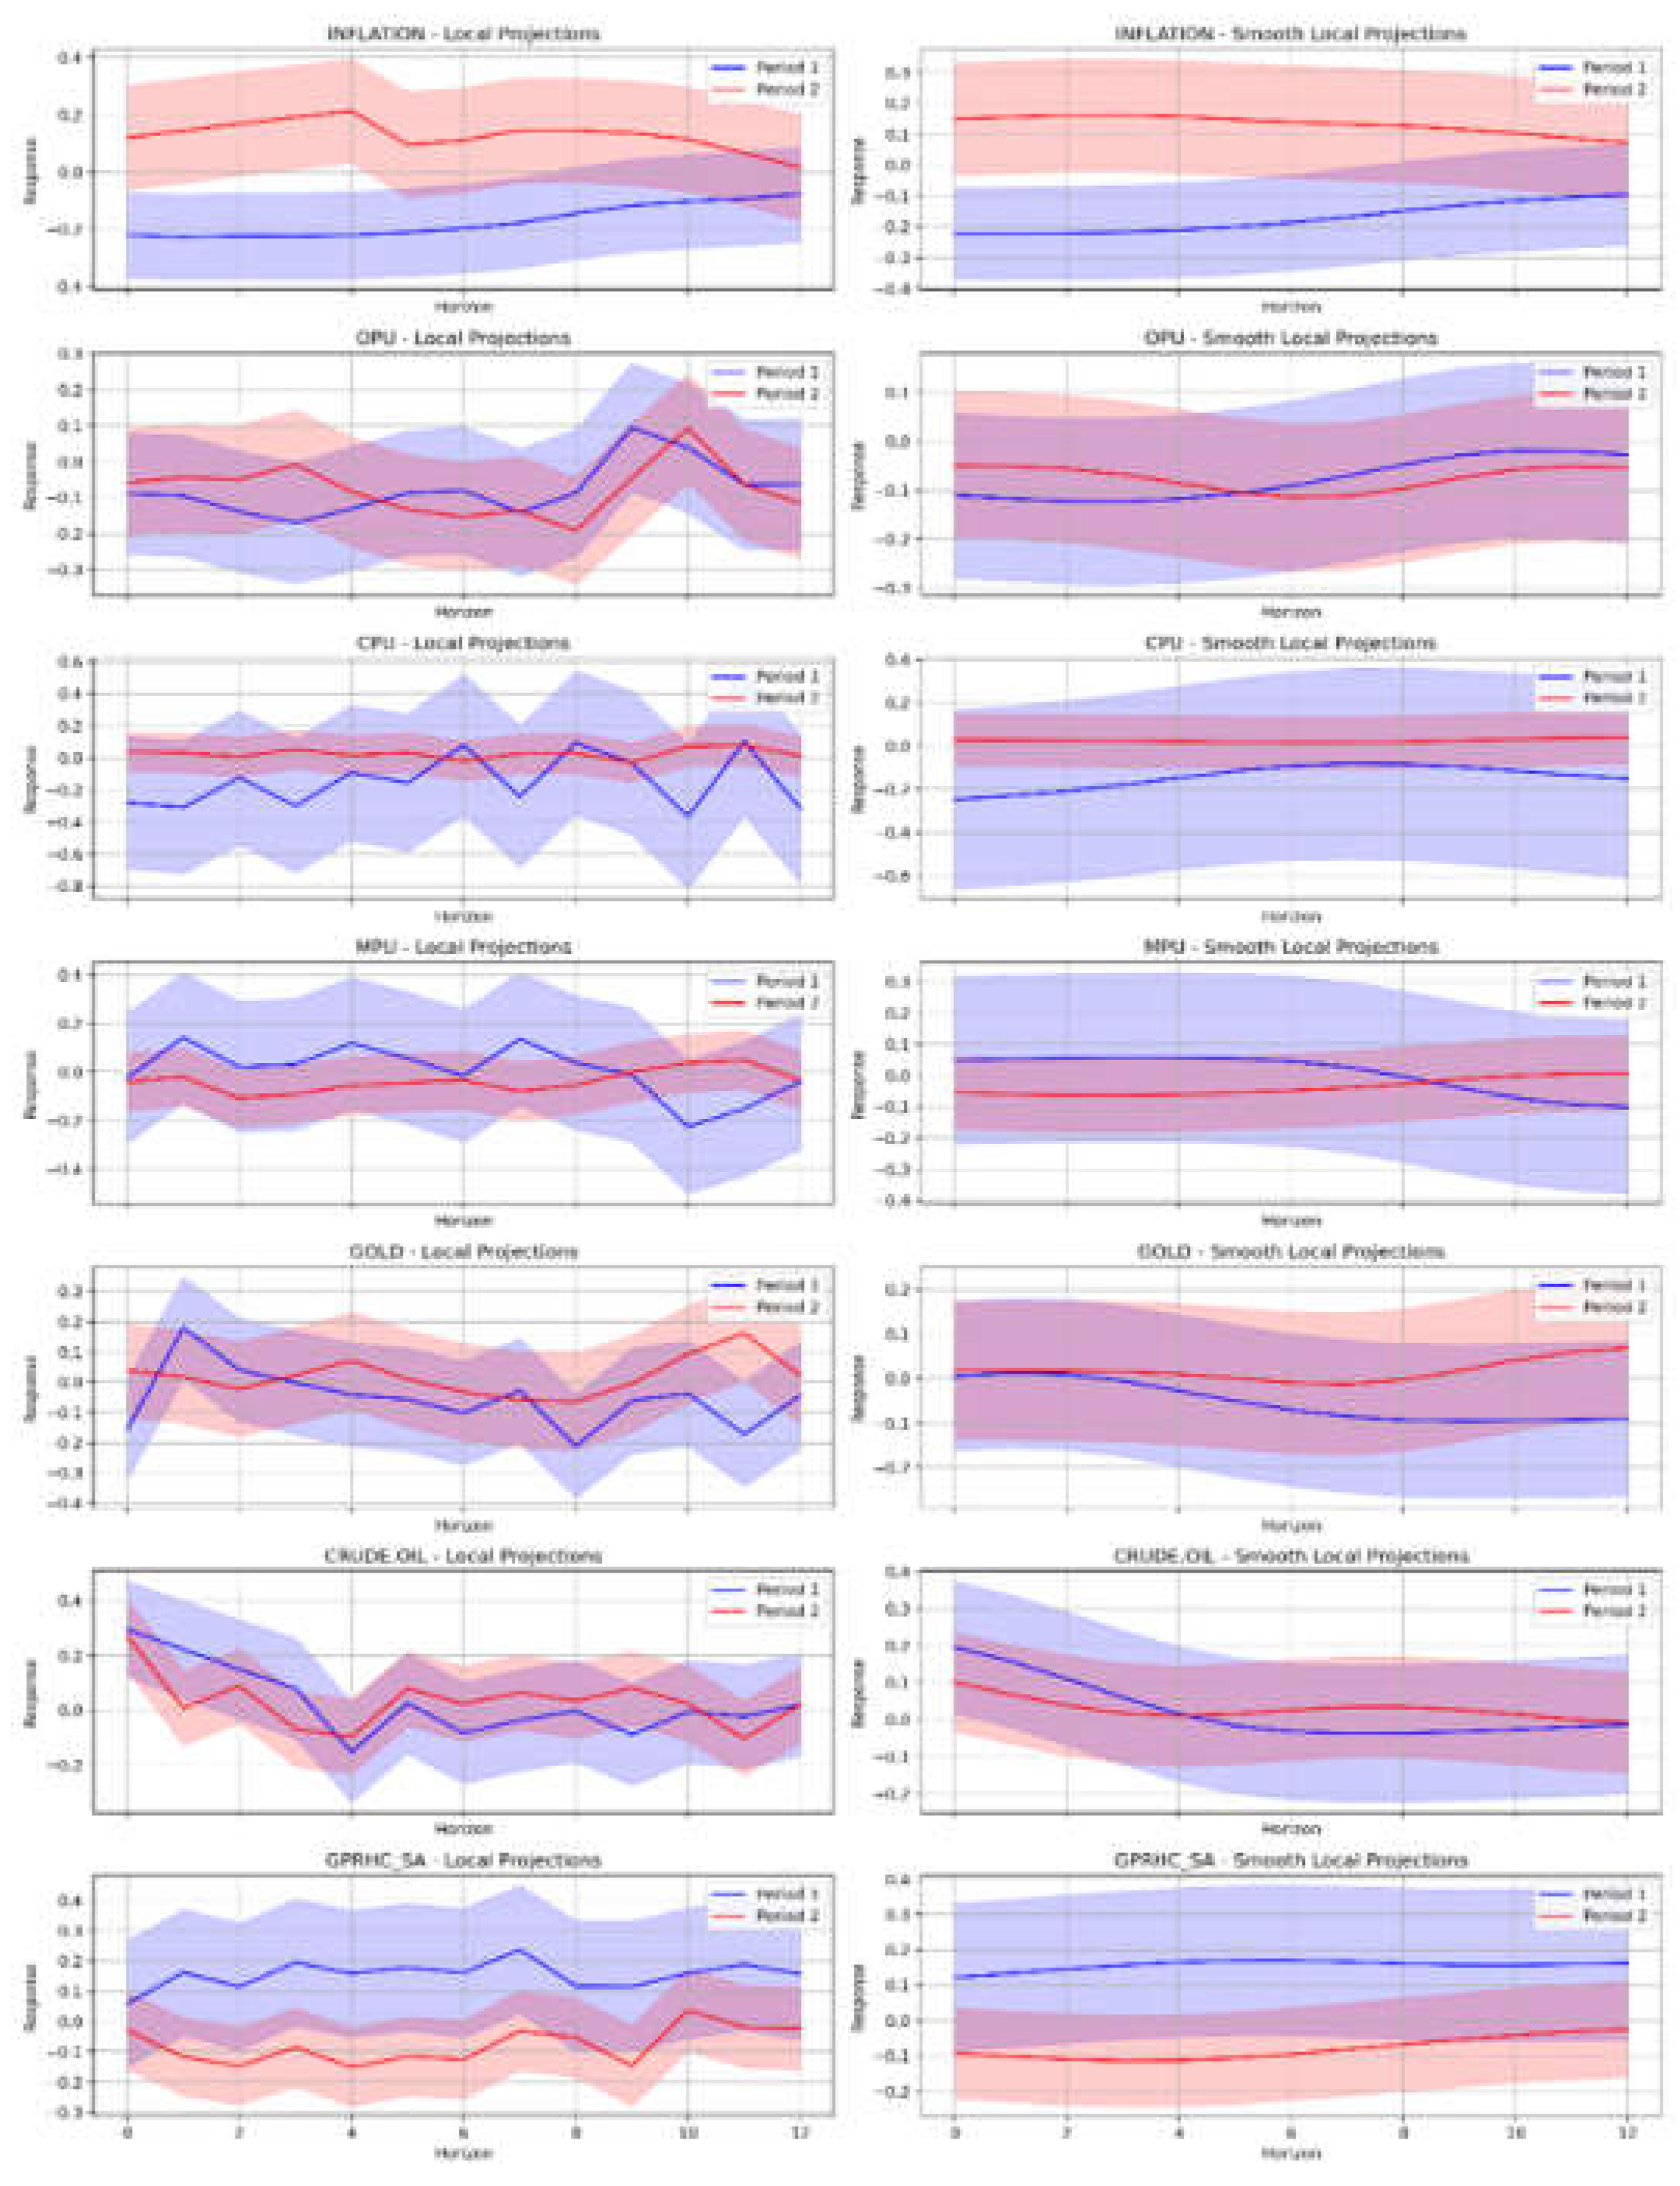
Figure 7.
Subsampled Cumulative Local Projections Impulse Response Graph.
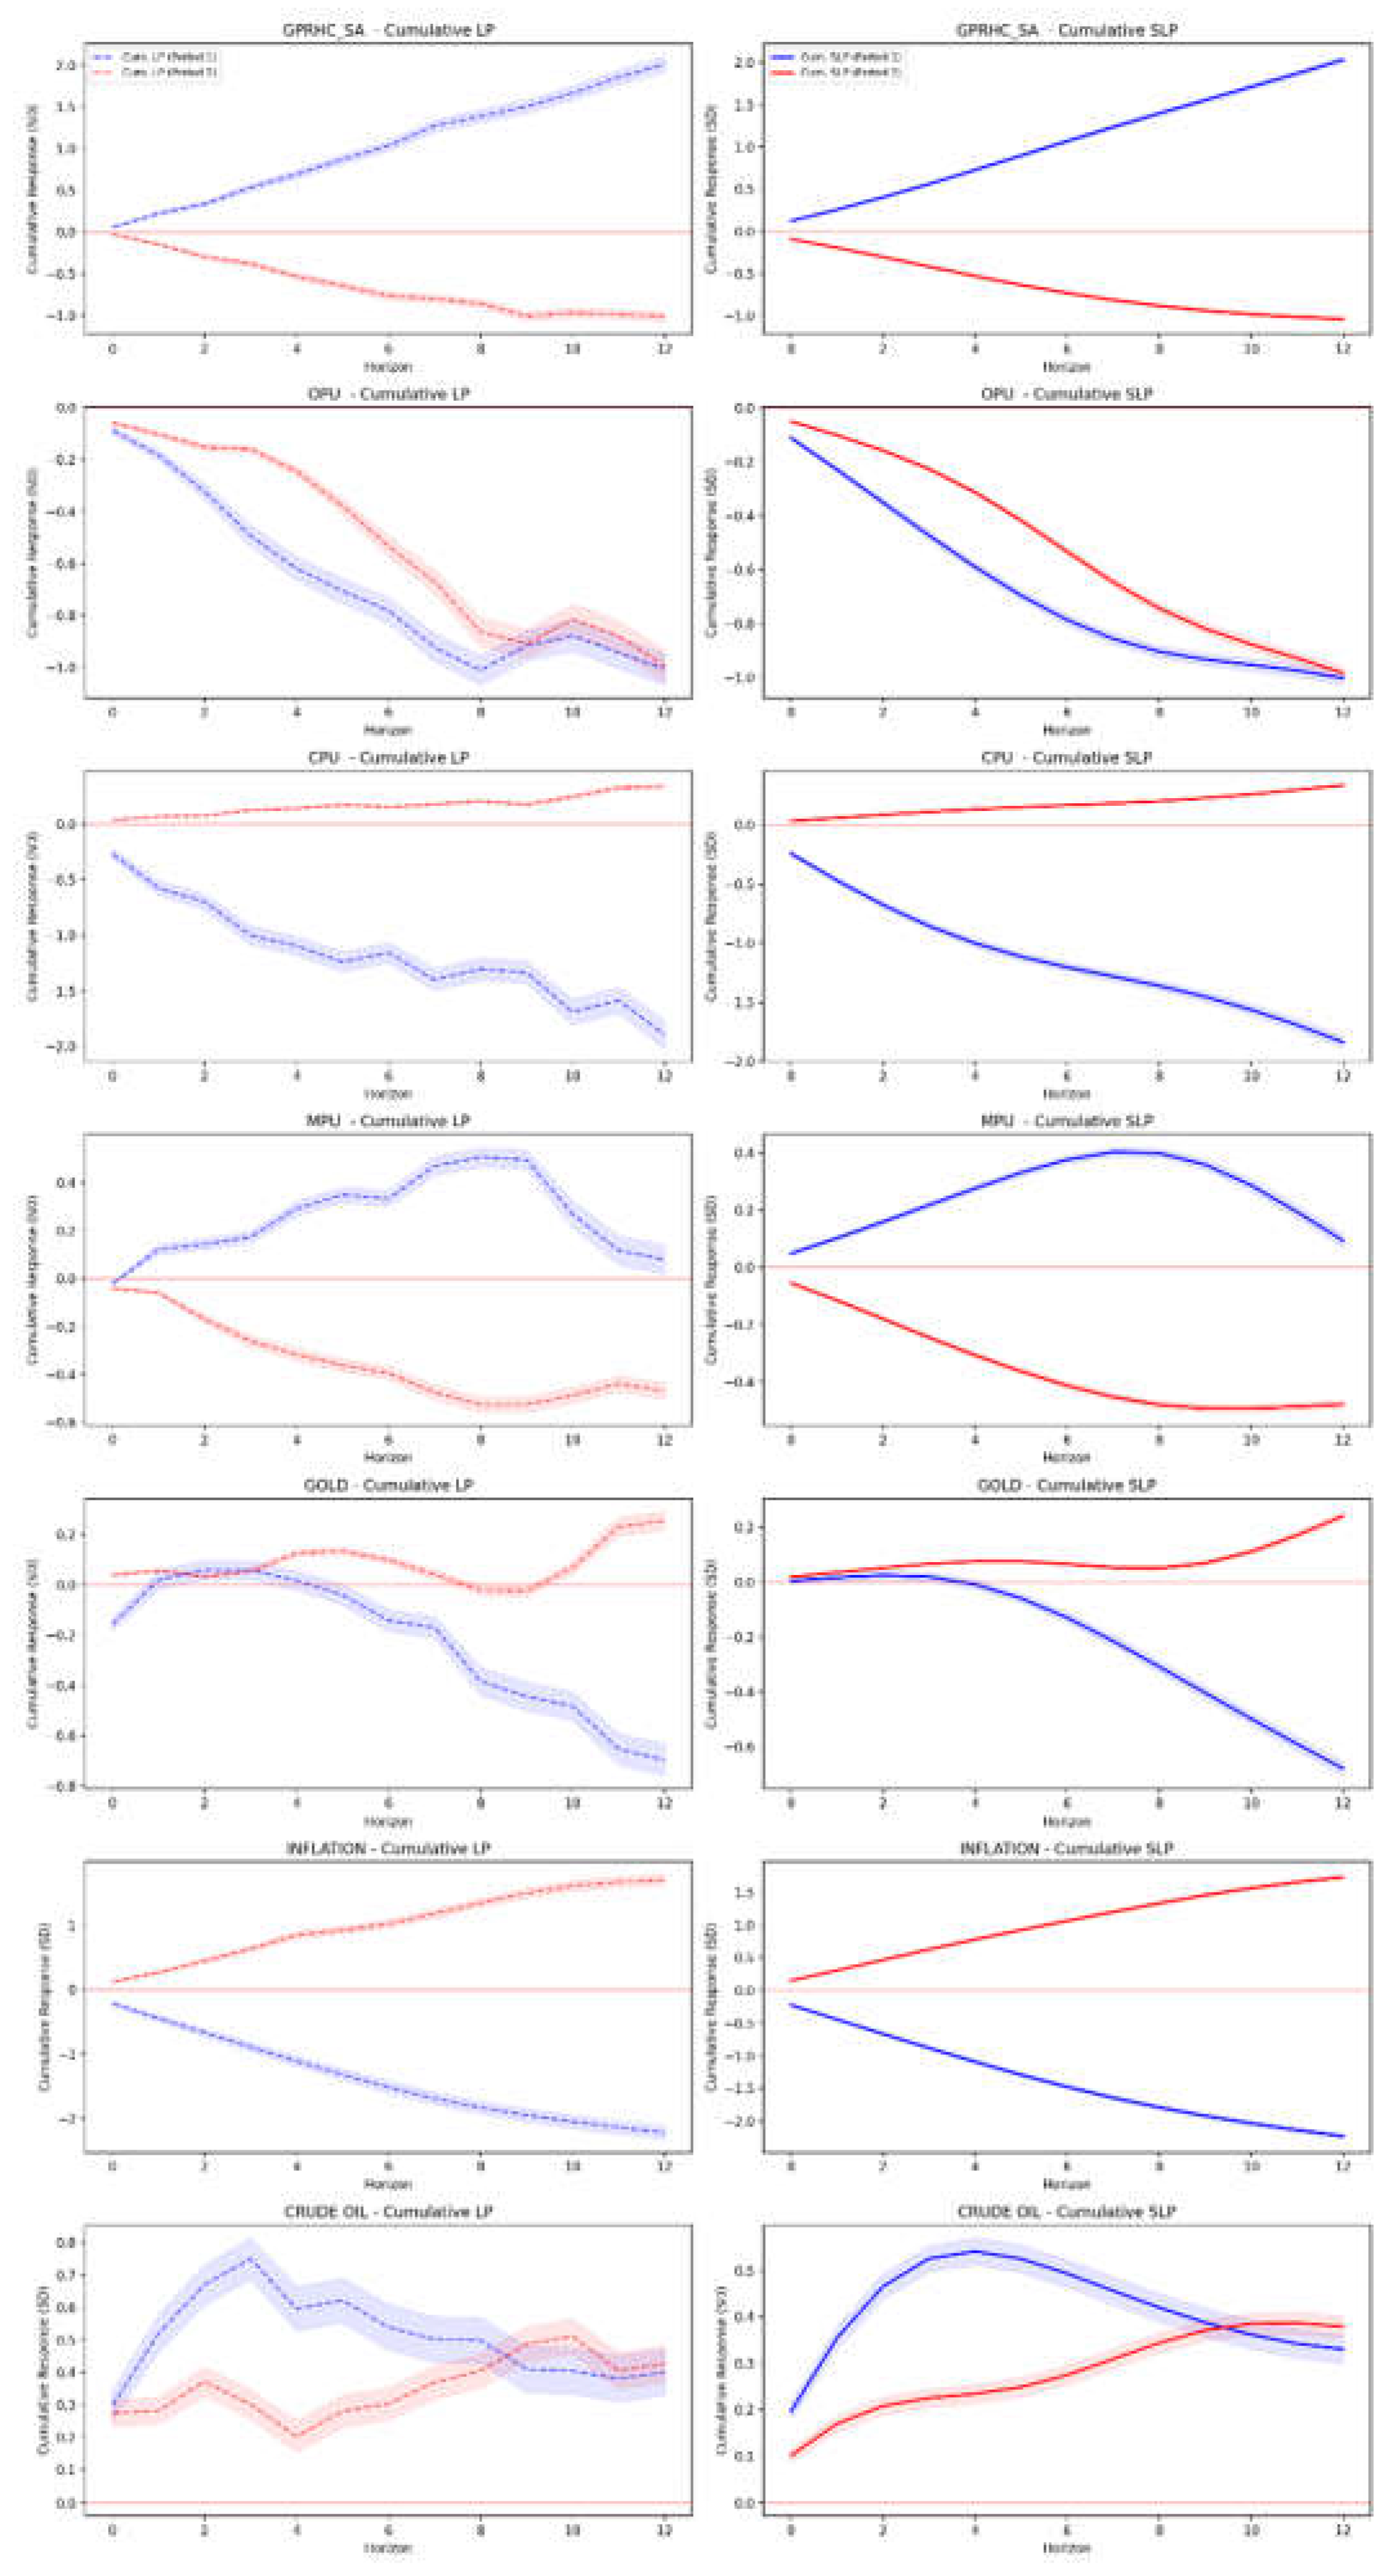
Figure 8.
Time-Varying Parameter Local Projections (TVP-LP) graph.
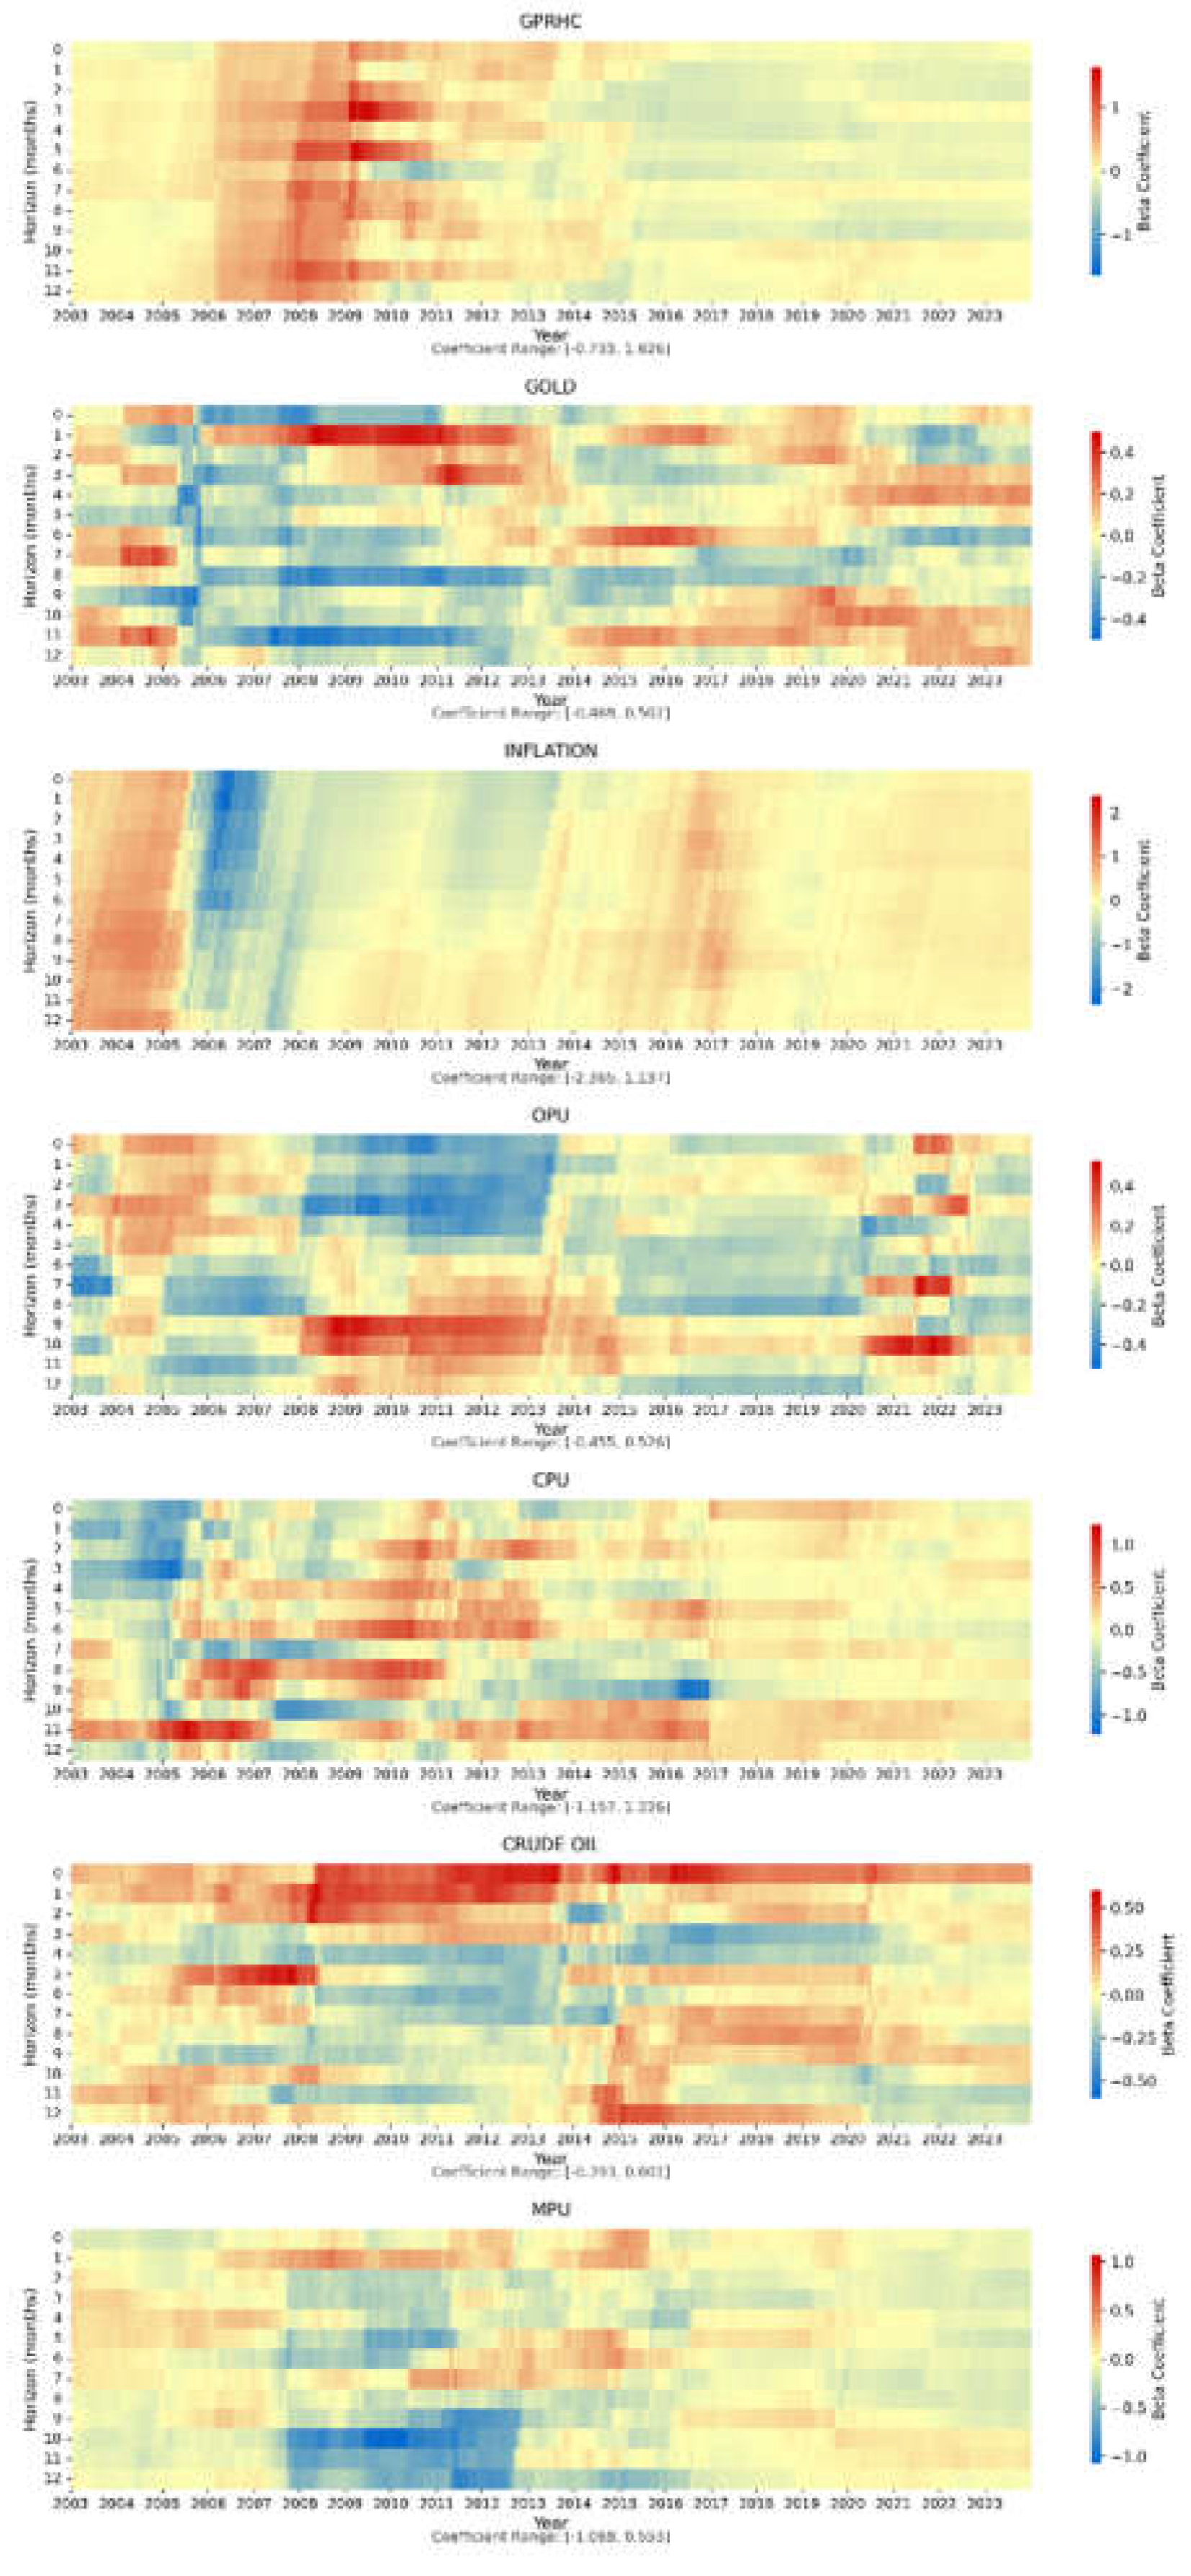
Figure 9.
Wavelet coherence analysis graph.
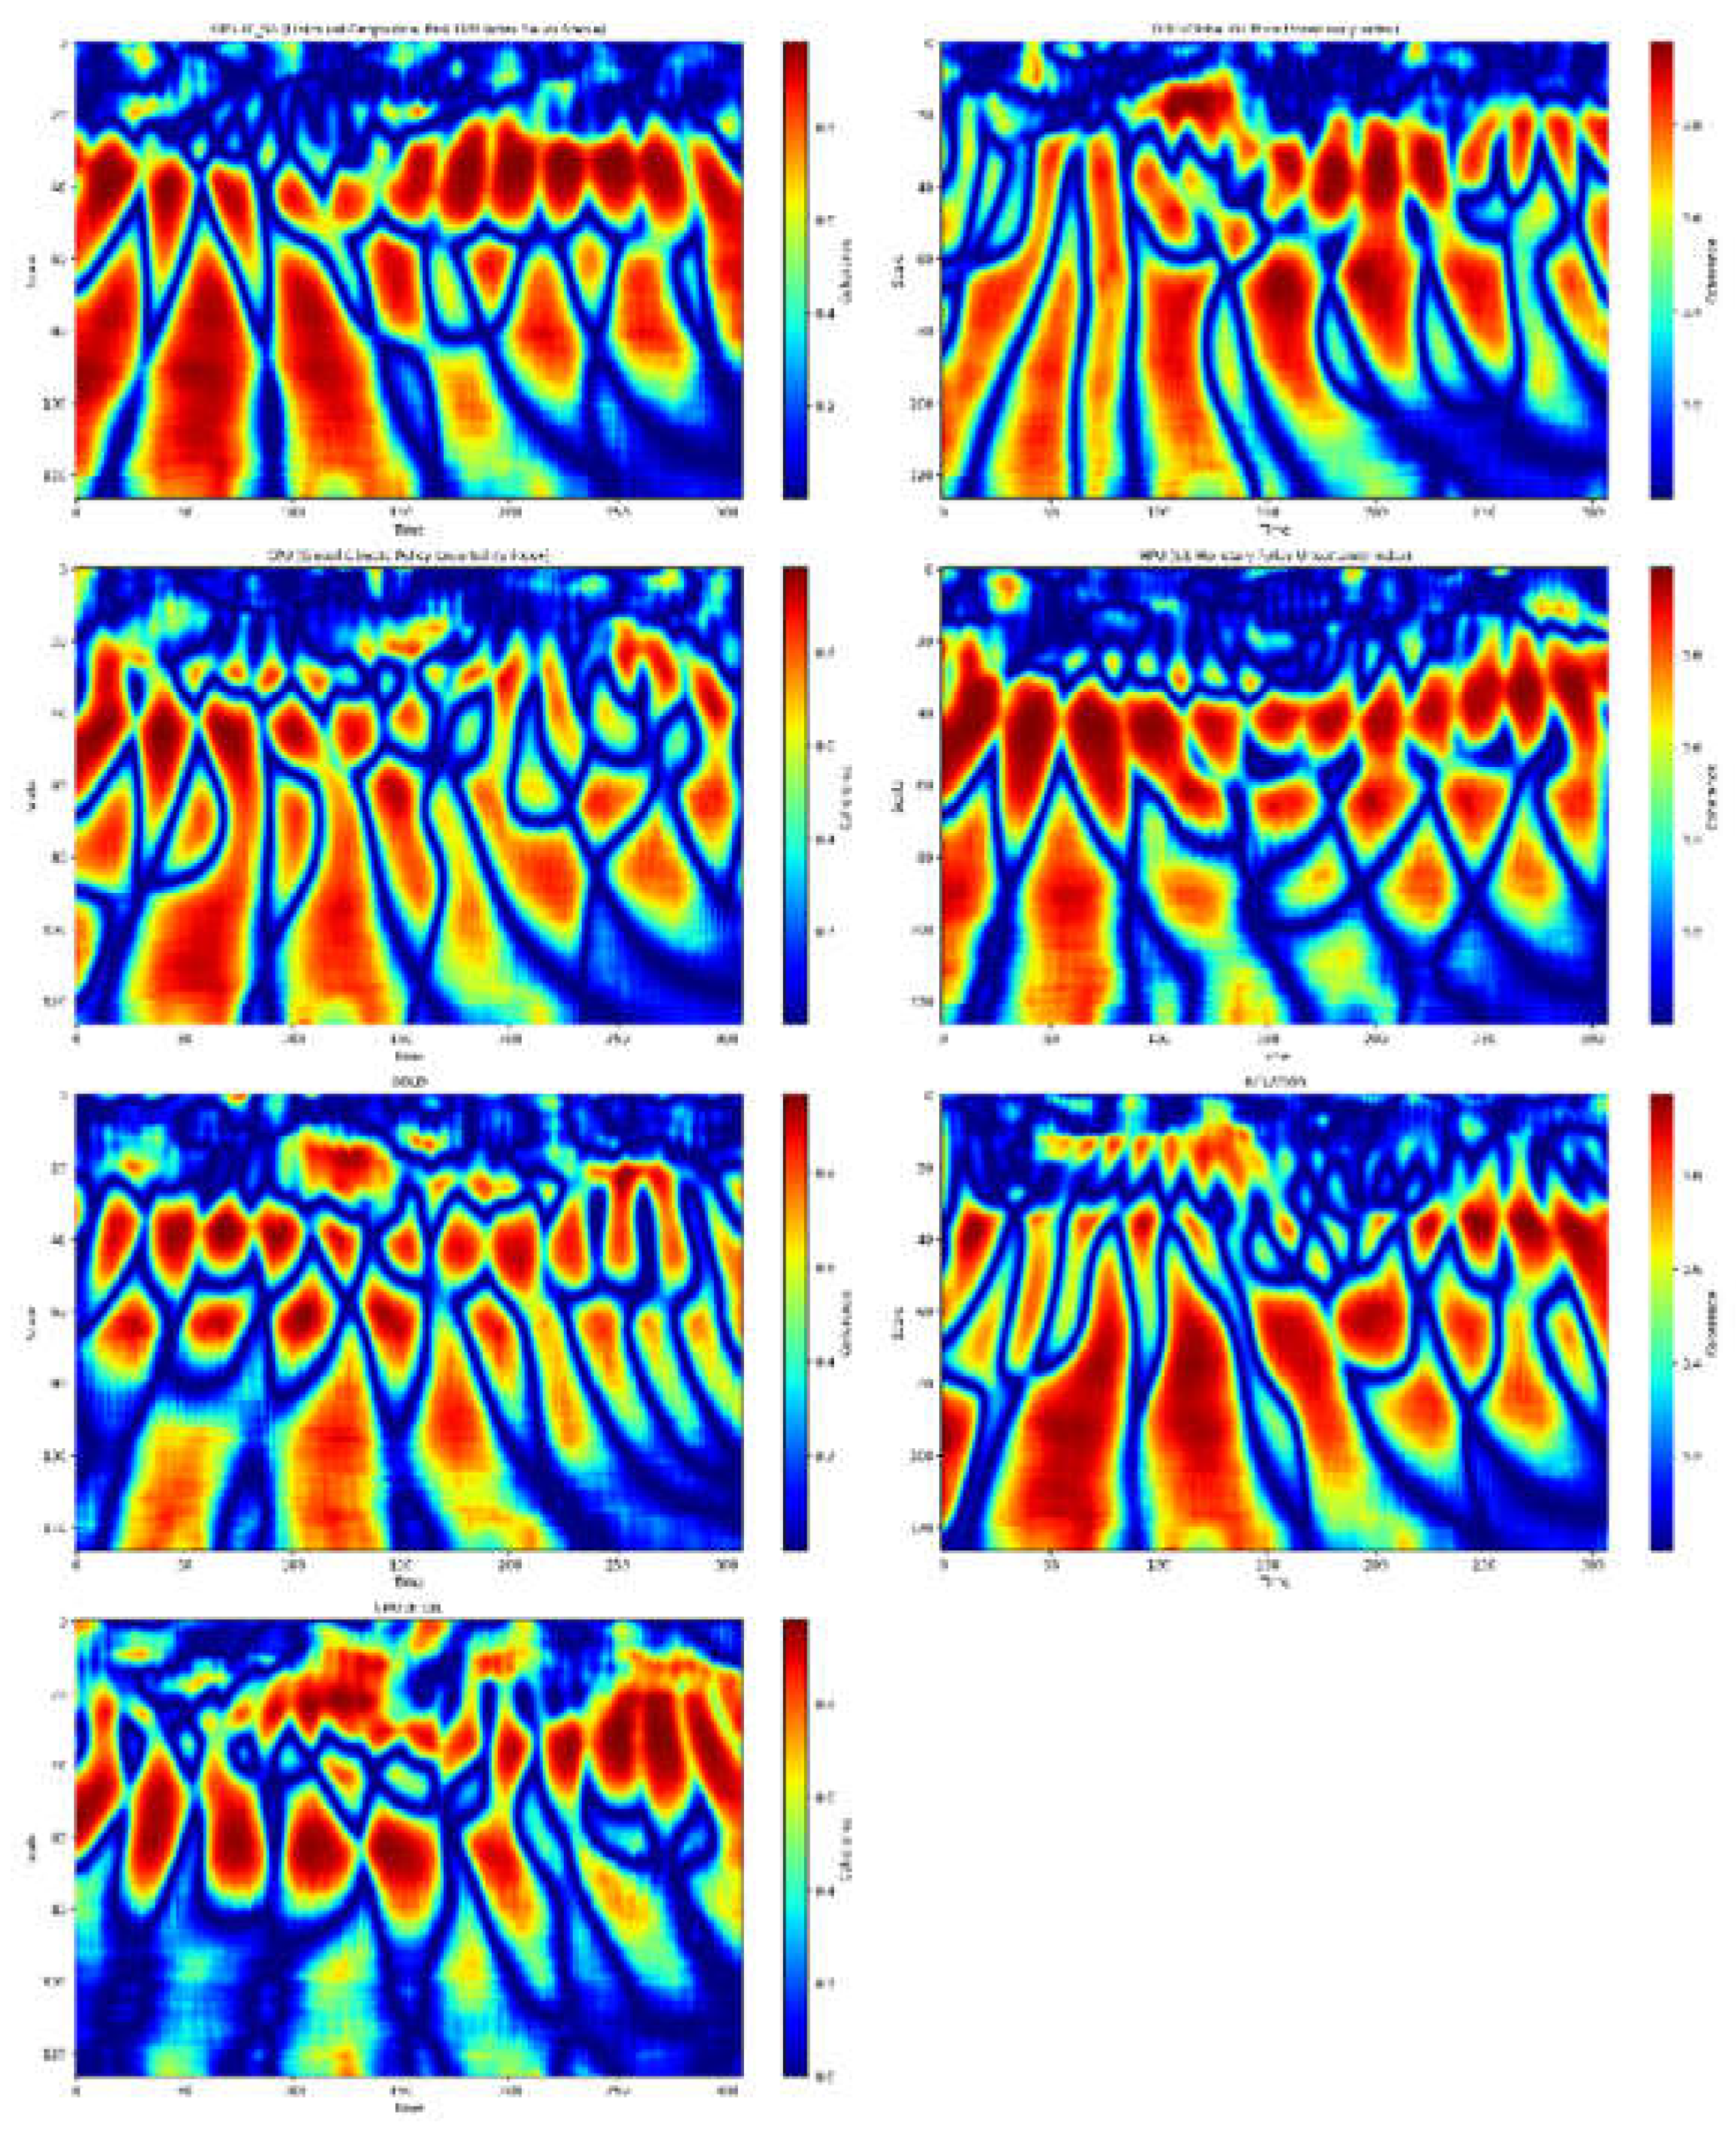
Table 1.
Sample of empirical studies.
| Authors & Year | Country | Period | Methodology | Key Findings |
|---|---|---|---|---|
| Baker et al. (2016). | Global | 1985 – 2015 | Geopolitical Risk Index (GPR), event study, regression analysis | Geopolitical risk negatively affects global stock markets, leading to lower equity returns and higher volatility. |
| Antonakakis et al. (2017). | U.S. | 1985 – 2015 | VAR models, spillover index approach | Geopolitical risks impact U.S. stock returns and heighten cross-market volatility spillovers. Investors tend to seek higher risk premiums during periods of geopolitical tension. |
| Christou et al. (2018). | European Union | 1990 – 2016 | Panel data analysis, GARCH models | Geopolitical risks have a negative impact on EU stock markets, with a more pronounced effect in peripheral economies. Uncertainty amplifies financial contagion across borders. |
| Kang & Ratti (2013). | Emerging Markets | 1996 – 2011 | Dynamic conditional correlation (DCC) GARCH model | Geopolitical events lead to increased correlations among emerging market equities, reducing diversification benefits for international investors. |
| Chen et al. (2020). | China | 2000 – 2019 | Event study, difference-in-differences (DiD) | Geopolitical tensions (e.g., the U.S.-China trade war) negatively impact Chinese stock market performance. Firms exposed to global supply chains experience larger declines. |
| Aastveit et al. (2021). | Global | 1990 – 2020 | Bayesian VAR, local projections | Geopolitical shocks lead to persistent declines in global equity prices, with varying impacts across different regions. Advanced economies are more resilient than emerging markets. |
| Hoque et al. (2022). | Asia-Pacific Region | 2000 – 2021 | Panel regression, quantile regression | Geopolitical risks have asymmetric effects on stock returns; extreme geopolitical events disproportionately harm smaller and less liquid markets. |
| Li & Peng (2023). | BRICS Countries | 2010 – 2022 | Time-varying parameter VAR, wavelet coherence analysis | Geopolitical risks exacerbate stock return volatility in BRICS nations. The impact is time-varying, with greater sensitivity during economic downturns. |
| Yilmazkuday (2024). | 29 economies | 1985 – 2023 | Local projections method | A one-standard-deviation increase in global geopolitical risk reduces stock prices in most economies but increases them in one. Subsample analyses reveal shifting impacts. |
| Balcilar et al. (2016). | South Africa | 1995 – 2014 | Nonlinear ARDL (NARDL), causality tests | Geopolitical risks have asymmetric effects on South African stock returns. Negative geopolitical shocks lead to sharper declines than positive shocks. |
| Alam & Uddin (2020). | GCC Countries | 2001 – 2018 | Panel data analysis, GARCH models | Geopolitical risks significantly reduce stock market returns in GCC countries. Oil price volatility amplifies the negative impact of geopolitical tensions on equity markets. |
| Mensi et al. (2021). | GCC Countries | 2000 – 2020 | Wavelet coherence analysis, quantile regression | Geopolitical risks strongly influence GCC stock markets, with higher impacts during periods of extreme market conditions. Energy-dependent economies are particularly vulnerable. |
| Rjoub et al. (2022). | Turkey | 2003 – 2021 | Quantile-on-quantile (QQ) regression, DCC-GARCH | Geopolitical risks have a negative impact on Turkish stock returns, particularly during periods of high volatility. Political instability exacerbates the adverse effects. |
| Omrane et al. (2020). | MENA Region | 2000 – 2019 | Dynamic conditional correlation (DCC) GARCH, panel VAR | Geopolitical risks increase stock market volatility and reduce returns across MENA countries. Financial contagion spreads more rapidly during periods of heightened geopolitical tension. |
| Ahmad et al. (2023). | Pakistan | 2007 – 2022 | Threshold regression, event study | Geopolitical risks lead to significant declines in Pakistani stock returns. The impact is more pronounced during periods of domestic political instability. |
| Kumar & Dash (2021). | India | 2000 – 2020 | Structural break analysis, GARCH-MIDAS | Geopolitical risks negatively affect Indian stock markets, with structural breaks observed during major global events (e.g., 9/11, Iraq War). |
| Al-Yahyaee et al. (2018). | Oman | 2000 – 2016 | Markov-switching models, GARCH | Geopolitical risks cause regime shifts in Omani stock market volatility. High-risk regimes exhibit lower average returns and higher volatility. |
Table 3.
The Local Projections estimates for the effect on TASI Return.
| Horizon | GPRHC | OPU | CPU | MPU | GOLD | INFLATION | CRUDE OIL |
|---|---|---|---|---|---|---|---|
| h=0 | -0.007 | -0.070 | -0.032 | -0.048 | -0.077 | -0.131** | 0.287*** |
| h=1 | -0.011 | -0.068 | -0.040 | 0.003 | 0.123** | -0.129** | 0.124** |
| h=2 | -0.046 | -0.097* | -0.038 | -0.082 | 0.024 | -0.118** | 0.124** |
| h=3 | 0.017 | -0.101* | -0.028 | -0.068 | 0.010 | -0.113** | 0.016 |
| h=4 | -0.032 | -0.101* | -0.033 | -0.028 | 0.013 | -0.102* | -0.122** |
| h=5 | -0.007 | -0.092 | -0.025 | -0.033 | -0.019 | -0.121** | 0.055 |
| h=6 | -0.018 | -0.097* | -0.039 | -0.049 | -0.051 | -0.101* | -0.029 |
| h=7 | 0.055 | -0.117** | -0.048 | -0.046 | -0.015 | -0.072 | 0.013 |
| h=8 | -0.003 | -0.116** | -0.013 | -0.054 | -0.145** | -0.048 | 0.020 |
| h=9 | -0.038 | 0.056 | -0.053 | -0.030 | -0.040 | -0.036 | -0.004 |
| h=10 | 0.071 | 0.074 | -0.013 | -0.052 | 0.014 | -0.034 | 0.016 |
| h=11 | 0.054 | -0.045 | 0.040 | -0.024 | -0.038 | -0.038 | -0.046 |
| h=12 | 0.035 | -0.074 | -0.048 | -0.049 | -0.008 | -0.041 | 0.034 |
Significance: ∗ for p<0.1, ∗∗ for p<0.05, and ∗∗∗ for p<0.01.
Table 4.
Statistical Significance of Effects Across Horizons for All Variables.
| Variable | Immediate (h=0) | Short-term (h=1-4) | Medium-term (h=5-8) | Long-term (h=9-12) |
|---|---|---|---|---|
| Crude Oil | 0.287*** | 0.124** | -0.122** | 0.034 |
| Inflation | -0.131** | -0.129** | -0.121** | -0.041 |
| OPU | -0.070 | -0.101* | -0.117** | -0.074 |
| Gold | -0.077 | 0.123** | -0.145** | -0.008 |
| GPRHC | -0.007 | -0.005 | 0.010 | 0.015 |
| CPU | -0.032 | -0.035 | -0.028 | -0.030 |
| MPU | -0.048 | -0.050 | -0.045 | -0.047 |
Significance: ∗ for p<0.1, ∗∗ for p<0.05, and ∗∗∗ for p<0.01.
Table 5.
Summary of Effects.
| Factor | Key Finding |
|---|---|
| Oil Price Effect | Strong immediate positive effect (0.287***) |
| Inflation Impact | Persistent negative effects (-0.131** to -0.101*) |
| OPU | Delayed significant impact (-0.117** at h=7,8) |
| Gold Response | Mixed effect: positive short-term, negative medium-term |
| GPRHC | Subdued responses with minor fluctuations |
| CPU | Consistent minor negative effects |
| MPU | Minor negative impact across horizons |
Table 6.
The Local Projections estimates for the effect on TASI Return (First Subperiod).
| Horizon | GPRHC | OPU | CPU | MPU | GOLD | INFLATION | CRUDE OIL |
|---|---|---|---|---|---|---|---|
| h=0 | 0.059 | -0.088 | -0.279 | -0.0240 | -0.156* | -0.219*** | 0.296*** |
| h=1 | 0.162 | -0.095 | -0.309 | 0.1419 | 0.180** | -0.228*** | 0.222** |
| h=2 | 0.115 | -0.139 | -0.123 | 0.0214 | 0.040 | -0.223*** | 0.148 |
| h=3 | 0.195* | -0.169** | -0.300 | 0.0323 | -0.001 | -0.224*** | 0.080 |
| h=4 | 0.158 | -0.131 | -0.093 | 0.1190 | -0.041 | -0.221*** | -0.153* |
| h=5 | 0.179* | -0.087 | -0.156 | 0.0578 | -0.057 | -0.210*** | 0.025 |
| h=6 | 0.161 | -0.079 | 0.080 | -0.0148 | -0.102 | -0.198** | -0.083 |
| h=7 | 0.237** | -0.141 | -0.243 | 0.1366 | -0.028 | -0.178** | -0.037 |
| h=8 | 0.117 | -0.087 | 0.093 | 0.0380 | -0.212** | -0.144* | -0.003 |
| h=9 | 0.116 | 0.095 | -0.032 | -0.0112 | -0.061 | -0.117 | -0.089 |
| h=10 | 0.159 | 0.038 | -0.366 | -0.2249 | -0.038 | -0.103 | -0.006 |
| h=11 | 0.188* | -0.064 | 0.100 | -0.1510 | -0.172* | -0.092 | -0.023 |
| h=12 | 0.157 | -0.062 | -0.315 | -0.0397 | -0.044 | -0.078 | 0.019 |
Significance: ∗ for p<0.1, ∗∗ for p<0.05, and ∗∗∗ for p<0.01.
Table 7.
The Local Projections estimates for the effect on TASI Return (Second Subperiod).
| Horizon | GPRHC | OPU | CPU | MPU | GOLD | INFLATION | CRUDE OIL |
|---|---|---|---|---|---|---|---|
| h=0 | -0.029 | -0.058 | 0.037 | -0.040 | 0.039 | 0.120 | 0,272*** |
| h=1 | -0.117* | -0.044 | 0.031 | -0.020 | 0.017 | 0.145 | 0.007 |
| h=2 | -0.148** | -0.049 | 0.005 | -0.109* | -0.024 | 0.169* | 0.088 |
| h=3 | -0.085 | -0.008 | 0.052 | -0.091 | 0.023 | 0.192** | -0.069 |
| h=4 | -0.152** | -0.084 | 0.014 | -0.055 | 0.072 | 0.214** | -0.097 |
| h=5 | -0.115* | -0.133* | 0.032 | -0.044 | 0.010 | 0.095 | 0.078 |
| h=6 | -0.126* | -0.153** | -0.021 | -0.033 | -0.033 | 0.111 | 0.023 |
| h=7 | -0.031 | -0.136* | 0.025 | -0.079 | -0.059 | 0.147 | 0.065 |
| h=8 | -0.053 | -0.192** | 0.029 | -0.052 | -0.065 | 0.146 | 0.033 |
| h=9 | -0.147** | -0.045 | -0.030 | 0.001 | -0.005 | 0.136 | 0.080 |
| h=10 | 0.037 | 0.093 | 0.070 | 0.037 | 0.093 | 0.115 | 0.024 |
| h=11 | -0.018 | -0.063 | 0.078 | 0.050 | 0.162** | 0.067 | -0.104 |
| h=12 | -0.022 | -0.115 | 0.011 | -0.032 | 0.022 | 0.016 | 0.019 |
Significance: ∗ for p<0.1, ∗∗ for p<0.05, and ∗∗∗ for p<0.01.
Table 8.
Subsample Cumulative Local Projections estimates for the effect on TASI Return.
| GPRHC | OPU | CPU | MPU | GOLD | INFLATION | CRUDE OIL | ||||||||
|---|---|---|---|---|---|---|---|---|---|---|---|---|---|---|
| Horizon | Period 1 | Period 2 | Period 1 | Period 2 | Period 1 | Period 2 | Period 1 | Period 2 | Period 1 | Period 2 | Period 1 | Period 2 | Period 1 | Period 2 |
| h=0 | 0.123*** | -0.092*** | -0.111*** | -0.050*** | -0.243*** | 0.029*** | 0.048*** | -0.055*** | 0.004 | 0.019*** | -0.222*** | 0.150*** | 0.196*** | 0.101*** |
| h=1 | 0.257*** | -0.194*** | -0.229*** | -0.101*** | -0.471*** | 0.057*** | 0.102*** | -0.115*** | 0.016** | 0.036*** | -0.444*** | 0.306*** | 0.354*** | 0.169*** |
| h=2 | 0.403*** | -0.304*** | -0.351*** | -0.158*** | -0.677*** | 0.084*** | 0.159*** | -0.179*** | 0.025*** | 0.052*** | -0.664*** | 0.466*** | 0.465*** | 0.208*** |
| h=3 | 0.560*** | -0.417*** | -0.473*** | -0.226*** | -0.855*** | 0.108*** | 0.217*** | -0.244*** | 0.019** | 0.066*** | -0.880*** | 0.625*** | 0.526*** | 0.225*** |
| h=4 | 0.726*** | -0.529*** | -0.590*** | -0.313*** | -1.000*** | 0.130*** | 0.275*** | -0.306*** | -0.008 | 0.076*** | -1.089*** | 0.778*** | 0.541*** | 0.234*** |
| h=5 | 0.896*** | -0.635*** | -0.696*** | -0.417*** | -1.114*** | 0.148*** | 0.330*** | -0.363*** | -0.059*** | 0.076*** | -1.288*** | 0.923*** | 0.525*** | 0.248*** |
| h=6 | 1.067*** | -0.730*** | -0.787*** | -0.533*** | -1.203*** | 0.164*** | 0.375*** | -0.412*** | -0.129*** | 0.066*** | -1.473*** | 1.061*** | 0.493*** | 0.274*** |
| h=7 | 1.233*** | -0.812*** | -0.857*** | -0.646*** | -1.280*** | 0.180*** | 0.402*** | -0.452*** | -0.215*** | 0.053*** | -1.639*** | 1.198*** | 0.456*** | 0.309*** |
| h=8 | 1.394*** | -0.881*** | -0.905*** | -0.744*** | -1.359*** | 0.199*** | 0.398*** | -0.479*** | -0.308*** | 0.051*** | -1.786*** | 1.330*** | 0.420*** | 0.344*** |
| h=9 | 1.551*** | -0.937*** | -0.933*** | -0.819*** | -1.451*** | 0.225*** | 0.358*** | -0.492*** | -0.403*** | 0.069*** | -1.915*** | 1.453*** | 0.388*** | 0.371*** |
| h=10 | 1.708*** | -0.981*** | -0.953*** | -0.877*** | -1.561*** | 0.257*** | 0.286*** | -0.492*** | -0.498*** | 0.111*** | -2.029*** | 1.562*** | 0.361*** | 0.385*** |
| h=11 | 1.867*** | -1.013*** | -0.974*** | -0.929*** | -1.690*** | 0.294*** | 0.194*** | -0.485*** | -0.590*** | 0.171*** | -2.132*** | 1.654*** | 0.342*** | 0.387*** |
| h=12 | 2.029*** | -1.038*** | -1.003*** | -0.984*** | -1.835*** | 0.334*** | 0.093*** | -0.477*** | -0.680*** | 0.241*** | -2.227*** | 1.730*** | 0.330*** | 0.379*** |
Significance: ∗ for p<0.1, ∗∗ for p<0.05, and ∗∗∗ for p<0.01.
Table 9.
Coherence Statistics.
| Variable | Mean Coherence | Max Coherence |
| GPRHC | 0.4443158404 | 0.9865856045 |
| OPU | 0.4025906815 | 0.9792206243 |
| CPU | 0.39957032 | 0.983446932 |
| MPU | 0.4067198116 | 0.9896087034 |
| GOLD | 0.3611281876 | 0.9670252691 |
| INFLATION | 0.4119405901 | 0.9743010486 |
| CRUDE OIL | 0.3656032039 | 0.9819232258 |
Disclaimer/Publisher’s Note: The statements, opinions and data contained in all publications are solely those of the individual author(s) and contributor(s) and not of MDPI and/or the editor(s). MDPI and/or the editor(s) disclaim responsibility for any injury to people or property resulting from any ideas, methods, instructions or products referred to in the content. |
© 2025 by the authors. Licensee MDPI, Basel, Switzerland. This article is an open access article distributed under the terms and conditions of the Creative Commons Attribution (CC BY) license (http://creativecommons.org/licenses/by/4.0/).
Copyright: This open access article is published under a Creative Commons CC BY 4.0 license, which permit the free download, distribution, and reuse, provided that the author and preprint are cited in any reuse.


