
Submitted:
09 November 2024
Posted:
11 November 2024
You are already at the latest version
Preprints on COVID-19 and SARS-CoV-2
Abstract
The Oil and Gas sector, particularly in the Gulf Cooperation Council (GCC) and various other countries globally, constitutes a significant portion of the economy. Unquestionably, this sector has encountered substantial disruptions due to the widespread impact of the global pandemic. Government interventions led to a contraction in activities within the oil and gas sector, resulting in considerable financial setbacks for companies operating in these industries in affected countries. The noticeable decline in oil prices compelled oil and gas suppliers to implement cost-cutting measures to recover from the economic downturn. Furthermore, the heightened volatility in financial markets poses an additional threat to overall demand. The objective of this study is to analyze the impact of the COVID-19 pandemic on oil industry performance, with a focus on its effect on oil stock returns during the crisis. Findings reveal that, while there was minimal impact on cumulative abnormal returns following the initial COVID-19 events of December 29, 2019, and January 13, 2020, a sharp decline in oil stock prices emerged in response to subsequent events. This pattern suggests possible investor overreaction and provides valuable insights into behaviour within the oil sector during crisis periods.
Keywords:
COVID-19
; Event study
; Oil industry
; Oil stock returns
; Volatility
; Financial reporting
Introduction
On December 29, 2019, the World Health Organization (WHO) formally declared COVID-19 a pandemic, marking the late stages of 2019 and the early months of 2020. This unprecedented global health crisis has left an indelible impact on multiple industries across the world. With nearly 690 million cases and 6,884,924 deaths reported worldwide, COVID-19 has gained recognition as the fastest-spreading virus in history, surpassing the magnitude of the 2009 global financial crisis.
The repercussions of COVID-19 have been particularly profound in various sectors such as the oil industry, hospitality, aviation, stocks, healthcare, banking, and food industries, among others. As a result, companies and governments have found themselves compelled to undertake a comprehensive re-evaluation of their goals, organizational structures, and operational strategies. This reassessment aims to mitigate risks and enable the continuation of business operations while minimizing costs. The financial implications have been substantial, with numerous companies experiencing a significant decline in revenue. Regrettably, some entities have been unable to weather the storm and have been forced to declare bankruptcy because of the adverse effects of the pandemic (Public Health, 2020).
Conversely, the global value chains have been disrupted, leading to economic challenges and a decline in the demand for goods, services, and notably, oil. This decline in demand has had a direct effect on the market value of the oil-industry. Consequently, the objective of this research paper is to analyse and evaluate the influence of the COVID-19 pandemic on the performance of the oil industry. Specifically, the study focuses on examining the impact of the pandemic on oil stock returns during this period of crisis.
We have taken into consideration four significant dates related to the COVID-19 pandemic: (1) December 29, 2019, which marks the initial reporting of the first four cases originating from Wuhan, China; (2) January 13, 2020, denoting the first confirmed case outside China, reported in Thailand; (3) February 21, 2020, highlighting the outbreak in Italy; and (4) March 11, 2020, signifying the World Health Organization's declaration of a global pandemic outbreak and the implementation of travel bans by the USA. These dates hold particular importance in the context of COVID-19. Our study focuses on analysing the impact of these events on oil stock returns. We believe this study is the first to investigate the global effects of COVID-19 on oil stock returns. Specifically, it aims to examine whether abnormal returns can be observed across four distinct pandemic-related events. We utilize an event study methodology, well-suited for this type of analysis. The anticipated results suggest the presence of time-varying behaviours among investors within the oil industry’s stock markets.
Our study encompasses a comprehensive sample of 104 listed oil companies from various continents. The results obtained indicate that the events of December 29, 2019, and January 13, 2020, did not exhibit a significant decline in cumulative abnormal returns. This suggests that, up until this period, the oil industry was unaffected by the COVID-19 outbreak. However, the situation took a different turn during the remaining two dates, revealing a notable decline in oil stock prices. This suggests an exaggeration on the part of stock market investors. Our findings are consistent with Ding et al. (2020) and Ru et al. (2020), who have detailed the economic consequences of the COVID-19 outbreak on stock returns. Additionally, we observe that investors in Western countries tend to react more swiftly to information compared to investors in other countries. This observation provides valuable insights into the behaviour of investors in the oil industry.
This study contributes to the existing literature on the oil industry, particularly due to its unique sample composition, which includes major listed oil firms from around the world. Furthermore, it sheds light on the implications for policymakers, emphasizing the importance of implementing coordinated fiscal and monetary measures, such as financial relief packages and targeted taxes, to mitigate the negative economic consequences of COVID-19 on this capital-intensive industry.
The rest of this study organized as follows. Section 2 present the literature review that belong to this study and section 3 describes the data and research methodology. Empirical results and policy discussion presented in Section 4. Section 5 provides the conclusion.
Literature Review and Study Hypotheses
Following the emergence of the COVID-19 pandemic, researchers swiftly turned their attention towards examining its impact on the global economy, trade, and stock markets. One particular area of interest was the effect on the oil industry. Given that stock markets serve as the driving force of the global economy, researchers have sought to establish connections between stock markets and the COVID-19 pandemic. Baker et al. (2020a) examine the response of the US stock market to the COVID-19 pandemic. They find that the influence of the pandemic on the US stock market is unparalleled and comparable to the impact of previous infectious disease outbreaks such as the Spanish Flu. The study suggests that government-imposed restrictions on commercial activities and international trade, among other factors, contributing to the strong reaction of the US stock market to the COVID-19 pandemic. Al-Awadhi et al. (2020) utilize panel data analysis to assess the effect of the pandemic on the Chinese stock market. They examine data from companies listed on the Hang Seng index and Shanghai Stock Exchange Composite index between January 10, 2020, and March 16, 2020, which coincided with the identification of the COVID-19 pandemic in China. Their findings indicate that the daily increase in confirmed COVID-19 cases and the overall number of deaths significantly impact the stock returns of all companies, exerting a negative influence.
Mishra and Mishra's (2021) study focuses on examining the effects of the COVID-19 pandemic on Asian stock markets by employing the GARCH (1,1) model, conducting an event study analysis, and utilizing the random effects model to understand the factors behind stock market plunges during the pandemic. The findings of this study provide empirical evidence supporting the presence of announcement effects on stock market movements and return volatilities in the Asian region. Moreover, the study identifies COVID-19 confirmed cases, changes in the exchange rate, and changes in Brent crude oil prices as significant factors contributing to stock market downturns during the pandemic. Onali (2020) employ a GARCH (1,1) model to analyse the volatility of the US stock market, specifically the Dow Jones and S&P500 indices. The study examines the impact of the COVID-19 pandemic and related deaths on the US stock market. The study reveals that the reported number of deaths in Italy and France negatively affected US stock market returns, but positively impacted VIX returns, a widely used measure of market volatility based on S&P 500 index options.
Furthermore, Papadamous et al. (2020) utilize panel data analysis to investigate the direct and indirect effects of the COVID-19 pandemic on implied stock market volatility across Europe, Asia, the US, and Australia. Their findings indicate that heightened concerns, as reflected in Google-based anxiety related to the contagious effects of COVID-19, resulted in increased risk aversion in the stock market. The COVID-19 pandemic in 2020 also caused a significant decline in oil prices, delivering a severe blow to the oil market. Sharif et al. (2020) examine the interconnections between the COVID-19 pandemic, oil price volatility shocks, the stock market, geopolitical risk, and economic policy uncertainty in the US. They employee time-domain and frequency dynamics approaches, including the coherence wavelet method and the wavelet-based Granger causality. Their research concludes that the unprecedented impact of the pandemic on these factors led to the development of low-frequency bands. Moreover, they find that the influence of the COVID-19 pandemic on geopolitical risk is notably greater than its impact on US economic uncertainty.
Albulescu (2020) investigates the impact of the COVID-19 pandemic on crude oil prices, while also considering the influence of financial turmoil and uncertainty in US economic policy. The findings indicate that daily reported new infections of COVID-19 had a slightly negative impact on crude oil prices. Similarly, Narayan (2020) examines the relative significance of COVID-19 infections and oil price news in influencing oil prices. The study concludes that when oil prices are used as a threshold, news regarding the COVID-19 pandemic and negative oil prices have an impact on oil prices during periods of high volatility. Gil-Alana and Monge (2020) utilize long memory techniques to investigate the effect of COVID-19 on WTI crude oil prices (West Texas Intermediate (WTI) crude oil is a specific grade of crude oil and one of the main three benchmarks in oil pricing, along with Brent and Dubai Crude). Their research reveals that the oil price series exhibit mean-reverting behaviour, indicating that the shock caused by the pandemic would be transitory but could have long-lasting effects.
Zhang and Hamori (2021) employed time-domain and frequency dynamics approaches to calculate return and volatility spillovers. The study utilizes the moving window method to obtain dynamic results. Zhang et al. (2020a) focused on examining the connectedness between natural gas, crude oil, and electricity utility stocks in North America and Europe using the DY12 and BK18 methods (The DY12 approach measures total, directional, net and pairwise spillover indexes while the BK18 procedure further provides a measure of these spillover indexes in short-, medium-, and long-term frequency by taking into account the different strengths of the shocks to economic variables at different frequencies). Zhang et al. (2020b) also applied these methods to evaluate the connectedness between oil, natural gas, and US macroeconomic indicators. Liu and Hamori (2020) utilize the rolling analysis method to assess the dynamic spillover of returns and volatility among renewable energy stocks between the US and Europe.
Based on previous studies, it becomes evident that various researchers have explored the impact of COVID-19 on oil stocks using different models, timeframes, and country-specific data. However, our study aims to extend the existing research by adopting a comprehensive approach that encompasses a global sample, incorporates four distinct time periods, and employs the event study model. Leveraging the cumulative insights from prior studies, our study seeks to explore the influence of COVID-19 on the global oil industry encompassing a broad spectrum of countries involved in both oil production and consumption. Drawing upon the existing literature, we have formulated the following hypotheses:
H1: The COVID-19 pandemic has no significant effect on the stock returns or overall performance of the oil industry.
H2: Investors overreacted to negative news during the first quarter of 2020, reducing the market value of oil stocks.
Research Methods
Sample Selection and Data
This study utilizes a sample consisting of active companies in the oil and gas industry that are listed on stock markets. Initially, the sample include all oil companies globally under SIC codes 1311 and 5172. However, due to missing data and to ensure representation from all continents, the final sample size was reduced to 104 companies. To compute the market return, the researchers utilized the major stock market index in each respective country. Stock prices and market indices are obtained from DataStream, a reliable data source. The responses by industries and countries are presented in Table 1 and 2. In cases where data are missing, we manually collected the necessary information from other available sources.
Methodology
In this section, we test H1 using the market model below to test the impact of the four-event information on the stock prices and return in the oil industry.
R i, t=αi + β I R m, t + u i, t,
Where:
R i, t: daily returns of stock i
R m, t: daily market index returns on stock market m at time t,
Ui,t: is the residual of stock i at time t, which is independent and identically distributed.
The event study employed in this paper is based on the framework initially presented by Fama et al. in (1969). The purpose of the event study is to examine the impact of new information on stock prices. This approach is commonly used to test market efficiency, which encompasses three forms: weak form, semi-strong form, and strong form. Fama (1970, 1991) further developed the event study methodology and established the notion that stock prices already incorporate all relevant information. According to this concept, if the market is efficient, stock prices should promptly reflect the announcement of new information. Essentially, new information is considered relevant to the market and subsequently influences investors' decisions. On the other hand, irrelevant information will have little to no effect on stock returns and investors' choices.
The first step in the process involves computing the expected stock return using the market model to estimate the expected return of a stock based on its historical relationship with the market's returns. The abnormal returns are then calculated as the difference between the actual stock returns and the expected returns. In a semi-strong efficient market, the abnormal returns should ideally be zero, indicating that market prices align with the fair value. For this study, four significant events related to the development of the COVID-19 pandemic are selected as key reference points. These events are as follows: (1) December 29, 2019: The first four cases reported originating from Wuhan, China, (2) January 13, 2020: The first infected case outside of China reported in Thailand, (3) February 21, 2020: The outbreak in Italy, (4) March 20, 2020: The World Health Organization's declaration of a global pandemic outbreak and the USA's travel ban on visitors from 26 European countries.
The parameters of the market model during the estimation window in 2019 estimated next. The abnormal return of stock i at time t (ARi, t) is
Where i and i are the estimated parameters of stock i from Equation (1).
The impact of the four different events, when new information is announced, is measured by calculating the ARi, t. A significant deviation of ARi,t from zero suggests that the market value of oil company stocks diverges from their fair value. The accumulated abnormal return of stock i during the period from t1 to t2, denoted as CARi, (t1, t2), is used to examine whether the market value diverges from the fair value. Specifically, the study investigates if CARi, (t1, t2) is significantly different from zero. The cumulative abnormal return of stock i from time t1 to t2, (CARi, (t1, t2)), is defined as follows:
CARi,(t1,t2)=∑ ARi,t
To assess the efficiency of stock markets, a 5-day window was selected for each event date, encompassing 5 days prior to the event date and 5 days after the event date (-5, +5). This window duration aligns with previous studies conducted in the field of transportation, airlines, and logistics research, which typically utilize event windows of no longer than 10 days (Park, 2004; Gong et al., 2006; Gong et al., 2008). We use a shorter event window to avoid overlapping event window periods, following McWilliams and Siegel (1997). This approach ensures that the analysis targets the specific impact of each event, eliminating potential confounding effects from overlapping event periods.
Results and Discussion
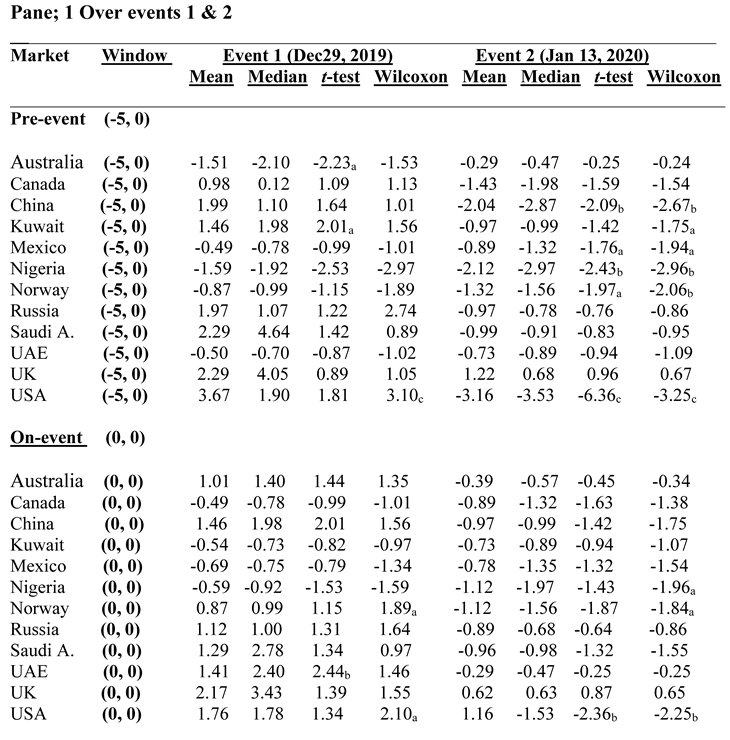
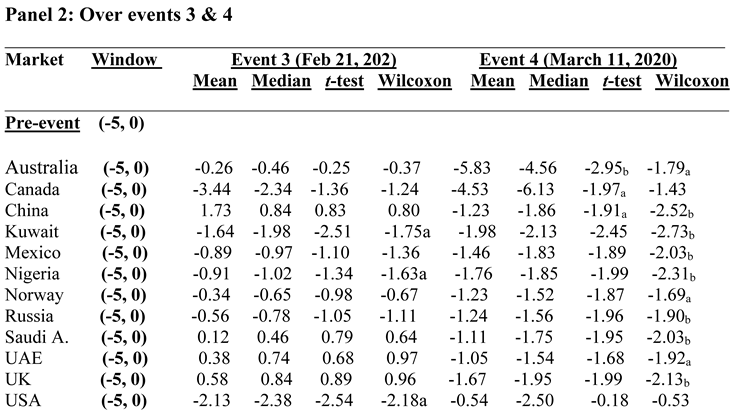
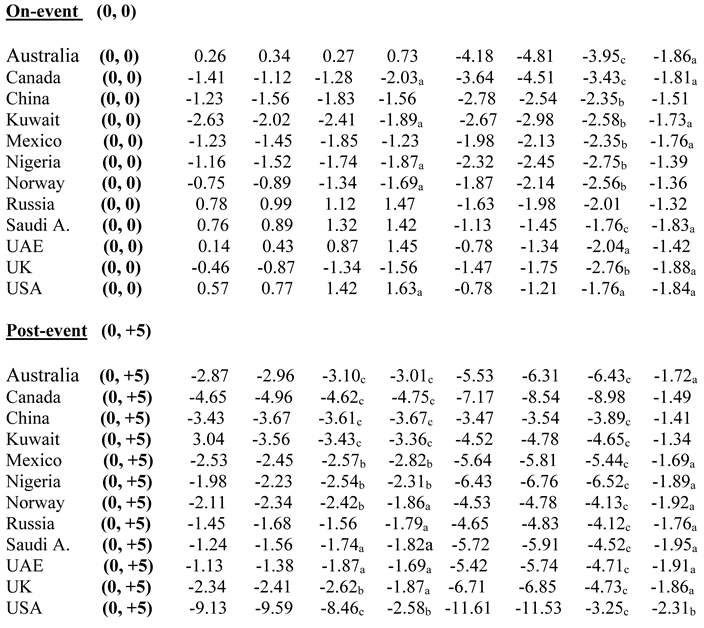
The objective of this study is to examine how the COVID-19 pandemic influenced the performance of the oil industry, specifically focusing on its effect on oil stock returns throughout the crisis. The first hypothesis posits that COVID-19 pandemic has no significant effect on the stock returns or overall performance of the oil industry. We test this using the market model to examine the impact of the four events on stock prices and returns in the oil industry. Findings reveal that the first two events (Events 1 and 2) had a minimal effect, as both investors and governments appeared to underestimate their impact. The market’s negative response was relatively muted during these events, indicating limited attention from global investors. However, Event 3—the outbreak in Italy—triggered a more substantial and pronounced response, with the oil industry experiencing a steady decline in stock performance. This resulted in cumulative negative abnormal returns of 9.63% over the five days following the outbreak, indicating the significant impact of COVID-19 on the oil industry and positioning it as one of the most affected sectors. The situation further exacerbated when the World Health Organization officially declared the global pandemic and when President Trump imposed a ban on international travel (Event 4). These announcements led to panic and fear in global financial markets, causing a significant plunge in stock markets, including the oil industry.
The cumulative negative abnormal returns in the oil industry amounted to 31.73% over the five-day period following the announcements. During this time, investors overreacted to the announcements, resulting in deviations of stock prices from their real values. The declining stock prices in the oil industry served as a warning to various agencies, particularly regulators and policymakers, emphasizing the gravity of the situation and the need for swift and effective responses. Table 1 presents the cumulative abnormal returns of oil stocks in each country during the four major events, analysed based on individual countries. The mean and median values of the cumulative abnormal returns, particularly on the event date [0, 0] and five days after the event date [0, +5], tend to be negative in most cases. Both the t-test and the Wilcoxon signed-rank test yield similar results. We further examine the results based on pre-event, on-event, and post-event windows. Starting with the pre-event window period [-5, 0], the most significant findings are observed for Event 4. Many countries included in the study exhibit negative abnormal returns during this period. However, there is no significant difference from zero in the mean and median values of the five days preceding Events 1 and 2. This suggests the presence of an underreaction phenomenon, particularly for Event 2. Possible explanations for this finding include traders' assumptions that the disease would be confined to specific regions (Ding et al. 2020 and Ru et al. 2020) and their anticipation of swift vaccine development by governments worldwide. These assumptions likely led investors to underestimate the pandemic’s impact on the oil industry. Additionally, the abnormal returns were not statistically significant on any of the event dates, suggesting that investors incorporated information during pre-event periods.
The abnormal returns on the event date are not statistically significant for any of the events, as investors appear to incorporate the information during the pre-event window periods. However, during Event 4, the stock markets in most countries included in the study exhibit significantly negative returns. Notably, Event 4 has a direct association with the U.S. oil market, leading to a dramatic impact on the U.S. oil business. Traders in the U.S. demonstrate a higher level of overreaction compared to the previous three events. Similar evidence is observed in other countries such as the UK, Saudi Arabia, Russia, and the UAE. Among these countries, the impact on their oil industries is particularly pronounced, resulting in cumulative negative abnormal returns of 16.71%. This finding suggests that the herd-immunity policy, which has been a topic of debate among physicians worldwide, may play a role in driving these results. Herd immunity aims to protect the entire community by achieving immunity in a substantial portion of the population, thereby reducing the likelihood of disease transmission between individuals.
In general, oil stock prices in Asia experienced less severe declines compared to other countries except China. This can be attributed to government interventions and remedies implemented in Saudi Arabia, UAE, and Kuwait (oil companies in these countries are governmental or semi-governmental owned companies). These governments provided state-backed loans to oil companies facing financial difficulties during the pandemic crisis, which helped alleviate cash crunches and stabilize the oil industry in these countries. In China, however, the pandemic had an overall negative effect on the stock market, particularly during the post-event window. This negative impact cannot be solely explained by real losses incurred by the companies. The results reveal a stronger positive correlation between individual investor sentiment and stock returns compared to normal market conditions. The influence of individual investor sentiment on stock returns is particularly significant for enterprises with high price-to-book ratio (PB), price-to-earnings ratio (PE), and market capitalization value (CMV), as well as low net asset value and low institutional shareholding. Only seven industries, primarily related to pharmacy, digitalization, and agriculture, experienced a boost during this period.
Price-to-book valuation
Table 2 presents the fair value of oil companies, which is determined based on their earnings reported as of March 2020. The study then proceeds to analyse the responses of oil traders to the event study by comparing the actual market prices with the fair values. To calculate the fair value of stock prices, the authors utilize the price-to-book valuation methos outline below
Pricei, 1Q2020 = (Price − to − book)2019*(Book value) i, 1Q2020
(Price − to − book)2019 measures the average ratio of market value to book value in 2019. We calculate the average value of price-to-book ratios of each company to generate universal price-to-book ratio. (Book value) i, 1Q2020 is the book value of stock i in March 2020. Pricei, 1Q2020 is the fair value of company in March 2020, which is the product of price-to-book ratio and book value. We compare the market value to the computed fair value of each stock at the end of March 2020. We hypothesize and find that investors overreact to bad news in the first quarter of 2020 leading to a drop-in market value.
The results shown in Table 2. Column 1 shows market value of each stock. Column 2 reports fair value of stocks using Equation (4). Column 3 states percentage differences between market value and fair value. The results show that market values significantly drop below fair values for most companies, leading to significantly average differences in mean and median of – 11.10% and − 48.00%, respectively.
Our findings confirm that investors overreact to COVID-19 pandemic events, offering greater understanding of how the oil and energy stock prices deteriorated during the crisis due to investors’ interpretation of information. In certain Asian countries, such as the UAE, Saudi Arabia, and Kuwait, government policy announcements helped mitigate this investor overreaction.
Study Limitations and Future Research
Although the study offers valuable insights, it is important to acknowledge its limitations, and future research should address the following issues for a more comprehensive understanding. First, the study focuses on a worldwide sample of oil companies and may not represent the entire oil industry, especially smaller or non-listed companies and those operating in different regions. Future research could expand the scope to include smaller oil companies, non-listed firms, or those in specific regions to provide a better understanding of how different segments of the industry were affected by COVID-19.
Second, the study's analysis is based on a specific period, which may not capture the full extent of the long-term effects of the pandemic on the oil industry. The evolving nature of the pandemic and subsequent policy changes could influence the results over time. Future studies may extend the analysis to encompass a broader timeframe, considering the ongoing developments and evolving policy responses related to COVID-19. This could offer insights into the prolonged impacts of the pandemic and how the oil industry adapts over time.
Third, the selection of four COVID-19 announcements as events of interest may not fully reflect the complex range of factors impacting the oil industry. Future research could broaden the scope of event selection, including additional events such as changes in government policy, or other significant occurrences that affected the global economy during the pandemic.
Fourth, the study relies on the efficient market hypothesis, which assumes that stock prices reflect all available information. However, market inefficiencies and behavioral biases could influence stock returns, which may affect the interpretation of the findings. Future studies could explore these inefficiencies and biases more explicitly, perhaps incorporating behavioral finance approaches to better understand investor reactions during periods of crisis.
Finally, the study predominantly uses quantitative analysis, which may overlook qualitative insights such as management strategies, government policies, and industry dynamics. Future research could adopt a mixed-methods approach, integrating qualitative factors to offer a more holistic view of the effects of COVID-19 on the oil industry. This would provide richer insights into how management decisions and policy responses shaped the industry’s resilience during the pandemic.
Summary and Conclusions
The objective of this study is to analyse the impact of the COVID-19 pandemic on the performance of the oil industry. Specifically, we examine the returns of oil stocks during the pandemic and investigate the existence of abnormal returns across four significant event periods. These events include the first reported cases in Wuhan, China (December 29, 2019), the first case outside China reported in Thailand (January 13, 2020), the outbreak in Italy (February 21, 2020), and the global pandemic declaration by the WHO and the travel ban announcement by President Trump (March 11, 2020).
Our findings strongly support previous studies by Ding et al. (2020) and Ru et al. (2020), which highlight the economic impact of the COVID-19 outbreak on stock returns. Furthermore, we observe that investors in Western countries tend to react more swiftly to information compared to investors in other countries. This study contributes to the existing literature on the oil industry, particularly due to its unique sample that includes major listed oil firms worldwide. Moreover, it provides insights for policymakers regarding the implementation of coordinated fiscal and monetary policies, including financial relief packages and taxes, to mitigate the adverse economic consequences of COVID-19 on this capital-intensive industry.
We identify underreaction to announcements in Event 1 and 2, while overreaction is evident in Event 3 and 4. Notably, oil stocks in many countries such as Australia, Canada, UK, and the US exhibit poor performance in the post-event period of Event 3 and 4.
Based on our findings, we offer several potential explanations and policy implications. As the COVID-19 pandemic continues, our results underscore the need for careful policy considerations. Governments are faced with the decision to provide financial support and debt guarantees or to rely on market mechanisms and allow oil firms to file for bankruptcy. To support the oil industry, potential policy measures may involve mergers and acquisitions, tax policy adjustments, and government subsidies. However, it is important to recognize that these policies may increase national debt. Alternatively, the possibility of firm liquidation in the oil industry cannot be ignored, which may subsequently disrupt the global supply chain and associated businesses.
The study's findings suggest that the oil industry needs to adapt to the changing market conditions caused by the pandemic. Oil companies should explore diversification, cost-cutting measures, and operational efficiencies to mitigate the adverse effects of similar crises in the future and ensure long-term sustainability. The study's observation of varying investor responses across regions highlights the importance of international collaboration in addressing the challenges faced by the oil industry.
This study is crucial because it provides an in-depth analysis of the economic consequences of the COVID-19 pandemic on the oil industry, a vital global sector. Given the unprecedented nature of the pandemic and its disruptive impact on industries worldwide, examining the specific effects on oil stock returns during key pandemic-related events enhances our understanding of how global crises can affect market behaviors. This research fills a gap in the literature by using an event study methodology to analyze the behavior of 104 listed oil companies across multiple continents, offering a global perspective on how investor sentiment shifts in response to crises. The study’s insights into time-varying behavior in stock markets will help stakeholders—from investors to policymakers—better comprehend the risks associated with future pandemics or similar crises, ensuring more informed decision-making for economic stability.
The findings from this research have significant theoretical and empirical implications. Empirically, the study shows how stock market investors in the oil industry reacted during distinct phases of the COVID-19 pandemic, particularly in Western countries where investors responded more swiftly to information. This insight highlights regional differences in market behavior, which could influence future investment strategies and market forecasts. Theoretically, the research enhances our understanding of investor psychology and market efficiency during global crises, offering evidence of abnormal returns in response to pandemic events. Additionally, the study emphasizes the need for policymakers to implement coordinated fiscal and monetary measures to stabilize capital-intensive industries like oil. Financial relief packages and targeted taxes could serve as effective tools to mitigate economic shocks, thus aiding both companies and national economies in weathering future disruptions.
References
- Al-Awadhi, A. M., Al-Saifi, K., Al-Awadhi, A., & Alhammadi, S. (2020). Death and contagious infectious diseases: Impact of the COVID-19 virus on stock market returns. Journal of Behavioural and Experimental Finance, 27, Article 100326. [CrossRef]
- Albulescu, C. (2020). Coronavirus and oil price crash. Available at SSRN: https://ssrn. com/abstract=3553452.
- Baker, S. R., Bloom, N., Davis, S. J., Kost, K., Sammon, M., & Viratyosin, T. (2020a). The unprecedented stock market reaction to COVID-19. The Review of Asset Pricing Studies, 10(4), 742–758. [CrossRef]
- Ding, W., Levine, R., Lin, C., Xie, W., (2020). Corporate Immunity to the COVID-19 Pandemic NBER Working paper No. 27055. Available at. https://www.nber. org/papers/w27055.
- Fama, E.F., (1970). Efficient capital markets: a review of theory and empirical work. J. Finance 25 (2), 383–417. [CrossRef]
- Fama, E.F., (1991). Efficient capital markets: II. Journal of Finance 46 (5), 1575–1617.
- Fama, E.F., Fisher, L., Jensen, M.C., Roll, R., (1969). The adjustment of stock prices to new information. Int. Econ. Rev. 10 (1), 1–21. [CrossRef]
- Gil-Alana, L. A., & Monge, M. (2020). Crude oil prices and COVID-19: persistence of the shock. Energy Research Letters, 1(1). [CrossRef]
- Gong, S.X., Firth, M., Cullinane, K., (2006). The information content of earnings releases by global airlines. J. Air Transport. Management. 12 (2), 82–91. [CrossRef]
- Gong, S.X., Firth, M., Cullinane, K., (2008). International oligopoly and stock market linkages: the case of global airlines. Transport. Res. E Logist. Transport. Rev. 44 (4), 621–636. [CrossRef]
- Liu, T., & Hamori, S. (2020). Spillovers to renewable energy stocks in the US and Europe: Are they different? Energies, 13(12), 3162. [CrossRef]
- McWilliams, A., Siegel, D., (1997). Event studies in management research: Theoretical and empirical issues. Acad. Management. J. 40 (3), 626–657. [CrossRef]
- Mishra, Pabitra Kumar & Mishra, Santosh Kumar (2021). COVID-19 pandemic and stock market reaction: empirical insights from 15 Asian Countries, Transnational Corporations Review, Vol 13(2), pp. 139-155. [CrossRef]
- Narayan, P.K. (2020). Oil price news and COVID-19: Is there any connection? Energy Research Letters, 1, 13176. doi:10.46557/001c.13176. [CrossRef]
- Onali, E. (2020). COVID-19 and stock market volatility. Available at SSRN: https://ssrn. com/abstract=3571453.
- Papadamous, S., Fassas, A., Kenourgios, D., & Dimitrious, D. (2020). Direct and indirect effects of COVID-19 pandemic on implied stock market volatility: Evidence from panel data analysis. MPRA Paper, 100020.
- Park, N.K., (2004). A guide to using event study methods in multi-country settings. Strategic Management Journal, 25 (7), 655–668. [CrossRef]
- Ru H., Yang E., Zou K. What do we learn from SARS-CoV-1 to SARS-CoV-2. Evidence from global stock markets. 2020 doi: 10.2139/ssrn.3569330. Available at SSRN.
- Sharif, A., Aloui, C., & Yarovaya, L. (2020). COVID-19 pandemic, oil prices, stock market, geopolitical risk, and policy uncertainty nexus in the US economy: Fresh evidence from the wavelet-based approach. International Review of Financial Analysis, 70, Article 101496. [CrossRef]
- Zhang, W., He, X., Nakajima, T., & Hamori, S. (2020a). How does the spillover among natural gas, crude oil, and electricity utility stocks change over time? Evidence from North America and Europe. Energies, 13(3), 727. [CrossRef]
- Zhang, Y., He, X., Nakajima, T., & Hamori, S. (2020b). Oil, gas, or financial conditions-which one has a stronger link with growth? The North-American Journal of Economics and Finance, 54, 101220.
- Zhang, W. and Hamori, S., (2021). Crude oil market and stock markets during the COVID-19 pandemic: Evidence from the US, Japan, and Germany, International Review of Financial Analysis, Volume 74, March 2021, 101702. [CrossRef]

Table 1.
Cumulative abnormal returns in individual countries.
 |
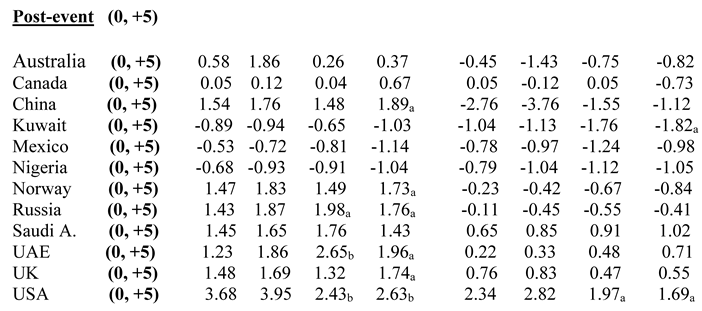 |
The numbers shown in the parentheses are the number of oil firms. a Statistical significance at the 10% level. b Statistical significance at the 5% level. c Statistical significance at the 1% level.
Table 1.
Cumulative abnormal returns in individual countries.
 |
 |
The numbers shown in the parentheses are the number of oil firms. a Statistical significance at the 10% level. b Statistical significance at the 5% level. c Statistical significance at the 1% level.
Table 2.
Market Value and Fair Value of Oil Stock Across countries.
| Difference | FV | MV | |
| Australia | |||
| -27.32 | 27,193.2 | 19,764.6 | Woodside Petroleum Ltd |
| -17.48 | 18,629.0 | 15,372.8 | Santos Limited |
| 13.68 | 6,584.3 | 7,485.0 | Ampol Limited |
| -5.106 | 4,996.1 | 4,741.0 | Yancoal Australia Ltd |
| -48.61 | 8,661.0 | 4,451.0 | Washington H. Soul Pattinson and Company Limited |
| -0.605 | 4,449.3 | 4,422.4 | Viva Energy Group Limited |
| -43.69 | 3,901.2 | 2,196.7 | Beach Energy Limited |
| Canada | |||
| -1.269 | 143,096.3 | 141,281.1 | Enbridge Inc. |
| 2.435 | 89,147.2 | 91,318.1 | TC Energy Corporation |
| 26.37 | 49,571.2 | 62,644.0 | Suncor Energy Inc. |
| -10.66 | 63,293.3 | 56,547.4 | Canadian Natural Resources Limited |
| -18.01 | 27,806.6 | 22,799.2 | Imperial Oil Limited |
| -47.41 | 36,213.0 | 19,044.6 | Cenovus Energy Inc. |
| -14.59 | 12,883.5 | 11,003.2 | Husky Energy Inc. |
| -20.42 | 12,203.2 | 9,711.4 | Inter Pipeline Ltd. |
| -5.541 | 8,505.2 | 8,033.9 | Parkland Corporation |
| -1.756 | 7,893.8 | 7,755.2 | Keyera Corp. |
| China | |||
| -16.27 | 243,000.5 | 203,466.7 | PetroChina Company Limited |
| -12.4 | 135,686.2 | 118,863.8 | China Petroleum & Chemical Corporation |
| -15.58 | 65,042.6 | 54,910.0 | China Shenhua Energy Company Limited |
| -0.982 | 21,089.6 | 20,882.5 | China Coal Energy Company Limited |
| -9.174 | 16,309.2 | 14,813.0 | Shaanxi Coal Industry Company Limited |
| -54.76 | 29,949.5 | 13,550.2 | Yankuang Energy Group Company Limited |
| -43.08 | 13,381.1 | 7,616.5 | Wintime Energy Co.,Ltd. |
| 7.7 | 6,966.4 | 7,502.8 | Inner Mongolia Yitai Coal Co., Ltd. |
| 1.328 | 7,289.3 | 7,386.1 | COSCO SHIPPING Energy Transportation Co., Ltd. |
| Kuwait | |||
| 28.18 | 591.9 | 758.7 | Independent Petroleum Group K.S.C.P. |
| 620.8 | 15.4 | 111.0 | The Energy House Holding Company |
| 33.41 | 8.8 | 11.7 | Kuwait Gulf Oil Company. |
| 48.37 | 24.6 | 36.5 | Kuwait National Petroleum Company. |
| -14.67 | 145.9 | 124.5 | Kuwait Oil Company. |
| 88.95 | 38.0 | 71.8 | Kuwait Petroleum Corporation. |
| -86.13 | 111.0 | 15.4 | Kuwait Petroleum International. |
| Mexico | |||
| -22.81 | 416.1 | 321.2 | Petróleos Mexicanos |
| 0.329 | 303.7 | 304.7 | FEMSA Combustibles |
| -42.43 | 339.6 | 195.5 | Grupo Petroil |
| -14.67 | 145.9 | 124.5 | Shell México |
| 88.95 | 38.0 | 71.8 | Vista Energy |
| 40.66 | 30.5 | 42.9 | Bonatti México |
| -21.98 | 758.7 | 591.9 | Compañía Mexicana de Exploraciones |
| -86.13 | 111.0 | 15.4 | Nabors Perforaciones de México |
| -8.495 | 899.4 | 823.0 | Vista Oil & Gas, S.A.B. de C.V. |
| -39.59 | 63.9 | 38.6 | Grupo TMM, S.A.B. |
| Nigeria | |||
| 6.51 | 880.2 | 937.5 | Oando PLC |
| -24.19 | 1,087.5 | 824.4 | Seplat Energy Plc |
| 110.4 | 115.3 | 242.6 | TotalEnergies Marketing Nigeria Plc |
| -46.75 | 220.3 | 117.3 | 11 plc |
| 19.21 | 65.6 | 78.2 | Ardova Plc |
| -48.7 | 65.3 | 33.5 | Eterna Plc |
| -52.71 | 44.2 | 20.9 | Conoil Plc |
| -25.04 | 11.7 | 8.8 | MRS OIL NIGERIA PLC |
| -32.6 | 36.5 | 24.6 | Lekoil Limited |
| Norway | |||
| -11.92 | 92,079.8 | 81,104.0 | Equinor ASA |
| -31.86 | 22,325.0 | 15,212.2 | Aker BP ASA |
| 2.051 | 2,286.5 | 2,333.4 | Höegh LNG Holdings Ltd. |
| 15.9 | 1,527.9 | 1,770.8 | DNO ASA |
| -0.48 | 1,458.2 | 1,451.2 | Norwegian Energy Company ASA |
| -22.81 | 416.1 | 321.2 | OKEA ASA |
| 0.329 | 303.7 | 304.7 | Awilco LNG ASA |
| -42.43 | 339.6 | 195.5 | Panoro Energy ASA |
| -14.67 | 145.9 | 124.5 | PetroNor E&P ASA |
| -47.08 | 71.8 | 38.0 | Interoil Exploration and Production ASA |
| -28.9 | 42.9 | 30.5 | Golden Energy Offshore Services AS |
| Russia | |||
| -10.76 | 162,149.9 | 144,704.8 | Public Joint Stock Company Gazprom |
| 4.941 | 126,563.2 | 132,816.8 | Public Joint Stock Company Rosneft Oil Company |
| 17.56 | 57,176.1 | 67,213.6 | PJSC LUKOIL |
| -12.64 | 70,699.4 | 61,763.1 | PAO NOVATEK |
| -2.444 | 42,249.9 | 41,217.2 | Public Joint Stock Company Gazprom Neft |
| -34.92 | 27,897.6 | 18,155.3 | Public Joint Stock Company Transneft |
| -48.94 | 26,571.9 | 13,568.5 | PJSC Tatneft |
| -751.6 | (1,459.4) | 9,510.1 | Surgutneftegas Public Joint Stock Company |
| Saudi Arabia | |||
| -7.178 | 2,014,946.8 | 1,870,318.6 | Saudi Arabian Oil Company |
| 3.707 | 18,365.7 | 19,046.5 | Rabigh Refining and Petrochemical Company |
| 19.13 | 5,615.4 | 6,689.9 | The National Shipping Company of Saudi Arabia |
| -3.69 | 1,038.0 | 999.7 | Aldrees Petroleum and Transport Services Company |
| United Kingdom | |||
| -27.33 | 228,780.0 | 314,819.5 | Shell plc |
| -24.43 | 3,182.9 | 4,211.9 | Premier Oil plc |
| -24.44 | 2,231.7 | 2,953.6 | EnQuest PLC |
| -28.86 | 4,004.7 | 2,848.8 | Energean plc |
| -13.74 | 1,496.1 | 1,734.5 | KNOT Offshore Partners LP |
| -59.71 | 4,069.8 | 1,639.7 | RAK Petroleum plc |
| -1.704 | 1,557.5 | 1,584.5 | TORM plc |
| -2.72 | 1,534.5 | 1,577.4 | Navigator Holdings Ltd. |
| -1.928 | 1,134.4 | 1,156.7 | Nostrum Oil & Gas PLC |
| United Arab Emirates | |||
| -7.672 | 1,974.8 | 1,823.3 | Dana Gas PJSC |
| -13.8 | 1,259.5 | 1,085.7 | Brooge Energy Limited |
| 1.734 | 1,557.5 | 1,584.5 | National Oil |
| 2.796 | 1,534.5 | 1,577.4 | Abu Dhabi National Energy |
| 1.966 | 1,134.4 | 1,156.7 | ENOC - Emirates National Oil Company |
| United States of America | |||
| -1.667 | 258,388.9 | 254,081.0 | Chevron Corporation |
| -30.08 | 97,331.6 | 68,056.1 | Occidental Petroleum Corporation |
| -8.359 | 93,573.4 | 85,751.4 | Energy Transfer LP |
| -14.5 | 89,747.6 | 76,730.0 | Enterprise Products Partners L.P. |
| -19.48 | 86,532.3 | 69,676.4 | Kinder Morgan, Inc. |
| -20.61 | 78,869.6 | 62,611.5 | Marathon Petroleum Corporation |
| -25.08 | 102,942.6 | 77,121.4 | ConocoPhillips |
| 32.1 | 47,452.1 | 62,685.9 | Phillips 66 |
| -4.063 | 56,543.4 | 54,245.8 | The Williams Companies, Inc. |
| -1 | 53,192.1 | 53,051.0 | EOG Resources, Inc. |
| -4.352 | 50,732.8 | 48,524.7 | MPLX LP |
| 12.03 | 42,555.6 | 47,676.6 | Valero Energy Corporation |
| -20.19 | 58,687.9 | 46,836.5 | Cheniere Energy, Inc. |
| 7.422 | 40,393.9 | 43,391.9 | ONEOK, Inc. |
| -4.133 | 36,673.2 | 35,157.6 | Cheniere Energy Partners, L.P. |
| Mean | -11.10% | ||
| t-test | -1.96a | ||
| Median | -48.00%b | ||
| Wilcoxon | -2.72c |
a Statistical significance at the 10% level. b Statistical significance at the 5% level. c Statistical significance at the 1% level.
Disclaimer/Publisher’s Note: The statements, opinions and data contained in all publications are solely those of the individual author(s) and contributor(s) and not of MDPI and/or the editor(s). MDPI and/or the editor(s) disclaim responsibility for any injury to people or property resulting from any ideas, methods, instructions or products referred to in the content. |
© 2024 by the authors. Licensee MDPI, Basel, Switzerland. This article is an open access article distributed under the terms and conditions of the Creative Commons Attribution (CC BY) license (http://creativecommons.org/licenses/by/4.0/).
Copyright: This open access article is published under a Creative Commons CC BY 4.0 license, which permit the free download, distribution, and reuse, provided that the author and preprint are cited in any reuse.


