
Submitted:
10 October 2025
Posted:
11 October 2025
You are already at the latest version
Abstract
Airborne particle concentrations were quantified during the processing of textile polyester materials at the beginning and end of a work shift. Online particle concentration monitoring combined with offline microscopic evaluation of filter samples revealed that small particles dominated numerically, whereas larger particles, though less abundant, contributed disproportionately to particle mass. Correlative scanning electron and Raman microscopy showed a heterogeneous mixture of particle types, including mineral particles, particles of organic material, soot, black tyre rubber, polyester particles and fibres, together with other microplastics. For the inhalable PM10 fraction, mass-based occupational exposure limits were exceeded. The study shows that textile production can generate complex mixtures of airborne particles. It highlights the importance of assessing exposure using both particle number and mass metrics.
Keywords:
occupational exposure
; microplastics
; correlative microscopy
1. Introduction
Plastics are defined by the International Union of Pure and Applied Chemistry (IUPAC) as polymer materials that can include a large variety of additives, including UV stabilizers, fillers and dyes, to improve performance and reduce production costs [1]. According to OECD in 2022, the world produces more than 430 million metric tons of plastics per year [2] – generally derived from fossil fuel and gas precursors. The most frequently-used types being polystyrene (PS), polyethylene terephthalate (PET), polyurethane (PUR), polypropylene (PP), polycarbonate (PC), polyamide (PA), polyvinyl chloride (PVC), and polyethylene (PE). Ubiquitous in modern society, plastics are employed widely across a multitude of domestic, industrial, and technological applications. With their industrial-scale production, plastics have become indispensable due to their versatility, high performance, and low cost. Today, over 5,000 types of plastics are marketed, many containing hundreds of chemicals, posing ecological hazards when released into the environment. This massive and widespread use has raised environmental and health concerns [3,4,5,6,7].
The smaller fractions of plastic litter can be classified as microscale plastics particles (microplastics, MPs, < 5 mm) or nanoscale plastics (nanoplastics, NPs, <1 μm). For both, the combined term micro- and nanoplastics (MNPs) is used. MNPs can be distinguished into two general material classes: primary MNPs, intentionally manufactured for products such as cosmetics, and secondary MNPs, formed from disintegration of larger plastic items like bottles, bags, and textiles [8,9,10]. MNPs contribute to “white pollution”, i.e., the visible accumulation of plastic waste in the environment [11,12]. Fibrous MNPs, primarily released through textile production, use, and laundering, are mostly composed of polyester, polypropylene, polyamide, or polyacrylic fibers. They are a major source of microplastic pollution. Up to 70% of the fibers that enter wastewater treatment plants are estimated to originate from textiles [10,13,14,15].
Airborne particle and fiber inhalation can contribute significantly to human MNP exposure, alongside with ingestion and dermal contact [16,17]. MNPs can contain and adsorb for organic and inorganic contaminants [18], act as substrates for microorganisms, and, after ageing, host polymer derivates that result from oxidation and photolysis. Such contaminants can induce to environmental and biological toxicity of initially inert materials [19]. A growing body of experimental and review studies consistently report oxidative stress, inflammation, tissue damage, and particle translocation to organs, suggesting systemic health risks resulting from MNP exposure. However, most data derive from in vitro or high-dose animal and cell studies, limiting direct extrapolation to real-world human exposure. There remains an urgent need for standardized exposure assessments and human-based evidence to clarify the epidemiological relevance of these findings [20,21,22].
Assessing exposure to MNP at workplaces and in the environment is generally difficult since they occur as part of a complex aerosol. Direct-reading particle concentration instruments and aerosol filter sampling that do not perform airborne particle classification based on morphology and chemical substance only serve to assess the general particle burden. For mixtures of airborne fibers and particles and their agglomerates, scanning electron microscopy (SEM) based measurement strategies have been developed that use morphological properties to recognize, classify and quantify nanofiber concentrations at workplaces where nanofibres of known origin are handled [23]. However, for complex mixtures of particle and fibers of unknown origin and composition, a purely SEM-based strategy will fail. Instead, analytical methods must be included that are capable of identifying particle chemistries. SEM secondary electron imaging allows for fast and very high-resolution imaging. Using SEM-based energy dispersive x-ray spectroscopy (EDS), many inorganic particles can be classified based on their elemental composition. However, for most carbon-based materials, EDS-derived elemental compositions do not allow for MNP particle identification. In recent years, Raman microscopy has gained importance in the field of MNP analysis. Raman spectroscopy allows identifying many chemical groups and molecular structures even of micro- and nanoscale particles, including polymers and carbon materials [24,25]. In order to image, localize, elementally and chemically characterize and, finally, identify individual micro- and nanoscale particles, the present study correlated morphological and elemental information from SEM/EDS to chemical information from Raman microscopy with high spatial resolution. This way correlative microscopy allowed assessing the exposure to microplastic particles at workplaces in the textile industry.
In this study, airborne particles were collected at a workstation within a Romanian polyester microfiber textile manufacturing factory on filters and analyzed using correlative microscopy (CM) to characterize the inhalable and respirable fractions, identify potential emission sources, and improve air quality management strategies.
2. Methods
2.1. Sampling Site
Aerosol sampling was conducted at two time points (T1 and T2), while workers were at their workstations in the production environment of a Romanian textile production facility. The study focused on cutting and sewing processes, which were expected to generate and emit fine particles and microfibers due to friction and high working speeds. Sampling was synchronized with the production schedule: the first measurement (T1) commenced at 07:00 AM, and the second (T2) at 03:00 PM.
2.2. Aerosol Sampling
Two VDI-3492-compatible samplers were used (GSA Messgerätebau GmbH, Ratingen, Germany). They hosted track-etched membrane filters made of PC with a diameter of 25 mm, 10 % porosity and pores of 0.8 µm in diameter, manufactured by APC, Eschborn, Germany. The samplers were positioned at the same height as the machine’s working point and at a distance of 30–50 cm. In contrast to standard 40 nm top and 20 nm bottom sputter-coated air sampling filters for SEM analysis, these filters were prepared with a 60 nm thick top and 40 nm bottom gold coating. This effectively suppressed Raman signal from the PC of the filter to interfere with particle signals, but effectively reduced filter pore sizes to ca. 0.6 µm
Thus, for particles larger than ca. 0.6 µm, a near 100% collection efficiency can be expected. Collection efficiency is the ratio of particles deposited on the filter membrane’s surface to all incoming particles. As non-impacting smaller particles can get lost through or inside the filter pores, only particle deposited on the membrane surface are microscopically detectable. The size-dependent filter collection efficiency for particles smaller than 0.6 µm is unknown but most likely decreases to a few percent only for nanoscale particles.
The samplers were connected to Gilian GilAir Plus (Sensidyne, St. Petersburg, USA) personal sampling pumps that were operated at a constant flow. For this study, a flow rate of 2.5–3 L/min was applied. The ambient conditions during sampling were temperatures of 25–28 °C (77–82.4 °F) and relative humidity of 45–53%.
2.3. Filter Weighing
Filters were weighted prior to aerosol sampling and afterwards following ISO 15767.
2.4. Fiber Identification
Since all sampling sites were located within a textile production facility, where polyester microfibers were handled, emissions of fibrous polyester fragments were apparent. A fibrous particle is classified as “fiber” based its geometric properties derived from its 2-dimensional microscopic projection image. Specifically, so-called WHO-fibers were to be identified. They are defined in accordance to the WHO counting convention by a length > 5 µm, a diameter < 3 µm and a length-to-diameter aspect ratio > 3:1. Thus, all objects detected on SEM images of the filter surface were characterized morphologically and classified. WHO-fibers were quantified with respect to the analyzed air volume.
2.5. Procedure for Correlative SEM-Raman Microscopy
Filter samples were analyzed using correlative microscopy (CM), combining SEM (SU8230 by Hitachi, Tokyo, Japan) and Raman microscopy (RM, Alpha300 apyron by WITec, Ulm, Germany). Both microscopes were equipped with fully motorized, software-controlled stages. For Raman microscopic imaging, a Zeiss EC Epiplan-Neofluar 100X/0.9NA objective (Zeiss, Oberkochen, Germany) was used. Video camera imaging resulted in an additional magnification factor 11.6X. Raman spectra were acquired using a laser wavelength of 532 nm and 1 mW laser power, a spectrometer of 300 mm focal length equipped with a grating of 600 lines/mm blazed at 550 nm and an EM-CCD camera. For each filter sample, 50 SEM micrographs of 5120 x 3840 pixels were acquired with a pixel resolution of 24.8 nm, corresponding to a magnification 1000X. For secondary electron (SE) imaging, an acceleration voltage of 0.8 kV was used. The image frames were randomly distributed across the filter using custom control and acquisition software that took care of correlating a sample-specific coordinate system to the stage coordinate system. To further increase the spatial correlation of the SEM and Raman analysis data, the random filter pore pattern was used. By matching the pore pattern of the optical microscope image of the filter frame to that in the SEM image, spatial correlation accuracies well below 100 nm were achieved. For Raman analysis, a subset of 10 of the 50 SEM images was selected randomly. These 10 images were sufficient to extrapolate Raman-derived particle identity statistics to the total filter area, as is manifested in the narrow 95% confidence intervals of the results.
SEM acquisition, particle counting rules, particle analysis and data evaluation followed the procedure described in CEN/TS 18117:2025-04: “Workplace exposure – Detection and characterization of airborne NOAA using electron microscopy – Rules for sampling and analysis” [26].
2.5.1. AI-Assisted Particle Analysis
For particle analysis, custom software (FibreDetect) was used. Using a pre-trained artificial neural network (ANN), binary semantic segmentation of SE images was performed. Groups of pixels classified as “non-filter” by the ANN allowed to locate image areas that showed collected particles [27]. As the pre-trained ANN’s performance was not satisfactory, resulting in artifacts and unidentified particles, the ANN was re-trained with annotated SE images from BAuA’s training image repository containing indoor and outdoor aerosol samples showing dust particles of various size, morphology and other distinctive features as well as similar substrate-related background properties. For the re-trained ANN, the segmentations still required visual validation and minor manual rework, either by deleting artifacts or by manually segmenting unrecognized particles. These corrected image annotations will allow to improve the ANN’s performance in future.
2.5.2. Raman-Analysis of Particle of Interest
Particle of interests (POI) were selected based on their minimum size for the following two reasons. As mentioned above, for particles smaller than ca. 0.6 µm, collection efficiency was undetermined and thus extrapolated results highly inaccurate. Also, for smaller particles weaker Raman signals result. Their detectability however also depends on Raman scattering behavior of the particle’s material. Very small and/or low Raman active particles can require long signal integration times and/or high laser powers to obtain spectra. Polymer-based particles on dry filters, however, may be prone to laser irradiation damage. Hence it was decided to use a 2-D-projected SE image area threshold of about 500 000 nm² as a POI-selection criterium, which corresponds to the area of a filter pore of ca. 0.8 µm in diameter.
Reference spectra were acquired on original textile samples from the production site and added to the reference library. On these materials, strong calcium carbonate signals contributed to the spectrum and mixed with the polymer signals. Calcium carbonates are used as water-repellants and are frequently employed as fillers and performance enhancers, particularly in non-woven fabrics, with the objective of enhancing mechanical strength, tear resistance, and durability [28]. Furthermore, it is employed as a sizing agent and it use extends even to the realm of environmental management, where its ability to decolorize dyes in wastewater is particularly advantageous [29].
Selected filter particles were chemically characterized by RM. Collected spectra were compared to those in the reference library to determine material identities. Spectral acquisition and averaging continued until a good signal-to-noise ratio and a ≥ 70% match with a database reference spectrum was reached, using the instrument’s analysis software TrueMatch (WITec, Ulm, Germany). In addition, the study-specific reference material library, also the commercially available ST-Japan database was employed. Identifications were verified visually and refined when necessary.
Black tire rubber particles proved difficult to identify. They showed rather variable spectra, since tire compositions differs depending on manufacturer and ageing state. Tire rubber typically contains ~28% carbon black, 14% natural rubber, 27% synthetic rubber, 14% steel wire, and 16% fillers, fabrics, additives, and sulfur-containing vulcanization chemicals [30]. Carbon black (soot) displays two characteristic Raman peaks: the G-peak at 1582 cm⁻¹ (sp²-hybridized graphitic carbon) and the D-peak at 1345 cm⁻¹ (structural defects, heteroatoms). Signals of natural and synthetic rubber occur mainly in the fingerprint region (400–1800 cm⁻¹) and at ~2900 cm⁻¹ (CH₂-stretch), but in black rubber characteristic bands are often masked by carbon black. The rubber contribution at 1600 cm⁻¹ can merge with the carbon G-peak. The latter serve to differentiate between black tire rubber and other rubber particles.
2.5.3. Chemical Classification for Substance-Specific Particle Counting
Particles were grouped into different classes based on their chemical composition as determined by Raman spectroscopy (e.g., PET, PP, mineral, soot). Particle classes were included into the exposure evaluation when at least three particles of the same chemical substance were detected inside of the analyzed area. Particles not meeting this criterion were assigned to the “Other” category. Particles that could not be identified based on the matching with Raman reference spectra were classified as “Unknown”. Those particles that were below the area threshold but were nonetheless collected on the filter were not analyzed and labelled “Not classified”. These generally nanoscale particles were most probably of combustion origin, e.g., soot.
Fibers underwent additional Raman analysis to determine their polymer-type and identify those that were most likely organic. Also, skin flakes sometimes appeared elongated.
2.5.4. Determination of Particle Number Concentration
The CM analysis procedure resulted in a dataset of particle counts per class together with the projected areas, minimal and maximal Feret diameters of all located particle segments. The procedure used to extrapolate results based on relatively small filter areas represented by 10 SEM images to air concentrations is described in CEN/TS 18117:2025-04 and Ref. [23]. From the resulting count statistics, 95% confidence intervals (CI) of the expectation value of particle counts per SEM image were calculated. The average particle number concentration and its CI resulted as ratio of these values and the product of the specific sampling volume with the evaluated filter area. The specific sampling volume being the ratio of the total sampled air volume and the open filter area. The evaluation area was determined by the evaluated number of SEM images times their area of about 127 x 95 µm².
The dataset from the CM analysis procedure therefore yielded CIs and expectation values for number concentrations per particle class, thus material-specific concentrations. Fiber counts were handled in the same manner.
Descriptive statistics for the particle sizes gave substance-specific mean particle sizes and their standard deviations. There is no established size-representing metric for particles since SEM images provide only 2D projections. Projected area diameters as well minimal and maximal Feret diameters are routinely measured but their interpretation in terms of particle volume is lacking due to missing information about the third dimension. Therefore, particle volumes were approximated geometrically. Particle minimal and maximal Feret diameters were used to construct ellipsoids, with volume calculated as:
This particle volume was used to determine the diameter of an equivalent sphere as a representative of particle size.
2.5.5. Estimation of Particle Mass Concentrations
The calculated ellipsoid volumes in each particle class bin were factored with the substance-specific material densities, given by the Matweb.com material property online database to determine particle masses. For “Other”, “Unknown” and “Not classified” particles, unit density was assumed. The sum of all particle masses in each class bin represents the substance-specific total particle mass.
The ellipsoid-volume converted to an equivalent sphere diameter of unit density was used as proxy for the aerodynamic diameter and allowed to differentiate inhalable (PM10 – particulate matter with sizer smaller than 10 µm) from respirable (PM2.5) fractions. In each class bin, particles smaller than the threshold diameters 10 µm and 2.5 µm were selected to determine the fractional particle mass.
In the same manner as the derivation of particle number concentrations, particle mass concentrations were subsequently determined. Although approximate, this method provided a reasonable estimate.
2.2. Real-Time Particle Measurement
A Mini-LAS 11-E Laser Aerosol Spectrometer (GRIMM Aerosol Technik, Muldenstausee, Germany) was used for online monitoring particle concentrations at the workplaces. This portable optical particle counter uses laser light scattering to detect and measure particles in the size range from 0.25 to 32 µm in 31 size channels. Assuming a standard material density, it reporResults of filter weighing and sampling conditionsts mass fractions (PM10, PM2.5) and full-size distributions if required. The device has a sample flow rate of ~1.2 L/min and a mass concentration range of 0.1–10,000 µg/m³. Measurements were conducted for particle diameters of 0.3, 0.5, 1.0, 2.5, 5.0, and 10 µm, with 20 repeated readings per size. In addition, mass concentrations for PM2.5 and PM10 were recorded 20 times each.
3. Results and Discussion
3.1. Aerosol Sampling and Correlative SEM-Raman Microscopy
3.1.1. Filter Weighing
Table 1 shows the results of particle collection on track-etched membrane filters at time T1 (sample T1) and time T2 (sample T2). Filters weights obtained prior and after sampling are given in Table 1. Mass concentrations were determined by the ratio of the weight difference of filters and the sampled air volume.
3.1.2. SEM Micrographs
Figure 1 shows representative SEM micrographs of the T1 filter together with magnified insets of selected particles. The images show that morphological or visual features alone are insufficient for particle material differentiation. Characterization via Raman spectroscopy was generally mandatory to identify a substance chemically.
3.1.3. Substance-Specific Particle Number Concentrations
Figure 2 (a,b) provides a graphical summary of particle concentrations related to chemical composition for the two PC filters. Detailed numerical results and full chemical compositions are provided in Table 2 (T1) and Table 3 (T2). Both samples were highly heterogeneous, comprising 9 (T1) and 8 (T2) distinct material classes.
The collected samples contained also organic material that could not be clearly identified but showed spectral characteristics of living organism and was therefore grouped as “Natural”. The “MNP” class comprises polymers that were not actively handled at the site, including PC, PS, PP, PA, and various non-black rubber types. The “Mineral” class comprises particles of various metal oxides and sulfates as well as quartz. Apart from PET, calcite was found on the T1 sample, a material supposedly used as additive to textiles, as described above. Particles of various chemical substances but occurring in one or two instances were allocated to the “Other” class, such as particles made from copper, various salts and pigments, amongst others.
Extrapolated particle number concentrations for each class determined the area of pie chart segments in Figure 2 (a,b). PET, the material actively handled onsite, was the dominant microplastic particle type in both samples, while black tire rubber contributed substantially to the aerosol background, alongside soot, mineral particles, and natural particles. Numerically, most particles were “Not classified” due to their small size, indicating strong underestimation of their extrapolated concentration and thus of the estimated total particle number concentration in the workplace atmosphere.
The additional analysis of fibers present on the filters yielded 22 WHO-fibers on 50 SEM images of T1, one of them being made from polyethersulfone (PES), the others most probably of natural origin. For time T2, 15 WHO-fibers were found on 50 SEM filters, two of them being black tire rubber, one nitrile rubber, the rest most probably from natural sources. These number can be converted to fiber concentrations of 626 fibers/m³ for time T1 and 318 fibers/m³ for time T2. Such exposure levels are far below occupational exposure levels that currently exist for asbestos-based WHO-fibers (e.g. 10 000 fibers/m³ in the European Union).
3.1.4. Estimated Particle Mass Concentrations
Figure 2 (c,d) shows pie charts of the estimated mass contributions. In this metric, “Not classified” particles contributed minimally due to their small mass, whereas classes with few but large particles—such as iron oxide and MNPs—dominated more in comparison to the particle number concentration reflection. Notably, total particle masses were similar for both samples. For time T1, the total mass aligned with gravimetric measurements of the polycarbonate filter (Table 1). This was not true for time T2, indicating unsuccessful filter weighing.
Figure 3 (a,b) shows stacked bar charts of total, PM10, and PM2.5 particle class. PM10 concentrations approximated total mass but were reduced by ~50% for both time T1 (127.1 µg/m³) for time T2 (120.2 µg/m³), whereas PM2.5 masses were roughly an order of magnitude lower (T1: 11.4 µg/m³, T2: 11.0 µg/m³).
Figure 3.
Stacked bar charts in of the total mass concentrations (dark teal), PM10 mass concentrations (teal) and PM2.5 mass concentrations (light teal) for all identified particles classes as well as their sum. (a) refers to sample T1, (b) to sample T2. Numerical values can be found in Table 2 for (a) and Table 3 for (b).
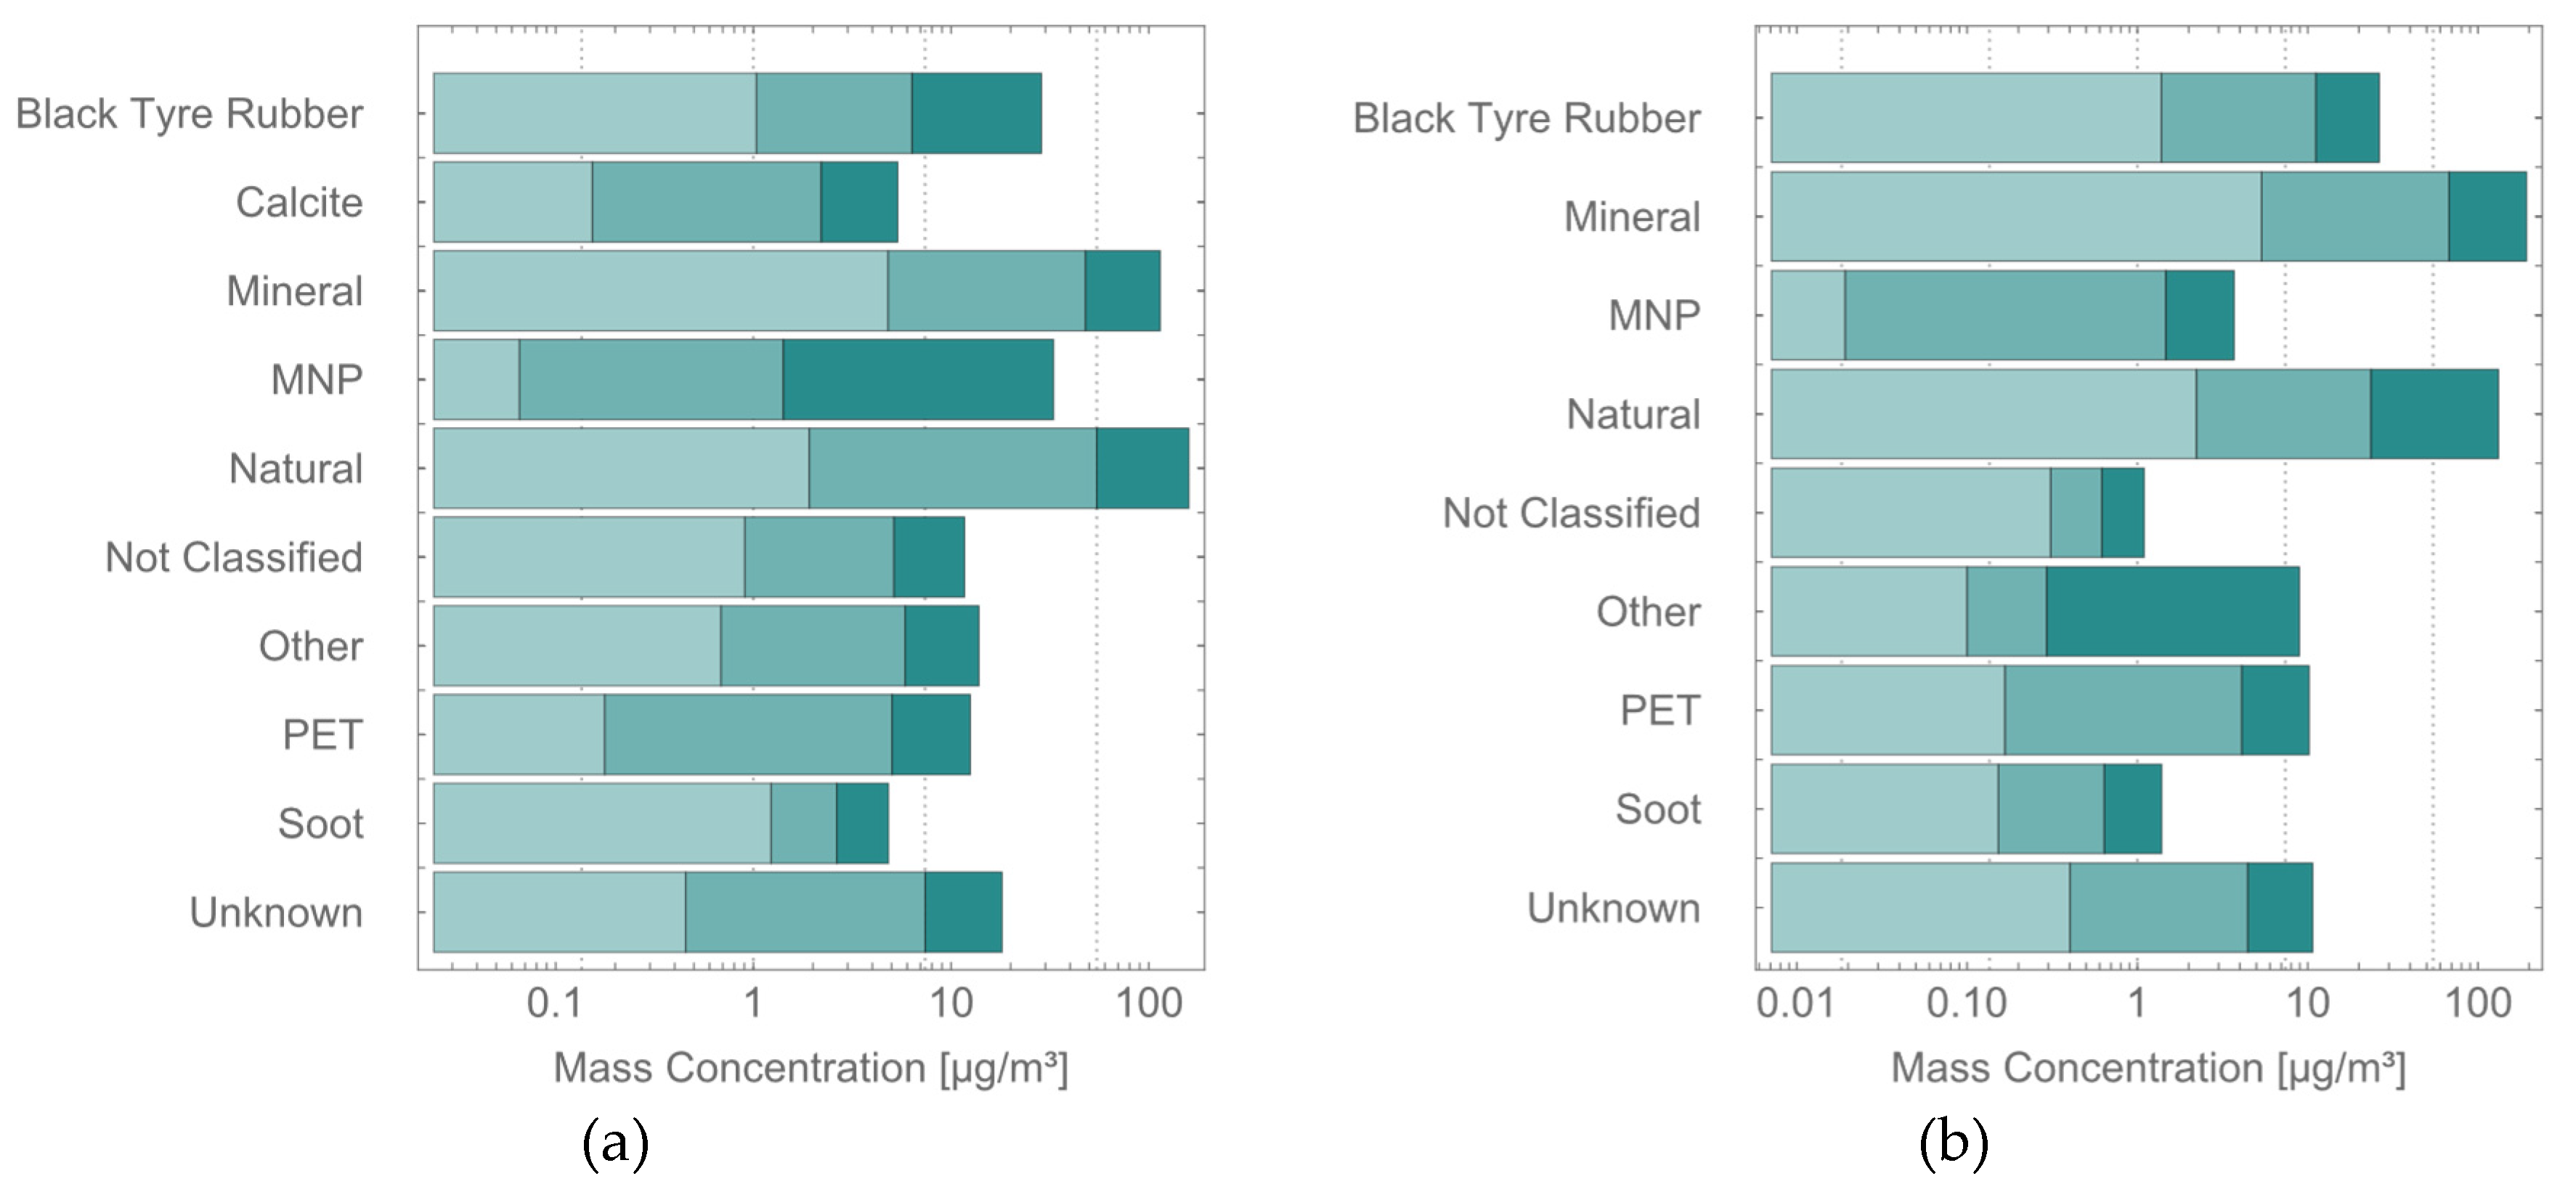
Figure 4.
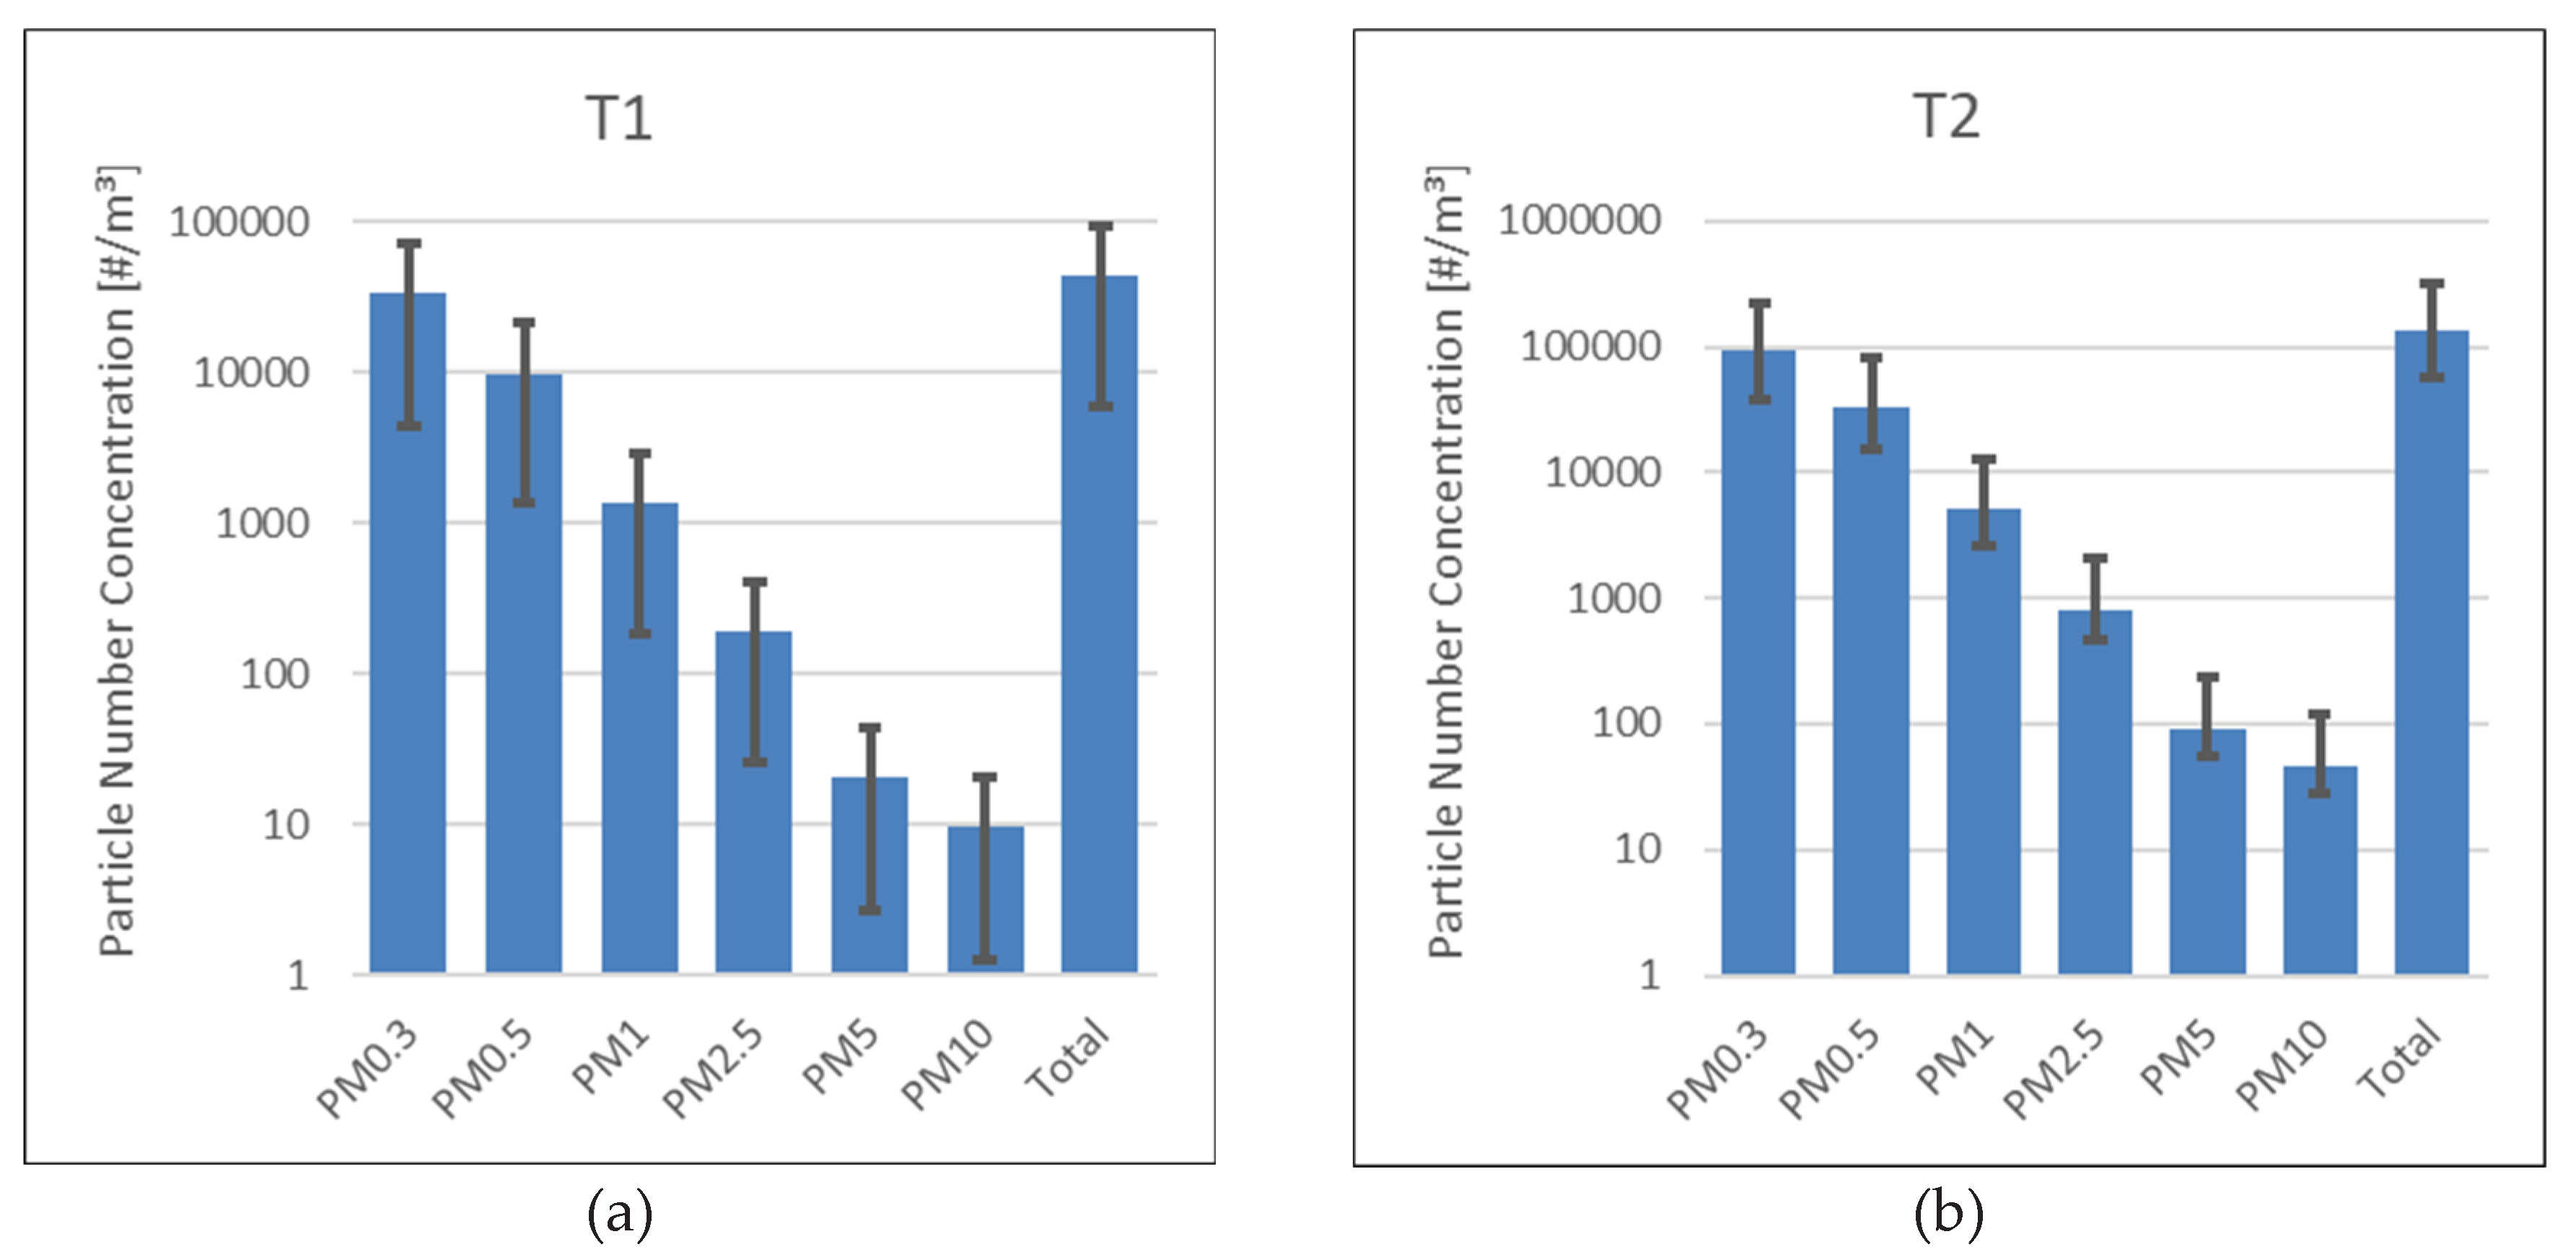
Particle size distributions as measured particle number concentrations in the available size channels of the OPC. Values are presented as means of a time series of 20 measurements. Error bars indicate standard deviations. (a) refers to sample T1, (b) to sample T2.
Figure 4.
Particle size distributions as measured particle number concentrations in the available size channels of the OPC. Values are presented as means of a time series of 20 measurements. Error bars indicate standard deviations. (a) refers to sample T1, (b) to sample T2.
Black tire rubber remained a dominant class across all size fractions, whereas PET particles contributed substantially less to the PM10 fraction compared with total mass. This indicates that PET particles released from onsite handling likely posed limited pulmonary exposure, whereas black tire rubber particles—part of the ubiquitous aerosol background—were the most prominent polymer-based exposure source. Their origin (indoor vs. urban traffic) remained uncertain.
Comparison with occupational exposure level values (OELVs) for indoor environments (24-hour averages: 45 µg/m³ for PM10, 15 µg/m³ for PM2.5) proposed in 2021 by the WHO [31] indicates that estimated PM10 concentrations exceeded the OELV at both sampling times, whereas PM2.5 concentrations remained near the guideline’s values.
3.2. Real-Time Measurements
Airborne particle concentrations measured by the OPC in each size channel were statistically processed using IBM SPSS Statistics. The analysis was based on 20 measurements, providing means as well as standard deviations to obtain the particle size distribution.
At time T1, the particle population was dominated by the smallest fraction, with decreasing counts observed for progressively larger particle sizes. OPC-measured PM10 mass concentration was ca. 24.5 µg/m³, for PM2.5, 9.7 µg/m³. At time T2, particle counts increased overall, with the size distribution still dominated by the smallest particles. PM10 mass concentration was ca. 101 µg/m³ and for PM2.5 40 µg/m³.
Both, OPC-based particle number and mass concentrations, are smaller in general compared to the values determined from CM analysis. This is most likely due to a lowered counting efficiency by of the OPC in mixed dust environment, which was attributed to various types of OPCs in a recent study by Plitzko et al. (2021) [32].
Of note, the proportion of the smallest particles (0.3 µm) decreased from 77% to 52%, while medium- and large-sized particles (1–10 µm) increased in both absolute number and relative proportion. However, this was not reflected in an increase in particle concentrations or even particle class fractional cardinalities determined by the CM analysis.
4. Conclusions
The air in the examined textile workplaces contained a highly heterogeneous particle mixture, including PET from onsite processing, black tire rubber from background sources, soot, minerals, and biological material. Morphological particle characterization alone was insufficient for differentiated particle exposure assessment. It was achieved only after spatially-correlated chemical identification via Raman spectroscopy.
PET dominated the microplastic particle number concentration but contributed less to respirable size fractions, suggesting limited pulmonary exposure risk. In contrast, black tire rubber particles were consistently abundant across all size fractions, representing the main polymer-based exposure source. Fibers released from the textile manufacturing processes were not found in significant quanta. Estimated PM10 concentrations exceeded WHO indoor guideline values at both sampling times, while PM2.5 values remained near the limits. Real-time OPC measurements underestimated concentrations compared to spatially correlated SEM imaging and Raman spectroscopy, reflecting OPC instrument limitations in complex dust environments.
These findings highlight the added value of correlative SEM–Raman microscopy. It combines morphological and chemical information to provide a reliable and comprehensive data set for the characterization of complex workplace aerosol exposures.
Acknowledgements
This project has received funding from the European Union’s Horizon 2020 research and innovation programme under grant agreement No 964766
References
- Vert, M. , et al., Terminology for biorelated polymers and applications (IUPAC Recommendations 2012). Pure and Applied Chemistry, 2012. 84, p. 377-410. [CrossRef]
- OECD, Global Plastics Outlook: Economic Drivers, Environmental Impacts and Policy Options. 2022: Paris.
- Rai, P.K. , et al., Micro- and nano-plastic pollution: Behavior, microbial ecology, and remediation technologies. Journal of Cleaner Production, 2021. 291: p. 125240. [CrossRef]
- Amato-Lourenço, L.F. , et al., An emerging class of air pollutants: Potential effects of microplastics to respiratory human health? Science of The Total Environment, 2020. 749: p. 141676. [CrossRef]
- Cerceo, E. , The climate crisis in clinical practice: Addressing air pollution, heat, and microplastics. European Journal of Internal Medicine, 2025. 139: p. 106435. [CrossRef]
- Udovicki, B. , et al., Microplastics in food: scoping review on health effects, occurrence, and human exposure. International Journal of Food Contamination, 2022. 9, p. 7. [CrossRef]
- Koelmans, A.A. , et al., Risk assessment of microplastic particles. Nature Reviews Materials, 2022. 7, p. 138-152. [CrossRef]
- Osman, A.I. , et al., Microplastic sources, formation, toxicity and remediation: a review. Environmental Chemistry Letters, 2023. 21, p. 2129-2169. [CrossRef]
- de Oliveira, C.R.S. , et al., Fibrous microplastics released from textiles: Occurrence, fate, and remediation strategies. Journal of Contaminant Hydrology, 2023. 256: p. 104169.
- Zhang, Y.-Q. , et al., Environmental contamination by microplastics originating from textiles: Emission, transport, fate and toxicity. Journal of Hazardous Materials, 2022. 430: p. 128453. [CrossRef]
- Lin, Z. , et al., Current progress on plastic/microplastic degradation: Fact influences and mechanism. Environmental Pollution, 2022. 304: p. 119159. [CrossRef]
- Ali, S.S. , et al., Degradation of conventional plastic wastes in the environment: A review on current status of knowledge and future perspectives of disposal. Science of The Total Environment, 2021. 771: p. 144719. [CrossRef]
- Yadav, S. , et al., Recent analytical techniques, and potential eco-toxicological impacts of textile fibrous microplastics (FMPs) and associated contaminates: A review. Chemosphere, 2023. 326: p. 138495. [CrossRef]
- Jahandari, A. , Microplastics in the urban atmosphere: Sources, occurrences, distribution, and potential health implications. Journal of Hazardous Materials Advances, 2023. 12: p. 100346. [CrossRef]
- Acharya, S. , et al., Microfibers from synthetic textiles as a major source of microplastics in the environment: A review. Textile Research Journal, 2021. 91(17-18): p. 2136-2156. [CrossRef]
- Yang, Z. , et al., Human Microplastics Exposure and Potential Health Risks to Target Organs by Different Routes: A Review. Current Pollution Reports, 2023. 9, p. 468-485. [CrossRef]
- Ageel, H.K., S. Harrad, and M.A.-E. Abdallah, Occurrence, human exposure, and risk of microplastics in the indoor environment. Environmental Science: Processes & Impacts, 2022. 24, p. 17-31. [CrossRef]
- Emecheta, E.E. , et al., A comparative investigation of the sorption of polycyclic aromatic hydrocarbons to various polydisperse micro- and nanoplastics using a novel third-phase partition method. Microplastics and Nanoplastics, 2022. 2, p. 29. [CrossRef]
- United Nations Environment Programme and Secretariat of the Basel, R.a.S.C. United Nations Environment Programme and Secretariat of the Basel, R.a.S.C., Chemical ins Plastics - A technical report. 2023: Geneva.
- Jeong, E., J. -Y. Lee, and M. Redwan, Animal exposure to microplastics and health effects: A review. Emerging Contaminants, 2024. 10, p. 100369.
- Li, Y. , et al., Potential Health Impact of Microplastics: A Review of Environmental Distribution, Human Exposure, and Toxic Effects. Environment & Health, 2023. 1, p. 249-257. [CrossRef]
- Prata, J.C. , et al., Environmental exposure to microplastics: An overview on possible human health effects. Science of The Total Environment, 2020. 702: p. 134455. [CrossRef]
- Meyer-Plath, A. , et al. , Correction: Meyer-Plath et al. A Practicable Measurement Strategy for Compliance Checking Number Concentrations of Airborne Nano- and Microscale Fibers. Atmosphere 2020, 11, 1254. [Google Scholar] [CrossRef]
- Schymanski, D. , et al., Analysis of microplastics in water by micro-Raman spectroscopy: Release of plastic particles from different packaging into mineral water. Water Research, 2018. 129: p. 154-162. [CrossRef]
- Marina-Montes, C. , et al., Characterization of atmospheric aerosols in the Antarctic region using Raman Spectroscopy and Scanning Electron Microscopy. Spectrochimica Acta Part A: Molecular and Biomolecular Spectroscopy, 2022. 266: p. 120452. [CrossRef]
- CEN, DIN CEN/TS 18117:2025-04: Workplace exposure - Detection and characterization of airborne NOAA using electron microscopy - Rules for sampling and analysis. 2025.
- Peters, T.S. , John; Kämpf, Kerstin; Meyer-Plath, Asmus, AI-assisted Recognition of Fibre Instances in Scanning Electron Microscope Images for Aerosol Characterization and Exposure Assessment. submitted to Powder Technology, 2025.
- Thenepalli, T. , et al., A strategy of precipitated calcium carbonate (CaCO3) fillers for enhancing the mechanical properties of polypropylene polymers. Korean Journal of Chemical Engineering, 2015. 32, p. 1009-1022. [CrossRef]
- Yan, S. , et al., Synthesis, Characterization and Adsorption Properties of Low-cost Porous Calcined Dolomite Microspheres for Removal of Dyes. Journal of Wuhan University of Technology-Mater. Sci. Ed., 2019. 34, p. 507-515. [CrossRef]
- Palos, R. , et al., Waste Refinery: The Valorization of Waste Plastics and End-of-Life Tires in Refinery Units. A Review. Energy & Fuels, 2021. 35, p. 3529-3557. [CrossRef]
- Organization, W.H. , WHO global air quality guidelines: particulate matter (PM2.5 and PM10), ozone, nitrogen dioxide, sulfur dioxide and carbon monoxide. 2021, World Health Organization: Geneva.
- Plitzko, S. , et al., Bewertung optischer Aerosolspektrometer zur Bestimmung arbeitsplatz-und coronarelevanter Aerosole/Evaluation of optical aerosol spectrometers for the determination of workplace-and corona-relevant aerosols. Gefahrstoffe Reinhaltung der Luft, 2021. 81(1-02): p. 42-52. [CrossRef]
Figure 1.
SEM images of a section of the filter (top). Colored areas refer to particles found by the AI-based segmentation application. Scale bar 1 µm. Four particles are shown underneath in higher zoom level: (1) is a PET particle, (2) a mineral particle, (3) a black tire rubber particle, (4) a soot particle and (4) a fiber made from organic material. Scale bars 1 µm. These examples demonstrate that, at least for (1)-(3), identification of particle chemical substances based on distinctive morphological or shading features was not feasible. Instead, identification of the chemical substance was obtained by taking Raman spectra with the Raman microscope.
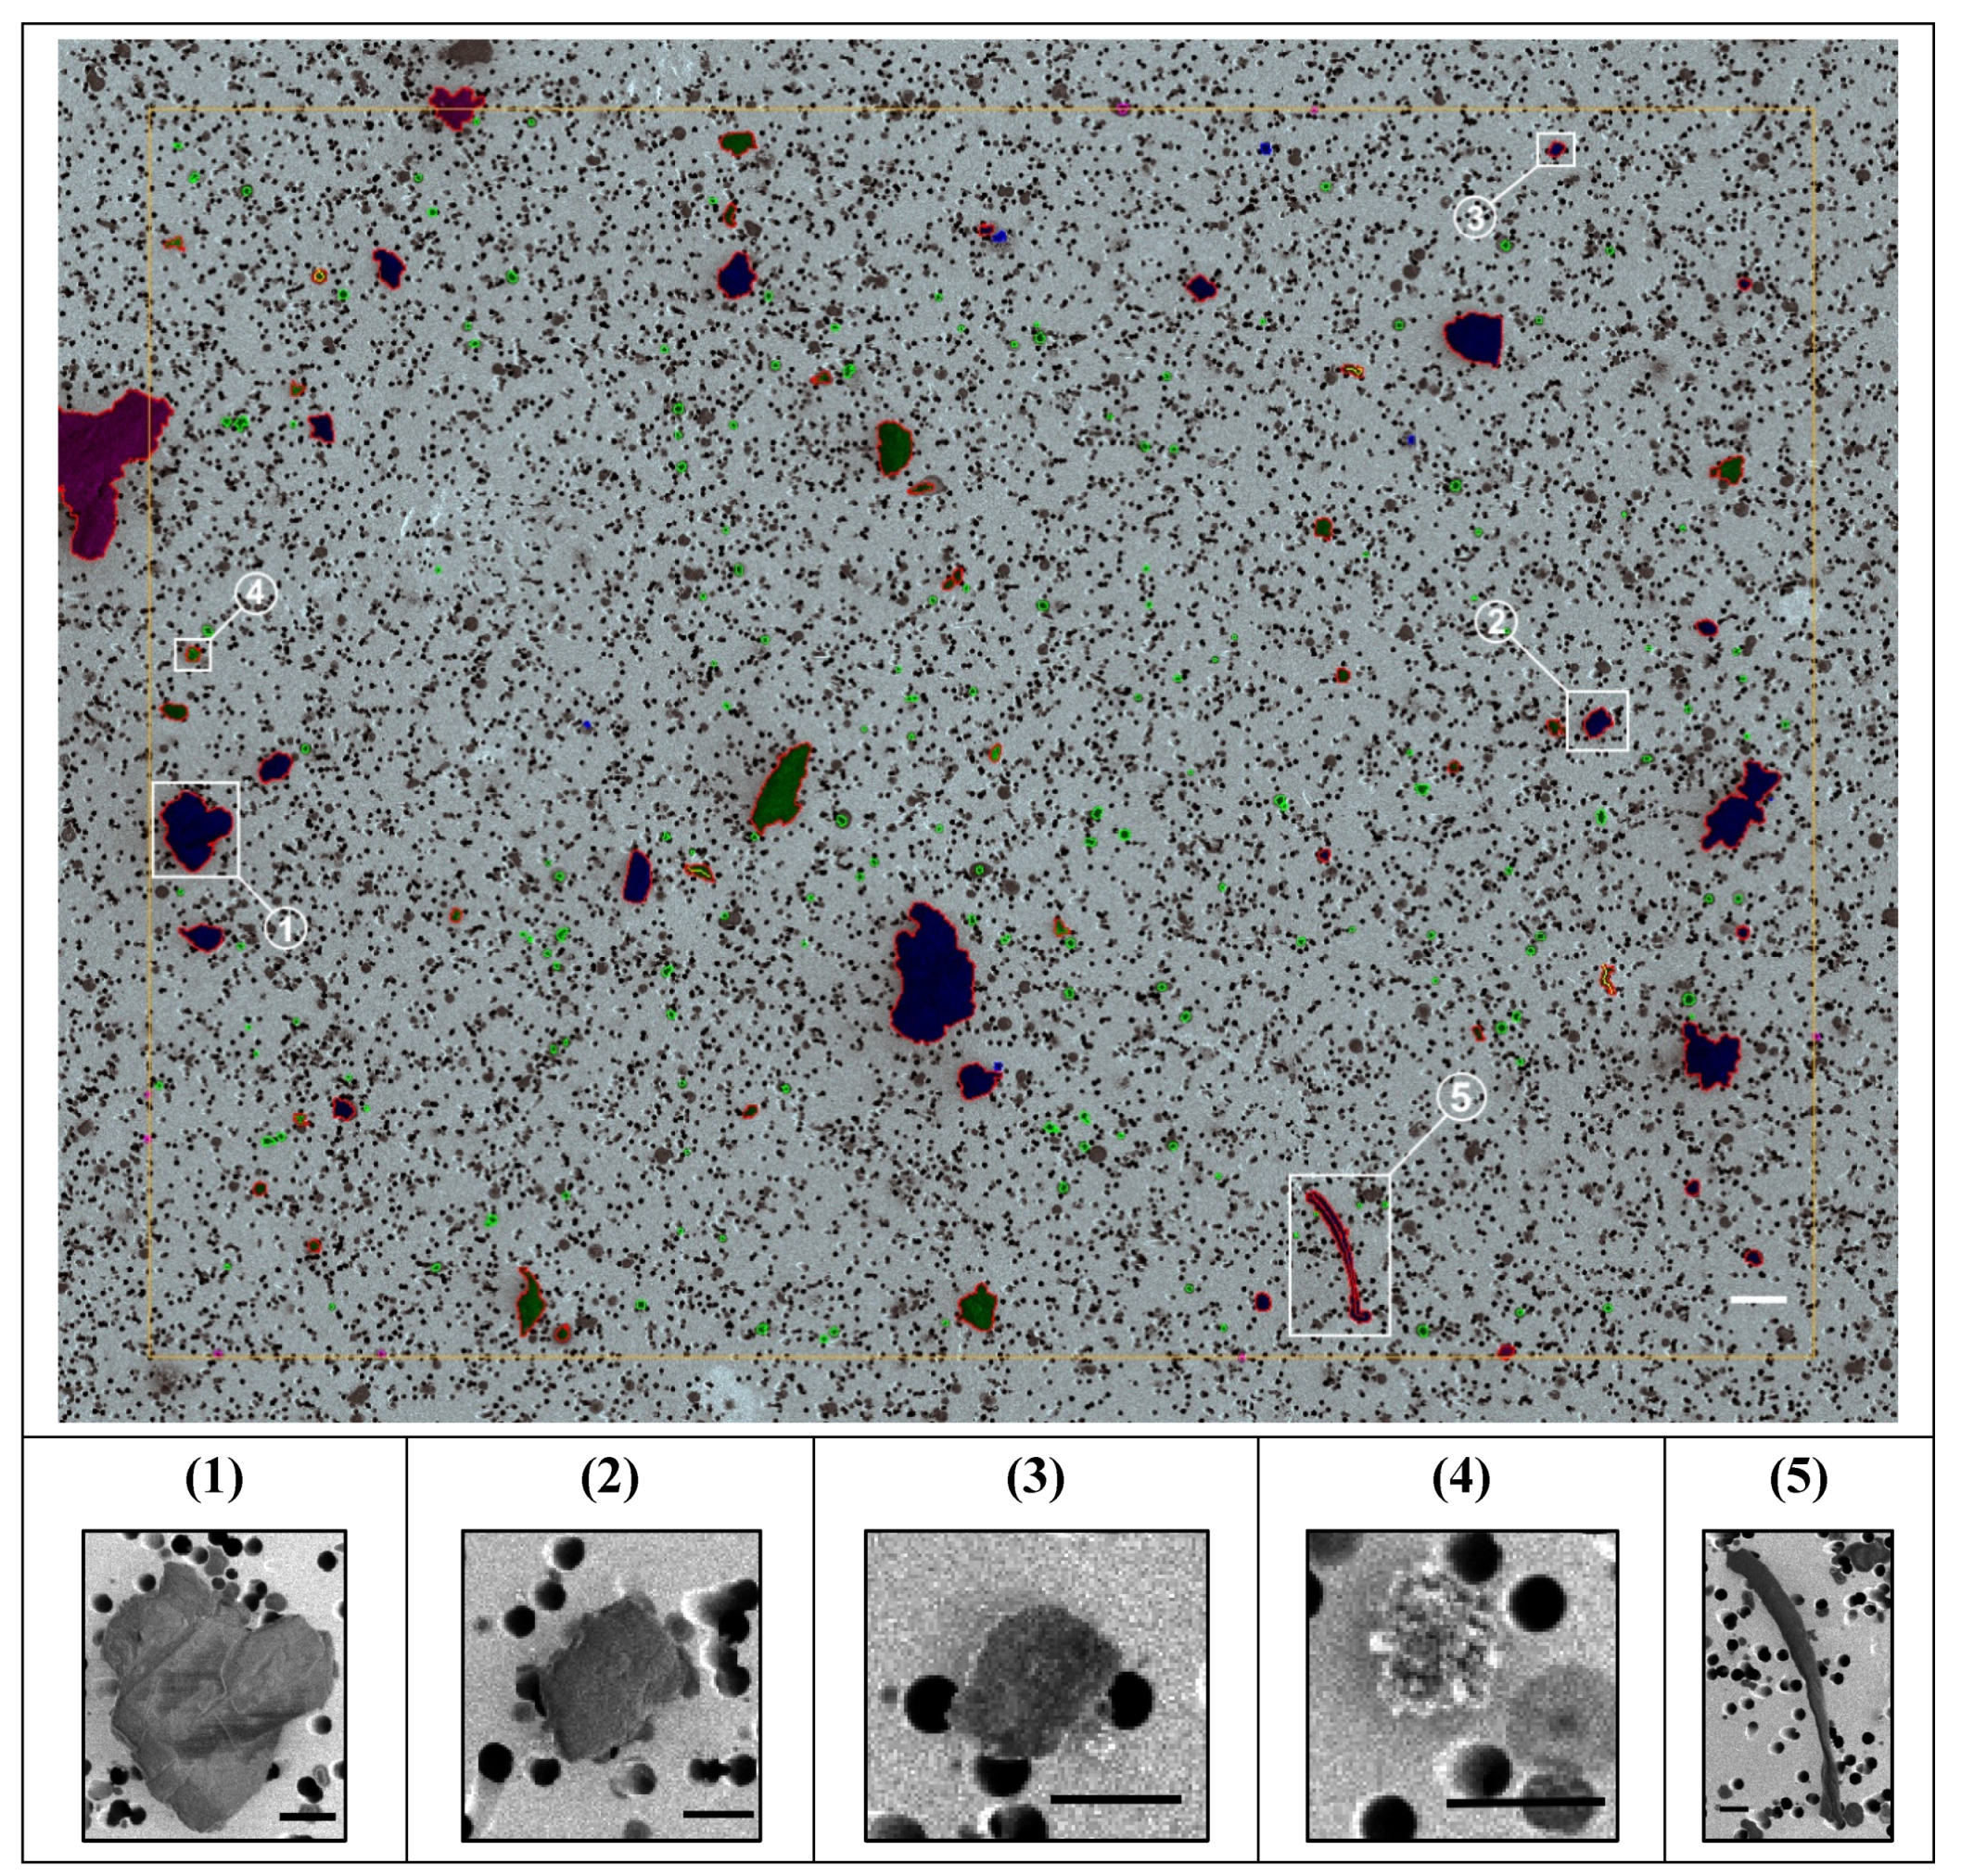
Figure 2.
Graphical summary of results obtained for the two filters with correlative SEM-Raman microscopy, shown in Table 2&3. (a,b) show pie charts correlating the particle classes defined by identified chemical substance, where pie pieces scale with midpoints of the 95% confidence intervals of particle number concentrations extrapolated from particle counts in SEM images. (c,d) show the estimated mass concentrations. Colored in blue tones are fractions of polymer-based particle classes, other (background) particle fractions are colored grey.
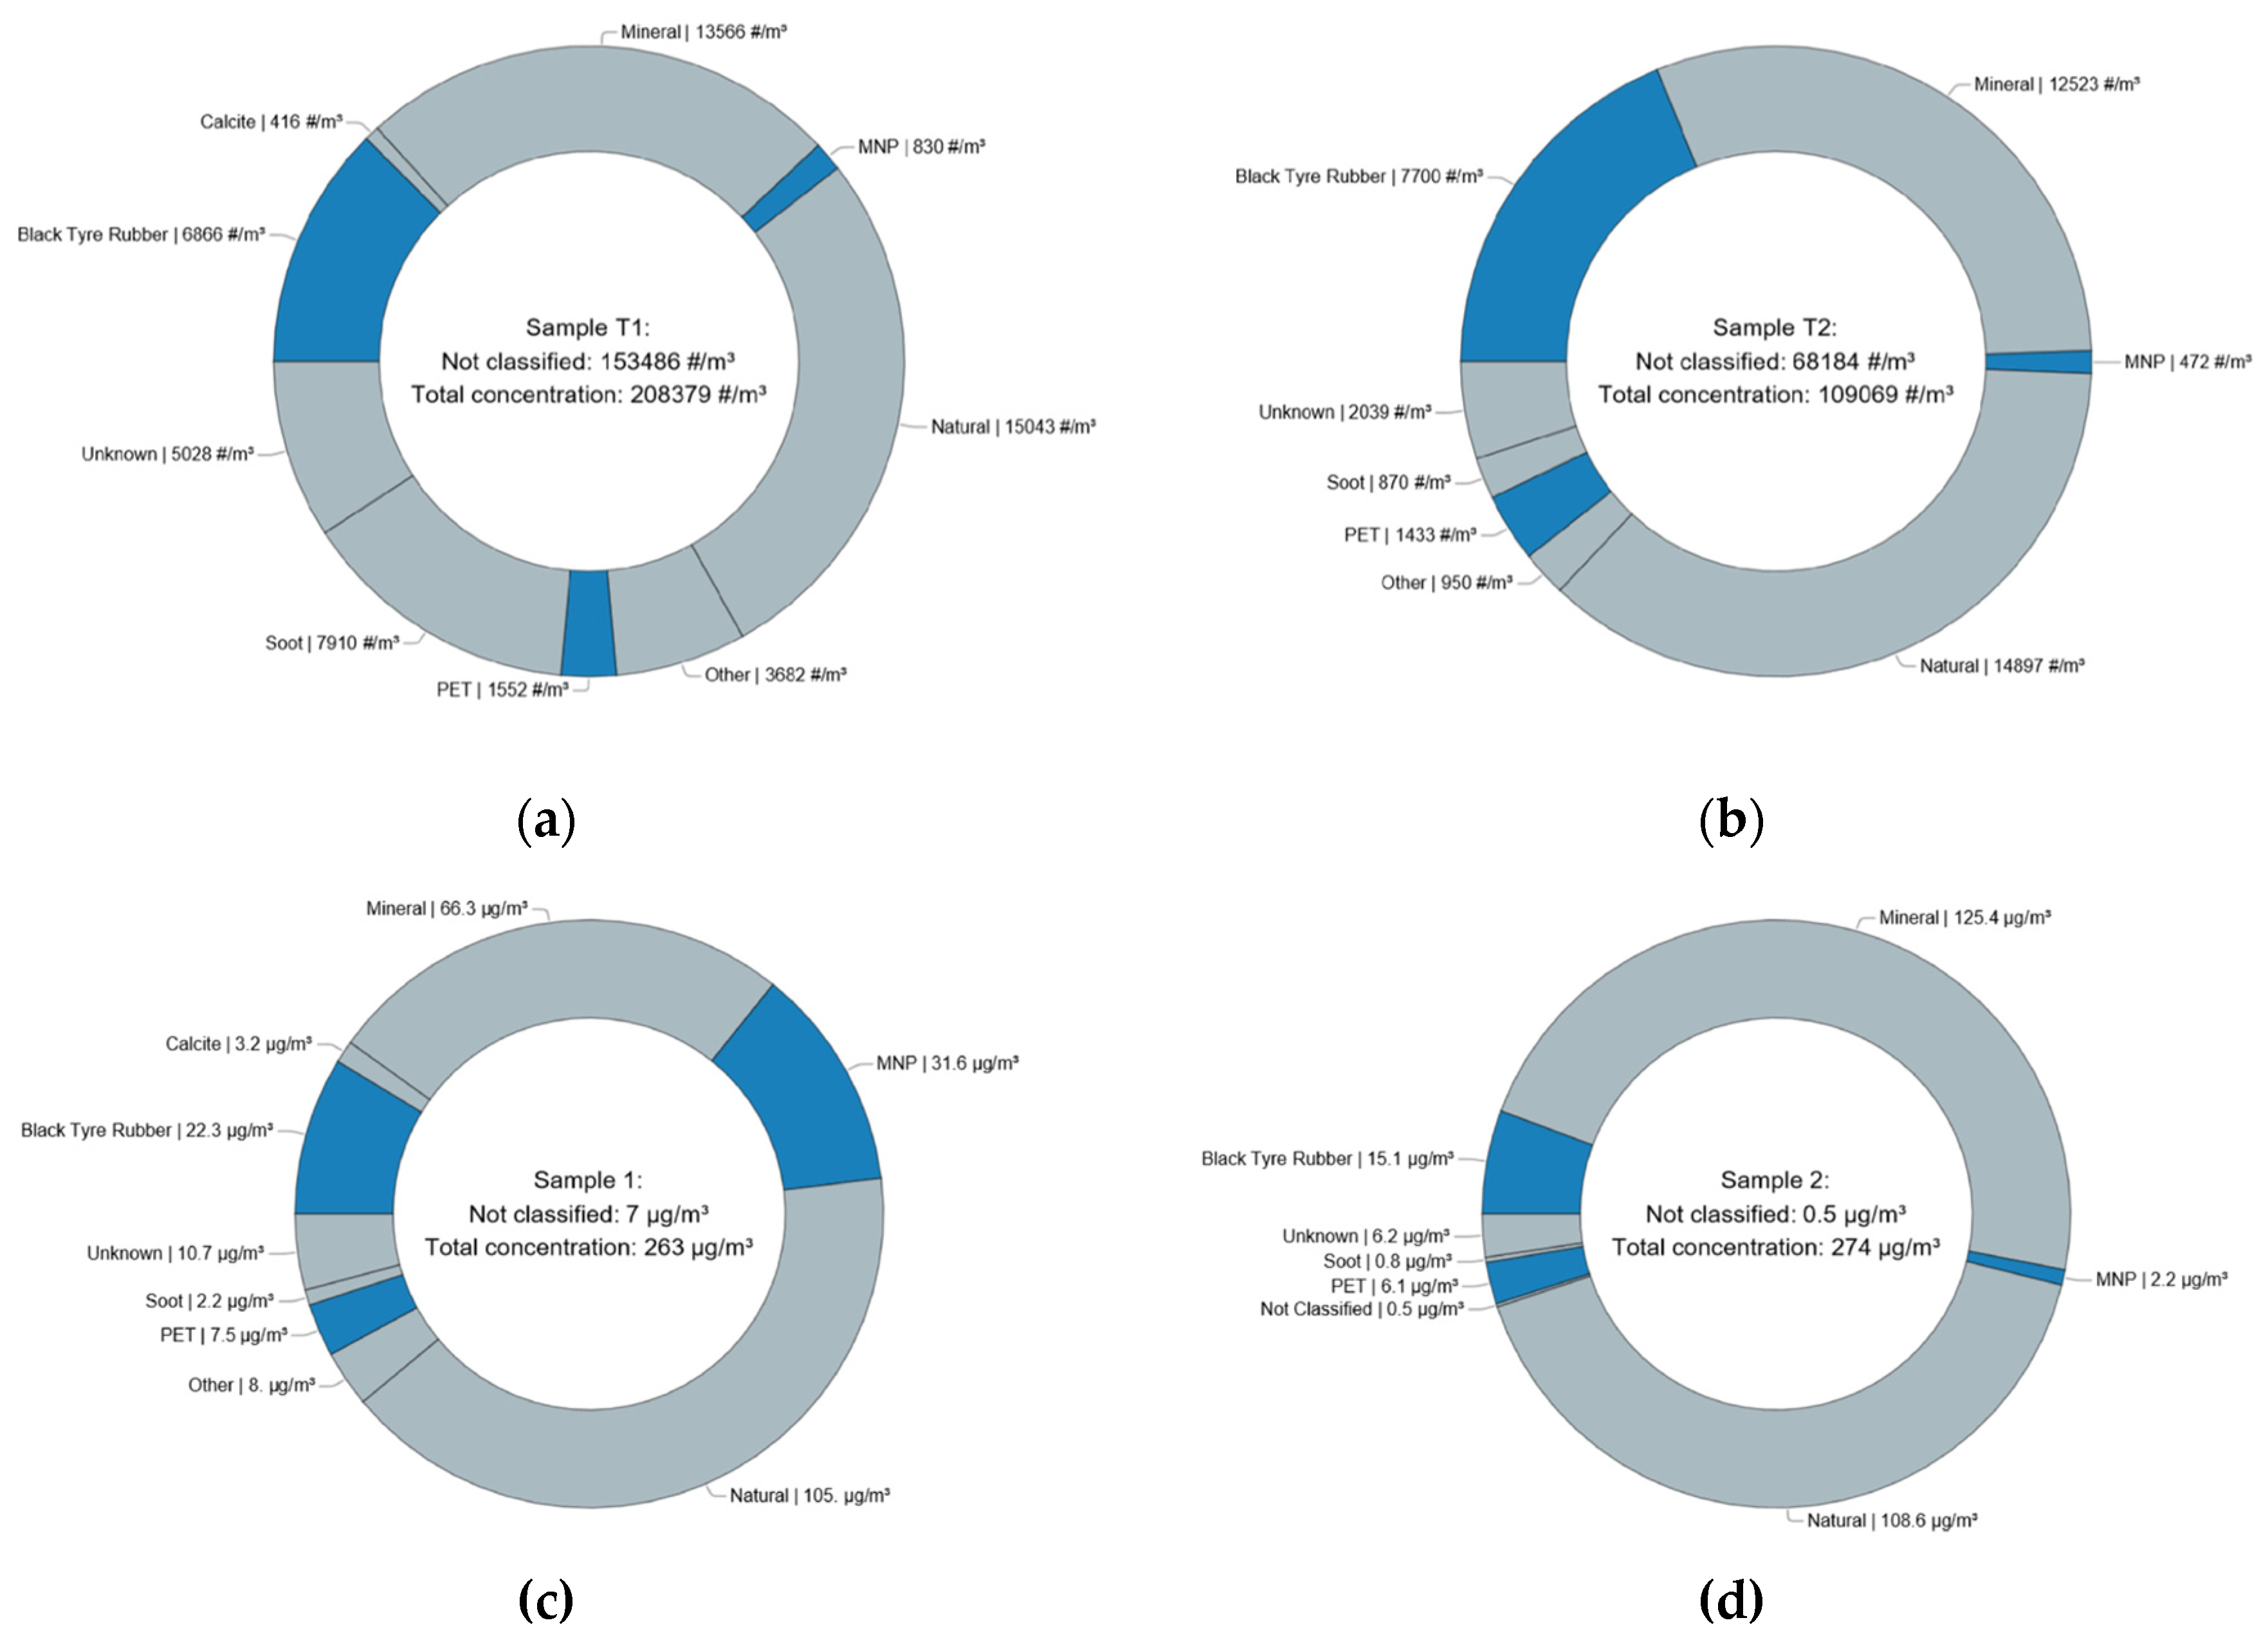

Table 1.
Results of filter weighing and sampling conditions.
| Sample | Filter weight [mg] | Air Volume (mL) | Concentration [µg/m³] | ||
| Initial | After | Difference | |||
| T1 | 3.974 | 4.062 | 0.088 | 347234 | 253.43 |
| T2 | 4.225 | 4.252 | 0.027 | 477804 | 56.50 |
Table 2.
Numerical results of the correlative microscopy procedure for sample T1.
| Sample T1 | Particle Number Concentration | Particle mass concentrations | Size statistics | ||||||
| Particle class | LCI [#/m³] | Midpoint [#/m³] |
UCI [#/m³] |
Density [g/cm³] |
Total [µg/m³] |
PM10 [µg/m³] |
PM2.5 [µg/m³] |
Mean [µm] |
SD [µm] |
| Black Tire Rubber | 5193.0 | 6866.4 | 8539.8 | 1.4 | 22.3 | 5.3 | 1.0 | 1.7 | 1.5 |
| Calcite | 51.5 | 416.2 | 780.9 | 2.7 | 3.2 | 2.1 | 0.2 | 2.7 | 1.8 |
| Mineral | 11213.4 | 13565.9 | 15918.4 | 2.5 | 66.3 | 43.1 | 4.8 | 2.1 | 1.3 |
| MNP | 273.1 | 830.0 | 1386.8 | 1.1 | 31.6 | 1.4 | 0.1 | 5.2 | 4.1 |
| Natural | 12566.2 | 15043.3 | 17520.4 | 1.0 | 105.0 | 52.7 | 1.9 | 2.6 | 2.3 |
| Not Classified | 145599.9 | 153486.1 | 161372.4 | 1.0 | 6.5 | 4.2 | 0.9 | 0.4 | 0.3 |
| Other | 2459.7 | 3682.0 | 4904.4 | 1.0 | 8.0 | 5.2 | 0.7 | 2.0 | 1.4 |
| PET | 769.1 | 1552.1 | 2335.1 | 1.4 | 7.5 | 4.9 | 0.2 | 2.9 | 1.6 |
| Soot | 6113.3 | 7909.7 | 9706.1 | 1.8 | 2.2 | 1.4 | 1.2 | 1.1 | 0.4 |
| Unknown | 3596.9 | 5027.6 | 6458.3 | 1.0 | 10.7 | 7.0 | 0.5 | 1.8 | 1.6 |
| Total | 187836.1 | 208379.3 | 228922.5 | 263.3 | 127.1 | 11.4 | |||
Table 3.
Numerical results of the correlative microscopy procedure for sample T2.
| Sample T2 | Particle Number Concentration | Particle mass concentrations | Size statistics | ||||||
| Particle class | LCI [#/m³] | Midpoint [#/m³] |
UCI [#/m³] |
Density [g/cm³] |
Total [µg/m³] |
PM10 [µg/m³] |
PM2.5 [µg/m³] |
Mean [µm] |
SD [µm] |
| Black Tire Rubber | 6255.5 | 7699.8 | 9144.0 | 1.4 | 22.3 | 5.3 | 1.0 | 1.6 | 1.2 |
| Mineral | 10682.3 | 12523.4 | 14364.6 | 2.5 | 3.2 | 2.1 | 0.2 | 2.4 | 1.7 |
| MNP | 133.7 | 471.9 | 810.1 | 1.1 | 66.3 | 43.1 | 4.8 | 3.1 | 1.4 |
| Natural | 12889.4 | 14897.0 | 16904.5 | 1.0 | 31.6 | 1.4 | 0.1 | 2.2 | 2.2 |
| Not Classified | 63898.9 | 68184.1 | 72469.2 | 1.0 | 105.0 | 52.7 | 1.9 | 0.3 | 0.2 |
| Other | 452.2 | 950.2 | 1448.2 | 1.0 | 6.5 | 4.2 | 0.9 | 2.3 | 2.9 |
| PET | 815.5 | 1433.1 | 2050.6 | 1.4 | 8.0 | 5.2 | 0.7 | 2.6 | 1.6 |
| Soot | 394.9 | 870.1 | 1345.2 | 1.8 | 7.5 | 4.9 | 0.2 | 1.3 | 0.9 |
| Unknown | 1299.3 | 2039.4 | 2779.5 | 1.0 | 2.2 | 1.4 | 1.2 | 2.4 | 1.5 |
| Total | 96821.7 | 109068.9 | 121316.1 | 252.6 | 120.2 | 11.0 | |||
Disclaimer/Publisher’s Note: The statements, opinions and data contained in all publications are solely those of the individual author(s) and contributor(s) and not of MDPI and/or the editor(s). MDPI and/or the editor(s) disclaim responsibility for any injury to people or property resulting from any ideas, methods, instructions or products referred to in the content. |
© 2025 by the authors. Licensee MDPI, Basel, Switzerland. This article is an open access article distributed under the terms and conditions of the Creative Commons Attribution (CC BY) license (http://creativecommons.org/licenses/by/4.0/).
Copyright: This open access article is published under a Creative Commons CC BY 4.0 license, which permit the free download, distribution, and reuse, provided that the author and preprint are cited in any reuse.


