
Submitted:
03 September 2024
Posted:
04 September 2024
You are already at the latest version
Abstract
Microplastic pollution, particularly particles smaller than 5 mm, poses significant environmental and health risks due to their potential for long-range transport and inhalation. This study provides the first long-term assessment of airborne microplastics in Porto, Portugal, over 18 months (September 2022 to March 2024). Bi-weekly samples were collected using a Microplastic Collector NILU, which were size-fractionated into five categories (>125 μm, 125-63 μm, 63-25 μm, 25-12 μm, and 12-1.2 μm), and quantified via optical microscopy. Microplastics (26 to 1,484 MPs/day/m²) and fibers (14 to 646 fibers/day/m²) showed increasing pollution trends. With a focus on the 12-1.2 μm size-range due to its classification as PM10 and PM2.5, the highest microplastic concentrations were 164 MPs/day/m² (12-1.2 μm) and 534 MPs/day/m² (25-12 μm). Recovery rates of methodology varied among polymers, with PP, PE-HD, and ABS showing high accuracy (75.9%) and PES significantly lower (26.5%). The study highlights significant temporal variability in airborne microplastic pollution, increasing trends, and the need for ongoing monitoring and targeted mitigation strategies to address associated health risks.
Keywords:
microplastics
; MPs
; quantification
; air
; atmosphere
; aerosols
; monitoring
; sampling procedure
; size fractionation procedure
; polymers recovery rate
1. Introduction
Initially investigated in marine ecosystems, microplastic pollution is now recognized as a concern issue in terrestrial and atmospheric environments. Airborne microplastics (MPs), defined as particles smaller than 5 mm suspended in the air by the European Chemicals Agency (ECHA), have drawn increasing attention due to their potential long-range transport and inhalation by organisms, including humans.
The European Union (EU) and the United States of America (USA) have initiated measures to address the growing problem of microplastics in the environment. However, regulations are still in the initial stages of development. The EU has been addressing microplastic contamination and on September 25, 2023, the European Commission published a Regulation [1], implementing restrictions on intentionally added microplastics under the REACH Regulation 1907/2006 [2], including a ban on loose glitter and microbeads. Furthermore, on May 12 2021, it adopted the EU Action Plan: Towards a Zero Pollution for Air, Water, and Soil [3]. This plan aims for a toxic-free environment by 2050, with key targets for 2030 including reducing plastic litter at sea by 50% and decreasing microplastics released into the environment by 30%.
USA legislative efforts have also been focused on reducing microplastic pollution. The Environmental Protection Agency (EPA) and the National Oceanic and Atmospheric Administration (NOAA) have played pivotal roles in these initiatives. The Microbead-Free Waters Act of 2015 [4] marked a significant step by banning the manufacturing and sale of rinse-off cosmetics containing plastic microbeads. NOAA's Marine Debris Program, initiated in 2015 and expanded in 2018, included research and action plans targeting microplastic pollution in marine environments [5]. Legislative actions continued with the Save Our Seas 2.0 Act in 2020 [6], which enhanced efforts to combat marine debris, including microplastics, through improved waste management and international cooperation. More recently, the proposed Break Free From Plastic Pollution Act of 2021 [7], aimed to address plastic pollution comprehensively, including measures like extended producer responsibility and improved recycling systems. These efforts highlight the global recognition of microplastics as a pressing environmental challenge and the need for continued action to mitigate their impact on ecosystems and human health.
Research conducted during the last few years highlights new investigations on the sources, distribution, and impacts of airborne microplastics. Studies have identified diverse sources contributing to airborne microplastic pollution, including abrasion of synthetic textiles [8], tire wear and nail salons [9], the degradation of plastic debris, and atmospheric fallout from plastic waste incineration [10]. These sources vary in their contributions based on geographic location, urbanization levels, and environmental conditions.
Similarly, a recent study has highlighted the seasonal variability in airborne microplastic concentrations, with higher levels observed during increased human activity and atmospheric turbulence [11]. The transport and fate of airborne microplastics are influenced by atmospheric dynamics such as wind patterns and precipitation events [12,13,14,15]. Turn out into airborne microplastics, these particles can undergo physical and chemical transformations, potentially adsorbing pollutants and microorganisms and concentrate them into the environment.
This article provides the results of airborne microplastics monitoring in Porto, Portugal. The main objective of this study was to assess, for the first time, the long-term levels and distribution of microplastics in the air of Porto, evaluate the extent of this problem for future consideration in potential human health risks, and for future exploration of mitigation and monitoring strategies to face the escalating microplastic contamination.
2. Materials and Methods
2.1. Sample Collection
Collecting campaigns for air microplastics were done for almost two years, from September 2022 to March 2024. Published procedures were adopted for a passive collection of aerosol microplastic samples and sample preparation [16]. A Microplastic Collector from Innovation NILU AS, designed according to the ISO/DIS 4222.2 standard for Particulate Deposition Collectors, was used for this purpose. The collector is made of to avoid cross-contamination. The sampler was placed at the garden of the Faculty of Sciences of the University of Porto (41.151629, -8.637068) at an 2.30 m above ground. Cumulative samples were collected every 14 days, transferred from the collector to a dark-glass vial using distilled water and an inox funnel with a 5 mm mesh, and stored in the fridge for future sample processing.
Meteorological data were collected using a Campbell Scientific, CR200Series meteorological station, equipped with sensors to measure various atmospheric parameters. The station is positioned on the roof of Faculty of Sciences (FC3) of the University of Porto close to sample collecting place to ensure a representative sampling of regional weather conditions. Continuous monitoring included: temperature, humidity, precipitation, wind speed and direction. Data were logged at 10-minute, intervals and stored in a database for subsequent analysis.
2.2. Sample Preparation
The following equipment and materials were utilized for sample preparation: a vacuum pump (KNF LABOPORT No. 96) aided in passing the sample through the filtration system into a flask. Three stainless steel sieves (HAVER & BOECKER, Germany) with diameters of 5 cm and mesh sizes of 125 µm, 63 µm, and 25 µm were used for particle fractionation in collected aqueous samples. A sonicator (VWR® Ultrasonic Cleaner) was used to disperse aggregates in aqueous samples and cleaning the materials. An oven (Heraeus Instruments) was used to digest organic matter in treated samples. A glass filtration system (Normax) suitable for various filtration membranes. Cellulose nitrate (CN) filtration membranes with pore sizes of 12 µm and 1.2 µm from Whatman® Cytiva (Germany) and CHMLAB Group (Spain) were used. Hydrogen peroxide (H₂O₂) 30% (diluted to 15%) from Carlo Erba Reagents (DasitGroup, France) was used to degrade organic matter in samples. An optical microscope (VWR® VisiScope® 534) with transmitted light and 10x, 20x, and 40x objectives was used to quantify microplastics and fibers.
Sample preparation procedure started with a size-fractionation step using inox sieves and a glass filtration system with membrane filters (Figure 1). Seven size-fraction for each sample were obtained: 5 mm-125 μm, 125-63 μm, 63-25 μm, 25-12 μm and 12-1.2 μm. Before fractionation, samples were homogenized. The entire sample from the dark-glass vials was filtered, and the vial and containers were washed three times with distilled water to ensure maximum sample extraction. As a first step, for sieving, a vacuum suction was applied using a vacuum pump. The next step included the filtering of the remaining liquid samples through 12 µm and 1.2 µm filter membranes, corresponding to particle size fractions of 25-12 µm and 12-1.2 µm, using the glass filtration system.
Each sieve (125 μm, 63 μm, and 25 μm) with the material there retained was placed in individual 250 ml beakers with H₂O₂ (15%) and sonicated for a few seconds. After sonication, sieves were removed, washed to the beakers that were subsequently covered with aluminum foil and placed in an oven at 50°C for 12 hours for organic matter digestion. This step is essential for visualizing microplastics under the microscope, as smaller microplastics adhere to organic matter. After organic matter digestion solution (H2O2) containing particulate matter from the bakers were sieving and filtrated again, as described above. Separated matter in the sieves was detached in the deionized water and filtered through 12 µm membrane filters using a glass filtration system yielding fractions >125 µm, 125-63 µm, and 63-25 µm. The remaining water sample was filtered again through 12 µm and 1.2 µm membranes to capture small, detached particles. During each filtration step, three rounds of water-throw-washing were conducted to ensure total sample extraction. Filters were stored separately in aluminum foil until analysis.
2.3. Control Samples and Recovery Rates Determination
Since filtration of all samples was conducted in three sets, to account for lab contamination during each set of filtrations, three control tests, with deionized water, were conducted using the same filtration procedure and quantifying microplastics similarly to actual samples. Average control values were subtracted from sample values of the according set.
For recovery rate (RR) determination, four types of polymers were used: polypropylene (PP), high-density polyethylene (PE-HD), acrylonitrile butadiene styrene (ABS), and polyester (PES). Polymers were sourced from various items: PP (bright green) from water sport bottle caps, PE-HD (magenta) from lab-reagent bottle caps, ABS (violet) from LEGO pieces, and PES from fluorescent yellow-green cords. PP, PE-HD, and ABS were grounded using a stainless-steel coffee grinder, while PES was cut off with scissors. Ground PP, PE-HD, and ABS particles were added to water and filtered through the sieves to obtain polymer particles for each size fraction. Observation shows that during grinding, smaller particles became more filamentous. Only particles larger than 125 µm were selected due to their particle morphology. Thirty particles of each polymer were placed in three sampling flasks from the same sampling period to ensure matrix complexity. The PES were cut off, mixed with water, filtered through sieves, and then through filter membranes for quantification. For PES, particles in the size-fraction intervals >125 µm and 125-63 µm had lengths ≥4 times their width, while those in the 63-25 µm and 25-12 µm intervals had lengths ≤3 times their width. Into each flask, over 200 PES fibers (lengths ≥4 times their width) and more than 50 PES (lengths ≤3 times their width) were added, previously counted on membrane filters. Aqueous samples with added polymers were filtered similarly to previous described procedure in 2.2, allowing some polymers to escape to verify recovery rates. Quantification was performed by considering the distinct colors and forms to distinguish them from regular samples (Table S1).
2.4. Microplastics Quantification
Optical microscopy with transmitted light was used to quantify MPs and fibers present in the filter membranes, for each of the five size fractions: >125 µm, 125-63 µm, 63-25 µm, 25-12 µm and 12-1.2 µm (Table S2). Given the limitations of this technique in identifying microplastics where color differentiation can be uncertain and potentially confused with other materials, bright colors not typically found in nature at this range—red, blue, green, yellow, orange, purple, and pink—were selected for counting microplastics. Both colored and colorless fibers were quantified.
The sample from September 29, 2022, to October 26, 2022, which covered 27 days, was divided into two parts (29.Sep.22a and 29.Sep.22b; 26.Oct.22a and 26.Oct.22b) to facilitate comparison with the other 14-day samples.
Absolute numbers and percentages of microplastics (MPs) and fibers were calculated for each sample and each fraction. According to studies accepted by the scientific community, the units for microplastics obtained by passive sampling are expressed as MPs per day and per square meter. Therefore, the number of MPs per day and per square meter (MPs/day/m²) was determined for the total size fractions (5 mm - 1.2 µm) and for the two smallest size fractions (25 - 12 µm and 12 - 1.2 µm), the number of fibers per day and per square meter (fibers/day/m²) was determined for just the total size fractions (5 mm - 1.2 µm)
The meteorological data and microplastic/fiber concentrations (MPs/day/m² and fibers/day/m²) were analyzed to identify any significant correlations or patterns. Wind Rose of winds direction, Statistical tests included Spearman's Rank Correlation, Principal Component Analysis (PCA) and Principal Component Regression (PCR) were performed to determine the relationship between meteorological conditions and the concentration of airborne microplastics and fibers. All calculations were performed in Excel, including data preparation and adjustments. Statistical analyses, such as Spearman's rank correlation coefficients for the wind rose and microplastics, were also conducted in Excel. PCA and PCR were carried out using Origin software.
The overall average recovery rate of polymers was not applied as a correction factor in calculating the collected MPs or fibers in the samples. This decision was made to avoid potential errors, as the recovery rate analysis was only conducted for particles larger than 125 µm, which may differ from smaller polymer particles. Additionally, the recovery rate was only verified for one type of fiber, polyester, and may not accurately represent other types of fibers.
3. Results
3.1. Recovery Rates for Plastic Polymers
The recovery rates for four types of polymers, PP, PE-HD, ABS, and PES, were evaluated through a series of three separate trials for the same period sample. Table 1 summarizes the recovery rates for during the filtration process. The recovery rates were assessed across the size fraction >125 µm for PP, PE-HD, and ABS, considered particulate microplastic, and across >63 µm and 63-12 µm size-fractions for PES, fibrous microplastic. The average recovery rates for each polymer and the overall average are also provided to evaluate the efficiency of the filtration process.
The recovery rates for the polymers varied across the trials, reflecting the effectiveness of the filtration process in capturing different types of microplastics. PP exhibited high recovery rates in the second and third trials (86.7%, 80.0%), while the first trial recorded recovery was lower (60.0%), resulting in an average recovery rate of 75.6%. PE-HD showed consistent recovery rates across the trials (90%, 70%, and 70%), with an average recovery rate of 76.7%. ABS exhibited a wide range of recovery rates in the >125 µm fraction, with the third trial showing the highest recovery rates (93.3%), the first and the second ones had lower recovery (70.0% and 63.3%), resulting in an average recovery rate of 75.6% for ABS, which is equal to the average recovery rate of PP. PES had lower recovery rates compared to the particulate polymers. The > 63 µm fraction had recovery rates of 52.6%, 25.5%, and 26.0%, averaging 34.7%. The 63-12 µm fraction had recovery rates of 24.2%, 14.0%, and 16.4%, averaging 18.2%. These results indicate lower recovery efficiency for PES compared with the other polymers, in both size-fractions analyzed, which may be due to the filamentous nature of PES that is more challenging in the filtration process.
3.2. Quantification of MPs and Fibers in the Air
Results of the quantification of MPs and fibers by optical microscopy are represented in Figure 2, and show the distribution of total microplastics and fibers in the samples collected from September 2022 to March 2024. The number of microplastics collected varied considerably over this period, with the highest count recorded on April 26, 2023 (653 particles) and the lowest on December 7, 2022 (11 particles). Similarly, fiber counts showed variability along the study period, with the highest number recorded on May 10, 2023 (284 fibers), and the lowest also on December 7, 2022 (6 fibers). Several notable peaks in microplastic counts were observed, including 387 particles on May 10, 2023, and 329 particles on May 24, 2023. Fiber counts also displayed peaks in these dates and generally following the same trends, with the most fibers collected on May 10, 2023 (284 fibers), and on May 24, 2023 (220 fibers).
When viewed as percentages, the relative proportions of microplastic particles to fibers also showed notable fluctuations (Figure 3). Microplastic particles ranged between 32% to 87% of the total particles, while fibers ranged from 13% to 68%. Notable peaks in microplastic particle counts were observed in April and May 2023, but the highest percentage (87%) was recorded on February 20, 2024. The highest fiber percentage (68%) occurred on March 15, 2023, indicating the existence of periods where fibers were more prevalent than microplastics.
The data for fiber counts by size fraction across the various samples from September 2022 to March 2024 shows distinct distribution patterns among different size ranges (Figure 4). Fibers were encountered into the five size fractions: >125 μm, 125-63 μm, 63-25 μm, 25-12 μm, and 12-1.2 μm. The majority of fibers were found in the 25-12 μm and 12-1.2 μm size fractions, with considerable fewer fibers in the bigger size fractions (>125 μm and 125-63 μm). For the >125 μm size fraction, fiber counts were generally low, with notable peaks on April 26, 2023 (65 fibers), and May 10, 2023 (50 fibers). Many samples recorded zero fibers in this size range. Similarly, the 125-63 μm size fraction also showed low counts with occasional peaks, such as May 10, 2023 (38 fibers). The 63-25 μm size fraction had moderate fiber counts with peaks between February 01, 2023 and July 05, 2023 (65-74 fibers). The 25-12 μm size fraction consistently showed higher counts, particularly notable on May 10, 2023 (118 fibers), and May 24, 2023 (82 fibers). Lastly, the 12-1.2 μm size fraction was the most consistently populated, with high counts across multiple dates, such as December 21, 2022 (57 fibers), and the lowest at December 07, 2022 (6 fibers).
The analysis of microplastic particles contamination across different size fractions (>125 μm, 125-63 μm, 63-25 μm, 25-12 μm, 12-1.2 μm) revealed considerable variability and different trends (Figure 5). The data shows that the mean particle counts decrease with increasing size fraction: 17 particles for >125 μm, 18 particles for 125-63 μm, 31 particles for 63-25 μm, 66 particles for 25-12 μm, but except for 12-1.2 μm, mean 21 particles. These results indicate a higher prevalence of smaller microplastic particles, likely more pervasive due to degradation processes. The variability and presence of outliers suggest localized dates of high contamination, pointing to the influence of specific environmental factors or sources. The absence of outliers in the smallest size fraction (12-1.2 μm) suggests a more uniform distribution of microplastics in this category. For the >125 μm fraction, most data falls from 0 to 61 particles, with a mean of 17 particles and one expressive outlier at 114 particles. It suggests that while most samples contain a moderate number of larger microplastic particles, there are occasional occurrence of considerable highly counts, possibly due to localized contamination. The data shows a similar trend in the 125-63 μm fraction, with a mean of 18 particles and a prominent outlier at 75 particles. This indicates that microplastics in this size range are less prevalent than larger particles. However, again, localized factors can cause high variability. The 63-25 μm category shows a broader range of particle counts with a mean of 31 particles and notable outliers at 98 and 235 particles. The more substantial number of outliers and higher variability suggest that this size fraction is more susceptible to environmental factors that can lead to spikes in microplastic counts. For the 25-12 μm fraction, the mean count of 66 particles and an outlier of 235 particles indicate a higher prevalence of microplastics in this size range. This could be because smaller particles are more likely to be produced and persist in the air, potentially accumulating from various sources. The 12-1.2 μm fraction, with a mean of 21 particles and no outliers, shows the smallest range of variability. The absence of outliers might suggest a more uniform distribution, constant affluent taxes, and sources of high microplastic counts in this size range. Generally, there appears to be fluctuation but potentially increasing trends in microplastic concentrations over the sampling period.
The box plot in Figure 6, visually represents the distribution of MPs and fibers per day and per square meter across the samples collected from September 29, 2022, to March 5, 2024. The numbers of MPs/day/m² range from 26to 1484, with mean (329), median (211), quartiles (119 and 407), and outliers (879 and 1484) are identified for each time point, revealing trends in microplastic pollution over time. There is notable variation in microplastic concentrations across different sampling dates. For instance, the highest concentration was observed on April 26, 2023 (1484 MPs/day/m²), while the lowest was on December 7, 2022 (26 MPs/day/m²). In the previous box-plot analysis (Figure 5), each fraction, excluding the 25-12 μm, exhibited a notable increase towards the upper quartile of the plot. Similarly, we observe this trend in the current box plot depicting MPs per day per square meter for the total fraction across all samples. There is a clear tendency towards higher concentrations over the sampling period, indicating a potential increase in microplastic levels.
The numbers of fibers/day/m² range from 14 to 646, with mean (197), median (150), quartiles (108 and 239), and two outliers (492 and 646). Generally, there appears to be fluctuations but potentially increasing trends in fibers concentrations over the sampling period too.
The counts of MPs/day/m² for total of fractions (5 mm-1.2 μm) and each fraction (25-12 μm and 12-1.2 μm) vary considerable over time, specific periodic dates with unusually high MPs counts might suggest episodic pollution events, seasonal effects or other influencing factors (Figure 7).
The counts of microplastics within the two lowest size fractions (25-12 μm and 12-1.2 μm) calculated per day and per meter square (MPs/day/m2) over the sampling period reveals notable variability in microplastic concentration across both size categories and sampling dates. MPs in the size-fraction 25-12 μm are generally more abundant than smaller ones, except for the period from December 7, 2022 to January 17, 2023. Overall, the data does not indicate much consistent proportions, trends, or relationships between the different fractions of MPs. The counts of MPs within for total of fractions (5 mm-1.2 μm) and each fraction (25-12 μm and 12-1.2 μm) vary independently and do not exhibit a clear pattern when compared to one another. Although for size-fractions 25-12 μm, even with variability, attend increasing trend of represented values.
The wind rose data, collected from 29 September 2022 to 5 March 2024, illustrates the distribution and frequency of wind directions over the study period (Figure 8a). The observations reveal that the wind predominantly blew from the East (E), South(S), Southwest (SW) and North (N) directions. The analysis of predominant wind directions for each sample period from 29 September 2022 to 5 March 2024 revealed distinct patterns (Figure 8b). The data indicate that the predominant wind direction varied considerably across the different sampling dates, reflecting the dynamic nature of local meteorological conditions. Throughout the study, easterly (E) winds were the most frequently predominant direction, especially notable on February 15, 2023, with a maximum count of 273 occurrences. This trend continued with significant instances on February 6, 2024 (245), December 7, 2022 (228), and March 1, 2023 (169). Southern (S) winds were predominant on several occasions with the most significant instance on October 26, 2022 (193) and notable occurrences on January 4, 2023 (139) and November 9, 2022 (114). In contrast, the northern (N) winds were predominantly observed on fewer occasions, including July 5, 2023 (112), May 10, 2023 (76), and March 5, 2024 (66). Moreover southwestern (SW) winds were primarily dominant on September 29, 2022, with 146 occurrences, on June 21, 2023, with 91 instances, on November 23, 2022 with 87 instances and on June 7, 2023, with 82 instances. These instances underscore the variability and occasional prominence of S and SW winds in the study area. Interestingly, there were no instances of predominant winds from the southeastern (SE), western (W), or northwestern (NW) directions during the sampling periods, indicating a limited influence from these directions within the observed timeframe. The northeastern (NE) winds were predominant on May 24, 2023, with 120 instances, marking a unique occurrence where NE winds dominated.
Overall, the data demonstrate that while easterly, southerly and southwesterly winds were more consistently predominant, there was considerable variability in wind direction, with certain periods experiencing strong influences from the northerly, northwesterly and northeasterly winds. This variability is crucial for understanding the dispersion patterns of airborne materials, including microplastics and fibers, within the study region.
The analysis of Spearman's rank correlation coefficients (rs) and associated p-value reveals that different wind directions have distinct impacts on the concentration of microplastics (MPs) and fibers in the environment (Figure 9). For Northwest (NW) and North (N) winds, strong positive correlations were observed between NW and N winds and microplastics per day and per square meter (MPs/day/m2), particularly for the total MPs fractions (5 mm-1.2 μm), with correlation coefficients of 0.70 and 0.68, respectively. These correlations are highly significant, with p-values of 0.0001 and 0.001, indicating that stronger winds from these directions are associated with increased levels of MPs. For Northeast (NE) winds, moderate positive correlations were found, particularly with the MPs fraction 25-12 μm and the total MPs fractions (5 mm-1.2 μm), with correlation coefficients of 0.45 and 0.44, respectively. The significance of these relationships is supported by p-values of 0.03, suggesting that NE winds may contribute to higher concentrations of these particles.
In contrast, Southern (S) and Southeast (SE) winds tend to have negative correlations with most MPs particle sizes and fibers. The strongest negative correlations were found with fibers in the 5 mm-1.2 μm range (-0.51 and -0.59, respectively), with significant p-values of 0.01 and 0.002. This negative correlation suggests a moderate inverse relationship between these two variables, indicating that stronger winds from the S and SE directions are likely to reduce the concentrations of fibers and MPs. Eastern (E) winds also showed negative correlations, particularly with the MPs fraction 12-1.2 μm (-0.43) and the total MPs fractions 5 mm-1.2 μm (-0.39). The p-values are 0.04 and 0.06, suggesting a potential, though less pronounced, inverse relationship between E winds and microplastic concentrations. Winds from the West (W), Southwest (SW), and periods with no significant wind (Null) generally showed non-significant correlations (p-values above 0.05), suggesting that these directions may have a less consistent influence on microplastic levels.
These findings suggest that wind direction plays a crucial role in influencing the distribution of microplastics and fibers in the environment. Northern and northeastern winds generally increase particle concentrations, while southern and eastern winds may contribute to their reduction.
During the analysis of the relationship between meteorological factors and the concentration of microplastics, an assessment was conducted to determine the presence of linearity between the independent variables (meteorological factors) and the dependent variable (MPs). Despite thorough evaluation, no significant linear relationships were identified. Given the absence of linearity, traditional methods like Multiple Correlation Analysis (MCA), which rely on linear associations between variables, were deemed unsuitable for this dataset. As a result, Principal Component Analysis (PCA) was employed as an alternative approach. PCA does not require linearity and is effective in reducing dimensionality by identifying the principal components that explain the most variance in the data. This technique allowed for the exploration of complex, non-linear relationships between the meteorological factors and microplastic concentrations, providing a more comprehensive understanding of the underlying patterns in the data.
PCA was employed to investigate the relationships between MPs concentrations (MPs/day/m²) and various meteorological factors (Table S3) (Wind maximum during the days of collecting of each sample (Wind max), Wind average during the days of collecting of each sample (Wind avr), Wind maximum of maximum in each day during the days of collecting of each sample (Wind max max), Wind average of maximum in each day during the days of collecting of each sample (Wind avr max), Precipitation total during the days of collecting of each sample (Precipitation tot), Occurrence number of precipitation during the days of collecting of each sample (Precipitation occur), Temperature average of maximum in each day during the days of collecting of each sample (Temperature avr max), Temperature average of minimum in each day during the days of collecting of each sample (Temperature avr min), Temperature average of average in each day during the days of collecting of each sample (Temperature avr avr), Temperature maximum during the days of collecting of each sample (Temperature max), Temperature minimum during the days of collecting of each sample (Temperature min), Humidity average of maximum in each day during the days of collecting of each sample (Humidity avr max), Humidity average of minimum in each day during the days of collecting of each sample (Humidity avr min), Humidity average of average in each day during the days of collecting of each sample (Humidity avr avr), Humidity maximum during the days of collecting of each sample (Humidity max), Humidity minimum during the days of collecting of each sample (Humidity min). The analysis identified key components that explain the majority of the variance in the dataset, offering insights into the impact of different environmental variables on microplastic levels (Figure 10). The PCA revealed 16 principal components, with the first three components accounting for a substantial portion of the total variance—42.80%, 27.74%, and 16.09%, respectively. Collectively, these three components explain 86.64% of the variance, indicating that they capture the most significant patterns in the data. The first principal component (PC1) is strongly associated with wind speed and precipitation variables, as evidenced by high positive loadings for factors such as "Wind max," "Precipitation tot," and "Precipitation occur." These results suggest that PC1 reflects the combined influence of wind speed and precipitation on microplastic concentrations. Conversely, temperature-related variables like "Temperature avr max" and "Temperature avr avr" show negative loadings, indicating an inverse relationship with PC1. The second principal component (PC2) is dominated by temperature and humidity factors, with significant positive loadings for "Temperature avr min," "Temperature avr avr," and "Humidity avr max." This suggests that PC2 primarily captures the impact of temperature and humidity on microplastic levels, with a lesser influence from wind speed variables, as indicated by the small negative loading for "Wind avr." The third principal component (PC3) primarily reflects variations in wind speed, with high positive loadings for "Wind avr," "Wind max," and "Wind avr max." While temperature variables like "Temperature avr min" and "Temperature avr avr" contribute to PC3, they do so to a lesser extent. In contrast, humidity variables exhibit negative loadings, particularly "Humidity av max" and "Humidity min," indicating an inverse relationship with this component.
In summary, the PCA results reveal distinct patterns in how meteorological factors influence microplastic concentrations. PC1 highlights the importance of precipitation and wind speed, suggesting that these conditions are closely associated with higher microplastic levels. PC2 underscores the role of temperature and humidity in shaping microplastic distributions, while PC3 emphasizes the primary role of wind speed in this context. These findings provide a nuanced understanding of the complex interplay between meteorological variables and microplastic concentrations, offering a foundation for further exploration of their environmental impact.
Principal Component Regression (PCR) was conducted to explore the relationship between microplastics concentrations and the principal components (PC1, PC2, and PC3) derived from meteorological data. Each principal component was analyzed separately to determine its contribution to explaining the variance in microplastics concentrations. The regression results for PC1 are as follows: Slope (m): 2.999 (Standard Error: 1.056); Intercept (b): 1.737 (Standard Error: 0.865); R-squared (R²): 0.973; F-statistic: 15.723 (Degrees of Freedom: 7); Regression Sum of Squares: 22.377 Residual Sum of Squares: 0.623 The regression analysis for PC1 shows a significant positive relationship with microplastics concentrations. The high R-squared value of 0.973 indicates that PC1 explains approximately 97.3% of the variance in microplastics concentrations, suggesting a strong fit of the model. The F-statistic further confirms the statistical significance of the regression model. The positive slope indicates that higher PC1 scores are associated with increased microplastics concentrations. The regression results for PC2 are: Slope (m): -3.925 (Standard Error: 1.382); Intercept (b): 1.333 (Standard Error: 0.663); R-squared (R²): 0.973; F-statistic: 15.723 (Degrees of Freedom: 7); Regression Sum of Squares: 22.377; Residual Sum of Squares: 0.623 The analysis for PC2 shows a significant negative relationship with microplastics concentrations. The R-squared value remains high at 0.973, indicating that PC2 also explains 97.3% of the variance in microplastics concentrations. The negative slope suggests that as PC2 scores increase, the concentration of microplastics decreases. The model is statistically significant, as indicated by the F-statistic. The regression results for PC3 are: Slope (m): -1.451 (Standard Error: 0.511); Intercept (b): -1.114 (Standard Error: 0.554); R-squared (R²): 0.973; F-statistic: 15.723 (Degrees of Freedom: 7); Regression Sum of Squares: 22.377; Residual Sum of Squares: 0.623. The regression for PC3 reveals a significant negative association with microplastics concentrations. The R-squared value is consistently high at 0.973, showing that PC3 explains 97.3% of the variance in microplastics concentrations. The negative intercept of the regression, indicating that the baseline concentration of microplastics is negative when PC3 is zero, although this may not be physically meaningful and could be an artifact of the model. The negative slope indicates that higher PC3 scores are associated with lower microplastics concentrations. The statistical significance of the model is supported by the F-statistic.
4. Discussion
In this study, we reported airborne microplastic particles and fibers present in air samples in five size-fractions. This allowed us to calculated the number of microplastics or fibers per day and per square meter (MPs/day/m²) for the entire sample and each size fraction, unlike several reported cases which do not do this fractionation [16], representing microplastics or fibers for the entire sample without size fractionation. Therefore, some of our results cannot be directly compared to those from other studies.
Comparing results of air microplastic contamination is highly subjective due to differences in sample capture methods (active air suction and passive deposition, which can be dry, wet, or both). Even with the same capture method, variations in the size and shape of collectors, the materials of collectors, and analytical techniques for identification could affect the final results, as well as the sample preparation procedures and sampling time. According to the sensitivity of various analytical techniques for microplastic analysis, the μFTIR technique can detect particles larger than 5-20 μm, depending on the resolution and sensitivity of the equipment used. Particles down to 0.5 μm are suited for Raman analysis, with identification for both techniques based on acquired spectra. For optical microscopy analysis, the method used in our study for the microplastics quantification, the detection limit is approximately 1 μm, but it is limited in identifying microplastics because only colored microplastics are counted for quantification. Consequently, the number of microplastics in the samples could be underestimated. However, microscopy is easily accessible in any research laboratory and require less expertise in sampling observation, analysis, spectra processing and identification, making it a more cost-efficient technique that could be used worldwide for microplastic quantification.
For comparison, we considered reported works that used NILU collectors similar to the ones used in our study or made from PTFE instead of Inox, with optical microscopy for identification at first, and then other passive collectors with optical microscopy or other analytical techniques for identification of MPs and fibers, without considering the sampling period and sample preparation technique.
The optical microscopy analyses of microplastics and fiber pollution over the sampling period reveal significant temporal variability in both absolute counts and relative proportions across samples. High absolute counts of microplastics in April and May 2023, coupled with high percentages of microplastics compared to fibers, suggest periods of intense microplastic contamination. Conversely, higher fiber percentages during other times highlight the dynamic nature of environmental contamination. The trends suggest potential seasonal or event-driven variations that influence microplastic and fiber prevalence, such as wind speed and precipitation, showed by PCA analyses.
In our study we divided the samples into the size fractions: >125 μm, 125-63 μm, 63-25 μm, 25-12 μm, and 12-1.2 μm. The 12-1.2 μm fraction represents MPs with sizes falling within the atmospheric PM10 and PM2.5 fractions, which are of most concern for human health. So our methodology allowed us to perform a more detailed study on the microplastics proportion and seasonal distribution in the fraction below PM10 compared with the entire atmospheric microplastic spectrum. The distribution of fibers by size fraction indicated several critical trends in fiber contamination. Firstly, smaller fibers (12-1.2 μm and 25-12 μm) were more common in the environment. This could be attributed to the breakdown of larger fibers over time or the predominant sources of fiber pollution contributing more to smaller sizes. Secondly, there were considerable fluctuations in fiber counts over time, particularly noticeable in the smaller size fractions. Peaks in fiber counts often coincided with specific dates, suggesting episodic events or seasonal variations in fiber pollution.
The results of the distribution of microplastic particles across various size fractions (>125 μm, 125-63 μm, 63-25 μm, 25-12 μm, 12-1.2 μm) offered insights into the prevalence and variability of microplastics in different size categories. Overall, the analysis of microplastic particle size fractions reveals several key trends: there is a notable increase in the number of particles as the size decreases, particularly in the 25-12 μm fraction, suggesting that smaller microplastics are more common in the environment, likely due to degradation processes breaking down larger plastics over time – aging of microplastics. Outliers in size fractions highlight the variability in microplastic contamination across different samples, underscoring the importance of considering local environmental factors, sampling methods, and potential contamination sources when analyzing microplastic data. The outliers observed in the >125 μm, 125-63 μm, 63-25 μm and 25-12 μm fractions suggest that the samples occasionally exhibit exceptionally high levels of microplastic contamination. These could be areas of interest for further investigation to identify and mitigate sources of pollution.
Between the two smallest (25-12 μm and 12-1.2 μm) size fractions examined over time, the results indicate fluctuating levels of microplastic per day and per square meter (MPs/day/m²) contamination. From September 2022 to March 2024, the 25-12 μm size fraction generally exhibited higher counts compared to the 12-1.2 μm fraction, with peaks observed in February 2023 and May 2023. This pattern suggests varying sources and deposition rates of microplastics in the sampled area. Interestingly, some sampling dates, such as December 2022 and January 2023, showed an increase in microplastic counts for the smaller size fraction (12-1.2 μm), indicating potential shifts in particle distribution and accumulation. The data also highlights specific spikes in size fractions (25-12 and 12-1.2) and in the total microplastic counts across all fractions from 5 mm to 1.2 microns during the sampling campaign. These spikes are not uniform and do not match each other across these fractions, potentially correlating with seasonal variations or local anthropogenic activities.
The wind rose data collected from September 29, 2022, to March 5, 2024, highlights a diverse range of wind directions in the study area, with a predominance of easterly (E), southerly (S), southwesterly (SW), and northerly (N) winds. Notably, easterly winds were the most frequently observed, particularly on February 15, 2023, and February 6, 2024. Southern winds also appeared prominently on various occasions, while northerly and southwesterly winds were less consistent but still notable.
The variability in wind direction observed throughout the study underscores the dynamic nature of local meteorological conditions. This variability has implications for the dispersion of airborne particles, such as microplastics and fibers. The strong positive correlations between northwesterly (NW) and northerly (N) winds with microplastic concentrations suggest that these wind directions are associated with higher levels of microplastics, likely due to their capacity to transport particles over longer distances. Conversely, southerly (S) and southeasterly (SE) winds exhibited negative correlations, indicating a potential for these winds to reduce particle concentrations, possibly through mechanisms such as particle deposition or dilution. The absence of significant correlations for winds from the west (W), southwest (SW), and periods with no significant wind (Null) suggests that these factors may have a less consistent impact on microplastic levels. The unique occurrence of northeastern (NE) winds on May 24, 2023, with a moderate positive correlation to microplastic concentrations, further emphasizes the complexity of wind-driven particle dispersion.
The Principal Component Analysis (PCA) revealed that wind speed and precipitation are key factors influencing microplastic concentrations. The first principal component (PC1) strongly associated with wind speed and precipitation indicates that these variables collectively drive higher microplastic levels. Temperature and humidity factors were captured by the second principal component (PC2), reflecting their role in shaping microplastic distributions, while the third principal component (PC3) highlighted the primary influence of wind speed.
The Principal Component Regression (PCR) analysis further supported these findings, with significant positive and negative relationships between the principal components and microplastic concentrations. The high R-squared values for PC1, PC2, and PC3 suggest that these components explain a substantial portion of the variance in microplastic levels, though the negative intercepts in the regression models should be interpreted with caution.
In comparison with other studies, a NILU collector was used in the French Pyrenees, and were reported atmospheric wet and dry deposition, identifying fibers up to ~750 μm long and fragments ≤ 300 μm as microplastics [17]. They documented relative daily counts of 249 fragments, 73 films, and 44 fibers per square meter deposited in the catchment area. These values are lower than our overall averages across all samples, which are 329 MPs/day/m² for microplastic particles and 197 fibers/day/m² for fibers. This highlights the higher degree of microplastic pollution in urban settlements compared with less urbanized areas, but even so can be transported. Another study, using the same collector [18], investigated anthropogenic microfibers > 200 microns in coastal areas of Ireland, observing an average deposition of 80 fibers/m²/day across the four study sites. Regarding Porto position in Portugal as a coastal city facing the Atlantic ocean, our study reported higher average concentrations of fibers in the air.
In recent study in 2024, using other types of passive collector at a remote site in the foothills of the Southern Alps of New Zealand, was reported that atmospheric microplastic deposition fluxes were six times larger during 24-hour sampling periods (150 MPs/m²/day) than during 7-day sampling periods (26 MPs/m²/day) [19]. The study highlights the influence of sampling frequency and deposition collector design to limit particle resuspension, suggesting that studies with different sampling frequencies may have underestimated atmospheric microplastic deposition fluxes. In our study it was used a ISO standard sampler specifically designed for deposition sampling. This equipment provides confidence that the collector is optimized for accurately capturing airborne microplastics. By adhering to these ISO standards, we ensure the reliability and consistency of our sampling process, making our data robust and representative of the environmental conditions being studied.
In a German study where sampling was conducted biweekly, similar to our approach, a median number of 275.0 MPs/m²/day was found across all sampling sites. For six specific sampling sites, the daily fallout ranged from 136.5 to 512.0 particles/m²/day, which is less compared with ours for microplastic particles from 26 to 1484 MPs/day/ m² and for fibers from 14 to 646 fibers/day/m2 [20].
In Portugal, one study employed passive collection using borosilicate bulk collectors and FTIR analysis for microplastic quantification of particles > 50 μm [21], reported atmospheric fallout ranging from 0 to 459 particles/m²/day across monthly sampling, with higher values during winter months. Despite differences in size ranges, they observed that smaller size particles were the most common, which coincided with our results.
The analysis of recovery rates for PP, PE-HD, ABS, and PES provides insights into the effectiveness of the filtration process used in this study. PP and PE-HD demonstrated high recovery rates, indicating efficient filtration for these polymers. ABS showed a wide range of recovery rates, suggesting room for methodological improvements. However, at the same time, averages for recovery rates of particulate microplastics PP, PE-HD, and ABS show similar relatively high values, and overall average for particulate polymers in range > 125 μm recorded 75.9% recovery rate. PES exhibited lower recovery rates in both size fractions (> 63 µm – 34.7%; and 63-12 µm – 16.4%), highlighting the need for further refinement in the filtration technique for fibrous polymers that would enable their catchment. Also, variability in the recovery rates of the polymers related to morphological type was observed.
Deposition collection is a practical, cost-effective, and efficient method for sampling airborne microplastics. However, variations in collector types, sampling time periods, sample preparation techniques, and analysis methods for air microplastics and fibers need to be carefully evaluated to compare results accurately.
The findings underscore the important role of wind direction in determining the distribution and concentration of microplastics and fibers in the environment. Winds from the northwest and north are associated with increased particle concentrations, while winds from the southeast and south appear to reduce them. These insights are crucial for understanding how atmospheric conditions affect the dispersion and accumulation of microplastics, providing a foundation for developing strategies to manage and mitigate their environmental impact.
5. Conclusions
Overall, the data indicates that microplastic pollution is widespread and varies considerable across different size fractions. Our results underscores the dynamic nature of environmental microplastic pollution, with distinct variations observed in all size-fraction categories across different sampling periods.
The microplastics per day per square meter (MPs/day/m²) across all collected samples ranged from 24 to 1,484, with a mean of 329 and a median of 211, indicating an increasing trend in microplastic pollution over time. Similarly, the fiber concentrations ranged from 14 to 646 fibers/day/m², with a mean of 197 and a median of 150, suggesting a potential rise in fiber levels during the sampling period. When comparing the two smallest size fractions (25-12 μm and 12-1.2 μm), the highest peak in microplastic concentration was recorded at 164 MPs/day/m² for the 12-1.2 μm fraction on April 26, 2023, and 534 MPs/day/m² for the 25-12 μm fraction on May 10, 2023. To ensure methodological accuracy, recovery rates for various polymers (PP, PE-HD, ABS, and PES) were evaluated, revealing high recovery rates for particles synthetic polymers PP, PE-HD, and ABS (75.9%) and a significantly lower rate for fibrous synthetic polymers PES (26.5%).
The study highlights the significant role of wind direction and meteorological factors in the distribution of microplastics. Predominantly easterly, southerly, and southwesterly winds were associated with varying levels of microplastic concentrations, while the absence of notable influences from certain wind directions and meteorological factors provides a nuanced understanding of particle dispersion patterns. The PCA and PCR analyses underscore the complex interplay between wind speed, precipitation, temperature, and humidity in influencing microplastic levels. These insights are crucial for developing targeted strategies to mitigate the impact of microplastics on the environment and inform future research on atmospheric transport mechanisms.
These findings emphasize the importance of continuous, comprehensive monitoring to capture the full scope of microplastic and fiber pollution. Understanding these contaminants` temporal dynamics and relative proportions is crucial for developing effective mitigation strategies to address microplastic contamination and its potential environmental and human health impacts. Future research should focus on identifying the sources of high variability and developing standardized methods for sampling and analysis to ensure consistent and reliable data collection. In addition, it is essential to thoroughly understand the observed patterns of microplastic pollution over time. Addressing these challenges is vital for reducing microplastic contamination and mitigating its associated risks.
Our study underscores the importance of rigorous methodology and repeated microplastic recovery and quantification testing. The results suggest that while the current filtration process is effective for specific polymers, further optimization is necessary to improve recovery rates, especially for fibrous ones. Consistent recovery rates across trials for each polymer type are essential for reliable quantification of microplastics in environmental samples. Further optimization of the filtration process and additional trials are recommended to ensure consistent recovery rates across all polymer types and size fractions.
Supplementary Materials
The following supporting information can be downloaded at the website of this paper posted on Preprints.org.
Author Contributions
Conceptualization, Y.L., H.R., L.P.d.S. and J.E.S.; writing—original draft preparation, Y.L.; methodology, Y.L., H.R., L.P.d.S. J.E.S., D.S.M., R.P.S. and I.F.N.; experimental data acquisition, Y.L., D.S.M., R.P.S. and I.F.N.; formal analysis, Y.L.; data curation, Y.L.; writing—review and editing, H.R., L.P.d.S. and J.E.S.; supervision, H.R., L.P.d.S. and J.E.S.; funding acquisition, H.R., L.P.d.S. and J.E.S. All authors have read and agreed to the published version of the manuscript.
Funding
The Portuguese “Fundação para a Ciência e Tecnologia” (FCT, Lisbon) is acknowledged for funding of project PTDC/QUI-QFI/2870/2020, R&D Unit CIQUP (UIDB/00081/2020 and UIDP/00081/2020) and the Associated Laboratory IMS (LA/P/0056/2020). FCT is acknowledged for funding the PhD grant of Yuliya Logvina (2022.14123.BD). Luís Pinto da Silva acknowledges funding from FCT under the Scientific Employment Stimulus (CEECINST/00069/2021).
Conflicts of Interest
The authors declare no conflict of interest. The funders had no role in the design of the study; in the collection, analyses, or interpretation of data; in the writing of the manuscript; or in the decision to publish the results.
References
- Regulation - 2023/2055 - EN - EUR-Lex. https://eur-lex.europa.eu/eli/reg/2023/2055/oj (accessed 2024-07-08).
- Regulation - 1907/2006 - EN - REACH - EUR-Lex. https://eur-lex.europa.eu/eli/reg/2006/1907/oj (accessed 2024-07-08).
- COMMUNICATION FROM THE COMMISSION TO THE EUROPEAN PARLIAMENT, THE COUNCIL, THE EUROPEAN ECONOMIC AND SOCIAL COMMITTEE AND THE COMMITTEE OF THE REGIONS Pathway to a Healthy Planet for All EU Action Plan: “Towards Zero Pollution for Air, Water and Soil”; 2021. https://eur-lex.europa.eu/legal-content/EN/TXT/?uri=CELEX%3A52021DC0400&qid=1623311742827 (accessed 2024-07-08).
- Rep. Pallone, F. H.R.1321 - 114th Congress (2015-2016): Microbead-Free Waters Act of 2015. https://www.congress.gov/bill/114th-congress/house-bill/1321 (accessed 2024-07-08).
- Marine Debris Program. https://marinedebris.noaa.gov/ (accessed 2024-07-08).
- Sen. Sullivan, D. [R-A. S.1982 - 116th Congress (2019-2020): Save Our Seas 2.0 Act. https://www.congress.gov/bill/116th-congress/senate-bill/1982 (accessed 2024-07-08).
- Sen. Merkley, J. [D-O. All Info - S.984 - 117th Congress (2021-2022): Break Free From Plastic Pollution Act of 2021. https://www.congress.gov/bill/117th-congress/senate-bill/984/all-info (accessed 2024-07-08).
- Zhang, Y.-Q.; Lykaki, M.; Alrajoula, M. T.; Markiewicz, M.; Kraas, C.; Kolbe, S.; Klinkhammer, K.; Rabe, M.; Klauer, R.; Bendt, E.; Stolte, S. Microplastics from Textile Origin – Emission and Reduction Measures. Green Chem. 2021, 23 (15), 5247–5271. https://doi.org/10.1039/D1GC01589C. [CrossRef]
- O’Brien, S.; Rauert, C.; Ribeiro, F.; Okoffo, E. D.; Burrows, S. D.; O’Brien, J. W.; Wang, X.; Wright, S. L.; Thomas, K. V. There’s Something in the Air: A Review of Sources, Prevalence and Behaviour of Microplastics in the Atmosphere. Sci. Total Environ. 2023, 874, 162193. https://doi.org/10.1016/j.scitotenv.2023.162193. [CrossRef]
- Aini, S. A.; Syafiuddin, A.; Kueh, A. B. H. Quantification, Characteristics, and Distribution of Microplastics Released from Waste Burning Furnaces and Their Associated Health Impacts. Environ. Qual. Manag. 2023, 33 (1), 303–310. https://doi.org/10.1002/tqem.22056. [CrossRef]
- Leonard, J.; El Rassi, L. A.; Samad, M. A.; Prehn, S.; Mohanty, S. K. The Relative Importance of Local Climate and Land Use on the Deposition Rate of Airborne Microplastics on Terrestrial Land. Atmos. Environ. 2024, 318, 120212. https://doi.org/10.1016/j.atmosenv.2023.120212. [CrossRef]
- Xiao, S.; Cui, Y.; Brahney, J.; Mahowald, N. M.; Li, Q. Long-Distance Atmospheric Transport of Microplastic Fibres Influenced by Their Shapes. Nat. Geosci. 2023, 16 (10), 863–870. https://doi.org/10.1038/s41561-023-01264-6. [CrossRef]
- Wei, L.; Yue, Q.; Chen, G.; Wang, J. Microplastics in Rainwater/Stormwater Environments: Influencing Factors, Sources, Transport, Fate, and Removal Techniques. TrAC Trends Anal. Chem. 2023, 165, 117147. https://doi.org/10.1016/j.trac.2023.117147. [CrossRef]
- Ryan, A. C.; Allen, D.; Allen, S.; Maselli, V.; LeBlanc, A.; Kelleher, L.; Krause, S.; Walker, T. R.; Cohen, M. Transport and Deposition of Ocean-Sourced Microplastic Particles by a North Atlantic Hurricane. Commun. Earth Environ. 2023, 4 (1), 1–10. https://doi.org/10.1038/s43247-023-01115-7. [CrossRef]
- Haque, F.; Fan, C. Fate of Microplastics under the Influence of Climate Change. iScience 2023, 26 (9), 107649. https://doi.org/10.1016/j.isci.2023.107649. [CrossRef]
- Logvina, Y.; Matas, I. M.; Ribeiro, H.; Pinto da Silva, L.; Rodrigues, P.; Leitão, J.; da Silva, J. E. Micro- and Nanoplastics in the Atmosphere: Methodology for Microplastics Size-Fractionation Sampling. Microplastics 2024, 3 (1), 82–97. https://doi.org/10.3390/microplastics3010006. [CrossRef]
- Allen, S.; Allen, D.; Phoenix, V. R.; Le Roux, G.; Durántez Jiménez, P.; Simonneau, A.; Binet, S.; Galop, D. Atmospheric Transport and Deposition of Microplastics in a Remote Mountain Catchment. Nat. Geosci. 2019, 12 (5), 339–344. https://doi.org/10.1038/s41561-019-0335-5. [CrossRef]
- Roblin, B.; Ryan, M.; Vreugdenhil, A.; Aherne, J. Ambient Atmospheric Deposition of Anthropogenic Microfibers and Microplastics on the Western Periphery of Europe (Ireland). Environ. Sci. Technol. 2020, 54 (18), 11100–11108. https://doi.org/10.1021/acs.est.0c04000. [CrossRef]
- Aves, A.; Ruffell, H.; Evangeliou, N.; Gaw, S.; Revell, L. E. Modelled Sources of Airborne Microplastics Collected at a Remote Southern Hemisphere Site. Atmos. Environ. 2024, 325, 120437. https://doi.org/10.1016/j.atmosenv.2024.120437. [CrossRef]
- Klein, M.; Fischer, E. K. Microplastic Abundance in Atmospheric Deposition within the Metropolitan Area of Hamburg, Germany. Sci. Total Environ. 2019, 685, 96–103. https://doi.org/10.1016/j.scitotenv.2019.05.405. [CrossRef]
- P33_marin-Beltran-et-Al_spq.Pdf. https://ccmar.ualg.pt/sites/default/files/legacy/p33_marin-beltran-et-al_spq.pdf (accessed 2024-07-09).
Figure 1.
Scheme for the sample preparation process using sieving and filtration.
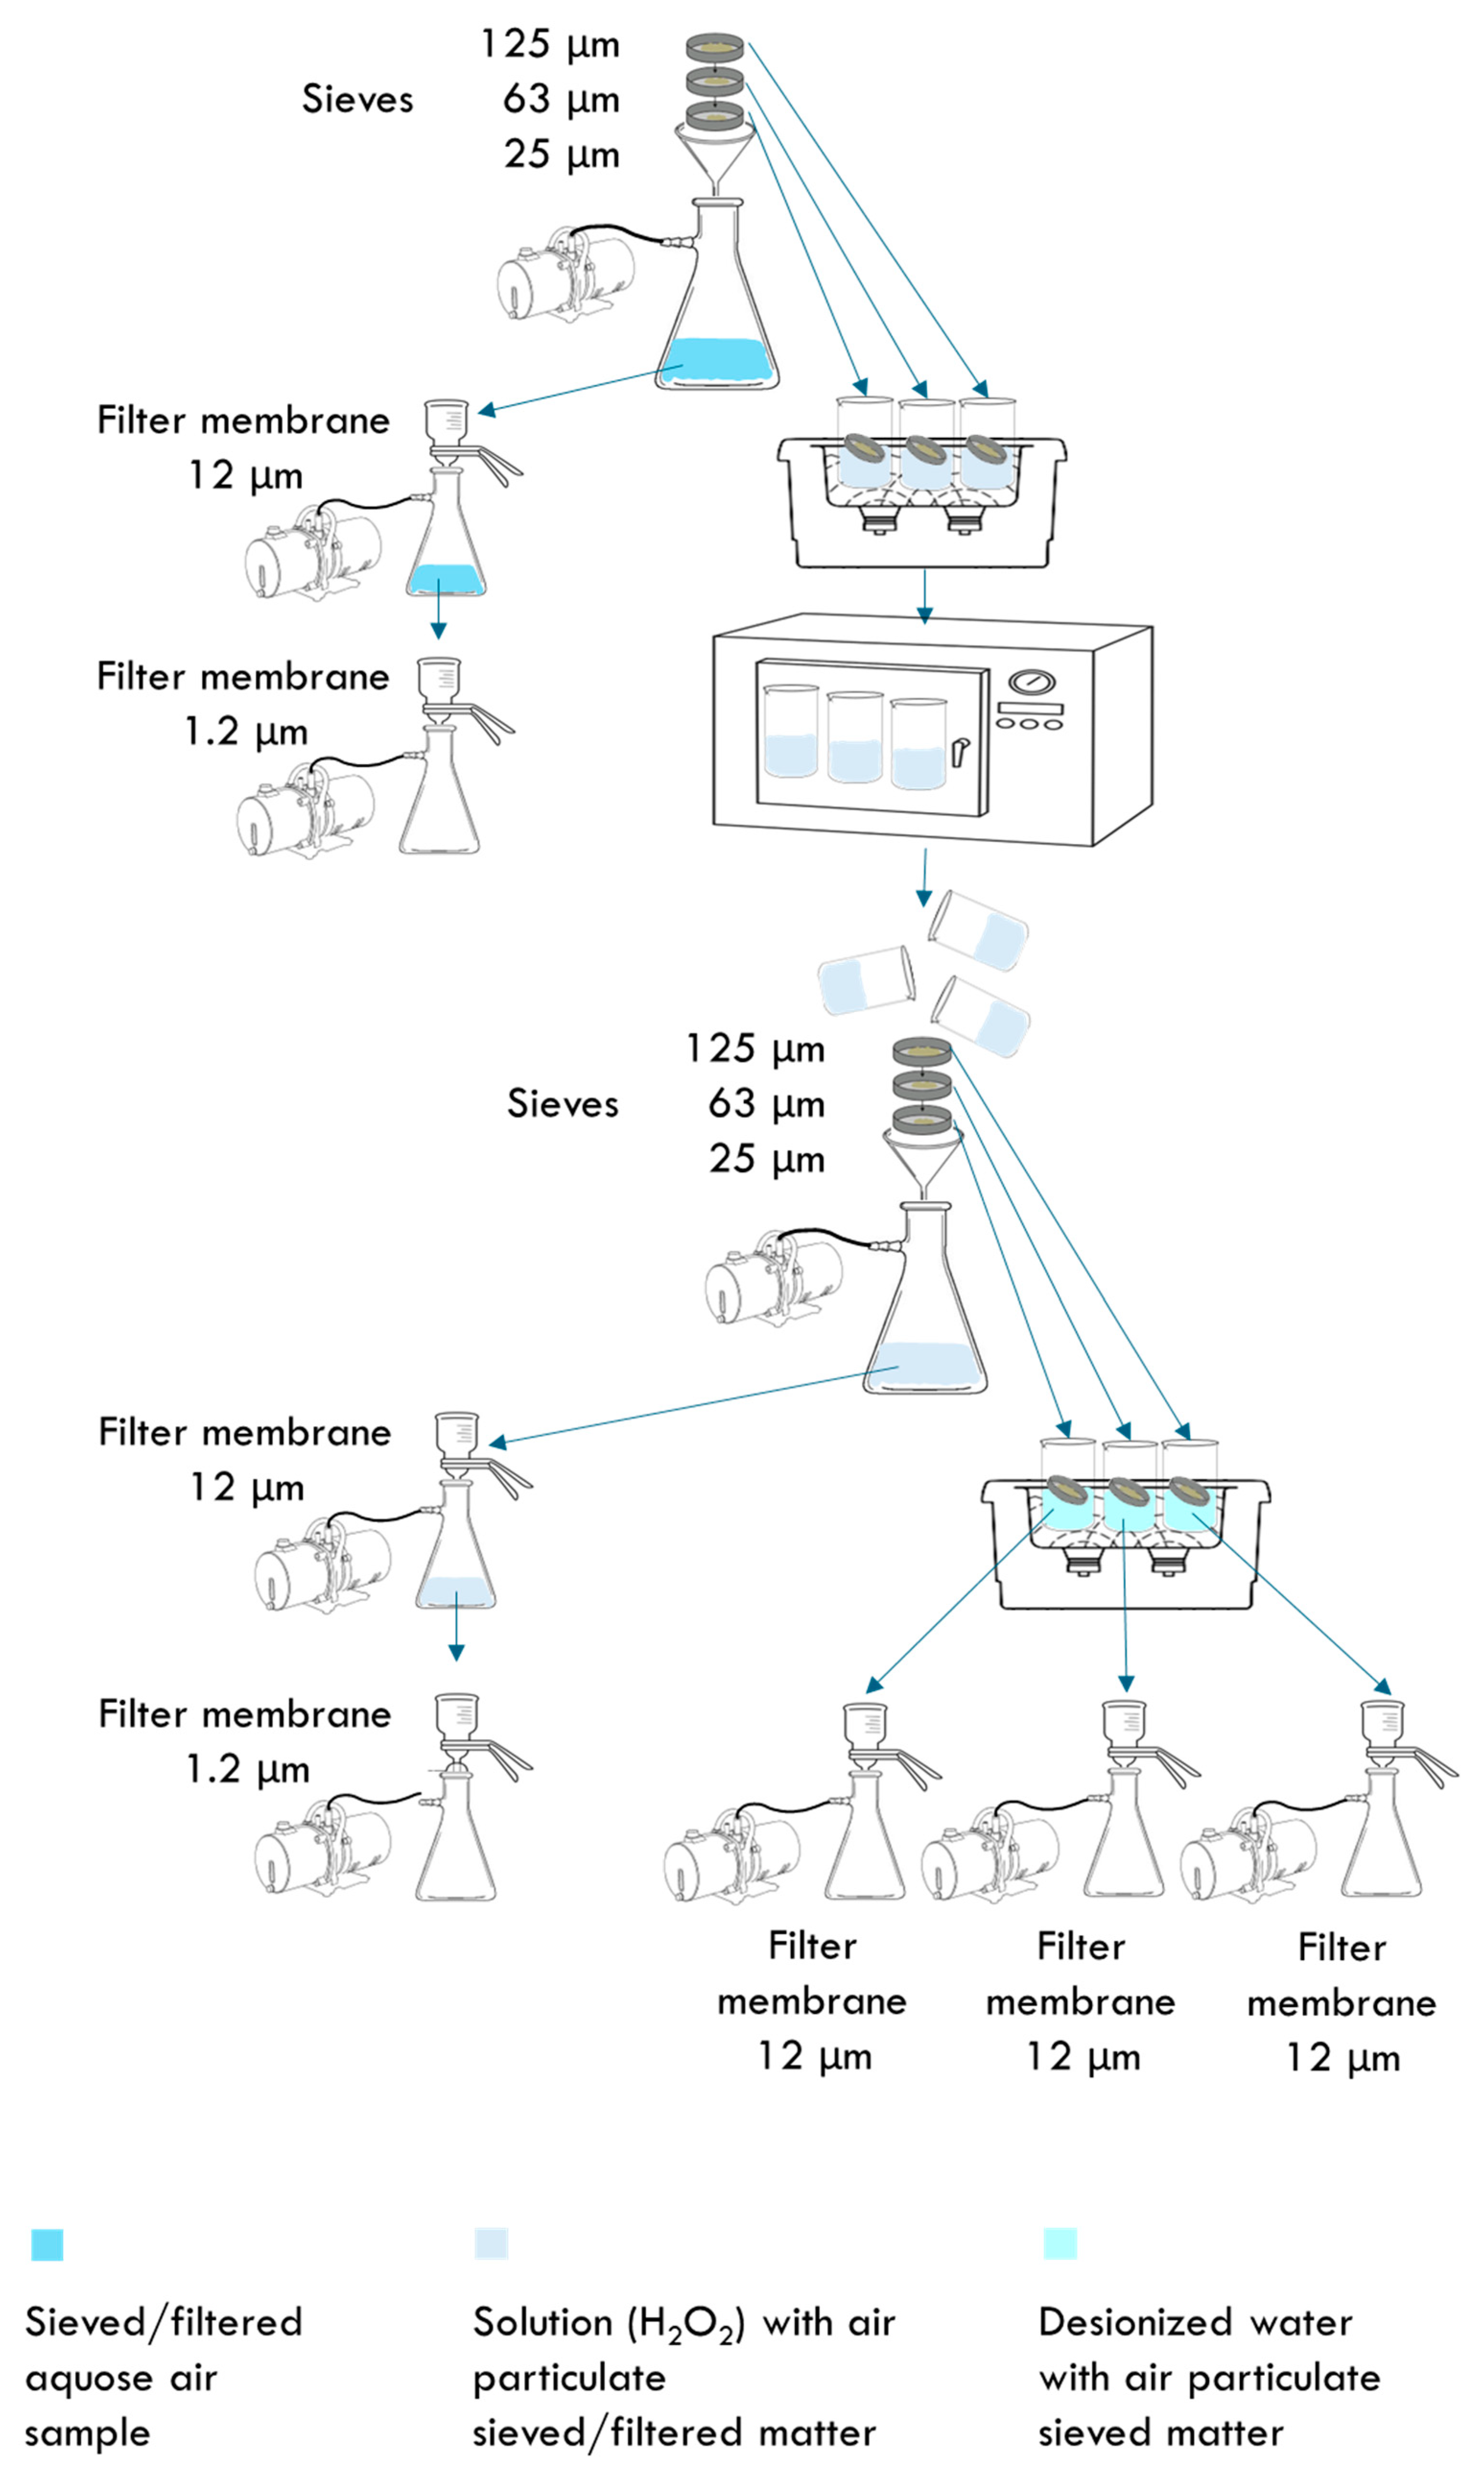
Figure 2.
Total absolute number of MPs and fibers in each collected sample.
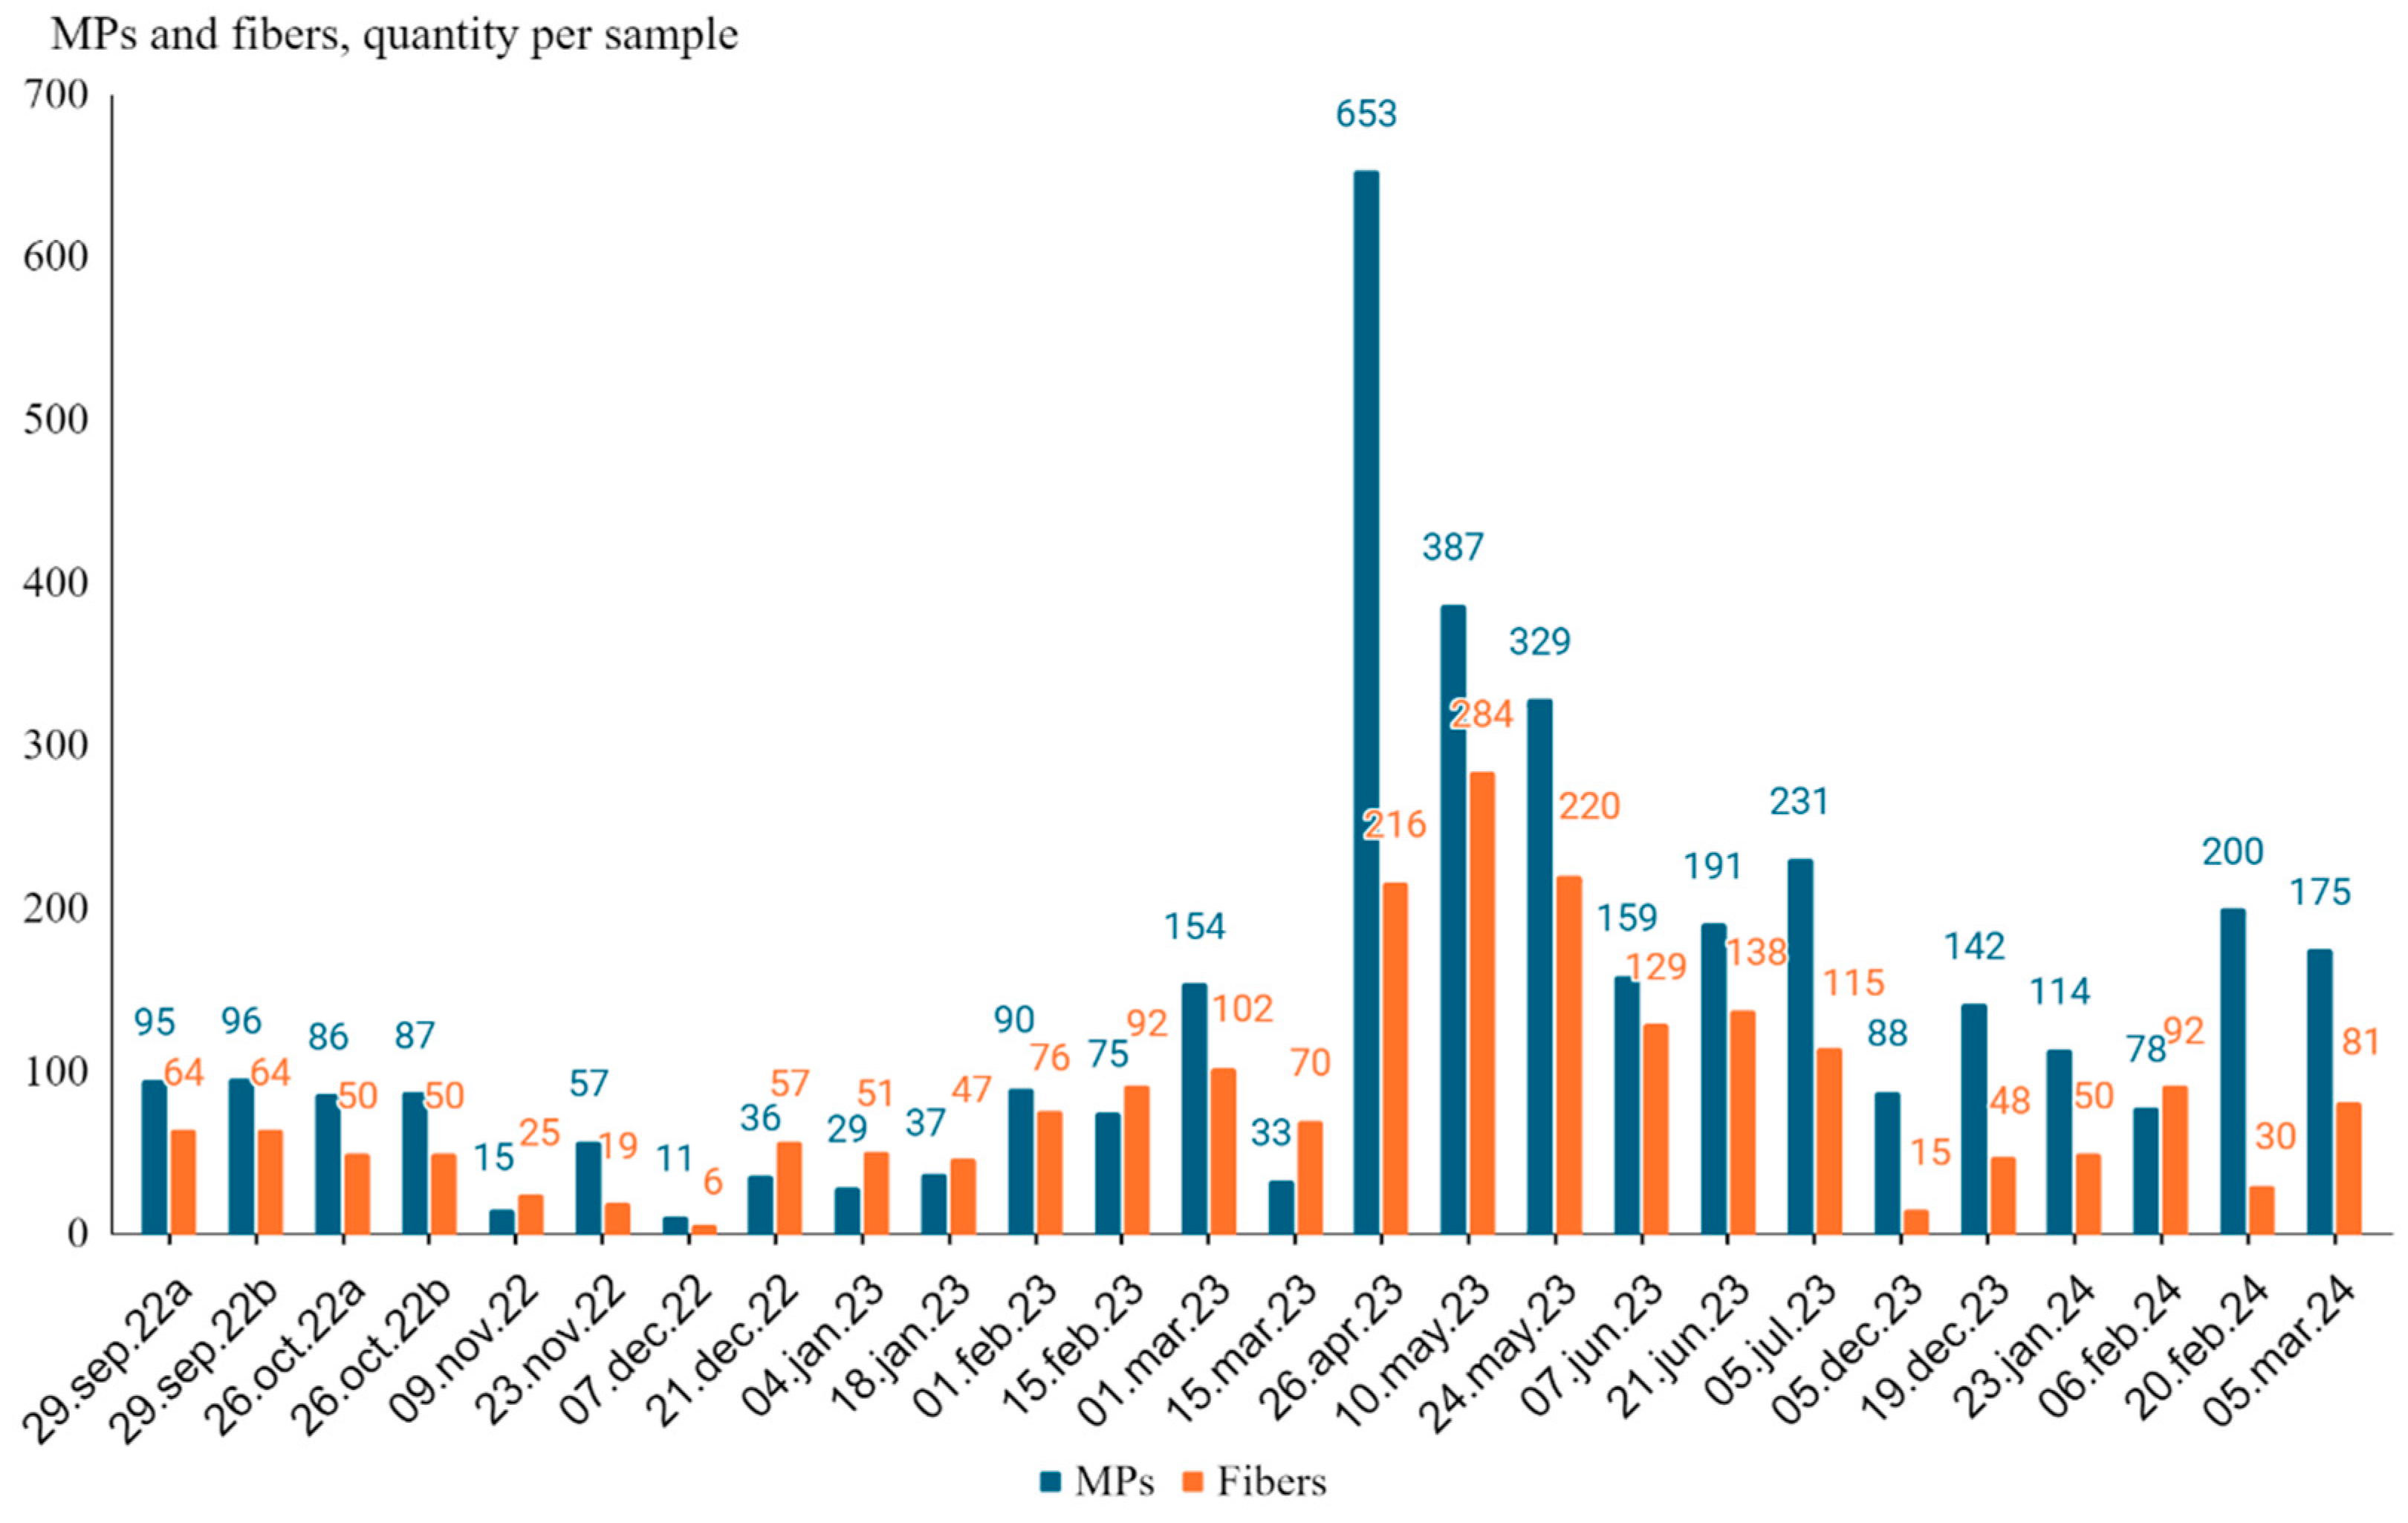
Figure 3.
Percentage of total MPs vs fibers in each collected sample.
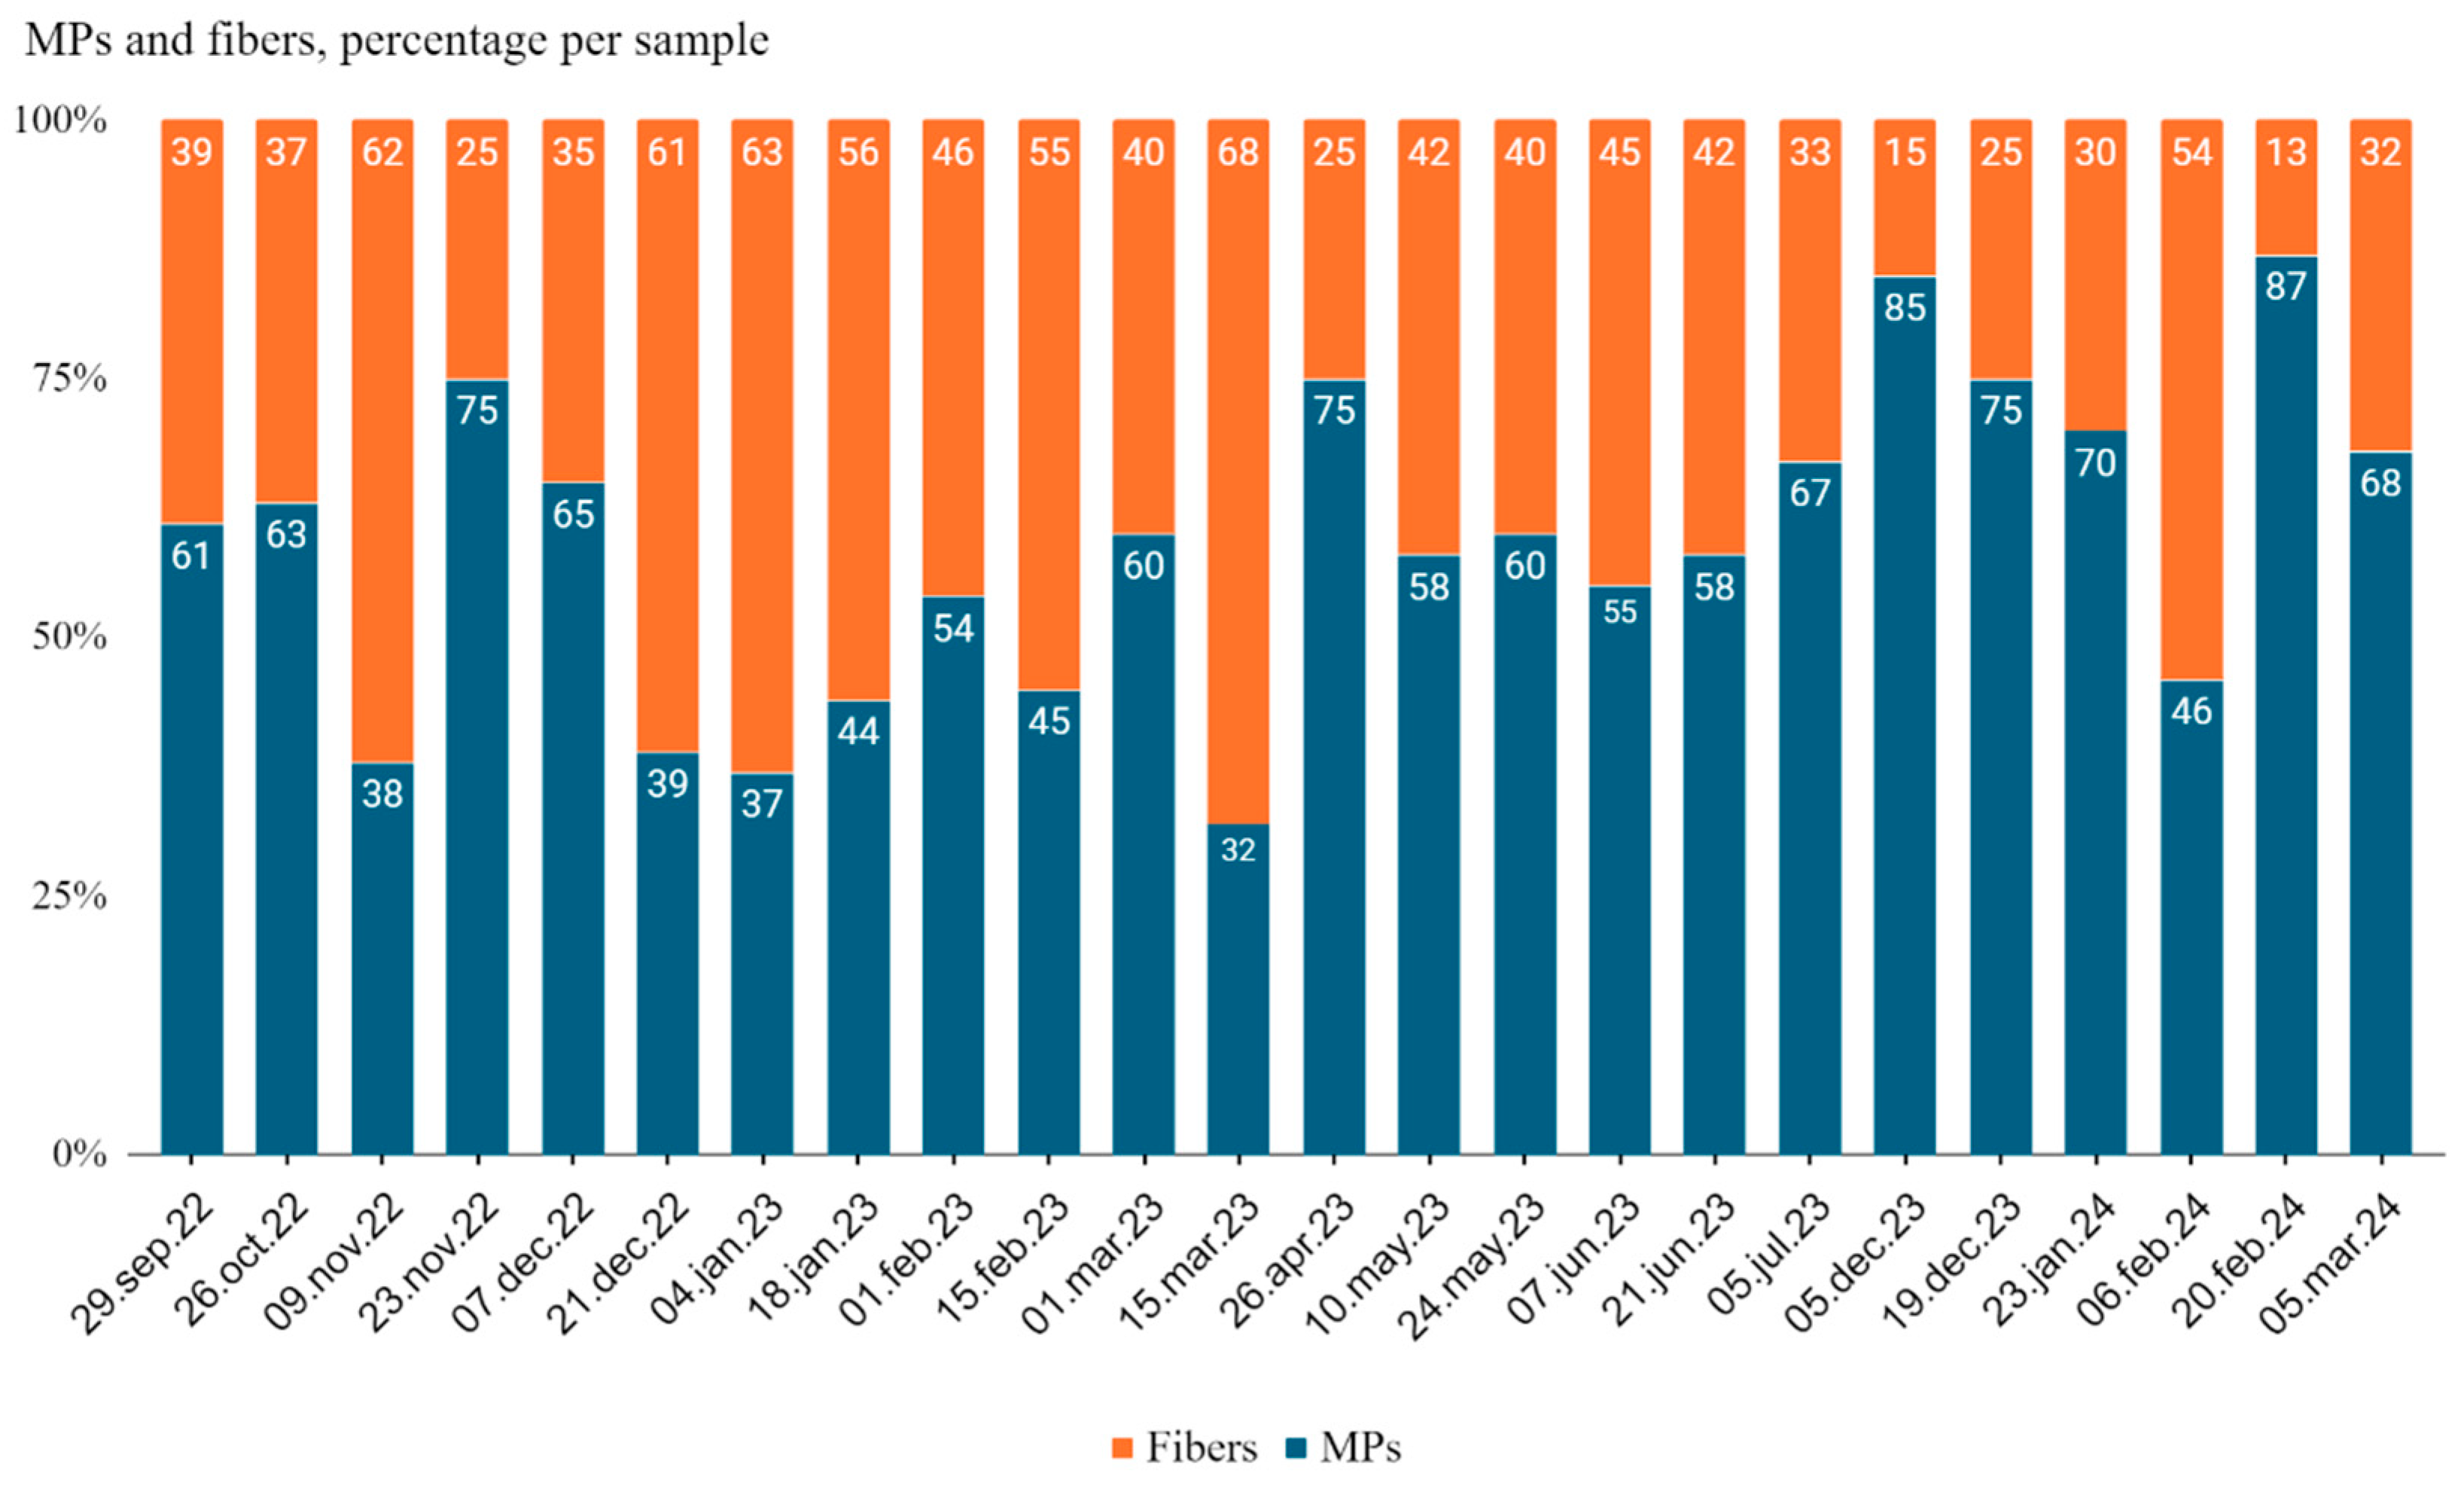
Figure 4.
Fibers counted by the size-fractions in each collected sample.
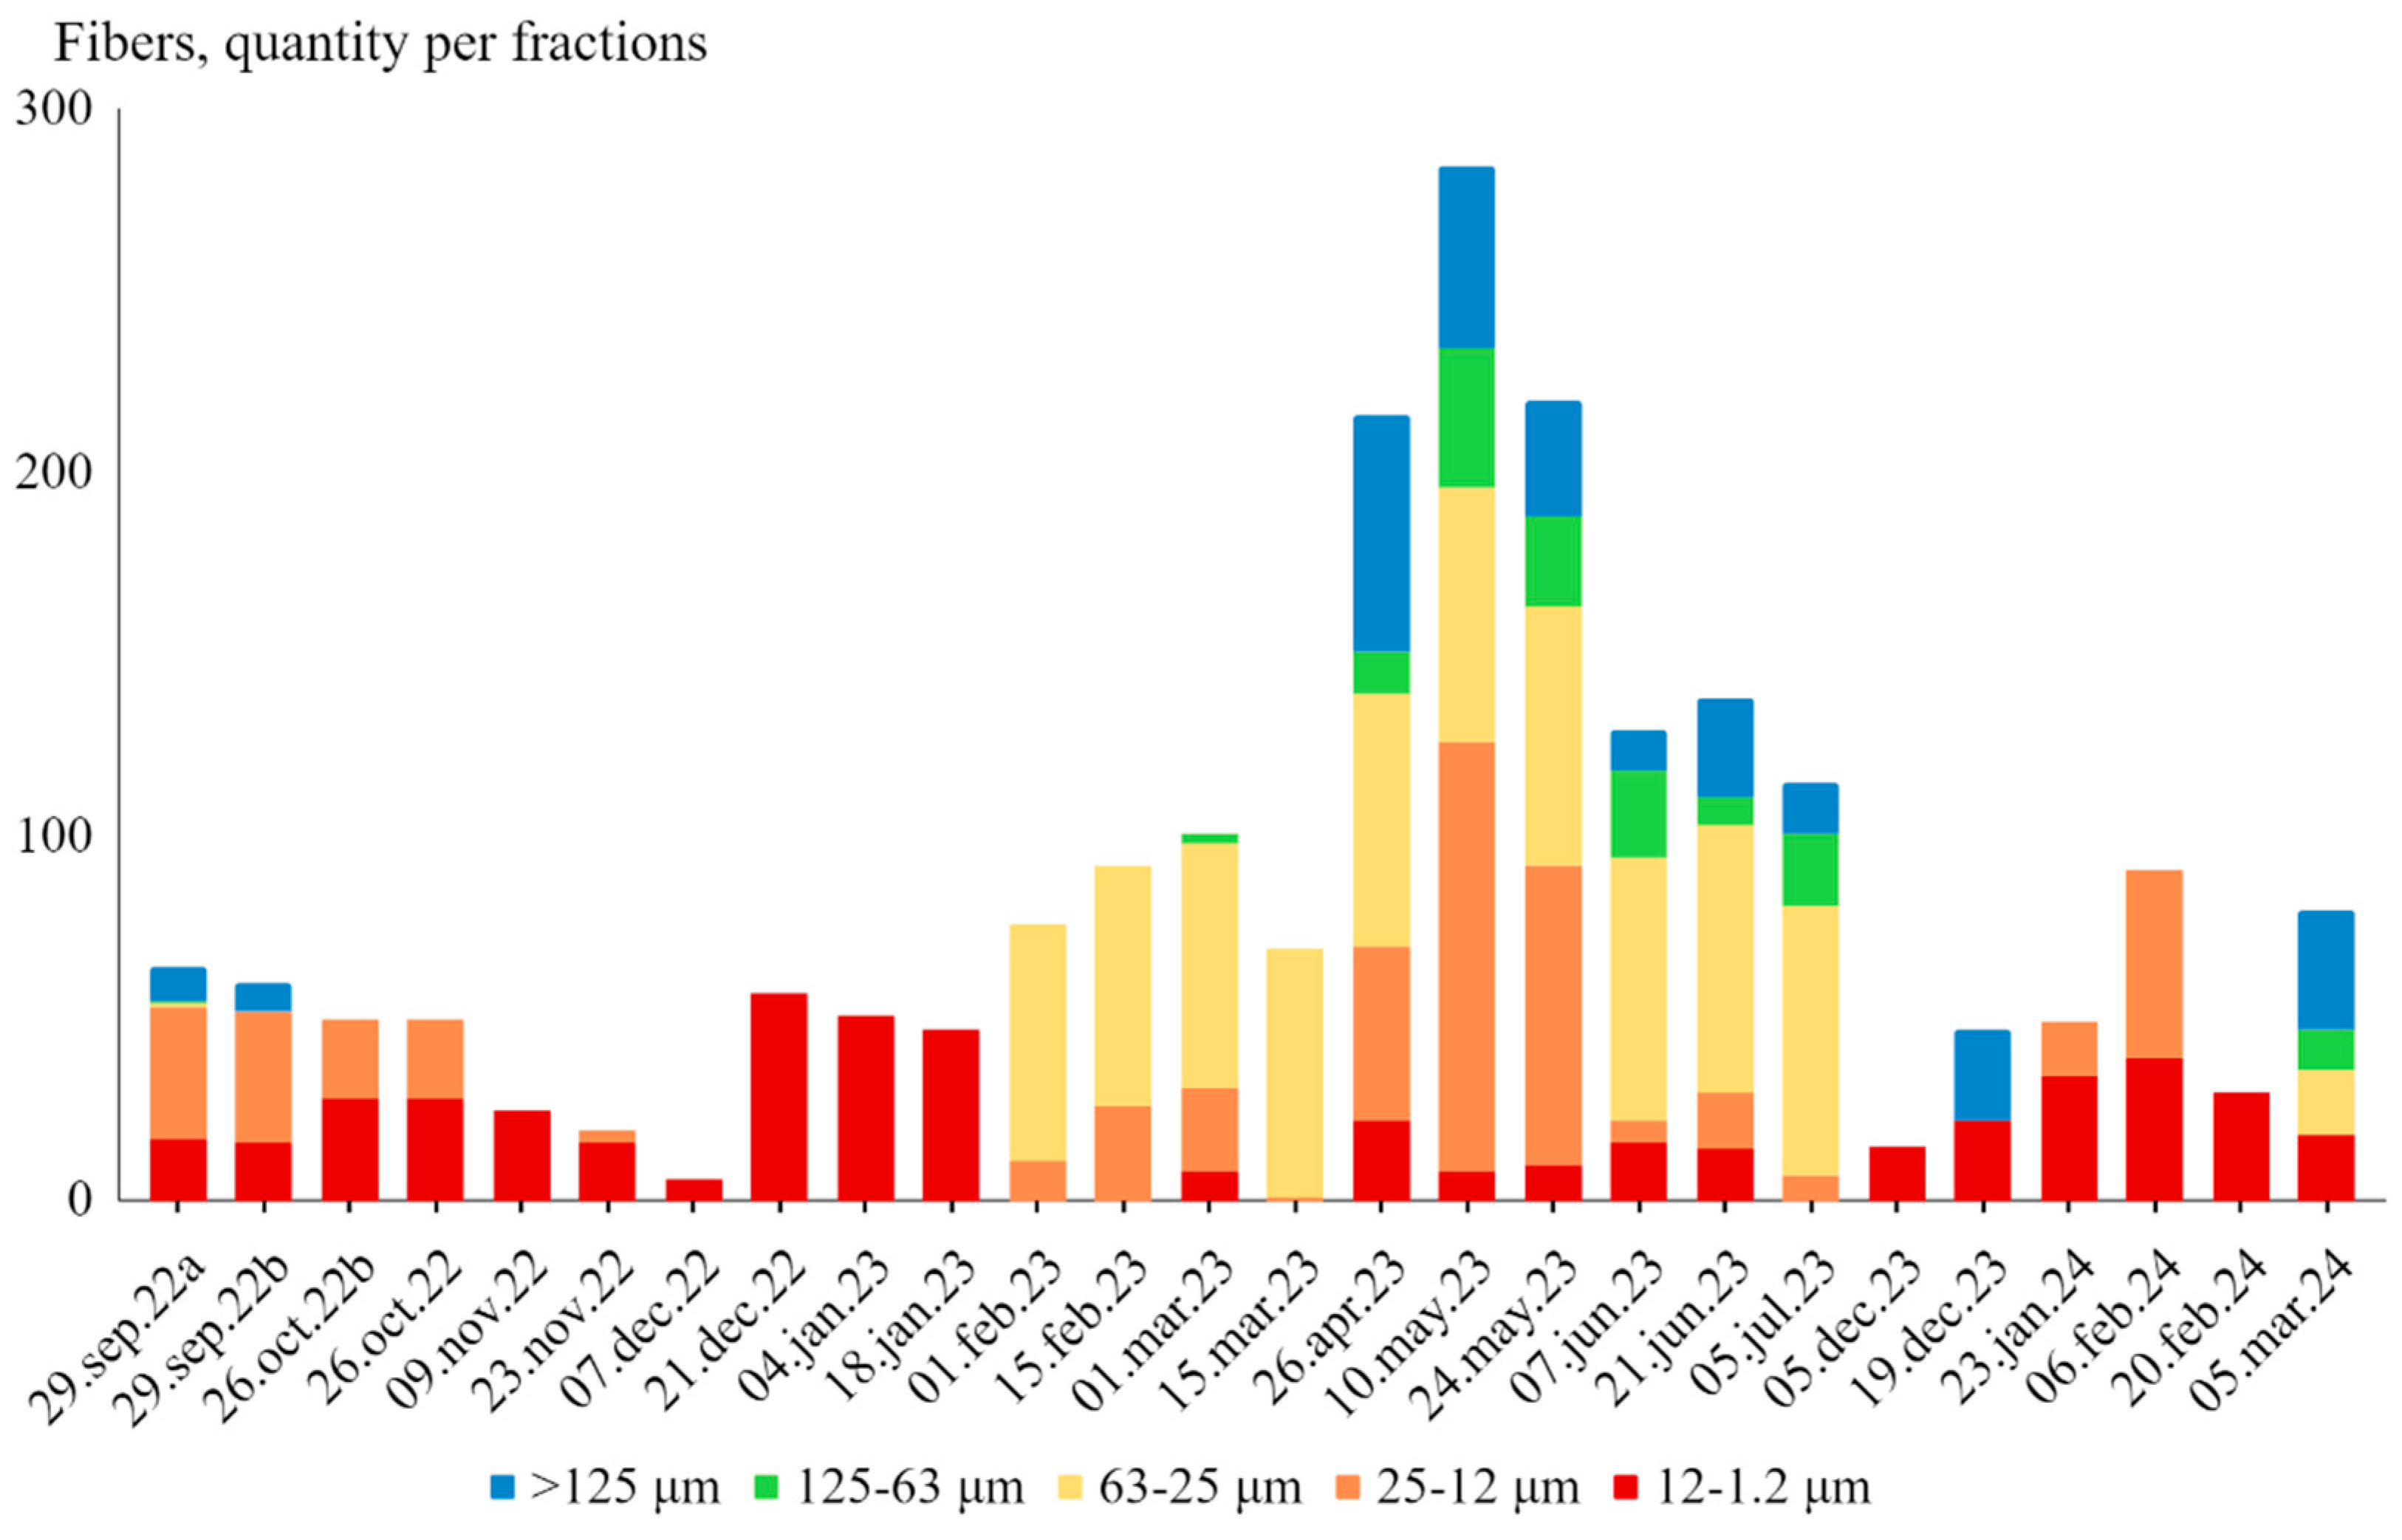
Figure 5.
Box plots of absolute numbers of MPs in each size fraction across all collected samples.
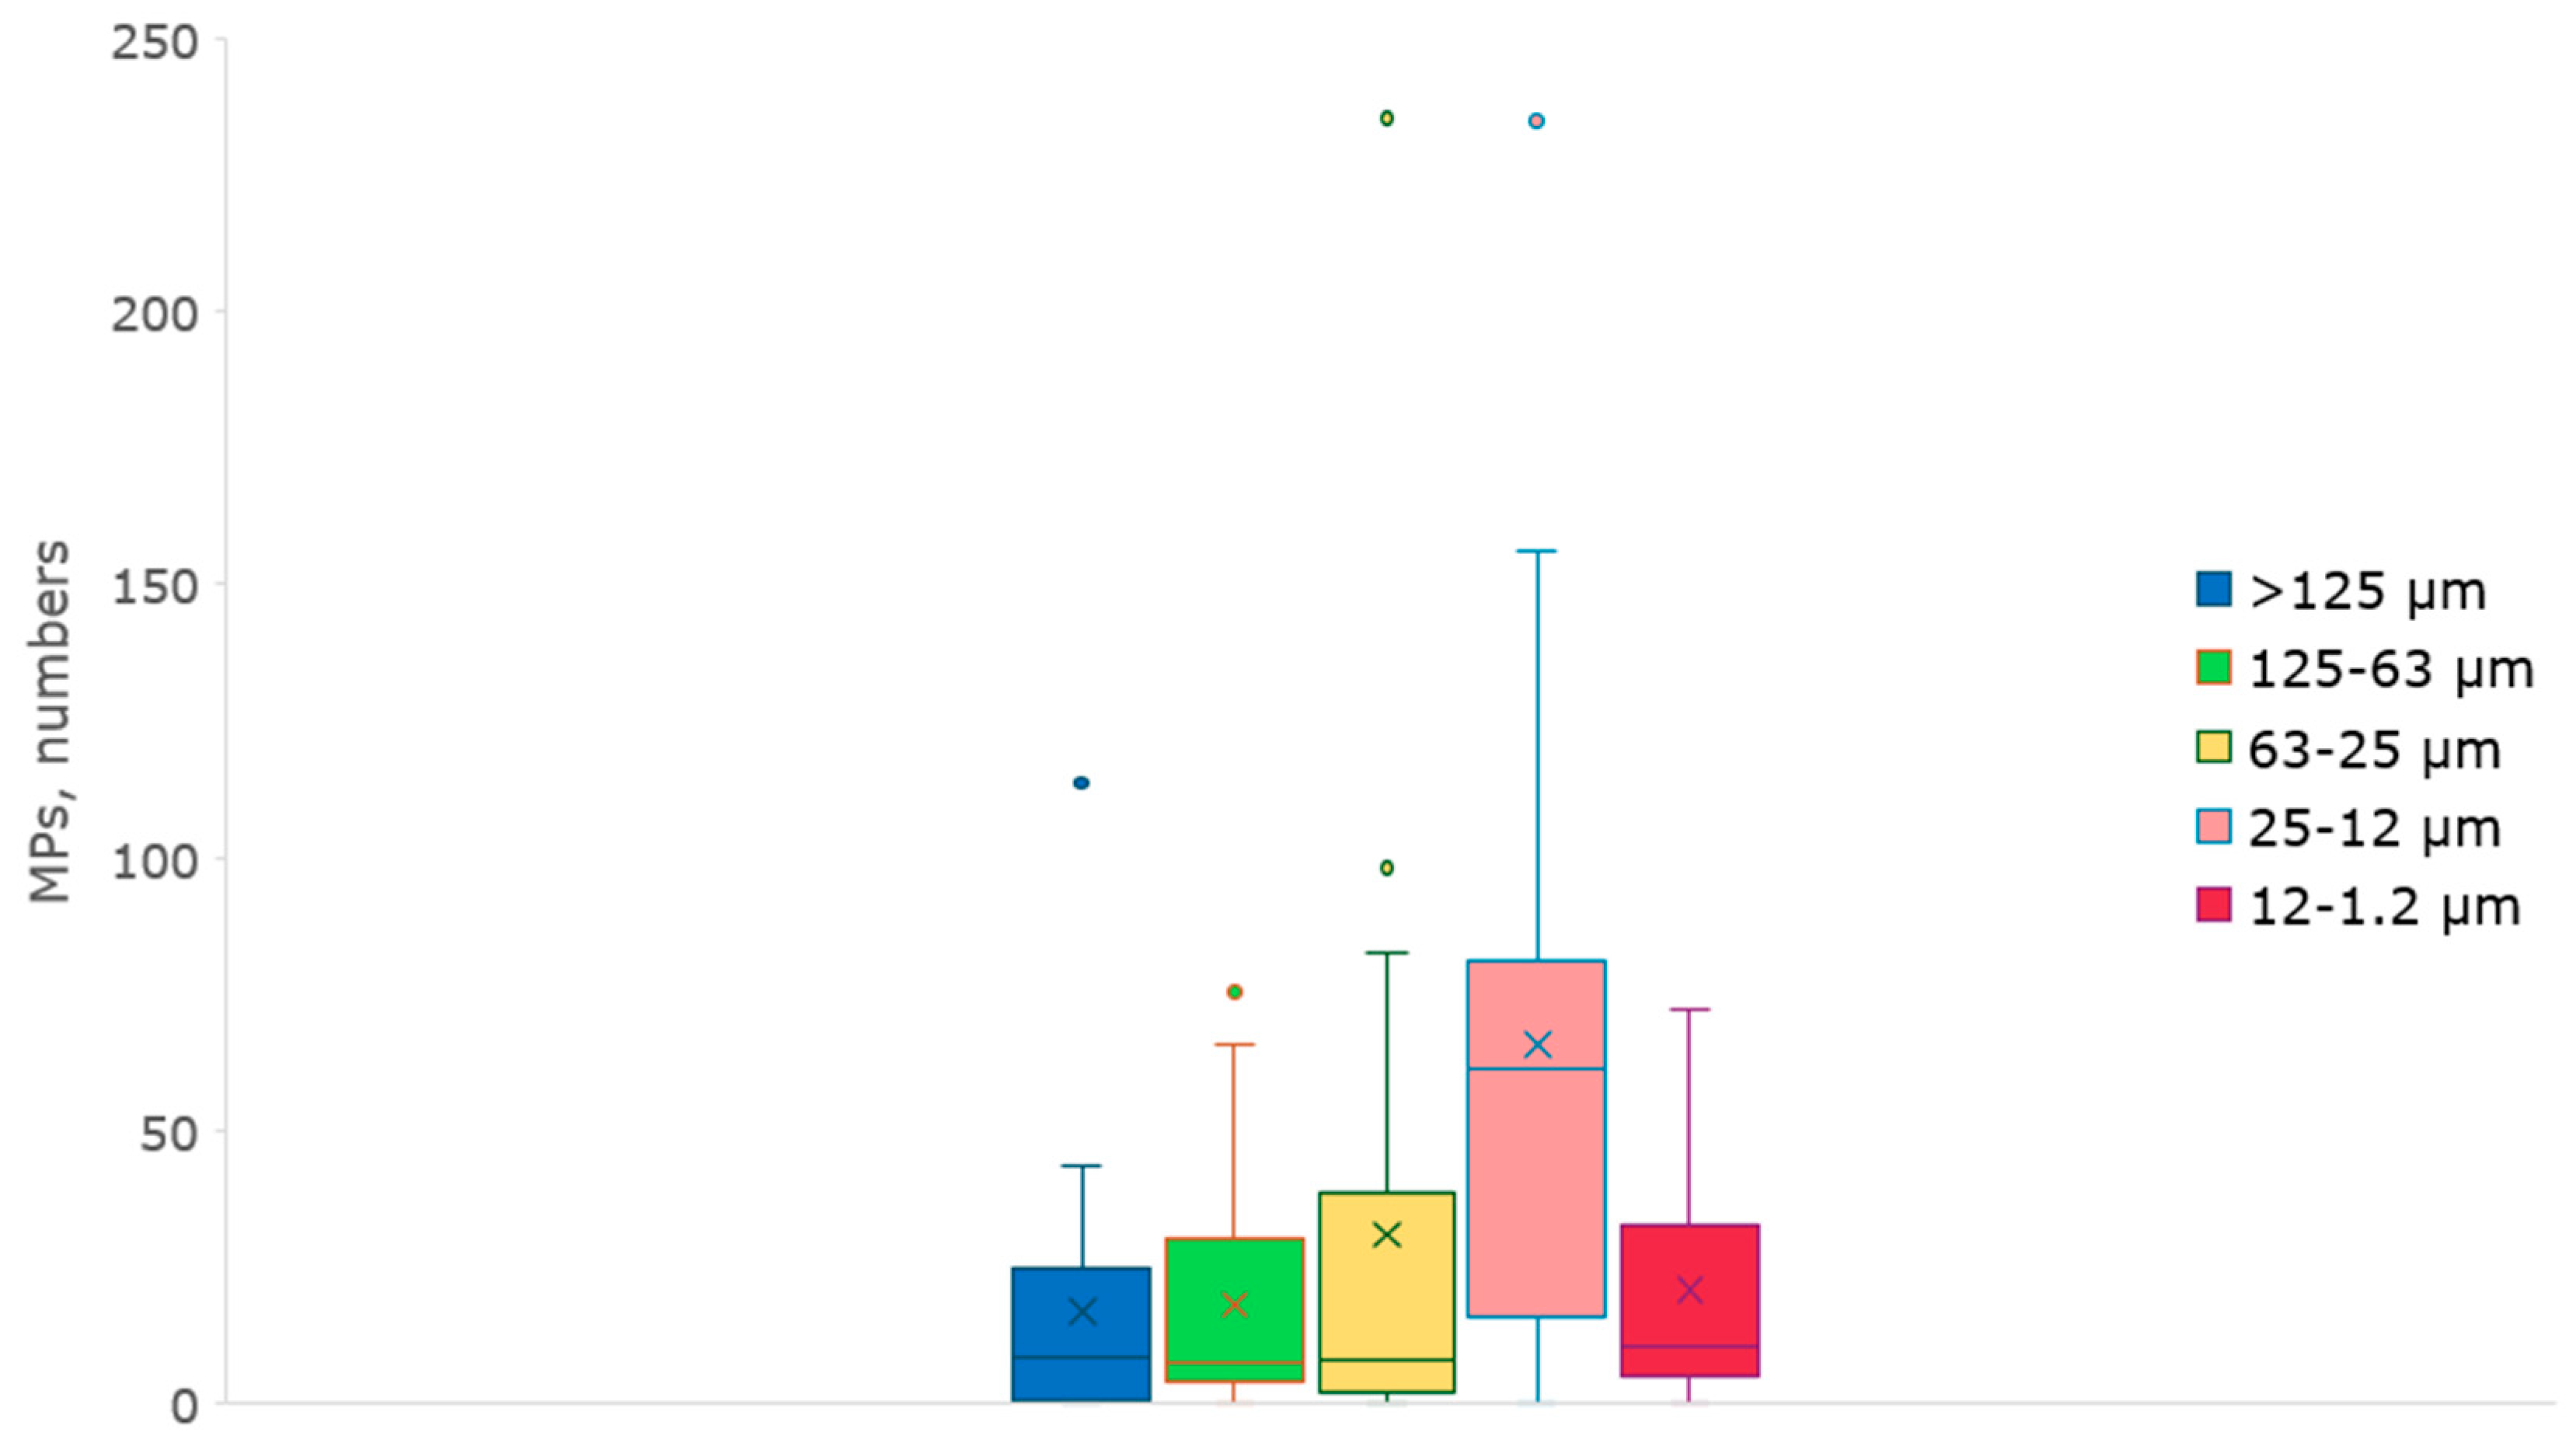
Figure 6.
Box plots of numbers of MPs and fibers per day and per square meter (MPs/day/m2) for total fractions in each collected sample.
Figure 6.
Box plots of numbers of MPs and fibers per day and per square meter (MPs/day/m2) for total fractions in each collected sample.
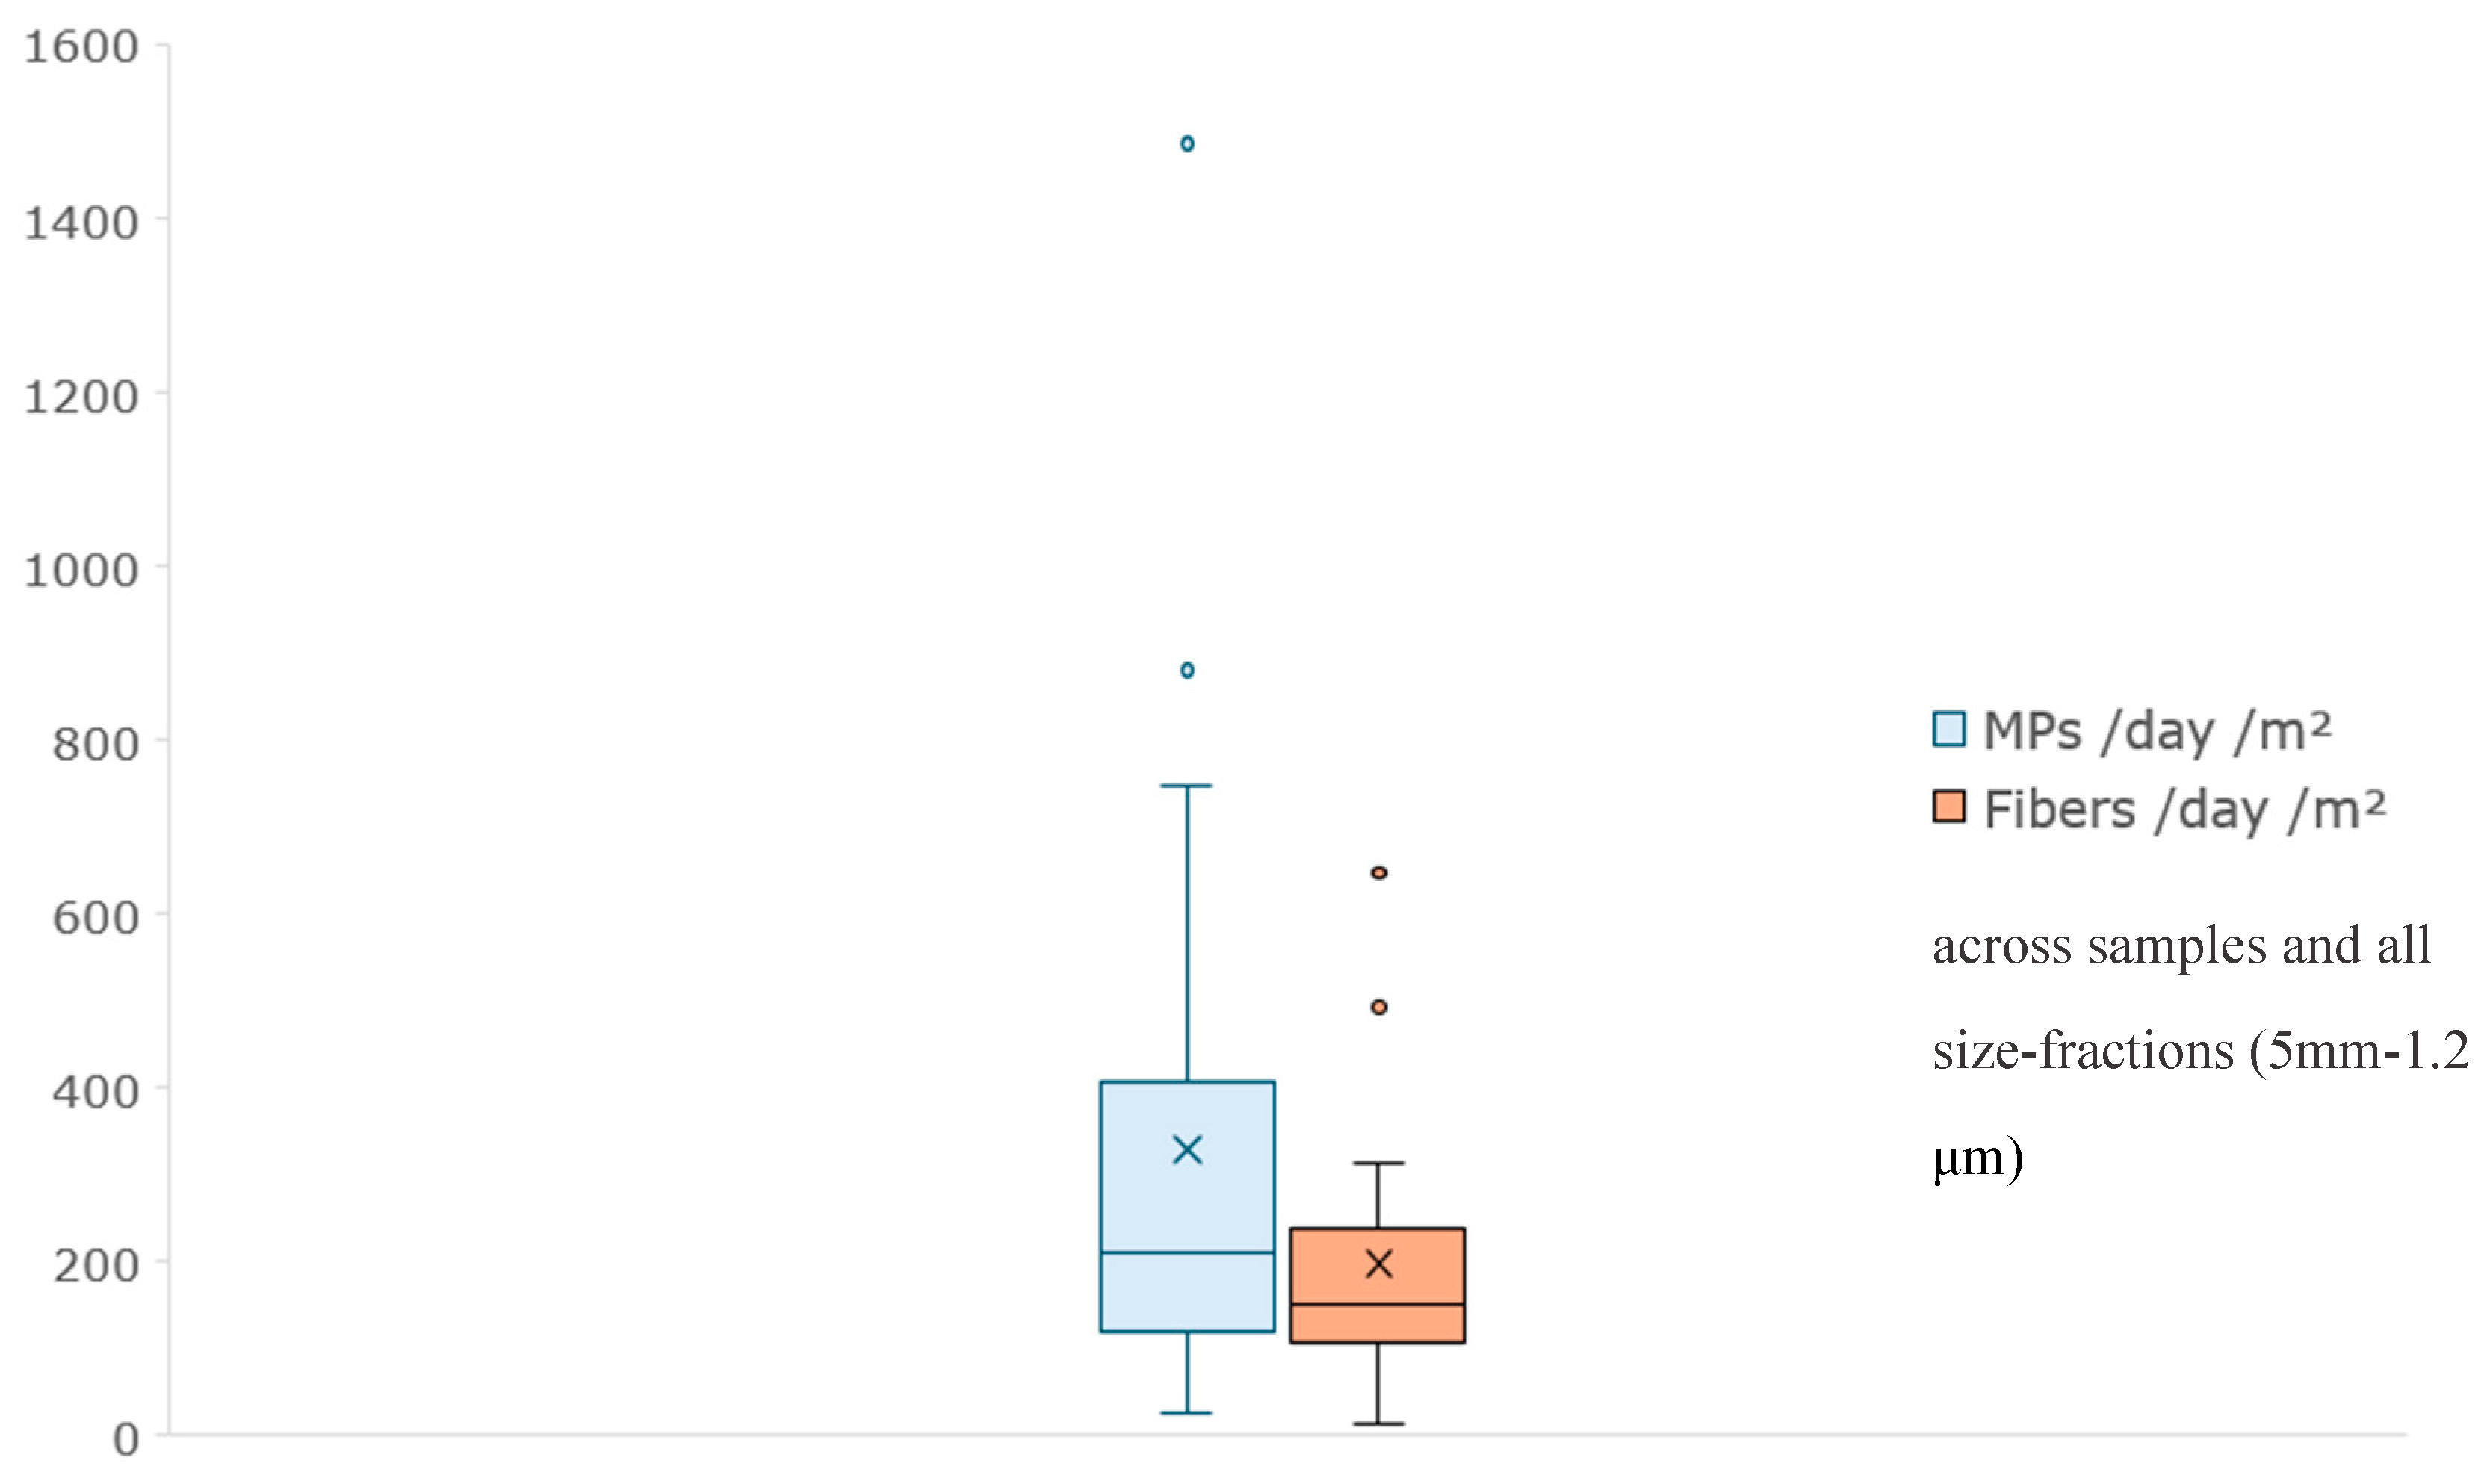
Figure 7.
MPs were calculated per day and per square meter (MPs/day/m2) across collected samples and within the two smallest fractions (25-12 μm and 12-1.2 μm), as well as for total of fractions (5mm-1.2 μm), without applying the recovery rate.
Figure 7.
MPs were calculated per day and per square meter (MPs/day/m2) across collected samples and within the two smallest fractions (25-12 μm and 12-1.2 μm), as well as for total of fractions (5mm-1.2 μm), without applying the recovery rate.
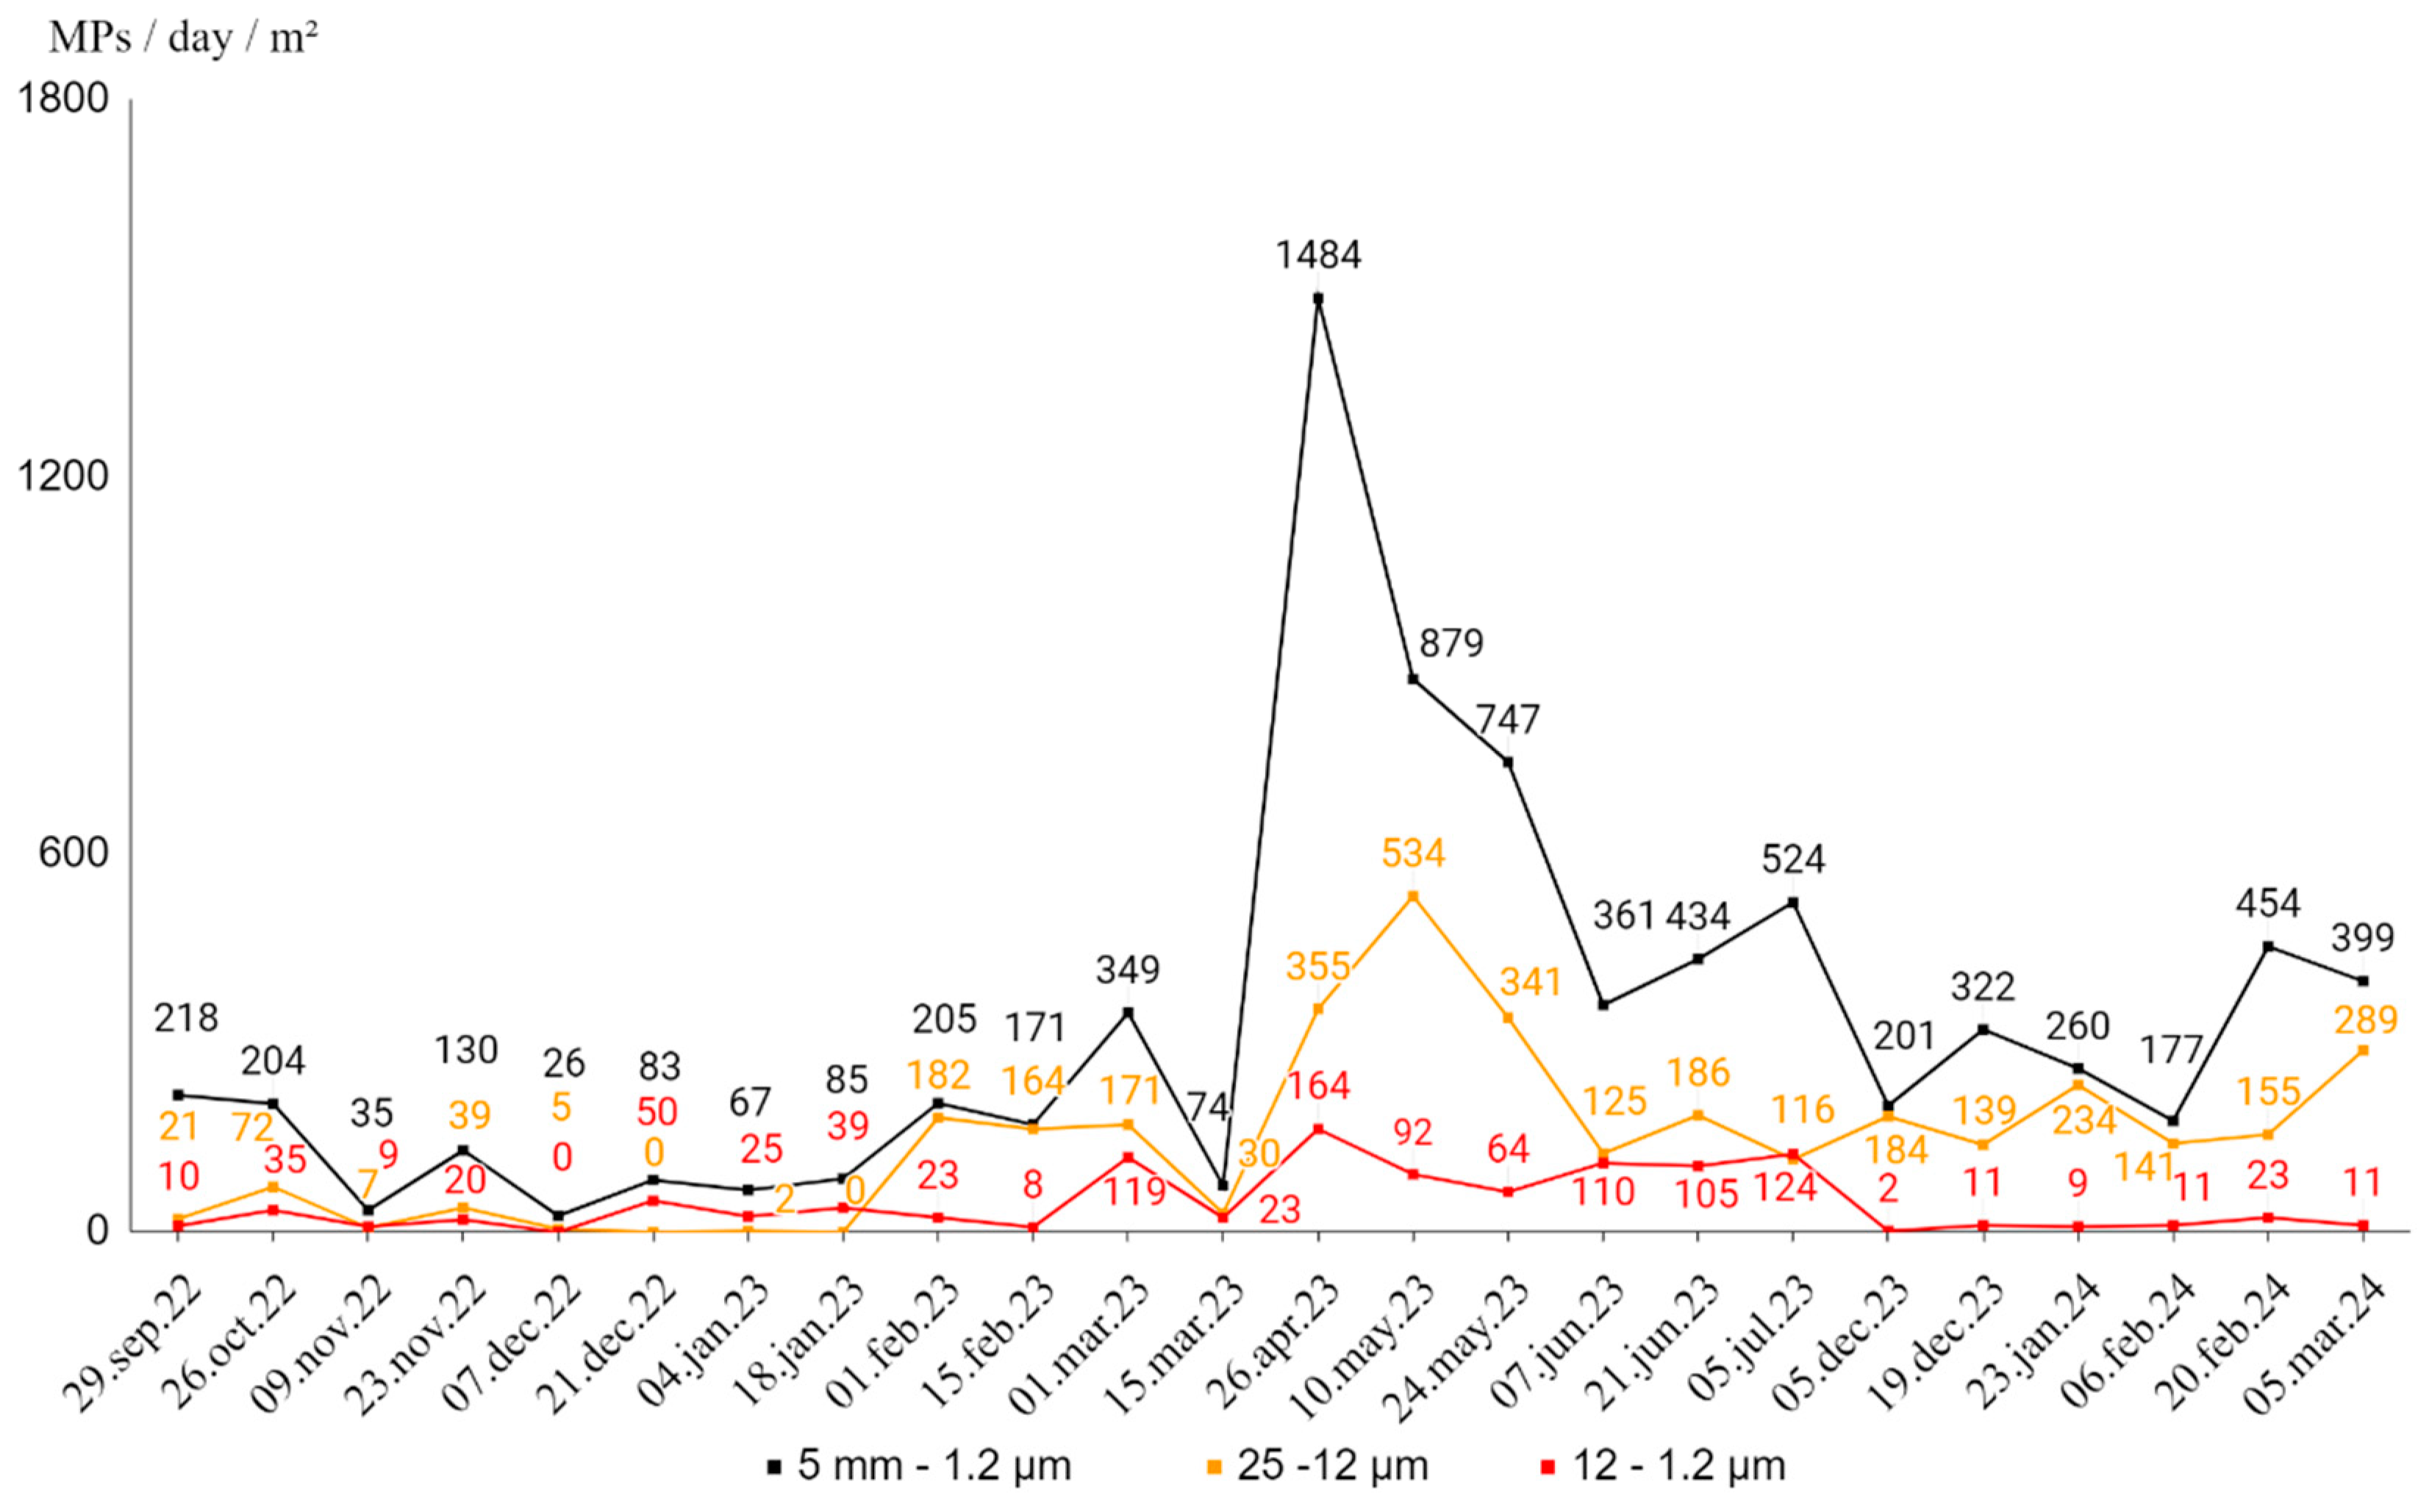
Figure 8.
Wind Rose schemes projected for winds of sampling period: (a) all winds in absolute frequencies for each collected air sample.; (b) predominated wind in absolute frequency for each collected air sample.
Figure 8.
Wind Rose schemes projected for winds of sampling period: (a) all winds in absolute frequencies for each collected air sample.; (b) predominated wind in absolute frequency for each collected air sample.
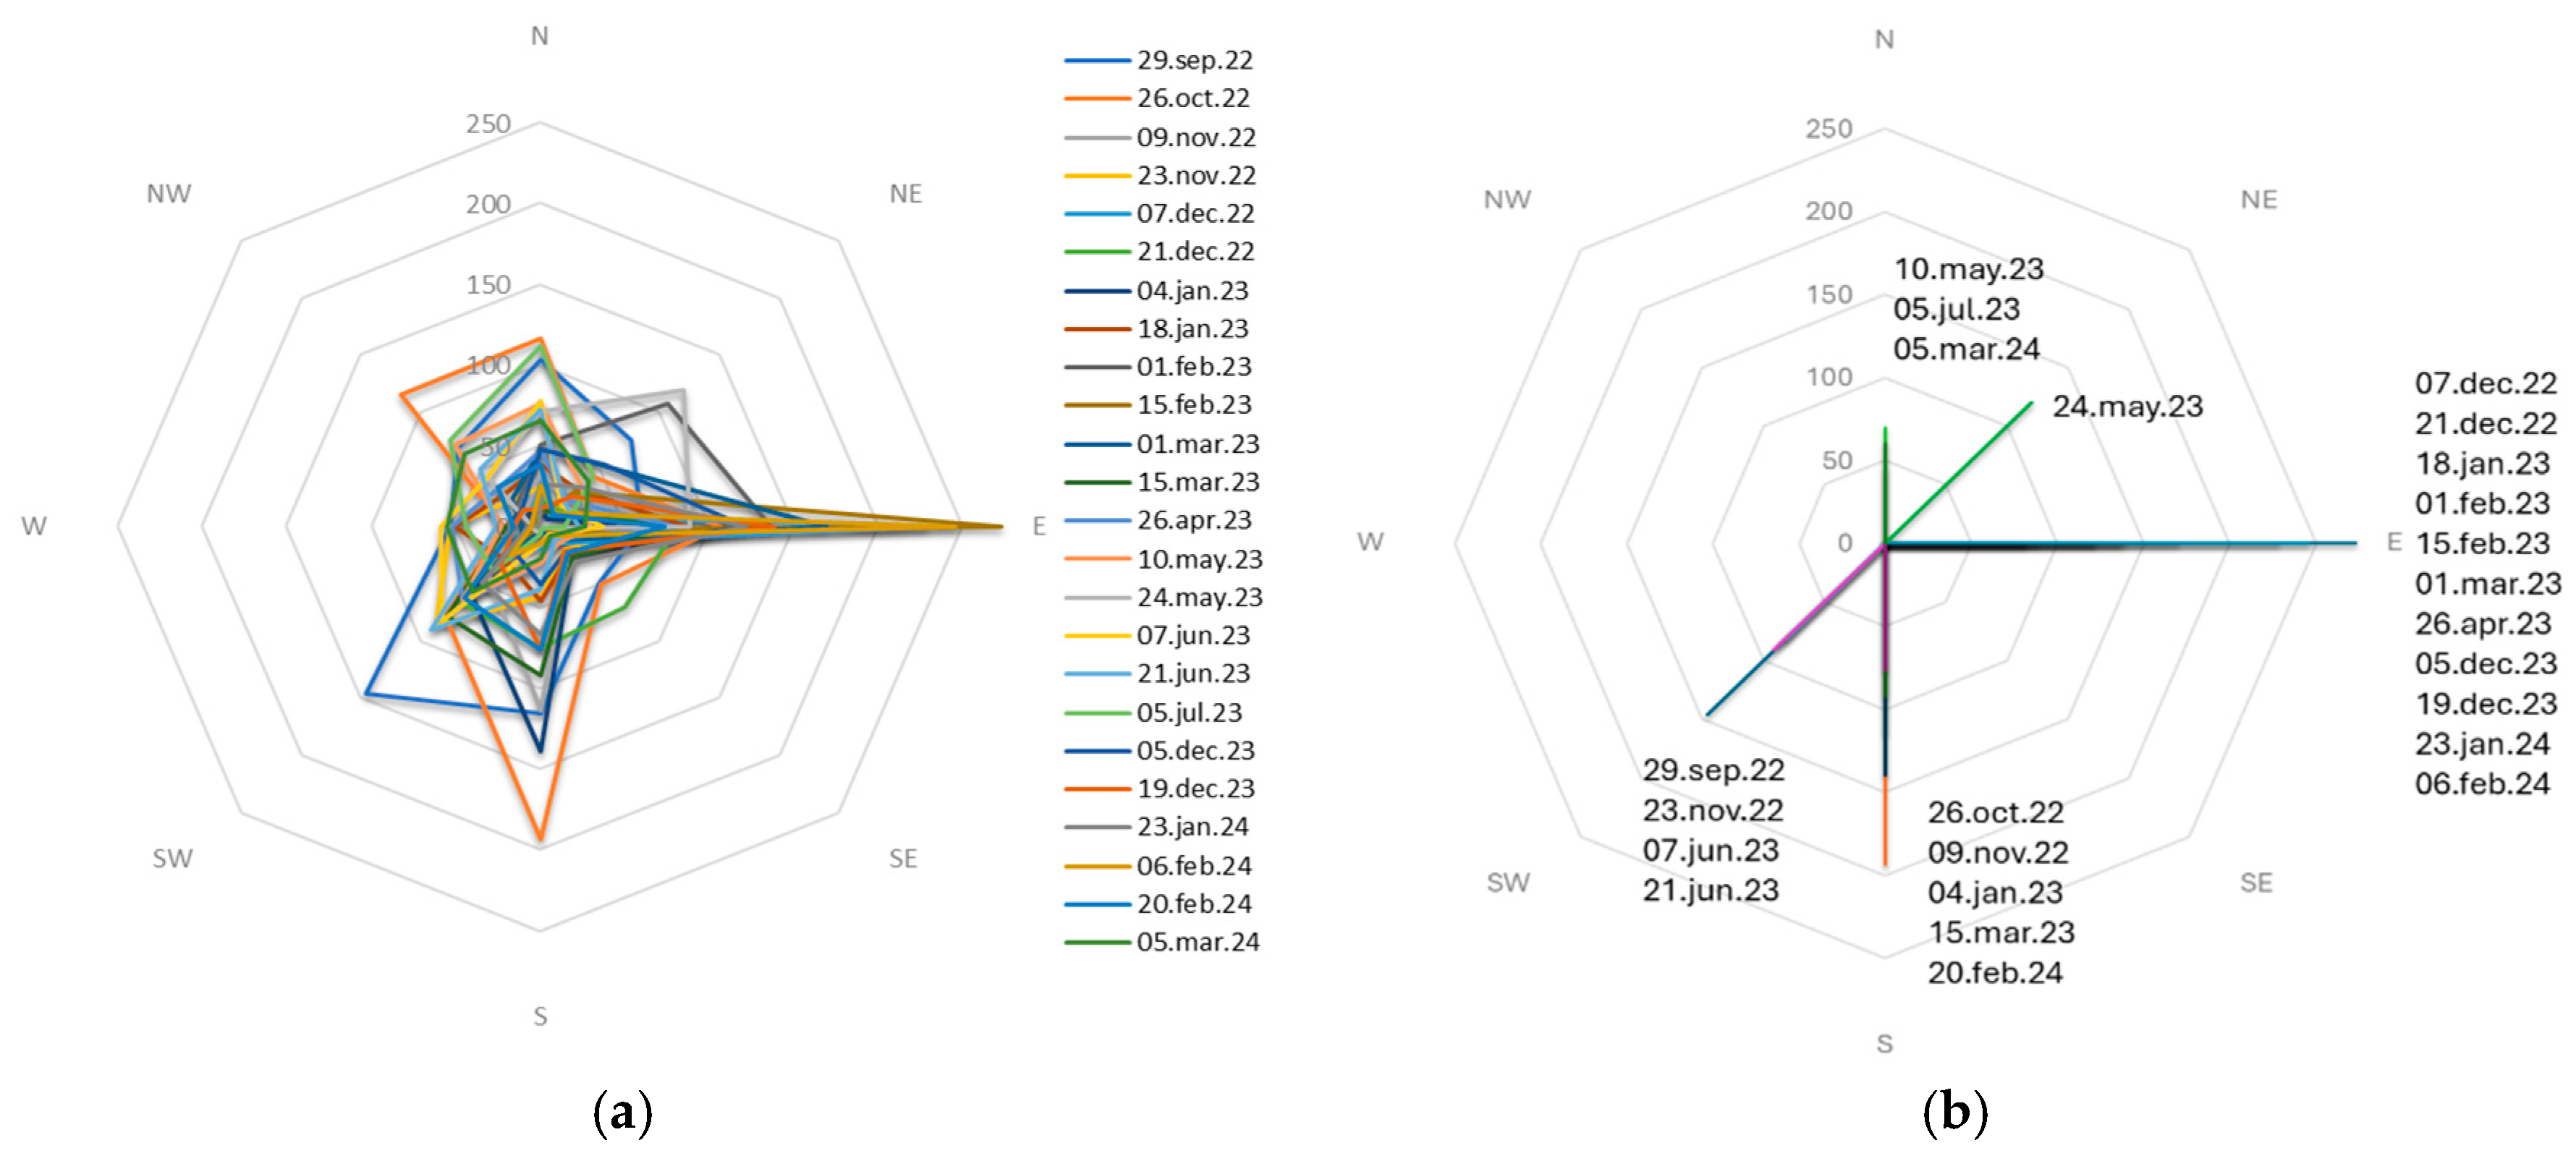
Figure 9.
The Spearman`s rank correlation coefficients with associated probability (p-values) for different wind directions and size fractions of MPs and fibers.
Figure 9.
The Spearman`s rank correlation coefficients with associated probability (p-values) for different wind directions and size fractions of MPs and fibers.
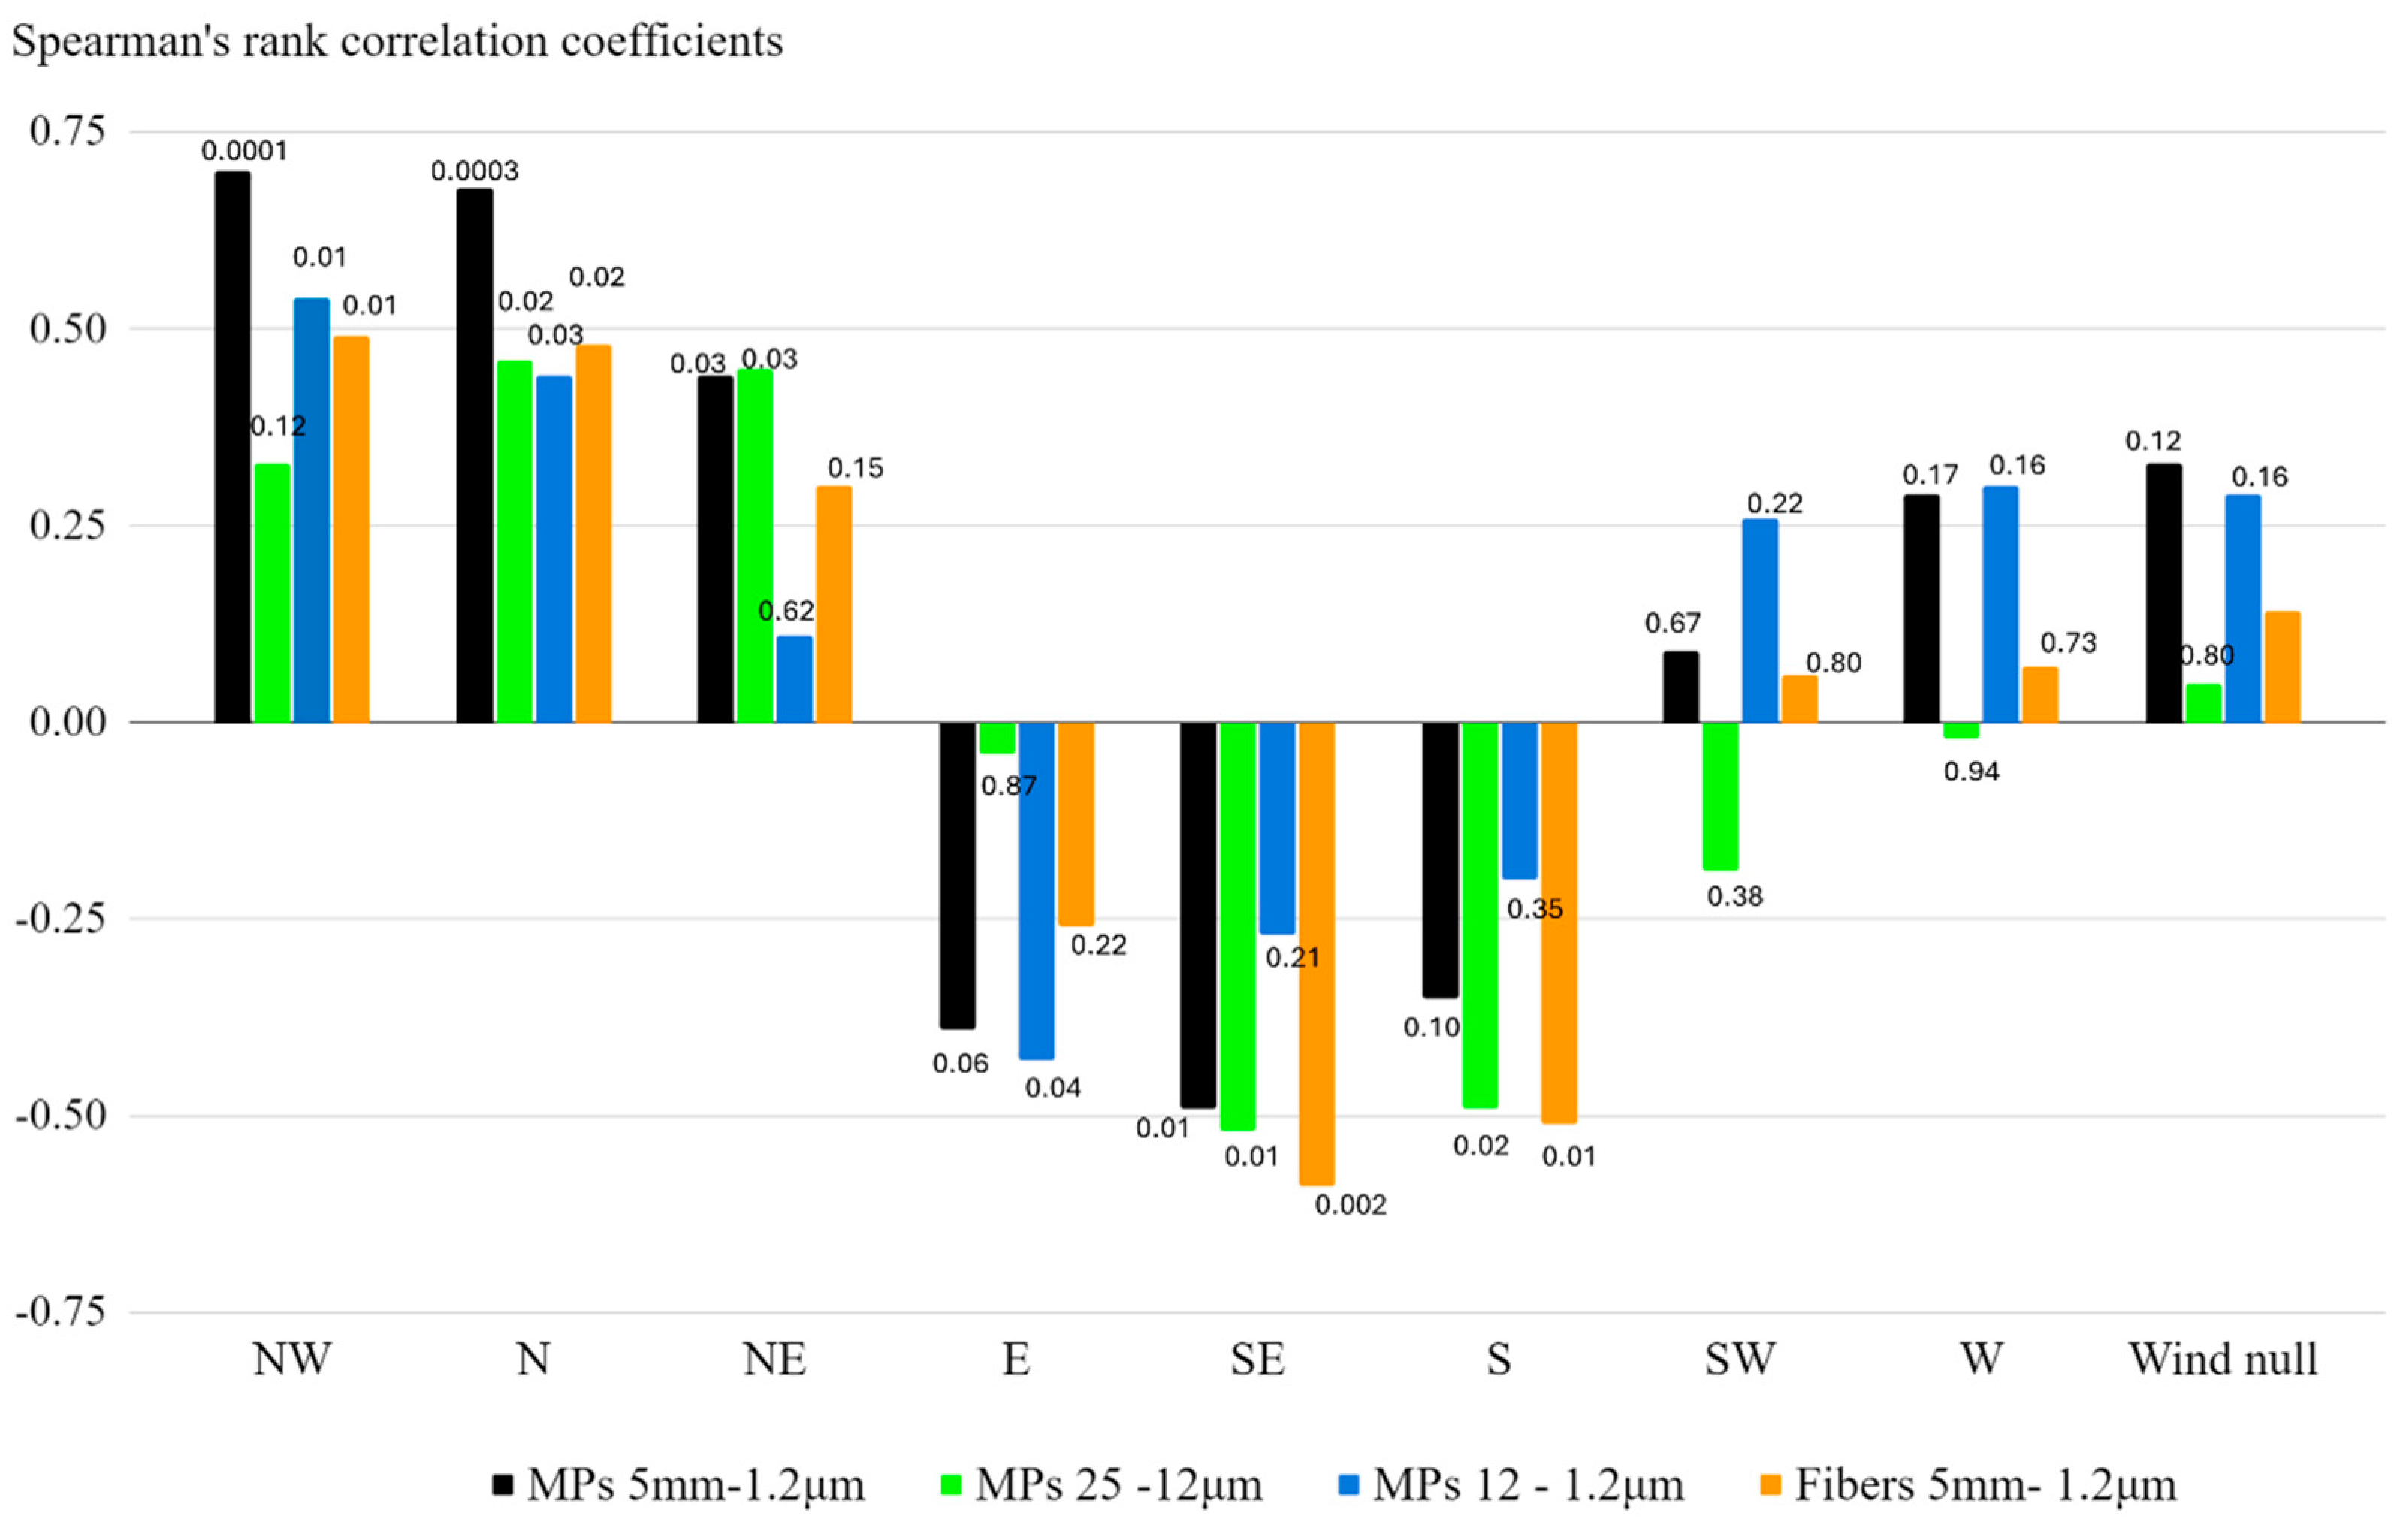
Figure 10.
Principal Component Analysis of Microplastic Concentrations (MPs/day/m²) for total of fractions (5mm- 1.2μm) and Meteorological Factors (16 Components: Wind, Precipitation, Temperature, Humidity). Scree plot for Eigenvalues and Biplot for Principal components (PC1, PC2 and PC3) and observed values.
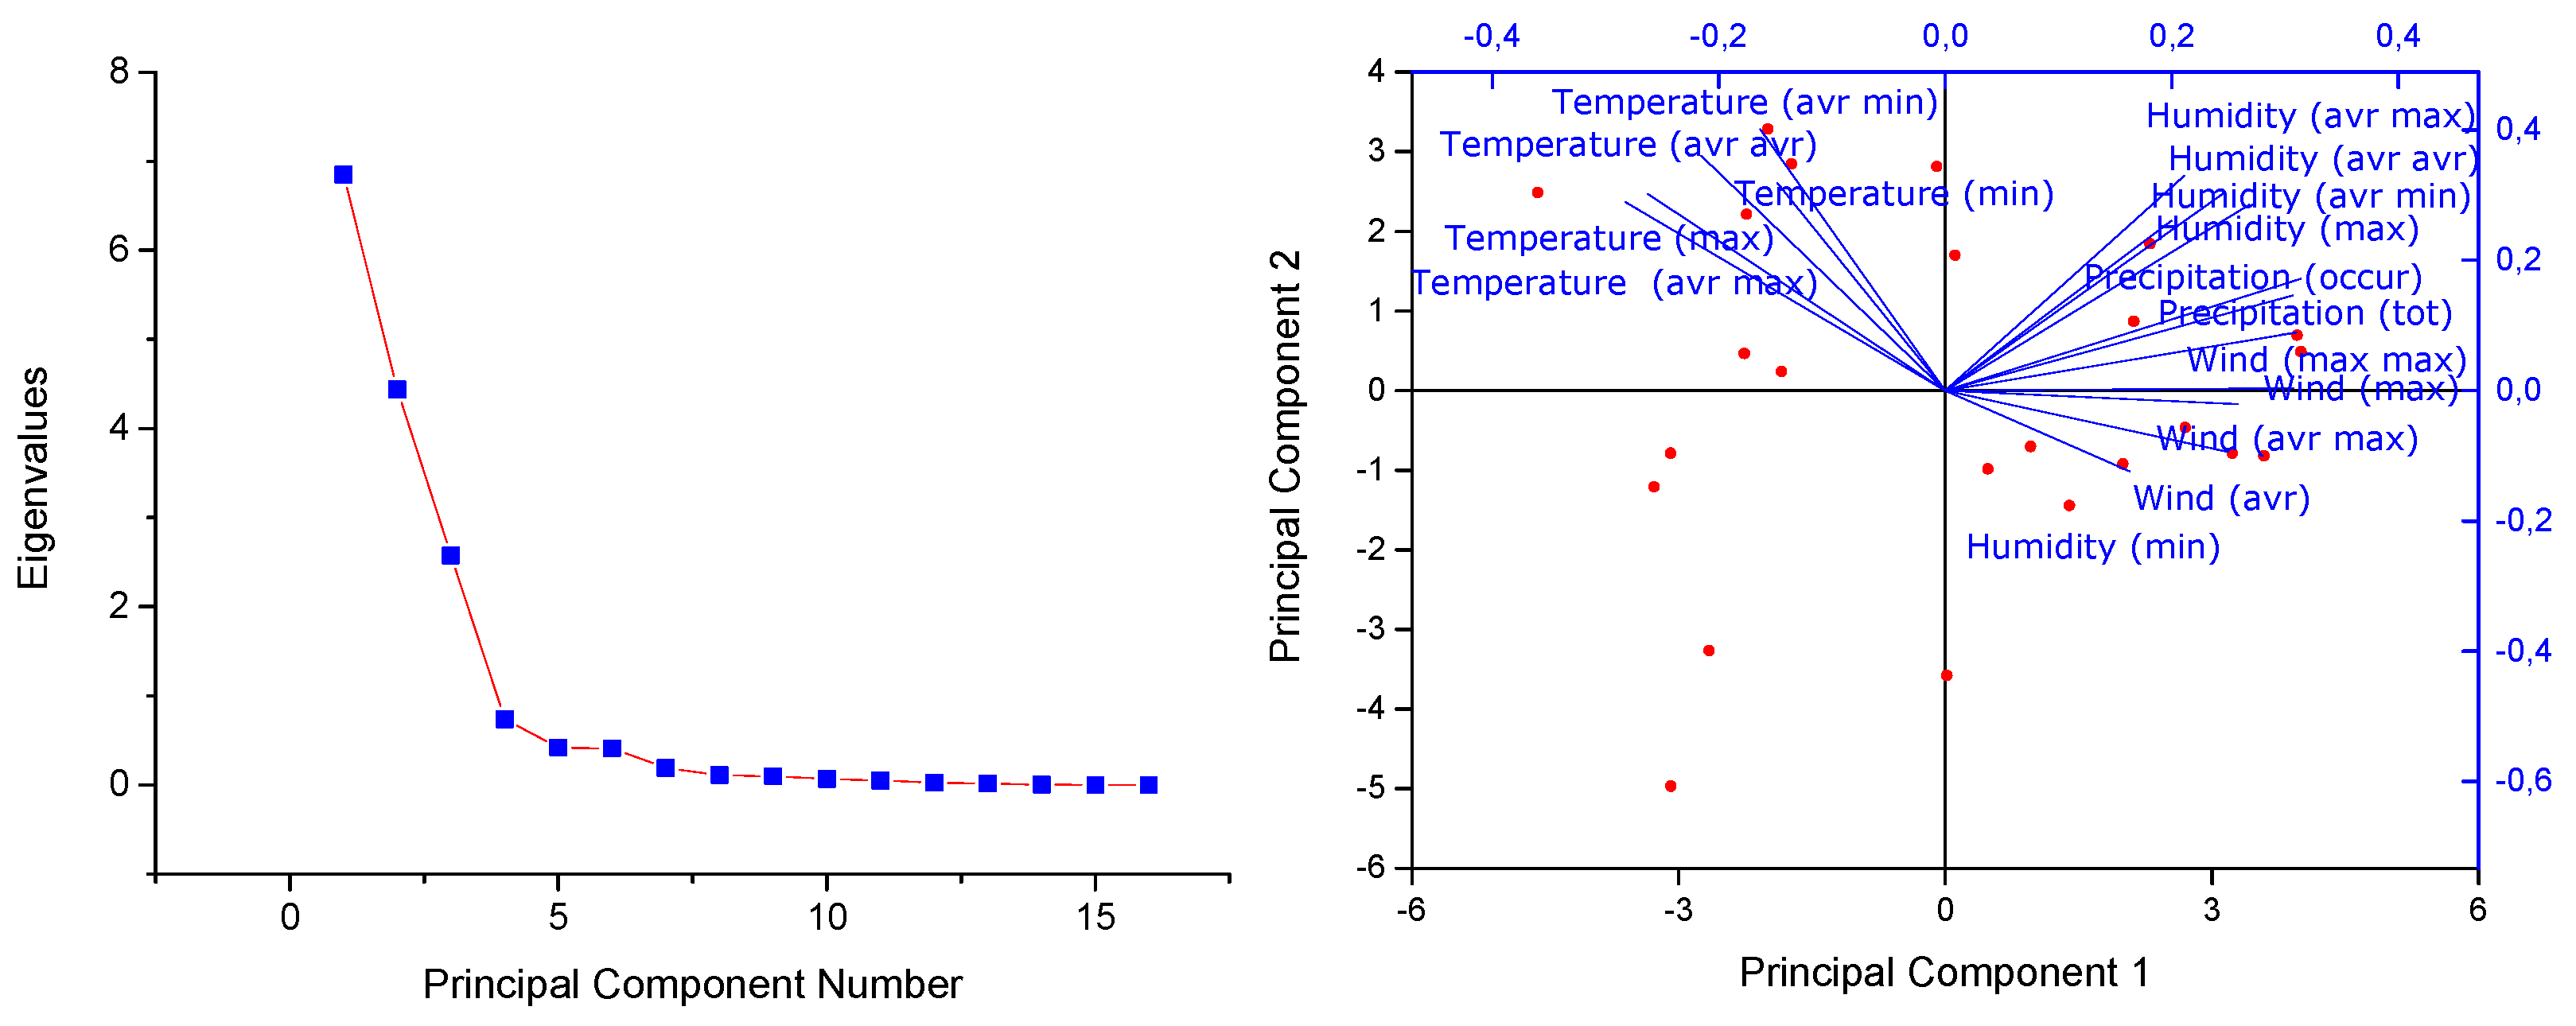
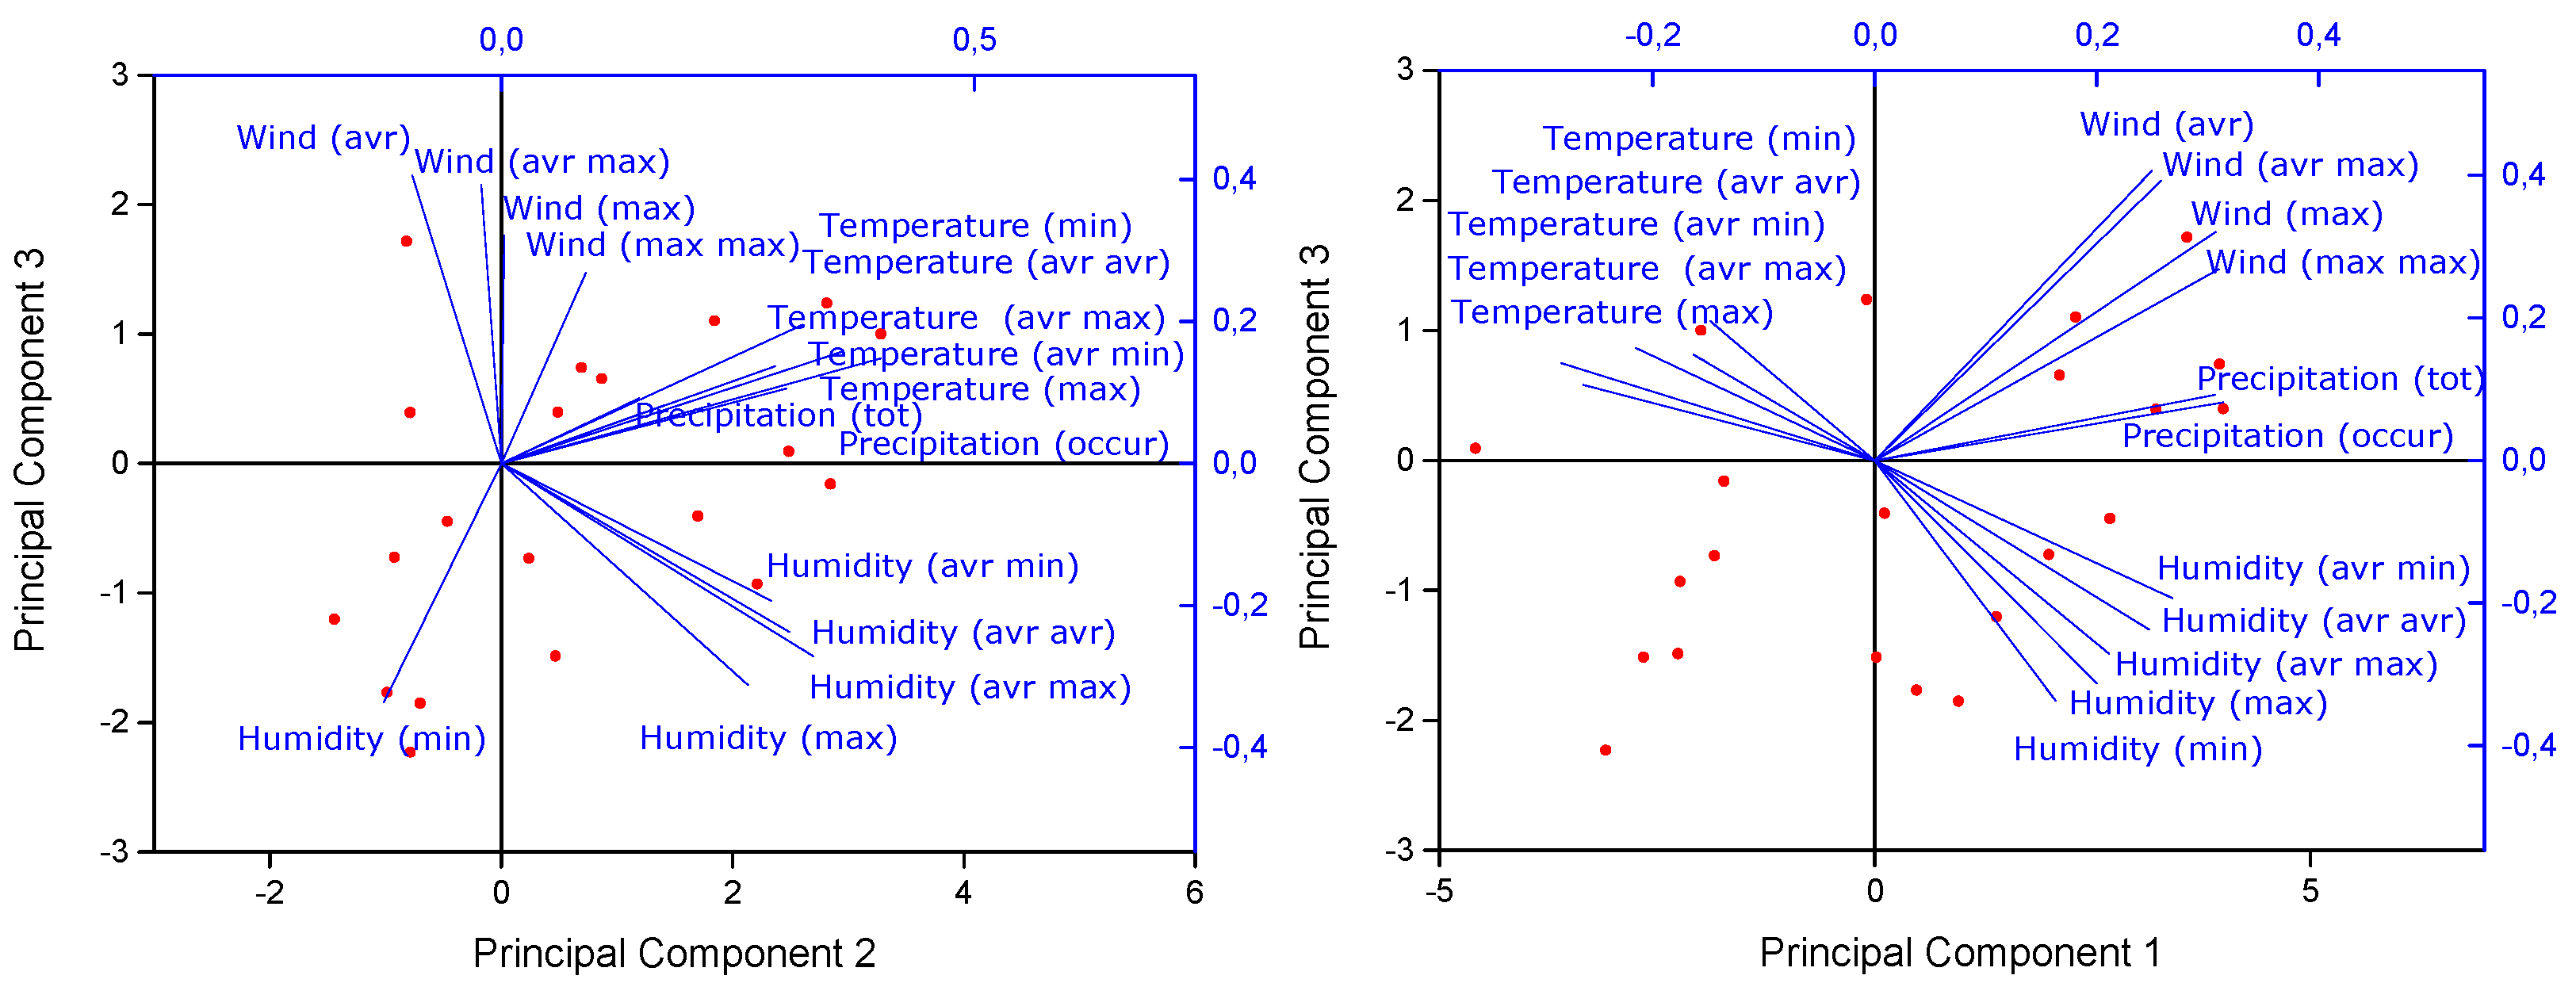

Table 1.
Recovery rates for four plastic polymers during the sample filtration process.
| Polymer | Polymer morphology | Fraction (μm) |
RRs %/washing | Average RRs % | Overall Average RRs % | ||
|---|---|---|---|---|---|---|---|
| 1st | 2nd | 3rd | |||||
| PP | particulate | >125 | 60.0 | 86.7 | 80.0 | 75.6 | 75.9 |
| PE-HD | 90.0 | 70.0 | 70.0 | 76.7 | |||
| ABS | 70.0 | 63.3 | 93.3 | 75.6 | |||
| PES | fibrous | >63 | 52.6 | 25.5 | 26.0 | 34.7 | 26.5 |
| 63-12 | 24.2 | 14.0 | 16.4 | 18.2 | |||
RR – recovery rate; PP – polypropylene; PE-HD – polypropylene high density; ABS – acrylonitrile butadiene styrene; PES – polyester.
Disclaimer/Publisher’s Note: The statements, opinions and data contained in all publications are solely those of the individual author(s) and contributor(s) and not of MDPI and/or the editor(s). MDPI and/or the editor(s) disclaim responsibility for any injury to people or property resulting from any ideas, methods, instructions or products referred to in the content. |
© 2024 by the authors. Licensee MDPI, Basel, Switzerland. This article is an open access article distributed under the terms and conditions of the Creative Commons Attribution (CC BY) license (http://creativecommons.org/licenses/by/4.0/).
Copyright: This open access article is published under a Creative Commons CC BY 4.0 license, which permit the free download, distribution, and reuse, provided that the author and preprint are cited in any reuse.


