Submitted:
10 October 2025
Posted:
11 October 2025
You are already at the latest version
Abstract
The structural integrity of adhesively bonded composites is critically dependent on man-ufacturing process fidelity. While the MGS L418 epoxy system is widely used in aerospace applications, a quantitative hierarchy of its process variables is absent from the literature, leading to reliance on qualitative guidelines and inherent performance variability. This study closes this gap through a comprehensive sensitivity analysis. A 2⁶⁻² fractional facto-rial Design of Experiments (DOE) quantified the effects of six variables on single-lap shear strength. Analysis of Variance (ANOVA) established a definitive hierarchy: induction time was the dominant factor, with a sub-optimal 15-minute period causing a 74% strength reduction (p < 0.000). Surface preparation was the second most significant factor, with mechanical abrasion increasing strength by 17% (p = 0.000). Ambient humidity was a marginal factor (p = 0.013), linked to amine blush formation. The interaction effects were statistically insignificant, simplifying the control strategy. This work provides a validated, quantitative model that defines a robust process window prioritizing induction time and surface preparation to de-risk manufacturing and ensure the reliability of safety-critical bonded structures.
Keywords:
adhesive bonding
; process optimization
; design of experiments
; ANOVA
; epoxy rheology
; amine blush
; aerospace manufacturing
1. Introduction
The adoption of advanced composite materials in aerospace is driven by an uncompromising demand for lightweight and high-performance structures [1,2]. Adhesive bonding is the enabling technology for assembling these components, offering superior stress distribution compared to mechanical fasteners [3,4]. However, the performance of an epoxy adhesive is not an intrinsic property but a process-defined characteristic. The transformation from a liquid mixture to a structural solid is a kinetic process exquisitely sensitive to manufacturing conditions [5]. This sensitivity is a primary source of performance scatter and a critical risk, as sub-critical bond flaws can evade inspection and lead to catastrophic in-service failures [6].
The MGS L418 two-part epoxy system is a benchmark for primary structural bonds. Despite its prevalence, a quantitative model defining the hierarchical influence of its process variables remains a significant knowledge gap. Current guidelines are often qualitative, forcing manufacturers to rely on costly internal validation or overly conservative specifications. This research addresses this deficit by employing a structured Design of Experiments (DOE) framework to develop a statistically-validated, quantitative process model. Our objective is to replace anecdotal understanding with a data-driven hierarchy of control, enabling robust and reliable manufacturing.
2. Literature Review
2.1. Principles of Adhesion
Successful adhesion requires two primary conditions: adequate wetting of the substrate by the adhesive and the subsequent solidification of the adhesive to a state capable of bearing load [1,12]. The quality of the interface between the substrate and the adhesive is therefore paramount. This interface is governed by surface energy and preparation [13,14].
2.2. Surface Preparation
Surface preparation is widely cited as the single most important factor in achieving a durable adhesive bond [15,16]. Its goal is to create a clean, chemically active, and topographically suitable surface [17]. Mechanical methods like grit or sandblasting increase surface roughness, which enhances mechanical interlocking and provides a larger surface area for bonding [18,19].
2.3. Epoxy Cure Chemistry and Influencing Factors
The MGS L418 system cures via a polyaddition reaction between epoxy functional groups (oxirane rings) and amine functional groups in the hardener [8,20].
Amine Blush: In the presence of atmospheric moisture and carbon dioxide, primary amines on the uncured surface can react to form ammonium carbamates [21,22]. This waxy, water-soluble layer, known as amine blush, is physically weak and non-adherent, preventing the formation of a primary adhesive bond and leading to a weak boundary layer and catastrophic interfacial failure [23,24].
Induction Time & Rheology: The period after mixing but before application, or induction time, allows for the initial stages of polymerization. This B-staging builds molecular weight, increasing the viscosity of the system [9]. The rheological state of the adhesive at the moment of application is critical for proper wetting and achieving the desired bond line thickness [25,26].
3. Materials and Methods
3.1. Materials
Substrates were 25.4 mm (1-inch) diameter coupons machined from a 121°C (250°F) cure, 8-ply glass pre-preg laminate. The adhesive system was the Hexion MGS L418 epoxy resin with H418 hardener.
3.2. Design of Experiments
A 16-run with 3 replicates (48 samples), 2⁶⁻² fractional factorial design was used to screen six process variables. The factors and their low (-) and high (+) levels are detailed in Table A1. The full experimental matrix is provided in Appendix A.
3.3. Sample
Preparation and Bonding For the high-level surface preparation, substrates were mechanically abraded using 120-grit aluminum oxide sandblasting at 0.55 MPa (80 psi), followed by a two-wipe cleaning procedure with isopropyl alcohol in a controlled cleanroom environment. For the low-level preparation, only the two-wipe cleaning process was performed.
The adhesive was mixed according to the ratio 100:40 by weight. For mechanical stirring, a planetary mixer was used at 150 RPM. Following mixing, the adhesive was held for the specified induction time in a controlled environment. A consistent bead of adhesive was applied to one substrate, and the joint was assembled with the second substrate to create a single-lap shear specimen with a 12.7 mm (0.5-inch) overlap. Assemblies were cured in a fixture applying uniform pressure of 0.14 MPa (20 psi) in an oven at 80°C (176°F) for 4 hours, as per manufacturer recommendations for elevated temperature cure.
3.4. Mechanical Testing
Tensile lap shear tests were conducted on a calibrated 10kN universal testing machine in accordance with ASTM D1002. A constant crosshead displacement rate of 1.3 mm/min was applied until joint failure. The ultimate tensile load (in pounds) was recorded as the primary response. (Figure 5)
3.5. Statistical Analysis
The experimental data was analyzed using Analysis of Variance (ANOVA) with a significance level (α) of 0.010 to determine the statistical significance of main effects and two-factor interactions.
4. Results
The ultimate tensile load for each of the 48 experimental runs was recorded (Appendix A) and analyzed. The ANOVA (Table 2) identified three factors with statistically significant or near-significant effects on bond strength. A model F-value of 601.99 with p < 0.000 indicates that the model is highly significant.
Factor B (Induction Time) exhibited the largest effect, with an F-value of 8813.69 (p < 0.000). Factor A (Surface Preparation) was the second most significant effect, with an F-value of 140.02 (p = 0.000). Factor C (Humidity) was marginally significant, with an F-value of 6.91 (p = 0.013). All other factors were statistically insignificant (p > 0.10).
Among the various factors analyzed, the Pareto Chart (Figure 1) clearly illustrates the hierarchy of significance. Notably, the standardized effects of Induction Time and Surface Preparation exceed the critical t-value threshold of 2.04 (at α = 0.05), confirming their statistically significant impact on the response variable. The Main Effects Plot (Figure 2) illustrates the magnitude and direction of each factor's influence. Moving from the low to high level of Induction Time produced the largest positive change in mean strength, while the same change for Surface Preparation produced the second-largest positive change. Conversely, increasing Humidity resulted in a negative change in mean strength.
5. Discussion
The results of this study provide a clear, quantitative framework for controlling the MGS L418 bonding process. The statistical hierarchy Induction Time > Surface Preparation > Humidity aligns with the fundamental chemical and physical principles of adhesion but, critically, provides the quantitative data necessary for robust industrial process design.
5.1. Dominant Effect of Induction Time on Rheology
The unequivocal dominance of induction time confirms that the rheological state of the adhesive at application is the paramount process parameter. The catastrophic 74% strength loss at the 15-minute level is a classic symptom of rheological failure (Figure 6). At this short time, the epoxy-amine polyaddition reaction has not progressed sufficiently to build molecular weight. The resulting low-viscosity adhesive is susceptible to being squeezed out of the bond line under clamping pressure, leading to starved or underfilled joints incapable of effective stress transfer. Furthermore, a less-advanced polymer network has lower intrinsic cohesive strength upon cure. The optimal 85-minute induction time allows the system to reach a more viscous, gel-like state that resists flow-out and ensures a consistent bond line thickness.
5.2. Critical Role of Surface Energetics and Mechanics
The 17% strength increase from mechanical abrasion underscores the non-negotiable role of surface preparation. The solvent wipe-only surface, while clean, is a low-energy, smooth substrate. The sandblasting process increases both the surface free energy and the microscopic surface area. This enhances mechanical interlocking, a key mechanism for adhesion to composite substrates, and provides a more favorable surface for adhesive wetting. The observed shift in failure modes from interfacial (for solvent-wiped surfaces) to cohesive (for abraded surfaces) is direct evidence that surface preparation successfully created a bond interface stronger than the adhesive itself.
5.3. Humidity as a Latent Defect Source
While only marginally significant in the statistical model, the practical importance of humidity control cannot be overstated. Its p-value of 0.013 indicates a real, though less dominant, effect. This aligns perfectly with the chemical mechanism of amine blush, which acts as a latent defect. (Figure 7) Visual observation of a waxy film on failed specimens from high-humidity runs confirms the formation of this weak boundary layer but occurs when induction time is low. (Figure 8) While its effect might be masked by a more dominant failure mode (like poor rheology), it remains a critical source of inconsistency and must be controlled to ensure high-quality bonds.
5.4. Implications for Process Control
The statistical insignificance of two-factor interactions (Figure 3) is a powerful outcome for industrial application. It implies that the process can be optimized by controlling each significant factor independently, without needing to account for complex coupled effects. The robustness of the adhesive to minor variations in temperature, mix ratio, and stirring method simplifies the process by allowing control efforts to be focused where they matter most.
6. Conclusions
This study successfully transitions the understanding of the MGS L418 bonding process from qualitative guidelines to a quantitative, data-driven framework. The results provide a statistically validated hierarchy for manufacturing control:
- Primary Control: Induction Time must be rigorously controlled to the optimal window (~85 minutes or higher) to allow for proper rheological development and prevent catastrophic strength loss. (Figure 4)
- Secondary Control: Surface Preparation via mechanical abrasion is essential to activate the substrate and enable mechanical interlocking, providing a significant and consistent strength benefit.
- Tertiary Control: Ambient Humidity should be maintained below critical levels (<70% RH) to prevent the formation of amine blush and ensure consistent interfacial quality.
By focusing control efforts on this hierarchy, manufacturers can define a robust process window that minimizes variability and de-risks the production of safety-critical composite assemblies. The presented model offers a clear, actionable path to enhanced joint reliability and structural integrity.
Appendix A. Design of Experiments Matrix and Results

Table A1.
DOE levels, factors and results
| X:Input | Y:Output | ||||||
|---|---|---|---|---|---|---|---|
| Run Order | Surface prep | Induction Time | Humidity | Stirring | Temp | Mix ratio | Strength |
| 1 | -1 | -1 | -1 | -1 | -1 | -1 | 370 |
| 2 | 1 | -1 | -1 | -1 | 1 | -1 | 383 |
| 3 | -1 | 1 | -1 | -1 | 1 | 1 | 1238 |
| 4 | 1 | 1 | -1 | -1 | -1 | 1 | 1415 |
| 5 | -1 | -1 | 1 | -1 | 1 | 1 | 307 |
| 6 | 1 | -1 | 1 | -1 | -1 | 1 | 376 |
| 7 | -1 | 1 | 1 | -1 | -1 | -1 | 1158 |
| 8 | 1 | 1 | 1 | -1 | 1 | -1 | 1315 |
| 9 | -1 | -1 | -1 | 1 | -1 | 1 | 279 |
| 10 | 1 | -1 | -1 | 1 | 1 | 1 | 352 |
| 11 | -1 | 1 | -1 | 1 | 1 | -1 | 1248 |
| 12 | 1 | 1 | -1 | 1 | -1 | -1 | 1360 |
| 13 | -1 | -1 | 1 | 1 | 1 | -1 | 245 |
| 14 | 1 | -1 | 1 | 1 | -1 | -1 | 330 |
| 15 | -1 | 1 | 1 | 1 | -1 | 1 | 1212 |
| 16 | 1 | 1 | 1 | 1 | 1 | 1 | 1365 |
| 17 | -1 | -1 | -1 | -1 | -1 | -1 | 347 |
| 18 | 1 | -1 | -1 | -1 | 1 | -1 | 430 |
| 19 | -1 | 1 | -1 | -1 | 1 | 1 | 1287 |
| 20 | 1 | 1 | -1 | -1 | -1 | 1 | 1475 |
| 21 | -1 | -1 | 1 | -1 | 1 | 1 | 306 |
| 22 | 1 | -1 | 1 | -1 | -1 | 1 | 387 |
| 23 | -1 | 1 | 1 | -1 | -1 | -1 | 1078 |
| 24 | 1 | 1 | 1 | -1 | 1 | -1 | 1421 |
| 25 | -1 | -1 | -1 | 1 | -1 | 1 | 310 |
| 26 | 1 | -1 | -1 | 1 | 1 | 1 | 369 |
| 27 | -1 | 1 | -1 | 1 | 1 | -1 | 1190 |
| 28 | 1 | 1 | -1 | 1 | -1 | -1 | 1387 |
| 29 | -1 | -1 | 1 | 1 | 1 | -1 | 309 |
| 30 | 1 | -1 | 1 | 1 | -1 | -1 | 372 |
| 31 | -1 | 1 | 1 | 1 | -1 | 1 | 1194 |
| 32 | 1 | 1 | 1 | 1 | 1 | 1 | 1430 |
| 33 | -1 | -1 | -1 | -1 | -1 | -1 | 356 |
| 34 | 1 | -1 | -1 | -1 | 1 | -1 | 355 |
| 35 | -1 | 1 | -1 | -1 | 1 | 1 | 1239 |
| 36 | 1 | 1 | -1 | -1 | -1 | 1 | 1397 |
| 37 | -1 | -1 | 1 | -1 | 1 | 1 | 296 |
| 38 | 1 | -1 | 1 | -1 | -1 | 1 | 347 |
| 39 | -1 | 1 | 1 | -1 | -1 | -1 | 1168 |
| 40 | 1 | 1 | 1 | -1 | 1 | -1 | 1453 |
| 41 | -1 | -1 | -1 | 1 | -1 | 1 | 297 |
| 42 | 1 | -1 | -1 | 1 | 1 | 1 | 371 |
| 43 | -1 | 1 | -1 | 1 | 1 | -1 | 1200 |
| 44 | 1 | 1 | -1 | 1 | -1 | -1 | 1383 |
| 45 | -1 | -1 | 1 | 1 | 1 | -1 | 340 |
| 46 | 1 | -1 | 1 | 1 | -1 | -1 | 325 |
| 47 | -1 | 1 | 1 | 1 | -1 | 1 | 1284 |
| 48 | 1 | 1 | 1 | 1 | 1 | 1 | 1373 |
Table A2.
Analysis of Variance (ANOVA) for Bond Strength.
| Source | DF | Adj SS | Adj MS | F-Value | P-Value |
| Model | 15 | 11400417 | 760028 | 601.99 | 0 |
| Linear | 6 | 11319980 | 1886663 | 1494.36 | 0 |
| Surface prep | 1 | 176783 | 176783 | 140.02 | 0 |
| Induction Time | 1 | 11127465 | 11127465 | 8813.69 | 0 |
| Humidity | 1 | 8721 | 8721 | 6.91 | 0.013 |
| Stirring | 1 | 2993 | 2993 | 2.37 | 0.133 |
| Temp | 1 | 963 | 963 | 0.76 | 0.389 |
| Mix ratio | 1 | 3056 | 3056 | 2.42 | 0.13 |
| 2-Way Interactions | 7 | 73100 | 10443 | 8.27 | 0 |
| Surface prep*Induction Time | 1 | 56239 | 56239 | 44.54 | 0 |
| Surface prep*Humidity | 1 | 1645 | 1645 | 1.3 | 0.262 |
| Surface prep*Stirring | 1 | 1813 | 1813 | 1.44 | 0.24 |
| Surface prep*Temp | 1 | 165 | 165 | 0.13 | 0.72 |
| Surface prep*Mix ratio | 1 | 196 | 196 | 0.16 | 0.696 |
| Induction Time*Stirring | 1 | 2451 | 2451 | 1.94 | 0.173 |
| Induction Time*Mix ratio | 1 | 10591 | 10591 | 8.39 | 0.007 |
| 3-Way Interactions | 2 | 7337 | 3669 | 2.91 | 0.069 |
| Surface prep*Induction Time*Stirring | 1 | 3024 | 3024 | 2.4 | 0.132 |
| Surface prep*Induction Time*Mix ratio | 1 | 4313 | 4313 | 3.42 | 0.074 |
| Error | 32 | 40401 | 1263 | ||
| Total | 47 | 11440818 |
Appendix B
Figure A1.
Pareto Chart of the Standardized Effects. The chart confirms that only Induction Time (B) and Surface Preparation (A) exceed the statistical significance threshold (α=0.01, dashed line).
Figure A1.
Pareto Chart of the Standardized Effects. The chart confirms that only Induction Time (B) and Surface Preparation (A) exceed the statistical significance threshold (α=0.01, dashed line).
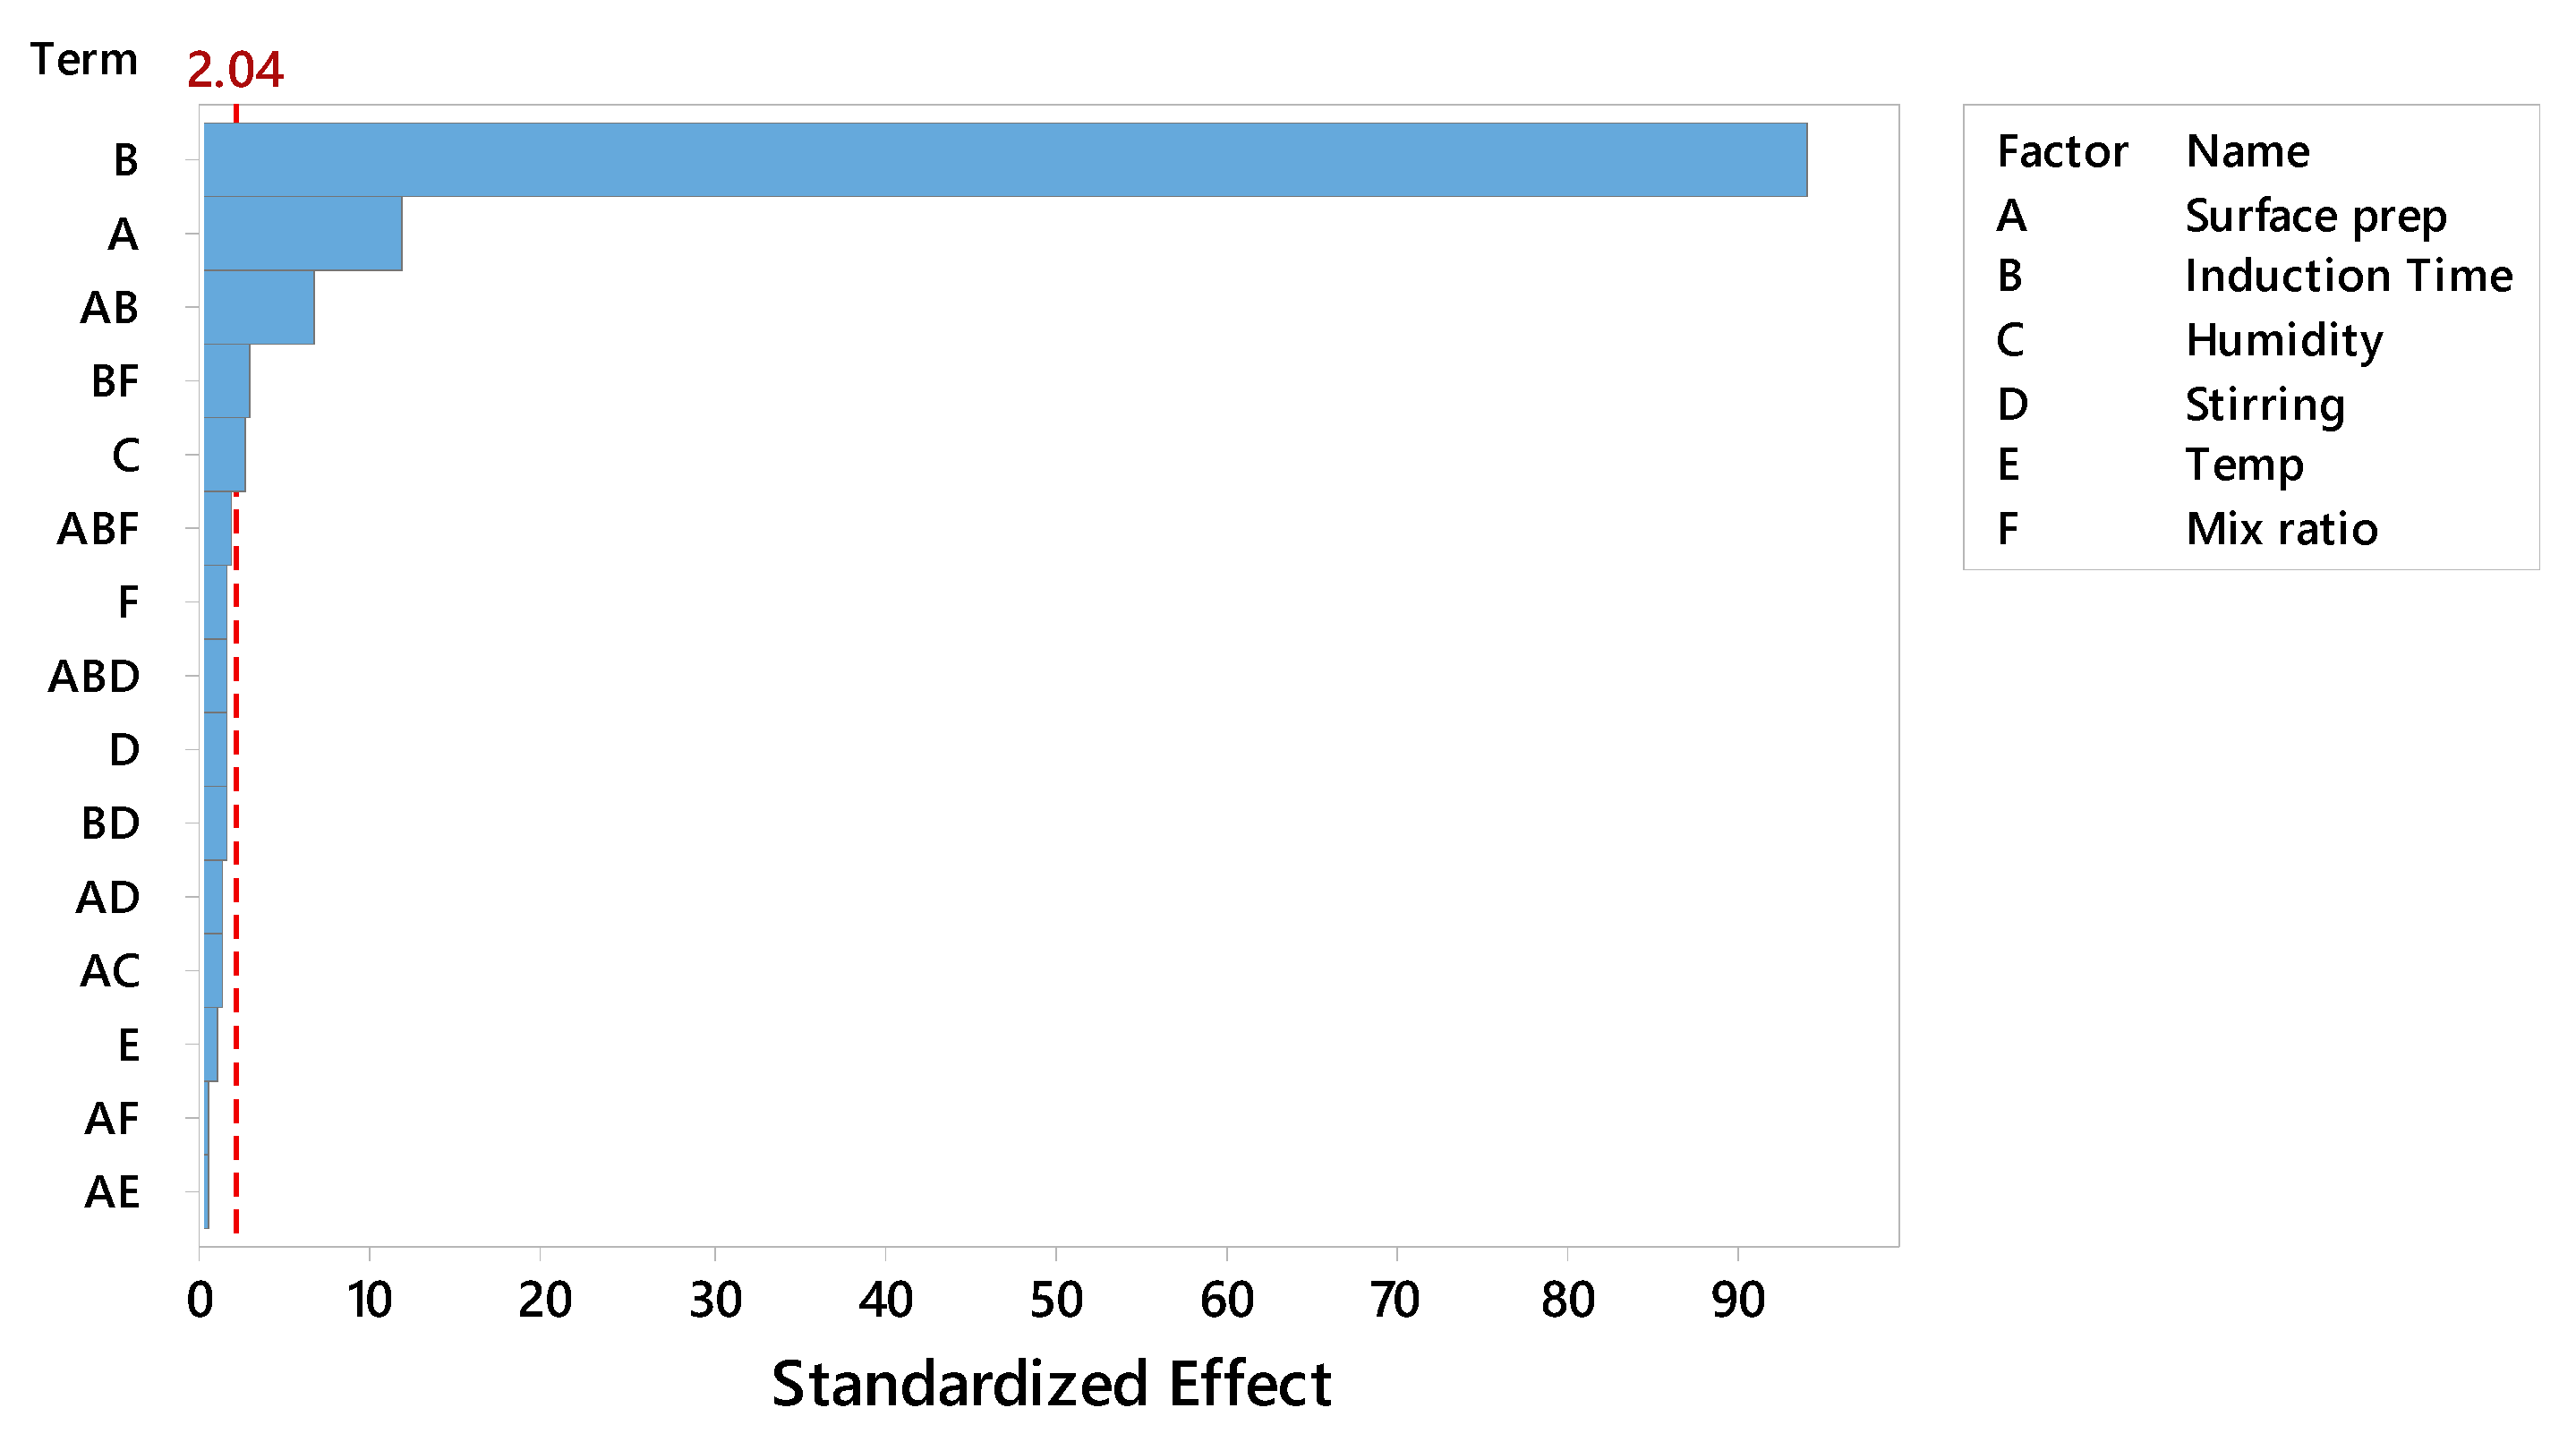
Figure A2.
Main Effects Plot for Bond Strength.
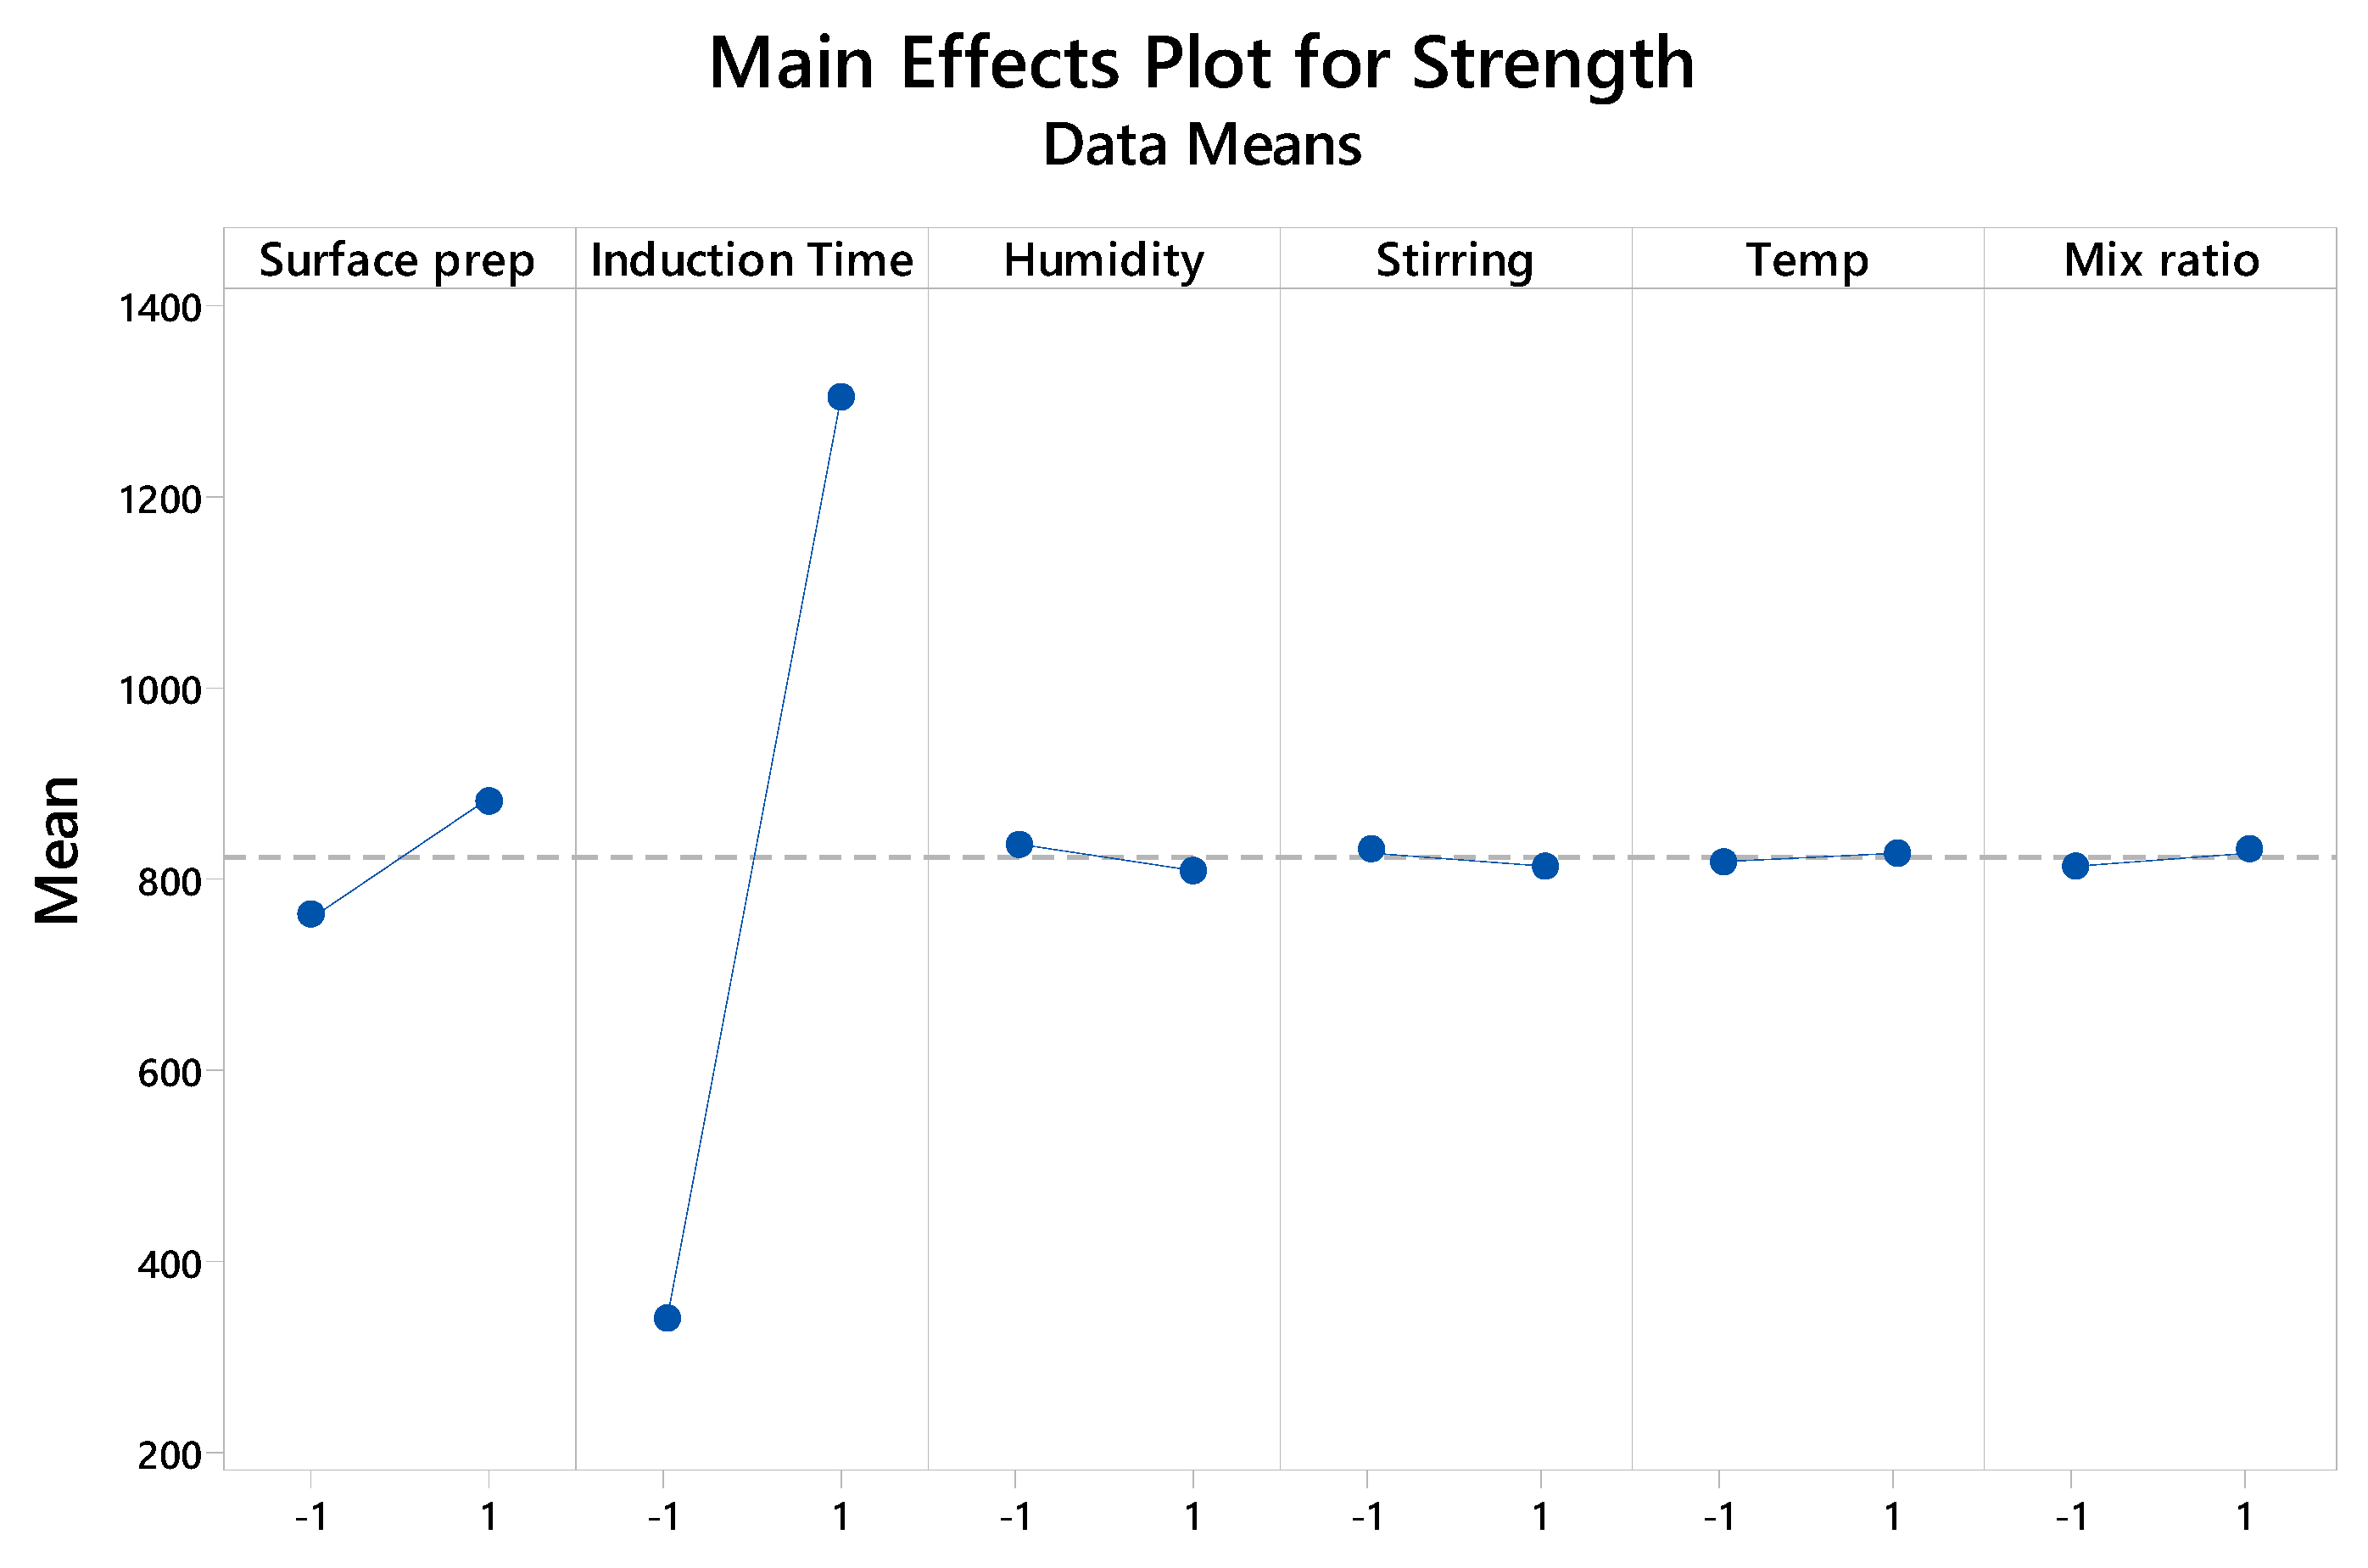
Figure A3.
Interaction Plot for Induction Time and Surface Preparation. The near-parallel lines indicate a lack of significant two-factor interactions between the most dominant variables.
Figure A3.
Interaction Plot for Induction Time and Surface Preparation. The near-parallel lines indicate a lack of significant two-factor interactions between the most dominant variables.
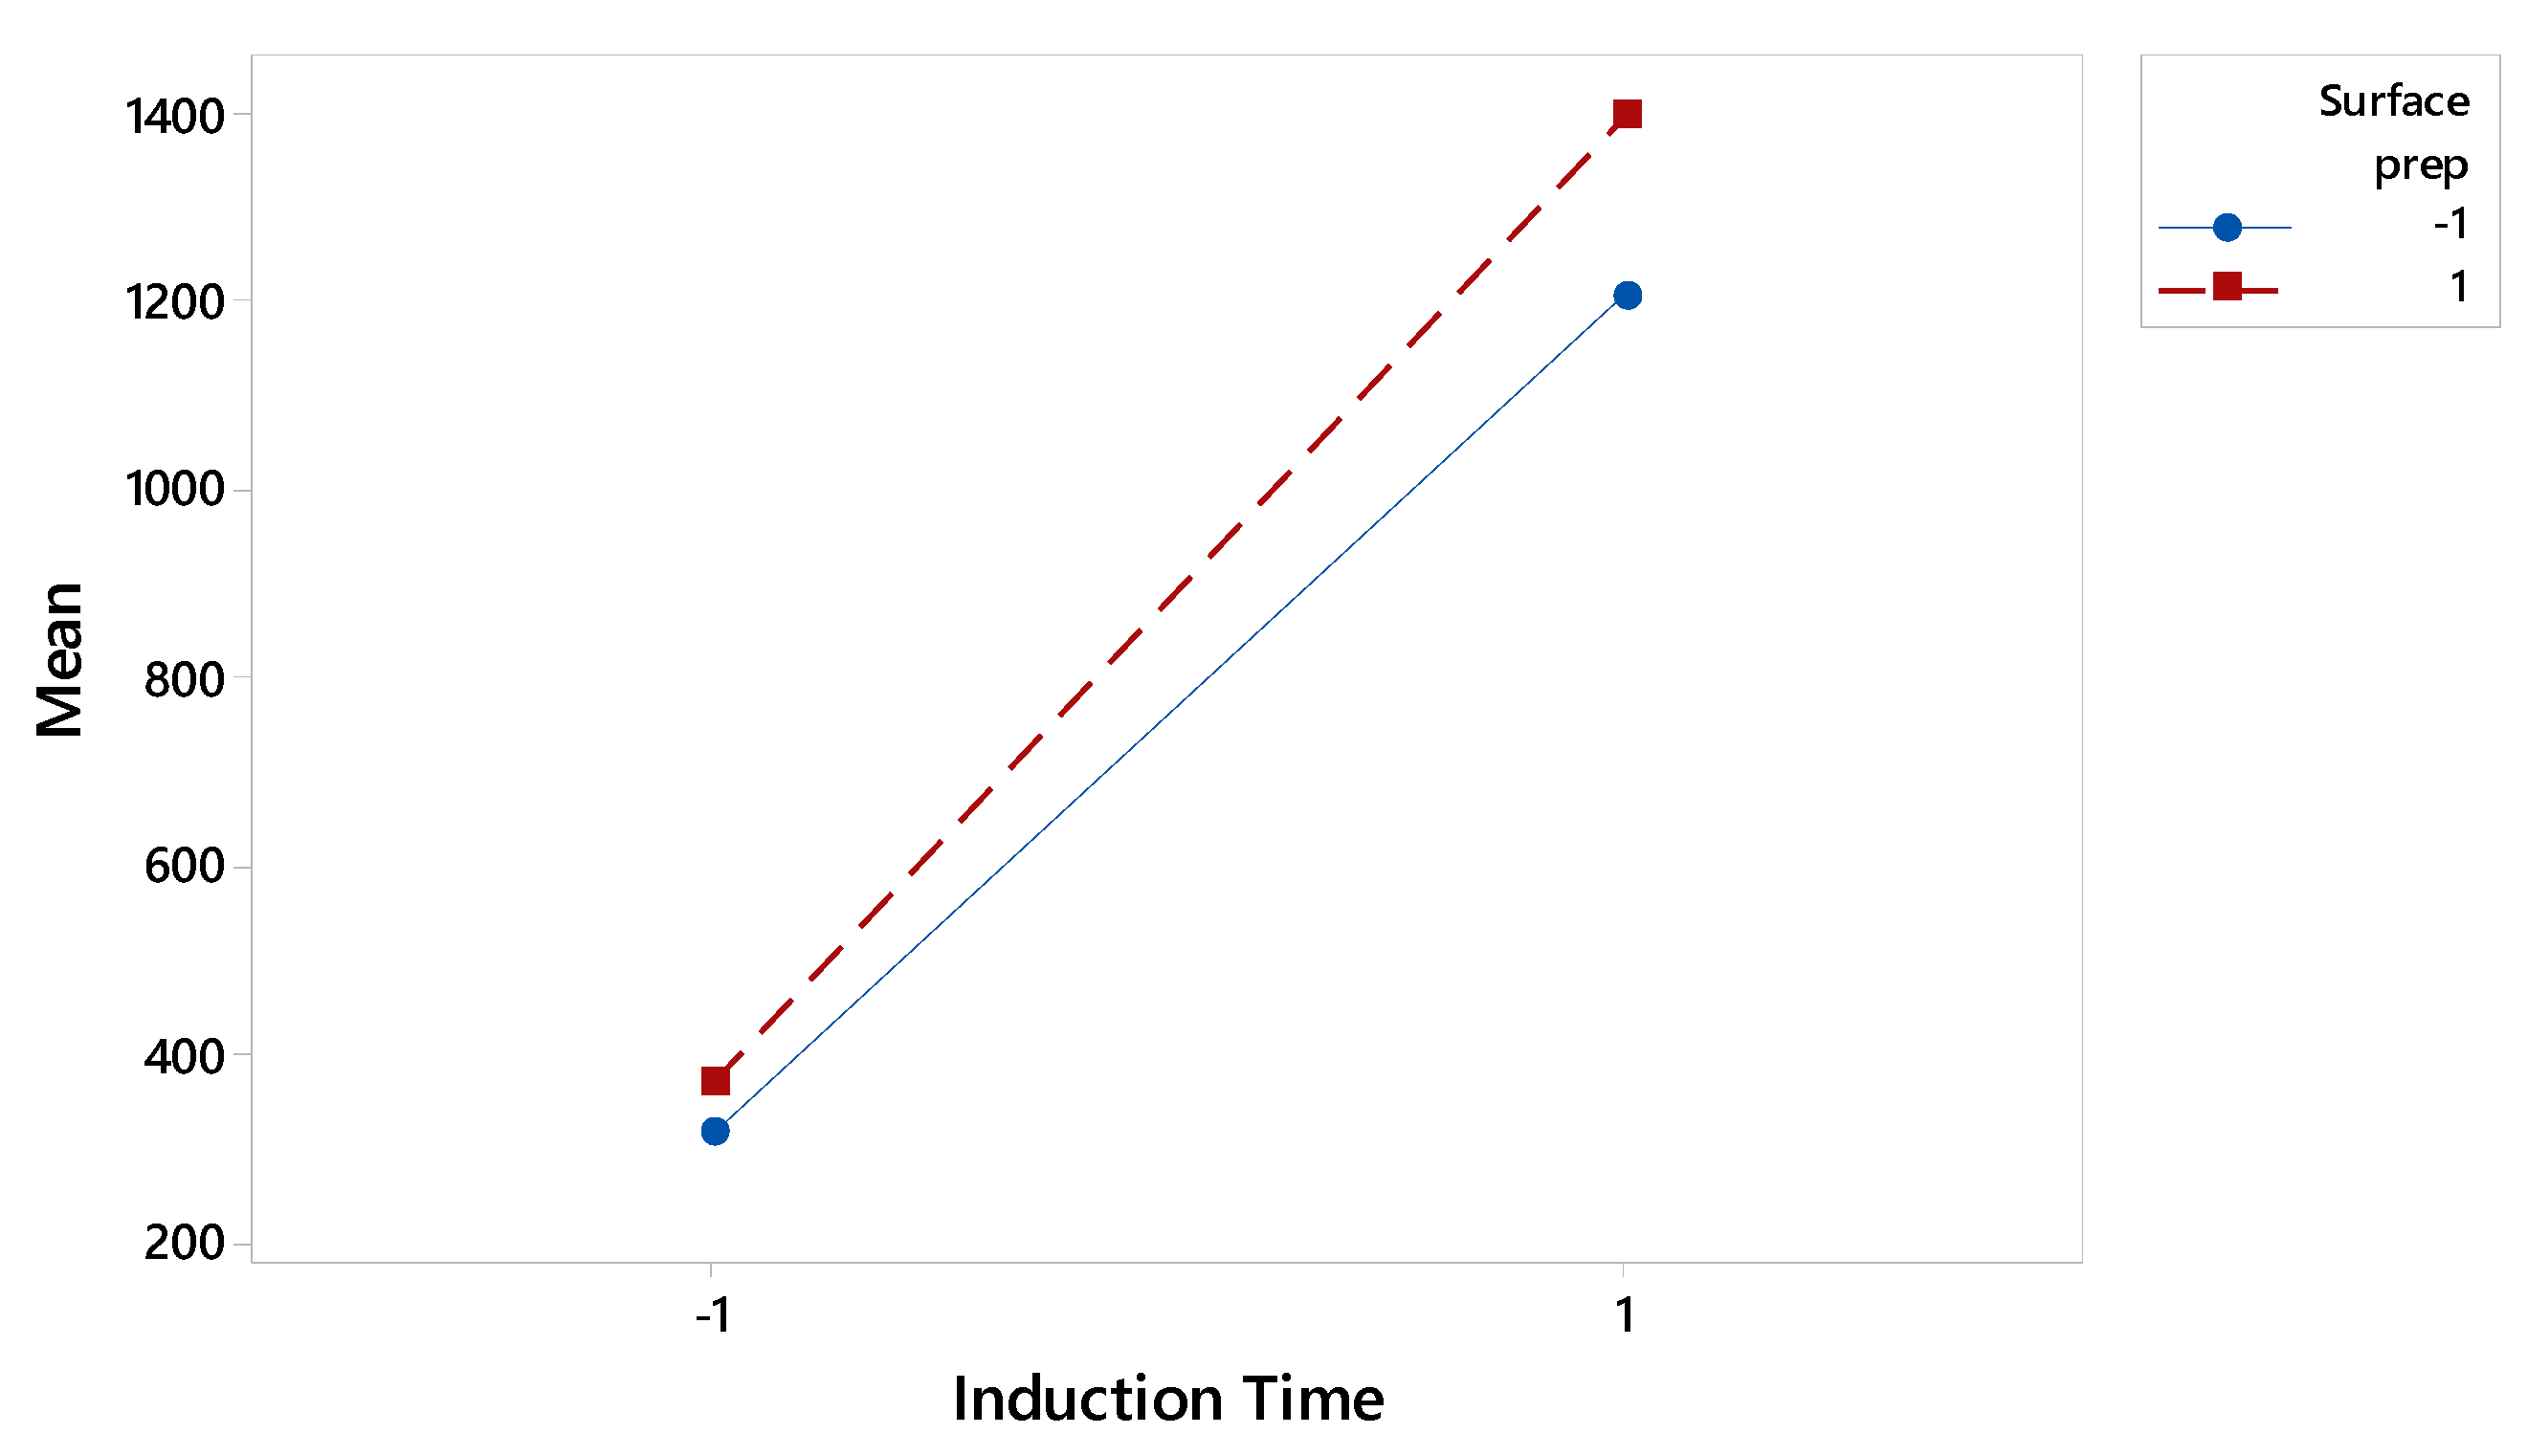
Figure A4.
Boxplot for main Factor at different levels. Presents a screening analysis of various induction times using a boxplot. The results indicate that mechanical strength improves progressively with longer induction times, reaching an optimal range beyond 85 minutes. This suggests that extending induction time beyond this threshold yields diminishing variability and maximized performance in mechanical strength.
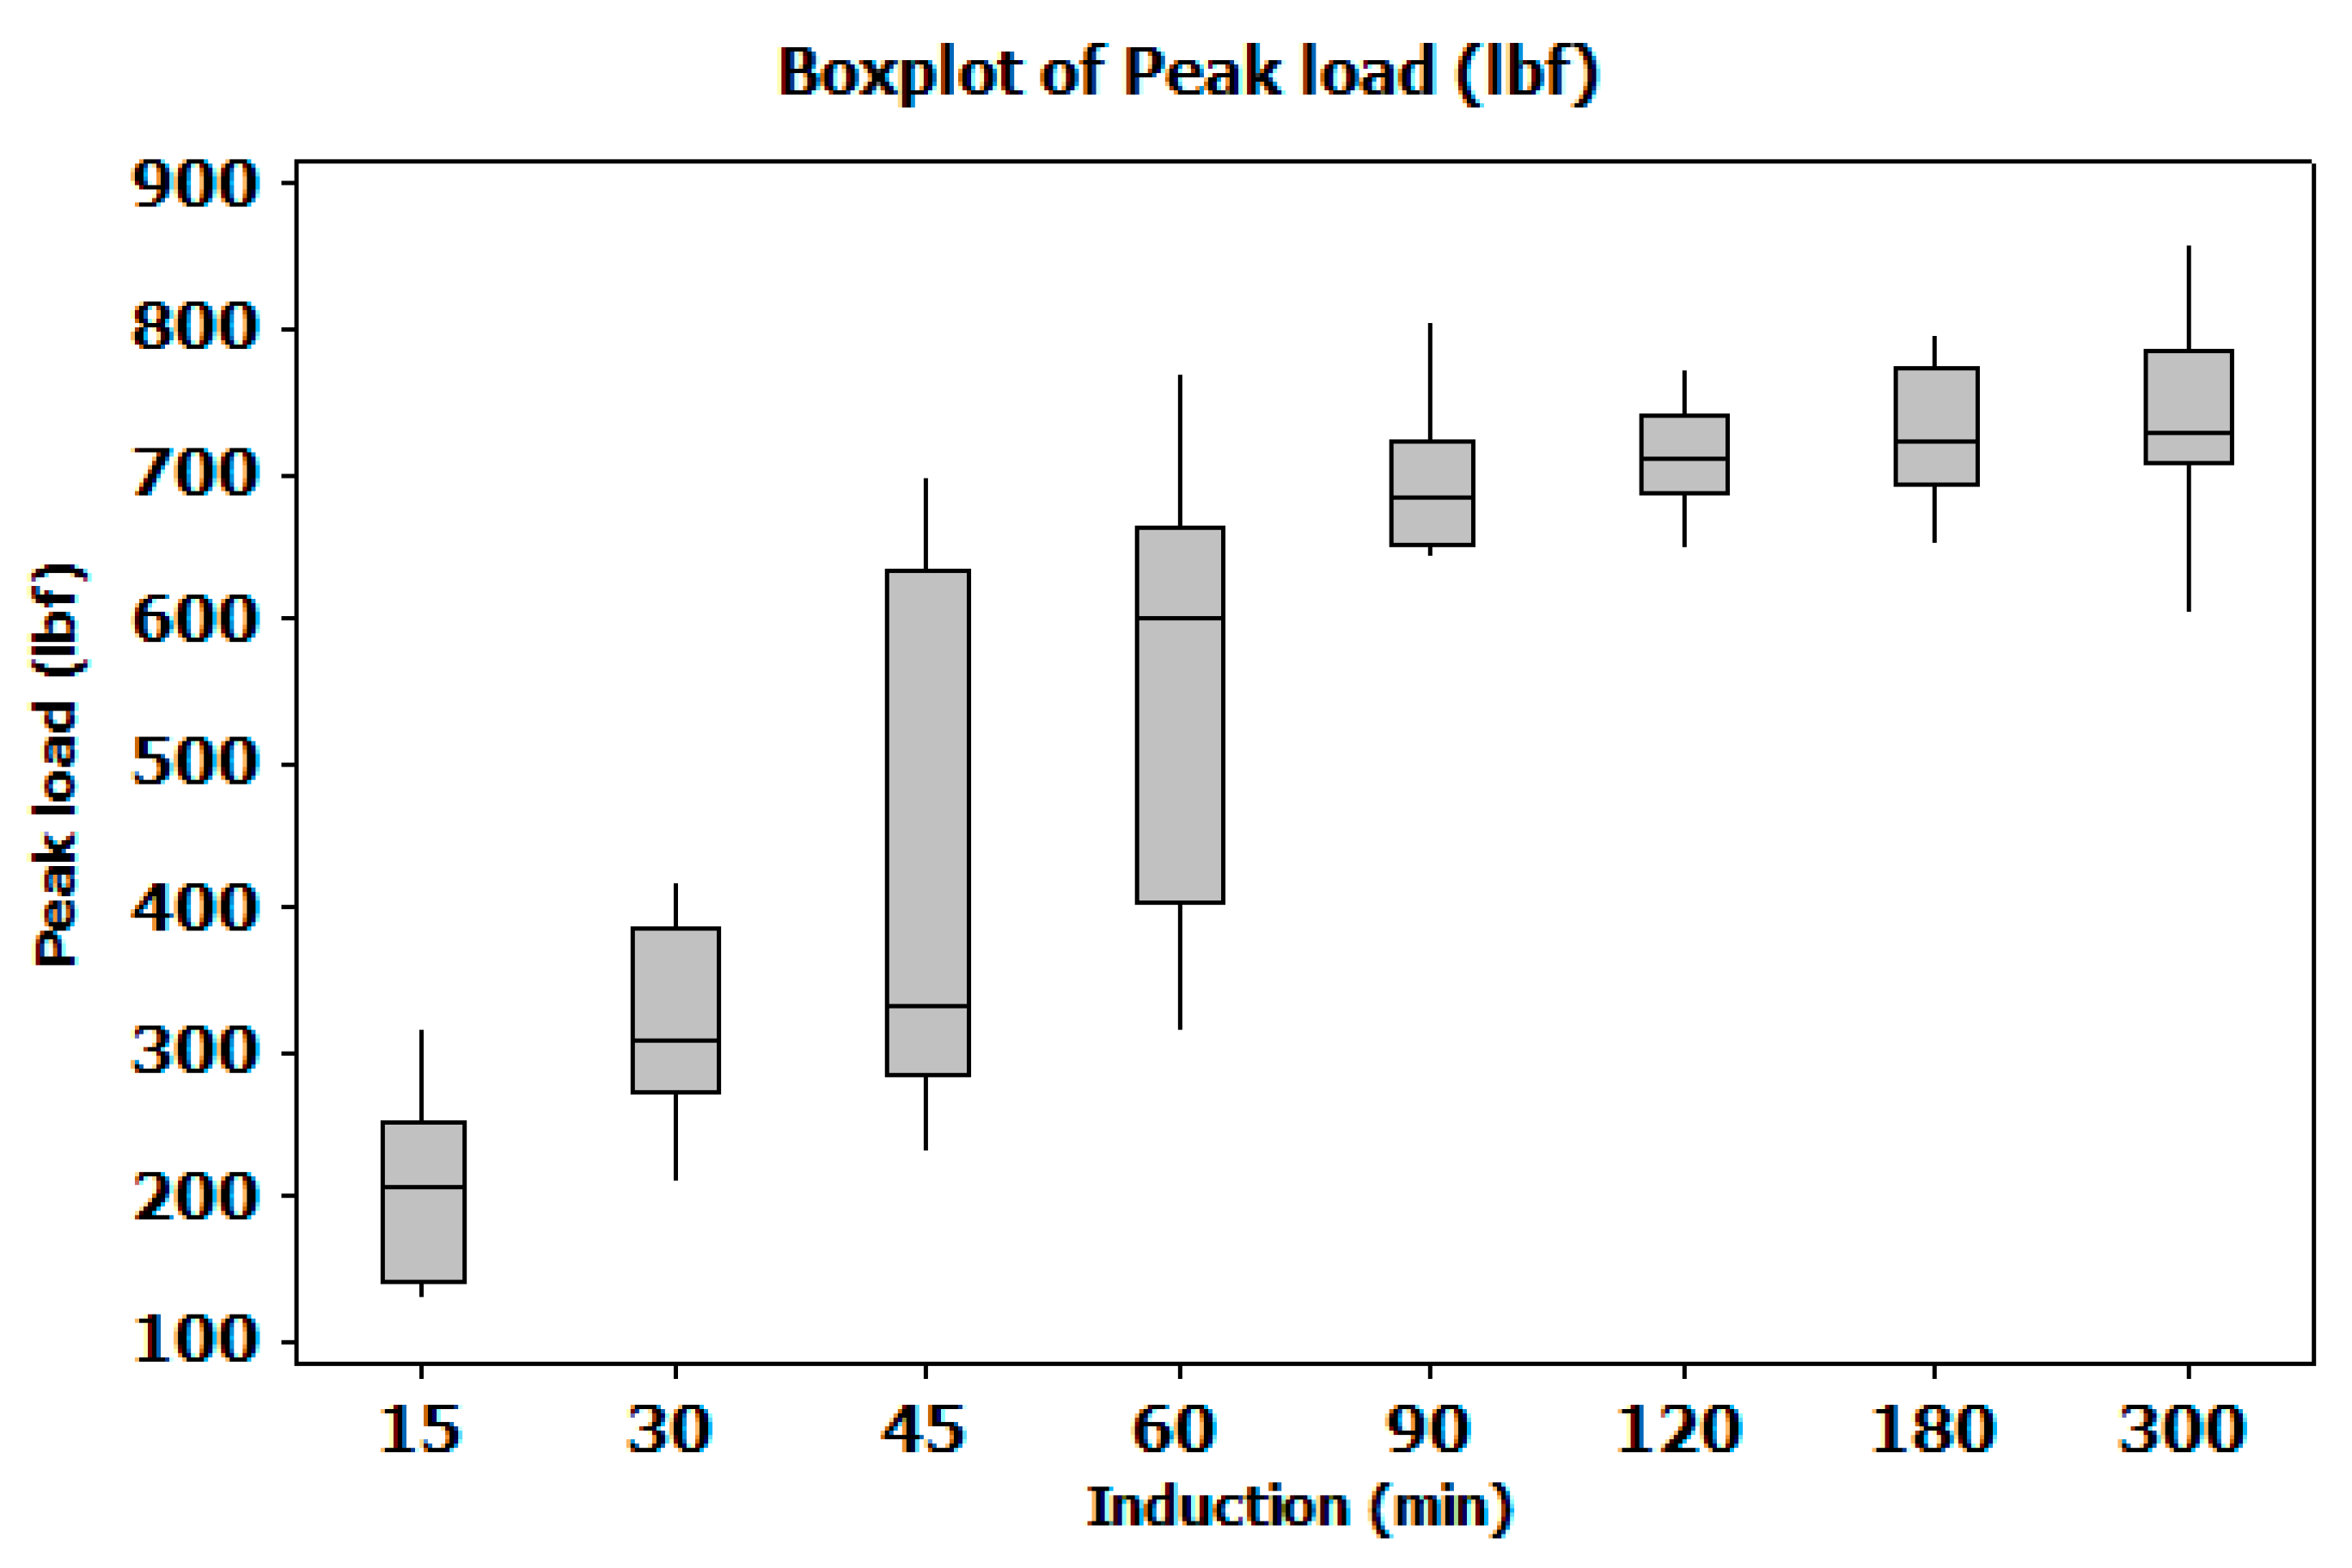
Figure 5.
Retention test with substrates specified in materials and method section.

Figure 6.
Influence of induction time: (a) Substrates with low induction time exhibit amine blush due to early exposure of reactive amines to ambient moisture and CO₂, leading to surface contamination and reduced crosslinking. This results in poor interfacial bonding and low force retention. (b) Substrates with mid to high induction time show improved adhesive performance, as the extended pre-reaction period promotes better molecular interaction and crosslink density, yielding significantly higher force retention.

Figure 7.
Amine Blush detected in FTIR for samples with low induction time and 90% humidity. Amine Blush is present in the material when the peak in the wave number (1/lambda) 1582 cm-1 is higher than the third of the pick in the wave number 1609cm-1.
Figure 7.
Amine Blush detected in FTIR for samples with low induction time and 90% humidity. Amine Blush is present in the material when the peak in the wave number (1/lambda) 1582 cm-1 is higher than the third of the pick in the wave number 1609cm-1.

Figure 8.
Amine Blush not detected in FTRIR for samples with high induction time at 90% humidity. Amine Blush is not present in the material when Induction Time is higher than 45 minutes.
Figure 8.
Amine Blush not detected in FTRIR for samples with high induction time at 90% humidity. Amine Blush is not present in the material when Induction Time is higher than 45 minutes.

References
- Kinloch, A. J. (1987). Adhesion and Adhesives: Science and Technology. Chapman and Hall.
- Mouritz, A. P. (2012). Introduction to Aerospace Materials. Woodhead Publishing.
- da Silva, L. F. M. , Öchsner, A., & Adams, R. D. (Eds.). (2011). Handbook of Adhesion Technology. Springer.
- Banea, M. D. , & da Silva, L. F. M. (2009). Adhesively bonded joints in composite materials: An overview. Journal of Materials: Design and Applications, 223(1), 1-18.
- Petrie, E. M. (2006). Epoxy Adhesive Formulations. McGraw-Hill.
- Adams, R. D. (2005). Adhesive Bonding: Science, Technology and Applications. Woodhead Publishing.
- Comyn, J. (1997). Adhesion Science. Royal Society of Chemistry.
- Pascault, J. P. , Sautereau, H., Verdu, J., & Williams, R. J. (2002). Thermosetting Polymers. Marcel Dekker.
- Ellis, B. (Ed.). (1993). Chemistry and Technology of Epoxy Resins. Springer Netherlands.
- May, C. A. (Ed.). (1988). Epoxy Resins: Chemistry and Technology (2nd ed.). Marcel Dekker.
- Hart-Smith, L. J. (1985). The design of adhesively bonded joints. In Developments in Adhesives (Vol. 2, pp. 1-43). Applied Science Publishers.
- Packham, D. E. (2005). Handbook of Adhesion (2nd ed.). John Wiley & Sons.
- Wu, S. (1982). Polymer Interface and Adhesion. Marcel Dekker.
- Mittal, K. L. (Ed.). (2006). Surface Contamination and Cleaning. CRC Press.
- Critchlow, G. W., & Brewis, D. M. (1996). Review of surface pretreatments for structural adhesion. International Journal of Adhesion and Adhesives, 16(4), 255-275.
- Wegman, R. F. , & Van Twisk, J. (2013). Surface Preparation Techniques for Adhesive Bonding. William Andrew.
- Ebnesajjad, S. (2014). Handbook of Adhesives and Surface Preparation. William Andrew.
- Williams, G. P. , & Pocius, A. V. (2012). The effects of surface roughness on adhesion. In Adhesion Science and Engineering (Vol. 1, pp. 415-455). Elsevier.
- Costa, M. , & Viana, J. C. (2016). The effect of grit blasting on the surface properties and adhesion of composite laminates. Composites Part B: Engineering, 91, 14-22.
- Dušek, K. (1986). Network formation in curing of epoxy resins. Advances in Polymer Science, 78, 1-59.
- Schuft, C. (1998). Amine Blush: What it is and how to avoid it. Epoxyworks, (12), 1-3.
- De la Fuente, J. L. , & Madaleno, E. (2006). The effect of amine blushing on the physical and mechanical properties of a DGEBA/polyetheramine system. Journal of Applied Polymer Science, 102(5), 4163-4172.
- Bell, J. P. , & Yuhasz, M. A. (1989). The effect of amine blush on the performance of epoxy adhesives. Journal of Adhesion, 28(2-3), 85-99.
- Smith, L. V., & Davis, C. R. (2001). Characterization and effects of amine blush on epoxy adhesive bonds. Journal of Materials Science, 36(4), 935-942.
- Halley, P. J. , & Mackay, M. E. (1996). The effect of B-stage curing on the rheology of an epoxy resin. Polymer Engineering & Science, 36(5), 593-609.
- Sancaktar, E., & Zhang, T. (2010). Moisture effects on the mechanical properties of adhesively bonded joints. Journal of Adhesion Science and Technology, 24(12), 1901-1925.
- Montgomery, D. C. (2017). Design and Analysis of Experiments (9th ed.). John Wiley & Sons.
Disclaimer/Publisher’s Note: The statements, opinions and data contained in all publications are solely those of the individual author(s) and contributor(s) and not of MDPI and/or the editor(s). MDPI and/or the editor(s) disclaim responsibility for any injury to people or property resulting from any ideas, methods, instructions or products referred to in the content. |
© 2025 by the authors. Licensee MDPI, Basel, Switzerland. This article is an open access article distributed under the terms and conditions of the Creative Commons Attribution (CC BY) license (http://creativecommons.org/licenses/by/4.0/).
Copyright: This open access article is published under a Creative Commons CC BY 4.0 license, which permit the free download, distribution, and reuse, provided that the author and preprint are cited in any reuse.


