
Submitted:
10 October 2025
Posted:
10 October 2025
You are already at the latest version
Abstract
Efficient thermal management is critical for the safety and performance of lithium-ion battery (LIB) systems, particularly under high C-rate charge-discharge cycling. Here, we investigate two classes of polymer composite thermal interface materials (TIMs): graphene-PLA (GPLA) fabricated via 3D printing and boron nitride nanoplatelets (BN)-loaded thermoplastic polyurethane (TPU) composites with 20 and 40 wt.% BN content. To understand cooling dynamics, we developed a simple analytical model based on Newtonian heat conduction, predicting an inverse relationship between the cooling rate and the TIM thermal diffusivity. We validated this model experimentally using a six-cell LIB module equipped with active liquid cooling, and complemented it with finite-element simulations in COMSOL Multiphysics incorporating experimentally derived parameters. Across all approaches, analytical, numerical, and experimental, we observed excellent agreement in predicting the temperature decay profiles and inter-cell temperature differentials (ΔT). Charge-discharge cycling studies at varying C-rates (1–8 C) demonstrated that high-diffusivity TIMs enable faster cooling but require careful design to minimize lateral thermal gradients. Our results establish that an ideal TIM must simultaneously support rapid vertical heat sinking and effective lateral thermal diffusion to ensure thermal uniformity. Among the studied materials, the 40% BN–60% TPU composite achieved the best overall performance, highlighting the potential of BN filler-engineered polymer composites for scalable thermal management in next-generation battery systems.
Keywords:
thermal interface materials
; graphene composites
; boron nitride
; lithium-ion batteries
; thermal diffusivity
; COMSOL simulation
; 3d printing
; battery thermal management
1. Introduction
As lithium-ion batteries (LIBs) become increasingly indispensable in electric vehicles (EVs), portable electronics, and stationary energy storage systems, their thermal management has emerged as a central engineering challenge [1,2,3,4,5,6,7,8]. Battery operation generates substantial heat, particularly under fast-charging or high-discharge conditions, leading to temperature gradients, accelerated degradation, and, in severe cases, thermal runaway [9,10]. Maintaining thermal uniformity and dissipating heat efficiently are critical for battery performance, safety, and lifespan.
In typical battery modules, heat is dissipated through passive and active cooling strategies, including airflow, liquid cooling manifolds, and heat pipes [2,3,4,5,11,12,13]. However, a significant thermal bottleneck persists at the interface between battery cells and their surrounding cooling infrastructure. Imperfect contact, surface roughness, and the low thermal conductivity of adhesives or structural materials contribute to significant thermal contact resistance [9,11,14,15,16,17,18]. This makes developing effective thermal interface materials (TIMs) crucial to advancing battery thermal management systems (BTMS).
TIMs are designed to bridge the thermal resistance gap between solid interfaces, such as battery casings and heat sinks. Polymer-based TIMs are often favored due to their mechanical flexibility, electrical insulation, and ease of processing [9,11,15,16,18,19]. Yet, the low intrinsic cross-plane thermal conductivity of most polymers (typically < 0.5 W m−1 K−1) severely limits their ability to conduct heat. To overcome this, high-conductivity fillers—such as graphite, metal oxides, and carbon nanostructures like graphene—are incorporated into the polymer matrix to form thermally conductive composites [20,21,22].
Graphene, with its exceptional in-plane thermal conductivity (up to 5000 W m−1 K−1), high aspect ratio, and tunable surface chemistry, has emerged as one of the most promising TIM fillers [18,23,24,25,26,27]. Its incorporation into polymer matrices can dramatically enhance thermal performance, particularly when oriented or networked to form continuous heat conduction paths [15,28,29,30,31,32,33]. However, graphene composites are also electrically conducting, which is a disadvantage in preventing undesired short circuits within the battery module.
Hexagonal boron nitride (h-BN), often dubbed “white graphene,” offers similarly high thermal conductivity along with electrical insulation, making it attractive for TIM applications where dielectric performance is important [17]. BN-polymer composites have demonstrated thermal conductivities up to 10 W m−1 K−1 depending on filler loading, morphology, and processing method [16,18,34,35,36,37]. A table summarizing prior results of thermal conductivity for various TIMs is presented in Table S1 [38,39,40,41,42,43,44,45,46,47,48,49,50,51,52,53,54,55]. Recent advances in filler surface functionalization, hybrid filler strategies, and anisotropic alignment have further improved the thermal transport efficiency of such composites .
While the thermal performance of individual materials is important, their integration into real-world systems poses additional design constraints. For example, TIMs must conform to irregular geometries, maintain thermal performance under cyclic loading, and avoid adding excessive mass or volume to the battery pack [11]. A comprehensive evaluation of TIMs requires multiscale assessment—from intrinsic thermal properties such as thermal diffusivity to system-level metrics like inter-cell temperature gradients and transient cooling behavior [9]. Finite-element simulations, particularly those implemented in platforms such as COMSOL Multiphysics, have become essential in linking material properties with thermal field evolution in complex battery assemblies [35,56].
In this study, we explored the fabrication and thermal performance of two classes of polymer composite TIMs: graphene-PLA (GPLA) produced via 3D printing, and BN-loaded thermoplastic polyurethane (TPU), cast with 20 and 40 wt.% BN content. Building on prior demonstrations of enhanced thermal conductivity in similar systems [11,15,15,17,18,28,35,56], we performed a comparative analysis using thermogravimetric analysis (TGA) and thermal diffusivity measurements to characterize material stability and heat transport properties. To evaluate real-world applicability, we implemented the TIMs in a compact battery module comprising six cylindrical 18650 LIB cells with an active liquid cooling manifold. We conducted thermal cycling experiments by heating the module to C under various TIM configurations and measuring the decay rates and inter-cell temperature differentials (). We employed finite-element simulations in COMSOL using experimentally derived parameters to model heat transfer within the battery module. We also studied the changes in the cell temperature with different TIMS at different C-rates as a function of charge-discharge cycles. Our simulations strongly agree with experimental data, particularly in reproducing the trends observed T and values for different TIMs. In addition to finite-element simulations performed in COMSOL using experimentally derived parameters, we developed an analytical framework linking the cooling time constant directly to the thermal diffusivity of the TIM. Furthermore, our study reveals that effective thermal management in battery modules depends on balancing two key processes: vertical heat sinking into the cooling infrastructure (cross-plane) and lateral thermal diffusion (in-plane) across adjacent cells. An ideal TIM must therefore achieve both a high heat decay rate and strong lateral thermal spreading to minimize inter-cell temperature gradients. Our findings contribute to the growing body of work demonstrating the feasibility of additive-manufactured, thermally-engineered polymer composites for thermal management in LIB systems.
2. Materials and Methods
2.1. Materials
Polylactic acid or PLA filament was purchased from Hacthbox while graphene-loaded PLA or GPLA filament was purchased from Blackmagic3D.com. Thermoplastic polyurethane or TPU filament and TPU pellets were purchased from TCPoly. Hexagonal boron nitride (h-BN) micropowder and N, N-dimethylformamide (DMF) were purchased from Sigma Aldrich.
2.2. Fabrication of Thermal Interface Materials
For 3D printing, a 70 x 30 x 1.4 mm slab was designed using the geometry module of COMSOL Multiphysics. Upon finalizing the geometry, the design was exported and sliced in PrusaSlicer software to generate the code for 3D printing. The exported code was then printed using a Prusa i3 MKS3+ 3D printer. We used commercially available polylactic acid or PLA, graphene-loaded PLA filament or GPLA, and thermoplastic polyurethane or TPU filaments for comparison with our polymer-nano composites.
For preparing TPU-BN composites, TPU pellets were dried in a vacuum oven at 100 °C for 4 hours. Subsequently, exfoliated micro h-BN micropowder was dispersed in N, N-dimethylformamide (DMF) using a tip sonicator at 10 watts for 30 minutes. After sonication, the mixture was placed on a hot plate at 80 °C and magnetically stirred at 150 rpm. Dried TPU pellets were added to the mixture slowly. Subsequently, the mixture was stirred at 80 °C and 150 rpm for 4 hours. Finally, the viscous mixture was cast onto a thin kitchen aluminum foil using an MTI doctor blade casting system to maintain a uniform thickness of 1.4 mm. The films were dried overnight at room temperature inside a chemical hood (120 cfm air flow) to remove all of the solvent slowly. Once dried, the TIMs were peeled from the foil and cut into 70 x 30 x 1.4 mm slabs.
2.3. Characterization Techniques
All TIMs were characterized using thermogravimetric (TGA) analysis (TA instrument SDT Q600) under nitrogen gas flow at 100 ml/min from room temperature to 600 °C with a ramp of 20 °C/min. Cross-plane thermal diffusivity was measured using the laser flash technique (Linseis LZT meter). Before diffusivity measurements, all samples were coated with graphite 33 spray to ensure uniform contact for heat flow. To analyze the performance of the TIMs, we made a prototype battery module with six 18650 cells (Panasonic NCR18650GA 3300 mAh); an aluminum manifold with internal tubes (similar to the manifold used in Tesla model 3) was used to flow liquid water coolant around the battery module at 40 ml/min using an electrical pump. TIMs were placed between the cooling tube and battery interfaces on both sides of the battery module. Six k-type thermocouples were inserted into the battery module to monitor the temperature of each battery using Pico software. FLIR E60 camera was used to capture IR images at different temperatures during heating and cooling. The battery module was heated to around 45 °C and then cooled down inside a hood with controlled air flow at 120 cfm. All the measurements were performed in triplicates (n=3) to ensure statistical robustness. Scanning electron microscope images, presented in Figures S1 and S2 of the supporting information, were obtained using a Hitachi 6600 SEM. High resolution X-ray diffraction (HR-XRD) is performed using a RIGAKU Ultima IV diffractometer, employing Cu K radiation, on powder samples that were held by a standard Al sample holder. Quantitative analysis using Rietveld refinement is performed on the XRD peaks using PDXL software. Atomic force microscopy (AFM) measurements were performed in a non-contact mode using AIST-NT SPM Smart system and cantilevers (HQ: NSC14/Al BS-50) from Micromasch. AIST-NT image analysis and processing (Version 3.2.14) software was used for AFM image analysis. Malvern Zetasizer 90 was used for dynamic light scattering measurements. Based on the DLS measurements, the average lateral size of BN particles is 745 ± 92 nm, which is consistent with the average size deduced from AFM measurements that showed an average lateral size of 600-800 nm with a thickness of 70-100 nm (see Figure S3 in the supporting information). Differential scanning calorimetry was performed to extract the specific heat values (Figure S4) using TA instruments Discovery DSC from 25- 600 °C.
2.4. COMSOL Modeling
The computational modeling part of the heat transfer mechanism was achieved using COMSOL Multiphysics 6.2 employing finite element method (FEM). The 18650 cells were modeled using a lithium-ion battery module (liion) with LMO- Spinel, graphite (, MCMB) and LiPF6 in 3:7 EC: EMC as respective cathode, anode, and electrolyte. Electrochemical reactions at the electrode/electrolyte interfaces follow Butler-Volmer kinetics given by
where (/) is the anodic (/cathodic) charge-transfer coefficient, F is the Faraday constant, is the overpotential, R is the universal gas constant, and T is the temperature in Kelvin. The electrolyte transport through porous electrodes was modeled via the Bruggeman relation.
A 3D heat transfer in solids and fluids (ht) module was further coupled with the Li-ion module using the average values of heat generated () and temeprature (). The thermal behavior of the module was then studied with a maintained coolant flow (water) through aluminum tubes similar to commercial battery packs. TIMs of size 70 x 30 x 1.4 mm (same as the ones used in experiments) were placed in between the batteries and the liquid cooling manifold. For the thermal cycling part, the module heating was achieved by a boundary heat source at the bottom of the cell with a 10 W heat source with a step function that triggers heat decay at 2400 s (cooling). A non-slip boundary condition was used for the fluid flow with flow rate limited to 1.08 x m2/s using the laminar flow (spf) module. COMSOL further uses the nonisothermal flow (nitf) module to couple the heat transfer spf and ht interfaces. Normal meshing (max. element size 11.4 nm) was used for all domains, with coolant tube boundaries defined using fine (max. element size 5.3 nm). For the charge-discharge studies, the six cells were assumed to be charging independency at the set c-rate simultaneously. An alternating charge-discharge cycle of current flow was employed using a square wave function with the current and cycle time as the variable to control the C-rate.
3. Results
Figure 1a presents the TGA curves for five materials: neat PLA, GPLA, neat TPU, and TPU loaded with 20 wt.% and 40 wt.% BN). All samples were heated under nitrogen atmosphere up to 600°C, and weight loss was monitored to evaluate thermal degradation behavior and filler content. Neat PLA and GPLA both exhibit a sharp one-step degradation between 300°C to 400°C, consistent with known depolymerization and chain scission mechanisms of PLA [11]. However, the GPLA sample demonstrates a slightly earlier onset of decomposition and retains significantly more mass at high temperature due to the presence of graphene fillers. Specifically, at 450 °C, PLA retains less than 2% of its initial mass, whereas GPLA retains approximately 15%. This difference indicates that there is ∼ 15 wt. % of graphene incorporated into GPLA. Neat TPU shows a broader and more gradual weight loss profile with a single step beginning near 300 °C, and a residual mass of around 45% at 450 °C. Such a single-step decomposition process is characteristic of the breakdown of both hard and soft segments in the polymer matrix. The addition of BN significantly alters this behavior. The 20%BN–80%TPU composite exhibits a two-step decomposition with a second decomposition onset at 400 °C and retains approximately 52% of its initial mass at 450 °C. The 40%BN–60%TPU sample demonstrates the highest thermal stability among all samples, retaining nearly 70% of its mass at the same temperature. The two-step decomposition is more evident in 40%BN–60%TPU sample. The progressive increase in residue with h-BN loading is indicative of the high thermal stability of h-BN, which acts as an inert filler resisting oxidative or thermal degradation [16]. The emergence of a second decomposition step in BN–TPU composites at 400 °C can be attributed to interfacial interactions between the BN fillers and the TPU chains. The high thermal stability and inertness of BN not only provide a thermal shielding effect but also restrict the mobility of TPU chains through non-covalent interactions such as van der Waals forces or hydrogen bonding (e.g., N–H⋯BN). These interfacial effects delay the decomposition of segments closely associated with BN surfaces, resulting in the observed higher-temperature degradation step. Therefore, the two-step decomposition is indicative of filler-mediated stabilization and heterogeneous breakdown of the polymer matrix in the presence of thermally robust BN domains.
Figure 1b shows the thermal diffusivity of the same five samples as a function of temperature up to 70°C. The diffusivity data reveals a clear hierarchy in thermal transport performance, strongly dependent on the type and concentration of thermally conductive fillers. The highest thermal diffusivity is observed in the 40%BN–60%TPU composite, with values consistently above cm2 s–1 across the entire temperature range. This value is more than an order of magnitude higher than that of the base TPU, which maintains a diffusivity near cm2 s–1. The substantial enhancement can be attributed to the formation of percolated thermal pathways within the TPU matrix due to the high BN content. BN’s high intrinsic thermal conductivity, good dispersion and high aspect ratio, likely contribute to efficient phonon transport even at modest temperature gradients [17]. The 20%BN–80%TPU composite shows intermediate performance, with a diffusivity of approximately cm2 s–1. While this is a notable improvement over neat TPU, the sub-percolation regime of filler content may limit the formation of continuous conduction networks. This aligns with existing studies suggesting that filler loadings above the percolation threshold are essential for achieving significant enhancements in thermal diffusivity [18]. The GPLA sample exhibits only a marginal improvement over neat PLA, with diffusivity values of about cm2 s–1 compared to cm2 s–1 for PLA. This modest increase suggests graphene in PLA matrix is suboptimal for effective thermal transport.
To assess the effectiveness of the TIMs under realistic conditions, a module comprising six cylindrical Li-ion cells was assembled with the TIM inserted between the cells and the liquid cooling manifold (Figure 2a,b). The module was subjected to controlled heating inside a forced-air convection hood with an airflow rate of 120 CFM. Heating was continued until the average temperature of the battery module reached approximately 45 °C, at which point the heat source was turned off, initiating the cooling phase. Each cell was attached with an independent thermocouple to monitor transient temperature profiles throughout the heating and cooling cycles. The aqueous liquid coolant was pumped through the Al manifold throughout the heating and cooling cycles. Typical IR images of the cells at different stages of heating are shown in Figure 2c,d.
Figure 3a shows the representative thermal response for all six cells when PLA was used as the TIM. Although all cells were exposed to the same environmental conditions, the temperature evolution was non-uniform, with distinct differences in heating rates and peak temperatures. Notably, Battery-1 reached the highest temperature while Battery-6 remained significantly cooler, exhibiting a temperature difference of nearly 4°C at the peak. These differences reflect the anisotropic thermal conductance within the module, asymmetries in cell-to-manifold contact, and intrinsic differences in cell self-heating behavior. Figure 3b shows the average temperature () of the entire module, obtained from the temperature readings from all six thermocouples. The average curve shows a smooth and symmetric profile with a clear demarcation between the heating and cooling phases. To evaluate thermal uniformity within the module, the temperature difference was computed for each cell i with respect to the instantaneous average temperature . The results are plotted in Figure 3c. The curves show that thermal nonuniformity peaks near the end of the heating phase, where some cells lag in temperature rise compared to others. During the cooling phase, gradually decreases as heat is more uniformly extracted via the manifold, but notable differences persist over the full transient period.
The transient cooling behavior of the battery module, following the removal of the external heat source, was analyzed using the following thermal conduction model. TIM serves as the dominant path for heat dissipation from the battery cells to the cooling manifold. Assuming negligible heat generation during the cooling phase and lumped thermal capacity of the cells, the rate of temperature decay can be modeled by equating the rate of internal energy loss to the conductive heat flux through the TIM. The rate of heat loss from the battery can be expressed as:
where is the specific heat capacity and is the effective thermal mass of the battery module. The heat flux through the TIM is modeled as:
where is the thermal conductivity of the TIM, is the contact area, is the TIM thickness, T is the instantaneous temperature of the battery, and is the steady-state temperature.
Equating these expressions yields the governing differential equation for temperature decay:
which simplifies to:
Introducing the thermal diffusivity , the time constant governing exponential decay is given by:
showing that is inversely proportional to the thermal diffusivity of the interface material. Thus, the solution to the temperature decay equation is an exponential approach to :
where is the initial temperature at the start of the cooling phase. Equation (7) was used to fit the experimental cooling data for each TIM configuration. The extracted decay constant provides a quantitative measure of the rate at which the battery module sheds heat. All the fit values are provided in Table S2 in the supporting information. Lower values of correspond to faster cooling and more thermally effective TIMs. The fitted results were subsequently compared across different TIM materials and correlated with their independently measured thermal diffusivities to verify the predicted inverse relationship . A representative plot (see Figure 3d) confirms this trend.
Figure 4 presents the time-resolved temperature deviations for each of the six cells in the attery module using five different TIMs: (a) PLA, (b) GPLA, (c) TPU, (d) 20%BN–80%TPU, and (e) 40%BN–60%TPU. The metric quantifies the deviation of each cell’s temperature from the instantaneous module average , providing a dynamic measure of inter-cell thermal uniformity. Interestingly, the PLA TIM—despite having the lowest thermal diffusivity among the tested materials—exhibits the narrowest spread in , with all six cells maintaining relatively close thermal trajectories. The peak remains below 3 °C throughout the thermal cycle. This result appears counterintuitive given PLA’s poor thermal conductivity. However, it can be rationalized by considering the relatively uniform thermal impedance across all cell–manifold interfaces: in the absence of a highly conductive path, each cell dissipates heat at a similar, albeit slow, rate (as indicated by a high for PLA in Figure 2d). The system behaves almost adiabatically on short time scales, and thermal gradients develop primarily due to intrinsic differences in cell positioning or contact pressure rather than material-mediated heat spreading.
In contrast, the introduction of higher-diffusivity TIMs such as GPLA and TPU increases the magnitude and spread of . Notably, the GPLA TIM (Figure 4b) exhibits the largest inter-cell thermal heterogeneity, with Battery-6 showing a pronounced deviation exceeding 5 °C. This suggests that while the thermal conductivity of GPLA is higher than PLA, it remains insufficient to rapidly redistribute heat, and may accentuate local differences arising from subtle variations in thermal contact resistance. Similarly, the TPU-only TIM (Figure 4c) produces a broader spread than PLA, albeit less pronounced than GPLA. These observations underscore the sensitivity of thermal equilibration to both filler dispersion and the quality of interface coupling between cells and the cooling manifold. For the 20%BN–80%TPU system (Figure 4d), peak values slightly increased, with Battery-1 deviating significantly from the average. In the 40%BN–60%TPU composite (Figure 4e), the inter-cell temperature differences become markedly lower, and the spread among all six cells narrows considerably. This suggests that only beyond a critical threshold of thermal diffusivity does the TIM effectively serve its homogenizing function, enabling lateral heat spreading across the module to suppress local temperature peaks.
It should be noted that an ideal TIM should simultaneously exhibit both a high rate of cooling (see Figure 2d) and a low spread of , which is achieved in our case through 40%BN–60%TPU composites. The physical mechanism underlying these trends can be understood in terms of the competition between two thermal processes: (1) vertical heat sinking into the cooling manifold, and (2) lateral thermal diffusion across adjacent cell interfaces via the TIM. At low diffusivity (e.g., PLA), both mechanisms are weak, resulting in symmetric but slow heat loss across the module. As diffusivity increases without reaching the percolation threshold (e.g., GPLA, 20%BN–TPU), lateral diffusion becomes anisotropic and non-uniform, which can amplify local hotspots, especially near the geometric or thermal boundaries of the module. Once the TIM achieves sufficiently high diffusivity (e.g., 40%BN–TPU), lateral heat transfer dominates, allowing efficient redistribution of thermal energy from warmer to cooler regions and thus reducing . Edge effects are also evident in these data due to the finite size of the battery module and the small number of monitored cells (N = 6). Cells located at the periphery (e.g., Battery-1 or Battery-6) often show the largest deviation from the average temperature. This behavior is consistent with the expectation that edge cells experience asymmetric thermal environments—differing airflow exposure, partial insulation, or varying proximity to the cooling manifold boundaries. To further elucidate the relationship between TIM thermal properties and inter-cell thermal uniformity, we extracted the peak values of for each configuration and plotted them against the measured thermal diffusivity of the corresponding materials, as shown in Figure 4f. Error bars represent the standard deviation of the peak values across three replicates for each TIM.
To evaluate the dynamic thermal response of the battery module under practical operating conditions, COMSOL Multiphysics simulations were conducted across a range of charge–discharge rates (1C, 2C, 4C, and 8C) [2,57,58,59,60,61,62]. A six-cell Li-ion battery module was subjected to 10 continuous charge–discharge cycles at varying C-rates (1C, 2C, 4C, and 8C), followed by a 2.5-hour cooling period with various TIMs placed between the cells, as shown in Figure 5. Figure 5a presents a representative image of the temperature profile at the end of the first cycle using PLA as the TIM. The thermal distribution among the cells is relatively symmetric. However, we notice an increase in the cell temperature, as evidenced by different colors of the liquid-cooling manifold (hot pink) compared to the cells (golden yellow). Figure 5b–f depict the temperature profiles at the end of the tenth cycle for the different TIMs. For PLA (Figure 5b), a significant temperature increase is evident, with pronounced hotspots in TIM toward the left edge of the cell. The GPLA and TPU TIMs (Figure 5c and d) demonstrate improved thermal performance relative to PLA, but still exhibit notably asymmetry as noticed from different colors for the liquid-cooling manifold (purple) and the cells (orange for GPLA and hot pink for TPU). These results are consistent with their moderate thermal diffusivities, which enable some degree of vertical heat sinking but are insufficient for complete lateral thermal equilibration. The 20% BN–TPU composite (Figure 5e) provides a further reduction in maximum temperature and a modest improvement in uniformity. The most striking improvement is observed with the 40% BN–TPU composite (Figure 5f), where the temperature field is both lower in magnitude and more homogeneous with the liquid-cooling manifold and the cells both showing similar color.
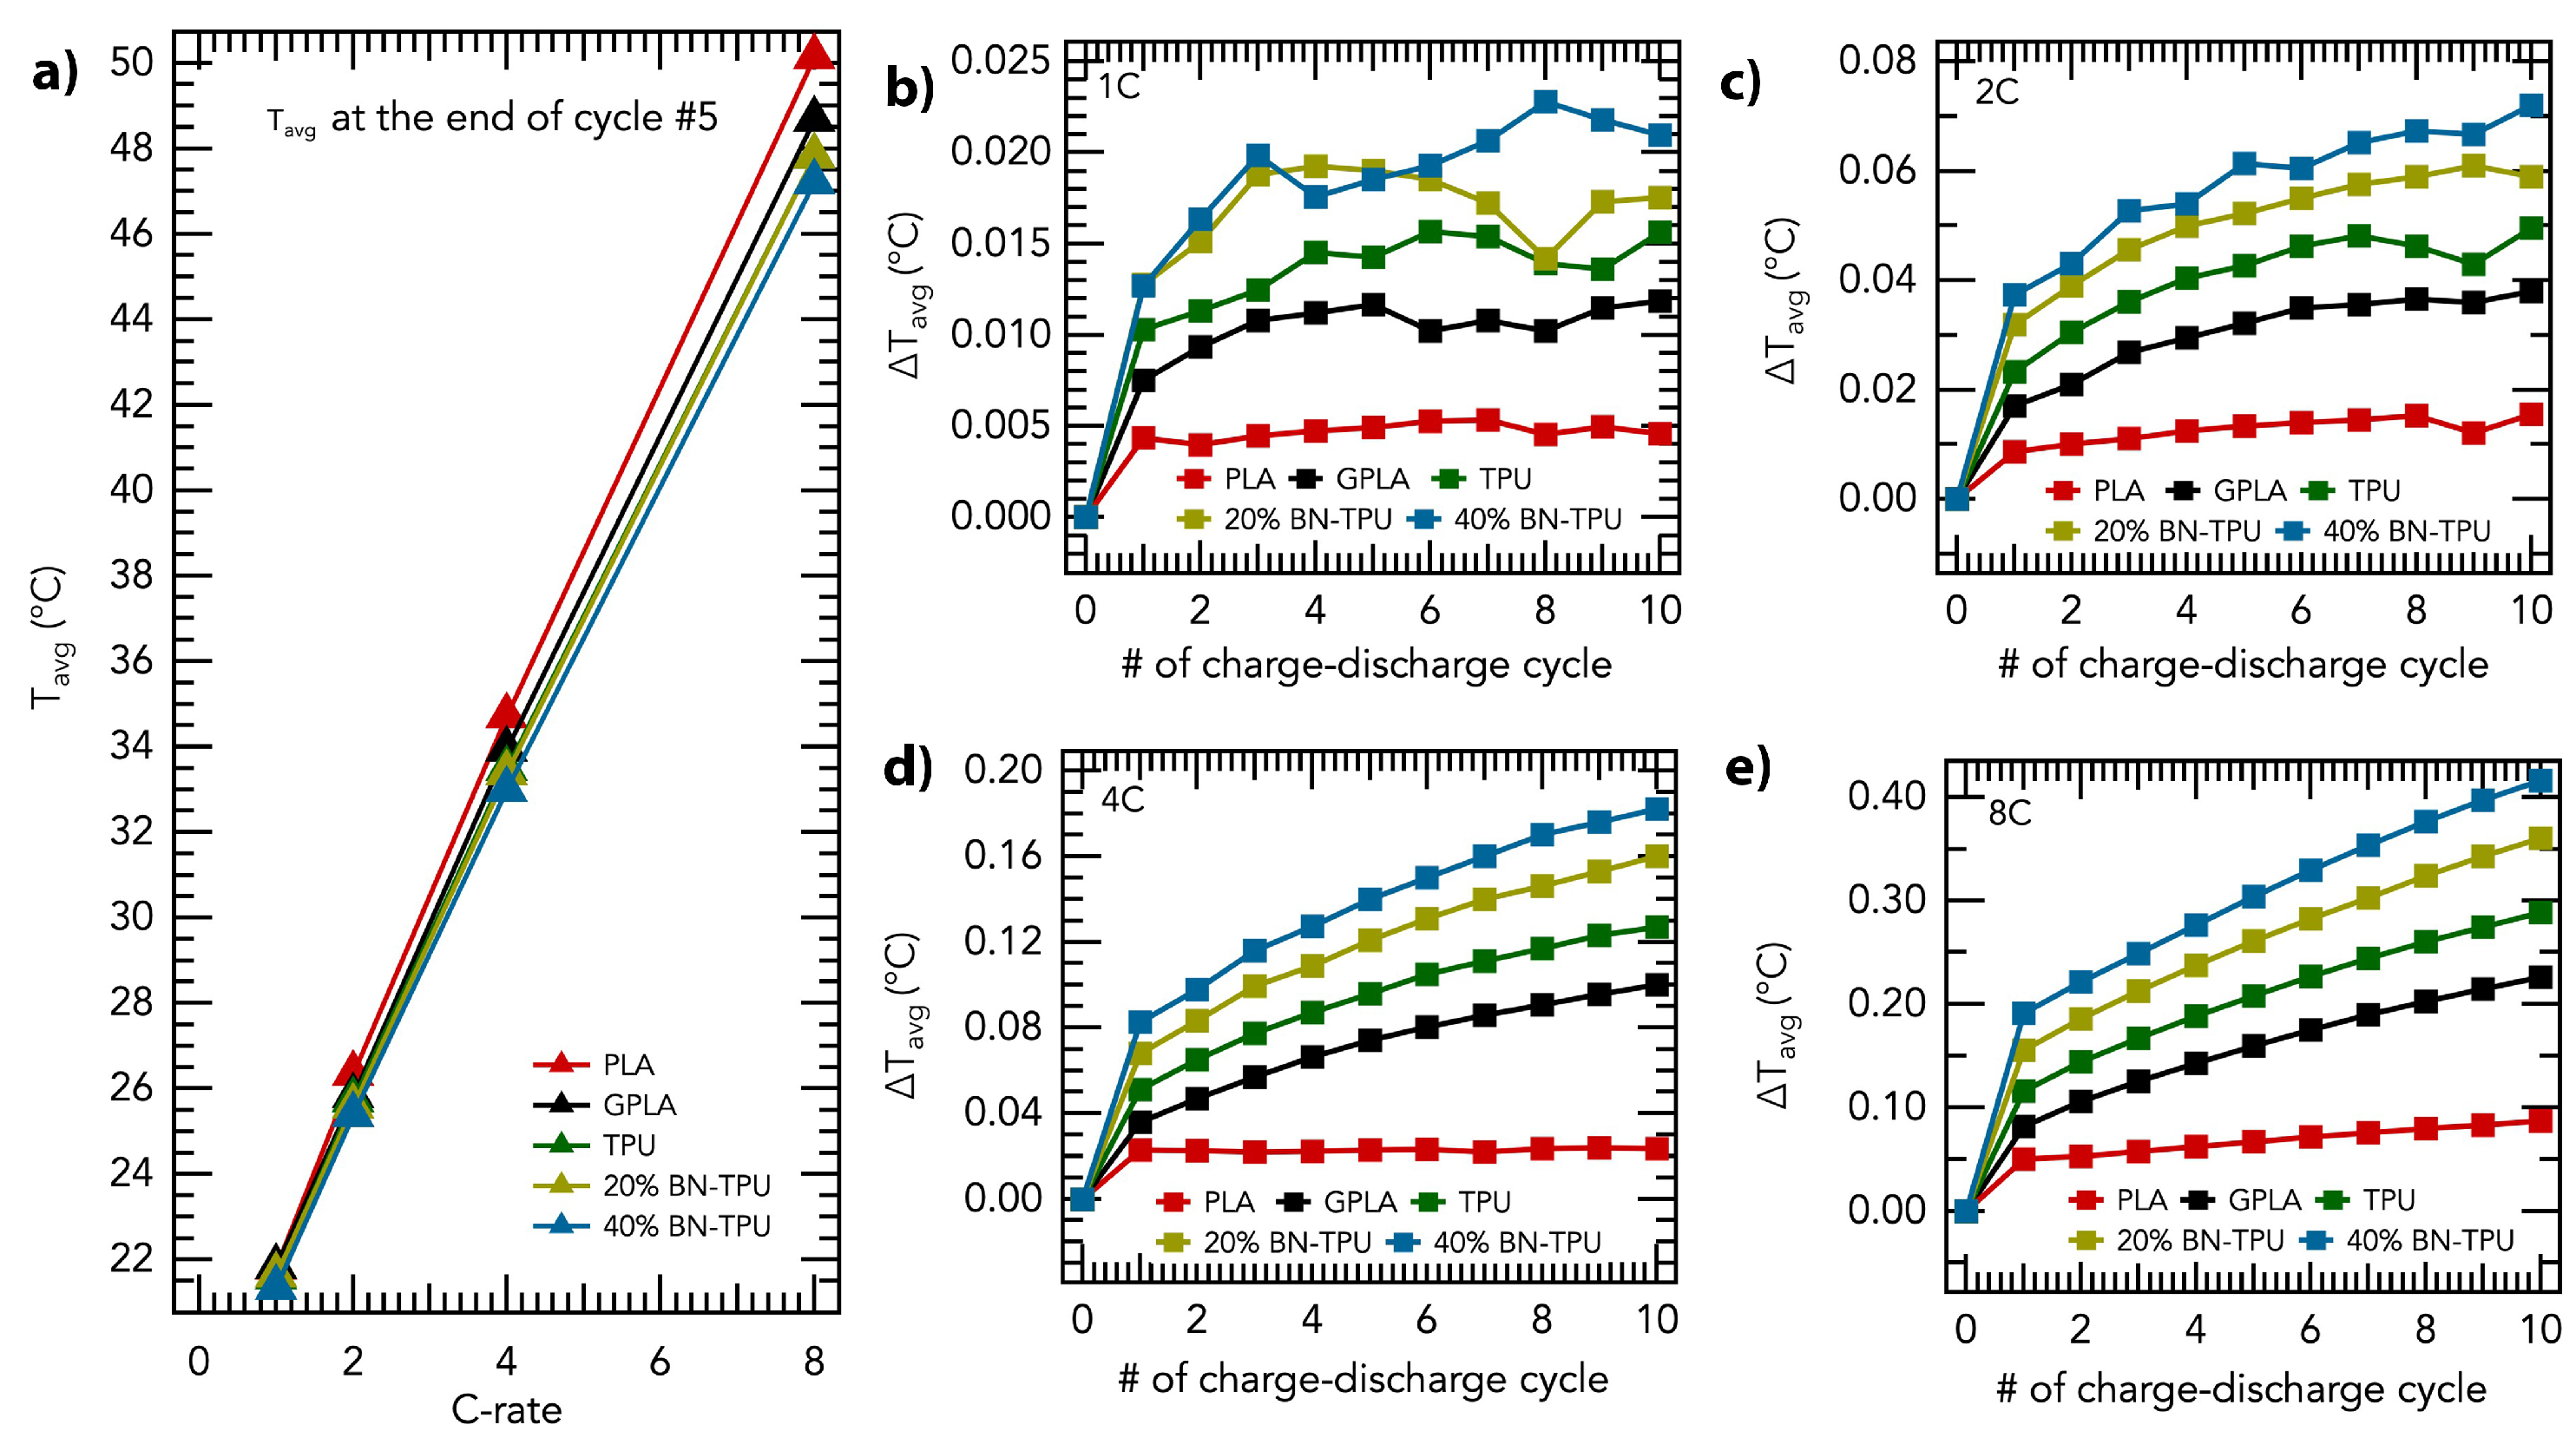
To analyze more quantitatively, we present the average temperature profiles in Figure 6. Each subplot compares the temperature rise for different TIM configurations: PLA, GPLA, TPU, 20% BN–TPU, and 40% BN–TPU. Across all conditions, a clear and systematic increase in temperature with increasing C-rate is observed, consistent with the enhanced internal heat generation governed by the relation , where I is the current and R is the internal resistance of the cell. At low C-rates (e.g., 1C in Figure 6a), the thermal load is moderate leading to maximum temperature ≤ 22 °C. At 1C, all TIMs appear reasonably effective in preventing excessive temperature rise, although subtle differences in performance are already discernible with 40% BN–TPU showing the best performance, as expected. As the C-rate increases (particularly at 4C and 8C) in Figure 6b-d, the distinctions among TIMs become significantly more pronounced. Notably, the PLA TIM, which exhibits the lowest thermal diffusivity among the tested materials, results in the highest average temperatures at every C-rate. In contrast, the 40% BN–TPU composite consistently demonstrates the lowest temperature profiles across all C-rates, highlighting the role of enhanced thermal diffusivity in facilitating vertical heat sinking and efficient thermal management. Furthermore, all materials exhibit a thermal staircase in peak temperature with increasing C-rate, indicating cumulative heating effects due to incomplete thermal recovery between successive cycles.
At the highest C-rate of 8C, PLA exhibited the largest , reaching slightly above 50 °C over the course of the cycles (Figure 7a). In contrast, the 40%BN–TPU TIM, which demonstrated the highest experimental thermal diffusivity, limited the thermal rise to below 50 °C, despite identical electrochemical and convective boundary conditions. Figure 7b-e present the average inter-cell temperature deviation, denoted as , for each TIM configuration across charge–discharge cycles at different C-rates. Across all C-rates, a clear hierarchy in emerges. Low-diffusivity TIMs such as PLA and GPLA exhibit the lowest inter-cell deviations in contrast to high-diffusivity TIMs (similar to results discussed in Figure 4). As discussed earlier, this can be rationalized in terms of the balance between vertical heat transfer to the manifold vs. the lateral heat spreading. While high diffusivity TIMs enable faster heat decay through vertical heat transfer (cf. Figure 3d), there is asymmetric lateral heat diffusion resulting in higher inter-cell deviations.
4. Conclusions
We systematically evaluated the thermal performance of graphene-PLA (GPLA) and boron nitride (BN)-loaded TPU composites as thermal interface materials (TIMs) for lithium-ion battery modules. Material characterization confirmed that the incorporation of high thermal conductivity fillers significantly enhanced both thermal stability and thermal diffusivity. Through a combination of analytical modeling, finite-element simulations in COMSOL Multiphysics, and experimental thermal cycling studies, we established a direct inverse relationship between the TIM thermal diffusivity and the heat decay rate of the battery module. Our analysis further revealed that optimal TIMs must balance vertical heat sinking into the cooling infrastructure with lateral thermal diffusion across adjacent cells to minimize inter-cell temperature gradients. Among the materials studied, the 40%BN–60%TPU composite demonstrated superior performance, achieving both rapid cooling and thermal uniformity. These findings underscore the potential of filler-engineered, additive-manufactured polymer composites for scalable, efficient thermal management in high-power lithium-ion battery applications.
Author Contributions
RP and PP instigated and conceptualized the study. SKM and GB prepared the thermal composites with assistance from RP and conducted all characterization and experimental measurements. AF and SMF performed COMSOL simulations and data visualization under RP’s supervision. YD provided design inputs and assisted with data analysis. All authors participated in data analysis, data visualization, and drafting the results. The manuscript was reviewed and approved by all authors.
Funding
This work was supported by Clemson University’s Virtual Prototyping of Autonomy Enabled Ground Systems (VIPR-GS), under Cooperative Agreement W56HZV-21-2-0001 with the US Army DEVCOM Ground Vehicle Systems Center (GVSC). The sub-project number is 2.23.11 2016337 (PI: Podila). DISTRIBUTION STATEMENT A. Approved for public release; distribution is unlimited (OPSEC 9863)
Institutional Review Board Statement
Not Applicable
Informed Consent Statement
Not applicable
Data Availability Statement
The raw data supporting the conclusions of this article and Supplementary Materials will be made available by the authors on request.
Acknowledgments
SKM and RP gratefully acknowledge Dr. Sriparna Bhattacharya at the Clemson Nanomaterials Institute (CNI) for assistance with the Linseis thermal diffusivity instrument and Dr. Rakesh Sachdeva from the Department of Chemistry at Clemson University for support with thermogravimetric analysis (TGA) measurements.
Conflicts of Interest
The authors declare no conflicts of interest.
Abbreviations
The following abbreviations are used in this manuscript:
| LIB | Lithium-ion battery |
| TIMs | Thermal interface materials |
| PLA | Polylactic acid PLA |
| GPLA | Graphene-PLA |
| BN | Boron nitride |
| TPU | Thermoplastic polyurethane |
| EVs | Electric vehicles |
| BTMS | Battery thermal management systems |
| h-BN | Hexagonal boron nitride |
| TGA | Thermogravimetric analysis |
| DMF | N, N-dimethylformamide |
| XRD | X-ray diffraction |
| AFM | Atomic force microscopy |
| DSC | Differential scanning calorimetry |
| FEM | Finite element method |
References
- Kermani, J.R.; Taheri, M.M.; Pakzad, H.; Minaei, M.; Bijarchi, M.A.; Moosavi, A.; Shafii, M.B. Hybrid battery thermal management systems based on phase transition processes: a comprehensive review. Journal of Energy Storage 2024, 86, 111227. [Google Scholar] [CrossRef]
- Zhao, Y.; Zhang, X.; Yang, B.; Cai, S. A review of battery thermal management systems using liquid cooling and PCM. Journal of Energy Storage 2024, 76, 109836. [Google Scholar] [CrossRef]
- Vikram, S.; Vashisht, S.; Rakshit, D.; Wan, M.P. Recent advancements and performance implications of hybrid battery thermal management systems for Electric Vehicles. Journal of Energy Storage 2024, 90, 111814. [Google Scholar] [CrossRef]
- Liu, J.; Yadav, S.; Salman, M.; Chavan, S.; Kim, S.C. Review of thermal coupled battery models and parameter identification for lithium-ion battery heat generation in EV battery thermal management system. International Journal of Heat and Mass Transfer 2024, 218, 124748. [Google Scholar] [CrossRef]
- Hwang, F.S.; Confrey, T.; Reidy, C.; Picovici, D.; Callaghan, D.; Culliton, D.; Nolan, C. Review of battery thermal management systems in electric vehicles. Renewable and Sustainable Energy Reviews 2024, 192, 114171. [Google Scholar] [CrossRef]
- Olabi, A.; Maghrabie, H.M.; Adhari, O.H.K.; Sayed, E.T.; Yousef, B.A.; Salameh, T.; Kamil, M.; Abdelkareem, M.A. Battery thermal management systems: Recent progress and challenges. International Journal of Thermofluids 2022, 15, 100171. [Google Scholar] [CrossRef]
- Lin, J.; Liu, X.; Li, S.; Zhang, C.; Yang, S. A review on recent progress, challenges and perspective of battery thermal management system. International Journal of Heat and Mass Transfer 2021, 167, 120834. [Google Scholar] [CrossRef]
- Ghalkhani, M.; Habibi, S. Review of the Li-ion battery, thermal management, and AI-based battery management system for EV application. Energies 2022, 16, 185. [Google Scholar] [CrossRef]
- Longchamps, R.S.; Yang, X.G.; Wang, C.Y. Fundamental insights into battery thermal management and safety. ACS Energy Letters 2022, 7, 1103–1111. [Google Scholar] [CrossRef]
- Li, H.; Wang, H.; Xu, Z.; Wang, K.; Ge, M.; Gan, L.; Zhang, Y.; Tang, Y.; Chen, S. Thermal-responsive and fire-resistant materials for high-safety lithium-ion batteries. Small 2021, 17, 2103679. [Google Scholar] [CrossRef]
- Wang, Z.; Wu, Z.; Weng, L.; Ge, S.; Jiang, D.; Huang, M.; Mulvihill, D.M.; Chen, Q.; Guo, Z.; Jazzar, A.; et al. A roadmap review of thermally conductive polymer composites: critical factors, progress, and prospects. Advanced functional materials 2023, 33, 2301549. [Google Scholar] [CrossRef]
- Chen, K.; Zhang, Z.; Wu, B.; Song, M.; Wu, X. An air-cooled system with a control strategy for efficient battery thermal management. Applied Thermal Engineering 2024, 236, 121578. [Google Scholar] [CrossRef]
- Kalaf, O.; Solyali, D.; Asmael, M.; Zeeshan, Q.; Safaei, B.; Askir, A. Experimental and simulation study of liquid coolant battery thermal management system for electric vehicles: A review. International journal of energy research 2021, 45, 6495–6517. [Google Scholar] [CrossRef]
- Yu, W.; Liu, C.; Qiu, L.; Zhang, P.; Ma, W.; Yue, Y.; Xie, H.; Larkin, L.S. Advanced thermal interface materials for thermal management. Engineered Science 2018, 2, 1–3. [Google Scholar] [CrossRef]
- Guo, H.; Zhao, H.; Niu, H.; Ren, Y.; Fang, H.; Fang, X.; Lv, R.; Maqbool, M.; Bai, S. Highly thermally conductive 3D printed graphene filled polymer composites for scalable thermal management applications. Acs Nano 2021, 15, 6917–6928. [Google Scholar] [CrossRef] [PubMed]
- Ma, H.; Gao, B.; Wang, M.; Yuan, Z.; Shen, J.; Zhao, J.; Feng, Y. Strategies for enhancing thermal conductivity of polymer-based thermal interface materials: A review. Journal of Materials Science 2021, 56, 1064–1086. [Google Scholar] [CrossRef]
- Lin, Y.; Li, P.; Liu, W.; Chen, J.; Liu, X.; Jiang, P.; Huang, X. Application-driven high-thermal-conductivity polymer nanocomposites. ACS nano 2024, 18, 3851–3870. [Google Scholar] [CrossRef]
- Lewis, J.S.; Perrier, T.; Barani, Z.; Kargar, F.; Balandin, A.A. Thermal interface materials with graphene fillers: review of the state of the art and outlook for future applications. Nanotechnology 2021, 32, 142003. [Google Scholar] [CrossRef]
- Akula, R.; Balaji, C. Thermal management of 18650 Li-ion battery using novel fins–PCM–EG composite heat sinks. Applied Energy 2022, 316, 119048. [Google Scholar] [CrossRef]
- Yuan, Z.; Ma, H.; Hussien, M.A.; Feng, Y. Development and challenges of thermal interface materials: a review. Macromolecular Materials and Engineering 2021, 306, 2100428. [Google Scholar] [CrossRef]
- Chen, J.; Xu, X.; Zhou, J.; Li, B. Interfacial thermal resistance: Past, present, and future. Reviews of Modern Physics 2022, 94, 025002. [Google Scholar] [CrossRef]
- Zhang, Y.; Ma, J.; Wei, N.; Yang, J.; Pei, Q.X. Recent progress in the development of thermal interface materials: a review. Physical Chemistry Chemical Physics 2021, 23, 753–776. [Google Scholar] [CrossRef]
- Shahil, K.M.; Balandin, A.A. Graphene–multilayer graphene nanocomposites as highly efficient thermal interface materials. Nano letters 2012, 12, 861–867. [Google Scholar] [CrossRef]
- Naghibi, S.; Kargar, F.; Wright, D.; Huang, C.Y.T.; Mohammadzadeh, A.; Barani, Z.; Salgado, R.; Balandin, A.A. Noncuring graphene thermal interface materials for advanced electronics. Advanced Electronic Materials 2020, 6, 1901303. [Google Scholar] [CrossRef]
- Zhang, Y.F.; Han, D.; Zhao, Y.H.; Bai, S.L. High-performance thermal interface materials consisting of vertically aligned graphene film and polymer. Carbon 2016, 109, 552–557. [Google Scholar] [CrossRef]
- Yun, J.; Lee, J.; Kim, J.; Lee, J.; Choi, W. Hexagonal boron nitride nanosheets/graphene nanoplatelets/cellulose nanofibers-based multifunctional thermal interface materials enabling electromagnetic interference shielding and electrical insulation. Carbon 2024, 228, 119397. [Google Scholar] [CrossRef]
- Chung, D. Performance of thermal interface materials. Small 2022, 18, 2200693. [Google Scholar] [CrossRef] [PubMed]
- Luo, T.; Lloyd, J.R. Enhancement of thermal energy transport across graphene/graphite and polymer interfaces: a molecular dynamics study. Advanced Functional Materials 2012, 22, 2495–2502. [Google Scholar] [CrossRef]
- Huang, J.; Zhu, Y.; Xu, L.; Chen, J.; Jiang, W.; Nie, X. Massive enhancement in the thermal conductivity of polymer composites by trapping graphene at the interface of a polymer blend. Composites Science and Technology 2016, 129, 160–165. [Google Scholar] [CrossRef]
- Li, A.; Zhang, C.; Zhang, Y.F. Thermal conductivity of graphene-polymer composites: Mechanisms, properties, and applications. Polymers 2017, 9, 437. [Google Scholar] [CrossRef]
- Zhang, P.; Zeng, J.; Zhai, S.; Xian, Y.; Yang, D.; Li, Q. Thermal properties of graphene filled polymer composite thermal interface materials. Macromolecular Materials and Engineering 2017, 302, 1700068. [Google Scholar] [CrossRef]
- Lu, X.H.; Liu, J.; Shu, C.; Zhang, S.C.; Zhao, H.Y.; Zhang, Y.; Wang, Q.; Yu, Z.Z.; Li, X. Densifying conduction networks of vertically aligned carbon fiber arrays with secondary graphene networks for highly thermally conductive polymer composites. Advanced Functional Materials 2025, 35, 2417324. [Google Scholar] [CrossRef]
- Dai, W.; Wang, Y.; Li, M.; Chen, L.; Yan, Q.; Yu, J.; Jiang, N.; Lin, C.T. 2D materials-based thermal Interface materials: structure, properties, and applications. Advanced Materials 2024, 36, 2311335. [Google Scholar] [CrossRef] [PubMed]
- Li, M.; Han, S.; Dan, C.; Wu, T.; You, F.; Jiang, X.; Wu, Y.; Dang, Z.M. Boron Nitride-Polymer Composites with High Thermal Conductivity: Preparation, Functionalization Strategy and Innovative Structural Regulation. Small 2025, p. 2412447. [CrossRef]
- Jia, P.; An, L.; Yu, L.; Pan, Y.; Fan, H.; Qin, L. Strategies for optimizing interfacial thermal resistance of thermally conductive hexagonal boron nitride/polymer composites: A review. Polymer Composites 2024, 45, 10587–10618. [Google Scholar] [CrossRef]
- Hu, J.; Huang, Y.; Yao, Y.; Pan, G.; Sun, J.; Zeng, X.; Sun, R.; Xu, J.B.; Song, B.; Wong, C.P. Polymer composite with improved thermal conductivity by constructing a hierarchically ordered three-dimensional interconnected network of BN. ACS applied materials & interfaces 2017, 9, 13544–13553. [Google Scholar] [CrossRef]
- Ravichandran, V.; Varrla, E. Sustainable high-yield h-BN nanosheet production by liquid exfoliation for thermal interface materials. RSC Applied Interfaces 2025. [Google Scholar] [CrossRef]
- Xu, L.; Zhan, K.; Ding, S.; Zhu, J.; Liu, M.; Fan, W.; Duan, P.; Luo, K.; Ding, B.; Liu, B.; et al. A Malleable Composite Dough with Well-Dispersed and High-Content Boron Nitride Nanosheets. ACS Nano 2023, 17, 4886–4895. [Google Scholar] [CrossRef]
- Liang, Z.; Pei, Y.; Chen, C.; Jiang, B.; Yao, Y.; Xie, H.; Jiao, M.; Chen, G.; Li, T.; Yang, B.; et al. General, Vertical, Three-Dimensional Printing of Two-Dimensional Materials with Multiscale Alignment. ACS Nano 2019, 13, 12653–12661. [Google Scholar] [CrossRef]
- Liu, G.; Ding, A.; Xu, P.; Zhu, M.; Zhang, H.; Zheng, Y.; Luo, Y.; Zhang, L.; Zhang, P.; Chen, A.; et al. Thermal conductivity of epoxy composites containing 3D honeycomb boron nitride filler. Chemical Engineering Journal 2024, 489, 151170. [Google Scholar] [CrossRef]
- Chen, J.; Huang, X.; Sun, B.; Wang, Y.; Zhu, Y.; Jiang, P. Vertically Aligned and Interconnected Boron Nitride Nanosheets for Advanced Flexible Nanocomposite Thermal Interface Materials. ACS Applied Materials & Interfaces 2017, 9, 30909–30917. [Google Scholar] [CrossRef]
- Hong, H.; Jung, Y.H.; Lee, J.S.; Jeong, C.; Kim, J.U.; Lee, S.; Ryu, H.; Kim, H.; Ma, Z.; Kim, T. Anisotropic Thermal Conductive Composite by the Guided Assembly of Boron Nitride Nanosheets for Flexible and Stretchable Electronics. Advanced Functional Materials 2019, 29, 1902575. [Google Scholar] [CrossRef]
- Song, Q.; Zhu, W.; Deng, Y.; Hai, F.; Wang, Y.; Guo, Z. Enhanced through-plane thermal conductivity and high electrical insulation of flexible composite films with aligned boron nitride for thermal interface material. Composites Part A: Applied Science and Manufacturing 2019, 127, 105654. [Google Scholar] [CrossRef]
- Gao, C.; Zhu, Z.; Shen, Y.; Wang, T.; Xiang, D. Efficient construction of boron nitride network in epoxy composites combining reaction-induced phase separation and three-roll milling. Composites Part B: Engineering 2020, 198, 108232. [Google Scholar] [CrossRef]
- Yuan, W.; Li, W.; Zhu, S.; Chu, Z.; Gan, W. 3D-network of hybrid epoxy-boron nitride microspheres leading to epoxy composites of high thermal conductivity. Journal of Materials Science 2022, 57, 11698–11713. [Google Scholar] [CrossRef]
- Wang, Z.; Wang, X.; Zhang, Z.; Liang, L.; Zhao, Z.; Shi, J. Preparation of a 3D BN network structure by a salt template assisted method filled with epoxy resin to obtain high thermal conductivity nanocomposites. Polymer Composites 2023, 44, 3610–3621. [Google Scholar] [CrossRef]
- Leng, X.; Xiao, C.; Chen, L.; Su, Z.; Zheng, K.; Zhang, X.; Tian, X. An efficient approach for constructing 3-D boron nitride networks with epoxy composites to form materials with enhanced thermal, dielectric, and mechanical properties. High Performance Polymers 2019, 31, 350–358. [Google Scholar] [CrossRef]
- Jung, D.W.; Kim, J.M.; Yoon, H.W.; Nam, K.M.; Kwon, Y.E.; Jeong, S.; Baek, Y.H.; Choi, Y.S.; Chang, S.J.; Yi, G.R.; et al. Solution-processable thermally conductive polymer composite adhesives of benzyl-alcohol-modified boron nitride two-dimensional nanoplates. Chemical Engineering Journal 2019, 361, 783–791. [Google Scholar] [CrossRef]
- Xu, Q.; Chen, Z.; Li, X.; Hu, J.; Liao, Y.; Liu, Y.; Li, L.; Wei, S.; Li, Z. Improved out-of-plane thermal conductivity of boron nitride nanosheet-filled polyamide 6/polyethylene terephthalate composites by a rapid solidification method. Materials Advances 2023, 4, 1490–1501. [Google Scholar] [CrossRef]
- Zhao, N.; Li, J.; Wang, W.; Gao, W.; Bai, H. Isotropically Ultrahigh Thermal Conductive Polymer Composites by Assembling Anisotropic Boron Nitride Nanosheets into a Biaxially Oriented Network. ACS Nano 2022, 16, 18959–18967. [Google Scholar] [CrossRef]
- Zhan, K.; Chen, Y.; Xiong, Z.; et al. Low thermal contact resistance boron nitride nanosheets composites enabled by interfacial arc-like phonon bridge. Nature Communications 2024, 15, 2905. [Google Scholar] [CrossRef]
- Chen, X.; Lim, J.; Yan, W.; Guo, F.; Liang, Y.; Chen, H.; Lambourne, A.; Hu, X. Salt template assisted BN scaffold fabrication toward highly thermally conductive epoxy composites. ACS Applied Materials & Interfaces 2020, 12, 16987–16996. [Google Scholar] [CrossRef] [PubMed]
- Pan, D.; Li, Q.; Zhang, W.; Dong, J.; Su, F.; Murugadoss, V.; Liu, Y.; Liu, C.; Naik, N.; Guo, Z. Highly thermal conductive epoxy nanocomposites filled with 3D BN/C spatial network prepared by salt template assisted method. Composites Part B: Engineering 2021, 209, 108609. [Google Scholar] [CrossRef]
- Zhou, Y.; Wang, Y.; Li, M.; et al. Ultra-high thermal conductivity multifunctional composites with uniaxially oriented boron nitride sheets for future wireless charging technology. Advanced Composites and Hybrid Materials 2025, 8, 237. [Google Scholar] [CrossRef]
- Yu, C.; Gong, W.; Tian, W.; Zhang, Q.; Xu, Y.; Lin, Z.; Hu, M.; Fan, X.; Yao, Y. Hot-pressing induced alignment of boron nitride in polyurethane for composite films with thermal conductivity over 50 W/mK. Composites Science and Technology 2018, 160, 199–207. [Google Scholar] [CrossRef]
- Ravichandran, V.; Chandrashekar, A.; Prabhu, T.N.; Varrla, E. SPI-modified h-BN nanosheets-based thermal interface materials for thermal management applications. ACS Applied Materials & Interfaces 2024, 16, 34367–34376. [Google Scholar] [CrossRef]
- Liu, Z.; Wang, B.; Chen, S.; Li, P. Lithium-ion battery pack thermal management under high ambient temperature and cyclic charging-discharging strategy design. Journal of Energy Storage 2024, 80, 110391. [Google Scholar] [CrossRef]
- Mahmood, A.; Cockerill, T.; de Boer, G.; Voss, J.; Thompson, H. Heat Transfer Modeling and Optimal Thermal Management of Electric Vehicle Battery Systems. Energies 2024, 17, 4575. [Google Scholar] [CrossRef]
- Smith, K.; Wang, C.Y. Power and thermal characterization of a lithium-ion battery pack for hybrid-electric vehicles. Journal of power sources 2006, 160, 662–673. [Google Scholar] [CrossRef]
- Cai, L.; White, R.E. Mathematical modeling of a lithium ion battery with thermal effects in COMSOL Inc. Multiphysics (MP) software. Journal of Power Sources 2011, 196, 5985–5989. [Google Scholar] [CrossRef]
- Srinivasan, V.; Wang, C.Y. Analysis of electrochemical and thermal behavior of Li-ion cells. Journal of The Electrochemical Society 2002, 150, A98. [Google Scholar] [CrossRef]
- Weragoda, D.M.; Tian, G.; Burkitbayev, A.; Lo, K.H.; Zhang, T. A comprehensive review on heat pipe based battery thermal management systems. Applied thermal engineering 2023, 224, 120070. [Google Scholar] [CrossRef]
Figure 1.
(a) Thermogravimetric analysis (TGA) showing the weight loss (%) as a function of temperature for different polymer composites: neat PLA, graphene-PLA (GPLA), neat TPU, 20 wt.% BN + 80 wt.% TPU, and 40 wt.% BN + 60 wt.% TPU. All measurements on composite samples represent the average of three measurements presented along with corresponding error bars. PLA and GPLA exhibit sharp degradation around 350–400 °C, while TPU and BN-TPU composites show enhanced thermal stability, with the 40 wt.% BN composite exhibiting the highest residue at 600 °C. (b) Thermal diffusivity as a function of temperature from 25 °C to 70 °C for the same samples. The addition of BN significantly enhances thermal diffusivity, with 40 wt.% BN + 60 wt.% TPU reaching values above cm2/s, much higher than neat PLA and TPU, indicating the effectiveness of BN as a thermally conductive filler.
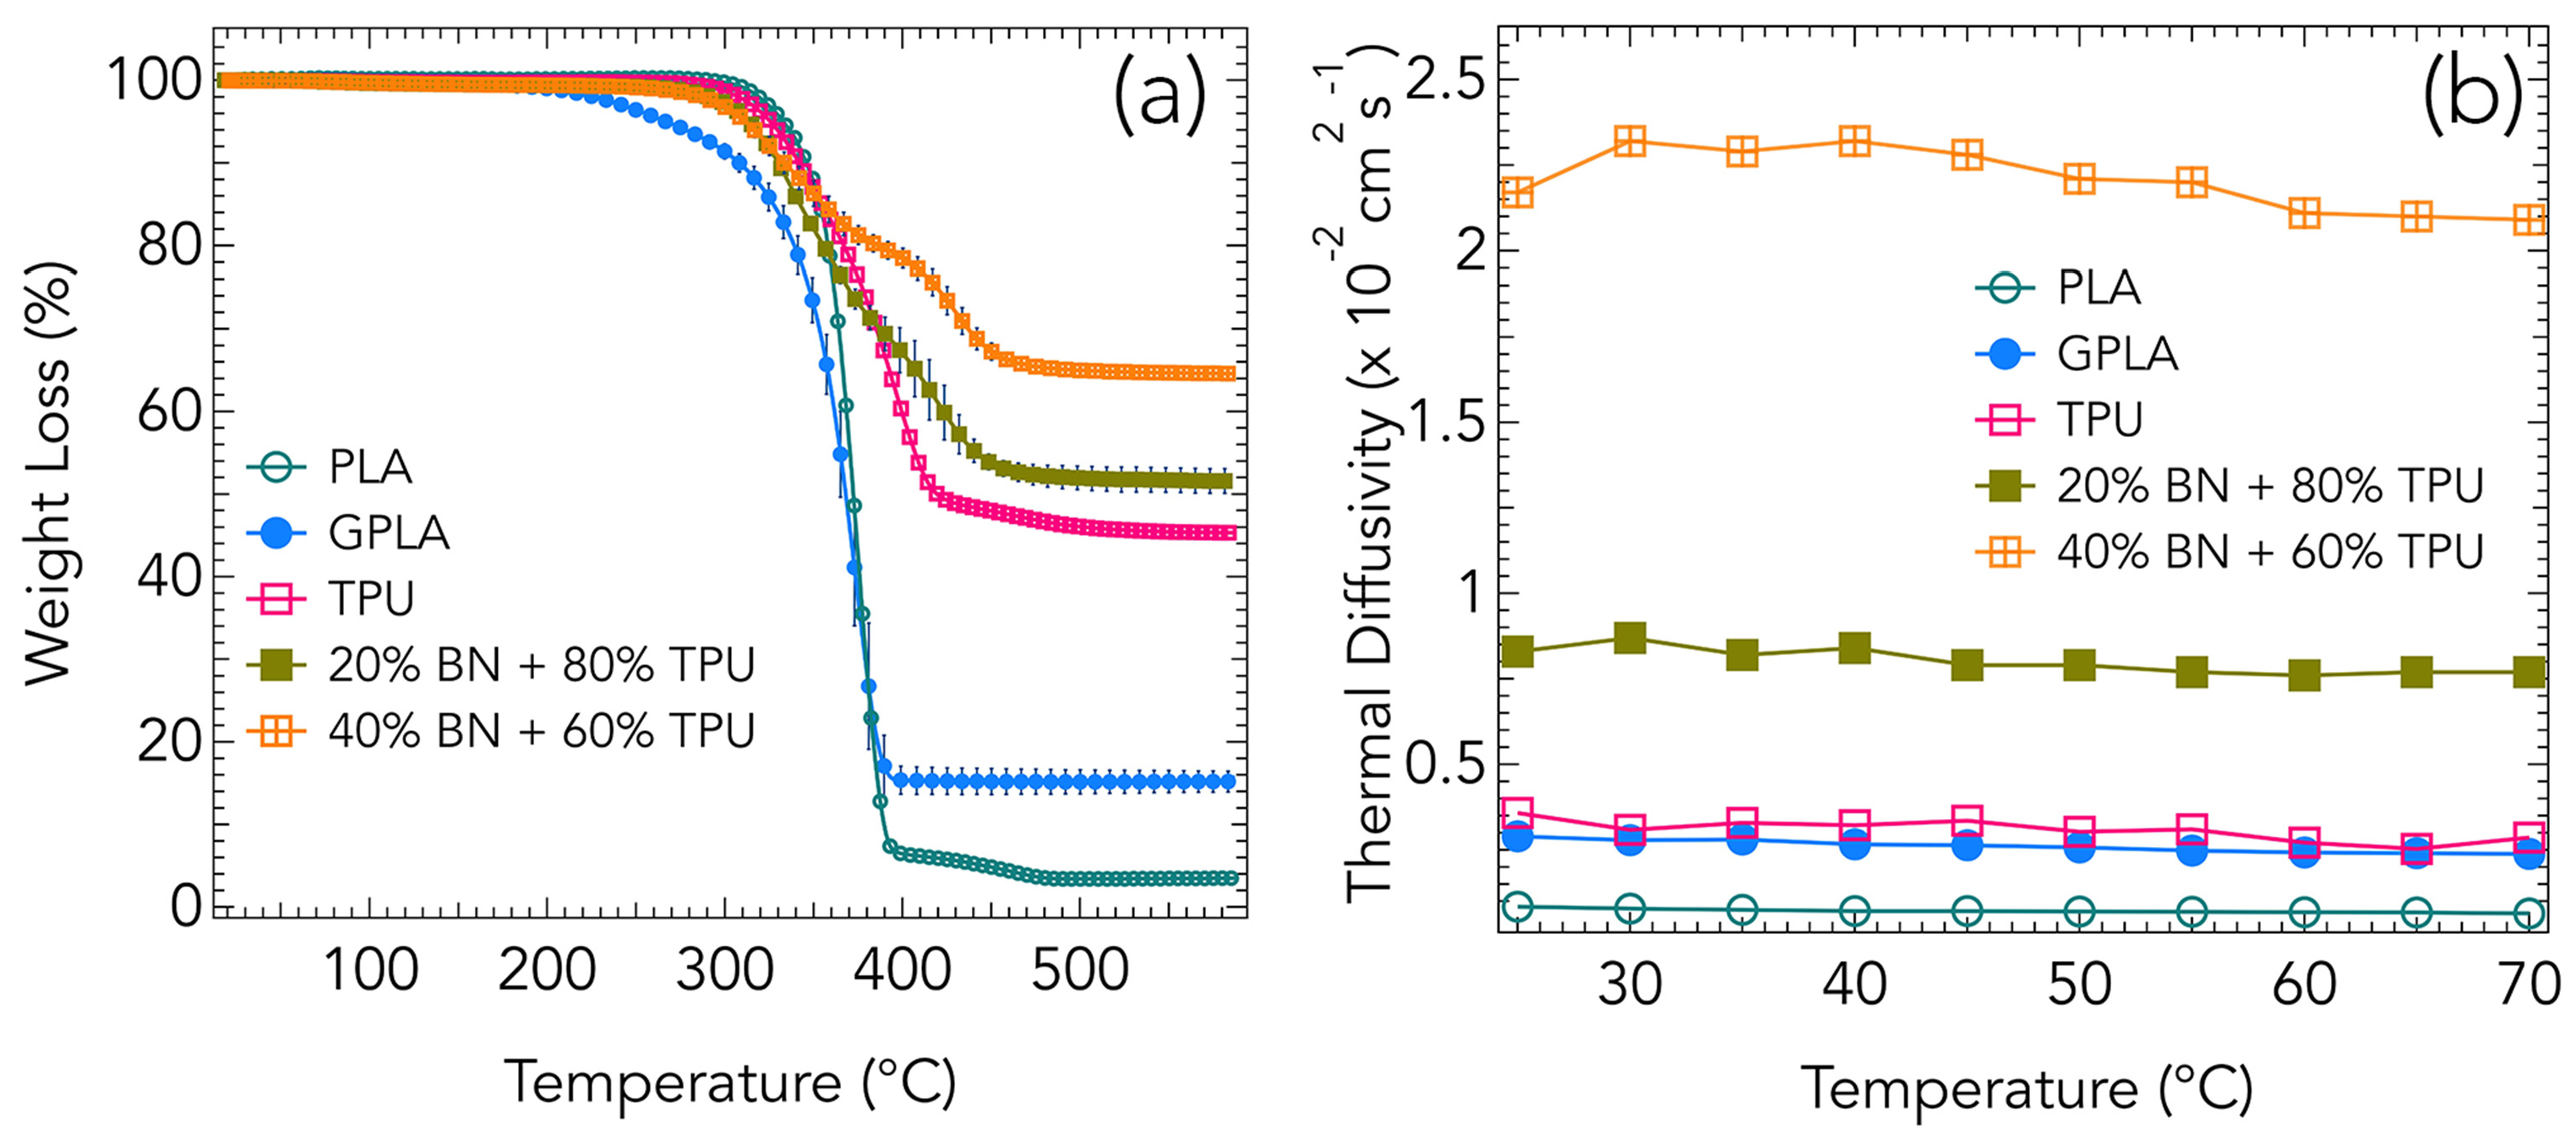
Figure 2.
(a) A 6-cell (3s2p) cylindrical Li-ion battery module integrated with thermal interface materials (TIMs) and an aluminum cooling plate for thermal performance evaluation. The inset shows the electrical wiring of the battery pack. (b) A representative photograph of PLA and TPU polymer composites used as TIMs. (c) Infrared (IR) thermal image of the battery module with TIMs under operation, showing thermal gradients with initial heat concentrated at the bottom of the cells. (d) IR thermal image of the battery module after 30 minutes showing heat distributed across the entire body of 18650 cells. Thermal imaging was conducted using a FLIR camera, with the temperature range set from 20 °C to 70 °C.
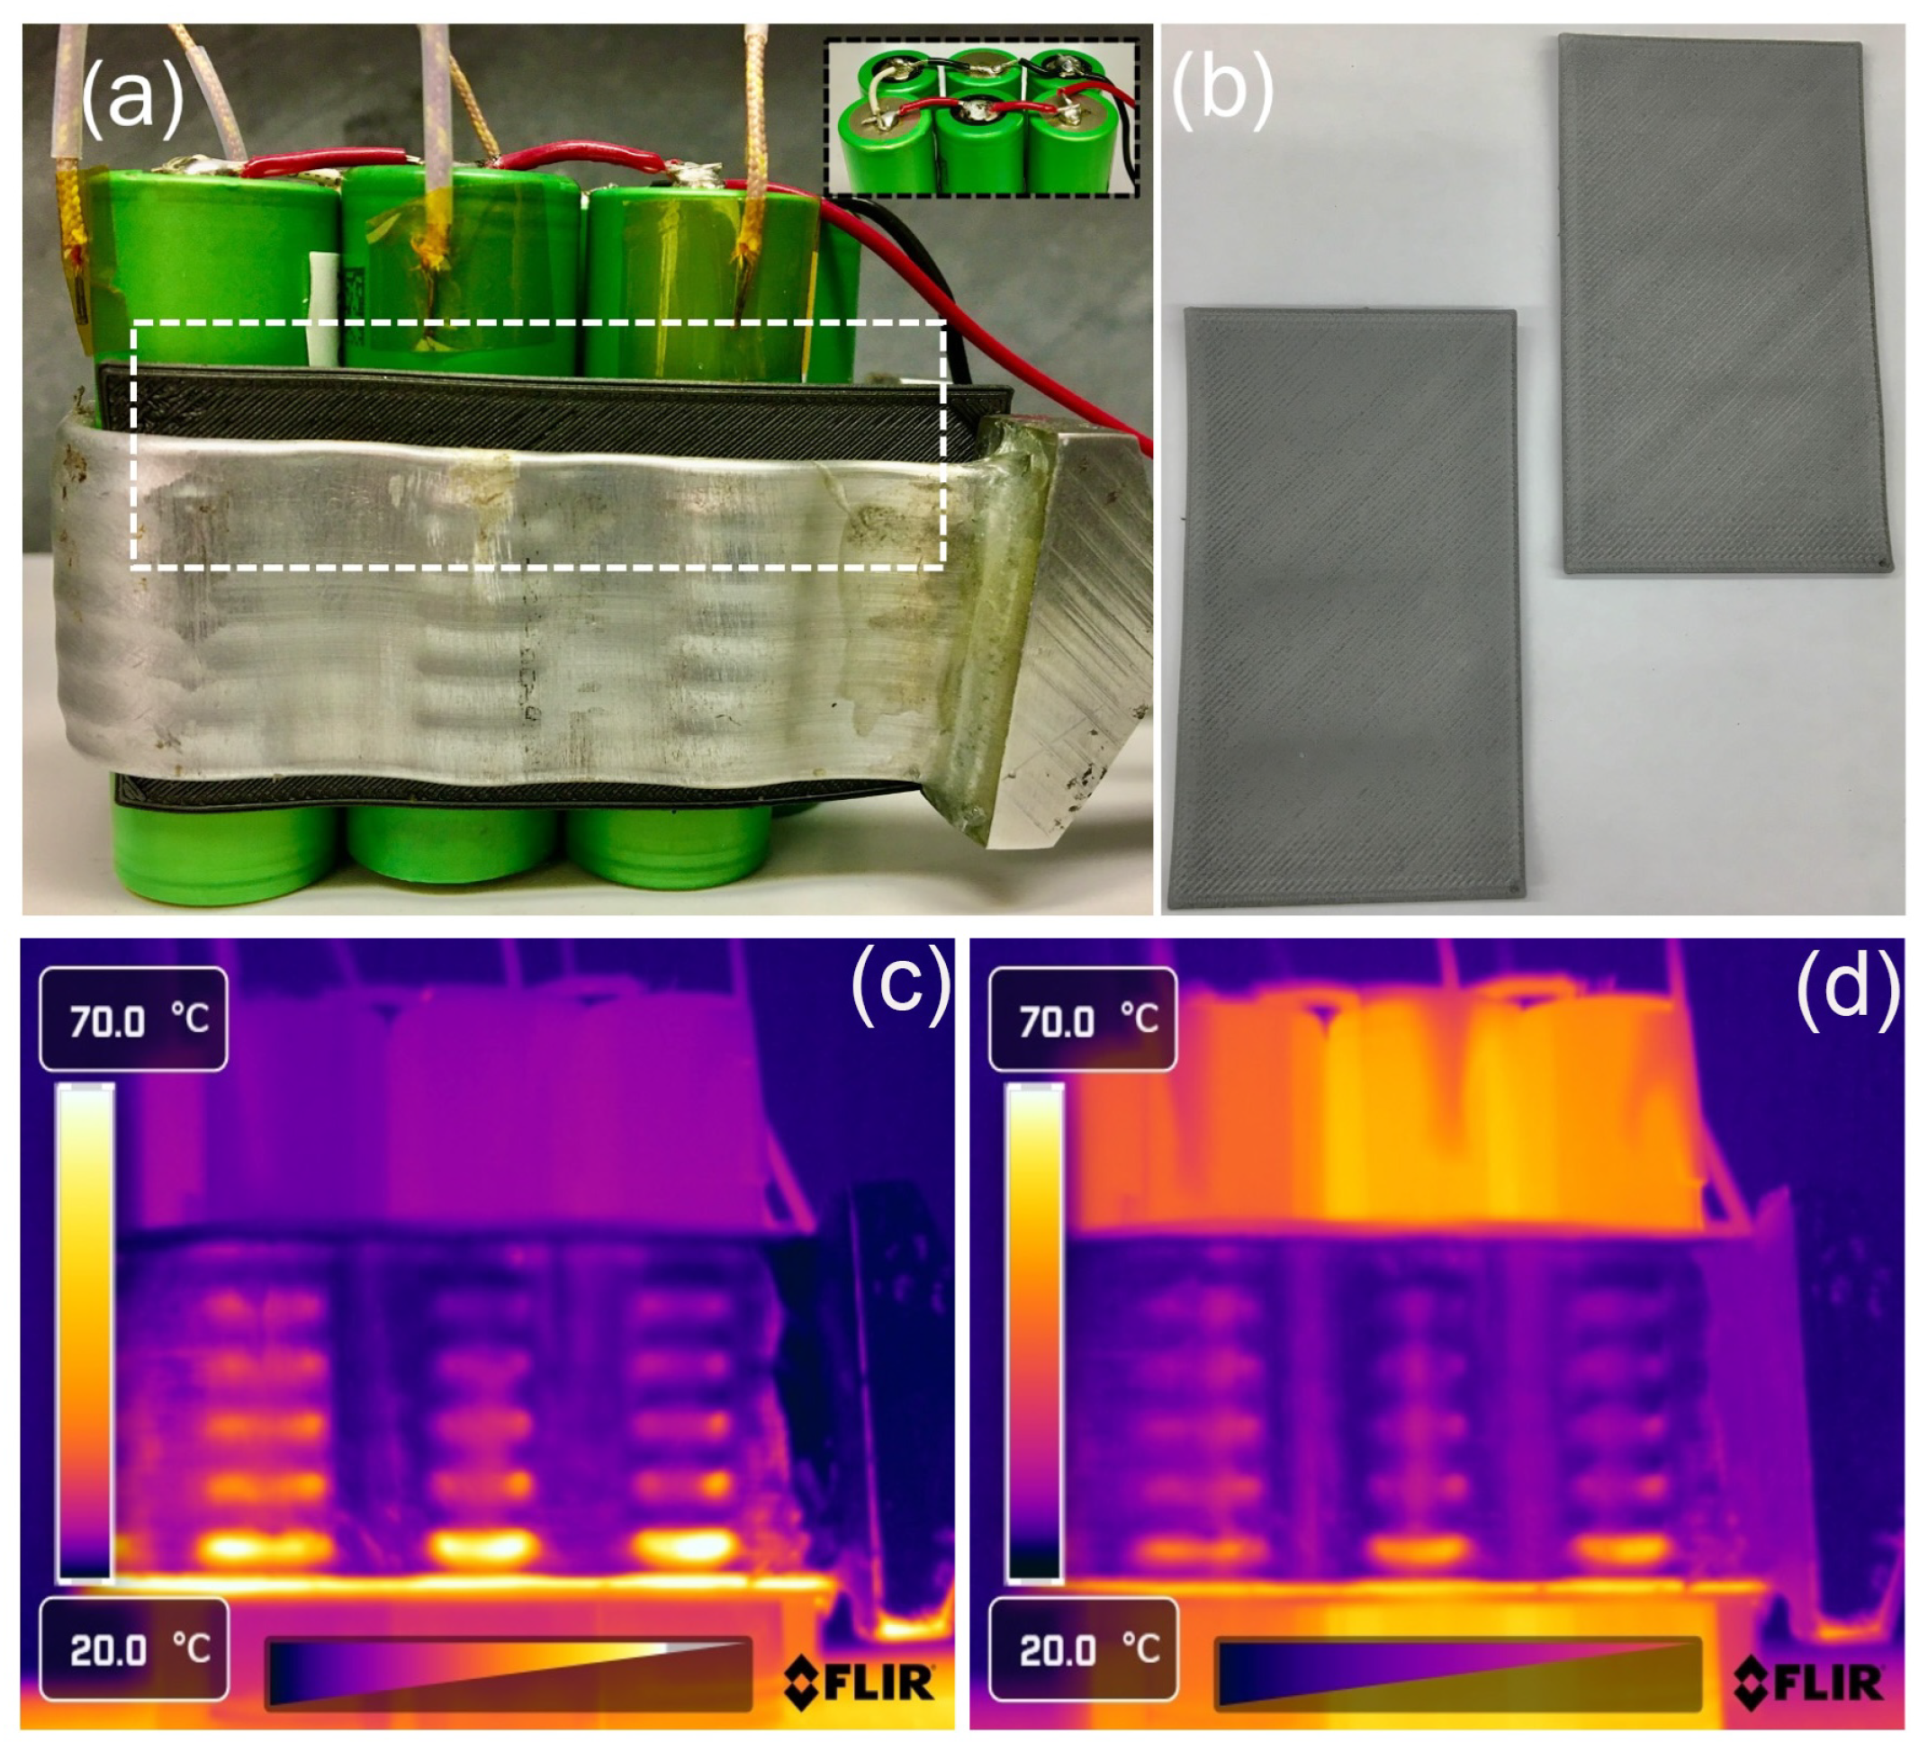
Figure 3.
(a) Temperature profiles of six individual battery cells within a module equipped with a PLA thermal pad during a heating-cooling cycle. All cells show consistent temperature rise and fall, with slight variations among them. (b) Average temperature profile of the battery module with clear distinction between heating and cooling phases, with the switching point around 2200 s. (c) Temperature deviation () from the average for individual batteries over time, indicating thermal non-uniformity within the module during operation. (d) Correlation between thermal time constant and thermal diffusivity of different TIM materials. The inset shows a linear fit of versus inverse thermal diffusivity, confirming expected thermal transport behavior. Higher diffusivity materials lead to faster heat dissipation and lower values.
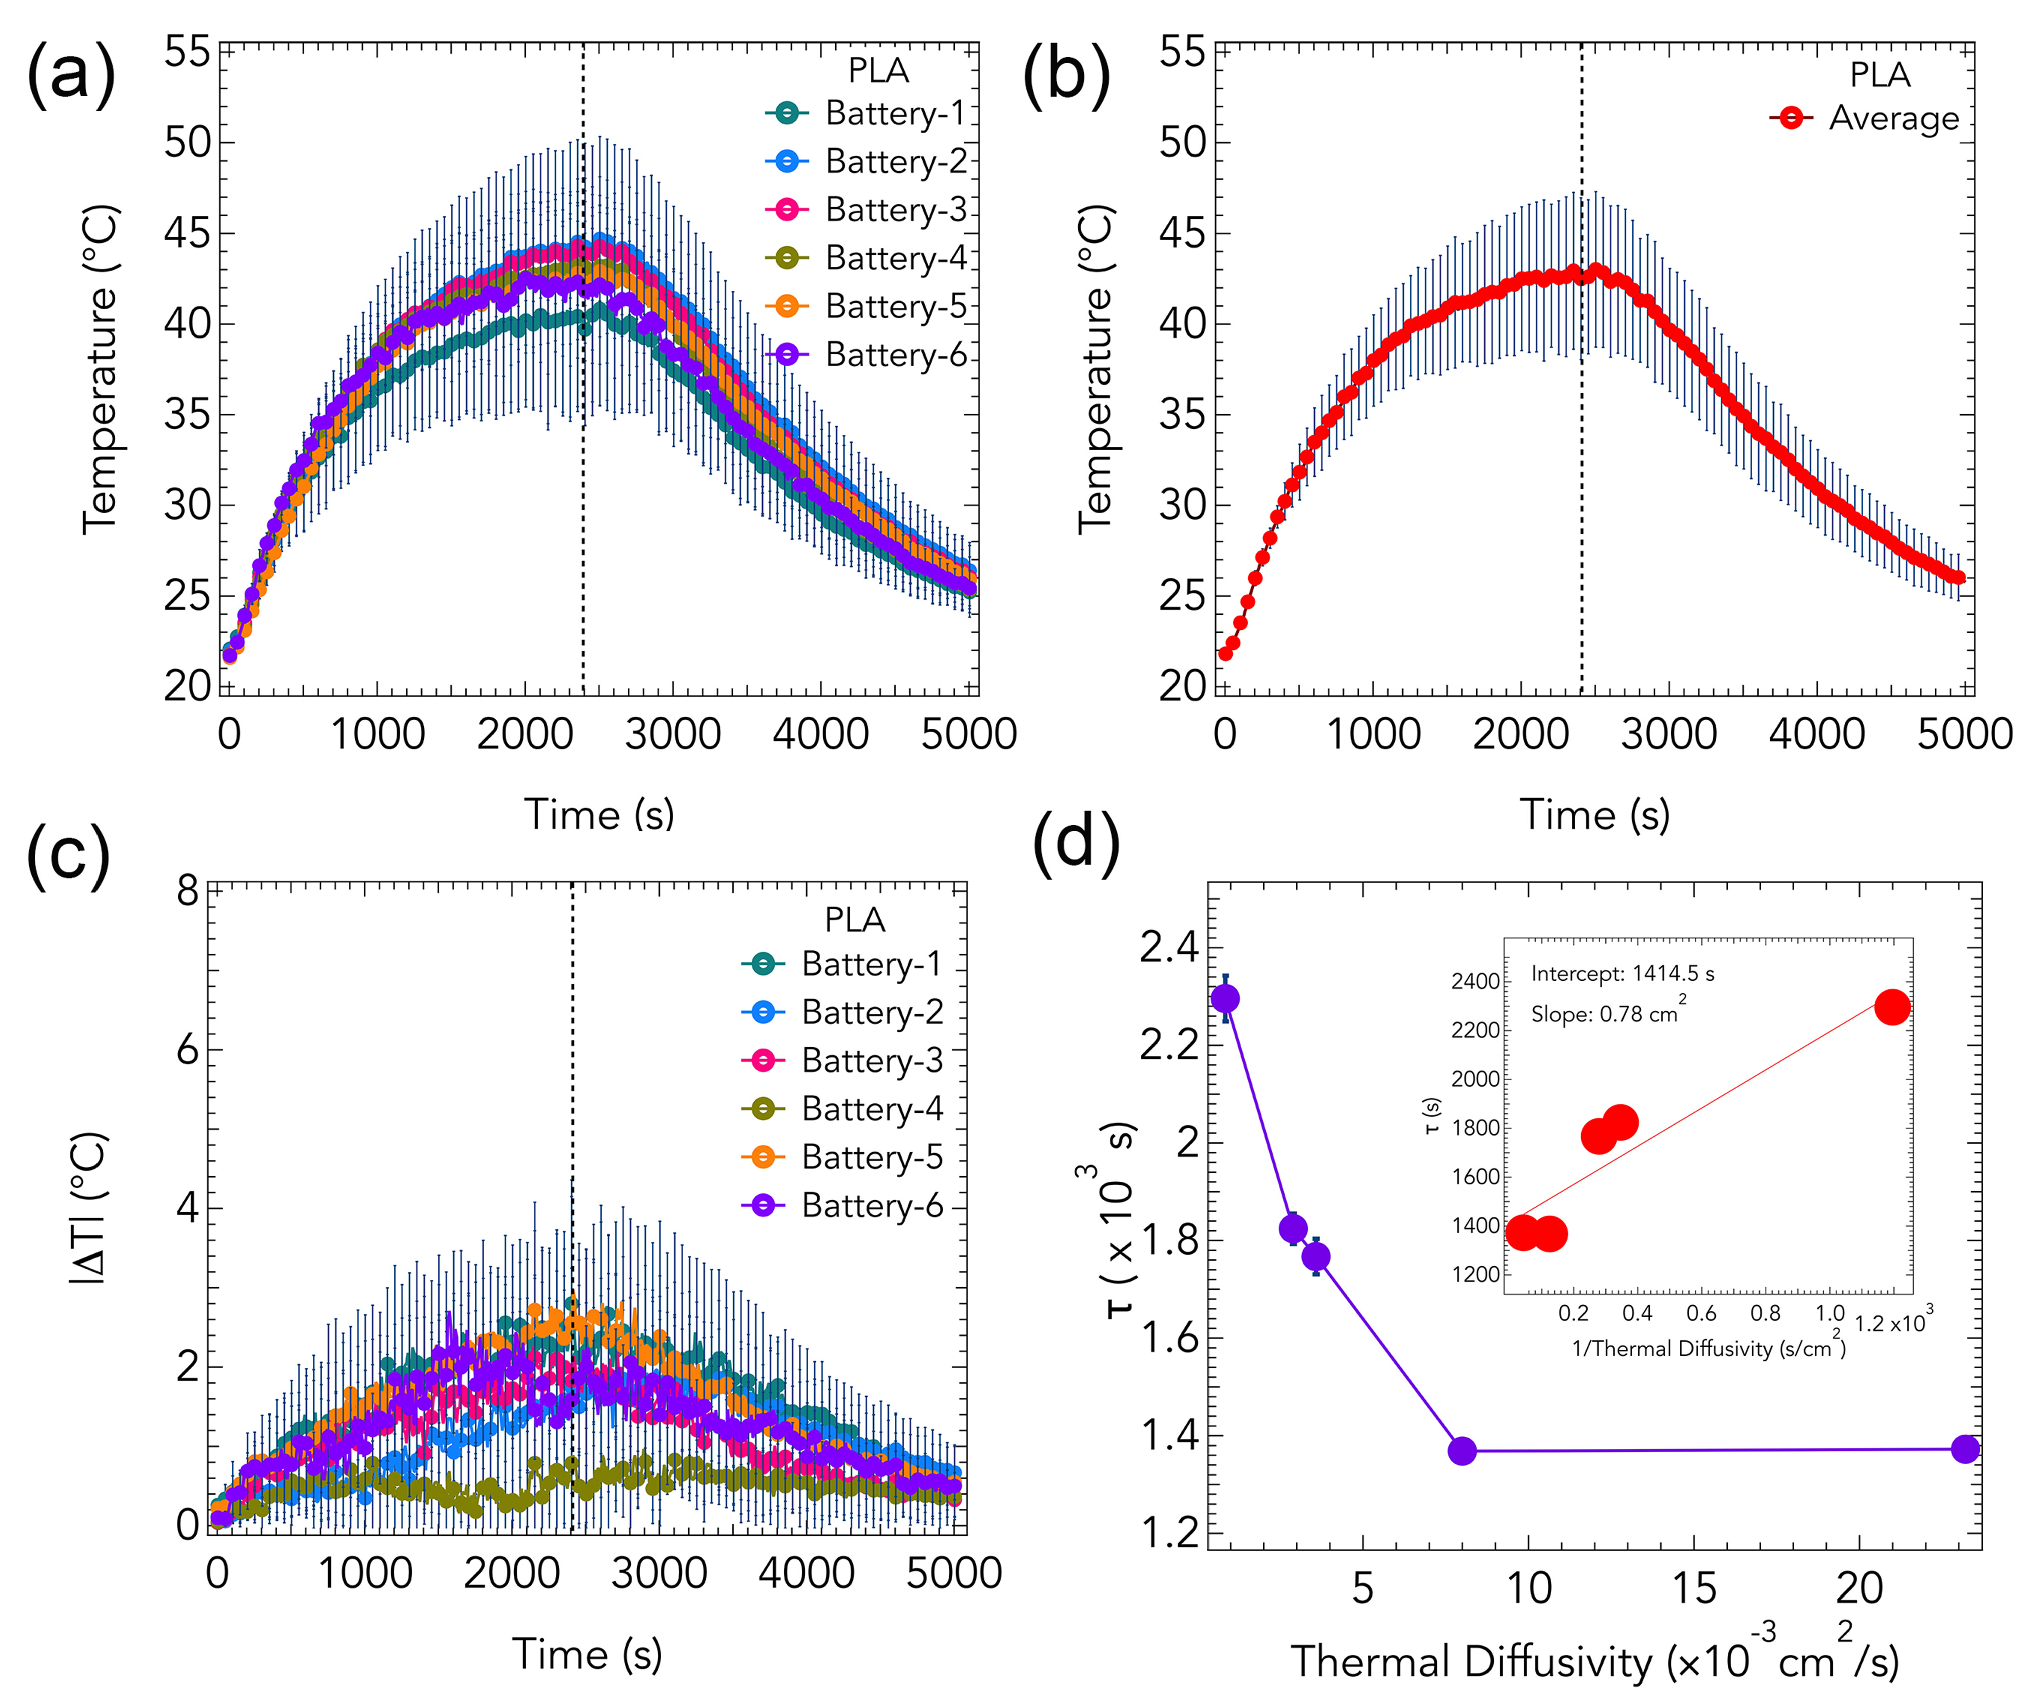
Figure 4.
Inter-cell temperature deviation as a function of time for six battery cells using different thermal interface materials (TIMs): (a) PLA, (b) graphene–PLA, (c) TPU, (d) 20%BN–80%TPU, and (e) 40%BN–60%TPU. Each curve represents the temperature deviation of an individual cell relative to the instantaneous module-average temperature during a controlled heating–cooling cycle. The temporal evolution and spread of reveal the extent of lateral thermal nonuniformity. Panel (f) shows the peak , averaged across all six cells, plotted against the corresponding thermal diffusivity of each TIM. Error bars denote standard deviation from multiple trials. A downward trend is observed, with a marked reduction in at higher thermal diffusivities ( cm2/s), suggesting a threshold for effective lateral heat spreading.
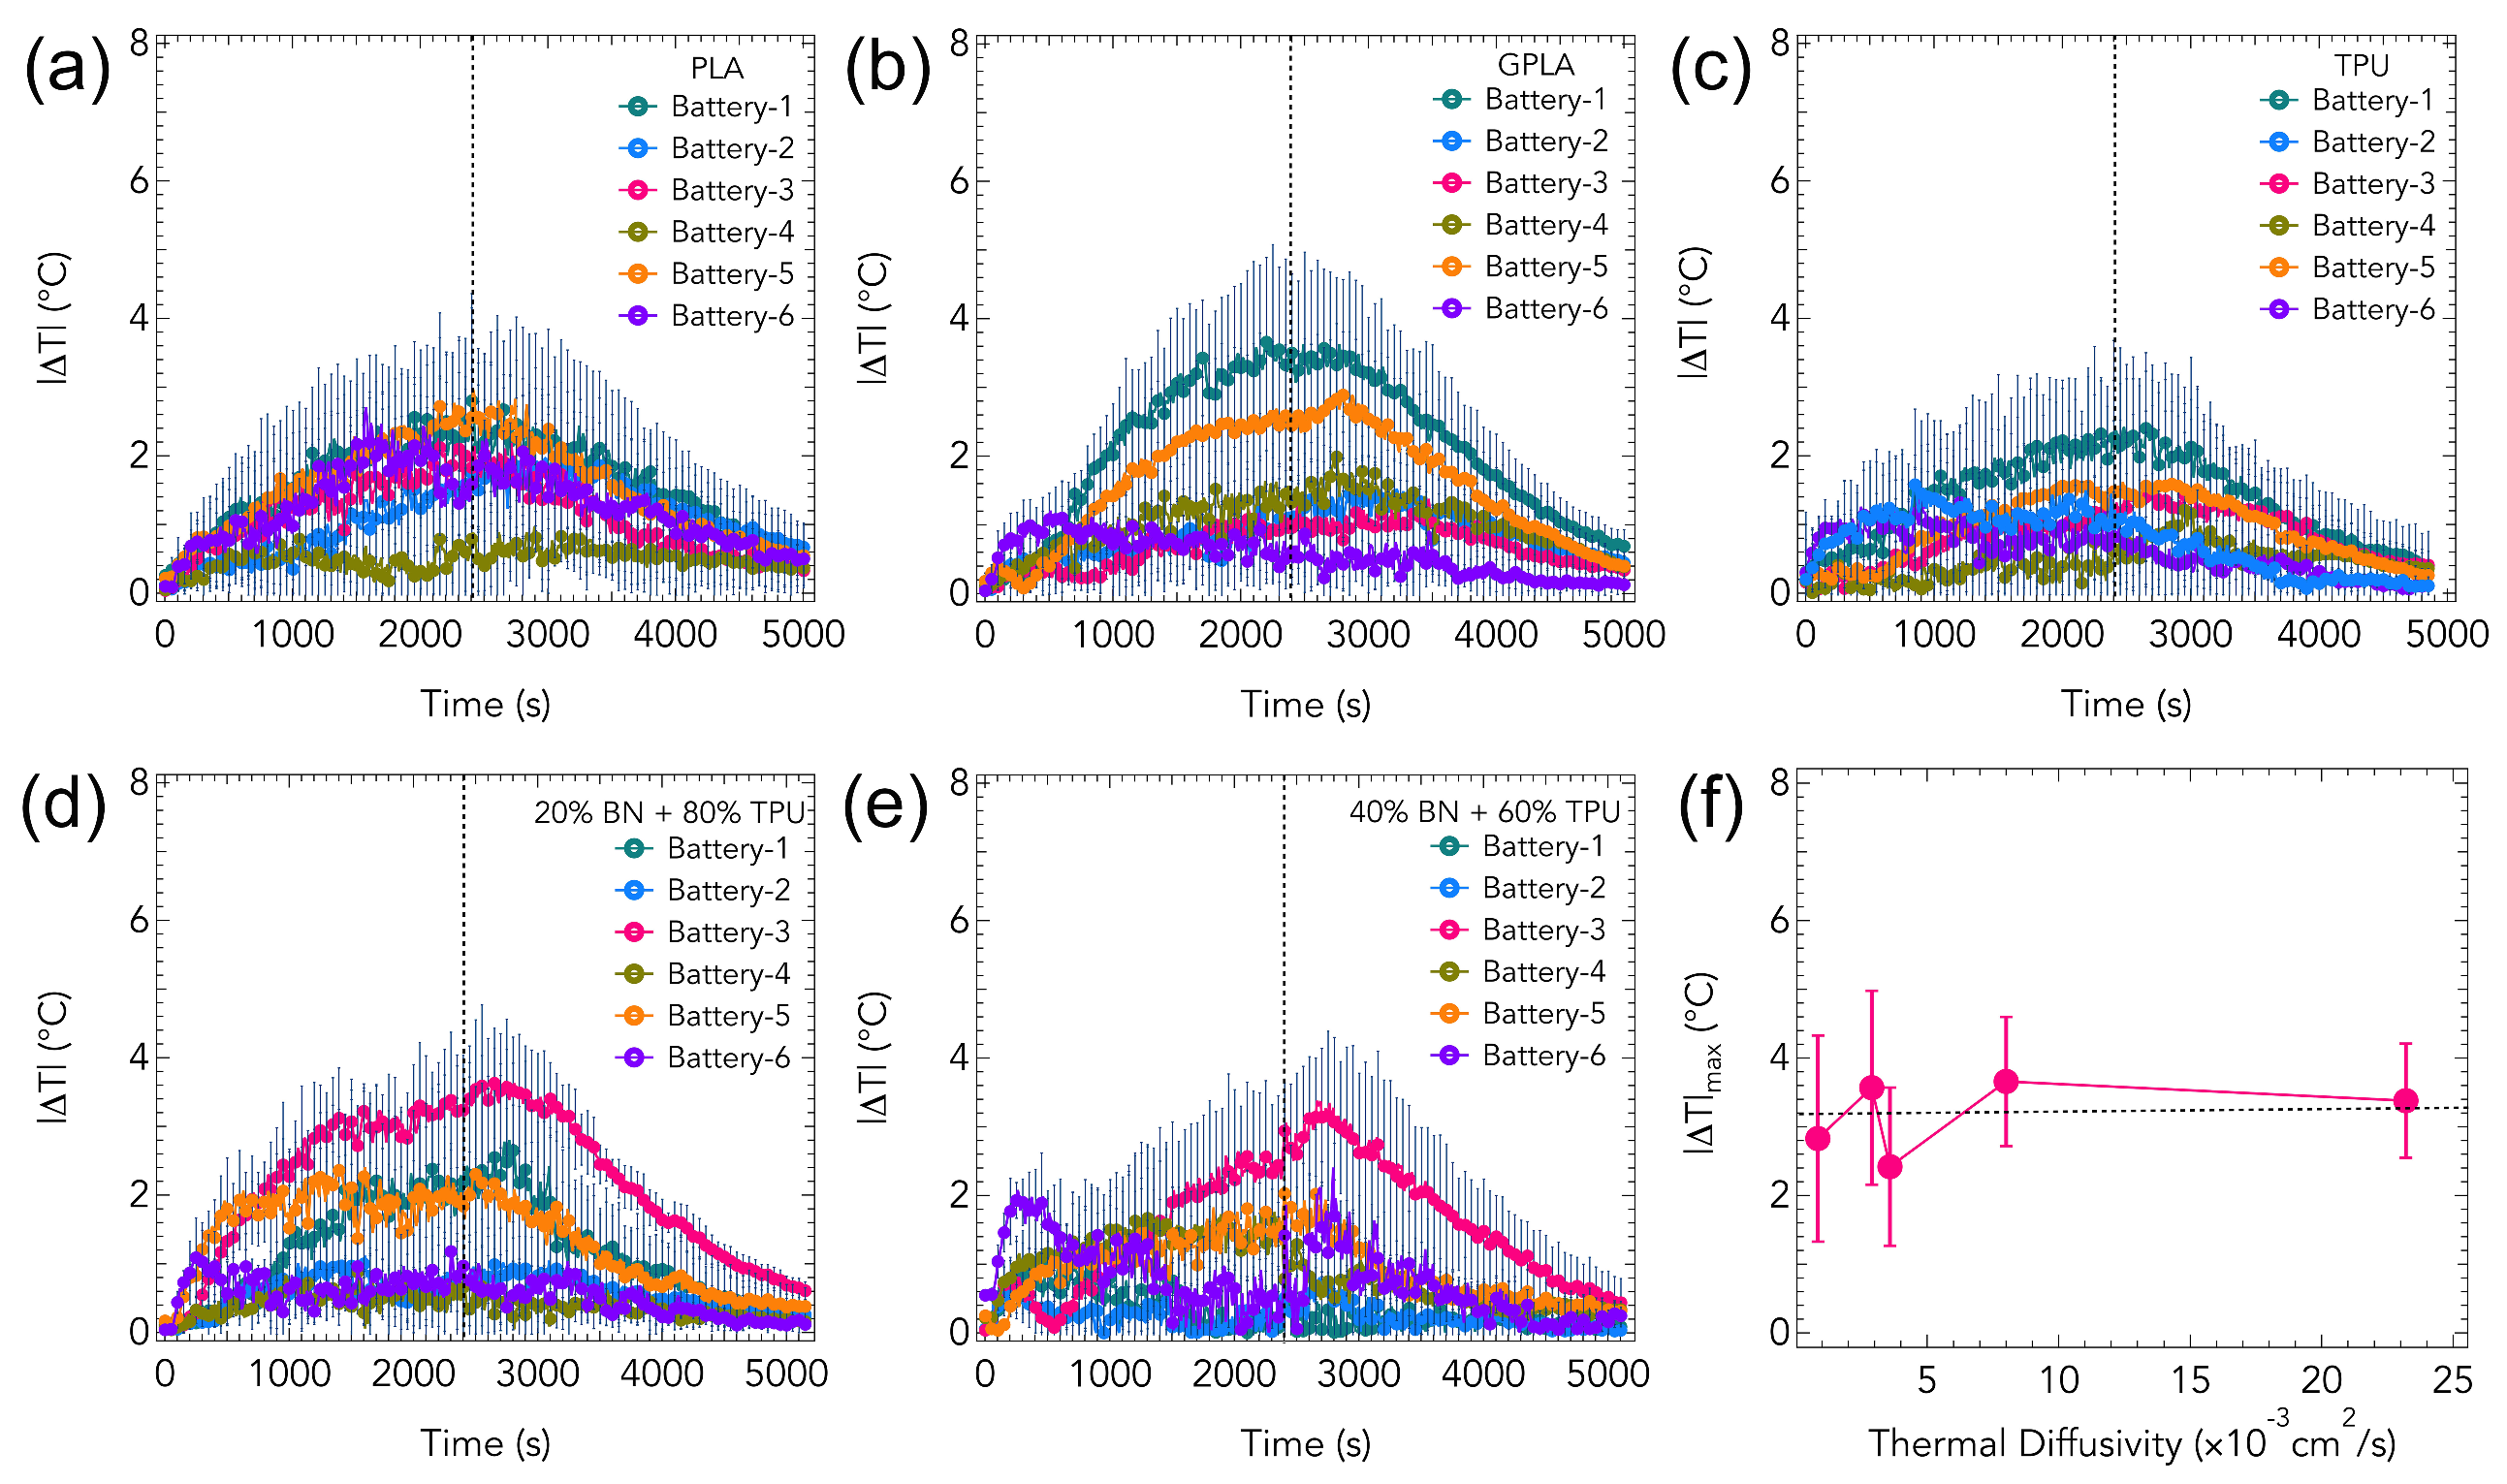
Figure 5.
3D temperature mapping on the 6 cell module captured at a) 900 s (i.e., the end of the first charge discharge) evaluated at 8C with PLA as the TIM material. The temperature profiles at the end of 10th cycle for different TIM materials, b) PLA, c) GPLA, d) TPU e) 20% BN-TPU and f) 40% BN-TPU.
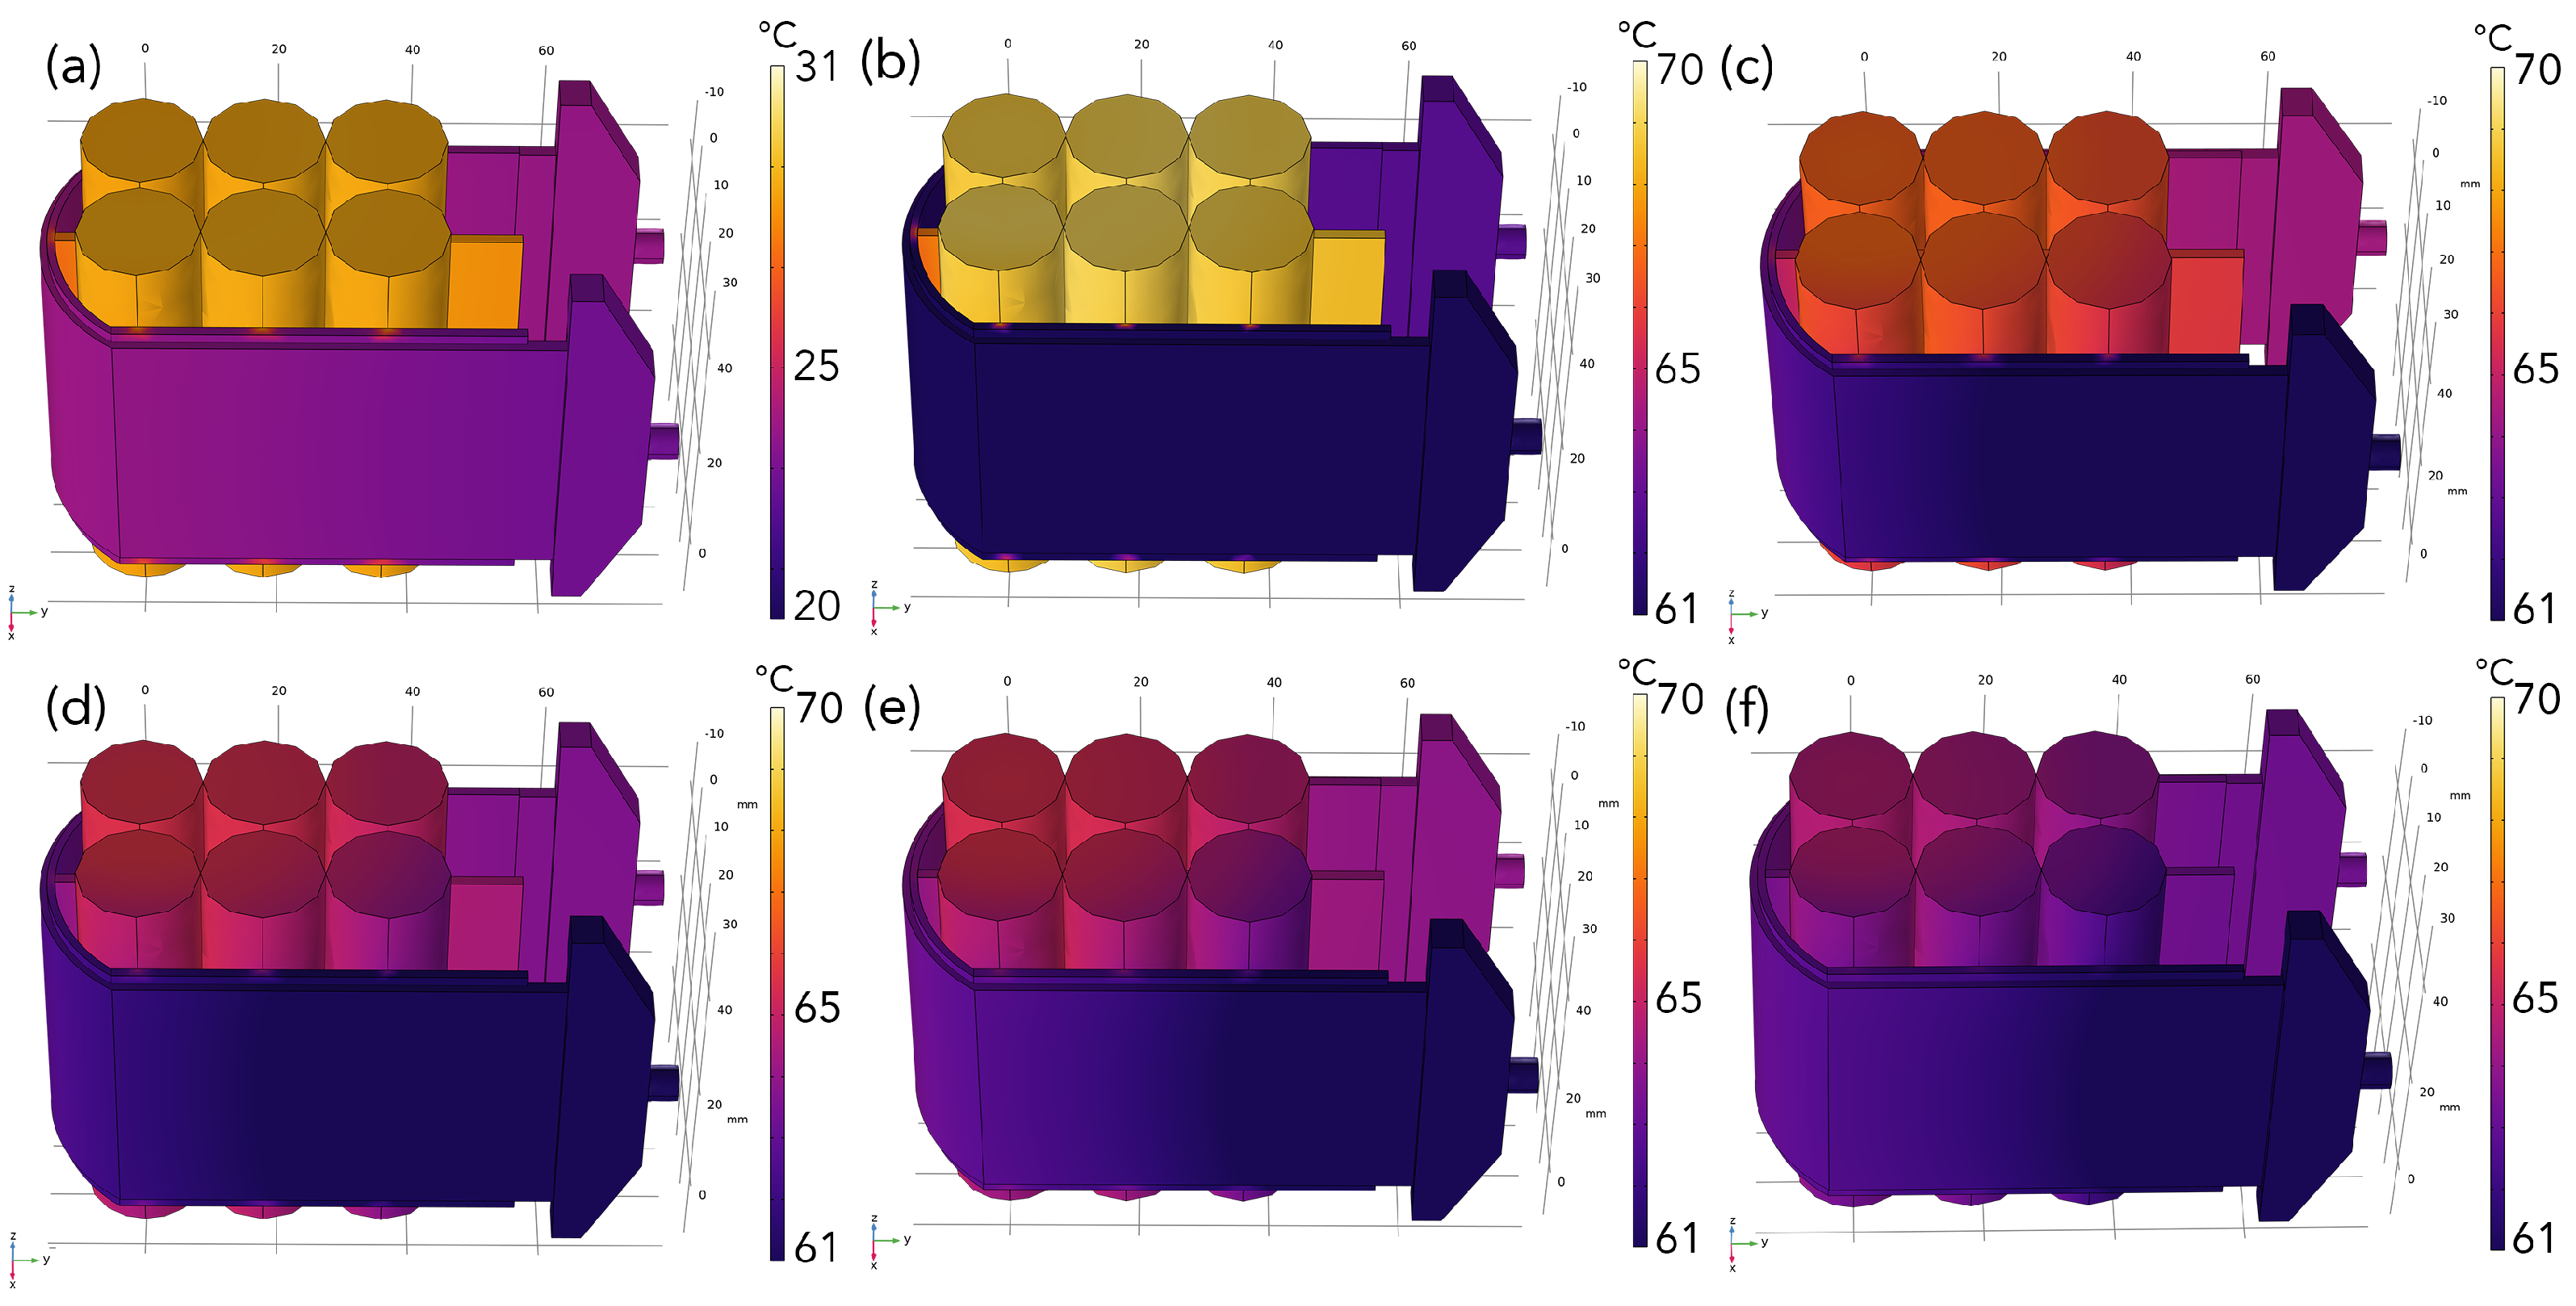
Figure 6.
The average temperature profile measured across six individual battery cells within a module equipped with different TIM materials during charge-discharge cycles at a) 1C, b) 2C c) 4C and d) 8C rates. PLA, GPLA, TPU, 20% BN-TPU and 40% BN-TPU were used as different TIM while TPU was employed to isolate batteries in between. All models were solved for 10 continuous cycles (individual charge-discharge), followed by a 2.5-hour cooling period. PLA (40% BN-TPU)showed the maximum (minimum) T, with all materials exhibiting a thermal staircase rise in dT with increasing C-rate.
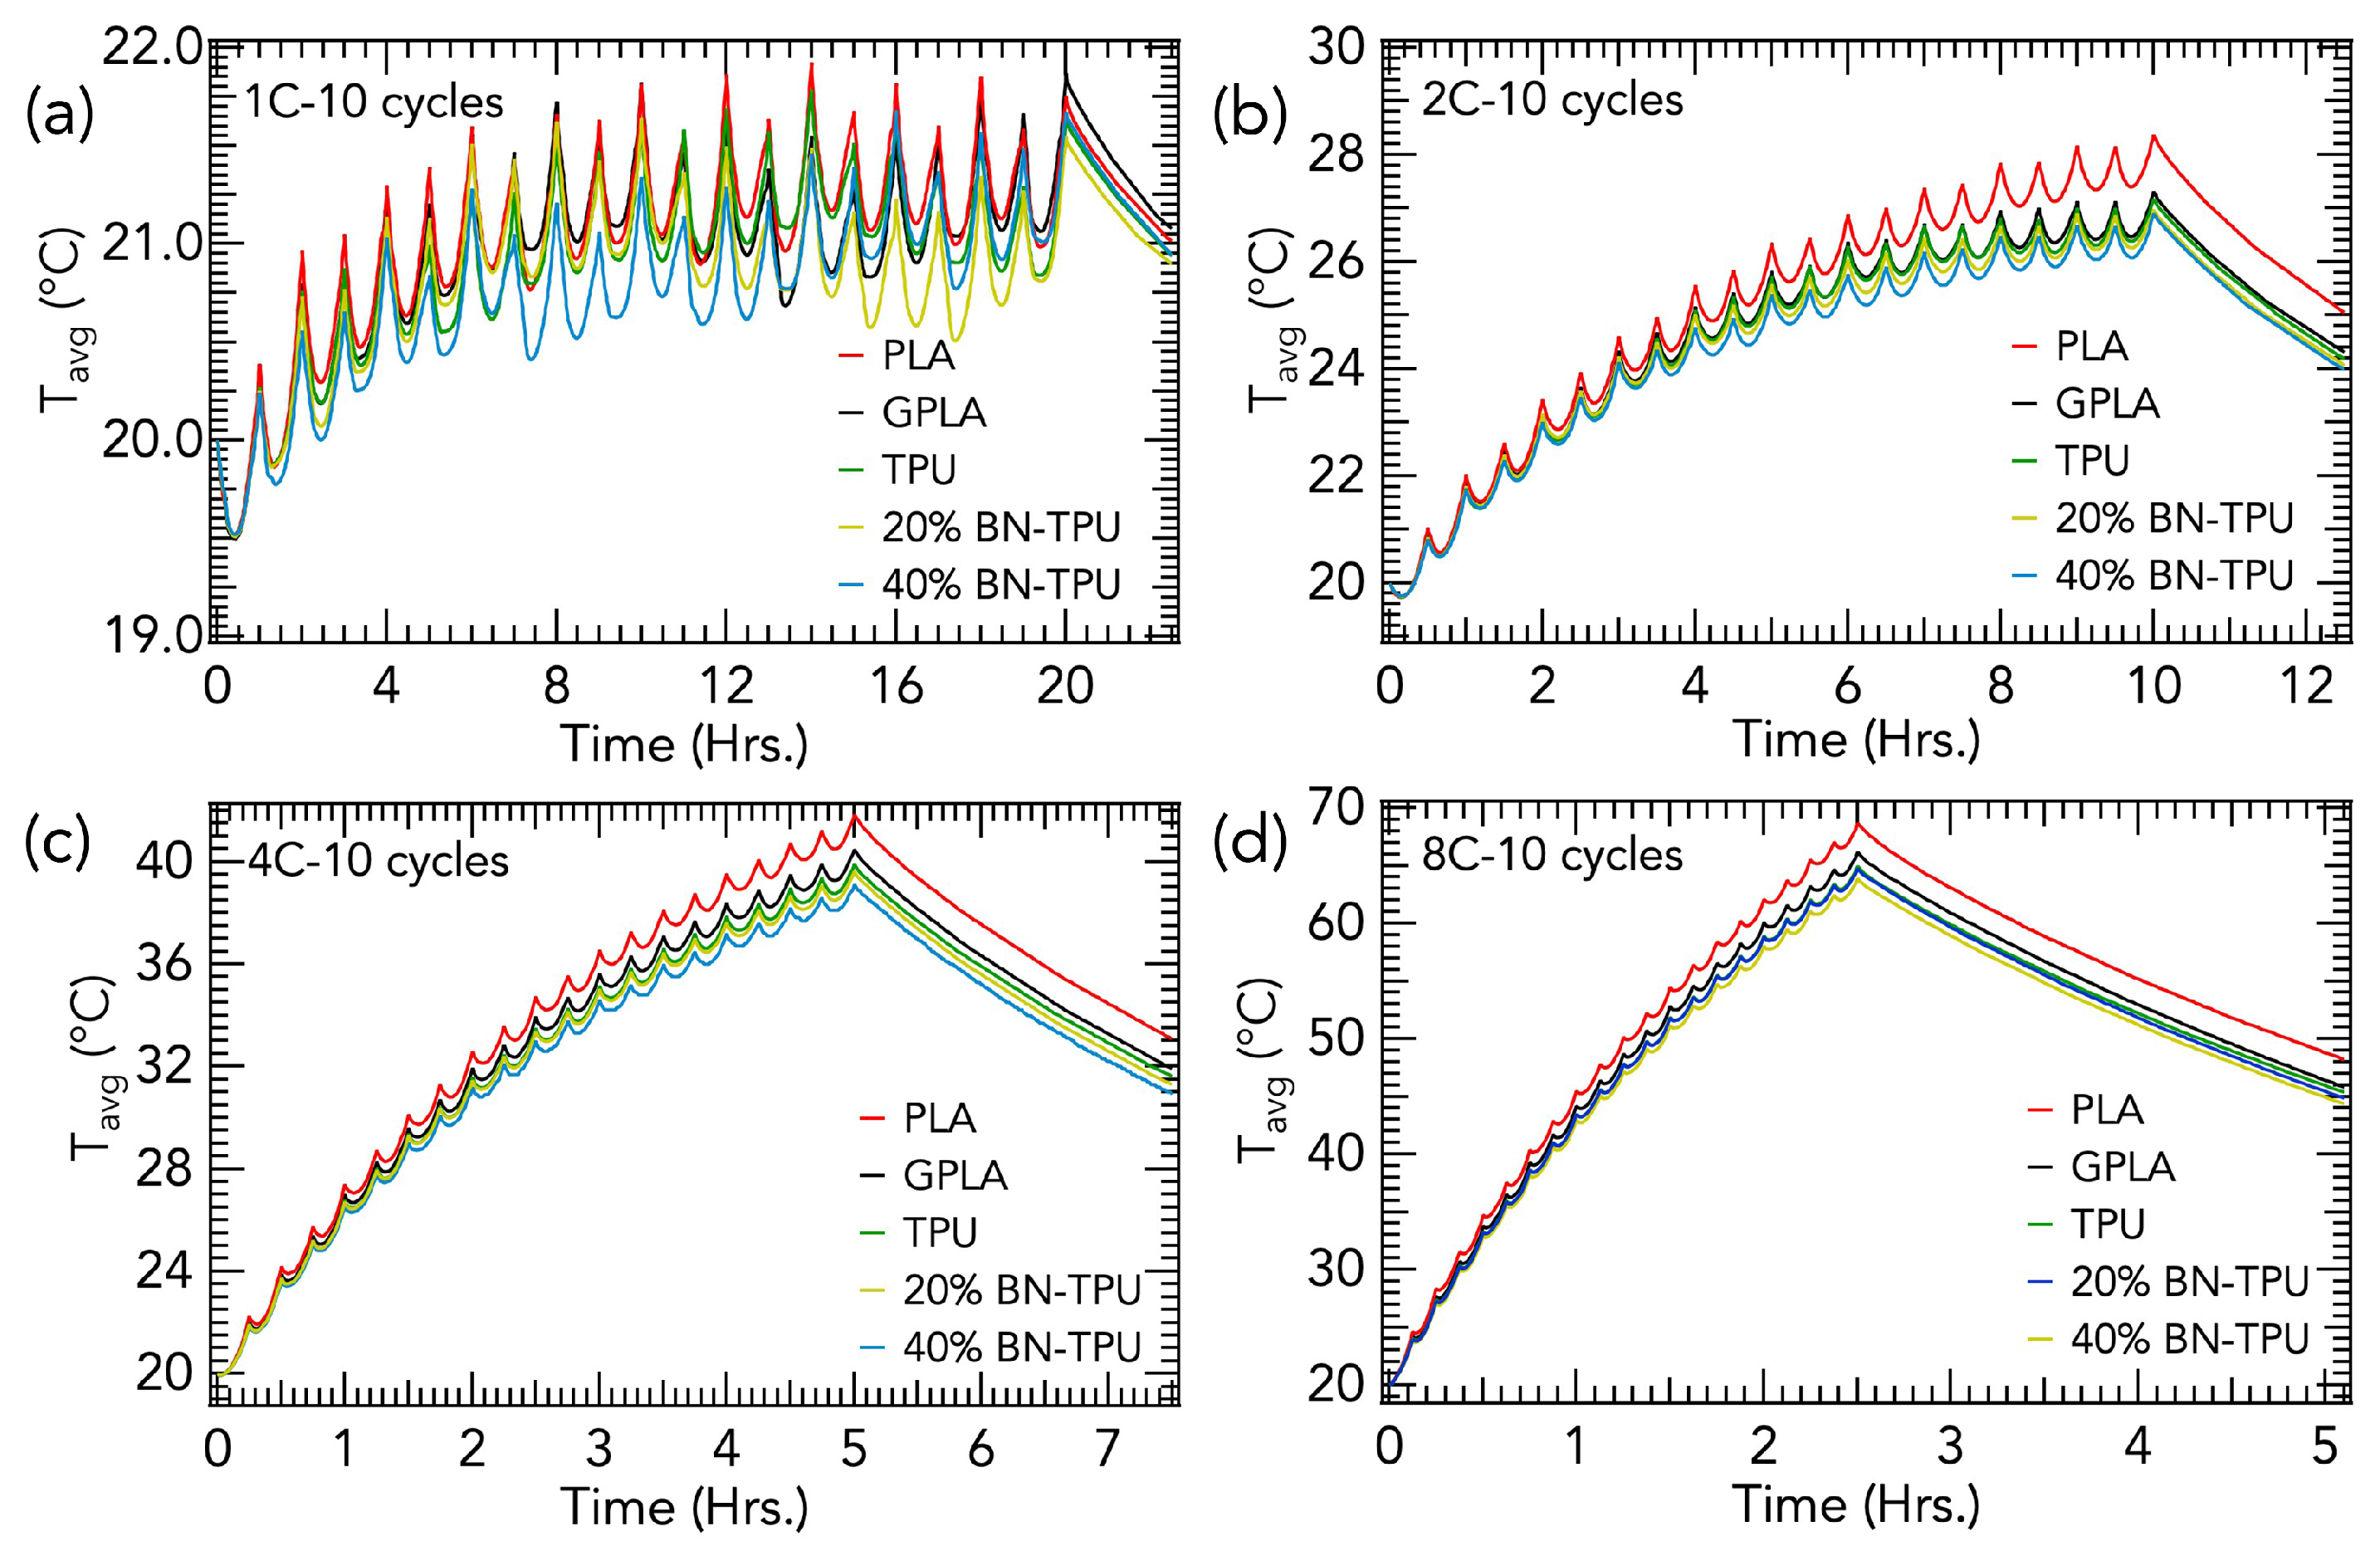
Figure 7.
a) The average temperature as a function of the C-rate for different TIMs. (b)The average temperature deviation () across the batteries within the module during charge-discharge cycles when operated at a) 1C, b) 2C, c) 4C and d) 8C. A clear non-uniformity in the temeprature distribution was observed at all C-rates with significant dependence on the TIM material used. e) Average temperature rise (=) in the battery pack as a function of C-rate, where i=1,2...,6
Disclaimer/Publisher’s Note: The statements, opinions and data contained in all publications are solely those of the individual author(s) and contributor(s) and not of MDPI and/or the editor(s). MDPI and/or the editor(s) disclaim responsibility for any injury to people or property resulting from any ideas, methods, instructions or products referred to in the content. |
© 2025 by the authors. Licensee MDPI, Basel, Switzerland. This article is an open access article distributed under the terms and conditions of the Creative Commons Attribution (CC BY) license (http://creativecommons.org/licenses/by/4.0/).
Copyright: This open access article is published under a Creative Commons CC BY 4.0 license, which permit the free download, distribution, and reuse, provided that the author and preprint are cited in any reuse.


