
Submitted:
09 October 2025
Posted:
10 October 2025
You are already at the latest version
Abstract
Background/Objectives: Salivary volatile organic compounds (VOCs) are promising noninvasive biomarkers for a wide range of diseases. While glandular saliva, secreted by salivary glands, is a relatively pure biofluid, whole saliva is a complex mixture containing oral microbiota, food debris, and desquamated epithelial cells. Therefore, a comprehensive comparison of the VOC profiles of these two types of saliva is essential to identify biologically relevant compounds. In this study, we aimed to establish a reliable method for VOC profiling from small saliva volumes and identify VOCs that reflect the biological differences between glandular and whole saliva. Methods: We developed a protocol combining MonoTrap extraction with dichloromethane, allowing the analysis of VOCs from just 100 µL of saliva. To address the issue of sampling-derived artifacts, we implemented a two-step blank analysis to systematically exclude compounds originating from the collection device. Results: Our analysis successfully identified 10 VOCs that were significantly higher in whole saliva than in glandular saliva and were confirmed not to be derived from the sampling devices. These compounds included isobutyric acid, isovaleric acid, 4-methylvaleric acid, 3-phenylpropionic acid, indole, skatole, methyl mercaptan, 1-propanol, d-valerolactam, and acetaldehyde. Most of these compounds originate from the metabolic activities of the oral microbiome, suggesting that the distinct VOC profile of whole saliva is predominantly influenced by microbial activity. Conclusions: Our findings demonstrated the effectiveness of this method for identifying biologically relevant VOCs from relatively small sample volumes. The identified VOC profiles highlight the potential of whole saliva as a valuable non-invasive tool for assessing oral health and serve as a solid foundation for future research into clinical applications.
Keywords:
saliva
; glandular saliva
; volatile compound
; VOC
; GC/MS
; MonoTrap
; oral microbiome
1. Introduction
Volatile organic compounds (VOCs) are diverse low-molecular-weight organic compounds produced during metabolic activities within the body. They are present in trace amounts in various biological samples, including breath, saliva, sweat, and blood [1]. VOC profiles in these clinical samples show promise as non-invasive biomarkers reflecting an individual’s health status and the presence of disease-specific metabolic abnormalities [2,3,4]. Among these, saliva is an ideal specimen as it can be collected without invasive procedures such as blood sampling, and the collection does not place a burden on the patient. However, VOCs in saliva are generally present at very low concentrations [5], and high-sensitivity analyses currently require large sample volumes. This not only compromises the advantages of non-invasive sampling but also hinders the analyses, particularly in cases where obtaining large sample volumes is difficult, such as with children, older adults, or patients with specific diseases. Therefore, establishing pretreatment methods capable of efficiently analyzing VOCs in small samples is an urgent priority for VOC research.
Furthermore, the sampling method complicates the interpretation of the VOC analysis. Commercially available devices, such as the Salivette, are widely used for saliva collection [6]. However, there is a potential risk of contamination from VOCs originating from the device itself, as well as adsorption and loss of specific compounds [7]. Consequently, unless device-derived artifacts are properly excluded, interpreting the resulting VOC profile as being of “biological origin” is difficult. To enhance the reliability of salivary VOC research, these sampling-related issues must be addressed.
The complex composition of human saliva makes VOC analyses challenging. Human saliva is a complex matrix containing not only fluid from the salivary glands, but also gingival crevicular fluid, oral bacteria, desquamated epithelial cells, food debris, and other components [8,9]. Therefore, VOCs in whole saliva are considered a mixture of those derived from human metabolism, oral microorganisms, and exogenous factors (such as diet). Identifying the VOCs derived from the metabolic activity of oral bacteria within this complex matrix and distinguishing them from human-derived or exogenous compounds is extremely difficult. Contrastingly, glandular saliva, directly collected from salivary glands, is a relatively pure biofluid with minimal contamination from the oral environment by microorganisms and food debris [8]. Therefore, to identify VOC biomarkers that reflect the metabolism of oral bacteria, it is essential to compare the VOC profile of glandular saliva, which has minimal bacterial contamination, with that of whole saliva, a complex matrix containing various components of the oral environment, collected from the same individuals. Studies have already been conducted on non-volatile metabolites [8,9] and proteins [10] to determine the differences between whole and glandular saliva. However, research on VOCs in saliva has focused solely on whole saliva [11,12,13], and the differences in VOC profiles between glandular and whole saliva remain unclear.
To address these challenges, we set two primary objectives in this study. First, we aimed to develop a new sample preparation method to efficiently extract VOCs from small saliva samples. Our method, which combines MonoTrap extraction with dichloromethane, enabled comprehensive VOC profiling from just 100 µL of saliva. Second, using this method, we aimed to perform a detailed comparison of the VOC profiles of whole and glandular saliva to identify biomarkers that reflect the metabolic activities of the oral microbiome. By further incorporating a two-step blank analysis using both saliva and ultrapure water as samples, we systematically excluded device-derived artifacts and achieved a more reliable exploration of biomarkers. This study not only provides crucial insights for establishing salivary VOCs as reliable biomarkers but also demonstrates a novel approach for VOC analysis from micro-volume samples; this can aid other research using clinical specimens, such as tears and sweat.
2. Materials and Methods
2.1. Participants
This study was approved by the Human Ethics Committee of the Osaka University Dental Hospital (approval no. R4-E10-2) and was conducted in accordance with the Declaration of Helsinki. Written informed consent was obtained from all the participants. Ten Japanese participants were recruited for this study. The participant ID, age, and sex are presented in Table 1. The main objective of this study was to compare the VOC profiles of glandular saliva and whole saliva samples collected from nine participants, except participant 17. A preliminary examination was conducted using whole saliva samples collected from participant 17 to evaluate the impact of Salivette (Sarstedt, Nümbrecht, Germany) on VOC profiles.
2.2. Sample Collection and Preparation
2.2.1. Main Experiment
All saliva samples were collected between 11:00 AM and 12:00 PM in the following order: glandular saliva followed by whole saliva. The participants were instructed to refrain from eating or drinking anything other than water for 8 h prior to saliva collection. Then, they were instructed to refrain from eating, drinking (including water), and brushing their teeth for 3 h prior to saliva collection. Glandular and whole saliva were collected using the procedure described below.
For glandular saliva collection, the participants first rinsed their mouths with water. Next, with the mouth open and tongue pressed against the upper palate, a Salivette cotton swab was placed at the outlet of the submandibular/sublingual gland using disposable tweezers (AS ONE, Osaka, Japan) (Figure S1). The swab was kept in place for 5 min with the mouth closed (For participant 01, owing to insufficient saliva volume, the swab was kept in place for 15 min). Subsequently, the cotton swab was removed using disposable tweezers and placed in a Salivette tube. Glandular saliva was collected by centrifugation of the Salivette tube at 4ºC and 1000 g for 2 min. The obtained glandular saliva was aliquoted into 2.0 mL microtubes (Eppendorf, Hamburg, Germany) by 200 µL, frozen in liquid nitrogen, and stored at −80ºC until analysis.
For whole saliva collection, unstimulated whole saliva was expectorated over a 5-min period into a 50-mL tube (Corning, NY, USA) kept on ice. After 15 min on ice, the aqueous layer was collected. The obtained whole saliva was aliquoted into 2.0 mL microtubes by 200 µL, frozen in liquid nitrogen, and stored at −80ºC until analysis.
2.2.2. Preliminary Experiment for Evaluation of the Effects of Salivette
To investigate the effect of Salivette use on saliva VOC profiles, we compared the VOC profiles of whole saliva with and without Salivette treatment, collected from a single participant (Participant 17). To further exclude compounds originating from the Salivette, a complementary analysis was performed by comparing the VOC profiles of ultrapure water with and without Salivette treatment.
Whole saliva was collected without Salivette treatment, following the same procedure as in the main experiment. Unstimulated whole saliva was expectorated over a 5-min period into a 50-mL tube kept on ice. After 15 min on ice, the aqueous layer was collected. The obtained whole saliva was aliquoted into 2.0 mL microtubes by 200 µL, frozen in liquid nitrogen, and stored at −80ºC until analysis.
For whole saliva collection with Salivette treatment, a Salivette cotton swab was placed inside a 50-mL tube prior to use. Saliva was collected in tubes for 5 min. Subsequently, the cotton swab was removed using disposable tweezers and placed in a Salivette tube. Whole saliva was collected by centrifugation of the Salivette tube at 4ºC and 1000 g for 2 min. The obtained saliva was aliquoted into 2.0 mL microtubes by 200 µL, frozen in liquid nitrogen, and stored at −80ºC until analysis.
2.3. VOC Extraction and Gas Chromatography/Mass Spectrometry (GC/MS) Analysis
2.3.1. VOC Extraction
The following preparations were made prior to the extraction of VOCs from saliva. Unless otherwise stated, all procedures were conducted at a room temperature of 22−24ºC. First, the MonoTrap RGPS TD (GL Sciences, Tokyo, Japan) was cut in half. The cut MonoTrap was conditioned with nitrogen gas flowing at approximately 45 mL/min for 2 h at 270ºC before use. All saliva samples were thawed at room temperature before use.
All saliva samples were subjected to the following VOC extraction protocols. The main experiment included 18 samples (glandular [n = 9] and whole saliva [n = 9]). The preliminary experiment for evaluating the effects of Salivette included six samples (whole saliva collected with and without Salivate; n = 3, technical replicates).
A 0.2 mL flat-bottom glass insert (GL Sciences) was placed in a 2 mL clear vial (Thermo Fisher Scientific, Massachusetts, USA). MonoTrap was then inserted into the glass insert, and 50 µL of dichloromethane was added. After vortexing for 10 s, the vials were kept at room temperature for 20 min. Subsequently, the MonoTrap was transferred to a new 2 mL clear vial containing a new glass insert with 100 µL of saliva sample. After vortexing for 10 s, the vial was maintained at room temperature for 60 min to extract VOCs from the saliva. During this process, vortex mixing (10 s) was performed every 20 min. The MonoTrap was transferred to a liner (GL Sciences) and subjected to thermal desorption-GC/MS analysis.
2.3.2. GC/MS Analysis
GC/MS analysis was performed using a GCMS-TQ8050 NX (Shimadzu, Kyoto, Japan) equipped with a multifunctional autosampler AOC-6000 (Shimadzu) and a multimode GC inlet OPTIC-4 (GL Sciences). OPTIC-4 inlet temperature program was as follows: It was first increased from an initial temperature of 40ºC to 50ºC at a rate of 5ºC/s, held at 50ºC for 240 s, then increased to 250ºC at 5ºC/s, and held at 250ºC for 360 s. The cryotrap was used at −120ºC for 600 s and then rapidly increased to 250ºC at 30ºC/s. The column flow was set to 1.0 mL/min for 240 s and then increased to 2.3 mL/min until the end of the analysis. The split flow was set to 230 mL/min for 240 s and then changed to 2.3 mL/min until the end of the analysis. The septum purge flow was set to 5 mL/min. The inlet temperature was maintained at 50ºC, and the split flow was set to a high rate of 230 mL/min for the initial 240 s to facilitate venting of the residual dichloromethane. GC analysis was performed using InertCap FFAP (60 m × 0.32 mm i.d., df = 0.50 µm; GL Sciences) with helium as the carrier gas. The column oven temperature conditions were as follows: it was maintained at 40ºC for 3 min, raised to 250ºC at 3ºC/min, and finally kept at 250ºC for 30 min. The MS was operated in the scan mode (m/z 24−350) using electron ionization with an event time of 0.200 s. The ion source temperature and interface temperature were set to 250ºC. To increase the sensitivity, the detector voltage was raised by 0.2 kV in relative value. A standard mixture of alkanes (C7−C26) was used to calculate the retention index (RI).
2.4. Data Analysis
The raw data obtained from the analysis were converted to netCDF files using GCMSsolution ver. 4.20 (Shimadzu), and then to ABF files using an Abf converter (Reifycs, Tokyo, Japan). MS-DIAL ver. 4.9.221218 (RIKEN, Saitama, Japan) was used for baseline correction, noise removal, peak detection, alignment, and automatic annotation based on the RI and mass spectral information of the compounds. An in-house library was used for the compound identification. The MS-DIAL analysis conditions were set as follows: minimum peak height: 5000 amplitude, smoothing method: linear weighted moving average, and RI tolerance: 20.
To compare the VOC profiles between glandular and whole saliva samples, orthogonal partial least squares discriminant analysis (OPLS-DA) was performed using MetaboAnalyst 6.0, and the Wilcoxon signed-rank test was conducted using R (ver. 4.5.1). To identify Salivette-derived compounds, the peak intensities were compared between samples with and without Salivette treatment using either Student’s t-test or Welch’s t-test, depending on data variance (Statistical analysis tool: https://systemsomicslab.github.io/compms/others/main.html#Statistics, accessed on 16 September 2025). This comparison was performed on whole saliva samples from the preliminary experiment and blank ultrapure water samples. All plots (bars, boxes, and paired scatter plots) were generated using R.
3. Results
3.1. Evaluation of the Effects of Salivette on Whole Saliva VOC Profiles
First, to investigate the effects of Salivette on the VOC profiles of saliva, we compared the VOC profiles of whole saliva collected from the same participants with and without Salivette treatment. A total of 62 compounds, consisting of alcohols (13), aromatic compounds (17), aldehydes (6), fatty acids (13), ketones (7), volatile sulfur compounds (VSCs) (3), and others (3), were detected in six samples: whole saliva collected with Salivette (n = 3), and whole saliva collected without Salivette (n = 3) (Table S1). Among these, compounds showing changes in peak intensity, with or without Salivette treatment, were investigated. The results indicated that 14 compounds (2-hexanol, 1-hexanol, 2-acetylfuran, 5-hydroxymethyl-2-furaldehyde, acetophenone, benzothiazole, decanoic acid, furan, furfural, heptanoic acid, hexanoic acid, pelargonic acid, valeric acid, and vanillin) significantly increased with Salivette use, whereas furfuryl alcohol showed a significant decrease (t-test, p < 0.05, n = 3) (Figure 1). The 14 compounds are possible blank compounds originating from the Salivette, whereas the furfuryl alcohol is a compound potentially adsorbed to the Salivette. Therefore, these 15 compounds were excluded from subsequent analysis comparing the VOC profiles of whole and glandular saliva.
3.2. Comparison of VOC Profiles in Whole and Glandular Saliva
Next, we compared the VOC profiles of glandular and whole saliva. Both saliva samples were collected from the nine participants and subjected to GC/MS analysis, where a total of 72 compounds were detected. Of these, 15 compounds that showed significant changes owing to Salivette use were excluded from subsequent analysis. The remaining 57 compounds included alcohols (11), aromatic compounds (15), aldehydes (6), fatty acids (10), ketones (6), VSCs (4), and others (5) (Table S2).
To identify differences in VOC profiles between glandular and whole saliva, OPLS-DA was performed using these 57 components as explanatory variables (Figure 2). The R2Y and Q2 were 0.743 and 0.679, respectively, indicating high model performance. Consequently, 22 compounds with variable importance for prediction (VIP) > 1.0, which were considered to contribute to the separation of the two groups, were identified. We evaluated the validity of the top VIP compounds. Wilcoxon signed-rank tests were performed to confirm whether the peak intensity of each compound showed a statistically significant difference between the two saliva samples. The results indicated significant differences (q < 0.05) for most of the compounds with high VIP values (17 of 22 compounds). Next, to exclude the possibility that these high-VIP compounds were blank compounds, we performed a blank analysis of ultrapure water treated with Salivette for comparison. These results suggested that seven compounds, including 3-heptanone, were likely Salivette-derived blank compounds. Additionally, some compounds, including formic acid, were not detected in the blank samples; thus, it could not be determined whether they originated from the Salivette. These verification results are summarized in Table 2, including the VIP values, false discovery rate from the Wilcoxon signed-rank test, and Salivette blank evaluation for each compound. Based on these verifications, we concluded that 10 compounds with statistically significant differences that did not originate from sampling reflected the biological differences between glandular and whole saliva. The 10 compounds were δ-valerolactam, 1-propanol, skatole, acetaldehyde, indole, isobutyric acid, isovaleric acid, 4-methylvaleric acid, methyl mercaptan, and 3-phenylpropionic acid. The box and paired scatter plots of these compounds are shown in Figure 3 and Figure S2, respectively.
4. Discussion
In this study, we established a sample preparation method combining MonoTrap extraction with dichloromethane, enabling the profiling of VOCs from relatively small amounts of saliva sample (100 µL). In this protocol, dichloromethane served a dual purpose: as an extraction solvent and a means to immerse the hydrophobic, porous polydimethylsiloxane/graphite-based MonoTrap into an aqueous saliva sample [14,15]. This dual functionality proved to be effective as our method successfully enabled the profiling of a wide range of VOCs from small saliva samples. Although this method is effective, the precise mechanism of VOC transfer among dichloromethane, MonoTrap, and saliva is complex and requires further investigation.
Using this VOC extraction protocol, we addressed our primary objective of identifying VOCs that reflected the biological differences between glandular and whole saliva. In this study, glandular saliva was collected using a Salivette, and whole saliva was collected by spitting into tubes. Ideally, a sampling method that minimizes the introduction of artifacts from collection devices is preferable. However, as the use of Salivette is essential for the effective collection of glandular saliva, it is necessary to properly evaluate the artifacts derived from this sampling device. As suggested by Bosman et al., Salivette use may affect the analytical results for some metabolites in the saliva [7]. While their work focused on non-volatile compounds, the issue of sampling-derived artifacts was equally relevant to VOC analysis. To address this issue, we implemented a two-step blank evaluation process. First, we compared whole saliva samples with and without Salivette treatment to exclude compounds whose peak intensities changed with Salivette use. Second, we excluded the compounds that changed in the case of Salivette treatment of ultrapure water from those that contributed to the difference between glandular and whole saliva.
In this blank evaluation, most of the compounds identified as blanks increased with Salivette use. Among them, furfural and 5-hydroxymethyl-2-furaldehyde are widely recognized as degradation products of cellulose [16,17]. Given that cotton is a plant-derived material consisting mainly of cellulose, the possibility that these compounds originated from Salivette’s cotton swabs cannot be excluded. Similarly, the simultaneous increase in short- and medium-chain fatty acids (C5–C10) and alcohols (1-hexanol and 2-hexanol) is consistent with leachables from the polyethylene closure of the Salivette. A previous study demonstrated that these compounds could be detected in polyethylene packaging materials [18]. The presence of acetophenone is also supported by a previous study that reported its detection in polyethylene and polypropylene materials used in food packaging [19]. Taken together, these results suggest that the compounds associated with Salivette use are derived from either the cotton swab or the plastic container. In contrast to other compounds, furfuryl alcohol showed a decrease with the use of Salivette, suggesting that it adsorbs onto cotton swabs or plastic containers.
Our blank analysis successfully identified 10 VOCs that were not derived from the sampling method. All these compounds showed significantly higher levels in whole saliva than in glandular saliva. These differences are likely attributable to the unique biological environment of the oral cavity, including the presence of oral microbiota, food debris, and desquamated epithelial cells [20].
For instance, indole and skatole are produced by tryptophan metabolism in oral bacteria such as the gram-negative anaerobic bacteria Prevotella intermedia, Porphyromonas gingivalis, and Fusobacterium nucleatum [21,22]. Our previous study identified indole in the culture supernatants of F. nucleatum and P. gingivalis with strong odor intensity by GC/olfactometry, suggesting a potential role in halitosis [15]. Similarly, short-chain fatty acids are produced by the breakdown of proteins and their subsequent deamination by anaerobic bacteria in the oral cavity [23]. Isobutyric and isovaleric acids, which were significantly increased in whole saliva in this study, have been detected in bacterial isolates of P. gingivalis, P. asaccharolytica, P. intermedia, and F. nucleatum [23]. 4-Methylvaleric acid, also a branched-chain fatty acid, was significantly increased in whole saliva. However, the specific metabolic pathway of this compound in the oral cavity has not been well documented. On the other hand, methyl mercaptan is known to be a major causative compound of halitosis, given its low odor threshold (5.1 × 10⁻¹³ ppm) [22,24]. It is produced by anaerobic bacteria such as Bacteroides spp., Eubacterium spp., Fusobacterium spp., Porphyromonas spp., and Treponema denticola [22].
The presence of δ-valerolactam in whole saliva was also noteworthy. Although its metabolic pathway in the oral cavity is not yet fully elucidated, it has been speculated that δ-valerolactam could be a product of cadaverine metabolism, a known lysine degradation product in saliva [25]. A previous study reported the detection of δ-valerolactam in whole saliva collected using the passive drool method [26]. Given these findings, the significant increase of δ-valerolactam in whole saliva likely reflects its production via the metabolic activities of oral bacteria. In this study, 3-phenylpropionic acid was also significantly increased in whole saliva. A previous study reported that levels of this compound are significantly higher in patients with periodontitis than in healthy participants [27]. Furthermore, a significant correlation between 3-phenylpropionic acid and oral microorganisms was found [27]. Taken together, these findings strongly suggest that the significant increase of 3-phenylpropionic acid in whole saliva reflects its production via the metabolic activities of the oral microbiome. Similarly, the presence of 1-propanol can be attributed to oral microbial activity. It is believed that 1-propanol is produced at higher concentrations by microorganisms in the mouth rather than endogenously [28]. It has been suggested that this is a result of bacterial fermentation of threonine, a process that does not occur in glandular saliva [29]. Finally, we discuss the presence of acetaldehyde in whole saliva. The origin of this compound is complex and is likely influenced by a combination of multiple factors. Although acetaldehyde can be produced from ethanol in epithelia, much higher levels are derived from the metabolism of ethanol by oral bacteria [30]. Smoking and drinking also affect its production [30]. Therefore, the elevated levels of acetaldehyde in whole saliva in our study likely reflected the combined effects of microbial activity, host metabolism, and exogenous factors. Taken together, the findings on these 10 compounds suggest that the distinct VOC profile of whole saliva is predominantly influenced by microbial metabolism in the oral cavity.
Despite these significant findings, this study has some limitations. The relatively small sample size, which was sufficient to demonstrate clear differences between glandular and whole saliva, suggests that further validation using a larger cohort is required to generalize these findings. Furthermore, our two-step blank analysis successfully excluded major sampling-derived artifacts, leading to the identification of 10 VOCs that likely originated from oral bacteria. However, we cannot entirely exclude the possibility of other unidentified artifacts.
5. Conclusions
This study successfully establishes a reliable method for the comprehensive profiling of VOCs from relatively small amounts of saliva. This protocol, which utilizes MonoTrap extraction with dichloromethane, is a promising tool for the analysis of other microvolume clinical samples, such as tears or sweat. By applying a two-step blank analysis, we successfully excluded artifacts derived from the sampling device. This approach enabled us to identify a unique and biologically relevant VOC profile characteristic of whole saliva, which was distinct from that of glandular saliva. Our results strongly suggest that most of these compounds were metabolites predominantly influenced by the metabolic activities of the oral microbiome. This methodology provides a solid foundation for future research aimed at developing rapid, convenient, and noninvasive diagnostic tools for oral conditions such as periodontitis and halitosis.
Supplementary Materials
The following supporting information can be downloaded at the website of this paper posted on Preprints.org, Figure S1: Representative image of glandular saliva collection; Figure S2: Paired scatter plots of 10 compounds showing significant changes (q < 0.05, Wilcoxon signed-rank test) between glandular and whole saliva; Table S1: Compounds detected in the whole saliva treated with and without Salivette; Table S2: Compounds detected in glandular and whole saliva (excluding 15 compounds significantly changed upon using Salivette).
Author Contributions
Conceptualization, E. F.; methodology, A. M.; resources, M. K.; writing—original draft preparation, A. M.; writing—review and editing, E. F.; project administration, E. F. and M. K.; funding acquisition, E. F. All authors have read and agreed to the published version of the manuscript.
Funding
This research was funded by the Japan Society for the Promotion of Science (JSPS), KAKENHI (grant number: JP 24K01271).
Institutional Review Board Statement
The study was conducted in accordance with the Declaration of Helsinki and approved by the Human Ethics Committee of Osaka University Dental Hospital (approval no. R4-E10-2, September 26, 2022).
Informed Consent Statement
Informed consent was obtained from all participants involved in the study.
Data Availability Statement
The raw GC-MS data from this study have been deposited in MB-POST (https://repository.massbank.jp/preview/122243149068d5f26c3390a, PIN CODE: 9541).
Acknowledgments
This study represents a part of the dissertation submitted by Asuka Mori to the University of Osaka in partial fulfillment of the requirements for her Ph.D. degree.
Conflicts of Interest
The authors declare no conflicts of interest.
Abbreviations
The following abbreviations are used in this manuscript:
| VOCs | Volatile organic compounds |
| GC | Gas chromatography |
| MS | Mass spectrometry |
| RI | Retention index |
| OPLS-DA | Orthogonal partial least squares discriminant analysis |
| VSCs | Volatile sulfur compounds |
| VIP | Variable importance for prediction |
References
- Amann, A.; Costello, B.d.L.; Miekisch, W.; Schubert, J.; Buszewski, B.; Pleil, J.; Ratcliffe, N.; Risby, T. The Human Volatilome: Volatile Organic Compounds (VOCs) in Exhaled Breath, Skin Emanations, Urine, Feces and Saliva. J. Breath Res. 2014, 8, 034001. [Google Scholar] [CrossRef]
- AL-Kateb, H.; de Lacy Costello, B.; Ratcliffe, N. An Investigation of Volatile Organic Compounds from the Saliva of Healthy Individuals Using Headspace-Trap/GC-MS. J. Breath Res. 2013, 7, 036004. [Google Scholar] [CrossRef]
- Arulvasan, W.; Chou, H.; Greenwood, J.; Ball, M.L.; Birch, O.; Coplowe, S.; Gordon, P.; Ratiu, A.; Lam, E.; Hatch, A.; et al. High-Quality Identification of Volatile Organic Compounds (VOCs) Originating from Breath. Metabolomics 2024, 20, 102. [Google Scholar] [CrossRef]
- Monedeiro, F.; dos Reis, R.B.; Peria, F.M.; Sares, C.T.G.; De Martinis, B.S. Investigation of Sweat VOC Profiles in Assessment of Cancer Biomarkers Using HS-GC-MS. J. Breath Res. 2020, 14, 026009. [Google Scholar] [CrossRef]
- Monedeiro, F.; Monedeiro-Milanowski, M.; Zmysłowski, H.; De Martinis, B.S.; Buszewski, B. Evaluation of Salivary VOC Profile Composition Directed towards Oral Cancer and Oral Lesion Assessment. Clin Oral Invest 2021, 25, 4415–4430. [Google Scholar] [CrossRef]
- Topkas, E.; Keith, P.; Dimeski, G.; Cooper-White, J.; Punyadeera, C. Evaluation of Saliva Collection Devices for the Analysis of Proteins. Clin. Chim. Acta 2012, 413, 1066–1070. [Google Scholar] [CrossRef]
- Bosman, P.; Pichon, V.; Acevedo, A.C.; Chardin, H.; Combes, A. Development of Analytical Methods to Study the Salivary Metabolome: Impact of the Sampling. Anal Bioanal Chem 2022, 414, 6899–6909. [Google Scholar] [CrossRef]
- Meleti, M.; Quartieri, E.; Antonelli, R.; Pezzi, M.E.; Ghezzi, B.; Viani, M.V.; Setti, G.; Casali, E.; Ferrari, E.; Ciociola, T.; et al. Metabolic Profiles of Whole, Parotid and Submandibular/Sublingual Saliva. Metabolites 2020, 10, 318. [Google Scholar] [CrossRef]
- Gardner, A.; Parkes, H.G.; So, P.-W.; Carpenter, G.H. Determining Bacterial and Host Contributions to the Human Salivary Metabolome. J. Oral Microbiol. 2019, 11, 1617014. [Google Scholar] [CrossRef]
- Denny, P.; Hagen, F.K.; Hardt, M.; Liao, L.; Yan, W.; Arellanno, M.; Bassilian, S.; Bedi, G.S.; Boontheung, P.; Cociorva, D.; et al. The Proteomes of Human Parotid and Submandibular/Sublingual Gland Salivas Collected as the Ductal Secretions. J. Proteome Res. 2008, 7, 1994–2006. [Google Scholar] [CrossRef]
- Monedeiro, F.; Milanowski, M.; Ratiu, I.-A.; Zmysłowski, H.; Ligor, T.; Buszewski, B. VOC Profiles of Saliva in Assessment of Halitosis and Submandibular Abscesses Using HS-SPME-GC/MS Technique. Molecules 2019, 24, 2977. [Google Scholar] [CrossRef]
- Bel’skaya, L.V.; Sarf, E.A.; Shalygin, S.P.; Postnova, T.V.; Kosenok, V.K. Identification of Salivary Volatile Organic Compounds as Potential Markers of Stomach and Colorectal Cancer: A Pilot Study. J. Oral Biosci. 2020, 62, 212–221. [Google Scholar] [CrossRef]
- Soini, H.A.; Klouckova, I.; Wiesler, D.; Oberzaucher, E.; Grammer, K.; Dixon, S.J.; Xu, Y.; Brereton, R.G.; Penn, D.J.; Novotny, M.V. Analysis of Volatile Organic Compounds in Human Saliva by a Static Sorptive Extraction Method and Gas Chromatography-Mass Spectrometry. J. Chem. Ecol. 2010, 36, 1035–1042. [Google Scholar] [CrossRef]
- Liu, C.; Liu, X.; Tian, X.; Zhang, J.; Zhang, Z.; Shi, J.; Xu, J.; Ren, X. Determination of Volatile Profiles inside Apple Fruit Storage Facilities Using MonotrapTM Monolithic Silica Adsorbent and GC–MS. Hortic. Plant J. 2021, 7, 267–274. [Google Scholar] [CrossRef]
- Mori, A.; Taniguchi, M.; Kuboniwa, M.; Amano, A.; Fukusaki, E. Profiling Volatile Compounds from Culture Supernatants of Periodontal Bacteria Using Gas Chromatography/Mass Spectrometry/Olfactometry Analysis with a Monolithic Silica Gel Adsorption Device. J. Biosci. Bioeng. 2022, 134, 77–83. [Google Scholar] [CrossRef]
- Yee, K.L.; Jansen, L.E.; Lajoie, C.A.; Penner, M.H.; Morse, L.; Kelly, C.J. Furfural and 5-Hydroxymethyl-Furfural Degradation Using Recombinant Manganese Peroxidase. Enzym. Microb. Technol. 2018, 108, 59–65. [Google Scholar] [CrossRef]
- Łojewski, T.; Sawoszczuk, T.; Łagan, J.M.; Zięba, K.; Barański, A.; Łojewska, J. Furfural as a Marker of Cellulose Degradation. A Quantitative Approach. Appl. Phys. A 2010, 100, 873–884. [Google Scholar] [CrossRef]
- Roosen, M.; Van Laere, T.; Decottignies, V.; Morel, L.; Schnitzler, J.-L.; Schneider, J.; Schlummer, M.; Lase, I.S.; Dumoulin, A.; De Meester, S. Tracing the Origin of VOCs in Post-Consumer Plastic Film Bales. Chemosphere 2023, 324, 138281. [Google Scholar] [CrossRef]
- Vera, P.; Canellas, E.; Nerín, C. Compounds Responsible for Off-Odors in Several Samples Composed by Polypropylene, Polyethylene, Paper and Cardboard Used as Food Packaging Materials. Food Chem. 2020, 309, 125792. [Google Scholar] [CrossRef]
- Milanowski, M.; Pomastowski, P.; Ligor, T.; Buszewski, B. Saliva – Volatile Biomarkers and Profiles. Crit. Rev. Anal. Chem. 2017, 47, 251–266. [Google Scholar] [CrossRef]
- Codipilly, D.; Kleinberg, I. Generation of Indole/Skatole during Malodor Formation in the Salivary Sediment Model System and Initial Examination of the Oral Bacteria Involved. J. Breath Res. 2008, 2, 017017. [Google Scholar] [CrossRef]
- Hampelska, K.; Jaworska, M.M.; Babalska, Z.Ł.; Karpiński, T.M. The Role of Oral Microbiota in Intra-Oral Halitosis. J. Clin. Med. 2020, 9, 2484. [Google Scholar] [CrossRef]
- Leonov, G.E.; Varaeva, Y.R.; Livantsova, E.N.; Starodubova, A.V. The Complicated Relationship of Short-Chain Fatty Acids and Oral Microbiome: A Narrative Review. Biomedicines 2023, 11, 2749. [Google Scholar] [CrossRef]
- Van den Velde, S.; van Steenberghe, D.; Van hee, P.; Quirynen, M. Detection of Odorous Compounds in Breath. J Dent Res 2009, 88, 285–289. [Google Scholar] [CrossRef]
- Gardner, A.; Carpenter, G.; So, P.-W. Salivary Metabolomics: From Diagnostic Biomarker Discovery to Investigating Biological Function. Metabolites 2020, 10, 47. [Google Scholar] [CrossRef]
- Malkar, A.; Devenport, N.A.; Martin, H.J.; Patel, P.; Turner, M.A.; Watson, P.; Maughan, R.J.; Reid, H.J.; Sharp, B.L.; Thomas, C.L.P.; et al. Metabolic Profiling of Human Saliva before and after Induced Physiological Stress by Ultra-High Performance Liquid Chromatography–Ion Mobility–Mass Spectrometry. Metabolomics 2013, 9, 1192–1201. [Google Scholar] [CrossRef]
- Wei, Y.; Shi, M.; Nie, Y.; Wang, C.; Sun, F.; Jiang, W.; Hu, W.; Wu, X. Integrated Analysis of the Salivary Microbiome and Metabolome in Chronic and Aggressive Periodontitis: A Pilot Study. Front. Microbiol. 2022, 13. [Google Scholar] [CrossRef]
- Khalid, T.Y.; Saad, S.; Greenman, J.; de Lacy Costello, B.; Probert, C.S.J.; Ratcliffe, N.M. Volatiles from Oral Anaerobes Confounding Breath Biomarker Discovery. J. Breath Res. 2013, 7, 017114. [Google Scholar] [CrossRef]
- van den Velde, S.; Quirynen, M.; Van hee, P.; van Steenberghe, D. Halitosis Associated Volatiles in Breath of Healthy Subjects. J. Chromatogr. B 2007, 853, 54–61. [Google Scholar] [CrossRef]
- Homann, N.; Tillonen, J.; Meurman, J.H.; Rintamäki, H.; Lindqvist, C.; Rautio, M.; Jousimies-Somer, H.; Salaspuro, M. Increased Salivary Acetaldehyde Levels in Heavy Drinkers and Smokers: A Microbiological Approach to Oral Cavity Cancer. Carcinogenesis 2000, 21, 663–668. [Google Scholar] [CrossRef]
Figure 1.
Bar plot of 15 compounds significantly changed upon using Salivette (Saliva: whole saliva collected without Salivette, Saliva+Salivette: whole saliva collected with Salivette).
Figure 1.
Bar plot of 15 compounds significantly changed upon using Salivette (Saliva: whole saliva collected without Salivette, Saliva+Salivette: whole saliva collected with Salivette).
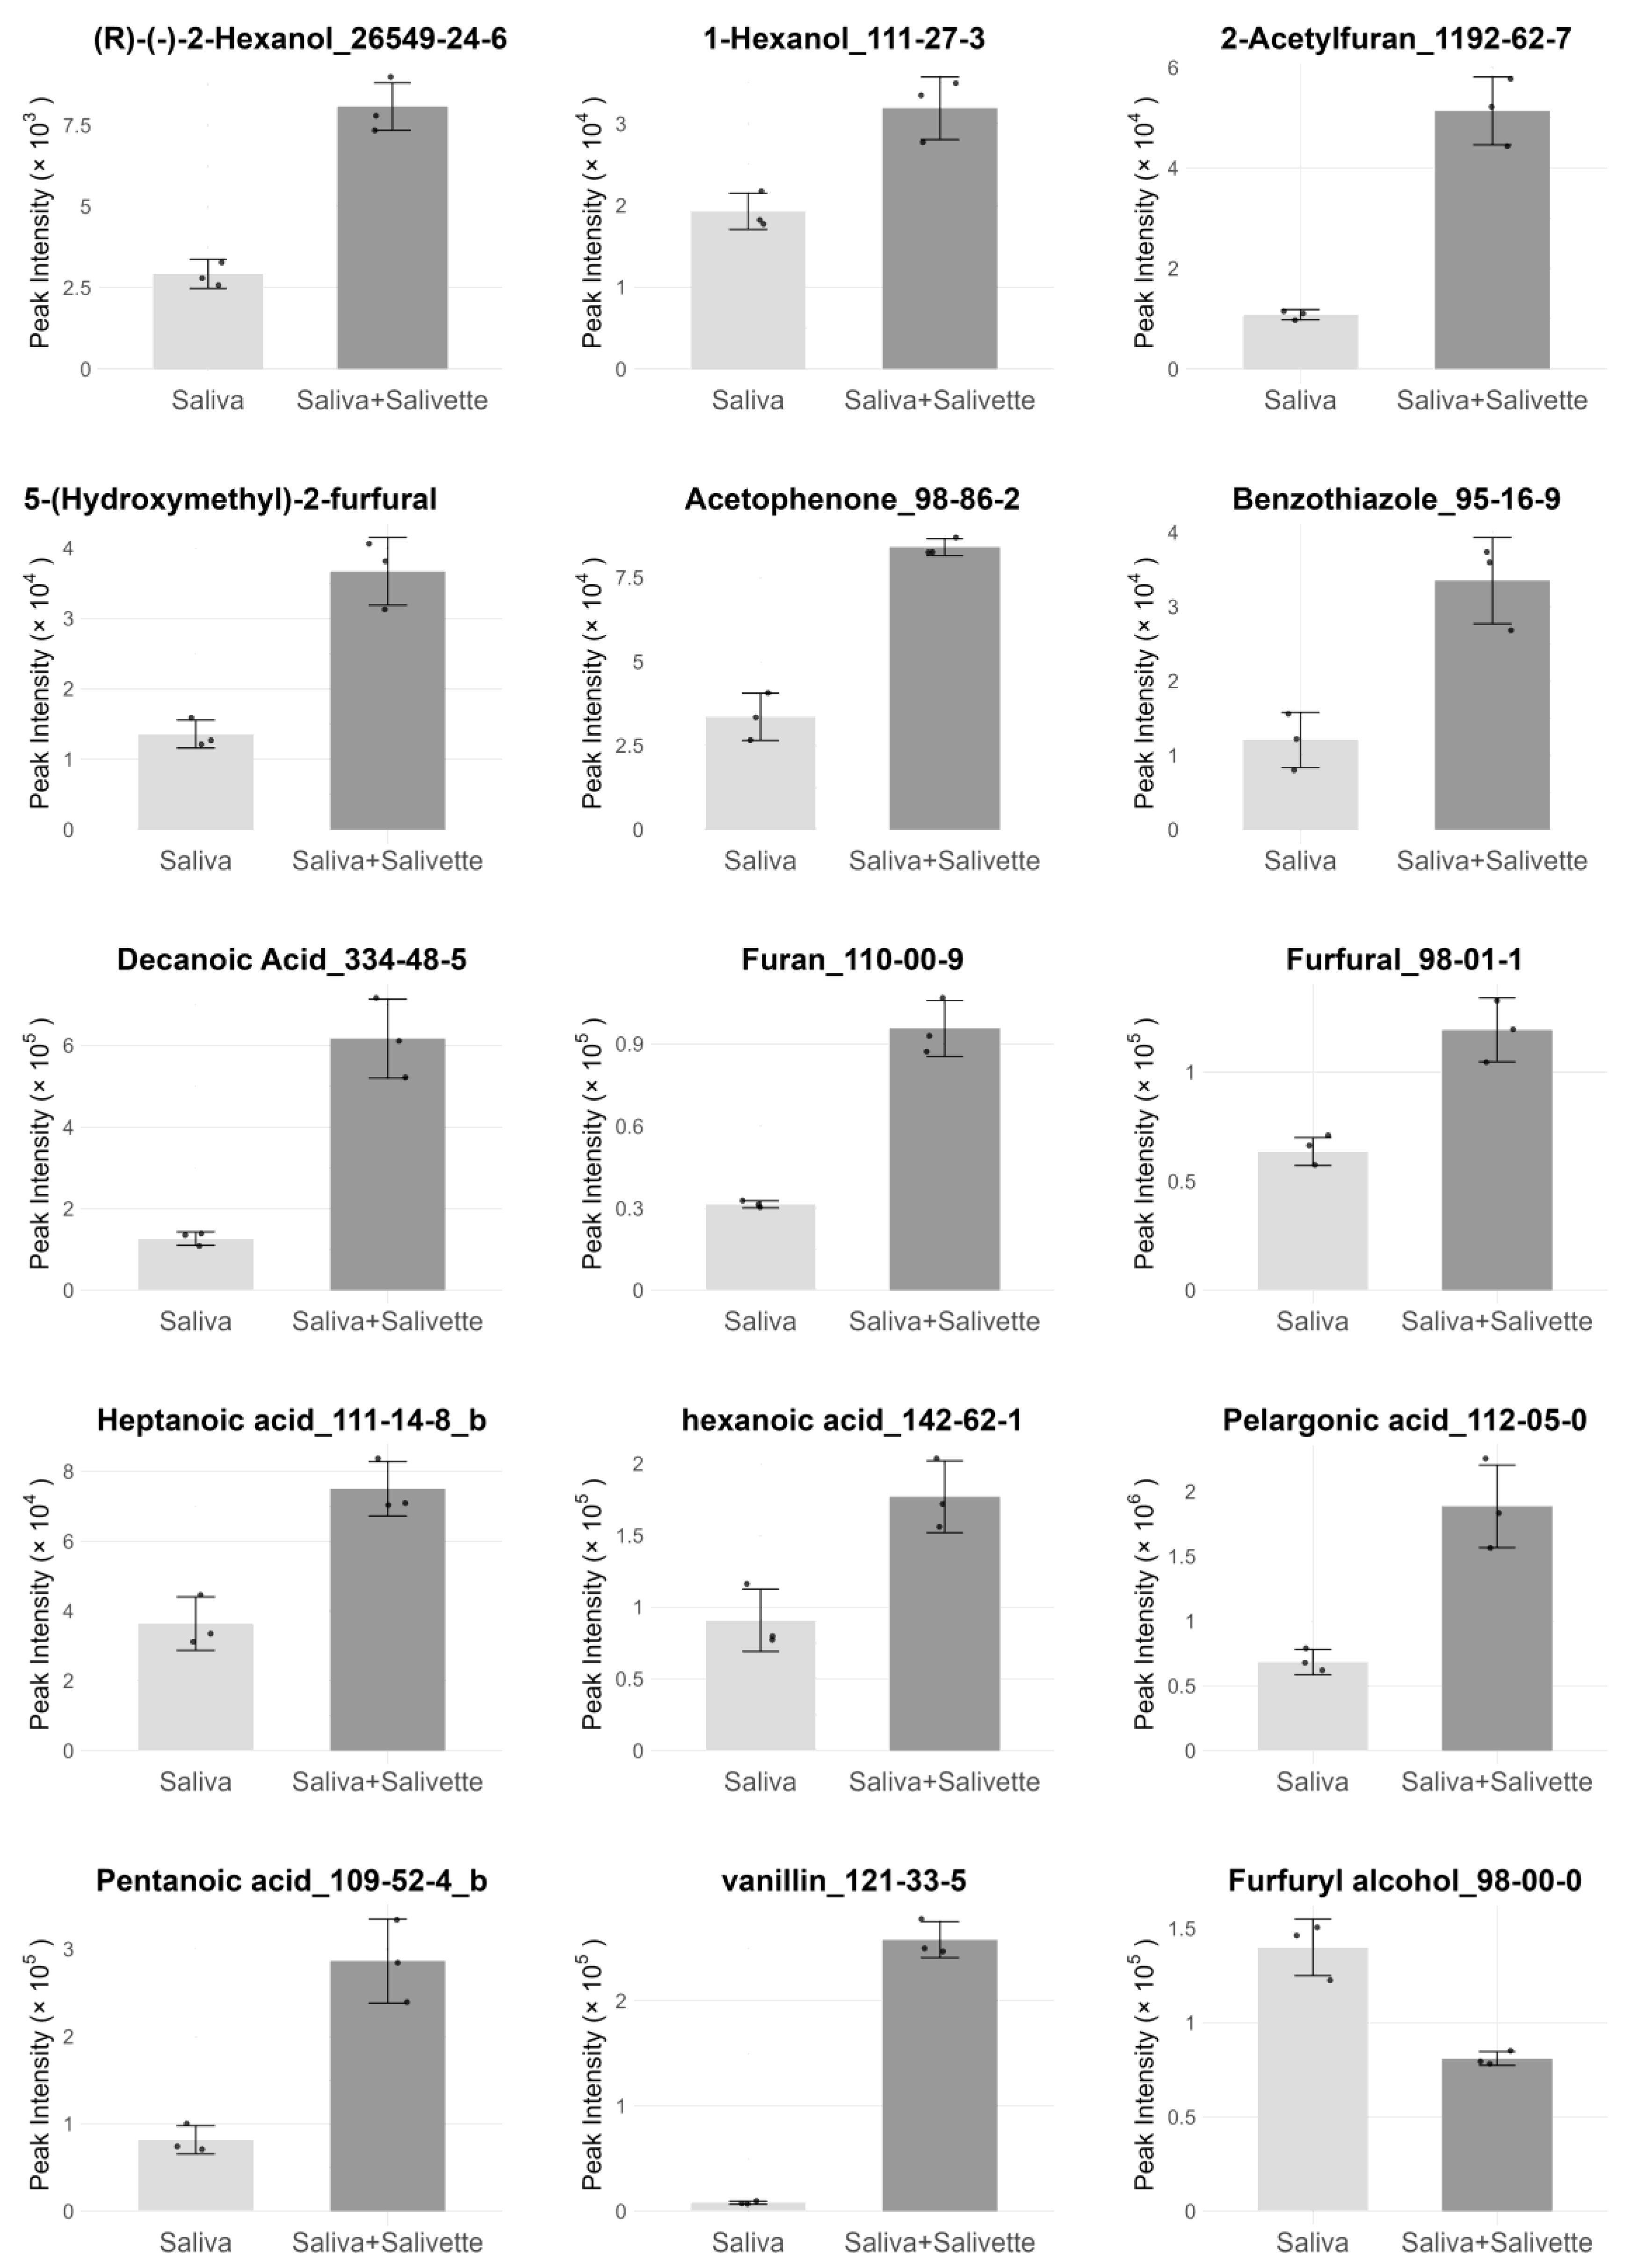
Figure 2.
(a) Score plot for OPLS-DA (W: whole saliva, G: glandular saliva); (b) VIP scores for OPLS-DA.
Figure 2.
(a) Score plot for OPLS-DA (W: whole saliva, G: glandular saliva); (b) VIP scores for OPLS-DA.
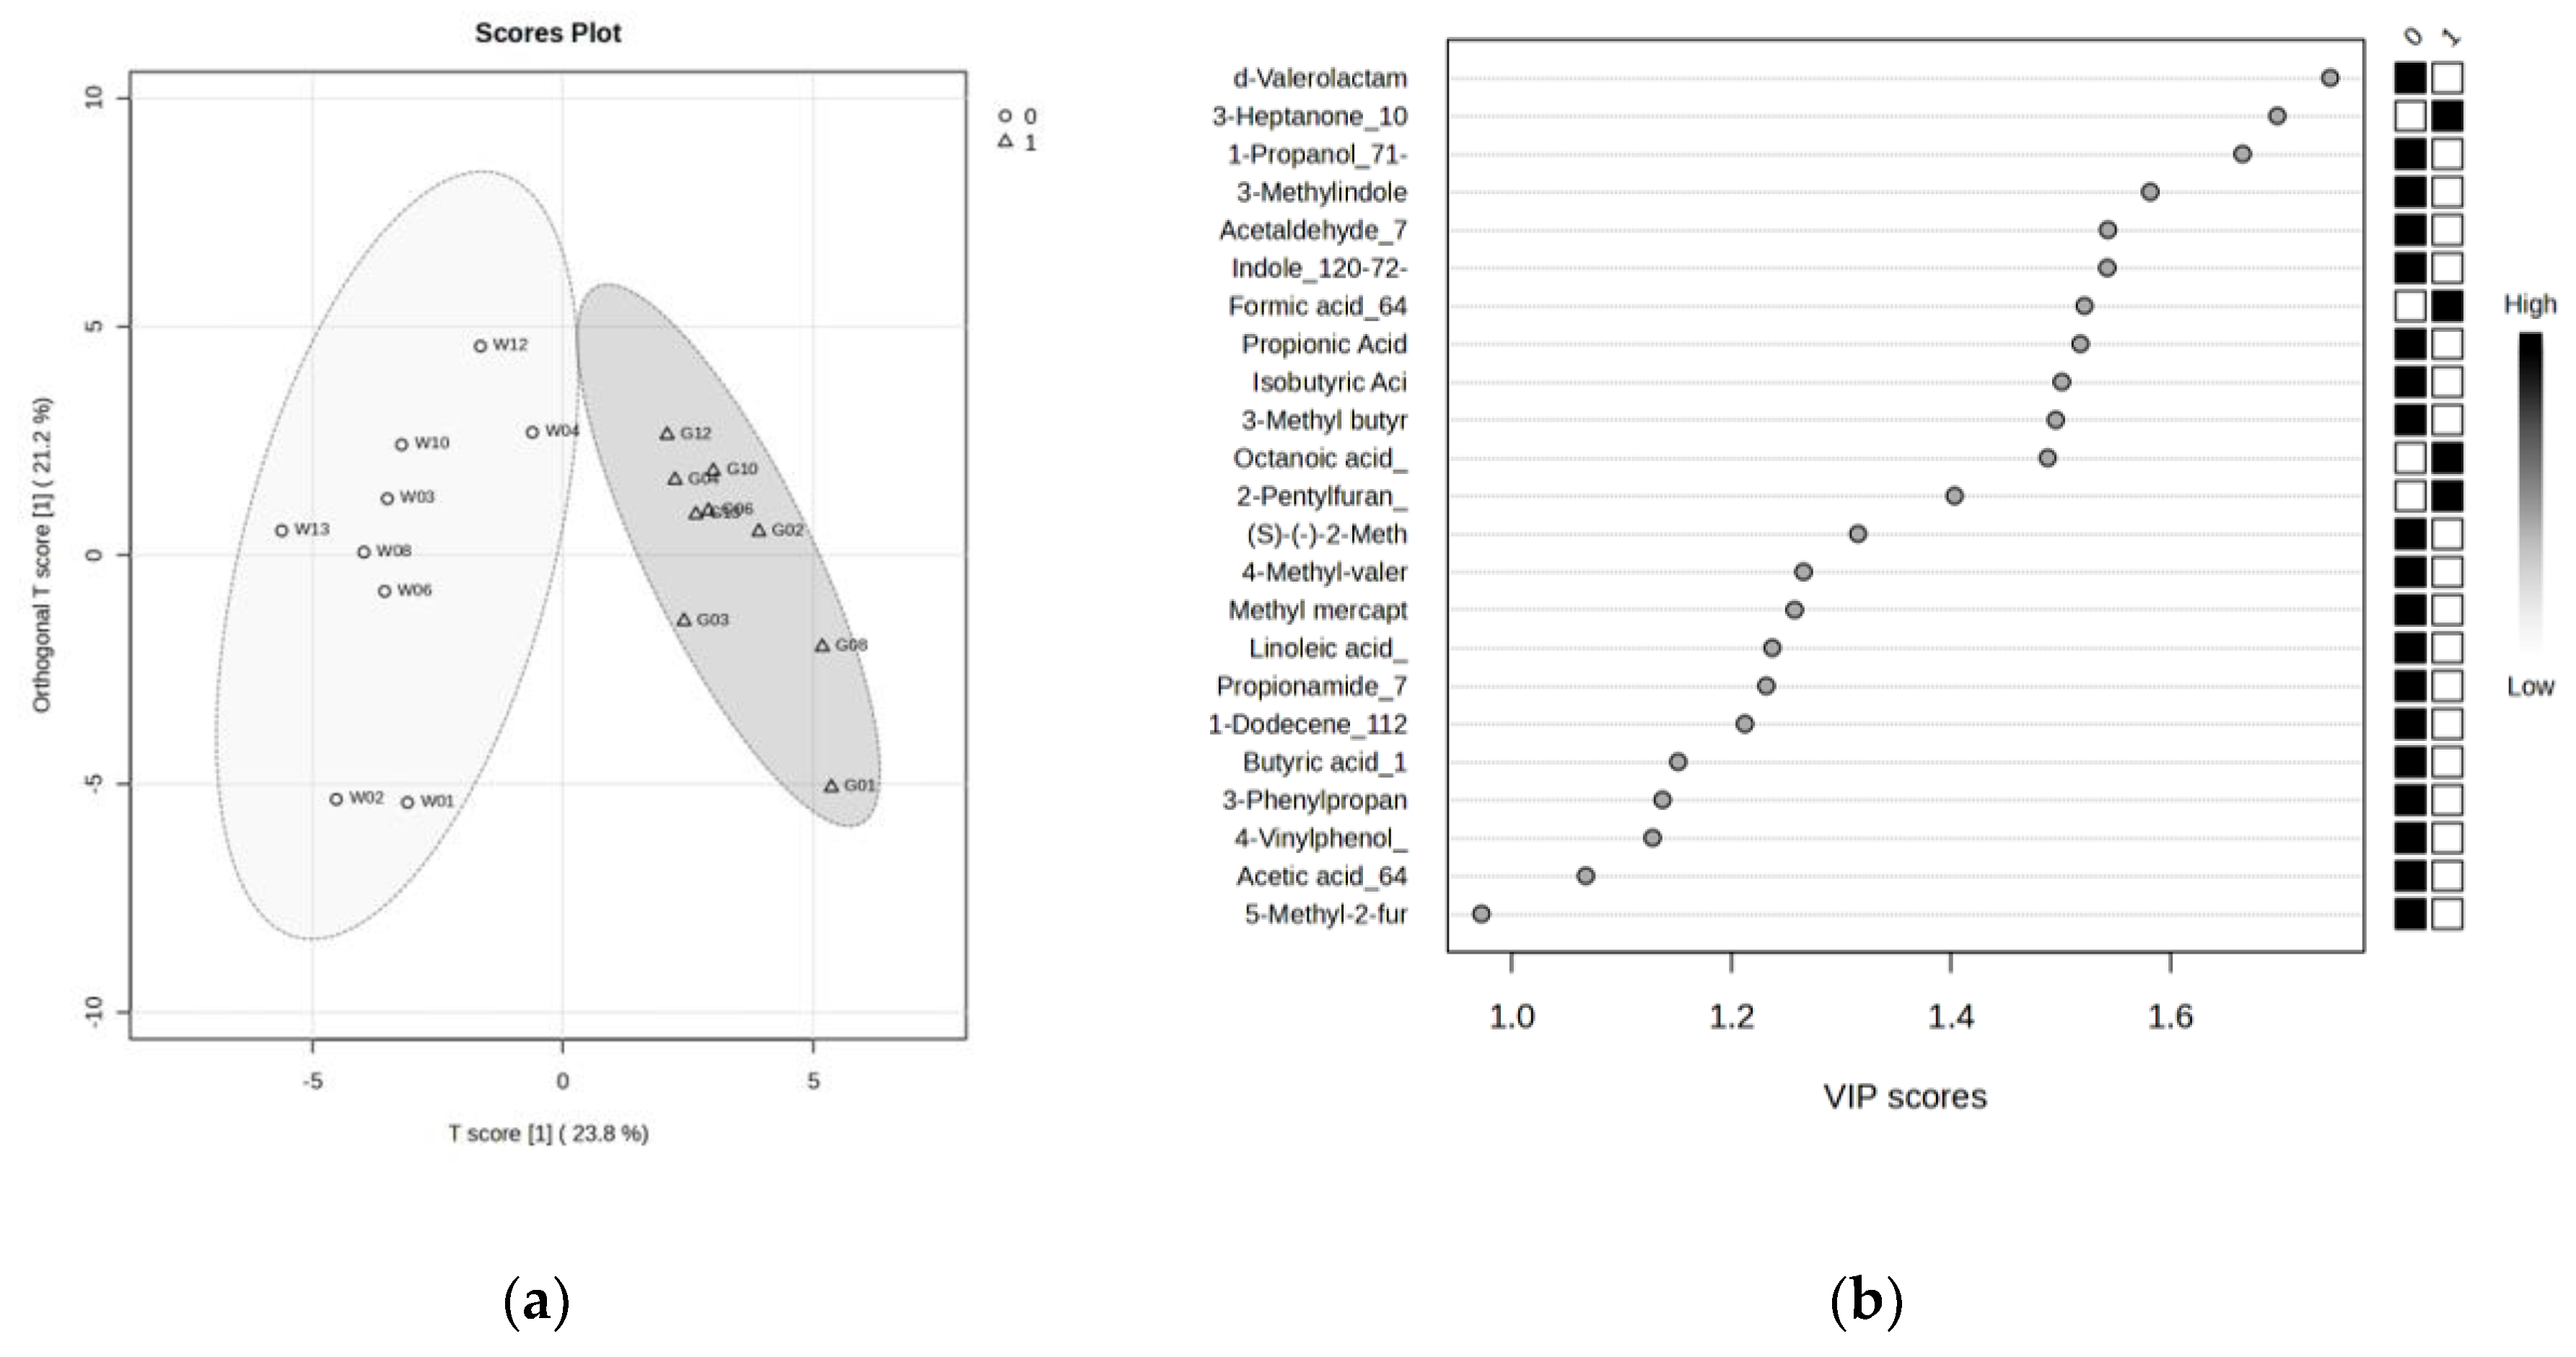
Figure 3.
Box plots of 10 compounds showing significant changes (q < 0.05, Wilcoxon signed-rank test) between glandular and whole saliva.
Figure 3.
Box plots of 10 compounds showing significant changes (q < 0.05, Wilcoxon signed-rank test) between glandular and whole saliva.
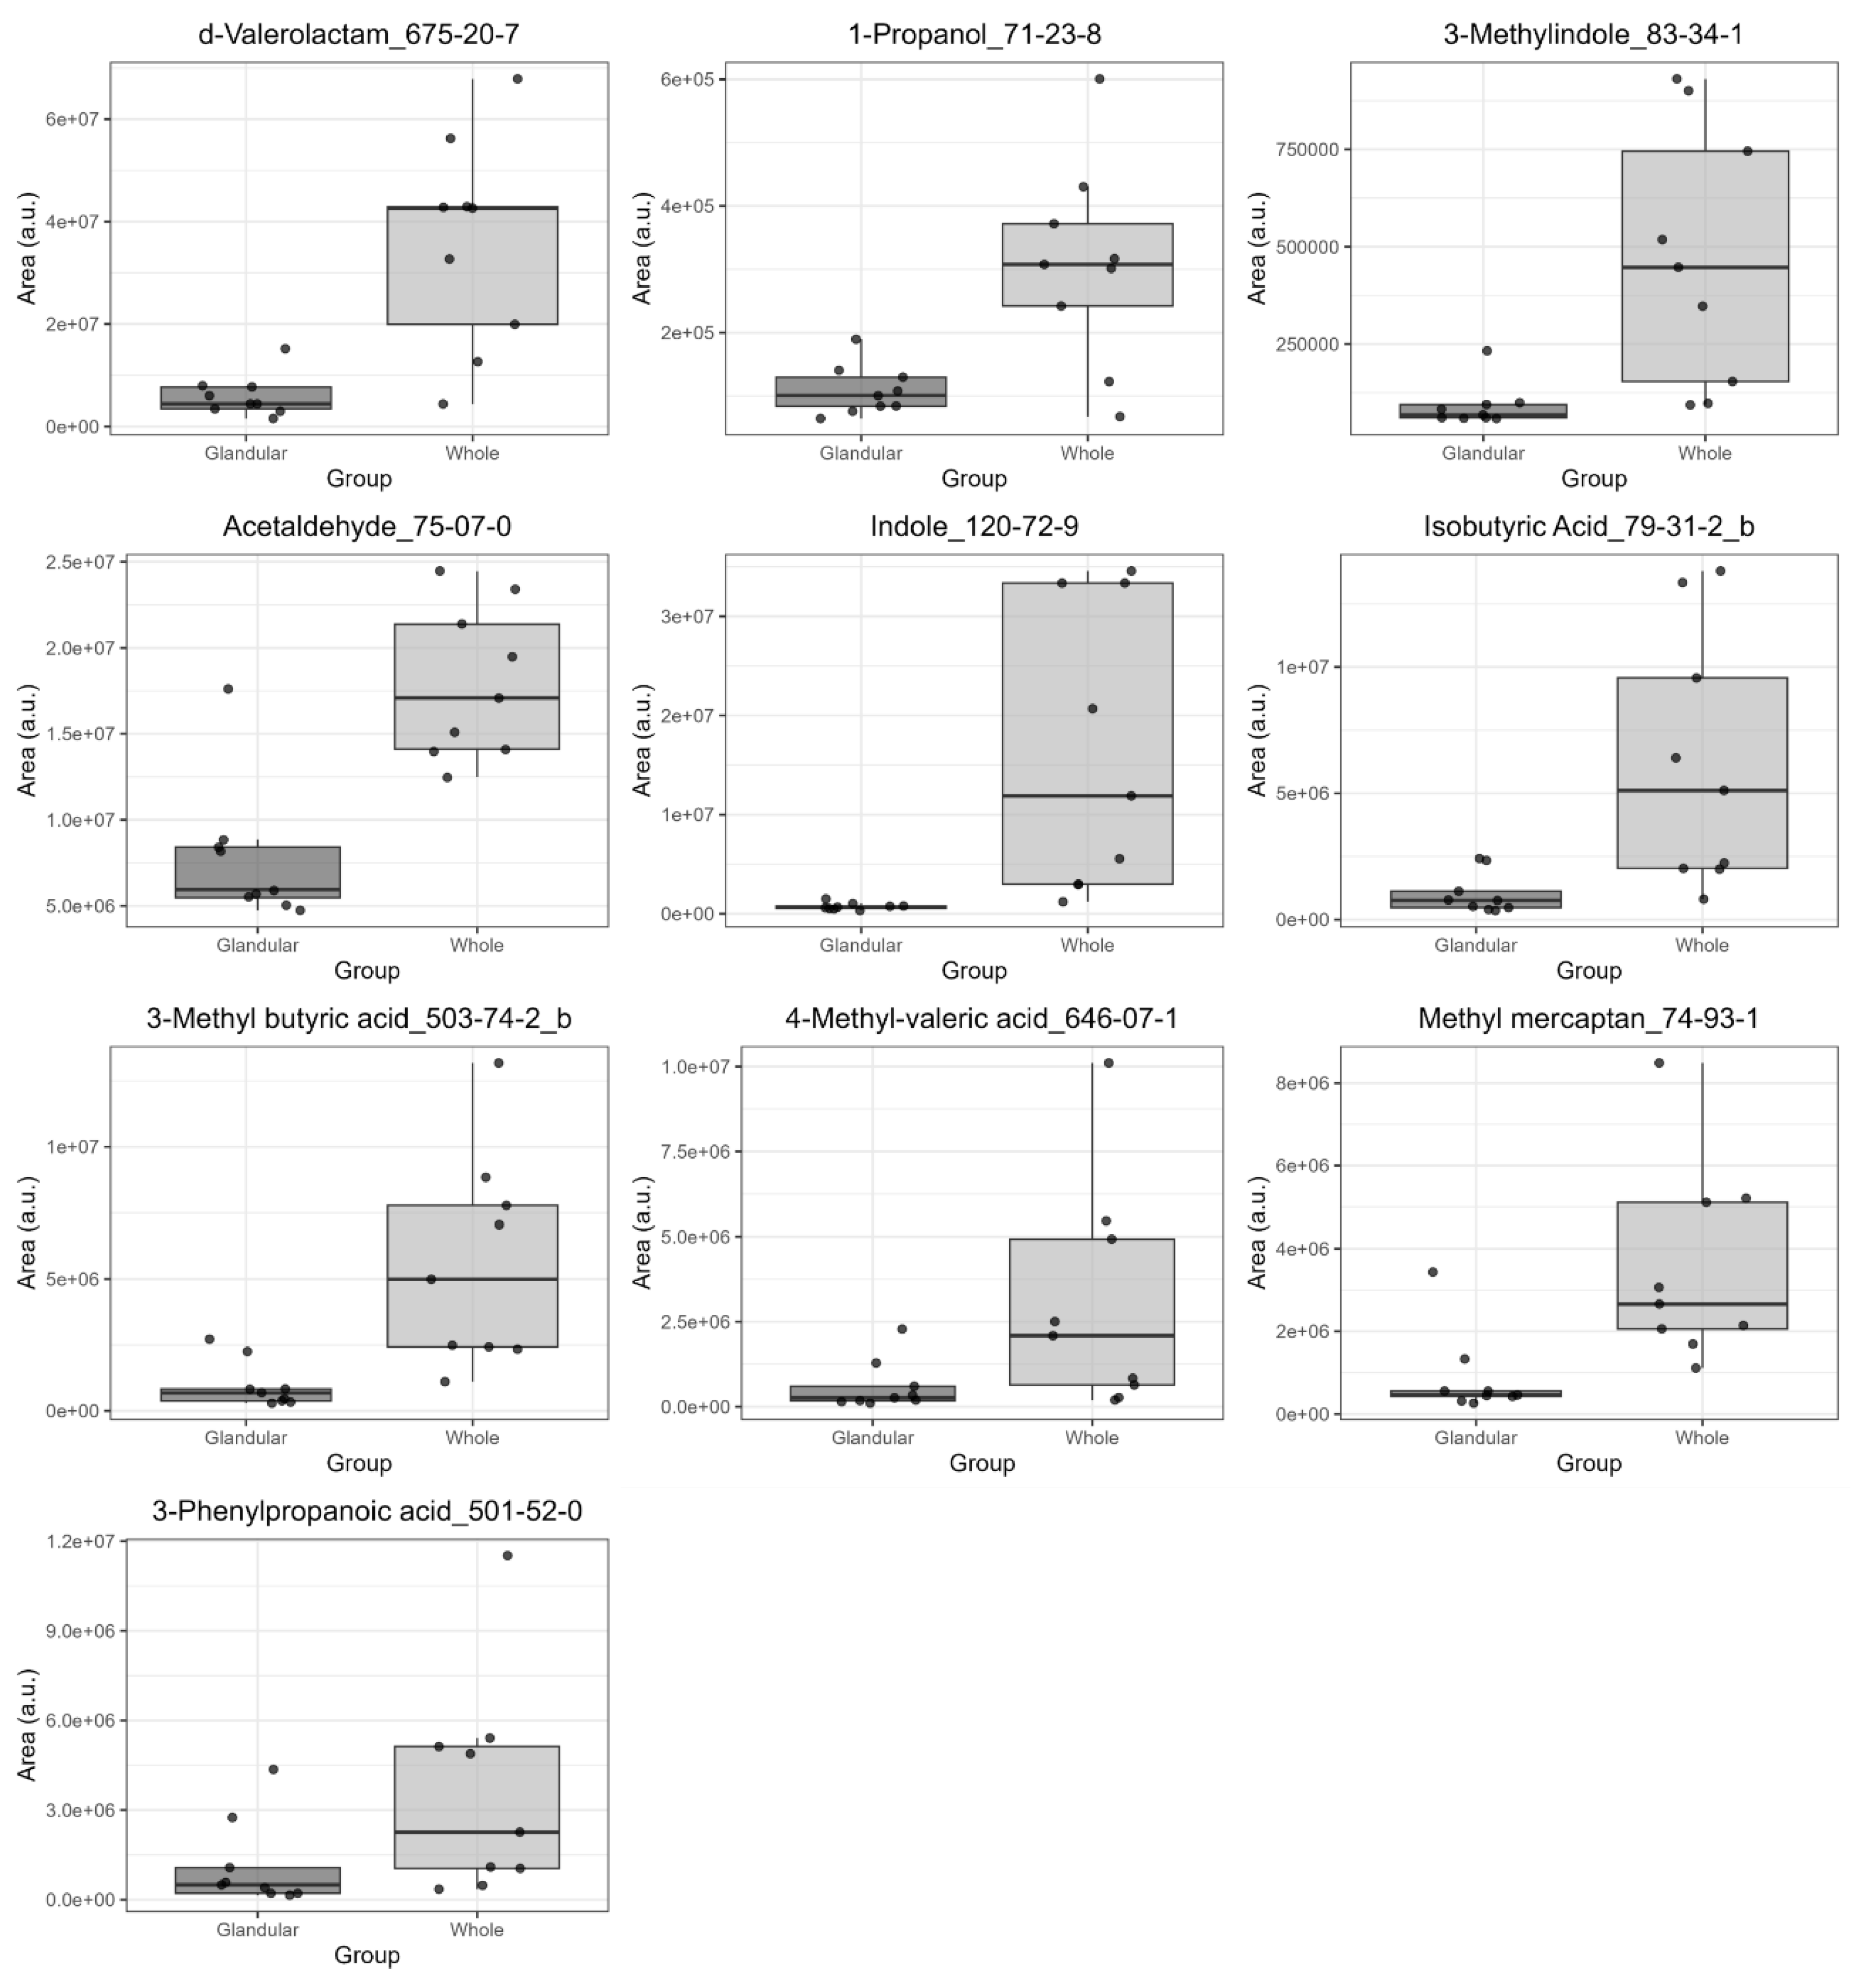

Table 1.
Participants’ information (ID, age, and sex).
| ID | Age | Sex |
|---|---|---|
| 01 | 72 | M |
| 02 | 44 | F |
| 03 | 48 | F |
| 04 | 30 | M |
| 06 | 49 | F |
| 08 | 22 | M |
| 10 | 22 | M |
| 12 | 24 | F |
| 13 | 23 | F |
| 17 | 27 | F |
Table 2.
List of compounds with VIP > 1.0 (VIP scores, results of the Wilcoxon signed-rank test, and Salivette blank evaluation).
Table 2.
List of compounds with VIP > 1.0 (VIP scores, results of the Wilcoxon signed-rank test, and Salivette blank evaluation).
| Compound | OPLS-DA VIP |
Wilcoxon signed-rank test (q < 0.05) |
Salivette blank evaluation* |
|---|---|---|---|
| δ-Valerolactam | 1.75 | 0.028 | No |
| 3-Heptanone | 1.70 | 0.016 | Yes |
| 1-Propanol | 1.67 | 0.016 | No |
| Skatole | 1.58 | 0.016 | No |
| Acetaldehyde | 1.54 | 0.016 | No |
| Indole | 1.54 | 0.016 | No |
| Formic acid | 1.52 | 0.016 | ** |
| Propionic acid | 1.52 | 0.035 | Yes |
| Isobutyric acid | 1.50 | 0.016 | No |
| Isovaleric acid | 1.50 | 0.016 | No |
| Octanoic acid | 1.49 | 0.016 | Yes |
| 2-Pentylfuran | 1.40 | 0.016 | ** |
| 2-Methyl-1-butanol | 1.32 | 0.086 | Yes |
| 4-Methylvaleric acid | 1.27 | 0.035 | No |
| Methyl mercaptan | 1.26 | 0.035 | No |
| Linoleic acid | 1.24 | 0.016 | ** |
| Propionamide | 1.23 | 0.128 | No |
| 1-Dodecene | 1.21 | 0.016 | ** |
| Butyric acid | 1.15 | 0.289 | Yes |
| 3-Phenylpropionic acid | 1.14 | 0.028 | No |
| 4-Vinylphenol | 1.13 | 0.065 | ** |
| Acetic acid | 1.07 | 0.065 | Yes |
* Based on the t-test between water with and without Salivette (p < 0.05). ** The compounds could not be confirmed as blanks because they were not detected in blank analysis (using water as a sample).
Disclaimer/Publisher’s Note: The statements, opinions and data contained in all publications are solely those of the individual author(s) and contributor(s) and not of MDPI and/or the editor(s). MDPI and/or the editor(s) disclaim responsibility for any injury to people or property resulting from any ideas, methods, instructions or products referred to in the content. |
© 2025 by the authors. Licensee MDPI, Basel, Switzerland. This article is an open access article distributed under the terms and conditions of the Creative Commons Attribution (CC BY) license (http://creativecommons.org/licenses/by/4.0/).
Copyright: This open access article is published under a Creative Commons CC BY 4.0 license, which permit the free download, distribution, and reuse, provided that the author and preprint are cited in any reuse.


