
Submitted:
08 October 2025
Posted:
08 October 2025
You are already at the latest version
Abstract
Afghanistan, a semi-arid region with limited prior research. This study presents an integrated assessment of urban flood vulnerability by analyzing land use land cover change (LULCC), climate variability, and geophysical factors using remote sensing, GIS, and multi-criteria decision analysis. Landsat imagery indicates built-up areas increased from 124 km² in 2004 to 180 km² in 2024, while agricultural land decreased from 1,978 km² to 1,883 km². Climate data show rising temperatures and intensifying rainfall, exacerbating flood hazards. Geospatial analysis of elevation, slope, drainage density, and proximity to water bodies highlights the high vulnerability of low-lying areas. The Analytical Hierarchy Process (AHP) integrates diverse flood risk factors to produce accurate flood hazard maps. High and very-high flood susceptibility zones expanded from 5,706 km² in 2004 to 5,985 km² in 2024, whereas low-susceptibility zones declined from 131 km² to 112 km². These results underscore the need for adaptive land use planning, resilient drainage systems, and community-based flood risk reduction. The study provides actionable insights for sustainable flood management and demonstrates the value of combining GIS, remote sensing, and multi-criteria analysis in data-scarce, conflict-affected regions.
Keywords:
urban flooding
; socioeconomic consequences
; climate change
; urbanization
; land use planning
1. Introduction
Urban flooding has significant negative socioeconomic consequences, disrupting essential urban services such as transportation, sewerage, communication, and electricity supply, while also causing direct harm to infrastructure and property (Jongman 2018). The economic losses from urban flooding can be immense, with global weather-related disaster losses exceeding $300 billion in 2017, and the trend is rising due to increased urbanization and climate change, which intensifies rainfall and flood events (Dharmarathne et al. 2024). Urban infrastructure including transportation networks and critical facilities is particularly vulnerable, leading to business disruptions, supply chain shocks, and welfare losses that often disproportionately affect the poorest and most vulnerable populations (Park et al. 2024). There is growing concern about the heightened probability of flooding in densely populated urban areas worldwide, driven by a combination of rapid urbanization, climate change, and increased encroachment on floodplains (Deopa et al. 2024). Urbanization not only increases the number of people and valuable assets at risk but also exacerbates flood hazards by expanding impervious surfaces, reducing green spaces, and intensifying stormwater runoff, as seen in cities like Delhi and Houston, where urbanization has dramatically amplified both rainfall impacts and flood damage (Zhang et al. 2018). Modifications in climate patterns and urban growth are widely recognized as two of the most significant drivers escalating urban flood risks, posing major challenges for both current and future flood management strategies (Hettiarachchi et al. 2018). Climate change leads to more frequent and intense rainfall events, raising the probability and severity of urban flooding, while urban growth especially rapid expansion and increased impervious surfaces amplifies runoff and reduces natural drainage, further heightening flood risk (Ajjur and Al-Ghamdi 2022). Climate variation significantly affects the water cycle, leading to more frequent and intense extreme precipitation events, which in turn can substantially increase surface runoff and the likelihood of high-intensity floods (Tabari 2020). As global temperatures rise, the hydrological cycle intensifies, resulting in stronger links between water availability, extreme rainfall, and flood events especially in wetter regions and during wetter seasons (Brêda et al. 2023). Urbanization, driven by population and economic expansion, is a major factor behind the increase in impermeable surfaces such as concrete and asphalt which significantly heightens urban regions' susceptibility to flooding (Feng et al. 2021). As cities grow, natural land is replaced with built-up areas, leading to a sharp reduction in infiltration and a dramatic rise in surface runoff and flood peaks during rainfall events (Zhou et al. 2019). Urban drainage systems are a vital part of city infrastructure, designed to efficiently remove excess water from urban areas and control flooding while maintaining reliable service standards (Getirana et al. 2023). Research shows that well-designed urban drainage networks can significantly reduce urban flooding during extreme events, with studies in cities like Rio de Janeiro demonstrating a 31-53% decrease in flood extent and a 60-80% reduction in the number of residents exposed to flooding when effective drainage is present (Chen and Huang 2024). Climate change and urbanization not only increase the frequency and severity of surface-level flooding but also have profound impacts on the planning, design, and performance of urban drainage systems (Kumar et al. 2022). Climate change leads to more intense and frequent extreme rainfall events, which can overwhelm existing drainage infrastructure, resulting in greater waterlogging, increased inundation volumes, and more frequent system failures if not properly accounted for in design and management (Arnbjerg-Nielsen et al. 2013). Persistent shifts in hydrological patterns such as changes in surface flooding pathways and flood characteristics can drive significant modifications in urban land use planning and drainage infrastructure to mitigate flood risks (Ye et al. 2023). Research shows that as rainfall patterns and land use evolve, cities must adapt by redesigning drainage systems and adjusting land use to manage increased runoff and expanded flood-prone areas (Mayou et al. 2024). Flood risks and susceptibility are directly shaped by both above-ground and below-ground routing and conveyance mechanisms, which determine how water moves through urban environments during heavy rainfall. Above-ground pathways, such as streets, open channels, and surface topography, influence the direction and speed of surface runoff, affecting which areas are most prone to flooding and how quickly floodwaters accumulate (Termeh et al. 2018). Below-ground systems, including stormwater drains, culverts, and underground transport networks, play a crucial role in conveying excess water away from the surface, but their effectiveness can be compromised by blockages, limited capacity, or cascading failures during extreme events (Gonzva et al. 2017). The size of the land area served by a drainage system is a highly influential factor in shaping hydrological runoff responses, often surpassing the effects of impervious surface percentage or development type. Larger catchment areas can generate significantly greater runoff volumes and peak discharges, especially during extreme precipitation events, making the scale of drainage systems critical for effective flood management (Kalantari et al. 2014). The standard approach for forecasting the impacts of climate change involves using outputs from Global Climate Models (GCMs), which simulate climate processes on a global scale, and then applying downscaling techniques or higher-resolution Regional Climate Models (RCMs) to capture local and regional climate details. GCMs provide broad, coarse-resolution projections, but their ability to represent local features such as variable landforms or extreme weather events is limited, making RCMs essential for adding detail and improving accuracy at smaller scales (Rummukainen 2016). Recent research has increasingly focused on how climate change intensifies stormwater runoff, strains urban drainage systems, and raises the frequency and severity of urban floods. Studies using regional climate models and hydrodynamic simulations show that future climate scenarios will likely bring more intense and frequent rainfall, leading to a dramatic increase in flooded locations, flood duration, and flood frequency in urban areas sometimes making what is now a rare 20-year flood as common as a 2-year event in the future (Yang Y et al. 2024). Past evaluations of urbanization’s influence on hydrological patterns have primarily relied on modeling approaches at large spatial scales, such as river catchments or basins. Commonly used hydrological models include HEC-HMS, SWAT, and distributed models like DHSVM, which are often integrated with land use development models and socioeconomic scenarios to simulate how urban expansion alters runoff, infiltration, and flood risk (Shao M et al. 2020). Urban land use classification and modeling of dynamic urban characteristics have long faced significant limitations, largely due to challenges in obtaining extensive, high-quality historical data and the complexity of simulating land use changes over time (Chowdhury 2024). Traditional methods often struggle with the heterogeneity and rapid evolution of urban environments, leading to lower accuracy in classifying mixed or transitional land uses and difficulties in capturing fine-scale temporal dynamics (Li et al. 2024). Understanding the factors driving shifts in flood risk is essential for developing effective mitigation and adaptation strategies, especially as both climate change and urbanization intensify flood hazards. Key drivers include increased urbanization leading to more impermeable surfaces and greater exposure of people and assets and climate change, which amplifies the frequency and severity of extreme rainfall and flooding events (Jongman 2018). Studies in Afghanistan’s major watersheds have found that changes in land use particularly the expansion of irrigated agriculture exert a more substantial influence on hydrology than climate variability alone. For example, in the Middle Helmand Basin, a 62% increase in irrigated area from 1990 to 2011 led to a significant reduction in annual streamflow, with agricultural development causing a decrease of up to 810 million cubic meters per year in river discharge and a marked rise in water depletion per hectare (Hajihosseini et al. 2020). Research across various river basins has consistently shown that climate change can be the dominant factor influencing hydrological responses, especially in regions where temperature and precipitation patterns are shifting significantly. Studies in large semi-arid river basins in the United States, such as the South Platte River Basin in Colorado, demonstrate that projected increases in temperature and slight reductions in precipitation can lead to notable decreases in stream discharge, groundwater storage, and crop yield, highlighting the substantial impact of climate change on water resources and hydrology (Aliyari et al. 2021). Research in the Sahel Zone suggests that both land use changes and climate variability have contributed roughly equally to increased river flooding, but the specific impacts of climate change and urbanization on urban flooding at the city level and the role of drainage systems are still being clarified (Zhou et al. 2019). Recent studies across diverse urban environments show that urbanization, by increasing impervious surfaces, often has a greater effect on urban flood volumes than climate change alone, sometimes amplifying runoff and flood risk by several hundred percent (Hassan et al. 2022). Vulnerability has become a central concept in environmental change and sustainability science, reflecting the need to understand who and what are at risks from multiple, interacting environmental stresses. Modern frameworks emphasize that vulnerability is not determined solely by exposure to hazards, but also by the sensitivity and resilience of coupled human environment systems, requiring integrated assessments that consider both social and ecological dimensions (Turner et al. 2003). The IPCC’s definition of vulnerability has evolved over its assessment reports. In the Third Assessment Report (TAR), vulnerability is defined as the extent to which a system is prone to negative impacts from climate variability or extremes, emphasizing sensitivity and adaptive capacity as key internal properties (Füssel and Klein 2006). There is strong evidence in the literature that evaluating flood risks is essential for effective disaster mitigation, and Multi-Criteria Decision Analysis (MCDA) methods have proven especially valuable for urban flood management. MCDA approaches allow for the integration of technical, environmental, and socio-economic factors, often incorporating expert opinions to assess and prioritize flood management options within catchment areas, as demonstrated in the Setubal, Portugal case (Bana e Costa et al. 2014). This study addresses a critical gap by providing an integrated assessment of urban flood vulnerability in Nangahar, Afghanistan, focusing on the combined pressures of rapid urbanization and climate change an area with limited prior research, especially in conflict-affected regions. While direct studies on Nangahar are scarce, regional evidence from Afghanistan and neighboring countries shows that rapid urban expansion, increased impervious surfaces, and shifting LULC patterns significantly heighten flood risks, particularly when compounded by more erratic rainfall and rising LST linked to climate change. Our findings aim to redefine resilience frameworks for semi-arid urban systems, offering actionable insights for policymakers navigating compounded environmental and anthropogenic stressors.
2. Study Area
The Eastern Hindukush region, including Nangahar, Afghanistan, is characterized by rugged mountainous terrain with altitudes ranging from 2000 to 3500 meters above mean sea level. This area is part of the broader Hindu Kush Mountain system, which features deep valleys, high peaks, and a complex mosaic of microclimates due to its diverse topography. Available research provides some insight into household statistics for Nangahar, Afghanistan, though precise and up-to-date population figures are limited. A 2003 survey in Nangarhar province included 362 households, with an average of 2.8 respondents per household aged 15 years or older. The region’s complex relief has been predominantly shaped by the tectonic interactions between the Indian and Eurasian plates, which have resulted in the accretion of multiple Lith tectonic blocks, and the formation of prominent suture and fault zones show in (Figure 1).
These tectonic processes include several major orogenic (mountain-building) events: the Vari scan (Hercynian), Cimmerian, and Himalayan (Alpine) orogenies, each contributing to the region’s intricate geological structure. The area falls within a sub-humid climate zone, experiencing substantial precipitation during the summer months primarily due to monsoonal influences and heavy snowfall in winter (Breckle and Rafiqpoor 2020). This combination of high elevation and diverse relief results in a mosaic of microclimates, supporting a rich biodiversity and varied vegetation cover, including dense forests in some southeastern slopes and more open woodlands or steppes elsewhere. Recent studies in Nangarhar confirm that local farmers perceive significant climate variability, with increased temperatures, more frequent droughts, and changes in precipitation patterns impacting water resources and agriculture (Noor et al. 2024). Projected climate models suggest that eastern Afghanistan, including Nangahar, may see increased summer precipitation under certain future scenarios, though there is considerable uncertainty among models. These climatic and topographic factors together heighten the region’s vulnerability to both drought and flooding.
3. Dataset
Observed, satellite, and reanalysis data products are widely used in climate and hydrological research to improve spatial accuracy and reduce systematic errors, especially in regions with limited ground-based observations shown in (Table 1).
3.1. To Quantify Regional Climate Variation
Digital elevation model (DEM) was obtained from the National Aeronautics and Space Administration (NASA) Earth data to support topographic analysis, while Landsat data was acquired for LULC mapping. Rainfall data from the Afghanistan Meteorological Department (AMD) and flood inventories from the National and Provincial Disaster Management Authorities (NDMA & ADMA) are crucial for understanding long-term hydrometeorological trends and flood risk in Afghanistan. Studies using long-term rainfall records (1975-2021) have enabled the development of intensity-duration-frequency (IDF) curves and trend analyses, which are essential for flood risk management and infrastructure planning, as demonstrated in Nangahar Province Google Earth images 2004, 2014, 2024.
4. Methodology
To investigate long-term spatial-temporal climate variation, regional geophysical attributes, LULC change, and flood area demarcation, a combination of non-parametric and statistical modeling approaches often implemented on platforms like GEE and ArcGIS 10.8 has proven effective. Studies have used remote sensing data and machine learning and high-resolution LULC maps, analyzing climate trends, and delineating flood-affected areas detailed shown in (Figure 2).
4.1. Measure Long-Term Climate Variability
The Sen’s slope estimator, a non-parametric statistical method, is widely used to quantify the magnitude and direction of trends in rainfall and LST time series, often after correcting for autocorrelation with the Lag-1 technique to ensure robust results (Panda and Sahu 2019). The Inverse Distance Weighted (IDW) interpolation method is widely used to estimate regional rainfall distribution from station records, as it assigns greater weight to rainfall values from stations closer to the point of interest, producing a continuous rainfall surface across the study area (Yang X et al. 2015).
4.2. Estimate the Geophysical Characteristics of Nangahar Province
Regional geophysical and flood acclimatizing factors are key determinants of flood susceptibility and include both natural and anthropogenic variables. Important geophysical factors identified in research are altitude, slope, aspect, curvature, stream power index (SPI), topographic wetness index (TWI), and proximity to rivers and roads (Yadav et al. 2024). Moreover, distance from water bodies was also calculated to influence how water moves across the landscape, accumulates, and potentially causes flooding. Low elevation, high TWI, and proximity to rivers are generally more prone to flooding (Tehrany et al. 2019).
4.3. Flood Susceptibility Mapping
A variety of flood-quantifying techniques have been developed and applied locally to regional scales, each with specific strengths and applications (Lima et al. 2016). The Analytical Hierarchy Process (AHP) is a widely used method for multi-criteria decision-making, particularly effective for classifying and prioritizing geophysical attributes. In geophysical applications, attributes are often reclassified into ordered classes (such as "very high" to "very low") to standardize variables before applying AHP. The process involves constructing a hierarchical structure of criteria and alternatives, then using pairwise comparisons to derive relative weights or priorities for each attribute based on expert judgment. These weights reflect the influence importance of each attribute in the final decision classification scheme (Wang et al. 2021). In flood zonation mapping, the CR is a critical measure used to evaluate the uniformity and reliability of the standardized influence weights assigned to variables, especially when using the AHP. A maximum consistency ratio of 10% is commonly adopted as a threshold to ensure that the pairwise comparisons made during the weighting process are acceptably consistent and not random or contradictory. This threshold helps validate that the judgments used to assign influence on each variable (such as slope, rainfall, land use) are logically coherent, thereby increasing the credibility of the final flood susceptibility zonation map (Ali et al. 2019).
5. Results
5.1. Geophysical Distributions of Nangahar Province
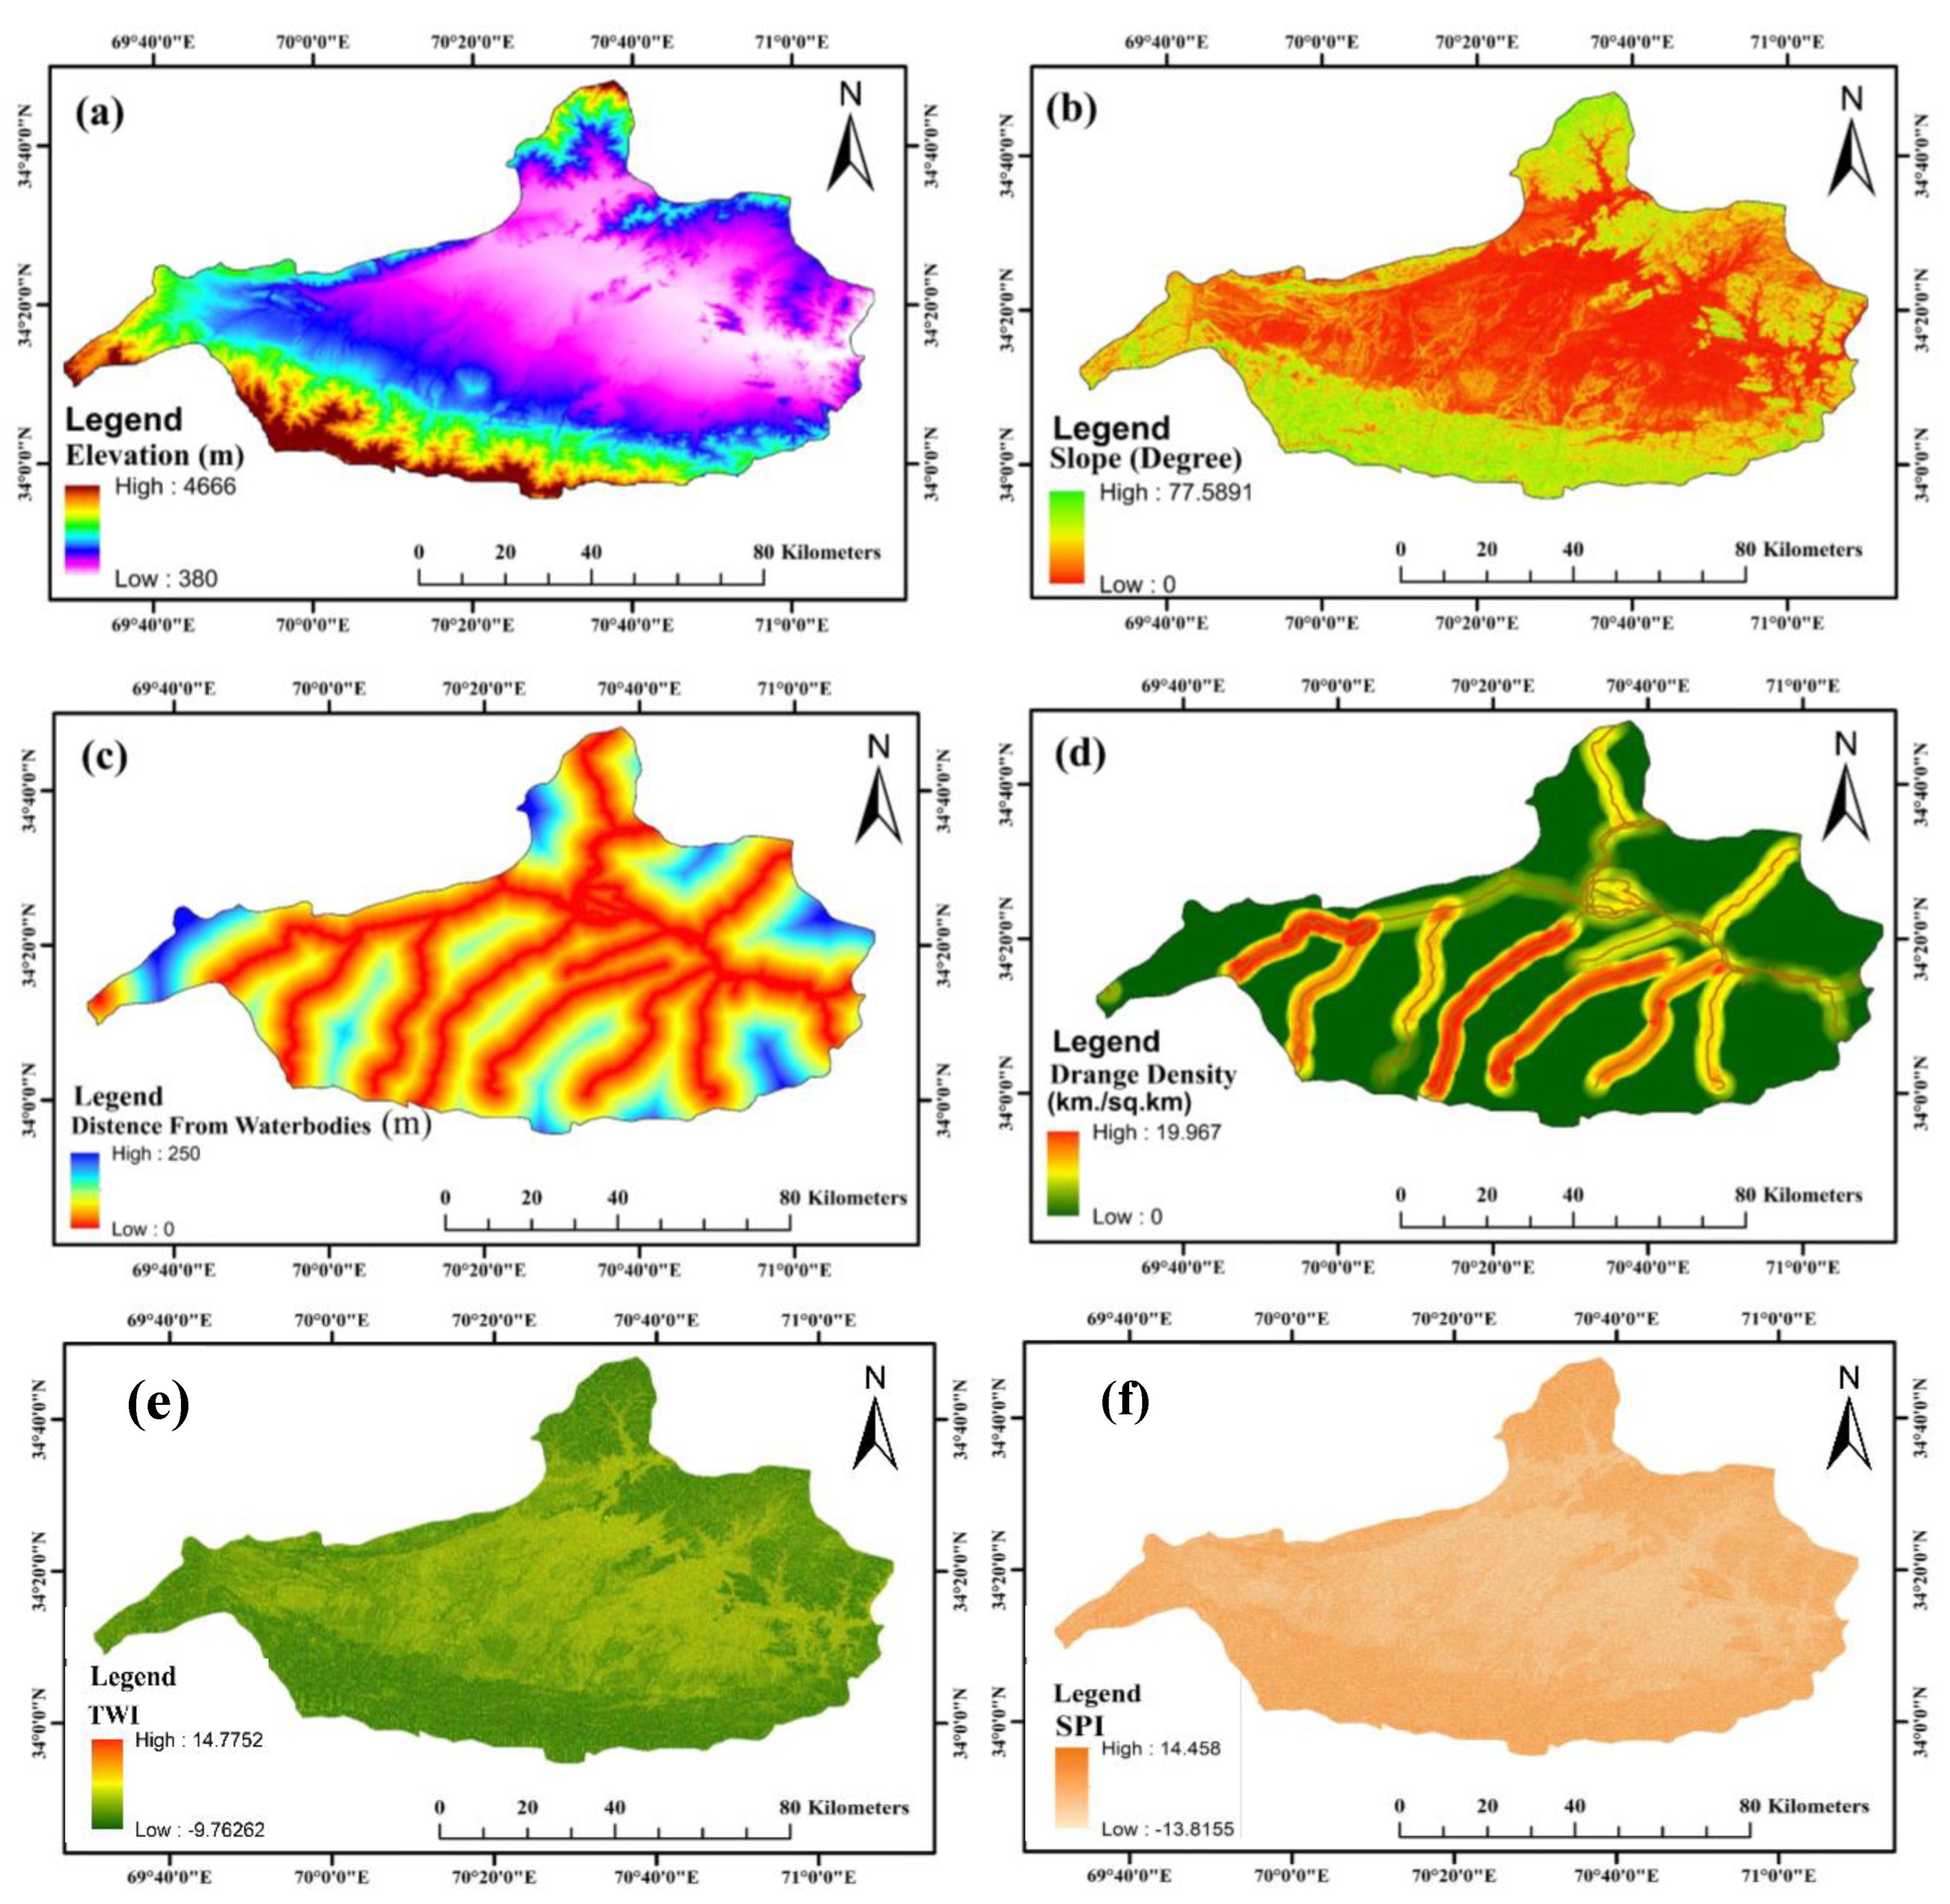
Geophysical distributions such as elevation, slope, distance to water bodies, and drainage density are fundamental parameters in hydrological and groundwater studies. Elevation and slopes, derived from digital elevation models, influence surface water flow, infiltration, and groundwater recharge, with steeper slopes generally leading to faster runoff and less infiltration, while low slopes favor water accumulation and recharge show in (Figure 3). DEMs are widely used to represent and analyze the Earth's surface, providing detailed information about altitude variations across a study area (Figure 3a). Regional slope distribution often mirrors the spatial patterns observed in DEMs, with areas of higher elevation typically corresponding to regions of greater surface inclination (Figure 3b). Surface elevation models are commonly used to calculate the actual distance from surrounding water bodies, which is essential for hydrological analysis and land use planning. Advanced methods, such as those using multi-generated data, can simultaneously detect water bodies and generate accurate DEMs, allowing for precise measurement of distances between land features and water bodies (Figure 3c). Drainage density (DD) is typically estimated by DEMs by delineating the stream network, assigning stream order, and calculating line density, which together provide a quantitative measure of how densely streams are distributed across a landscape (Figure 3d).
Subsequently, spatial TWI mapping was initiated by employing the DEM, which contains information about the hydrological situation and water holding capacity. The maximum TWI was observed in northeastern portion of the study area, trailed by west and southwest (Figure 3e). Concurrently, a spatial analysis of the (SPI) was conducted using the high-resolution DEM to quantify the theoretical erosive force of surface runoff. The most significant stream power was predominantly associated with the high-gradient slopes and concentrated flow pathways in the upper catchment areas (Figure 3f).
Figure 3.
Geophysical and topographic distributions of Nangarhar (a) elevation map, (b) slope map, (c) distance from water bodies, (d) DD, (e)) TWI, (f) SPI.
Figure 3.
Geophysical and topographic distributions of Nangarhar (a) elevation map, (b) slope map, (c) distance from water bodies, (d) DD, (e)) TWI, (f) SPI.
5.2. Distribution and Change of Regional LULC
Yearly distribution and trends of different LULC classes are commonly analyzed using remote sensing and machine learning techniques, which allow for accurate mapping and monitoring of changes over time. Studies have shown that supervised classification methods, such as Random Forest and maximum likelihood classifiers, can achieve high accuracy in yearly LULC mapping, especially shown in (Figure 4). Progressive increase in built-up land from 124 km2 in 2004 to 140 km2 in 2014, and further to 180 km2 in 2024 reflects a clear pattern of rapid urbanization. This trend is consistent with global and regional studies, which document significant expansion of urban built-up areas over recent decades, often at the expense of agricultural and natural land. The observed decline in agricultural land from 1978 km2 in 2004 to 1915 km2 in 2014, and further to 1883 km2 by 2024 strongly highlights the impact of urban expansion encroaching on fertile land in (Figure 4d). This trend is widely documented in research, with studies across various regions reporting that rapid urbanization leads to the conversion of agricultural land into built-up areas, particularly in peri-urban zones
The marginal reduction in water bodies from 52 km2 in 2004 to 48 km2 in 2014, and slightly to 47 km2 in 2024 suggests a gradual degradation of aquatic ecosystems, a trend widely observed in research (Figure 4d). This decline is often linked to urbanization, industrialization, and agricultural activities, which introduce contaminants, increase nutrient loads, and alter natural hydrological patterns, ultimately degrading water quality and reducing aquatic habitat. Open space remains the dominant land cover type across all years, with only minor fluctuations from 5542 km2 in 2004 to 5593 km2 in 2014, and 5586 km2 in 2024, indicating relative stability compared to other categories. However, the overall landscape is undergoing significant transformation due to anthropogenic activities, particularly rapid urban growth, which is driving the expansion of built-up land at the expense of agricultural and aquatic resources.
5.3. Regional Flood Susceptibility Mapping to LULC Classes
Current research on the spatial and temporal dynamics of flood susceptibility highlights the importance of mapping and monitoring changes in flood-prone areas over time, specifically addressing Nangarhar Province of the exact years 2004, 2014, and 2024 in (Figure 5a-c). Studies in regions using GIS and machine learning approaches have shown that flood susceptibility can be effectively categorized into classes such as very-low, moderate, high and very-high, and that these categories often shift over time due to factors like land use change, rainfall variability, and hydrological alterations.
Changes in hydrological and land use conditions such as increased urbanization, loss of vegetation, and expansion of impervious surfaces lead to a reduction in very-low and moderate flood susceptibility zones, while high and very-high susceptibility zones expand. As natural vegetation is converted to agricultural or built-up land, infiltration decreases and surface runoff increases, making more areas vulnerable to flooding and shrinking the extent of safer zones. Quantitative assessments of flood susceptibility using advanced modeling techniques consistently show that areas classified as very-high susceptibility tend to increase over time, reflecting growing vulnerability due to both natural and human-induced changes. A consistent decline in very-low flood susceptibility areas over time, as indicated by a reduction from 131 km2 in 2004 to 125 km2 in 2014, and further to 112 km2 in 2024, aligns, flood-free zones are shrinking due to urbanization and changing land use patterns in (Figure 5d). Reduction in moderate susceptibility areas from 1859 km2 in 2004 to 1599 km2 in 2024 reflects a broader global pattern where moderate-risk zones shrink as high and very-high risk zones expand, driven by changes in land use. Steady increase in high susceptibility areas, such as from 1,537 km2 in 2004 to 1,698 km2 in 2024, and a similar expansion in very-high susceptibility zones, which can come to dominate. The expansion of very-high flood susceptibility zones from 4,169 km2 in 2004 to 4,287 km2 by 2024 reflects a global trend where the most at-risk areas are growing and increasingly dominating landscapes.
6. Discussion
6.1. Urbanization and Escalating Flood Risk
Multiple studies confirm that rapid urban expansion in Afghanistan has significantly increased built-up areas while reducing agricultural and aquatic land cover. In major cities such as Kabul and Herat, satellite and remote sensing analyses from 1993 to 2021 show dramatic increases in built-up land, with Kabul’s built-up area expanding by over 227 km2, while vegetation and water bodies declined substantially during the same period (Sahak, Karsli, Saraj 2024). In Herat, built-up areas increased by about 30%, while vegetation and water bodies decreased by 8.5% and 1.1%, respectively, between 2000 and 2021 (Sahak, Karsli, Ahmadi, et al. 2024). Global research strongly supports the observation that urbanization accelerates surface runoff, reduces infiltration capacity, and magnifies flood peaks. As cities expand, the increase in impervious surfaces such as roads and buildings leads to less water infiltrating into the ground and more water running off into drainage systems and rivers. This process results in higher and faster peak flows during rainfall events, increasing the risk and severity of urban flooding (Huang et al. 2024). The spatial arrangement and density of urban development also influence runoff patterns, with high-density and compact urban forms generating more localized runoff, while low-density sprawl can lead to greater overall loss of green space and increased runoff at the city scale (Xu et al. 2020). The relationship between impervious surface area and runoff is well established: even moderate increases in imperviousness can double or triple runoff volumes and shift flood peaks earlier (Shao Z et al. 2019).
6.2. Climate Variability and Hydrological Stress
Climatic fluctuations in eastern Afghanistan, particularly increased summer precipitation and rising temperatures, have been shown to exacerbate flood susceptibility by intensifying rainfall-runoff responses. Regional studies confirm that precipitation during the warmest quarter and extreme rainfall events are major drivers of flood susceptibility, with climate change scenarios projecting dynamic and expanding flood-prone areas in Afghanistan and neighboring South Asian countries (Janizadeh et al. 2024). In the Kabul River Basin, climate models project a 14% increase in annual precipitation and a 4.7°C rise in temperature, leading to a 37% increase in maximum flood inundation area and deeper floodwaters, even when mean river flows increase only slightly (Baig 2024). The observed expansion of high-risk flood zones between 2004 and 2024 is consistent that climate change amplifies extreme rainfall events, increasing both the frequency and severity of urban floods. Multiple studies confirm that climate change leads to more intense and frequent extreme rainfall, particularly in urban areas, which in turn raises the risk and magnitude of urban flooding. The Nangarhar case localized topography and climatic variability interact synergistically with anthropogenic land use changes to create compounding hydrological stresses. Research from diverse regions demonstrates that watershed hydrology is shaped by the interplay of terrain, climate fluctuations, and LULCC. Steep or mountainous topography amplifies the effects of urbanization and deforestation, leading to increased surface runoff, reduced infiltration, and heightened flood risk, especially when combined with more intense or variable rainfall patterns. In such settings, urban expansion and agricultural conversion further disrupt natural hydrological processes, compounding the impacts of climate-driven changes in precipitation and temperature. Studies consistently find that the combined effects of land use change and climate variability are often greater than their individual impacts, with spatial variability in hydrological responses depending on local terrain and land management practices.
6.3. Drainage Infrastructure and Adaptive Capacity
The findings indicate that increasing impervious surfaces and associated hydrological alterations significantly challenge the effectiveness of existing drainage networks in urban areas like Nangarhar. As impervious surfaces expand, more rainfall becomes surface runoff, overwhelming drainage systems that were not designed for such high volumes, leading to increased flood risk and surface inundation. Research from various urban centers consistently shows that poorly designed or undersized drainage systems can significantly exacerbate flood hazards during intense rainfall events. Inadequate stormwater drainage, combined with increased impervious surfaces and climate change, leads to drainage systems being overwhelmed even under moderate rainfall, resulting in extensive urban flooding and increased flood volumes (Hassan et al. 2022). The expansion of flood-prone zones in Nangarhar, combined with its lack of robust drainage infrastructure, highlights the urgent need for adaptive drainage planning. Research from other rapidly urbanizing and flood-prone regions demonstrates that adaptive strategies such as integrating green infrastructure, increasing drainage channel capacity, and employing flexible, data-driven planning are essential for managing increased runoff and mitigating flood risks. Studies emphasize that a combination of infrastructure upgrades, nature-based solutions, and participatory planning involving local stakeholders leads to more resilient and sustainable urban drainage systems. Flexible, incremental adaptation pathways and decision-support tools help cities respond to climate uncertainties and evolving flood hazards, ensuring that drainage improvements remain effective as conditions change (Gersonius et al. 2013). Prioritizing drainage system optimization, supported by community engagement and advanced technologies, is critical for Nangarhar to address its growing flood risks and build long-term resilience.
6.4. Socioeconomic Vulnerability and Equity Concerns
The disproportionate expansion of high and very-high flood susceptibility zones is especially concerning in Nangarhar’s socioeconomic context, where limited resources and infrastructure heighten vulnerability to flood impacts. Research from other regions shows that rapid urbanization and economic development, when not matched by sustainable planning, lead to significant increases in high-risk flood zones, particularly affecting areas with weaker socioeconomic resilience. In such contexts, the expansion of built-up land and reduction of ecological land exacerbate surface runoff and flood susceptibility, disproportionately impacting poorer communities that often lack adequate protection and recovery resources (Fu et al. 2025). Global research strongly supports the observation that populations residing in low-lying, rapidly urbanizing zones are often among the poorest and least resilient, and that urban flooding disproportionately affects marginalized communities. Studies from cities such as Los Angeles and across the United States reveal that flood risks and exposure are significantly higher for low-wealth, non-white, and socioeconomically disadvantaged populations, who also face greater challenges in recovery and are more likely to live in flood-prone areas with deficient infrastructure (Sanders et al. 2023). As very-low flood susceptibility zones shrink, displaced communities are likely to face heightened exposure to both direct flood damage and indirect socioeconomic disruptions. Research shows that when residential areas are forced into higher susceptibility zones, the risk of property loss, injury, and displacement increases significantly, especially for those living at watershed outlets or in rapidly urbanizing regions. Indirect impacts include the loss of agricultural productivity, as flood-prone land becomes less suitable for farming, and the degradation of water resources due to increased runoff, sedimentation, and pollution (Mahmoud and Gan 2018). These changes can disrupt local economies, threaten food security, and strain water supplies, compounding the vulnerability of already at-risk populations.
6.5. Implications for Regional Flood Governance
This study fills a critical research gap by demonstrating how the combined pressures of urbanization and climate change intensify flood risks in semi-arid, conflict-affected regions areas that have historically received limited scientific attention. Evidence from diverse global contexts shows that rapid urban growth, especially when unplanned, increases impervious surfaces and disrupts natural drainage, leading to higher surface runoff and greater flood susceptibility even when rainfall does not increase significantly. Climate change compounds these risks by increasing the frequency and intensity of extreme precipitation events, further overwhelming urban drainage systems and expanding high-risk flood zones (Miller and Hutchins 2017). Recent studies highlight that the joint effects of urbanization and climate change are particularly severe in regions with limited infrastructure and adaptive capacity, resulting in disproportionate impacts on vulnerable populations (Ajjur and Al-Ghamdi 2022). The results highlight that without proactive adaptation such as green infrastructure, land use regulation, and resilient drainage systems urban flood risks will continue to escalate, especially in resource-constrained and vulnerable regions. Regional and international evidence supports the need for both structural measures, like underground drainage tunnels and detention reservoirs, and non-structural strategies, such as land use management and public engagement, to effectively reduce urban flood risk. Multi-criteria decision analysis (MCDA) and geospatial flood zonation maps, as applied in this study, are practical tools for prioritizing interventions and optimizing resource allocation in settings with limited data and funding. Combining green, blue, and grey infrastructure rather than relying on a single approach tends to yield the most effective and resilient outcomes. Integrated planning that leverages these tools and strategies is essential for sustainable urban flood management, particularly in Afghanistan and neighboring countries facing similar climate and urbanization pressures.
7. Policy Implications
7.1. Hazard-Informed Urban Planning
Flood susceptibility maps developed in this study should be formally adopted in Nangarhar’s urban and provincial lands and use planning frameworks. Directing new settlements, infrastructure, and critical facilities away from high-risk flood zones will reduce exposure. Zoning regulations can help prevent unplanned expansion into hazard-prone areas, ensuring safer long-term urban growth.
7.2. Strengthening Drainage Infrastructure
The rapid increase in built-up land has overwhelmed existing stormwater drainage systems. Investment in resilient drainage, such as retention basins, wider culverts, and permeable pavements, is urgently needed. Incorporating green-blue infrastructure like wetlands and vegetated swales can further enhance natural flood absorption.
7.3. Protection of Agricultural and Ecological Land
Agricultural land loss to urban sprawl has amplified surface runoff and reduced natural flood buffers. Policies restricting conversion of fertile land and encouraging riparian vegetation can mitigate flood risk. Ecological restoration of small wetlands and floodplains offers cost-effective natural flood management solutions.
7.4. Climate-Resilient Development Planning
Projected increases in rainfall intensity demand revisions to infrastructure design standards. Roads, bridges, and housing must be built to withstand more frequent and intense flood events. Water-sensitive urban design (WSUD) approaches should be piloted in Jalalabad to demonstrate climate-resilient planning.
7.5. Community-Based Disaster Risk Reduction (CBDRR)
Local communities, particularly refugees and vulnerable groups, face the highest flood risks. Early warning systems using SMS alerts, community sirens, and mobile apps can save lives. Training programs on flood preparedness and incentives for resilient housing can empower households to adapt.
7.6. Integration into National Disaster Risk Reduction Frameworks
The results should inform Afghanistan’s National Disaster Management Authority (ANDMA) and be linked with global resilience programs. Flood susceptibility maps can guide insurance schemes, evacuation routes, and relief planning. Embedding this geospatial evidence in national frameworks will reduce disaster losses.
7.7. Data-Driven Policy and Monitoring
Remote sensing and GIS provide an affordable approach for continuous flood monitoring. Authorities should establish a provincial flood monitoring cell in Jalalabad to update hazard maps every 3–5 years. International donors and academic institutions can support capacity building in geospatial risk assessment.
8. Conclusions
This study provides an integrated assessment of urban flood vulnerability in Nangarhar Province, Afghanistan, by examining the combined impacts of rapid urbanization, climate variability, and geophysical factors. The findings reveal that built-up expansion at the expense of agricultural and aquatic land has substantially increased high and very-high flood susceptibility zones, while low-susceptibility areas have steadily declined. Intensified rainfall and rising temperatures further amplify runoff and overwhelm existing drainage systems, underscoring the compounding risks of climate stress and land use transitions. The application of multi-criteria decision analysis (AHP) integrated with remote sensing and GIS demonstrates a robust methodological approach for flood risk mapping in conflict-affected and data-scarce regions. This framework effectively identifies flood-prone zones based on rainfall, slope, elevation, LULC, SPI, TWI, and drainage density, offering actionable insights for local planners and policymakers. Overall, the study highlights the urgent need for adaptive land use planning, resilient drainage infrastructure, and community-based flood risk reduction. Hazard-informed zoning, agricultural land protection, and restoration of degraded water bodies can significantly mitigate risks if integrated into urban planning frameworks. Strengthening governance and community participation will be essential for building resilience against escalating flood hazards in Afghanistan and similar semi-arid, rapidly urbanizing regions.
Author Contributions
Imtiaz Ahmad: Conceptualization, Methodology, Data Collection, Writing – Original Draft. Data Curation, GIS Analysis, Visualization. Methodology, Formal Analysis, Validation. Writing. Review & Editing, Critical Revisions. Wang ping: Supervision, Conceptualization, Writing – Review & Editing, Final Approval. All authors have read and approved the final manuscript and agree to be accountable for all aspects of the work.
Funding
This research was supported by a grant from the Education Department of Jilin Province, China, grant number JJKH20211289KJ, and the Natural Science Foundation of Jilin Scientific Institute of China grant number 20220101155JC.
Data Availability Statement
The datasets used and/or analyzed during the current study are available from the corresponding author on reasonable request.
Competing Interests
The authors declare that they have no known competing financial interests or personal relationships that could have appeared to influence the work reported in this paper.
References
- Ajjur SB, Al-Ghamdi SG. 2022. Exploring urban growth–climate change–flood risk nexus in fast growing cities. Scientific Reports. 12(1):12265.
- Ali SA, Khatun R, Ahmad A, Ahmad SN. 2019. Application of GIS-based analytic hierarchy process and frequency ratio model to flood vulnerable mapping and risk area estimation at Sundarban region, India. Modeling Earth Systems and Environment. 5(3):1083-1102. [CrossRef]
- Aliyari F, Bailey RT, Arabi M. 2021. Appraising climate change impacts on future water resources and agricultural productivity in agro-urban river basins. Science of the Total Environment. 788:147717. [CrossRef]
- Arnbjerg-Nielsen K, Willems P, Olsson J, Beecham S, Pathirana A, Bülow Gregersen I, Madsen H, Nguyen V-T-V. 2013. Impacts of climate change on rainfall extremes and urban drainage systems: a review. Water science and technology. 68(1):16-28. [CrossRef]
- Baig, S. 2024. Flood inundation and streamflow changes in the Kabul River Basin under climate change. Sustainability. 16(1):116. [CrossRef]
- Bana e Costa CA, Lourenço JC, Oliveira MD, Bana e Costa JC. 2014. A socio-technical approach for group decision support in public strategic planning: the Pernambuco PPA case. Group Decision and Negotiation. 23(1):5-29.
- Breckle S-W, Rafiqpoor MD. 2020. The Hindu Kush/Afghanistan. Plant biogeography and vegetation of high mountains of Central and South-West Asia. Springer; p. 43-91.
- Brêda JPL, de Paiva RCD, Siqueira VA, Collischonn W. 2023. Assessing climate change impact on flood discharge in South America and the influence of its main drivers. Journal of Hydrology. 619:129284. [CrossRef]
- Chen Z, Huang G. 2024. Numerical simulation study on the effect of underground drainage pipe network in typical urban flood. Journal of Hydrology. 638:131481. [CrossRef]
- Chowdhury MS. 2024. Comparison of accuracy and reliability of random forest, support vector machine, artificial neural network and maximum likelihood method in land use/cover classification of urban setting. Environmental Challenges. 14:100800.
- Deopa R, Thakur DA, Kumar S, Mohanty MP, Asha P. 2024. Discerning the dynamics of urbanization-climate change-flood risk nexus in densely populated urban mega cities: An appraisal of efficient flood management through spatiotemporal and geostatistical rainfall analysis and hydrodynamic modeling. Science of the Total Environment. 952:175882. [CrossRef]
- Dharmarathne G, Waduge A, Bogahawaththa M, Rathnayake U, Meddage D. 2024. Adapting cities to the surge: A comprehensive review of climate-induced urban flooding. Results in Engineering. 22:102123. [CrossRef]
- Feng B, Zhang Y, Bourke R. 2021. Urbanization impacts on flood risks based on urban growth data and coupled flood models. Natural Hazards. 106(1):613-627. [CrossRef]
- Fu X, Xue F, Liu Y, Chen F, Yang H. 2025. Evaluation of Urban Flood Susceptibility Under the Influence of Urbanization Based on Shared Socioeconomic Pathways. Land. 14(3):621. [CrossRef]
- Füssel H-M, Klein RJ. 2006. Climate change vulnerability assessments: an evolution of conceptual thinking. Climatic change. 75(3):301-329. [CrossRef]
- Gersonius B, Ashley R, Pathirana A, Zevenbergen C. 2013. Climate change uncertainty: building flexibility into water and flood risk infrastructure. Climatic change. 116(2):411-423. [CrossRef]
- Getirana A, Mandarino F, de Montezuma PN, Kirschbaum D. 2023. An urban drainage scheme for large-scale flood models. Journal of Hydrology. 627:130410. [CrossRef]
- Gonzva M, Barroca B, Gautier P-É, Diab Y. 2017. Modeling disruptions causing domino effects in urban guided transport systems faced by flood hazards. Natural hazards. 86(1):183-201. [CrossRef]
- Hajihosseini M, Hajihosseini H, Morid S, Delavar M, Booij MJ. 2020. Impacts of land use changes and climate variability on transboundary Hirmand River using SWAT. Journal of Water and Climate Change. 11(4):1695-1711. [CrossRef]
- Hassan BT, Yassine M, Amin D. 2022. Comparison of urbanization, climate change, and drainage design impacts on urban flashfloods in an arid region: Case study, New Cairo, Egypt. Water. 14(15):2430. [CrossRef]
- Hettiarachchi S, Wasko C, Sharma A. 2018. Increase in flood risk resulting from climate change in a developed urban watershed–the role of storm temporal patterns. Hydrology and Earth System Sciences. 22(3):2041-2056. [CrossRef]
- Huang S, Gan Y, Chen N, Wang C, Zhang X, Li C, Horton DE. 2024. Urbanization enhances channel and surface runoff: A quantitative analysis using both physical and empirical models over the Yangtze River basin. Journal of Hydrology. 635:131194. [CrossRef]
- Janizadeh S, Kim D, Jun C, Bateni SM, Pandey M, Mishra VN. 2024. Impact of climate change on future flood susceptibility projections under shared socioeconomic pathway scenarios in South Asia using artificial intelligence algorithms. Journal of environmental management. 366:121764. [CrossRef]
- Jongman, B. 2018. Effective adaptation to rising flood risk. Nature communications. 9(1):1986. [CrossRef]
- Kalantari Z, Briel A, Lyon SW, Olofsson B, Folkeson L. 2014. On the utilization of hydrological modelling for road drainage design under climate and land use change. Science of the Total Environment. 475:97-103. [CrossRef]
- Kumar S, Agarwal A, Ganapathy A, Villuri VGK, Pasupuleti S, Kumar D, Kaushal DR, Gosain AK, Sivakumar B. 2022. Impact of climate change on stormwater drainage in urban areas. Stochastic environmental research and risk assessment. 36(1):77-96. [CrossRef]
- Li Z, Chen B, Wu S, Su M, Chen JM, Xu B. 2024. Deep learning for urban land use category classification: A review and experimental assessment. Remote Sensing of Environment. 311:114290. [CrossRef]
- Lima CH, Lall U, Troy T, Devineni N. 2016. A hierarchical Bayesian GEV model for improving local and regional flood quantile estimates. Journal of Hydrology. 541:816-823. [CrossRef]
- Mahmoud SH, Gan TY. 2018. Urbanization and climate change implications in flood risk management: Developing an efficient decision support system for flood susceptibility mapping. Science of the Total Environment. 636:152-167. [CrossRef]
- Mayou LA, Alamdari N, Ahmadisharaf E, Kamali M. 2024. Impacts of future climate and land use/land cover change on urban runoff using fine-scale hydrologic modeling. Journal of Environmental Management. 362:121284. [CrossRef]
- Miller JD, Hutchins M. 2017. The impacts of urbanisation and climate change on urban flooding and urban water quality: A review of the evidence concerning the United Kingdom. Journal of Hydrology: Regional Studies. 12:345-362. [CrossRef]
- Noor NA, Sarwary M, Baber BM, Qaderi AS, Safi Z. 2024. Farmer Perceptions to Climate Variability and Adaption Strategies in Nangrahar Province. Nangarhar University International Journal of Biosciences.241-245. [CrossRef]
- Panda A, Sahu N. 2019. Trend analysis of seasonal rainfall and temperature pattern in Kalahandi, Bolangir and Koraput districts of Odisha, India. Atmospheric Science Letters. 20(10):e932. [CrossRef]
- Park HJ, Song SM, Kim DH, Lee SO. 2024. Socioeconomic impact on urban resilience against flood damage. Applied Sciences. 14(17):7882. [CrossRef]
- Rummukainen, M. 2016. Added value in regional climate modeling. Wiley Interdisciplinary Reviews: Climate Change. 7(1):145-159. [CrossRef]
- Sahak AS, Karsli F, Ahmadi K, Saraj MA, Sahak AT. 2024. Geospatial Assessment of Urban Sprawl: A Case Study of Herat City, Afghanistan. Australian Journal of Engineering and Innovative Technology. 6(3).
- Sahak AS, Karsli F, Saraj MA. 2024. Evaluating the impact of urban sprawl on the urban ecological status using GIS and remote sensing from 2000 to 2021: a case study of Herat City, Afghanistan. Environmental Monitoring and Assessment. 196(12):1246. [CrossRef]
- Sanders BF, Schubert JE, Kahl DT, Mach KJ, Brady D, AghaKouchak A, Forman F, Matthew RA, Ulibarri N, Davis SJ. 2023. Large and inequitable flood risks in Los Angeles, California. Nature sustainability. 6(1):47-57. [CrossRef]
- Shao M, Zhao G, Kao S-C, Cuo L, Rankin C, Gao H. 2020. Quantifying the effects of urbanization on floods in a changing environment to promote water security—A case study of two adjacent basins in Texas. Journal of Hydrology. 589:125154. [CrossRef]
- Shao Z, Fu H, Li D, Altan O, Cheng T. 2019. Remote sensing monitoring of multi-scale watersheds impermeability for urban hydrological evaluation. Remote Sensing of Environment. 232:111338. [CrossRef]
- Tabari, H. 2020. Climate change impact on flood and extreme precipitation increases with water availability. Scientific reports. 10(1):13768. [CrossRef]
- Tehrany MS, Jones S, Shabani F. 2019. Identifying the essential flood conditioning factors for flood prone area mapping using machine learning techniques. Catena. 175:174-192. [CrossRef]
- Termeh SVR, Kornejady A, Pourghasemi HR, Keesstra S. 2018. Flood susceptibility mapping using novel ensembles of adaptive neuro fuzzy inference system and metaheuristic algorithms. Science of the Total Environment. 615:438-451. [CrossRef]
- Turner BL, Kasperson RE, Matson PA, McCarthy JJ, Corell RW, Christensen L, Eckley N, Kasperson JX, Luers A, Martello ML. 2003. A framework for vulnerability analysis in sustainability science. Proceedings of the national academy of sciences. 100(14):8074-8079. [CrossRef]
- Wang Y, Anderson N, Torgashov E. 2021. Selection of geophysical methods based on matter-element analysis with analytic hierarchy process. Exploration Geophysics. 52(6):669-679. [CrossRef]
- Xu C, Rahman M, Haase D, Wu Y, Su M, Pauleit S. 2020. Surface runoff in urban areas: The role of residential cover and urban growth form. Journal of Cleaner Production. 262:121421. [CrossRef]
- Yadav N, Wu J, Banerjee A, Pathak S, Garg R, Yao S. 2024. Climate uncertainty and vulnerability of urban flooding associated with regional risk using multi-criteria analysis in Mumbai, India. Environmental Research. 244:117962. [CrossRef]
- Yang X, Xie X, Liu DL, Ji F, Wang L. 2015. Spatial interpolation of daily rainfall data for local climate impact assessment over greater Sydney region. Advances in Meteorology. 2015(1):563629. [CrossRef]
- Yang Y, Zhu DZ, Loewen MR, Zhang W, van Duin B, Mahmood K. 2024. Impacts of climate change on urban stormwater runoff quantity and quality in a cold region. Science of The Total Environment. 954:176439. [CrossRef]
- Ye C, Dang TD, Xu X, Stewart CJ, Arias ME, Zhang Y, Zhang Q. 2023. Coupled effects of future rainfall and land use on urban stormwater drainage system in Tampa, Florida (USA). Ecological Indicators. 153:110402. [CrossRef]
- Zhang W, Villarini G, Vecchi GA, Smith JA. 2018. Urbanization exacerbated the rainfall and flooding caused by hurricane Harvey in Houston. Nature. 563(7731):384-388. [CrossRef]
- Zhou Q, Leng G, Su J, Ren Y. 2019. Comparison of urbanization and climate change impacts on urban flood volumes: Importance of urban planning and drainage adaptation. Science of the Total Environment. 658:24-33. [CrossRef]
Figure 1.
Location of the study area (A). Elevation map of the study area (B) Nangahar Province.
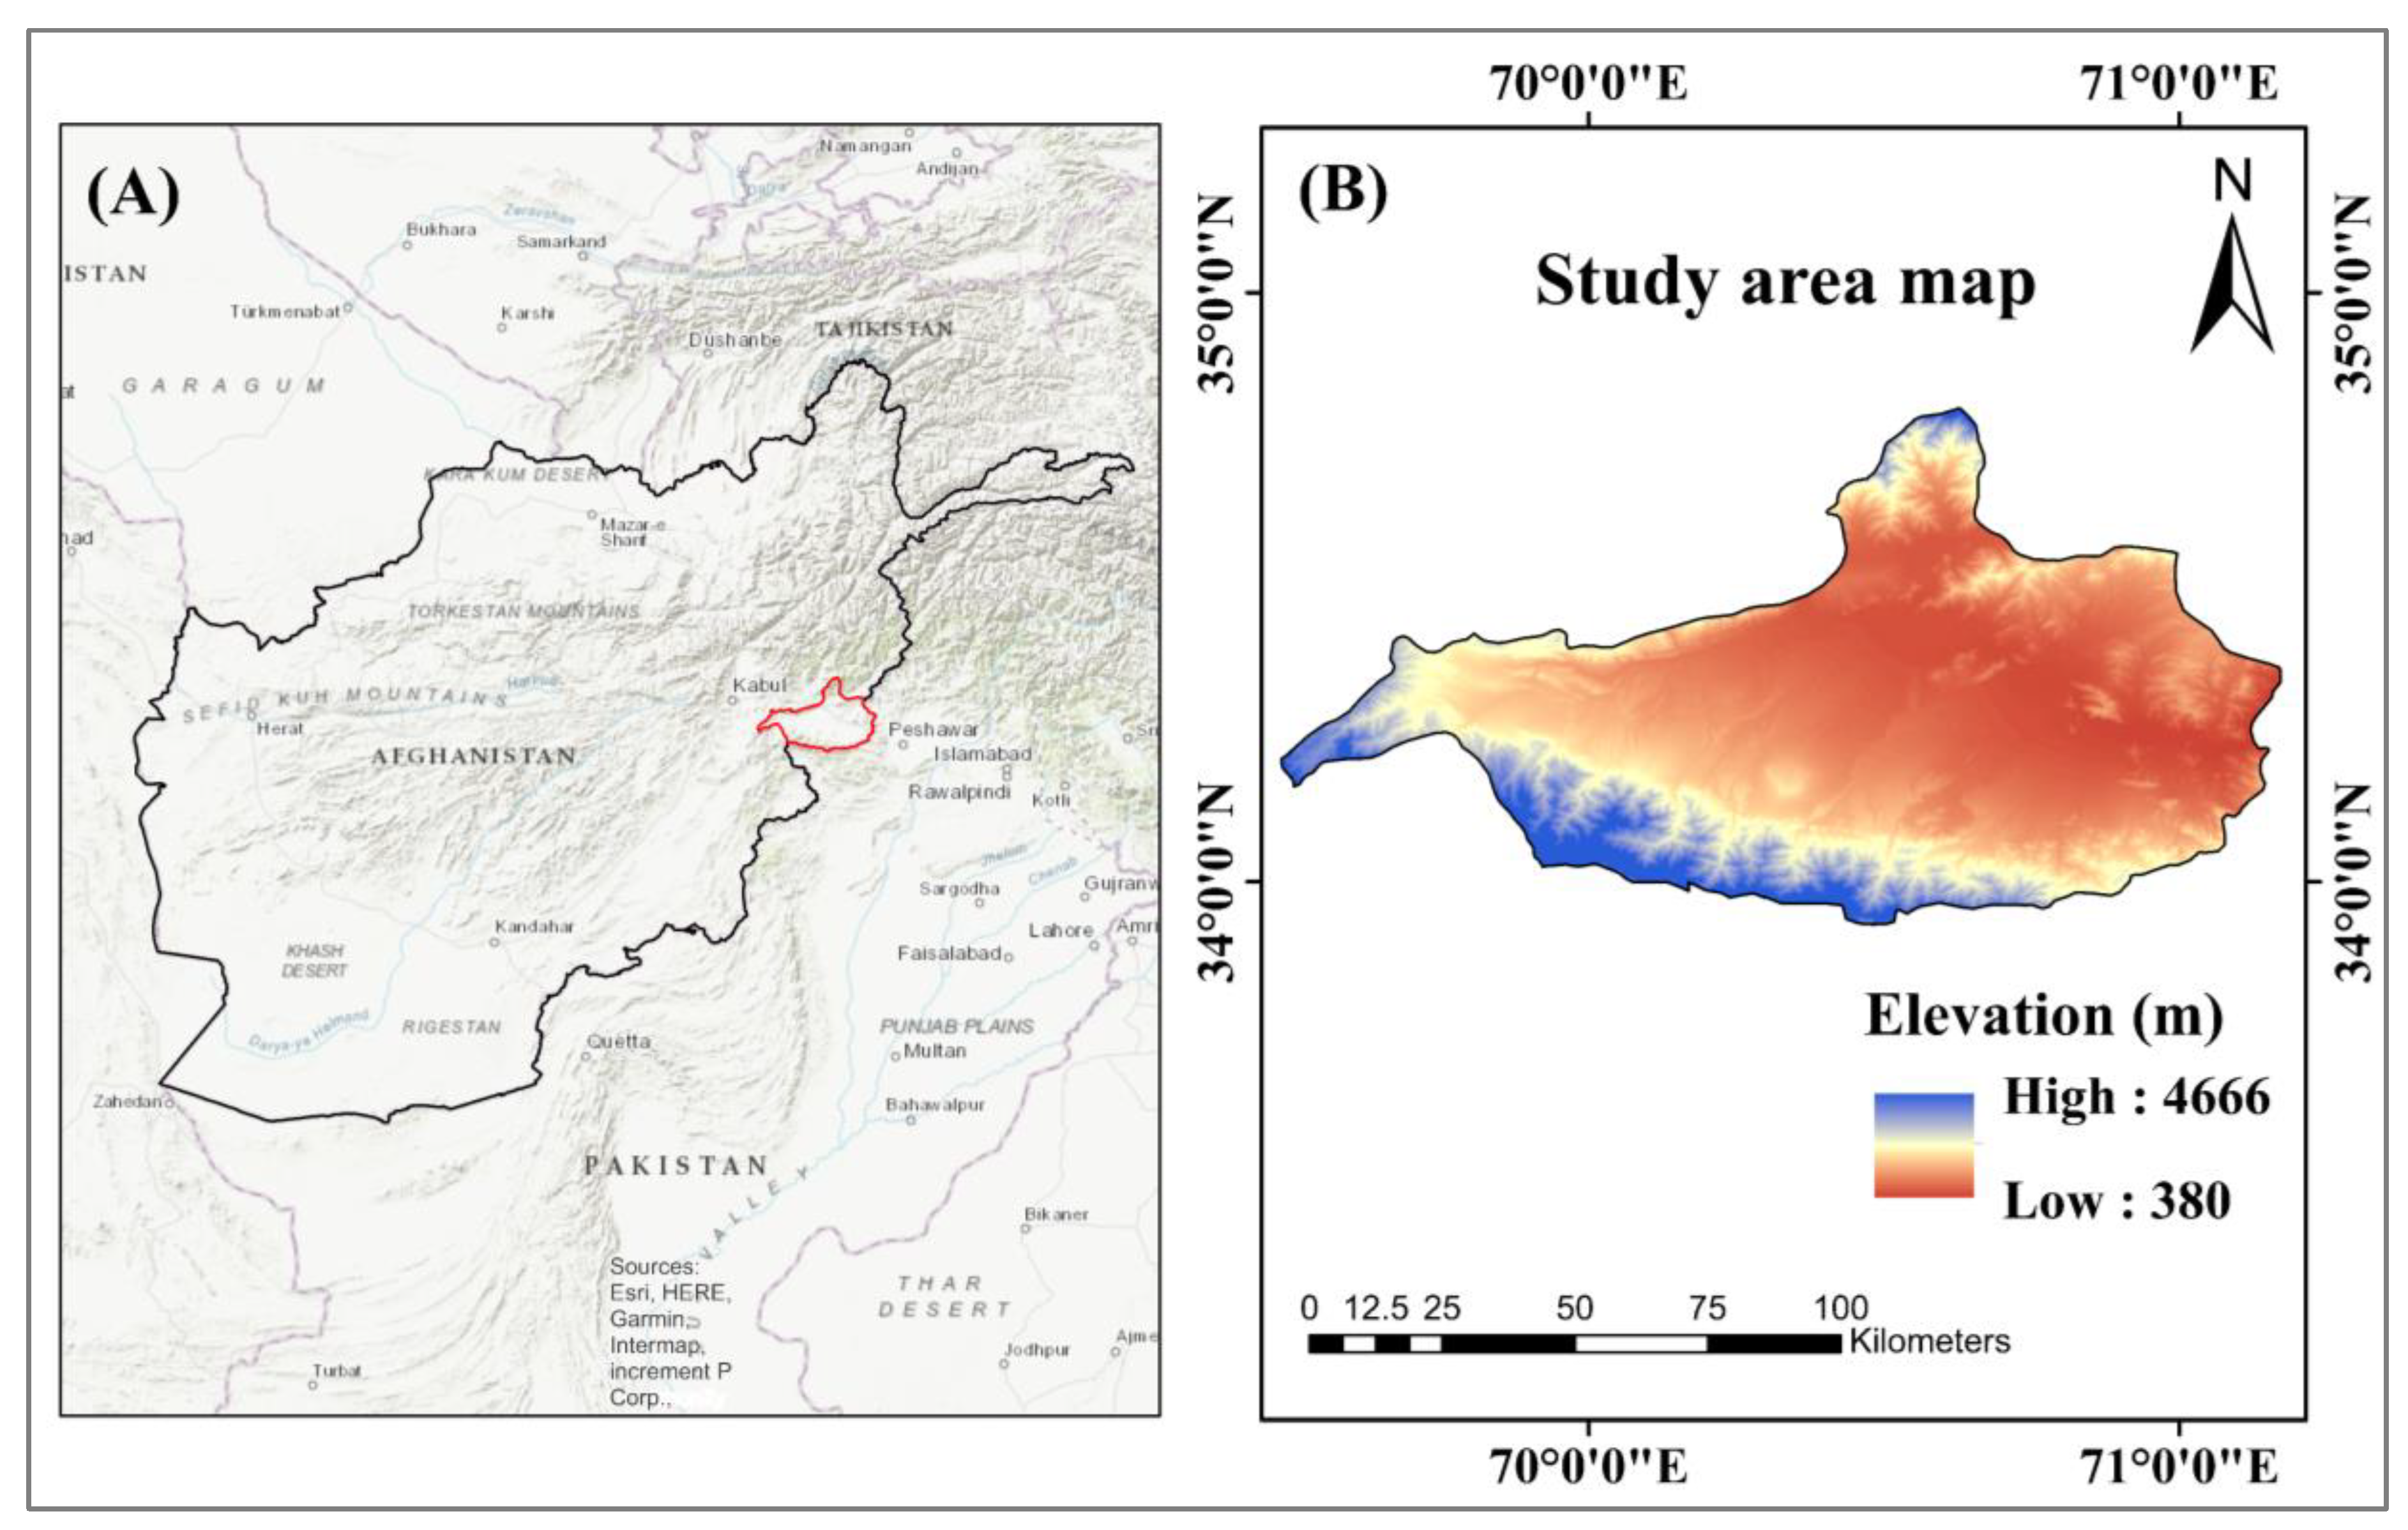
Figure 2.
Methodological workflow of the study.
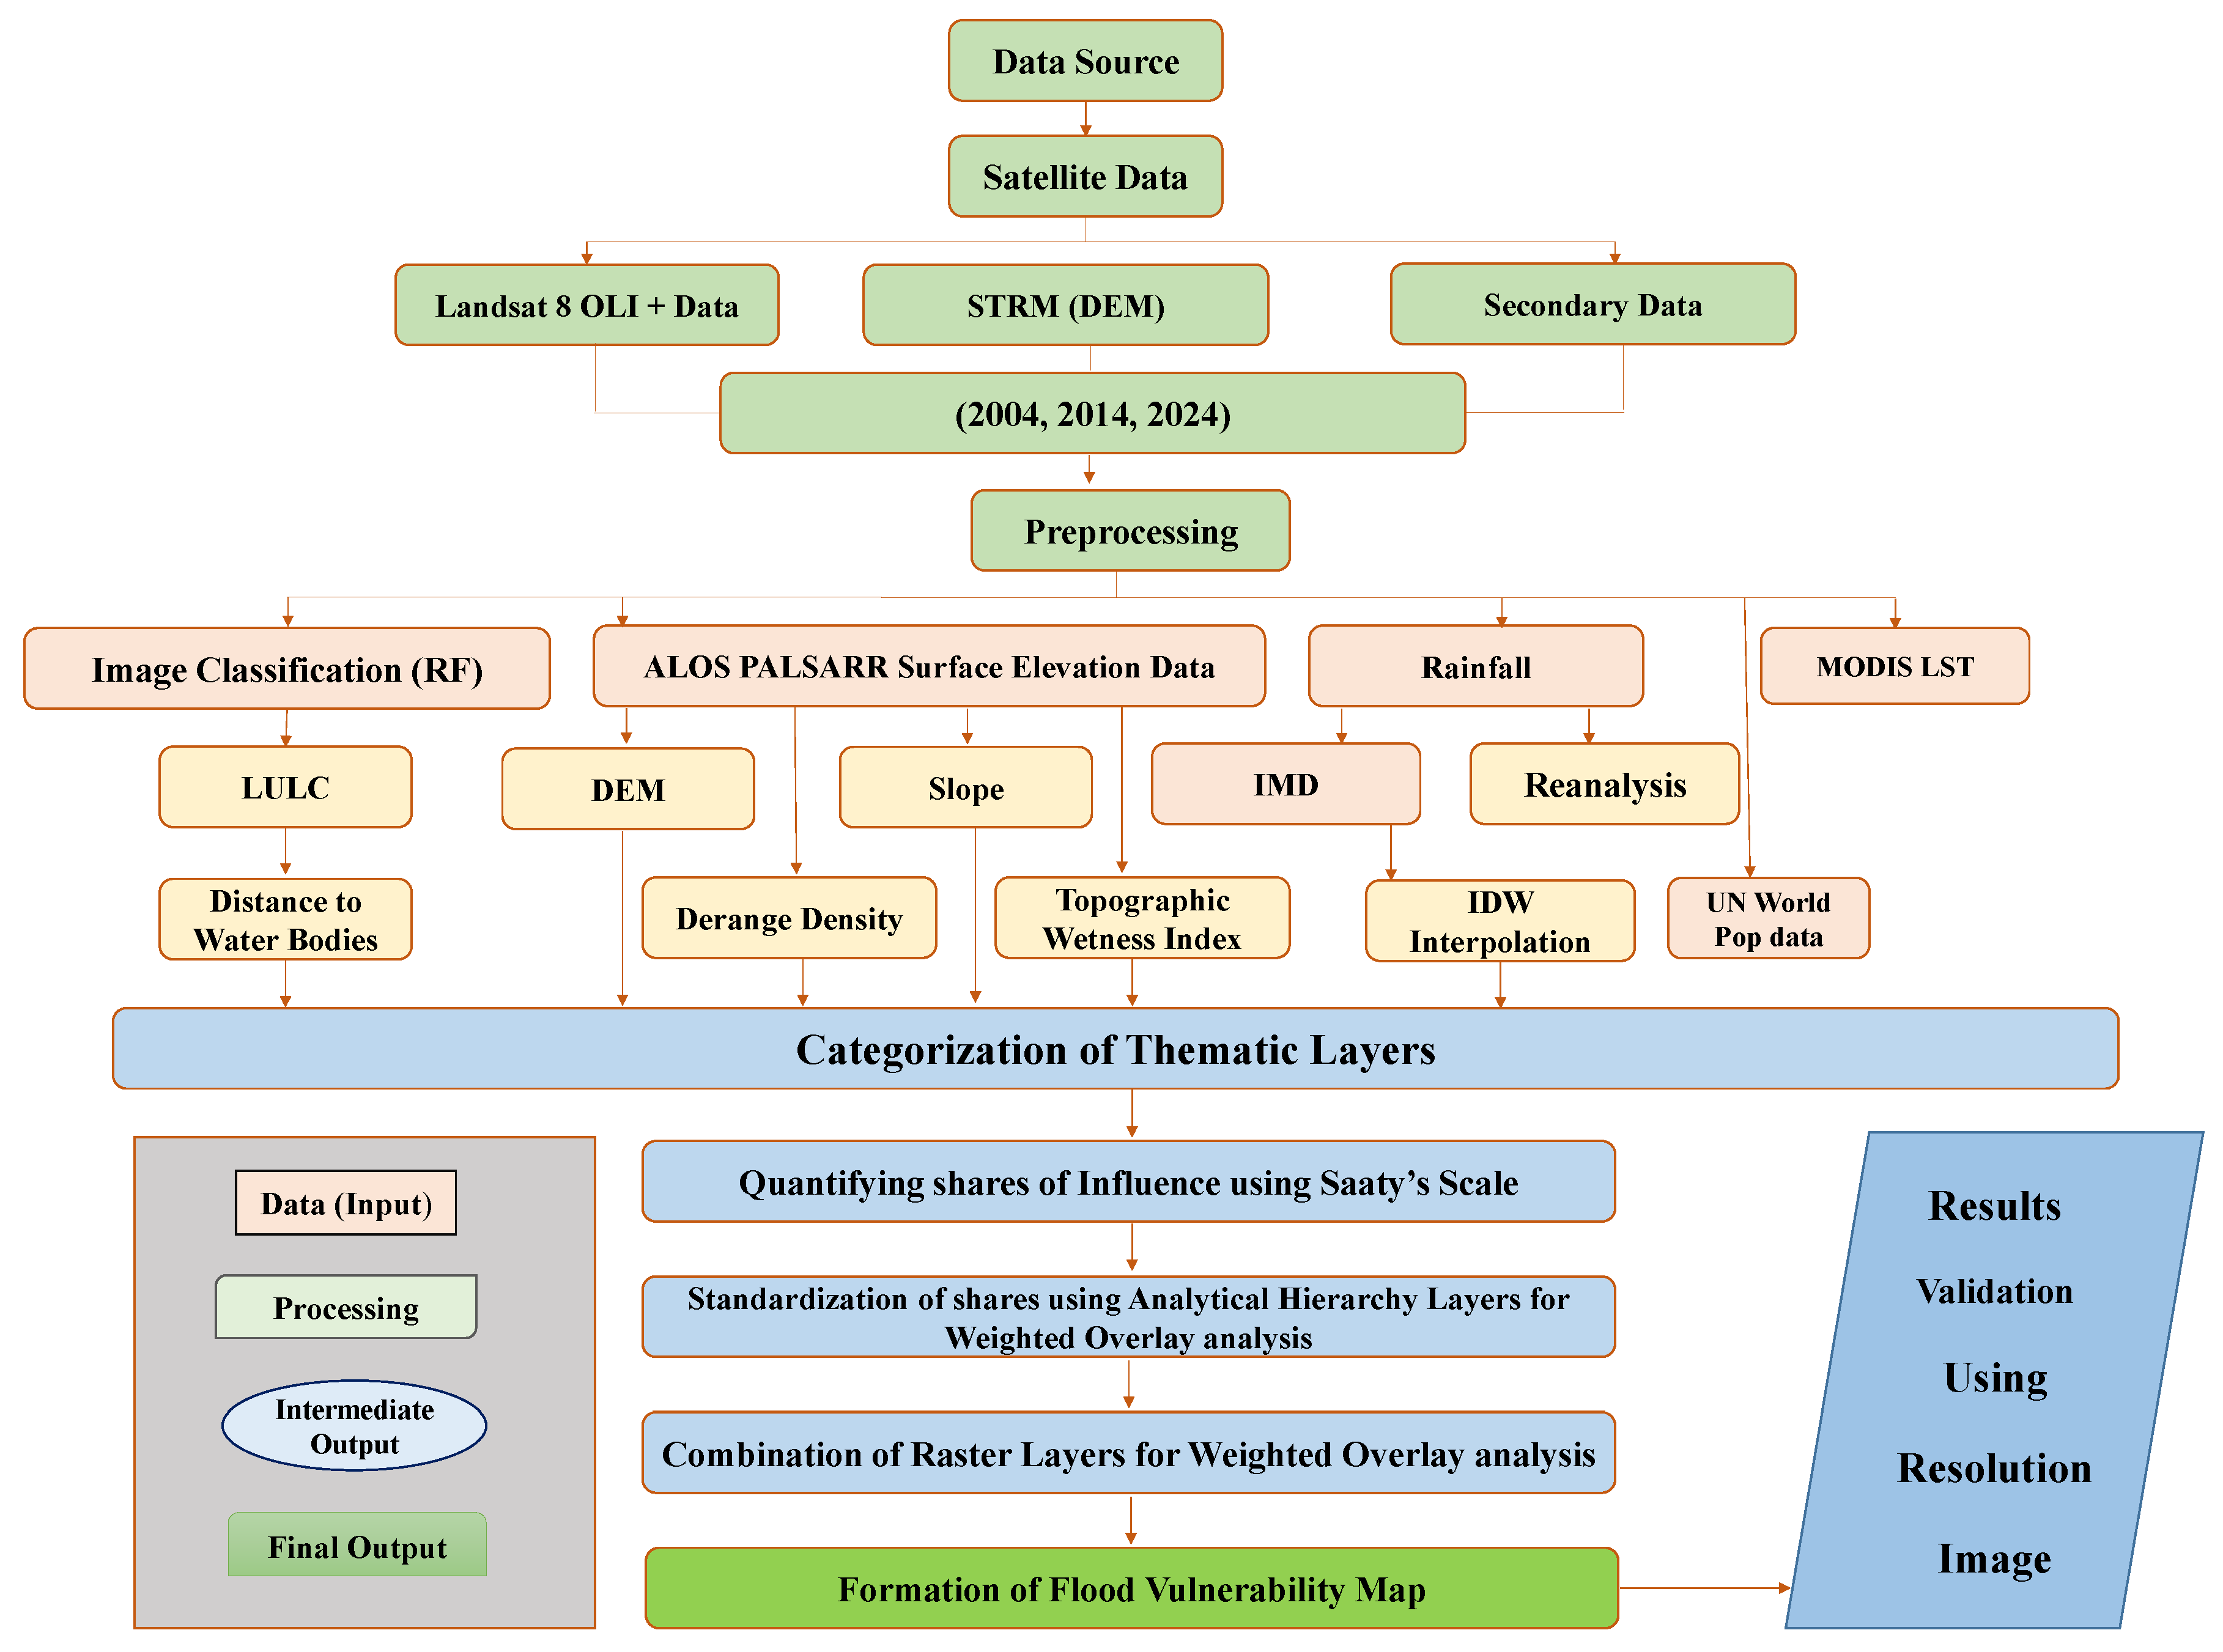
Figure 4.
Land use and land cover map of Nangarhar. (a) LULC map in 2004, (b) LULC map in 2014, (c) LULC map in 2024, (d) LULC category-wise area graph of the year 2004, 2014, and 2024.
Figure 4.
Land use and land cover map of Nangarhar. (a) LULC map in 2004, (b) LULC map in 2014, (c) LULC map in 2024, (d) LULC category-wise area graph of the year 2004, 2014, and 2024.
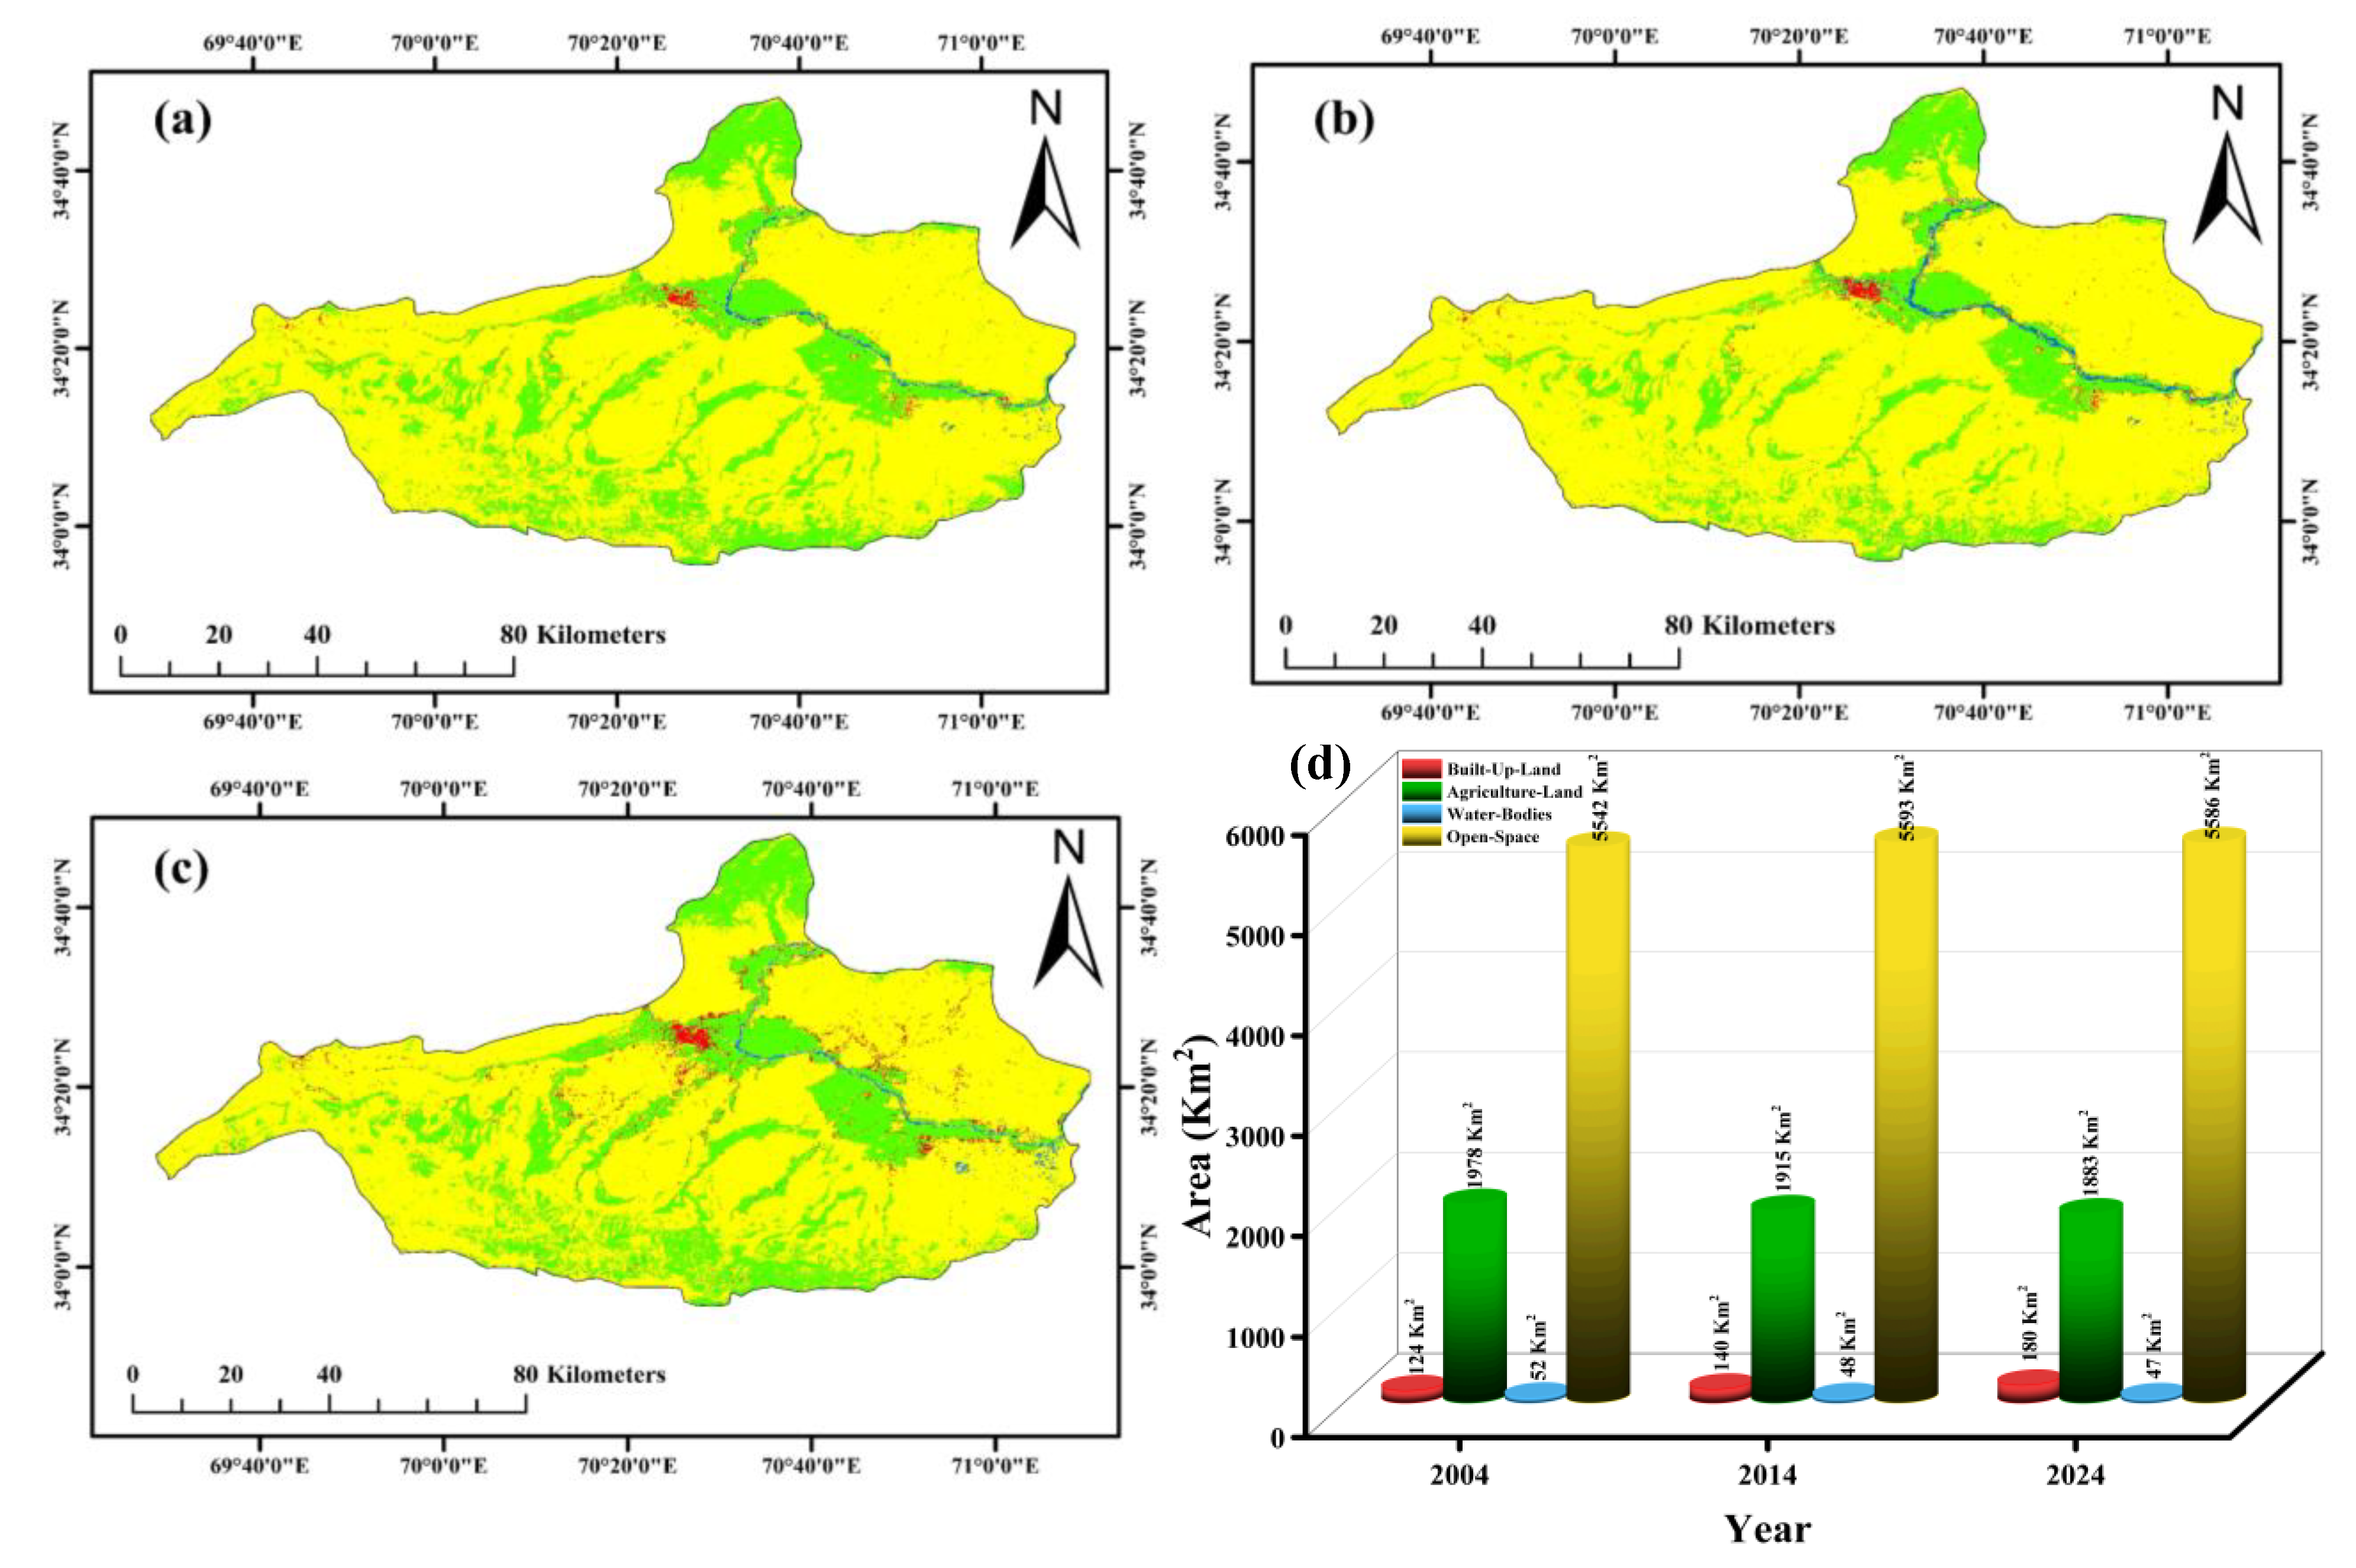
Figure 5.
Flood susceptibility map of Nangarhar. (a) Flood vulnerability map in 2004, (b) Flood vulnerability map in 2014, (c) Flood vulnerability map in 2024, (d) Category-wise area graph of flood vulnerability for the years 2004, 2014, and 2024.
Figure 5.
Flood susceptibility map of Nangarhar. (a) Flood vulnerability map in 2004, (b) Flood vulnerability map in 2014, (c) Flood vulnerability map in 2024, (d) Category-wise area graph of flood vulnerability for the years 2004, 2014, and 2024.
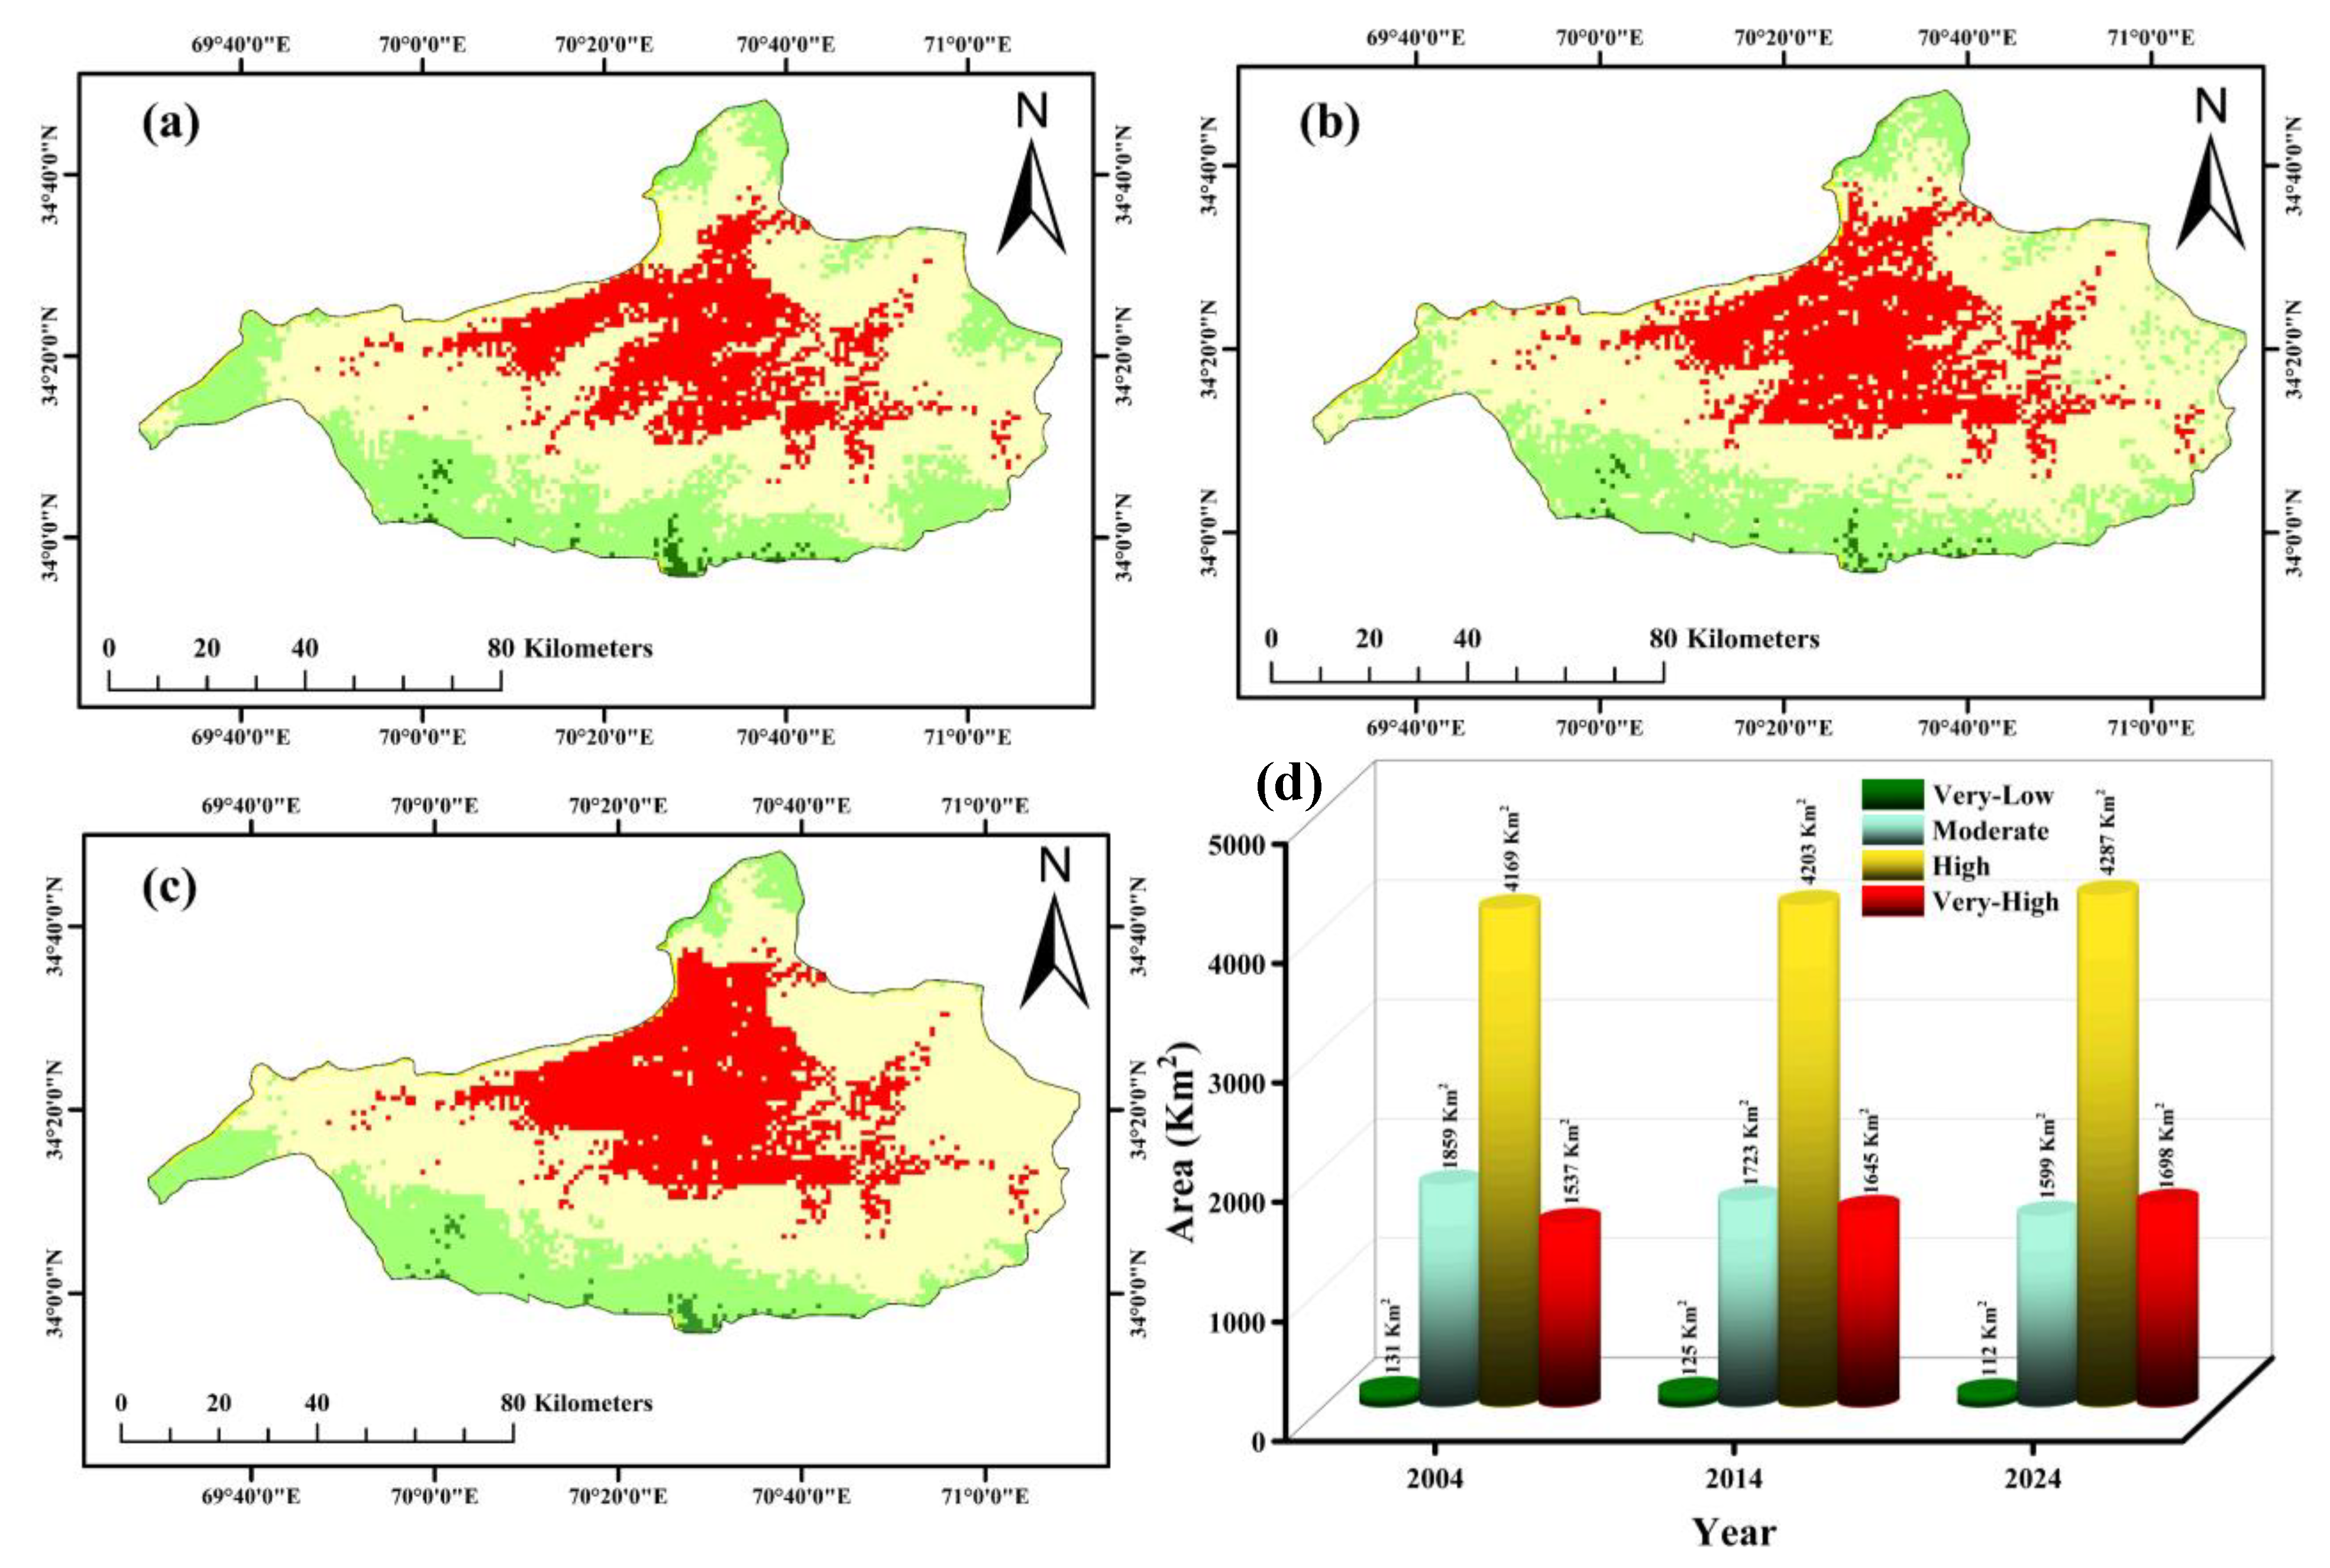

Table 1.
Data acquisition table.
| Data Product | Data ID | Used Band | Spatial resolution | Data Frame |
|---|---|---|---|---|
| Landsat Imagery | Landsat 5, Landsat 7 and Landsat 8 | NIR, Red and Green | 30 m | 2004, 2014 and 2024 |
| DEM | ALPSRP262080370-RTC & ALPSRP262080360-RTC | Elevation | 12.5 m | 2010 |
| Population density | World Pop/GP/100m/pop | population | 97m | 2004–2024 |
Disclaimer/Publisher’s Note: The statements, opinions and data contained in all publications are solely those of the individual author(s) and contributor(s) and not of MDPI and/or the editor(s). MDPI and/or the editor(s) disclaim responsibility for any injury to people or property resulting from any ideas, methods, instructions or products referred to in the content. |
© 2025 by the authors. Licensee MDPI, Basel, Switzerland. This article is an open access article distributed under the terms and conditions of the Creative Commons Attribution (CC BY) license (https://creativecommons.org/licenses/by/4.0/).
Copyright: This open access article is published under a Creative Commons CC BY 4.0 license, which permit the free download, distribution, and reuse, provided that the author and preprint are cited in any reuse.


