
Submitted:
11 October 2025
Posted:
15 October 2025
You are already at the latest version
Abstract
Urban flooding is one of the greatest challenges to sustainable development in rapidly urbanizing cities. This study applies an integrated approach that combines Sentinel-1 radar data, geomorphological analysis, and the DPSIR (Drivers–Pressures–State–Impacts–Responses) framework to assess the relationship between urbanization and flooding in Hanoi during the period 2010–2024 (with Sentinel-1 time series covering 2015-2024). A time series of Sentinel-1 images (2015–2024) was processed on the Google Earth Engine platform to detect inundation and construct maps of flood frequency, validated against 148 field survey points (overall accuracy = 87%, Kappa = 0.79). Results show that approximately 80% of newly urbanized areas are located on geomorphologically sensitive units (paleochannels, floodplains, karst), which are highly flood-prone. Meanwhile, 57% of older urban areas are mainly flooded on inner-dike floodplains, and notably, 36.5% of new urban areas have been developed on floodplains with inherently high flood risk. The DPSIR analysis highlights rapid population growth, land-use change, and inadequate drainage infrastructure as the main pressures driving both the frequency and extent of flooding. To our knowledge, this is the first study to integrate geomorphology, Sentinel-1, and DPSIR for Hanoi, providing robust scientific evidence to support sustainable urban planning and enhance resilience in the context of climate change.
Keywords:
urban flooding
; Sentinel-1 SAR
; geomorphology
; DPSIR
; urbanization
; sustainable development
; Hanoi
1. Introduction
Urban flooding has long been considered one of the most severe environmental-social hazards, causing significant losses of life and property, interrupting production- business activities, and adversely affecting community well-being [1,2,3,4,5,6]. According to statistics from the United Nations and many international organizations, floods and inundation accounted for approximately 44% of all natural disasters during 1970–2019 and caused over 31% of total global economic losses [7]. In the period 2010–2019 alone, 1,298 major floods occurred worldwide [8]. In tropical regions, the frequency of major floods quadrupled between 1985 and 2015, while global flood risk increased by 20–24% from 2000 to 2018 [9,10,11]. These figures indicate that flood risk is increasing rapidly under the combined impacts of climate change and urbanization, creating an urgent need for sustainable disaster risk management [12,13,14,15,16].
The reasons for urban flooding are not only extreme rainfall events but also stem from many complex anthropogenic factors, such as unplanned urban growth [17], changes in land use and surface coverage [18], degradation of urban ecosystem [19], outdated or non-uniform drainage systems [18,20,21,22], and ineffective management of green infrastructure [23]. In the context of unpredictable climate change and rapid urbanization, population growth and the expansion of urban areas have become key drivers exacerbating flood hazards [21,24]. Therefore, urban flooding should be viewed as the cumulative outcome of interactions among climate, geomorphology and uncontrolled human-induced factors [6,25,26].
Southeast Asia, characterized by low-lying terrain and high population density, is particularly vulnerable to flooding. Serious floods in recent decades in Hanoi (2008), Bangkok (2011), Beijing (2012), and Ho Chi Minh City (2018) illustrate the escalating level of risk [3,27,28,29,30]. This emphasizes that urban flooding is not only an extreme meteorological phenomenon but also a consequence of unsustainable spatial development and inadequate infrastructure management [29,31].
In Vietnam, Hanoi is a typical example of urban flooding. Its low-lying terrain and gentle slope hinder natural drainage, making many areas prone to inundation. Older streets are less affected by flooding, while many new urban areas frequently experience severe flooding, highlighting the imbalance between urban spatial expansion and the capacity of drainage infrastructure [31,32,33,34]. Since 2012, repeated heavy rainfall events have caused serious floods in rapidly developing districts, resulting in substantial socio-economic damage and directly impacting on people’s lives [34]. Recent studies have proposed various solutions to control floods, ranging from technical measures to prevention planning based on risk analysis [34,35].
Numerous methods have been developed to analyze and predict flooding. Hydrological-hydraulic models such as HEC-RAS, LISFLOOD-FP, MIKE NAM, MIKE 11, Flo-2D, etc., are widely used in flow simulation and flood mapping [36,37,38,39]. Raster models [40], GIS-based flood modeling [41], and uncertainty analysis in flooding mapping [42] have further improved simulation accuracy and provided more reliable information for management. However, these models require detailed input data, which poses challenges for application in data-scarce urban contexts. Another approach is GIS combined with multi-criteria decision analysis (MCDA, AHP) to classify flood risk zones based on elevation, rainfall, land use, and infrastructure factors [43,44,45,46,47]. Despite its efficiency, it is still affected by subjectivity in determining weights [48,49,50,51].
In recent decades, remote sensing technology has played an increasingly important role in monitoring and assessing inundation [52,53,54]. In particular, SAR Sentinel-1 imagery offers the ability to collect data under all weather conditions and penetrate clouds [55,56]. Recent studies have integrated Sentinel-1 with deep learning models (CNN–LSTM) and MODIS data to create high-resolution maps to support planning and risk management [57,58]. In Vietnam, the use of Sentinel-1 for urban flooding studies remains limited, mainly focusing on large river basins or pilot studies [2,59,60,61], creating opportunities for applications in large urban areas.
Geomorphology also plays a vital role in flooding analysis. Many domestic studies have shown the relation between terrain features (plains, lowlands, paleochannels) and flooding risk [6,26,32,62,63]. Studies in the Red River Delta, Tra Khuc, Hue, and Thu Bon demonstrate that geomorphology affects flood distribution, drainage capacity, and re-flooding [6,32,62,63,64]. However, most studies have been limited to theoretical warnings or geomorphological mapping without integrating quantitative analysis with modern remote sensing data such as Sentinel-1.
Urban flooding is also associated with institutions and planning [65,66]. Planning that does not integrate hydrological factors, climate change, natural drainage mechanisms, or account for increased impervious surfaces and unreasonable ground elevation can overload drainage systems and cause localized flooding. Modern urban planning requires integrating nature-based solutions such as flood corridors, detention basins, and ecological buffers from the master planning stage. From a system analysis perspective, the DPSIR (Drivers–Pressures–State–Impacts–Responses) framework, proposed by the European Environment Agency (EEA) in 1999, provides a systematic approach to analyze cause–effect relationships of environmental issues [67,68]. Many international studies have applied DPSIR to analyze flood and inundation, constructing aggregate indices such as the Integrated Flood Risk Index (IFRI) or Coastal Risk Index (CRI) [68,69]. In Vietnam, DPSIR has only been applied in the Vu Gia–Thu Bon basin and some cities in the Central region [70,71]. These studies have not fully integrated DPSIR with quantitative data such as geomorphology and remote sensing.
The overview shows that each approach has its advantages and disadvantages: Hydraulic models simulate details but require extensive data [38,40,42]; GIS–AHP is flexible but remains subjective [45,46,72]; Sentinel-1 performs well in status monitoring but requires integration with spatial analysis [58,59]; DPSIR is systemic but has not yet been deeply integrated with quantitative data [68,69,71]. These gaps highlight the need for an integrated approach combining geomorphology data and remote sensing with DPSIR to fully assess urban flooding risk.
In this context, this study adopts an integrated geomorphology–Sentinel-1–DPSIR approach to assess urban flooding risks in Hanoi. Study objectives include: (i) geomorphological analysis to identify flood-prone areas; (ii) using Sentinel-1 to detect and monitor actual flood areas; and (iii) integrating these findings into the DPSIR framework to analyze the system of drivers–pressures–state–impacts–responses. The study is expected to provide a scientific basis for urban planning and propose solutions for sustainable flood risk management and climate change adaptation.
In parallel, the rapid digital transformation of urban governance in Hanoi highlights the necessity of integrating flood risk information into smart management systems. Combining geospatial analysis and inundation mapping with digital decision-support tools can strengthen data sharing, transparency, and coordination among sectors. This approach ensures that scientific assessments are not isolated from practice but become part of a broader framework for adaptive and resilient urban management.
2. Study Area
Hanoi city is geographically located between 2053' and 2123' North latitude and 105' to 106' East longitude, situated in the center of the Red River Delta. It is the capital and one of the major political, administrative, economic, and cultural centers of Vietnam. Hanoi has a high level of urbanization and population density, covering an area of 3,359.84 km² with a population of over 8.5 million [73,74]. As one of the two main economic growth poles of Vietnam, the city experiences increasing pressure on its infrastructure and urban environment [74,75] (Figure 1).
Hanoi's topography is relatively low and flat, characterized by a dense river network and a tropical monsoon climate. Rainfall is concentrated mainly in the wet season, accounting for about 89% of the annual total, making the city highly prone to flooding, especially in low-lying central districts during heavy rain events [74,75] (Figure 2).
Hanoi's terrain is also profoundly shaped by its river system. Rivers such as the Day, Nhue, To Lich, and Ca Lo once had strong natural flows but, through geological and hydrological evolution, have left behind traces in the form of paleochannels, residual lakes, and interlaced ridges of varying elevation. Large water bodies such as West Lake, Yen So Lagoon, and a chain of smaller lakes along riverbanks are remnants of these processes, forming the city’s distinctive “mound–depression” landscape pattern [76].
Over the past decade, Hanoi has experienced rapid urbanization, with an urbanization rate reaching 49.1%—5.4% higher than the national average in 2024. Urban expansion has occurred primarily toward the southern and southwestern peripheries, accompanied by increases in both building density and height. However, this expansion has not been synchronized with infrastructure development, posing major challenges for sustainable urban management and planning (Figure 3).
Hanoi has a comprehensive system of rivers, lakes, and dikes designed for flood control, but recent inundations are mainly caused by localized heavy rainfall that exceeds the drainage capacity. The existing drainage infrastructure is insufficient to meet the growing demands under rapid urbanization and population increase. In recent years, intense rainfall events have repeatedly caused serious flooding in many inner-city districts, resulting in considerable damage to assets and public infrastructure.
The scope of this study focuses on 12 inner-city districts and 4 suburban districts (Dan Phuong, Hoai Duc, Gia Lam, and Thanh Tri) (Figure 1), representing areas experiencing intensive urbanization and extensive land-use conversion from agricultural to non-agricultural purposes. These areas have also recorded numerous severe flooding locations between 2010 and 2024. Furthermore, they face critical planning challenges, particularly regarding drainage systems, land-use management, and urban development control under conditions of climate change and rapid population growth.
3. Materials and Methods
3.1. Data Sources
The study integrates multi-source datasets including remote sensing data, topographic and geomorphological maps, statistics data, and field surveys to assess the current status and flooding risk in Hanoi (Table ). Data were selected according to three criteria: (i) reliability of the sources; (ii) spatial and temporal resolution suitable for GIS analysis; and (iii) direct relevance to each component of the DPSIR (Drivers–Pressures–State–Impacts–Responses) framework. All spatial data were standardized to the WGS84/UTM Zone 48N coordinate system. Preprocessing steps included speckle filtering of SAR image, DEM correction, and synchronization of the LULC layer to ensure consistency prior to overlay analysis.

Table 1.
Data sources for the study.
| Types of data | Formats | Duration | Source / references | Purposes of use |
|---|---|---|---|---|
| Sentinel-1 SAR (C-band, IW) | Raster (10m) | 2015–2024 (Jul–Oct) | ESA/Copernicus Hub | Flood mapping, constructing maps of flood frequency |
| ALOS AVNIR-2 | Raster (30 m) | 2010, 2020 | JAXA | Analysis of urban fluctuation |
| VLULC Vietnam Land Use Land Cover | Vector/Raster | 2010–2020 | Ministry of Natural Resources and Environment, VLULC update | Map of land use, urban expansion |
| DEM (SRTM v3) | Raster (30 m) | 2011 | USGS | Topographic analysis, geomorphological indices |
| Geomorphological map of Hanoi | Vector (1:320,000) | 2015 | Dao Dinh Bac | Classification of 9 geomorphological units |
| Historical flooded points | Vector (GPS points) | 2012-2022 | Reports of authority, press, field surveys | Flood map validation |
| Population (Statistical yearbook) | Data tables | 2013-2021 | Hanoi Statistics Office | Assessment of “Drivers” in DPSIR (non-GIS) |
| Drainage systems | Documents | 2018-2022 | Hanoi Sewerage and Drainage Company Limited | Assessment of “Pressures” in DPSIR (non-GIS) |
Notes: Sentinel-1 data was used to construct flood frequency map; VLULC and ALOS data supported urban expansion analysis; DEM and geomorphological maps were used to evaluate terrain-based risks; while population and drainage data were integrated into the DPSIR analysis.
3.2. Constructing Flood Maps from Sentinel-1 SAR
Sentinel-1 (A & B) operates in the C-band with a 6–12-day revisit cycle, which is highly suitable for flood monitoring as it is unaffected by cloud cover or weather conditions. Sentinel-1 SAR images (VV and VH polarizations, C-band) from 2015 to 2024 (rainy season, July–October) were processed on Google Earth Engine (GEE) following these steps:
- Preprocessing: Orbit and terrain correction, radiometric calibration, and speckle filtering using the Refined Lee filter (5×5 kernel).
- Flood classification: Calculation of the SAR-based NDWI index, application of Otsu’s automatic thresholding method to classify water and non-water pixels, and generation of binary flood maps for each image.
- Flood frequency mapping: Compilation of the image series to count the number of times each pixel was classified as inundated during 2015–2024. Flood frequency was then categorized into five levels (very low, low, medium, high, very high) according to pixel occurrence.
- Validation: Using 148 historical flood points (2012–2024) collected from official reports, media sources, and GPS surveys for spatial–temporal matching. The validation focused on flood occurrence and distribution rather than flood depth or duration, due to the limited resolution of reference data.
The overall accuracy reached 87% (Kappa = 0.79), consistent with international studies [77,78]. The GIS–remote sensing framework developed in this study not only supports quantitative flood risk assessment but also provides a standardized spatial database that can be incorporated into digital management systems. This interoperability enables continuous data updating, integration with monitoring networks, and long-term application in e-government platforms for flood control and urban planning.
3.3. Analysis of Urbanization and Land Use
ALOS AVNIR-2 images (2010 and 2020), combined with VLULC datasets (2010–2020), were used to detect changes in land cover and identify newly urbanized areas compared with pre-existing urban zones.
Old urban areas were defined as those urbanized prior to 2010, while new urban areas refer to regions developed after 2010. Urbanization layers were overlaid with the geomorphological map to determine which geomorphological units were most affected by new urban expansion, particularly those in low-lying terrains (inner and outer-dike floodplains and fluvio-marine plains).
Previous studies have consistently shown that urban expansion in low-elevation zones increases flood susceptibility [79].
3.4. Flood Risk Assessment by Geomorphology
The geomorphological map of Hanoi (scale 1:320,000) delineates nine geomorphological units, including inner and outer-dike floodplains, paleochannels, karst areas, fluvio-marine plains, denudation surfaces, fluvial surfaces, mixed surfaces, and river terraces.
The flood frequency map (Section 3.2) and urbanization layer (Section 3.3) were overlaid with this geomorphological map to identify terrain units most vulnerable to inundation.
A Weighted Overlay Analysis was performed in GIS, assigning each geomorphological unit a weight from 0 (very low) to 5 (very high) based on its susceptibility to flooding. Weighting values were derived from a synthesis of international studies [80] and adjusted to reflect Hanoi’s specific topographic features, including elevation, slope, and natural drainage capacity.
3.5. DPSIR Framework
The Drivers–Pressures–State–Impacts–Responses (DPSIR) framework was applied to systematically examine the cause–effect relationships among factors influencing flooding in Hanoi (Figure 4).
- Drivers: Population growth, rapid urbanization, and climate change.
- Pressures: Increasing impervious surfaces, infilling of lakes and ponds, and reduced drainage capacity.
- State: Current flood frequency and urbanization maps, combined with geomorphological conditions.
- Impacts: Results from field and sociological surveys assessing effects on livelihoods, infrastructure, and the economy.
- Responses: Policies, planning solutions, and infrastructure projects that have been implemented or are under development.
The DPSIR framework has been widely and successfully applied in environmental and risk management research both in Vietnam and internationally [81]. Its use in this study enables a comprehensive analysis of the root causes and evolution of flooding, and supports the formulation of adaptive and sustainable planning strategies.
3.6. Field Surveys and Sociological Investigations
Field surveys were conducted from 22 to 30 March 2025 in four districts with high flood frequency (Thanh Xuan, Hoang Mai, Nam Tu Liem, and Hoai Duc). The surveys documented flooded sites, drainage infrastructure, photographic evidence, and GPS coordinates.
For sociological investigations, 80 structured questionnaires were distributed to households and individuals in flood-affected areas. The questionnaires covered flood frequency and duration, damages, drainage performance, and expectations for future planning solutions. These data were used to validate Sentinel-1 flood maps (State) and to assess Impacts and Responses within the DPSIR framework.
3.7. Study Process
The overall study process comprised four main stages (Figure 5):
- Data collection and preprocessing: Compilation and preparation of Sentinel-1, ALOS, VLULC, DEM, geomorphological, flood point, population, and drainage datasets.
- Geomorphological and urbanization analysis: Generation of old and new urban maps and analysis by geomorphological unit.
- Flood mapping and frequency analysis: SAR image processing, flood frequency calculation, and validation using historical flood points.
- Risk assessment and adaptive planning proposals: Integration of Weighted Overlay results with the DPSIR framework and social survey data to identify high-risk zones and propose adaptation-oriented solutions.
4. Results and Discussion
4.1. Flood Frequency in Hanoi City (2015-2024)
The flood frequency map derived from Sentinel-1 image series (2015-2024) reveals a clear spatial differentiation in both extent and frequency of inundation in Hanoi. Based on the number of flood events recorded annually, the study area was classified into five levels: very low (0–1 event), low (2–3 events), medium (4 events), high (5–6 events) and very high (>6 events) (Table 1).
Approximately 67% of the area experienced a very low flood frequency, whereas 18% fell into the medium to very high categories. Flood-prone areas are mainly concentrated in the western and southern districts (Thach That, Chuong My, My Duc, Phu Xuyen, Thuong Tin) and Soc Son, Dong Anh, which have low-lying terrain and rely on dikes and natural drainage capacity. In contrast, inner-city districts mainly experienced localized flooding events associated with extreme rainfall exceeding the capacity of the existing drainage system (Figure 6).
The map was validated using a database of flood points collected from press and official reports for the period 2012–2024 [34]. Major events in Bac Son (Soc Son) and Xuan Mai (Chuong My) were clearly reflected, demonstrating the consistency between the remote sensing results and actual conditions. However, the validation data mainly focused on severe flood events, with limited information on minor and short-duration floods. In addition, the recorded locations were often reported only at the commune or village level, which was not sufficiently precise for calculating statistical indices such as OA or Kappa. Therefore, validation in this study was limited to an indirect level. Future studies should incorporate additional field surveys, community-based (crowdsourced) data, or IoT sensor networks to enhance transparency and quantitatively assess accuracy using standard statistical indicators [55,82].
4.2. Urbanization Trends on Geomorphological Units in Hanoi
The urbanization map, constructed by overlaying data from 2010 and 2020, shows that Hanoi's urban increased rapidly, reaching 56,543.7 ha in 2020. Of this total, 66% corresponds to old urban areas (existing since 2010) and 34% to new urban areas (developed during 2010–2020), mainly concentrated in the West and Southwest (Thach That, Thanh Tri, Thuong Tin, My Duc) (Table 2).
When integrated with the geomorphological map, the results show that urbanization has primarily occurred on two low-lying geomorphological units: inner-dike floodplains (39.5%) and outer-dike floodplains (23.0%) (Figure 7). These areas are prone to flooding due to low elevation, limited drainage capacity, and high dependence on river–lake systems.
This reflects an imbalance between urban spatial expansion and flood adaptability. Previous studies have also indicated that many newly urbanized areas of Hanoi overlap with flood-prone geomorphological units, increasing their vulnerability to heavy rainfall events [47,83]. The findings reinforce the observation that the trend of urban development on low-lying alluvial grounds is one of the key factors contributing to increased flood risk (Figure 8 and Figure 9).
4.3. Statistics of Inundated Areas by Geomorphological Units
To evaluate the influence of geomorphological characteristics on inundation, flood occurrence data from 2015–2024 were overlaid with the geomorphological map, allowing quantification of the inundated area within each geomorphological unit (Figure 10). The results indicate that the three geomorphological units with the largest inundated areas are inner-dike floodplains (36.45%), outer-dike floodplains (16.66%), and fluvio-marine plains (15.64%), mainly concentrated in low-lying zones. These areas are characterized by low elevation, limited drainage capacity, and direct exposure to heavy rainfall and river flooding, particularly in the southwestern subsided zones (Chuong My, My Duc, Phu Xuyen, Thuong Tin), which function as the “flood outlets” of Hanoi.
Table 3.
Statistics of inundated areas by geomorphological units in Hanoi.
| Inundated area | Percentage | |
|---|---|---|
| Denudation–erosion origin | 11,336.078 | 9.47% |
| Fluvial-origin surfaces | 4,595.217 | 3.84% |
| River terrace | 7,553.963 | 6.31% |
| Inner-dike floodplains | 43,638.614 | 36.45% |
| Outer-dike floodplains | 19,950.677 | 16.66% |
| Paleochannels | 4,534.418 | 3.79% |
| Mixed surfaces | 2,145.095 | 1.79% |
| Karst | 7,250.181 | 6.06% |
| Fluvio-marine plain | 18,727.5 | 15.64% |
Conversely, higher geomorphological units such as river terraces, karst, and denudation–erosion surfaces exhibit lower flooding risk due to their higher elevation and more efficient natural drainage. Previous studies have also indicated that floodplains and alluvial grounds face a 2–3 times higher flood risk compared to elevated geomorphological units [80], confirming the decisive role of geomorphology in the spatial distribution of inundation [84].
4.4. Characteristics of Inundation in Urban Areas (New and Old Urban Areas)
Analysis of the overlay between flood data and the urban spatial layer revealed a clear distinction between old and new urban areas. The total inundated area was 4,779.2 ha, of which 73% occurred in new urban areas and 27% in old urban areas (Table 4).
New urban areas are more prone to inundation due to rapid development on weak soils and floodplains, especially in the western and southwestern zones (Figure 11). Old urban areas experience less flooding thanks to their higher terrain and earlier-constructed drainage systems, although localized inundation still occurs in degraded streets such as Nguyen Trai, Giai Phong, and Truong Chinh.
In fact, newly developed urban zones in the western part of Hanoi frequently experience flooding during heavy rainfall events, which is consistent with previous analyses [34,83]. This finding indicates that inundation is not only a consequence of rapid urbanization but also closely linked to geomorphological characteristics, highlighting the necessity of integrating topographic and geomorphological factors into sustainable urban planning.
4.5. Assessment of Flood Risk Using Geomorphological Approach
The flood risk map was constructed using the Weighted Overlay method in GIS, which assigns weights to each geomorphological unit according to its level of vulnerability, and then overlays them with flood frequency and urbanization data. This method has been widely applied in many studies assessing disaster and flood risk [46,85,86].
The weighting scale consists of five levels (0, 2, 3, 4, and 5), corresponding to very low, low, medium, high, and very high risk. This scale is based on: (i) a synthesis of previous studies on flood risk classification using GIS and weighting methods [85,86]; (ii) Hanoi’s distinctive geomorphological characteristics [26,32,64]; and (iii) the analytical results of the flooding map for the period 2015–2024. Particularly, areas of denudation–erosion origin and karst terrain at higher elevations were assigned negligible to moderate risk values (0–3). For the first-order river terrace, flood risk depends on the combined influence of alluvial deposition and human impacts (0–3). The remaining geomorphological units (floodplains, paleochannels, fluvio-marine plains, and fluvial-origin surfaces) were assigned the full five-level scale (0–5), as they are located in low-lying terrain with poor drainage and are highly susceptible to river floods (Table 5).
The results show that areas with medium to very high risk are mainly concentrated in suburban zones, particularly in Thuong Tin, My Duc, and Phu Xuyen—natural “flood outlet” areas of Hanoi. Several other districts, such as Gia Lam and Me Linh, also exhibit low to high risks, which should be taken into account in urban planning.
Based on the weighting table, combined with the flood frequency and urbanization data layers, a geomorphology-based flood risk map was developed (Figure 12). The map shows a clear five-level differentiation between inner-city and outer-city areas, providing a scientific basis for identifying high-risk zones and serving as a foundation for DPSIR-based analysis to propose solutions for urban flood management.
4.6. DPSIR Framework in Assessing Urban Flooding and Spatial Planning in Hanoi
4.6.1. Drivers
Urban flooding is strongly affected by socio-economic drivers, including population growth, rapid urbanization, insufficient integration of hydrological factors in planning, and the impacts of climate change. Between 2010 and 2023, Hanoi's population increased by more than 2 million people, reaching a density of approximately 2,556 people per km², which has placed considerable pressure on the drainage infrastructure [73,87].
The impervious surface area expanded by about 35%, reducing water permeability and the city’s natural regulation capacity. New urban areas have mainly developed toward the West and South, along major traffic axes, resulting in drainage demands that exceed existing capacity.
Spatial planning remains largely administrative, with limited integration of climate change and hydrological conditions, and is sometimes influenced by short-term interests, leading to fragmented urban development and infrastructure overload. Drainage policies still depend primarily on centralized systems, thereby reducing the city’s adaptive capacity and resilience [88].
4.6.2. Pressures
From the above drivers, three main groups of pressures are pushing Hanoi's urban system to its limits of exploitation:
(1) Expansion of impervious surfaces and reduction of natural regulation capacity: Between 2014 and 2023, many districts (Nam Tu Liem, Hoang Mai, Ha Dong, Hoai Duc) reported increases of 11.3–39.8% in special-use land, while agricultural land decreased by 3.6–24.1% [73,89]. The number of lakes and ponds declined from 122 (2010) to 112 (2015), with a surface water loss of approximately 72,540 m² [90], gradually eroding the city's natural “buffer zones.”
(2) Lack of synchronization between planning and infrastructure: New urban areas have often been constructed on low-lying ground with limited drainage outlets. In Linh Dam (Hoang Mai), the master plan was adjusted to nearly double the residential land, reducing green spaces and detention basins; construction density exceeded 50%, rapidly overloading the drainage network [88]. Surveys indicate that over 50% of residents rate the drainage system as degraded and frequently clogged. Hanoi still employs a combined drainage system for stormwater and wastewater, while the treatment capacity remains only about 30% (1 million m³/day) across six plants (Figure 13).
(3) Extreme climate and heavy rainfall: Although total annual rainfall during 1961–2020 decreased by 8.7%, the frequency of extreme rainfall has significantly increased. Typhoon No. 3 (Yagi) on 7 September 2024 caused 200–500 mm of rainfall over two days, far exceeding the design capacity of the drainage system (70–100 mm/2 hours). The combination of heavy rainfall, rapid urbanization, and poor infrastructure has turned many districts into frequent flooding hotspots.
4.6.3. State
During the period 2012–2022, Hanoi recorded over 50 heavy rainfall events, causing flooding in more than 200 locations across 16 districts [34]. The number of flooded points increased from 21 (2012) to 144 (2022), reflecting an upward trend in both spatial extent and frequency [34,88].
Mapping results show that flooded points often form clusters along main urban corridors such as Ring Road 3 – Thang Long Bridge (North), Thang Long Avenue (West), National Highway 6 (Southwest), and Duong Bridge axis (Northeast). Flood frequency was distributed as follows: 18% very high (9–24 events), 15.5% high (6–8 events), 34.5% medium (3–5 events), and 32% low (1–2 events) [34]. Thanh Xuan, Hoan Kiem, Hoang Mai, Cau Giay, and Ha Dong were identified as flooding “hotspots” due to high construction density, aging infrastructure, and loss of permeable surfaces (Figure 14).
These results not only confirm the widespread occurrence of urban flooding but also indicate a systematic increase exceeding the design capacity of existing drainage infrastructure, highlighting limitations in management and planning [88].
4.6.4. Impacts
Flooding in Hanoi exerts multidimensional impacts on society, the economy, and infrastructure. Socially, 74% of surveyed residents reported that their daily life and work were directly affected. Indirect economic damage due to traffic congestion and livelihood disruptions is estimated at tens of billions of VND per hour of flooding, particularly for small traders and businesses (52%).
Repeated flooding also accelerates the deterioration of transport infrastructure, sewers, and underground facilities. Road surfaces are degraded, basements and manholes are regularly clogged with sediment, waste, and grease, while maintenance mechanisms remain passive and lack systematic monitoring. Consequently, maintenance costs have risen sharply, creating a burden on the municipal budget and reducing the efficiency of public investment.
4.6.5. Responses
At the household level, residents have adopted temporary adaptive measures such as raising floor levels, installing pumps, elevating furniture, and sharing flood warnings on social media. However, these solutions only mitigate short-term damages without addressing the root causes.
At the city level, Hanoi has implemented major projects, including the Yen Xa, Phu Do, and An Lac wastewater treatment plants; rehabilitation of the To Lich and Kim Nguu rivers; and gradual separation of stormwater and wastewater systems under Decision 725/QD-TTg, alongside promoting integrated planning following Decision 1569/QD-TTg (2024).
Nevertheless, many projects remain delayed, facing capital shortages and a lack of cross-sector coordination. The absence of a real-time monitoring system has further reduced operational efficiency. To improve long-term resilience, an integrated management strategy is required, combining technical measures (green infrastructure, detention basins, permeable materials) with governance solutions (basin-based planning, smart monitoring).
Analysis using the DPSIR framework (Figure 15) systematizes the cause–effect relationships between urbanization and flooding in Hanoi. The drivers of population growth, spatial expansion, and socio-economic development have created strong pressures on land and infrastructure. The pressures—such as increased impervious surfaces, infilling of lakes and ponds, and climate change—have overloaded the drainage system, resulting in expanded and recurrent seasonal flooding.
The consequences of this phenomenon are reflected in numerous negative impacts: economic losses, traffic disruptions, decreased quality of life, and accelerated infrastructure degradation. Although responses have been implemented through the 2030 master plan, detention basins, and wastewater treatment projects, their effectiveness remains limited due to a lack of intersectoral coordination, slow implementation, and insufficient integration of nature-based solutions.
The results highlight the urgent need for an integrated flood management strategy, combining green–gray infrastructure, basin-based planning, and real-time monitoring technologies to enhance resilience and move toward a sustainable and climate-adaptive Hanoi. The integration of geomorphological and Sentinel-1 analyses provides reliable spatial patterns that reflect the interactions among topography, land use, and observed inundation. These results could be linked with real-time monitoring platforms and digital spatial management systems to support proactive flood response and infrastructure planning. Such integration also enhances coordination between scientific assessment and administrative decision-making, contributing to more adaptive and transparent urban governance.
4.7. Planning Orientations for Flood-Adaptive Urban Development in Hanoi
Flooding in Hanoi is a consequence of rapid urbanization on low-lying terrain, the expansion of impervious surfaces, the infilling of lakes and ponds, fragmented planning, and drainage systems that fail to meet increasing demands [26,32,33,34,88]. Flooding is concentrated in newly developed urban areas and low-lying geomorphological zones, which account for over 70% of total inundated areas [47]. This highlights the urgent need for sustainable urban planning and enhanced resilience based on risk management and spatial data integration.
(1) Basin-based planning and risk zoning: Flood frequency maps combined with geomorphological and urbanization analyses should be used to identify high-risk areas (such as Thuong Tin, My Duc, Phu Xuyen, and Ha Dong). These zones should be restricted from high-density development, preserve natural drainage corridors, and be incorporated into climate-adaptive spatial planning. Experience from the Sponge City program (China) and GIS–AHP studies in Hanoi demonstrates that pre-planning risk zoning helps reduce damage and optimize investment costs [47,91].
(2) Development of green–gray infrastructure and nature-based solutions: The results presented in Section 4.2, Section 4.3, Section 4.4 and Section 4.5 indicate that the loss of water bodies and permeable land is a major driver of increased flood risk. Hanoi should prioritize the restoration of lakes, ponds, flood drainage corridors, and natural water retention zones, in combination with green infrastructure (rain gardens, green roofs, permeable pavements) and gray infrastructure (detention basins, interceptor sewers). The green–blue infrastructure approach, along with Low-Impact Development (LID) and sunken green spaces, can reduce surface runoff by up to 75% while simultaneously improving landscape quality and water environments [92,93].
(3) Upgrading and separation of the drainage system: Currently, more than 70% of inner-city areas still rely on a combined drainage network for stormwater and wastewater. It is essential to separate the two systems, expand detention basin capacity, and integrate decentralized regulating tanks with smart drainage management technologies to reduce overload risks during extreme rainfall events [93].
(4) Governance mechanisms and financial policies: New drainage design standards should be established based on extreme rainfall scenarios (≥100 mm/h). Flood risk assessment must be required prior to urban project approval, and an anti-flood fund should be developed under public–private partnership (PPP) models. Land-use planning, drainage, and infrastructure development must be synchronized to ensure coherence and long-term effectiveness [88,94].
(5) Monitoring and implementation roadmap: A real-time rainfall and flood monitoring system integrating GIS and remote sensing should be established to evaluate the effectiveness of interventions. Pilot projects should be implemented in heavily flooded districts (Hoang Mai, Ha Dong, Thanh Xuan), followed by large-scale deployment over a 5–10-year roadmap aligned with Hanoi’s sustainable development strategy.
Based on the analytical findings, several orientations are proposed to promote flood-adaptive and intelligent urban development in Hanoi. Beyond conventional physical and institutional measures, urban management should also adopt digital technologies and data-driven tools. Integrating GIS- and remote-sensing-based flood databases with IoT monitoring and e-government platforms can improve early-warning capability, optimize resource allocation, and facilitate public participation. This integrated approach connects scientific analysis with governance practice, strengthening the city’s adaptive capacity to climate-induced flooding.
These orientations will not only help Hanoi reduce flood risks but also contribute to achieving SDG 11 – building safe, adaptive, and sustainable cities.
5. Conclusions
Urban flooding has become a major challenge to sustainable development in Hanoi, as its frequency, extent, and severity continue to increase. This study applied an integrated approach combining geomorphological analysis, Sentinel-1 remote sensing data, and the DPSIR framework to assess the relationship between urbanization and flood risk.
The results show that more than 70% of inundated areas are located in low-lying geomorphological units such as floodplains, paleochannels, and fluvio-marine terrains. Notably, approximately 80% of newly urbanized areas have been developed in sensitive zones, of which 36.5% are situated on inner-dike floodplains. The flood map validated using 148 field points achieved an overall accuracy of 87% (Kappa = 0.79), confirming the effectiveness of radar data in spatio-temporal monitoring of urban flooding.
The DPSIR analysis identified three major groups of pressures: the reduction of natural water retention spaces, unsynchronized infrastructure planning and management, and the increase in extreme rainfall events caused by climate change. Among these, uncontrolled urbanization and weak planning enforcement were recognized as root causes, leading to recurrent and expanding flood incidents.
This study provides scientific evidence of the combined impacts of urbanization on flooding and proposes adaptive planning orientations for Hanoi, including the preservation of water retention spaces, development of green–gray infrastructure, and upgrading of the drainage system. However, the scope of this study was limited to Hanoi during 2015–2024 and did not consider extreme climate scenarios. Future research should expand the study area, employ high-resolution remote sensing data, integrate urban hydrological models, and apply artificial intelligence techniques to enhance reliability and support the development of a solid scientific foundation for sustainable urban planning in Vietnam. The findings of this study also demonstrate the potential of integrating geomorphological and remote-sensing data into digital management frameworks. Future work should focus on developing interoperable geospatial infrastructures and applying artificial intelligence for dynamic flood prediction and urban monitoring. Embedding these analytical frameworks into smart-city and e-government systems will enhance resilience, transparency, and the overall efficiency of urban governance in Vietnam.
Supplementary Materials
The following supporting information can be downloaded at the website of this paper posted on Preprints.org, Figure S1: Location of the study area in Vietnam (high-resolution version of Figure 1a); Figure S2: Administration map of the study area (high-resolution version of Figure 1b); Figure S3: Digital Elevation Model (DEM) of Hanoi (high-resolution version of Figure 2); Figure S4: Urbanization map of the study area in 2010 (high-resolution version of Figure 3a); Figure S5: Urbanization map of the study area in 2020 (high-resolution version of Figure 3b); Figure S6: DPSIR model diagram (high-resolution version of Figure 4); Figure S7: Research flow (high-resolution version of Figure 5); Figure S8: Flood frequency map of Hanoi (2015–2024) (high-resolution version of Figure 6); Figure S9: Urbanization map of Hanoi city (2010–2020) (high-resolution version of Figure 7); Figure S10: Distribution of urbanization areas by geomorphological units in Hanoi (high-resolution version of Figure 8); Figure S11: Geomorphological map of Hanoi (related to Figure 9); Figure S12: Map of urbanization trend on geomorphological units in Hanoi city (high-resolution version of Figure 9); Figure S13: Map of inundation distribution on geomorphological units in Hanoi city (high-resolution version of Figure 10); Figure S14: Flood map of urban areas in Hanoi (high-resolution version of Figure 11); Figure S15: Flood risk assessment map of Hanoi using a geomorphological approach (high-resolution version of Figure 12); Figure S16: Survey of residents’ perceptions of the current drainage system (high-resolution version of Figure 13); Figure S17: Flooding state chart by district for the period 2012–2022 (high-resolution version of Figure 14); Figure S18: DPSIR table on flooding in Hanoi (high-resolution version of Figure 15).
Author Contributions
Conceptualization, Trinh Thi Kieu Trang and Dang Kinh Bac; methodology, Trinh Thi Kieu Trang; software, Nguyen Minh Hieu; validation, Trinh Thi Kieu Trang, Dang Kinh Bac, and Pham Thi Phuong Nga; formal analysis, Vu Thi Kieu Oanh and Nguyen Minh Hieu; investigation, Vu Thi Kieu Oanh, Pham Thi Phuong Nga, Tran Van Tuan, Pham Thi Phin, Pham Sy Liem, Do Thi Tai Thu, and Vu Khac Hung; resources, Dang Kinh Bac and Pham Thi Phuong Nga; data curation, Nguyen Minh Hieu; writing—original draft preparation, Trinh Thi Kieu Trang; writing—review and editing, Trinh Thi Kieu Trang and Dang Kinh Bac; visualization, Nguyen Minh Hieu; supervision, Trinh Thi Kieu Trang and Dang Kinh Bac; project administration, Trinh Thi Kieu Trang; funding acquisition, Trinh Thi Kieu Trang. All authors have read and agreed to the published version of the manuscript.
Funding
This research has been done under the research project QG.22.21 of Vietnam Nation University, Hanoi. The project supports studies related to spatial data and smart urban management applications
Institutional Review Board Statement
Ethical review and approval were waived for this study because the survey on residents’ perceptions of urban flooding was conducted anonymously, did not collect any personal or identifiable information, and was used solely for academic research purposes.
Informed Consent Statement
Informed consent was waived for this study because the survey on residents’ perceptions did not collect personal or identifiable information and participation was entirely voluntary and anonymous.
Data Availability Statement
The datasets used and analyzed during this study are obtained from publicly available sources. Sentinel-1 SAR data were acquired from the European Space Agency (ESA) Copernicus Open Access Hub (https://scihub.copernicus.eu/), and ALOS AVNIR-2 images from the Japan Aerospace Exploration Agency (JAXA) (https://www.eorc.jaxa.jp/ALOS/en/avnir2/). Digital Elevation Model (SRTM v3) data were accessed via the U.S. Geological Survey (USGS) EarthExplorer (https://earthexplorer.usgs.gov/). Vietnam Land Use Land Cover (VLULC) data were provided by the Ministry of Natural Resources and Environment (MONRE, Vietnam), and the geomorphological map of Hanoi was digitized from Dao Dinh Bac (2015). Flood point data were collected from Hanoi authorities’ reports, press archives, and field GPS surveys conducted by the authors in March 2025. Population and drainage data were obtained from the Hanoi Statistical Office and Hanoi Sewerage and Drainage Company Limited. Processed datasets and GIS layers used for analyses (flood frequency, urbanization, geomorphology-based risk, and DPSIR indicators) are available from the corresponding author upon reasonable request due to size limitations and local data-sharing restrictions.
Acknowledgments
This research was conducted under the project QG.22.21 “Research on building a set of criteria and the model of the smart real estate management system for e-government development: trial in Nam Tu Liem district, Hanoi city” funded by Vietnam National University, Hanoi. We sincerely thank local officials and residents in Hanoi, Vietnam, for their participation in field interviews and their willingness to provide information.
Conflicts of Interest
The authors declare no conflicts of interest. All authors have completed the ICMJE conflict of interest disclosure form. The funders had no role in the design of the study; in the collection, analyses, or interpretation of data; in the writing of the manuscript; or in the decision to publish the results. The authors declare that there are no financial or personal relationships that could have inappropriately influenced the work reported in this manuscript.
Abbreviations
The following abbreviations are used in this manuscript:
| AHP | Analytic Hierarchy Process |
| ALOS | Advanced Land Observing Satellite |
| CNN–LSTM | Convolutional Neural Network – Long Short-Term Memory |
| DEM | Digital Elevation Model |
| DPSIR | Drivers–Pressures–State–Impacts–Responses |
| ESA | European Space Agency |
| GIS | Geographic Information System |
| GEE | Google Earth Engine |
| IFRI | Integrated Flood Risk Index |
| LID | Low-Impact Development |
| MCDA | Multi-Criteria Decision Analysis |
| MODIS | Moderate Resolution Imaging Spectroradiometer |
| OA | Overall Accuracy |
| PPP | Public–Private Partnership |
| SAR | Synthetic Aperture Radar |
| VLULC | Vietnam Land Use Land Cover |
References
- Ruan, J.; Chen, Y.; Yang, Z. Assessment of Temporal and Spatial Progress of Urban Resilience in Guangzhou under Rainstorm Scenarios. International Journal of Disaster Risk Reduction 2021, 66, 102578. [Google Scholar] [CrossRef]
- Nkeki, F.N.; Bello, E.I.; Agbaje, I.G. Flood Risk Mapping and Urban Infrastructural Susceptibility Assessment Using a GIS and Analytic Hierarchical Raster Fusion Approach in the Ona River Basin, Nigeria. International Journal of Disaster Risk Reduction 2022, 77, 103097. [Google Scholar] [CrossRef]
- Duan, W.; He, B.; Nover, D.; Fan, J.; Yang, G.; Chen, W.; Meng, H.; Liu, C. Floods and Associated Socioeconomic Damages in China over the Last Century. Nat Hazards 2016, 82, 401–413. [Google Scholar] [CrossRef]
- Tang, X.; Shu, Y.; Lian, Y.; Zhao, Y.; Fu, Y. A Spatial Assessment of Urban Waterlogging Risk Based on a Weighted Naïve Bayes Classifier. Science of The Total Environment 2018, 630, 264–274. [Google Scholar] [CrossRef]
- McDermott, T.K. Global Exposure to Flood Risk and Poverty. Nature Communications 2022, 13, 3529. [Google Scholar] [CrossRef]
- Bao, D.V.; Hieu, N. Refinement of the Digital Elevation Model Based on Geomorphology for Flood Research in the Lower Thu Bon River. VNU Journal of Science: Natural Sciences and Technology 2004, 9–15.
- Najibi, N.; Devineni, N. Recent Trends in the Frequency and Duration of Global Floods. Earth System Dynamics 2018, 9, 757–783. [Google Scholar] [CrossRef]
- Tellman, B.; Sullivan, J.A.; Kuhn, C.; Kettner, A.J.; Doyle, C.S.; Brakenridge, G.R.; Erickson, T.A.; Slayback, D.A. Satellite Imaging Reveals Increased Proportion of Population Exposed to Floods. Nature 2021, 596, 80–86. [Google Scholar] [CrossRef]
- World Meteorological Organization WMO Atlas of Mortality and Economic Losses from Weather, Climate and Water-Related Hazards (1970-2021); World Meteorological Organization: Geneva, Switzerland, 2021; ISBN 978-92-63-11267-5.
- International Federation of Red Cross and Red Crescent Societies (IFRC) World Disasters Report 2020: Come Heat or High Water; World Disasters Report 2020 | IFRC: Geneva, Switzerland, 2020; ISBN 978-2-9701289-5-3.
- Madsen, H.; Lawrence, D.; Lang, M.; Martinkova, M.; Kjeldsen, T.R. Review of Trend Analysis and Climate Change Projections of Extreme Precipitation and Floods in Europe. Journal of Hydrology 2014, 519, 3634–3650. [Google Scholar] [CrossRef]
- Dhiman, R.; VishnuRadhan, R.; Eldho, T.I.; Inamdar, A. Flood Risk and Adaptation in Indian Coastal Cities: Recent Scenarios. Appl Water Sci 2018, 9, 5. [Google Scholar] [CrossRef]
- Shao, Z.; Ding, L.; Li, D.; Altan, O.; Huq, M.E.; Li, C. Exploring the Relationship between Urbanization and Ecological Environment Using Remote Sensing Images and Statistical Data: A Case Study in the Yangtze River Delta, China. Sustainability 2020, 12, 5620. [Google Scholar] [CrossRef]
- Nowak, D.J.; Greenfield, E.J. The Increase of Impervious Cover and Decrease of Tree Cover within Urban Areas Globally (2012–2017). Urban Forestry & Urban Greening 2020, 49, 126638. [Google Scholar] [CrossRef]
- Zeng, Q.; Xie, Y.; Liu, K. Assessment of the Patterns of Urban Land Covers and Impervious Surface Areas: A Case Study of Shenzhen, China. Physics and Chemistry of the Earth, Parts A/B/C 2019, 110, 1–7. [Google Scholar] [CrossRef]
- Deng, Y.; Qi, W.; Fu, B.; Wang, K. Geographical Transformations of Urban Sprawl: Exploring the Spatial Heterogeneity across Cities in China 1992–2015. Cities 2020, 105, 102415. [Google Scholar] [CrossRef]
- Quan, R.-S.; Liu, M.; Lu, M.; Zhang, L.-J.; Wang, J.-J.; Xu, S.-Y. Waterlogging Risk Assessment Based on Land Use/Cover Change: A Case Study in Pudong New Area, Shanghai. Environ Earth Sci 2010, 61, 1113–1121. [Google Scholar] [CrossRef]
- Li, J.; Burian, S.J. Evaluating Real-Time Control of Stormwater Drainage Network and Green Stormwater Infrastructure for Enhancing Flooding Resilience under Future Rainfall Projections. Resources, Conservation and Recycling 2023, 198, 107123. [Google Scholar] [CrossRef]
- Li, L.; Uyttenhove, P.; Van Eetvelde, V. Planning Green Infrastructure to Mitigate Urban Surface Water Flooding Risk – A Methodology to Identify Priority Areas Applied in the City of Ghent. Landscape and Urban Planning 2020, 194, 103703. [Google Scholar] [CrossRef]
- Pham Anh, T. Water Urbanism in Hanoi, Vietnam: An Investigation into Possible Interplays of Infrastructure, Urbanism and Landscape of the City’s Dyke System, KU Leuven, Science, Engineering & Technology: Heverlee, Belgium, 2013.
- Tramblay, Y.; Mimeau, L.; Neppel, L.; Vinet, F.; Sauquet, E. Detection and Attribution of Flood Trends in Mediterranean Basins. Hydrology and Earth System Sciences 2019, 23, 4419–4431. [Google Scholar] [CrossRef]
- Xuan, T.T. Floods and Prevention Methods; Science and Technology Publishing House: Hanoi, Vietnam, 2000.
- Ringo, J.; Sabai, S.; Mahenge, A. Performance of Early Warning Systems in Mitigating Flood Effects. A Review. Journal of African Earth Sciences 2024, 210, 105134. [Google Scholar] [CrossRef]
- Sofia, G.; Roder, G.; Dalla Fontana, G.; Tarolli, P. Flood Dynamics in Urbanised Landscapes: 100 Years of Climate and Humans’ Interaction. Sci Rep 2017, 7, 40527. [Google Scholar] [CrossRef]
- Mulyasari, F.; Shaw, R.; Takeuchi, Y. Chapter 12 Urban Flood Risk Communication for Cities. In Climate and Disaster Resilience in Cities; Shaw, R., Sharma, A., Eds.; Emerald Group Publishing Limited, 2011; Vol. 6 ISBN 978-0-85724-319-5.
- Bao, D.V.; Bac, D.D.; Hieu, N.; Bac, D.K. Geomorphological Research for Planning the Western Expansion of Hanoi City. In Proceedings of the Proceedings of the 10th Southeast Asian Geography Conference; Hanoi National University of Education Publishing House: Hanoi, 2010; pp. 132–139.
- Bich, T.H.; Quang, L.N.; Thanh Ha, L.T.; Duc Hanh, T.T.; Guha-Sapir, D. Impacts of Flood on Health: Epidemiologic Evidence from Hanoi, Vietnam. Global Health Action 2011, 4, 6356. [Google Scholar] [CrossRef] [PubMed]
- Nabangchang, O.; Allaire, M.; Leangcharoen, P.; Jarungrattanapong, R.; Whittington, D. Economic Costs Incurred by Households in the 2011 Greater Bangkok Flood. Water Resources Research 2015, 51, 58–77. [Google Scholar] [CrossRef]
- Hammond, M.J.; Chen, A.S.; Djordjević, S.; Butler, D.; Mark, O. Urban Flood Impact Assessment: A State-of-the-Art Review. Urban Water Journal 2015, 12, 14–29. [Google Scholar] [CrossRef]
- Rodrigues do Amaral, F.; Gratiot, N.; Pellarin, T.; Tu, T.A. Assessing Typhoon-Induced Compound Flood Drivers: A Case Study in Ho Chi Minh City, Vietnam. Natural Hazards and Earth System Sciences 2023, 23, 3379–3405. [Google Scholar] [CrossRef]
- United Nations Office for Disaster Risk Reduction (UNDRR) Global Assessment Report on Disaster Risk Reduction 2019 | UNDRR; Geneva, Switzerland, 2019.
- Ngan, D.T. Geomorphological Study in Flood Hazard Warning for the Hanoi Area. Bachelor’s Thesis, VNU University of Science: Hanoi, 2009.
- Thien, T.D.; Ha, D.V.; Yen, N.T.; Hung, C.M. Challenges for Urban Water Management in Hanoi. In Proceedings of the Proceedings of the National Conference on Research, Transfer, and Application of Science and Technology for Sustainable Development; Science and Technology Publishing House: Hanoi, Vietnam, 2021; pp. 59–69.
- Thien, T.D.; Linh, D.T.; Gam, V.T.; Thu, N.T.; Chien, H.C. Current Situation of Urban Flooding in Hanoi during 2012–2022. Vietnam Architecture Journal 2023. [Google Scholar]
- Dung, N.T. Scientific Basis for Planning Urban Flood Control Based on Risk Analysis; Construction Publishing House: Hanoi, 2023. [Google Scholar]
- Pappenberger, F.; Beven, K.J.; Ratto, M.; Matgen, P. Multi-Method Global Sensitivity Analysis of Flood Inundation Models. Advances in Water Resources 2008, 31, 1–14. [Google Scholar] [CrossRef]
- Van Der Knijff, J.M.; Younis, J.; De Roo, A.P.J. LISFLOOD: A GIS-based Distributed Model for River Basin Scale Water Balance and Flood Simulation. International Journal of Geographical Information Science 2010, 24, 189–212. [Google Scholar] [CrossRef]
- Schumann, G.J.-P.; Neal, J.C.; Voisin, N.; Andreadis, K.M.; Pappenberger, F.; Phanthuwongpakdee, N.; Hall, A.C.; Bates, P.D. A First Large-Scale Flood Inundation Forecasting Model. Water Resources Research 2013, 49, 6248–6257. [Google Scholar] [CrossRef]
- Dutta, D.; Herath, S.; Musiake, K. Flood Inundation Simulation in a River Basin Using a Physically Based Distributed Hydrologic Model. Hydrological Processes 2000, 14, 497–519. [Google Scholar] [CrossRef]
- Bates, P.D.; De Roo, A.P.J. A Simple Raster-Based Model for Flood Inundation Simulation. Journal of hydrology 2000, 236, 54–77. [Google Scholar] [CrossRef]
- Zhang, S.; Pan, B. An Urban Storm-Inundation Simulation Method Based on GIS. Journal of Hydrology 2014, 517, 260–268. [Google Scholar] [CrossRef]
- Merwade, V.; Olivera, F.; Arabi, M.; Edleman, S. Uncertainty in Flood Inundation Mapping: Current Issues and Future Directions. Journal of Hydrologic Engineering 2008, 13, 608–620. [Google Scholar] [CrossRef]
- Mahmoud, S.H.; Gan, T.Y. Multi-Criteria Approach to Develop Flood Susceptibility Maps in Arid Regions of Middle East. Journal of Cleaner Production 2018, 196, 216–229. [Google Scholar] [CrossRef]
- Luu, C.; Tran, H.X.; Pham, B.T.; Al-Ansari, N.; Tran, T.Q.; Duong, N.Q.; Dao, N.H.; Nguyen, L.P.; Nguyen, H.D.; Thu Ta, H.; et al. Framework of Spatial Flood Risk Assessment for a Case Study in Quang Binh Province, Vietnam. Sustainability 2020, 12, 3058. [Google Scholar] [CrossRef]
- Chen, Y.-R.; Yeh, C.-H.; Yu, B. Integrated Application of the Analytic Hierarchy Process and the Geographic Information System for Flood Risk Assessment and Flood Plain Management in Taiwan. Nat Hazards 2011, 59, 1261–1276. [Google Scholar] [CrossRef]
- Kazakis, N.; Kougias, I.; Patsialis, T. Assessment of Flood Hazard Areas at a Regional Scale Using an Index-Based Approach and Analytical Hierarchy Process: Application in Rhodope–Evros Region, Greece. Science of The Total Environment 2015, 538, 555–563. [Google Scholar] [CrossRef] [PubMed]
- Nguyen, H.N.; Fukuda, H.; Nguyen, M.N. Assessment of the Susceptibility of Urban Flooding Using GIS with an Analytical Hierarchy Process in Hanoi, Vietnam. Sustainability 2024, 16, 3934. [Google Scholar] [CrossRef]
- Nguyen, H.X.; Nguyen, A.T.; Ngo, A.T.; Phan, V.T.; Nguyen, T.D.; Do, V.T.; Dao, D.C.; Dang, D.T.; Nguyen, A.T.; Nguyen, T.K.; et al. A Hybrid Approach Using GIS-Based Fuzzy AHP–TOPSIS Assessing Flood Hazards along the South-Central Coast of Vietnam. Applied Sciences 2020, 10, 7142. [Google Scholar] [CrossRef]
- Ward, P.J.; Jongman, B.; Aerts, J.C.J.H.; Bates, P.D.; Botzen, W.J.W.; Diaz Loaiza, A.; Hallegatte, S.; Kind, J.M.; Kwadijk, J.; Scussolini, P.; et al. A Global Framework for Future Costs and Benefits of River-Flood Protection in Urban Areas. Nature Clim Change 2017, 7, 642–646. [Google Scholar] [CrossRef]
- Alfieri, L.; Bisselink, B.; Dottori, F.; Naumann, G.; de Roo, A.; Salamon, P.; Wyser, K.; Feyen, L. Global Projections of River Flood Risk in a Warmer World. Earth’s Future 2017, 5, 171–182. [Google Scholar] [CrossRef]
- Ashfaq, S.; Tufail, M.; Niaz, A.; Muhammad, S.; Alzahrani, H.; Tariq, A. Flood Susceptibility Assessment and Mapping Using GIS-Based Analytical Hierarchy Process and Frequency Ratio Models. Global and Planetary Change 2025, 251, 104831. [Google Scholar] [CrossRef]
- Intergovernmental Panel on Climate Change (IPCC) Climate Change 2021: Impacts, Adaptation and Vulnerability (AR6 WGII). Presented at the Bonn Climate Change Conference - June 2019, 2019.
- Moftakhari, H.R.; AghaKouchak, A.; Sanders, B.F.; Matthew, R.A. Cumulative Hazard: The Case of Nuisance Flooding. Earth’s Future 2017, 5, 214–223. [Google Scholar] [CrossRef]
- Zscheischler, J.; Westra, S.; van den Hurk, B.J.J.M.; Seneviratne, S.I.; Ward, P.J.; Pitman, A.; AghaKouchak, A.; Bresch, D.N.; Leonard, M.; Wahl, T.; et al. Future Climate Risk from Compound Events. Nature Clim Change 2018, 8, 469–477. [Google Scholar] [CrossRef]
- Tarpanelli, A.; Mondini, A.C.; Camici, S. Effectiveness of Sentinel-1 and Sentinel-2 for Flood Detection Assessment in Europe. Natural Hazards and Earth System Sciences 2022, 22, 2473–2489. [Google Scholar] [CrossRef]
- Dowell, M.; Bernard, S.; Kilsedar, C.; Gianinetto, M.; Speyer, O.; Kuffer, M.; Grecchi, R.; Gliottone, I.; Melchiorri, M. Earth Observation in Support of EU Policies for Urban Climate Adaptation; Publications Office of the European Union, 2025; ISBN 9789268261330 9789268261347.
- Giezendanner, J.; Mukherjee, R.; Purri, M.; Thomas, M.; Mauerman, M.; Islam, Akm.; Tellman, B. Inferring the Past: A Combined CNN-LSTM Deep Learning Framework to Fuse Satellites for Historical Inundation Mapping. In Proceedings of the Proceedings of the IEEE/CVF Conference on Computer Vision and Pattern Recognition; 2023; pp. 2155–2165.
- Shen XinYi, S.X.; Wang DaCheng, W.D.; Mao KeBiao, M.K.; Anagnostou, E.; Hong Yang, H.Y. Inundation Extent Mapping by Synthetic Aperture Radar: A Review. 2019.
- Diep, N.T.H.; Trong Can, N.; Thi Ngoc, T.N.; Thien Nhi, D. Flood Inundation Mapping Using Sentinel-1A in An Giang Province in 2019. Vietnam Journal Of Sciences, Technology and Engineering 62, 36–42. [CrossRef]
- Nam B.H.; Van N.L.; Vu H.H. Applications of satellite data for rapid inundation assessment - A case study in Thua Thien Hue province. 1 2024, 75, 1697–1706. [CrossRef]
- Tu, N.A.; Stéphane, G.; Xuan, N.H.; Van Tho, P. Consideration on the Use of Sentinel-1 Radar Image and GIS for Flood Mapping in the Lai Giang River Basin of Binh Dinh Province (Central Coast Vietnam). In Global Changes and Sustainable Development in Asian Emerging Market Economies Vol. 2: Proceedings of EDESUS 2019; Nguyen, A.T., Hens, L., Eds.; Springer International Publishing: Cham, 2022; pp. 517–527 ISBN 978-3-030-81443-4.
- Bao, D.V.; Bac, D.D.; My, N.Q.; Phai, V.V.; Hieu, N. Geomorphological Map for Flood Warning in the Coastal Plains of Central Vietnam. VNU Journal of Science: Natural Sciences and Technology 2002, 18. [Google Scholar]
- Hieu, N.; Bao, D.V. Study on the Influence of Geomorphological Characteristics on Flood Sensitivity in the Hue Delta Based on Remote Sensing and GIS 1999.
- Bac, D.K. Application of Remote Sensing and GIS in Reconstructing the Ancient Riverbeds of the Day and Nhue Rivers in Hanoi. Master’s Thesis, VNU University of Science: Hanoi, 2012.
- Jago-on, K.A.B.; Kaneko, S.; Fujikura, R.; Fujiwara, A.; Imai, T.; Matsumoto, T.; Zhang, J.; Tanikawa, H.; Tanaka, K.; Lee, B. Urbanization and Subsurface Environmental Issues: An Attempt at DPSIR Model Application in Asian Cities. Science of the total environment 2009, 407, 3089–3104. [Google Scholar] [CrossRef]
- Tien, N.H. Urban Flood Management in Selected Cities Worldwide—Solutions and Lessons Learned. Vietnam Construction Journal 2024, 08.2024, 50–53. [Google Scholar]
- European Environment Agency (EEA) Environmental Indicators:Typology and Overview; 1999.
- Bruno, M.F.; Saponieri, A.; Molfetta, M.G.; Damiani, L. The DPSIR Approach for Coastal Risk Assessment under Climate Change at Regional Scale: The Case of Apulian Coast (Italy). Journal of Marine Science and Engineering 2020, 8, 531. [Google Scholar] [CrossRef]
- Kafi, Md.A.H.; Babel, M.S. A DPSIR Conceptual Framework for Index-Based Flood Risk Assessment: Case Study of Riverine Flood in Sirajganj, Bangladesh. Journal of Civil Engineering (IEB) 2022, 50, 43–58. [Google Scholar]
- Pham, H.N.; Takara, K.; Nguyen, H.S. Flood Hazard Impact Analysis in the Downstream of Vu Gia-Thu Bon River System, Quang Nam Province, Central Vietnam. Journal of Japan Society of Civil Engineers Ser B1 (Hydraulic Engineering) 2015, 71, I_157–I_162. [Google Scholar] [CrossRef]
- Ha, P.T.T.; Thao, V.T.T. Application of the DPSIR Model to Assess Surface Water Environment in Cu Khe Commune, Thanh Oai District, Hanoi City (2010–2014). CRES-Journal Papers 2016.
- Loi, D.T. Assessment of Urban Flood Vulnerability Using Integrated Multi-Parametric AHP and GIS. International Journal of GeoInformatics 2023, 19. [Google Scholar] [CrossRef]
- Hanoi Statistics Office. Hanoi Statistical Yearbook 2023; Statistical Publishing House: Hanoi, Vietnam, 2024. [Google Scholar]
- Prime Minister of Vietnam Master Plan for Hanoi Capital for the Period 2021–2030, with a Vision to 2050; Ministry of Planning and Investment, 2024.
- Prime Minister of Vietnam Adjustment of the General Master Plan for Hanoi Capital to 2045, with a Vision to 2065; Ministry of Construction: Hanoi, 2024.
- Bao, D.V.; Bac, D.K.; Nga, P.T.P.; Phuong, N.T. Ancient Riverbeds in Hanoi: Reconstruction and Management Orientation. VNU Journal of Science: Earth and Environmental Sciences 2014, 30. [Google Scholar]
- Shahabi, H.; Shirzadi, A.; Ghaderi, K.; Omidvar, E.; Al-Ansari, N.; Clague, J.J.; Geertsema, M.; Khosravi, K.; Amini, A.; Bahrami, S.; et al. Flood Detection and Susceptibility Mapping Using Sentinel-1 Remote Sensing Data and a Machine Learning Approach: Hybrid Intelligence of Bagging Ensemble Based on K-Nearest Neighbor Classifier. Remote Sensing 2020, 12, 266. [Google Scholar] [CrossRef]
- Mai Sy, H.; Luu, C.; Bui, Q.D.; Ha, H.; Nguyen, D.Q. Urban Flood Risk Assessment Using Sentinel-1 on the Google Earth Engine: A Case Study in Thai Nguyen City, Vietnam. Remote Sensing Applications: Society and Environment 2023, 31, 100987. [Google Scholar] [CrossRef]
- Gahalod, N.S.S.; Rajeev, K.; Pant, P.K.; Binjola, S.; Yadav, R.L.; Meena, R.L. Spatial Assessment of Flood Vulnerability and Waterlogging Extent in Agricultural Lands Using RS-GIS and AHP Technique-a Case Study of Patan District Gujarat, India. Environ Monit Assess 2024, 196, 338. [Google Scholar] [CrossRef]
- Rendana, M.; Mohd Razi Idris, W.; Abdul Rahim, S.; Abdo, H.G.; Almohamad, H.; Abdullah Al Dughairi, A. Flood Risk and Shelter Suitability Mapping Using Geospatial Technique for Sustainable Urban Flood Management: A Case Study in Palembang City, South Sumatera, Indonesia. Geology, Ecology, and Landscapes 2025, 9, 452–462. [Google Scholar] [CrossRef]
- S., N.A.; Hung Anh, L.; Schneider, P. A DPSIR Assessment on Ecosystem Services Challenges in the Mekong Delta, Vietnam: Coping with the Impacts of Sand Mining. Sustainability 2020, 12, 9323. [CrossRef]
- Uddin, K.; Matin, M.A.; Meyer, F.J. Operational Flood Mapping Using Multi-Temporal Sentinel-1 SAR Images: A Case Study from Bangladesh. Remote Sensing 2019, 11, 1581. [Google Scholar] [CrossRef]
- Van Pham, T.; Bui, D.X.; Do, T.A.T.; Do, A.N.T. Assessing Flood Susceptibility in Hanoi Using Machine Learning and Remote Sensing: Implications for Urban Health and Resilience. Nat Hazards 2025, 121, 10149–10170. [Google Scholar] [CrossRef]
- Tran, K.H.; Menenti, M.; Jia, L. Surface Water Mapping and Flood Monitoring in the Mekong Delta Using Sentinel-1 SAR Time Series and Otsu Threshold. Remote Sensing 2022, 14, 5721. [Google Scholar] [CrossRef]
- Rahmati, O.; Zeinivand, H.; Besharat, M. Flood Hazard Zoning in Yasooj Region, Iran, Using GIS and Multi-Criteria Decision Analysis. Geomatics, Natural Hazards and Risk 2016, 7, 1000–1017. [Google Scholar] [CrossRef]
- Khosravi, K.; Shahabi, H.; Pham, B.T.; Adamowski, J.; Shirzadi, A.; Pradhan, B.; Dou, J.; Ly, H.-B.; Gróf, G.; Ho, H.L.; et al. A Comparative Assessment of Flood Susceptibility Modeling Using Multi-Criteria Decision-Making Analysis and Machine Learning Methods. Journal of Hydrology 2019, 573, 311–323. [Google Scholar] [CrossRef]
- Hanoi Statistics Office. Hanoi Statistical Yearbook 2010; Statistical Publishing House: Hanoi, Vietnam, 2011. [Google Scholar]
- Hanoi Sewerage and Drainage One Member Limited Company Current Status of the Inner-City Drainage System of Hanoi 2022.
- Hanoi Statistics Office. Hanoi Statistical Yearbook 2014; Statistical Publishing House: Hanoi, Vietnam, 2015. [Google Scholar]
- Ly, N.N. Report on Hanoi Lakes 2015; Vietnam Women’s Publishing House: Hanoi, Vietnam, 2015. [Google Scholar]
- Chikhi, F.; Li, C.; Ji, Q.; Zhou, X. Review of Sponge City Implementation in China: Performance and Policy. Water Sci Technol 2023, 88, 2499–2520. [Google Scholar] [CrossRef] [PubMed]
- Yu, Q.; Li, N.; Wang, J.; Wang, S. Comprehensive Performance Assessment for Sponge City Construction: A Case Study. Water 2023, 15, 4039. [Google Scholar] [CrossRef]
- Lim, H.S.; Lu, X.X. Sustainable Urban Stormwater Management in the Tropics: An Evaluation of Singapore’s ABC Waters Program. Journal of Hydrology 2016, 538, 842–862. [Google Scholar] [CrossRef]
- Prime Minister of Vietnam Decision No. 725/QD-TTg: Approval of the Drainage Master Plan for Hanoi Capital to 2030, with a Vision to 2050 2013.
Figure 1.
Administrative map of the study area. High-resolution versions are available in the Supplementary Materials (Figures S1 and S2).
Figure 1.
Administrative map of the study area. High-resolution versions are available in the Supplementary Materials (Figures S1 and S2).
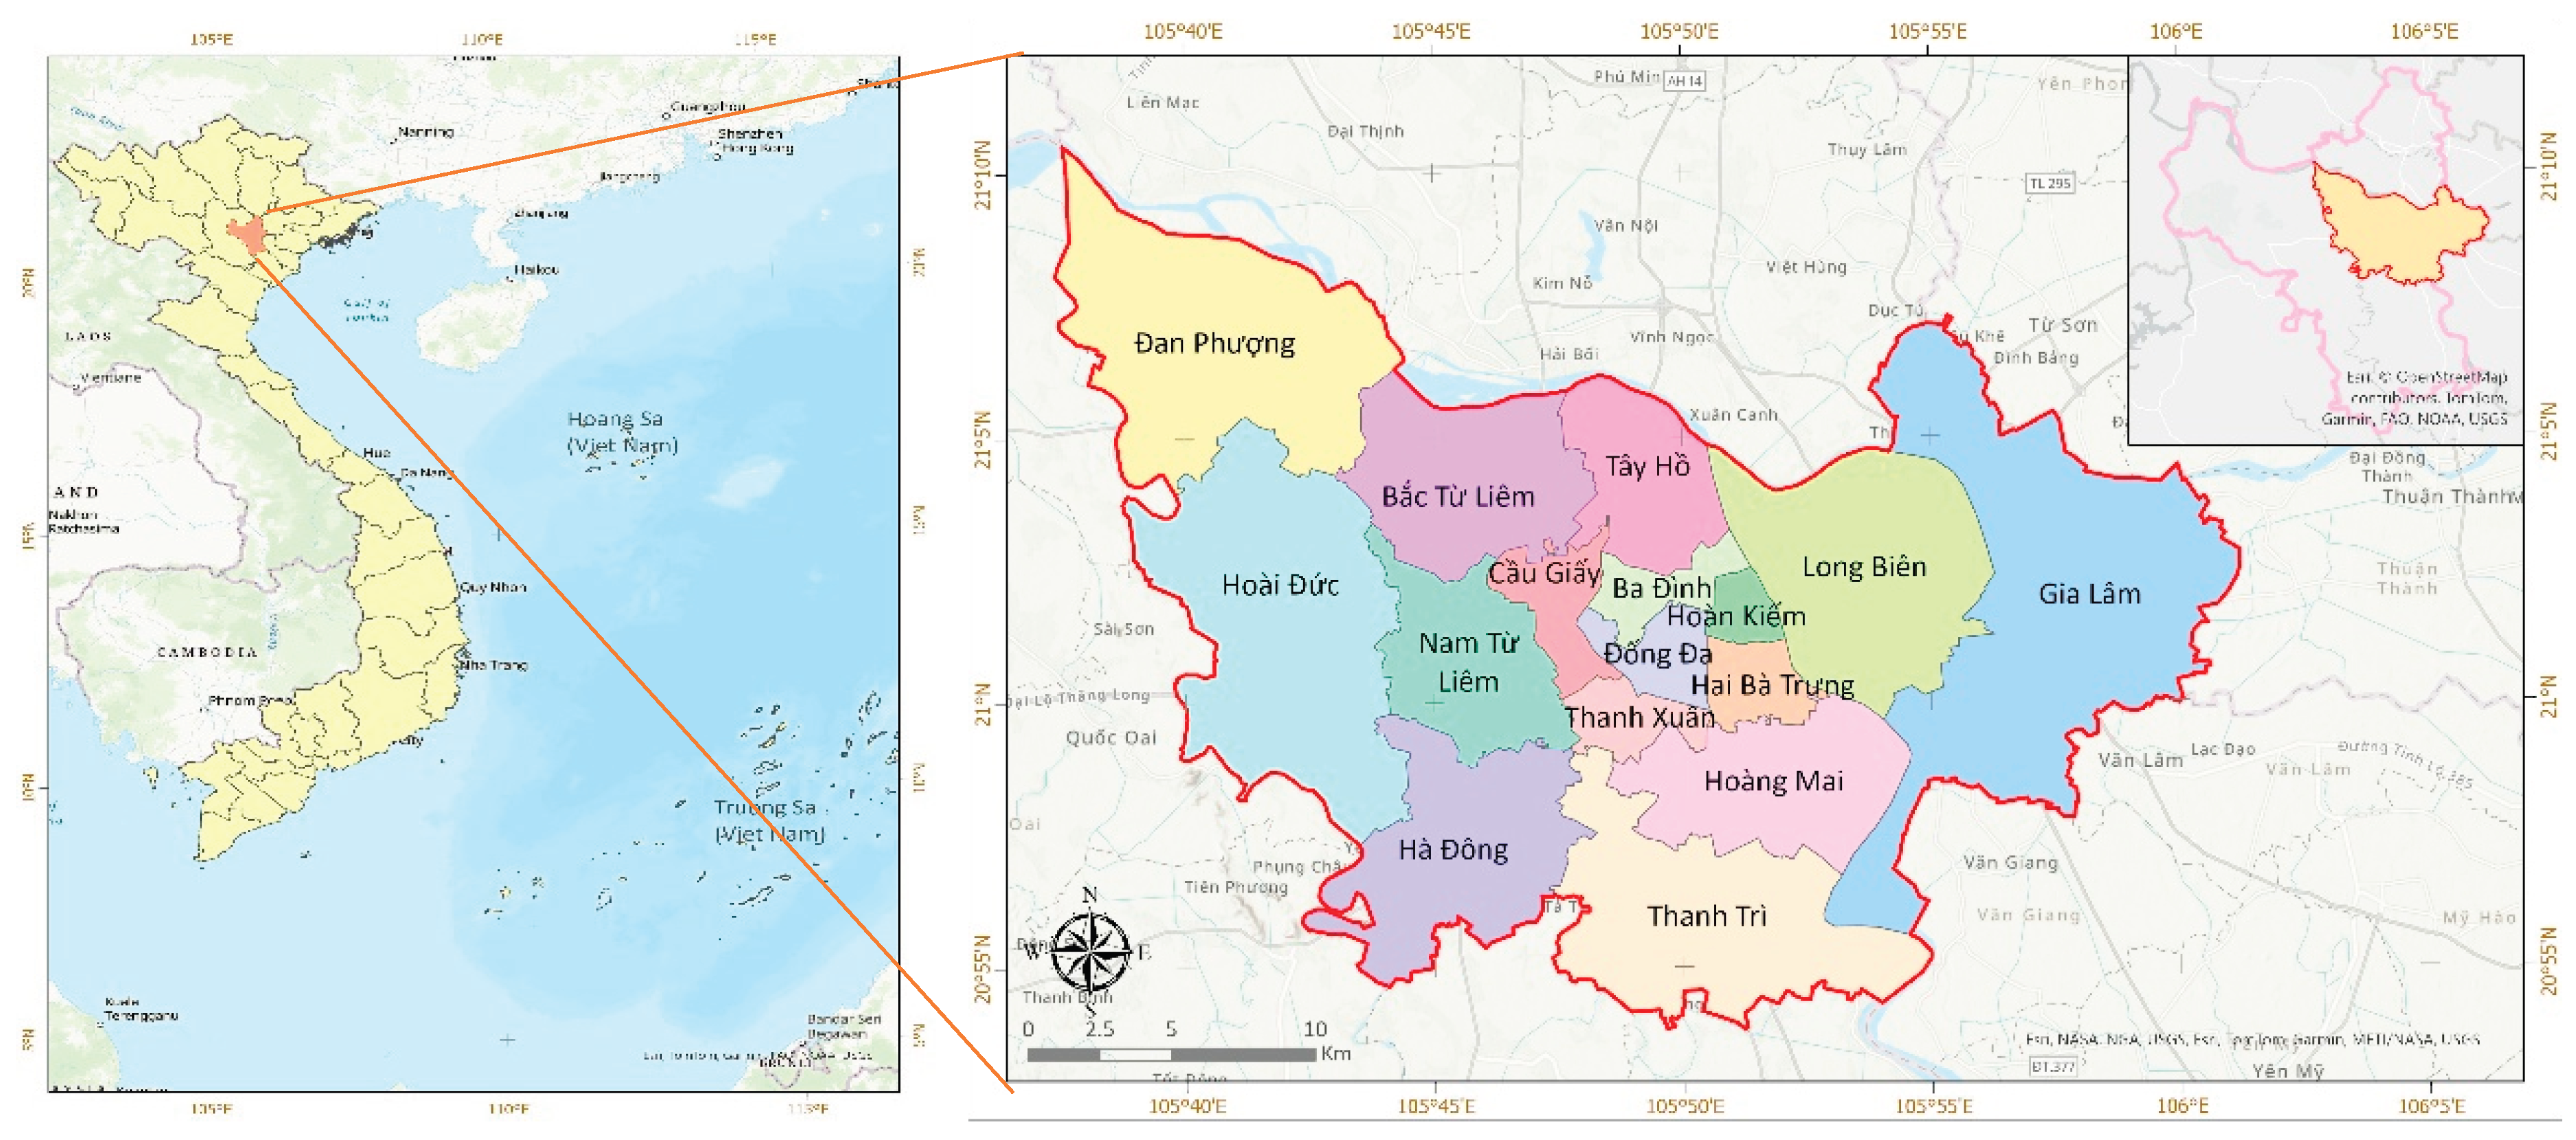
Figure 2.
Topographic map of Hanoi. High-resolution version is available in the Supplementary Materials (Figure S3).
Figure 2.
Topographic map of Hanoi. High-resolution version is available in the Supplementary Materials (Figure S3).
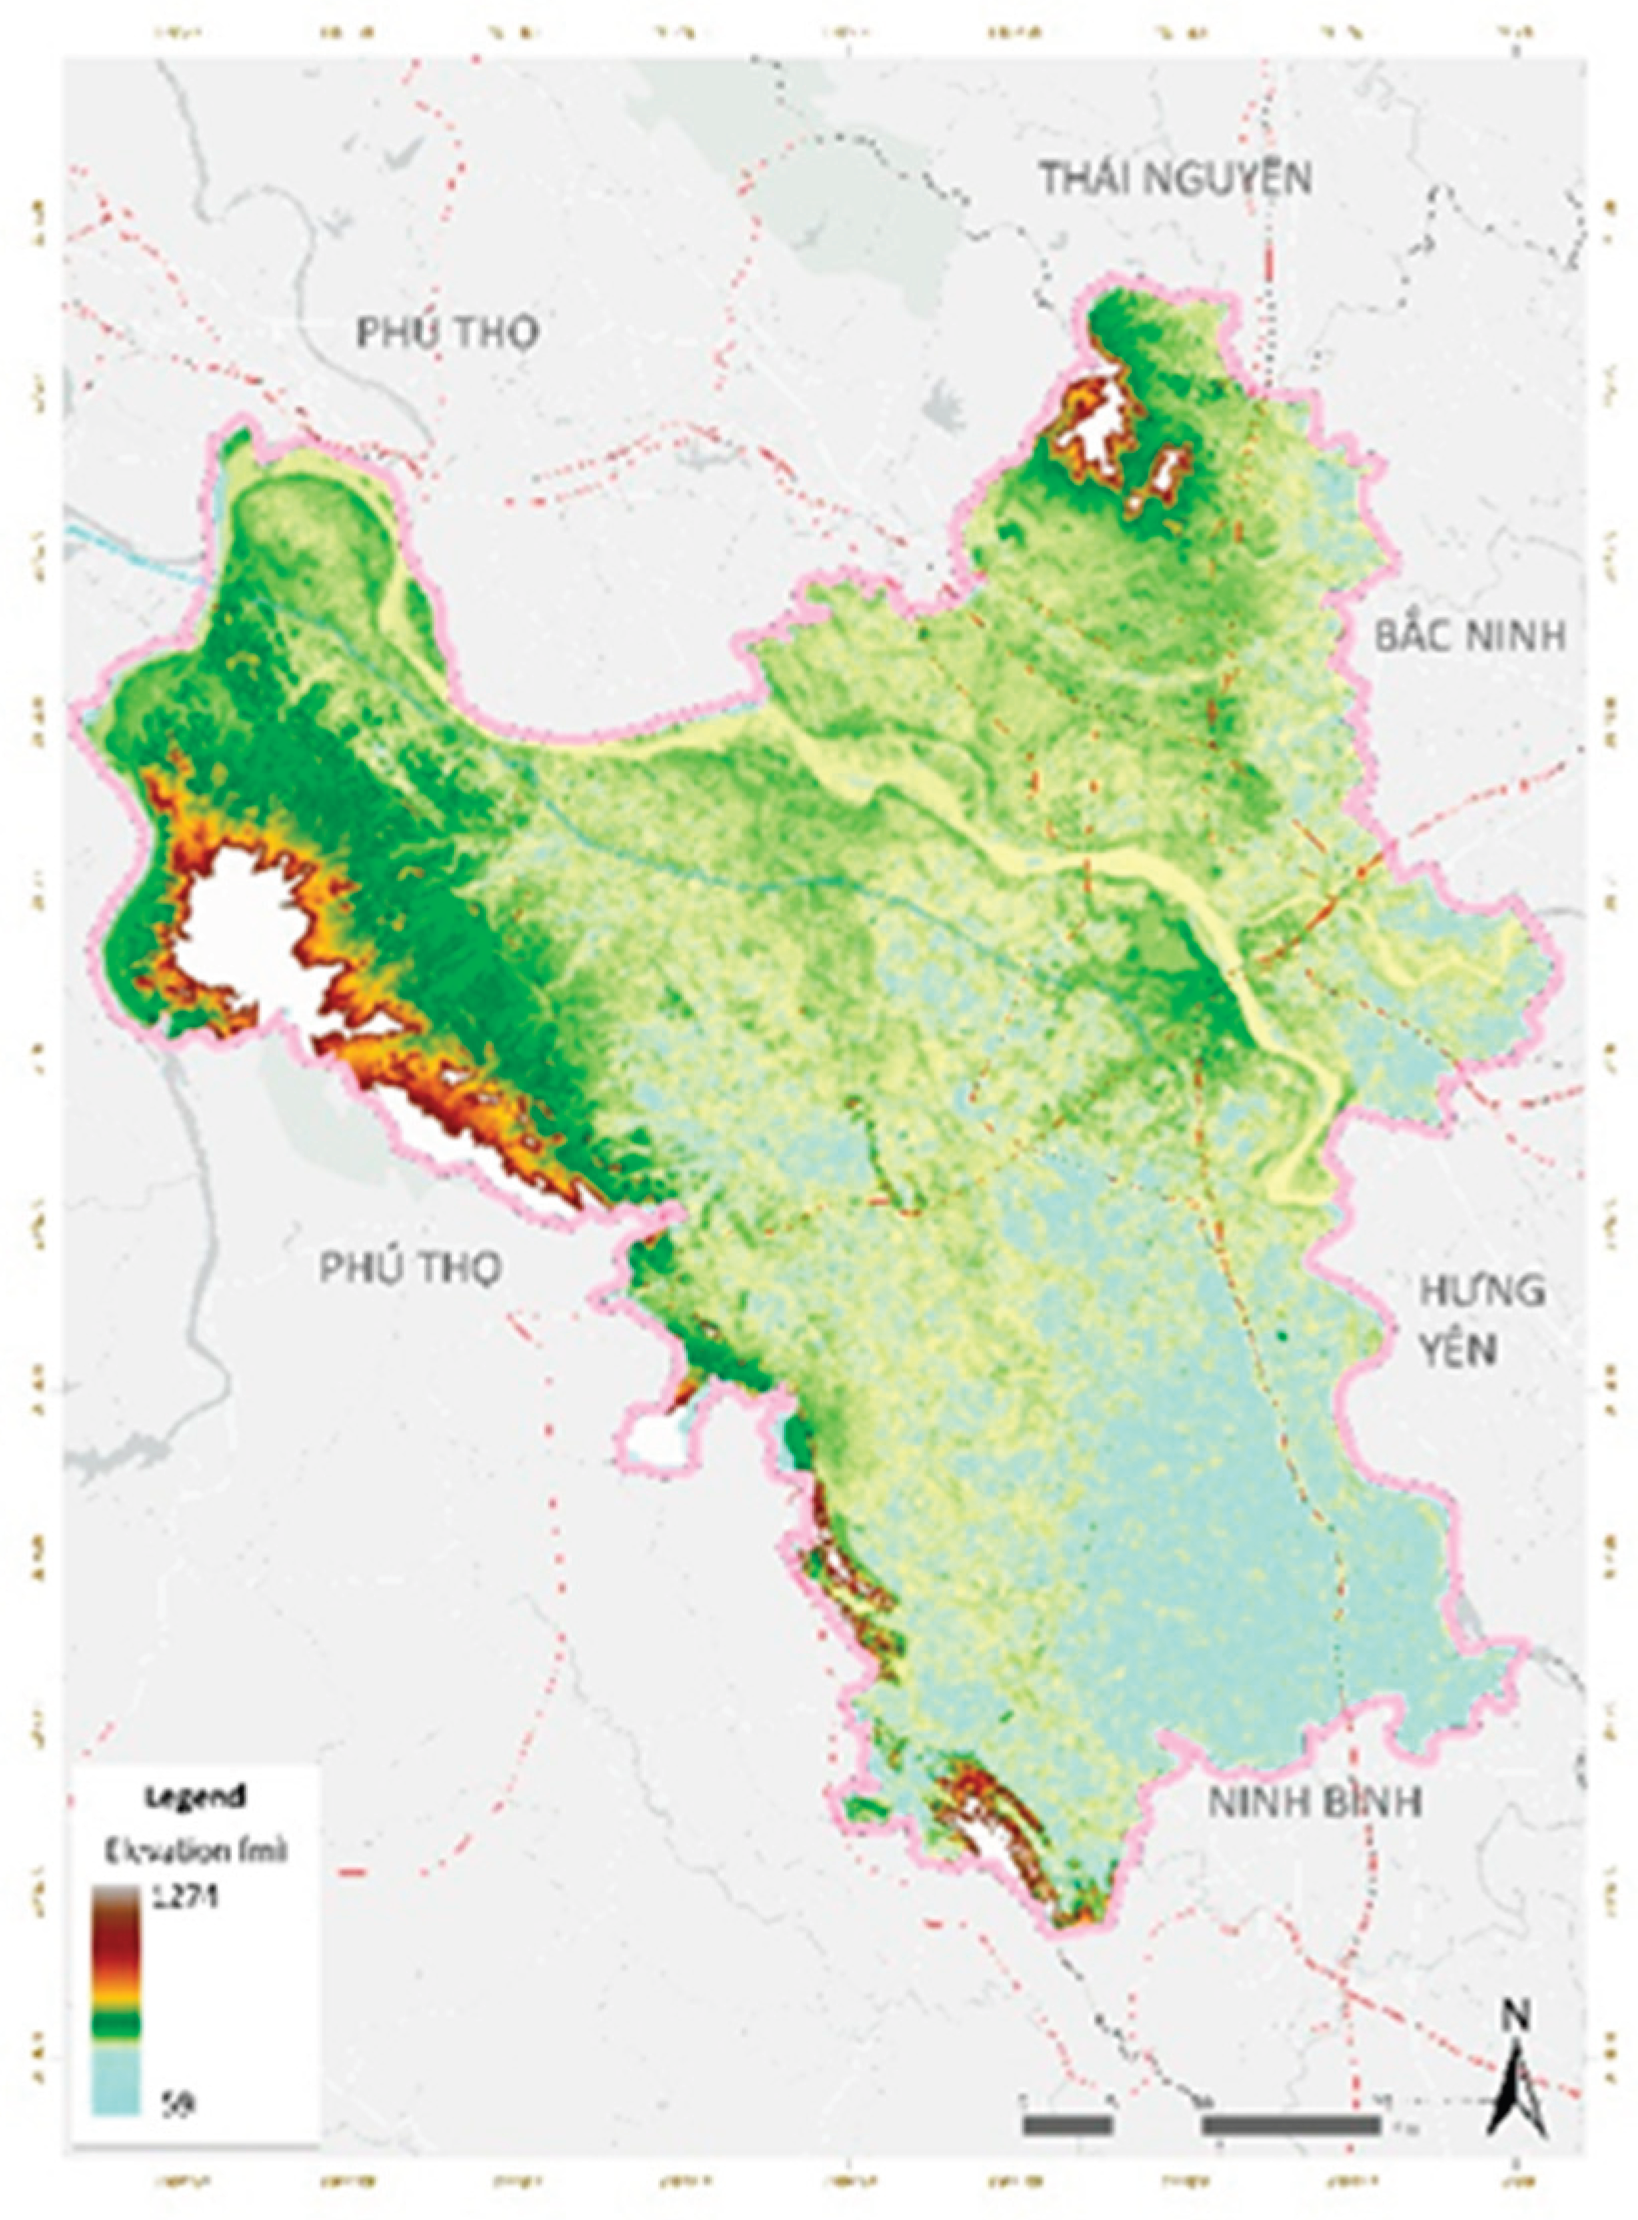
Figure 3.
Urbanization map of the study area in 2010 (a) and 2020 (b). High-resolution versions are available in the Supplementary Materials (Figures S4 and S5).
Figure 3.
Urbanization map of the study area in 2010 (a) and 2020 (b). High-resolution versions are available in the Supplementary Materials (Figures S4 and S5).
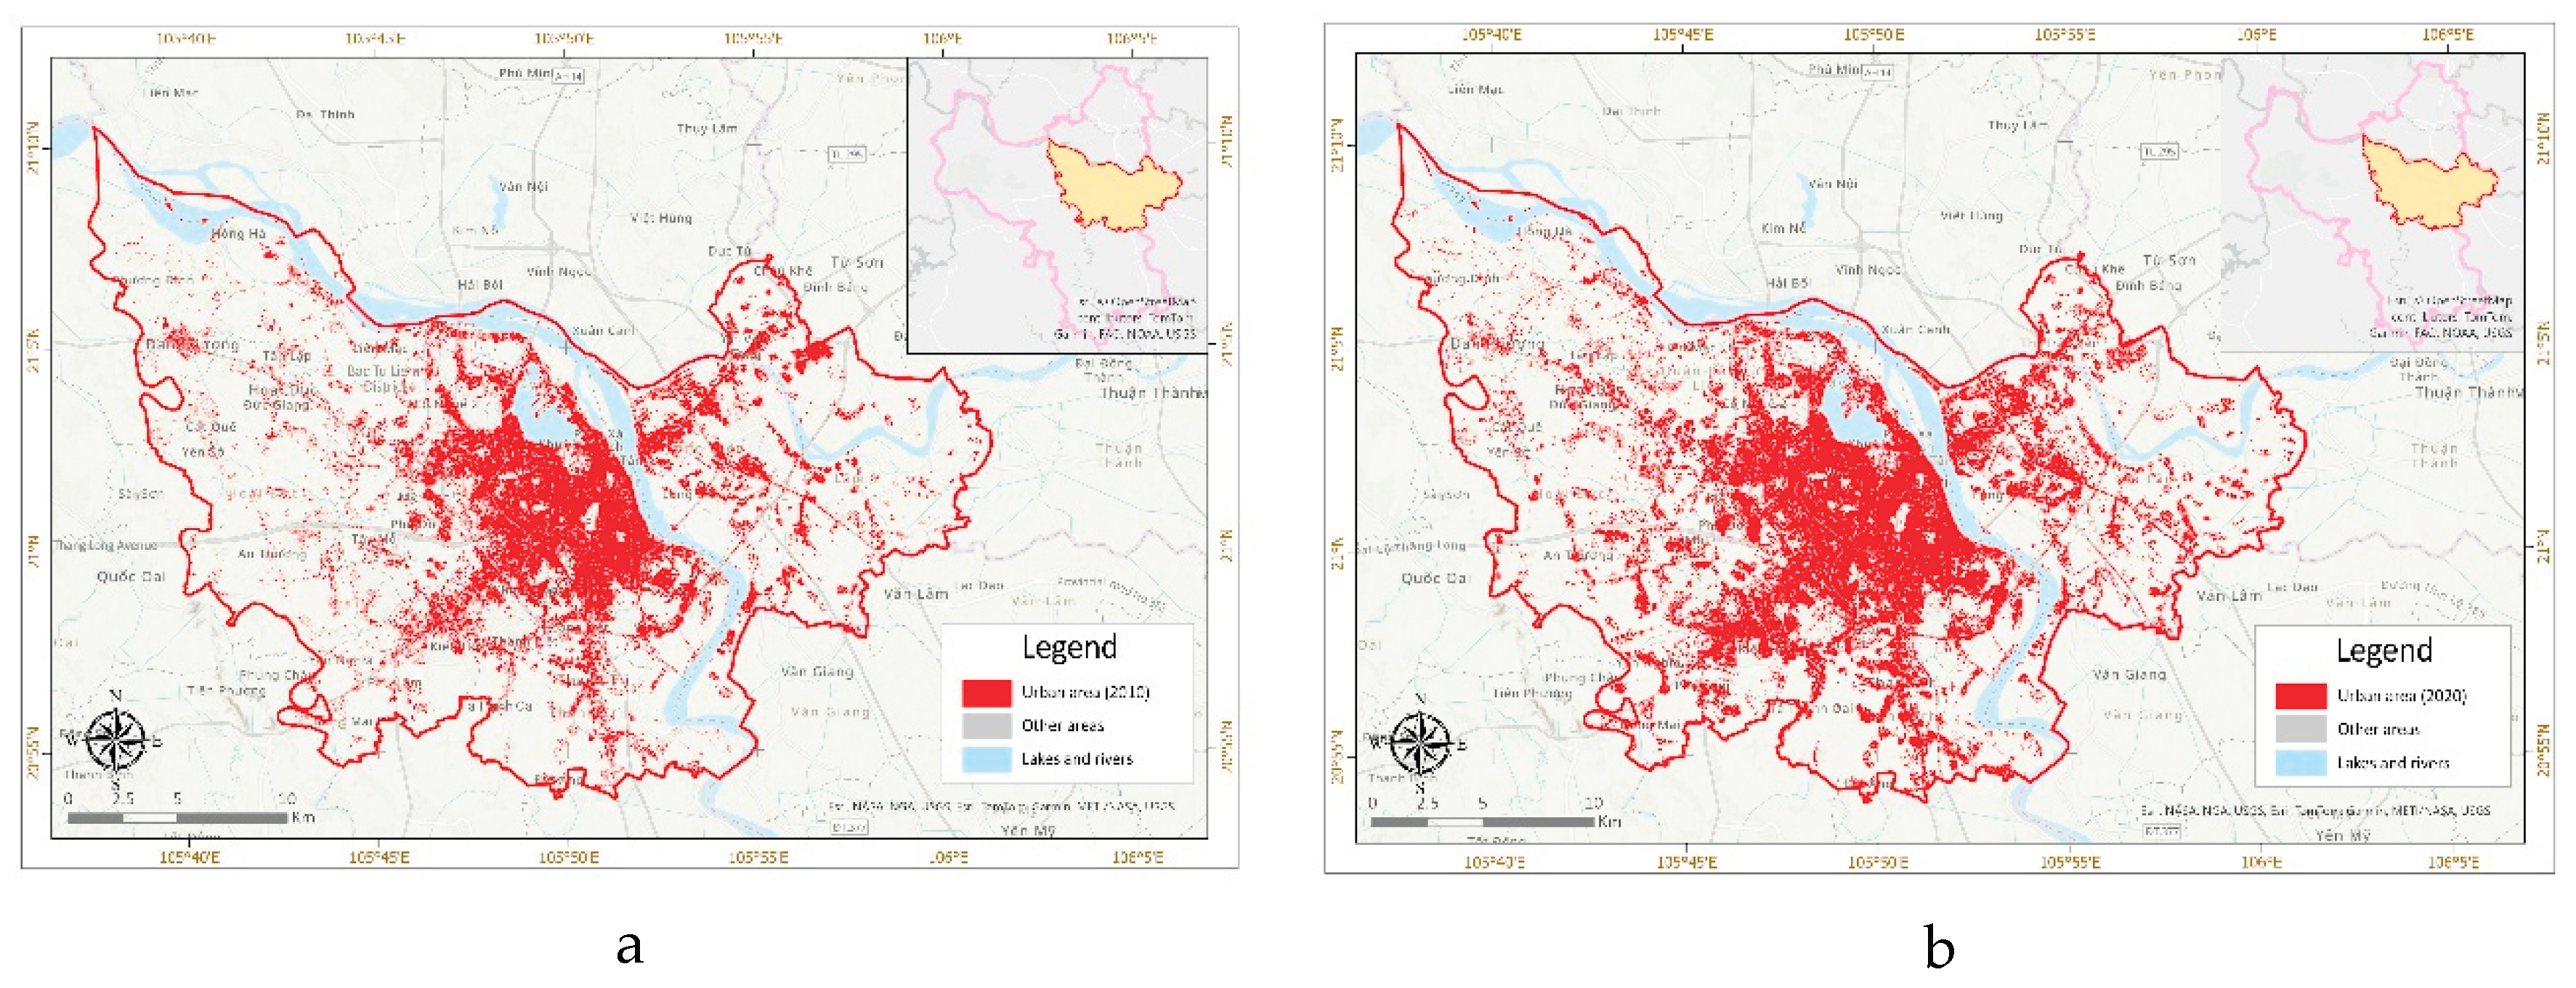
Figure 4.
DPSIR model diagram [67]. High-resolution version is available in the Supplementary Materials (Figure S6).
Figure 4.
DPSIR model diagram [67]. High-resolution version is available in the Supplementary Materials (Figure S6).
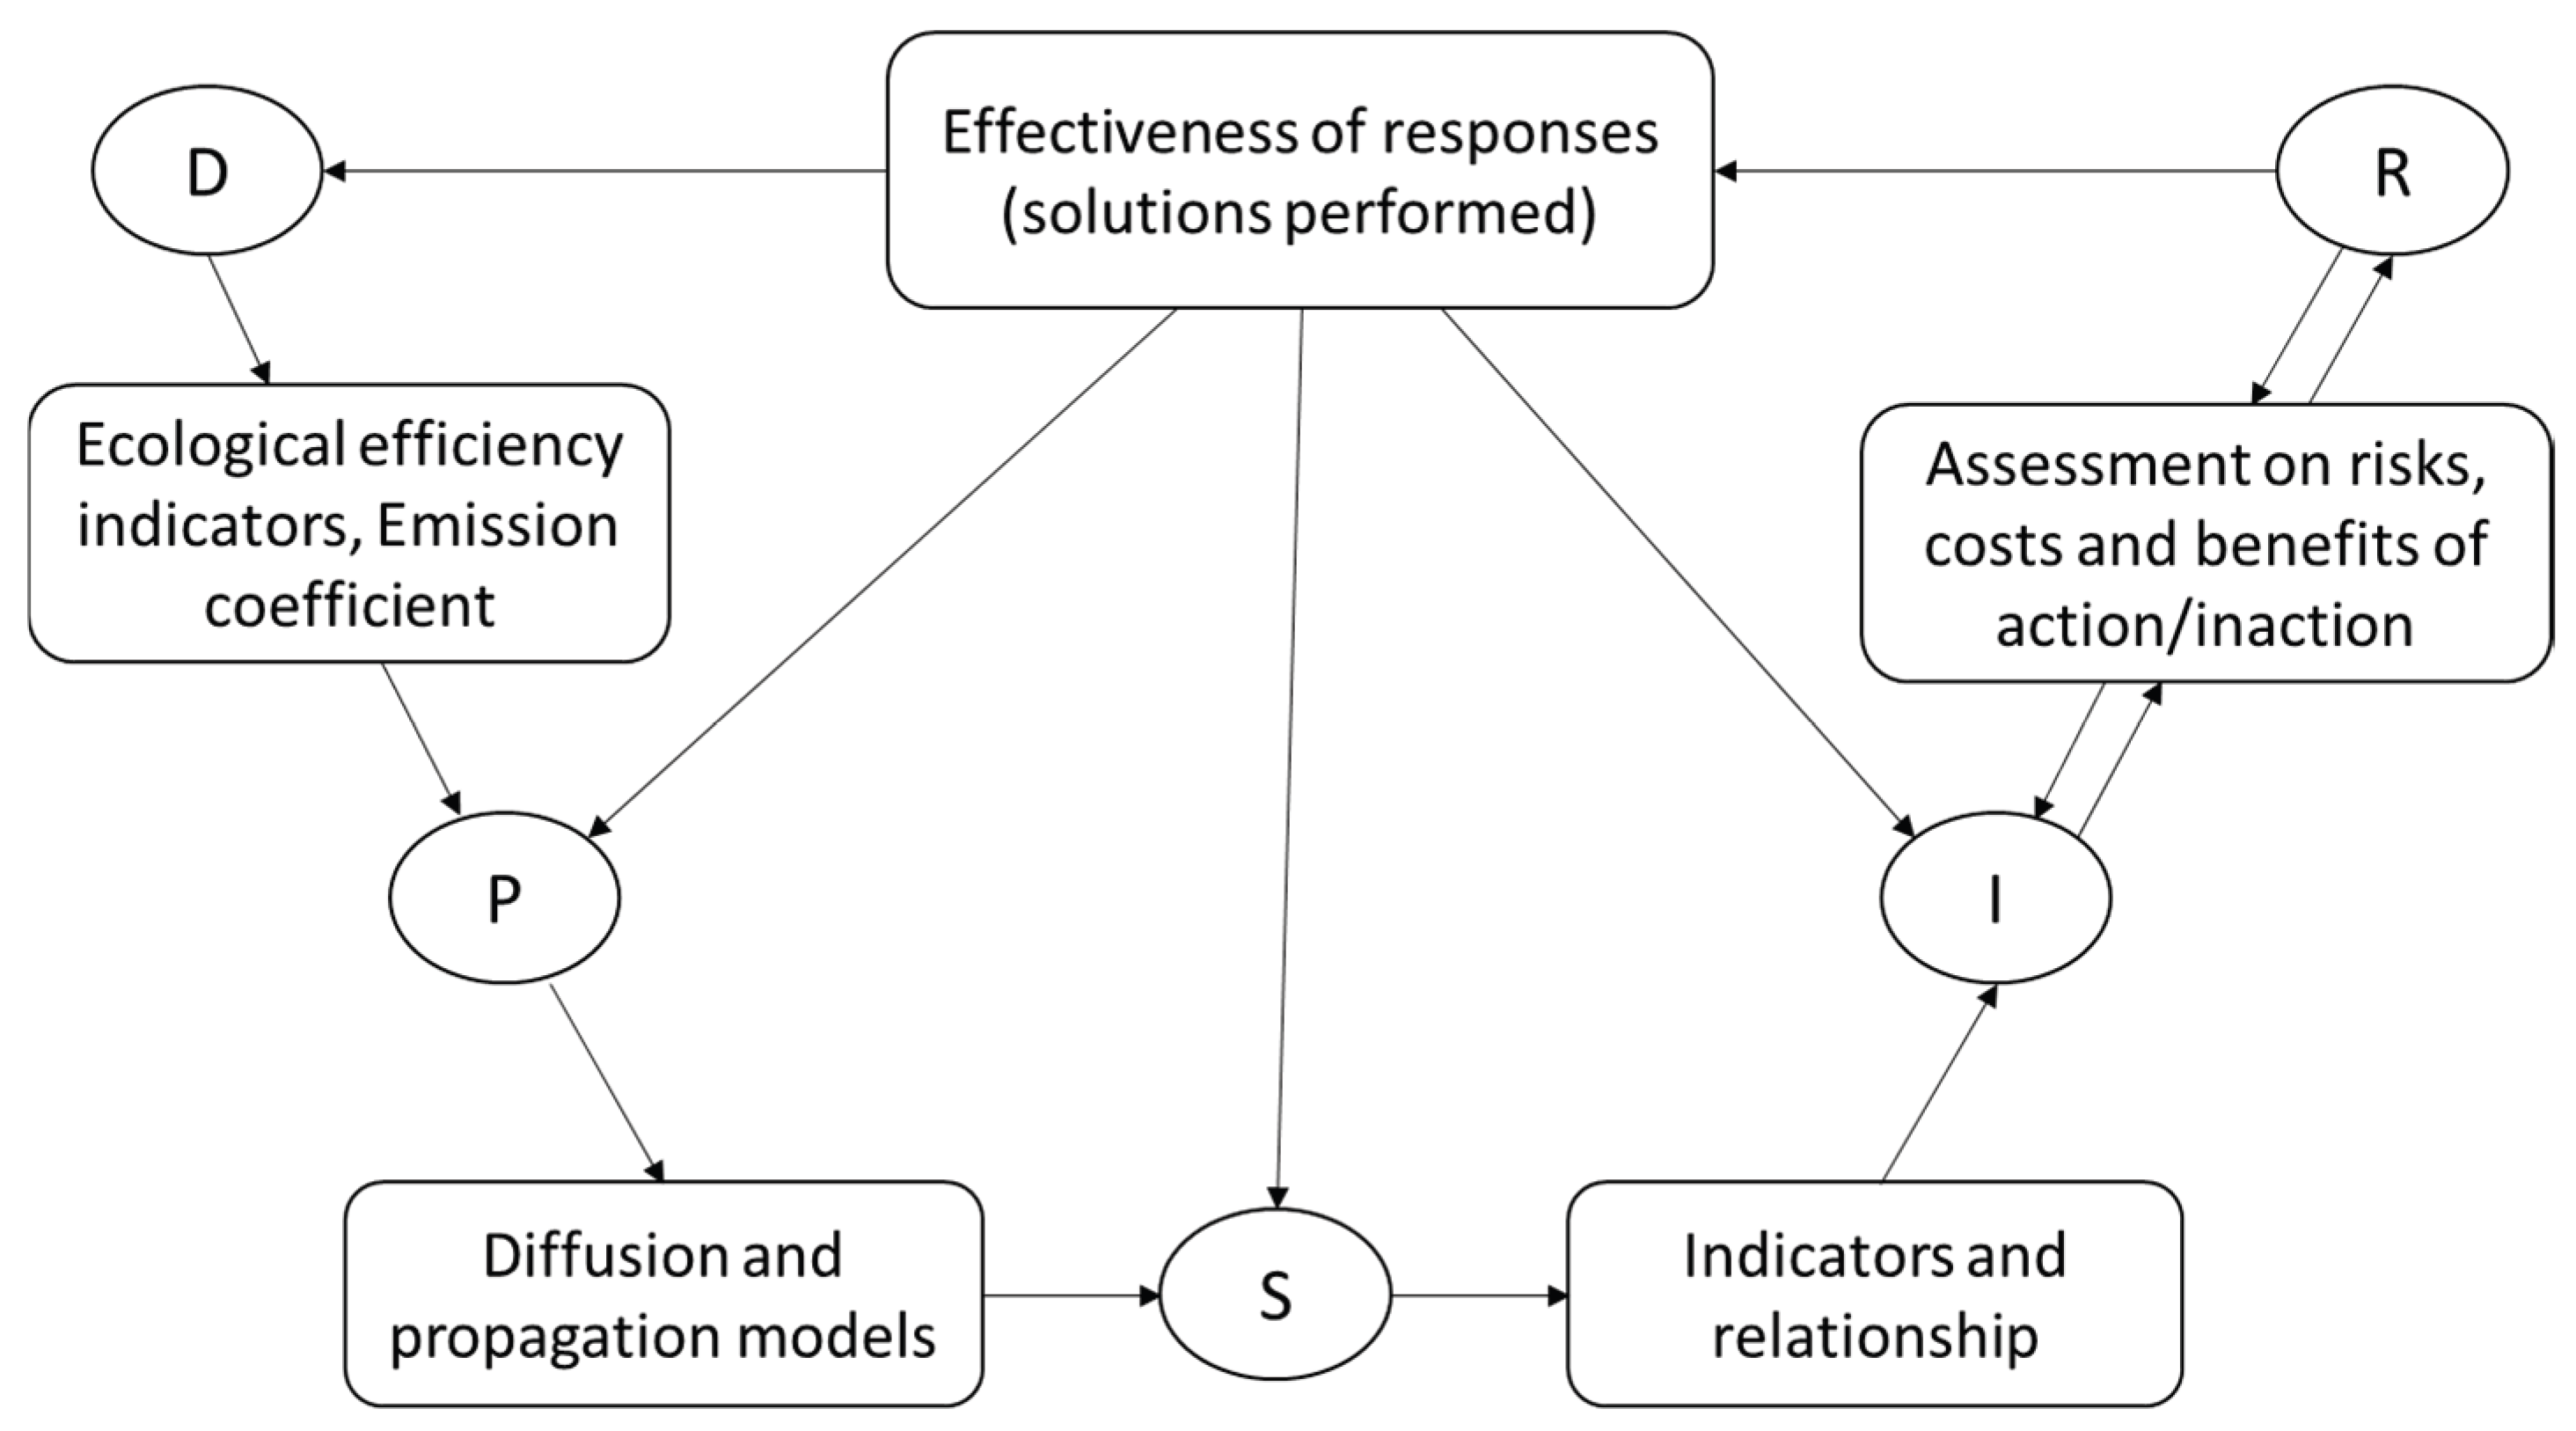
Figure 5.
Research flow. High-resolution version is available in the Supplementary Materials (Figure S7).
Figure 5.
Research flow. High-resolution version is available in the Supplementary Materials (Figure S7).
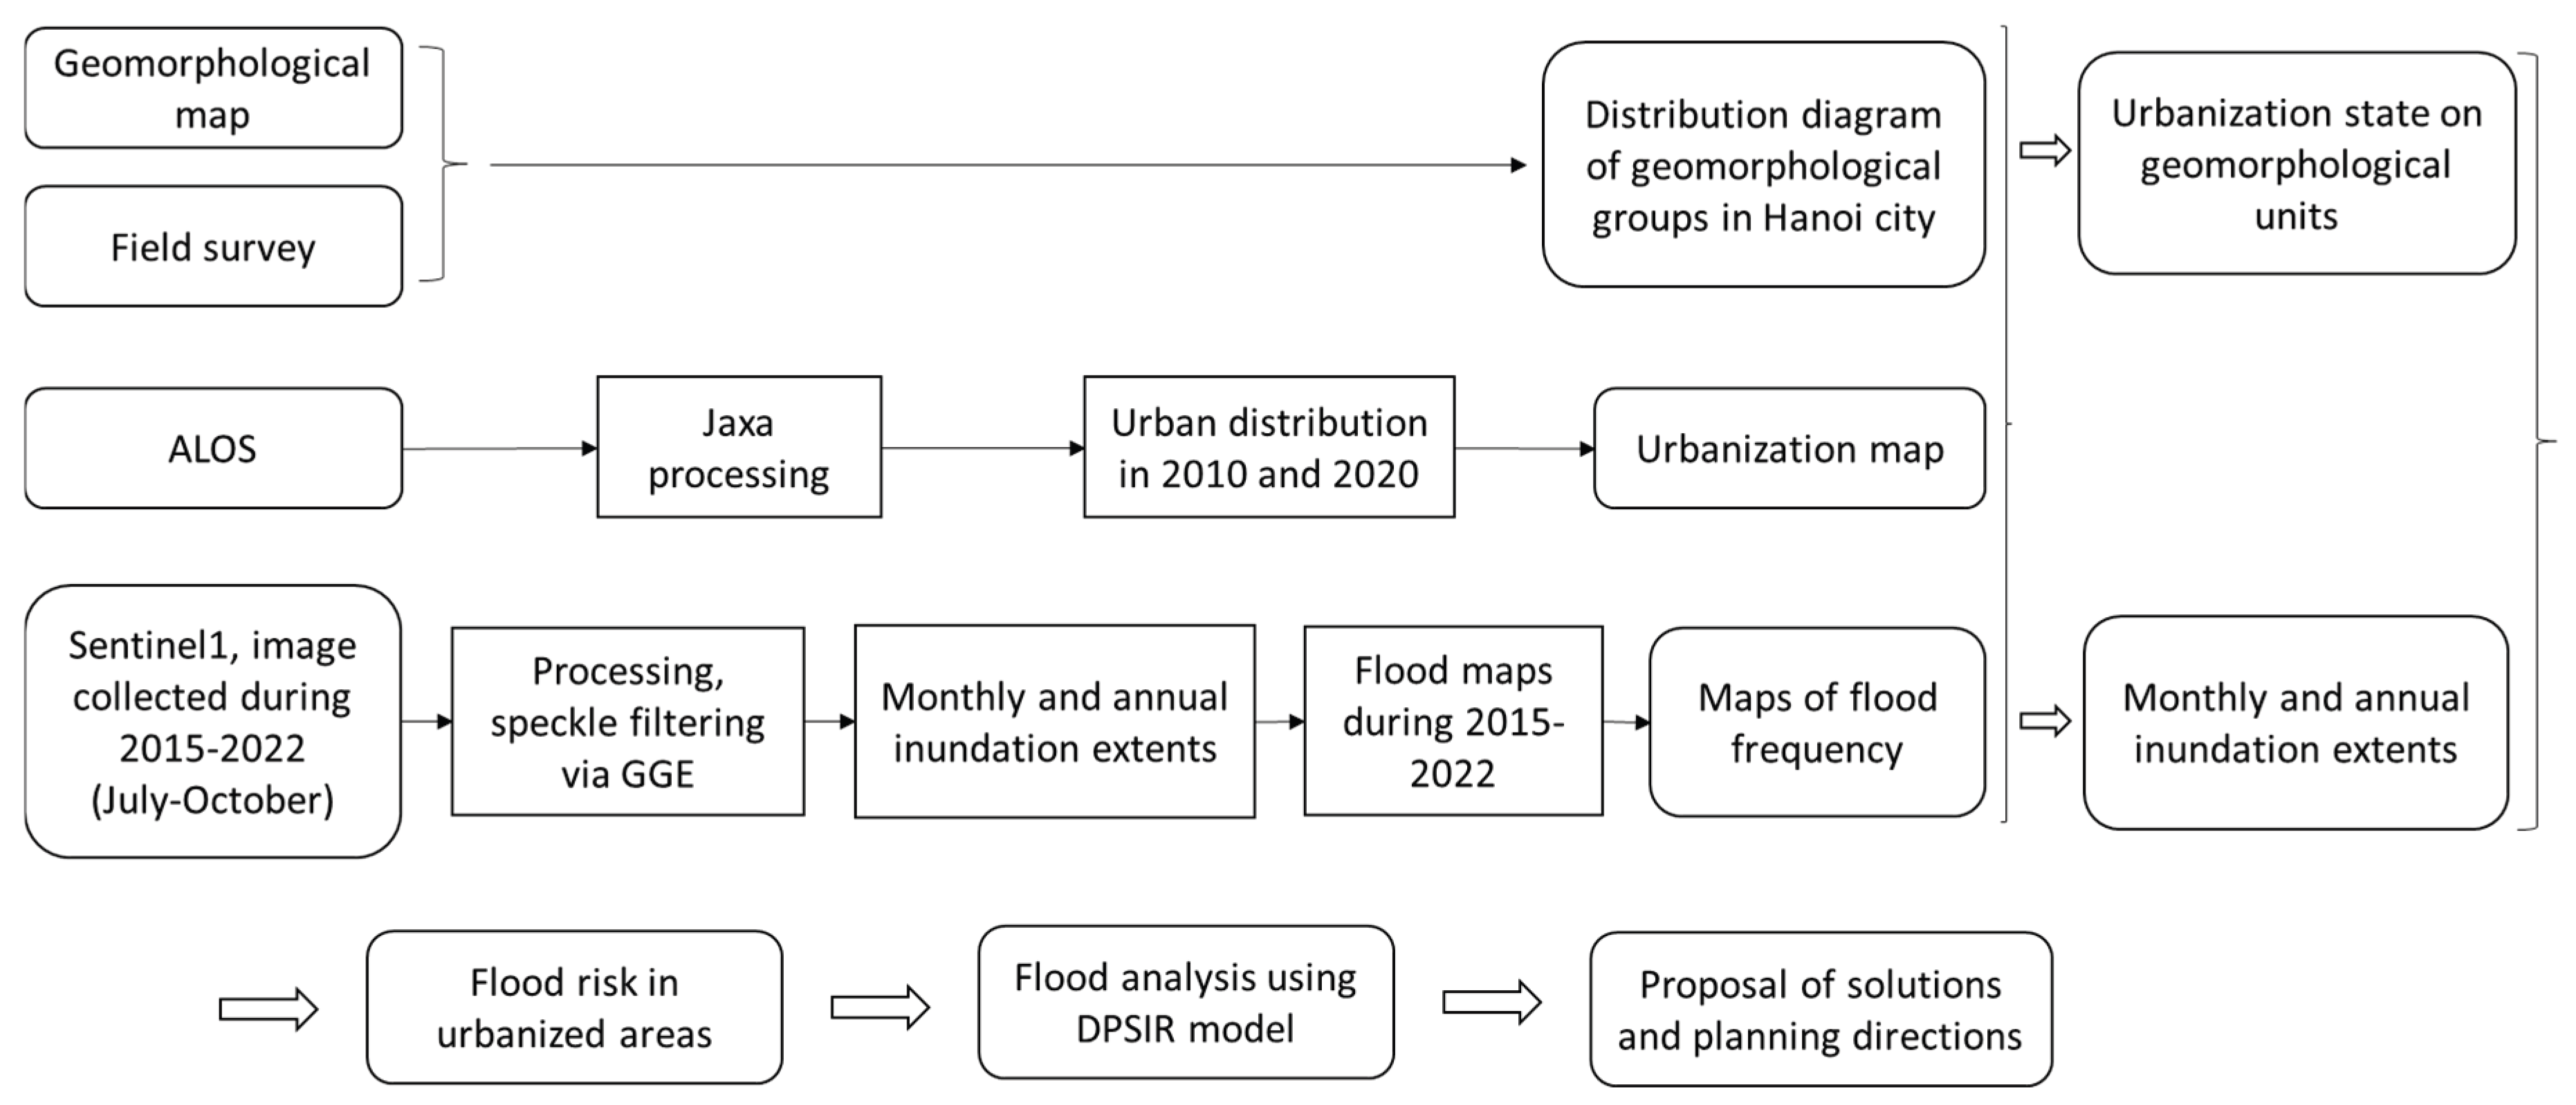
Figure 6.
Flood frequency map of Hanoi (2015 – 2024). High-resolution version is available in the Supplementary Materials (Figure S8).
Figure 6.
Flood frequency map of Hanoi (2015 – 2024). High-resolution version is available in the Supplementary Materials (Figure S8).
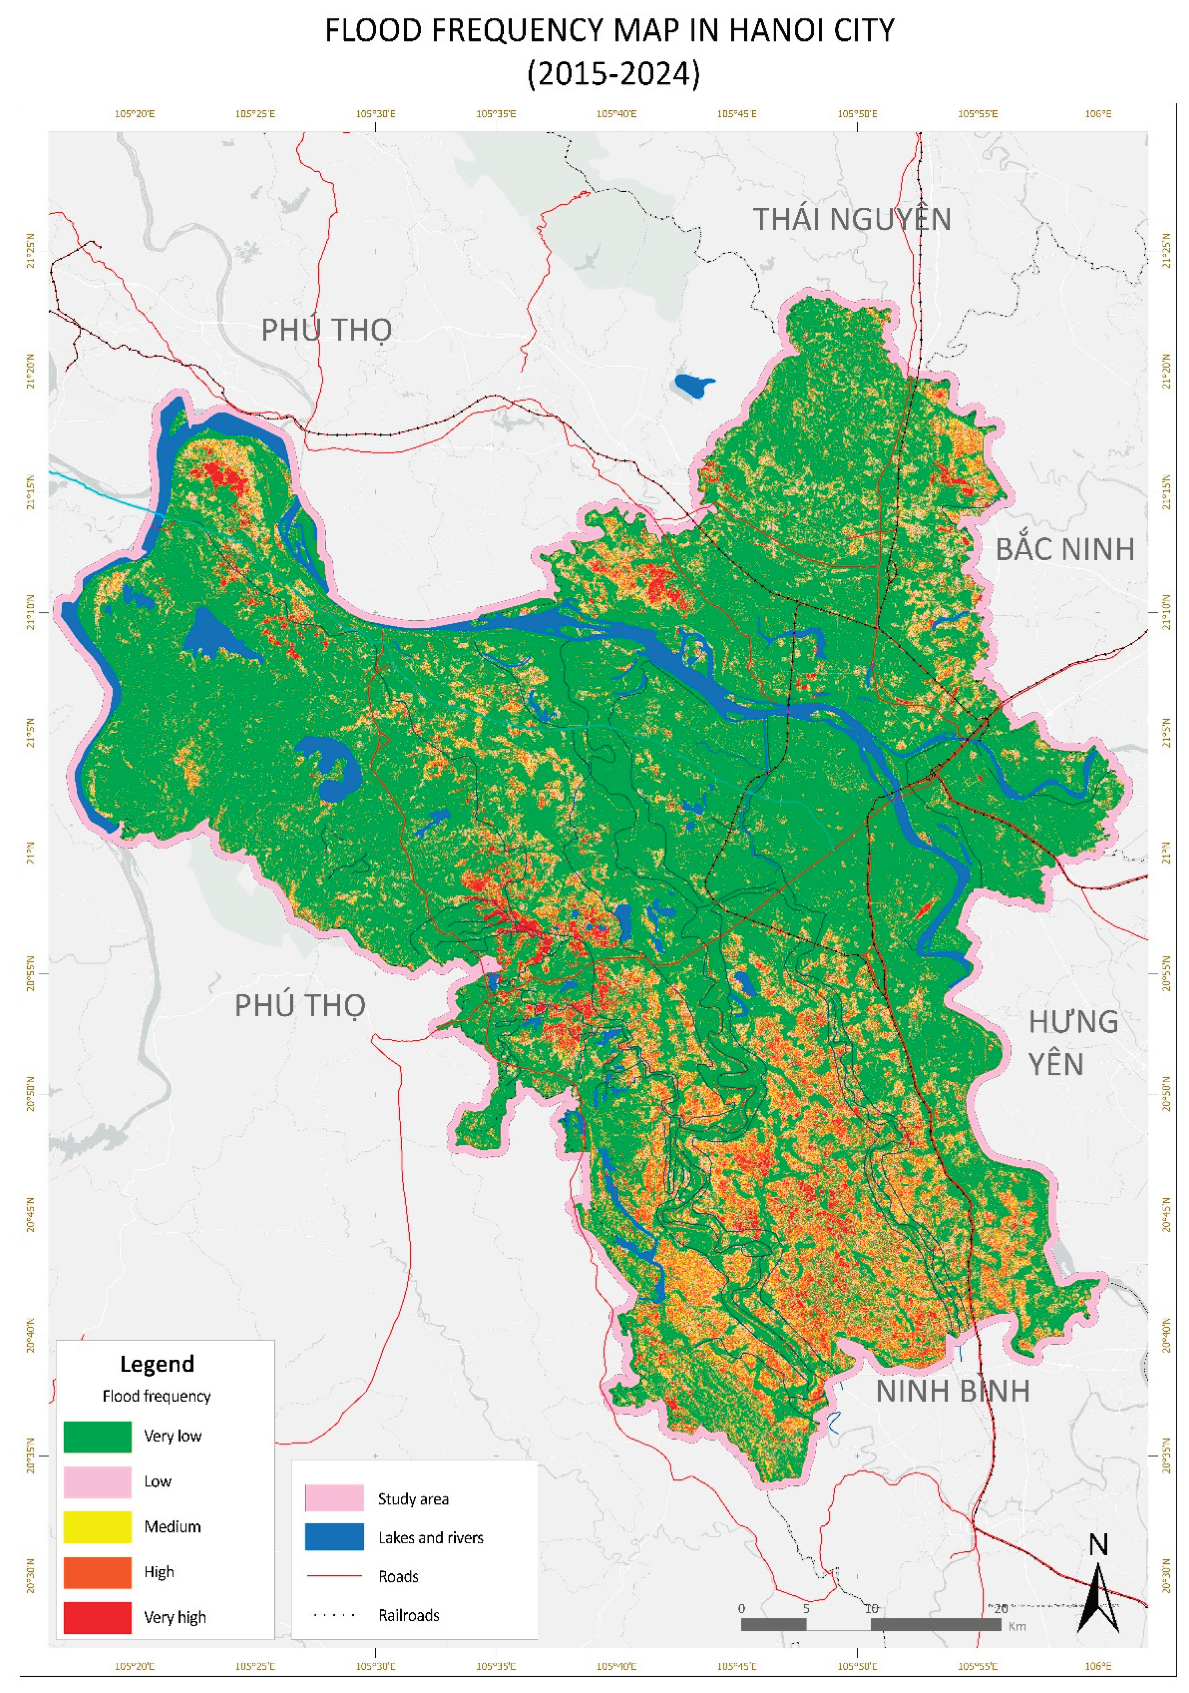
Figure 7.
Urbanization map of Hanoi city (2010 – 2020). High-resolution version is available in the Supplementary Materials (Figure S9).
Figure 7.
Urbanization map of Hanoi city (2010 – 2020). High-resolution version is available in the Supplementary Materials (Figure S9).
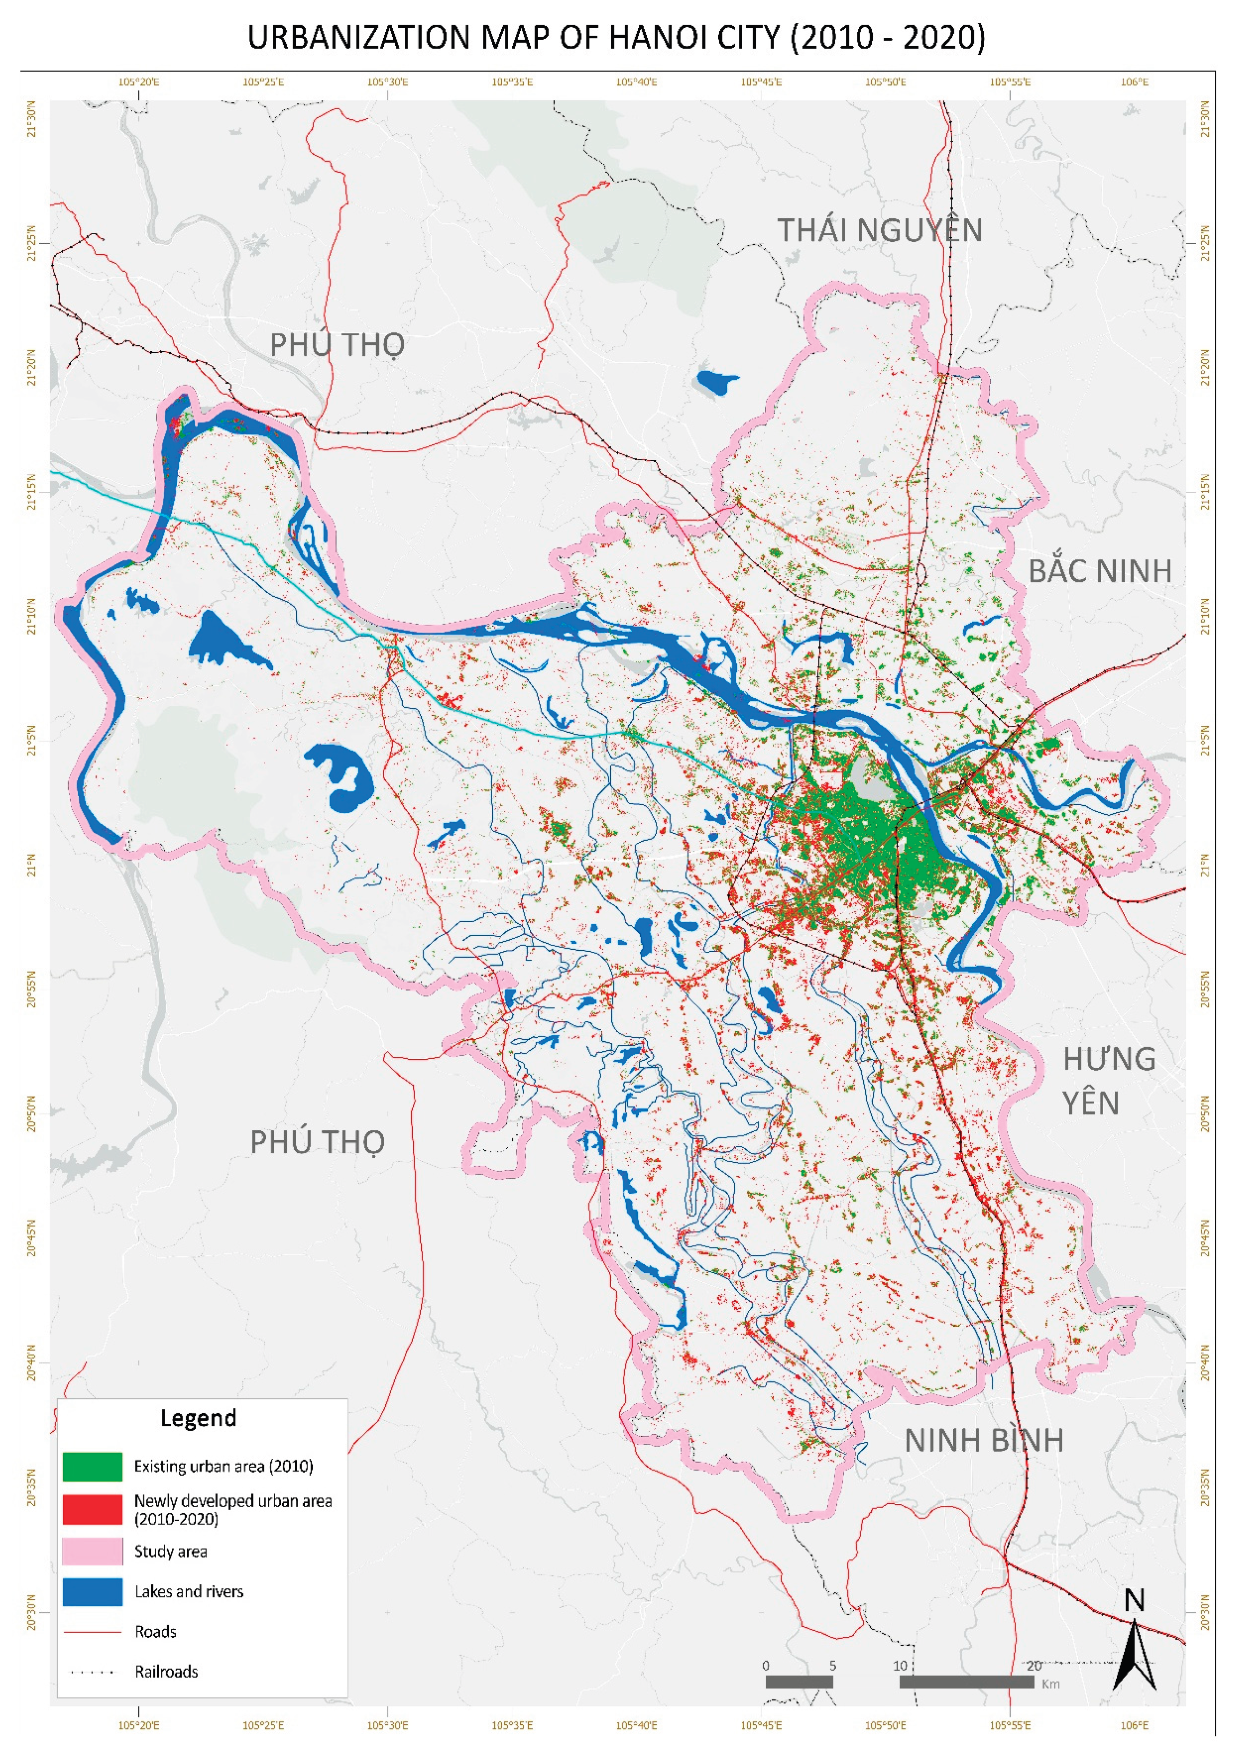
Figure 8.
Distribution of urbanization areas by geomorphological units in Hanoi. High-resolution version is available in the Supplementary Materials (Figure S10).
Figure 8.
Distribution of urbanization areas by geomorphological units in Hanoi. High-resolution version is available in the Supplementary Materials (Figure S10).
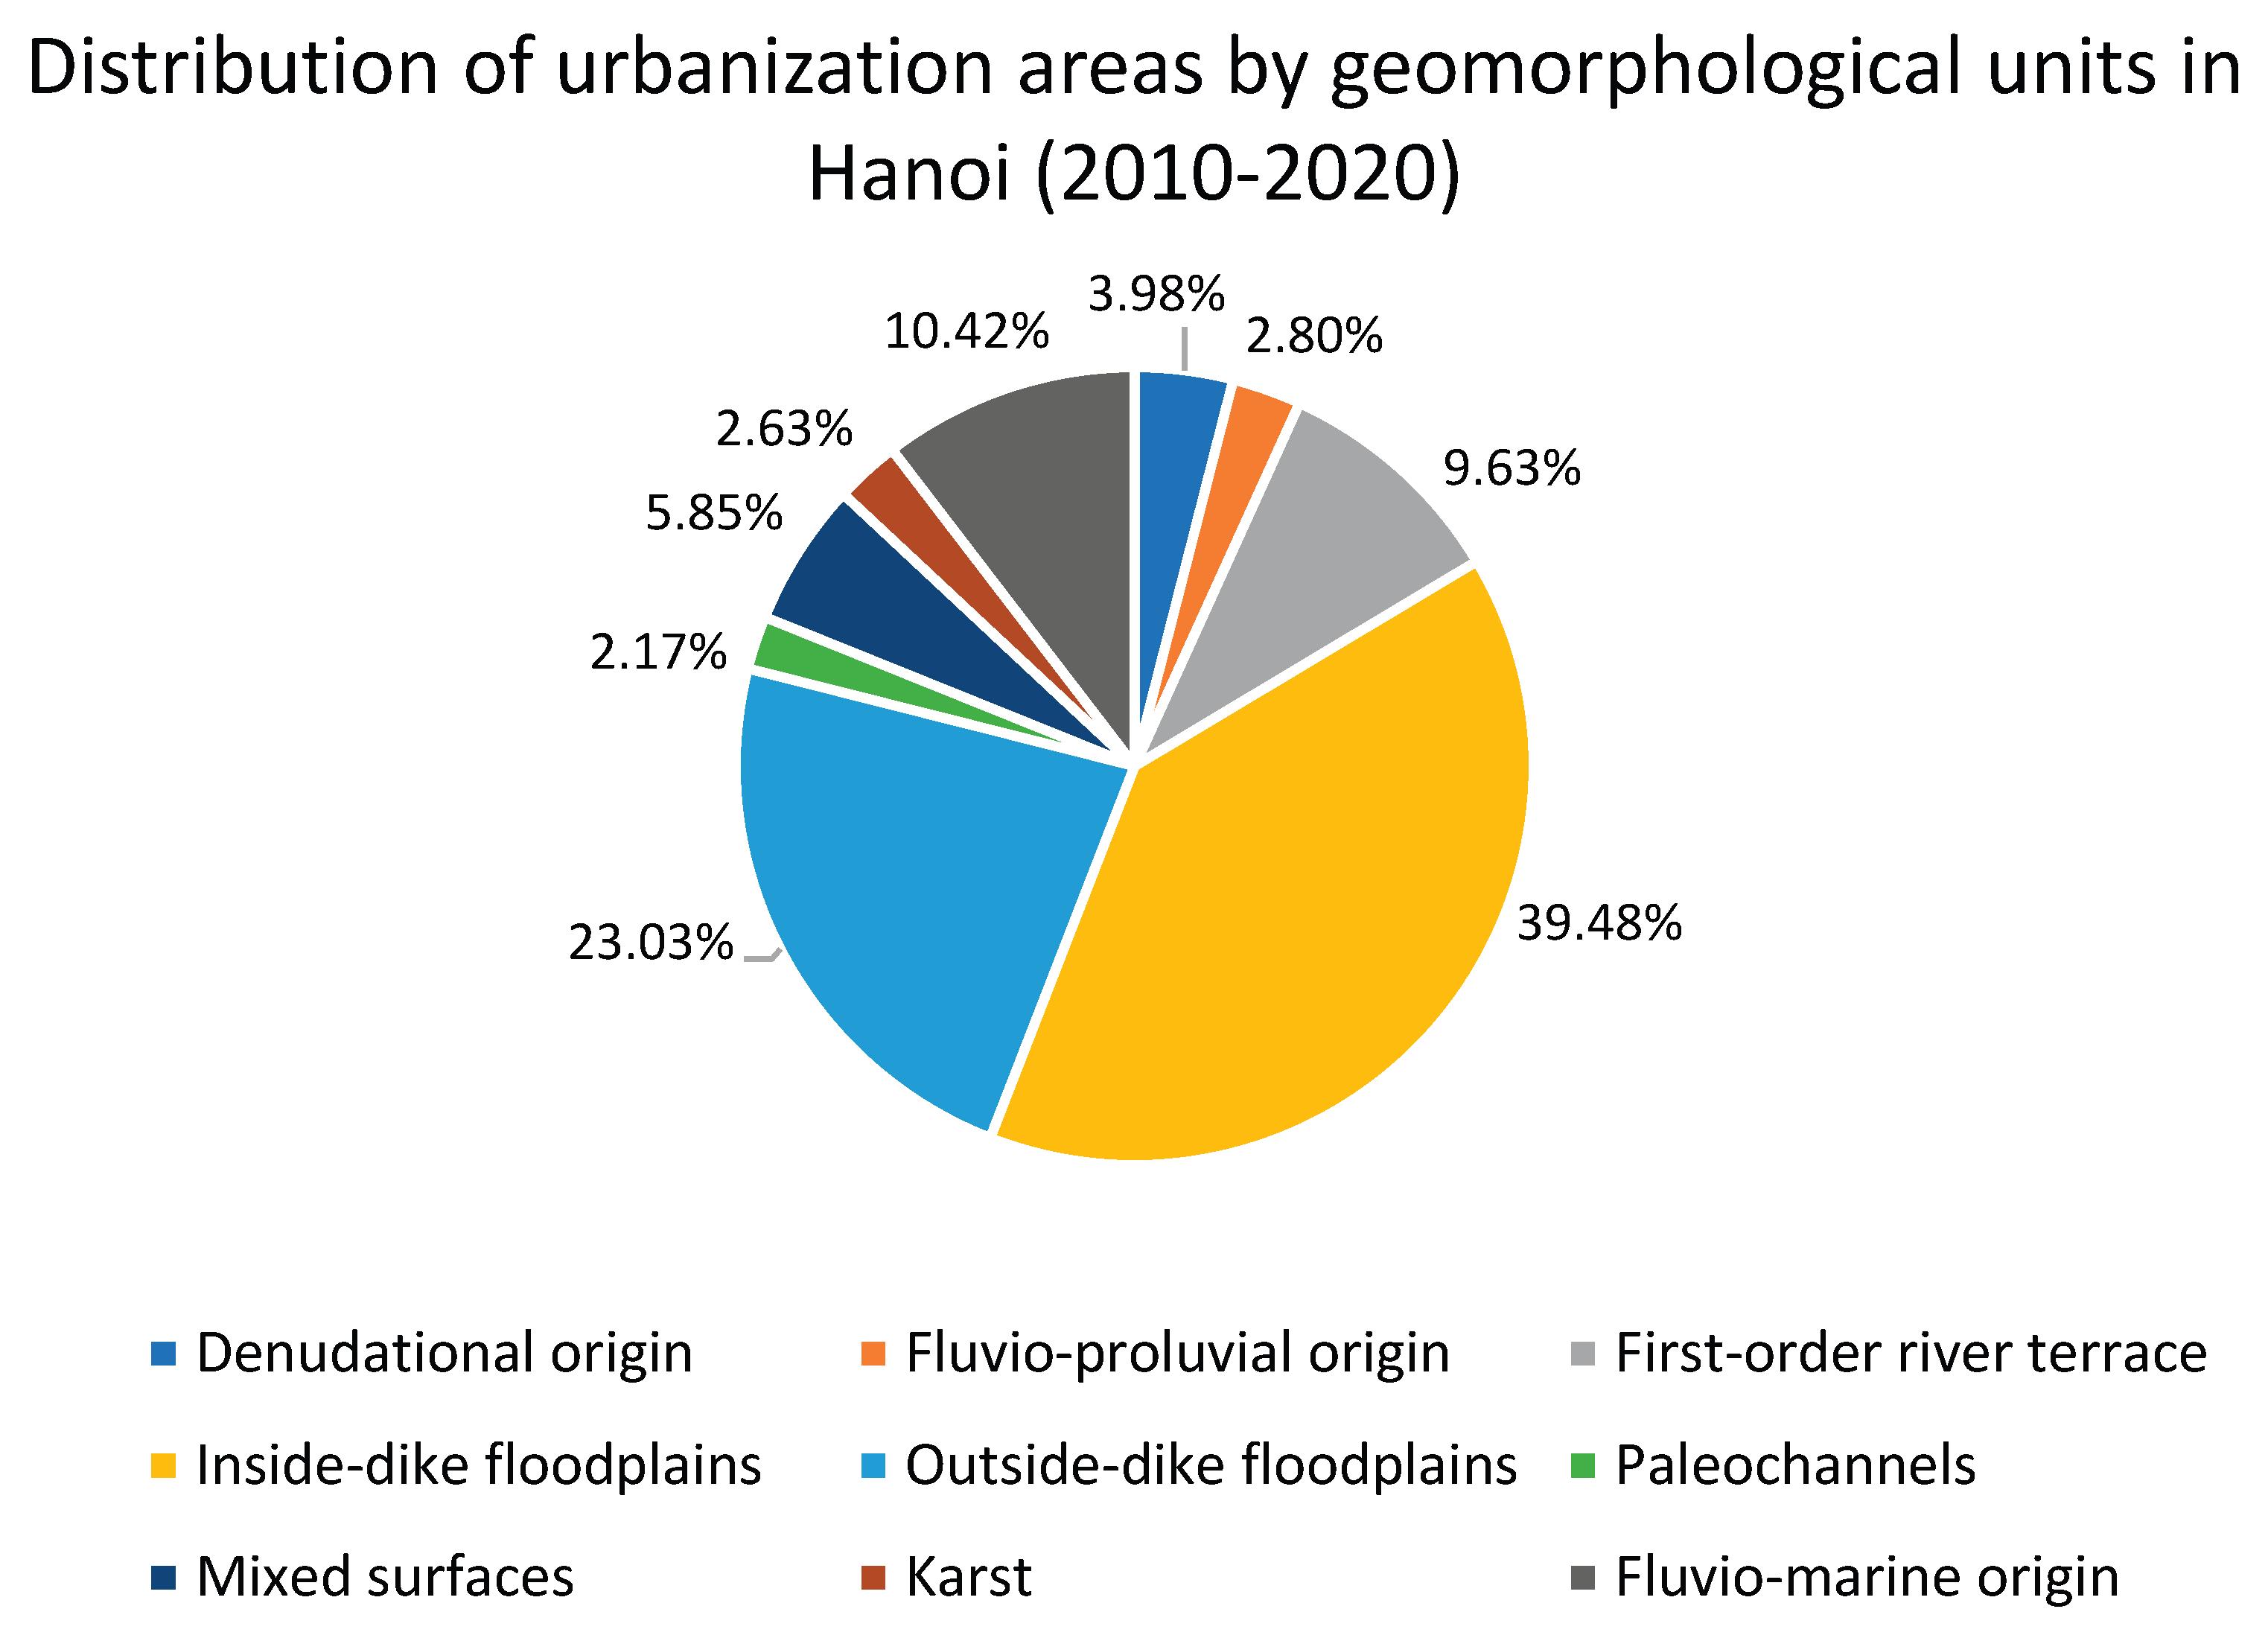
Figure 9.
Map of urbanization trend on geomorphological units in Hanoi city. High-resolution version is available in the Supplementary Materials (Figure S12).
Figure 9.
Map of urbanization trend on geomorphological units in Hanoi city. High-resolution version is available in the Supplementary Materials (Figure S12).
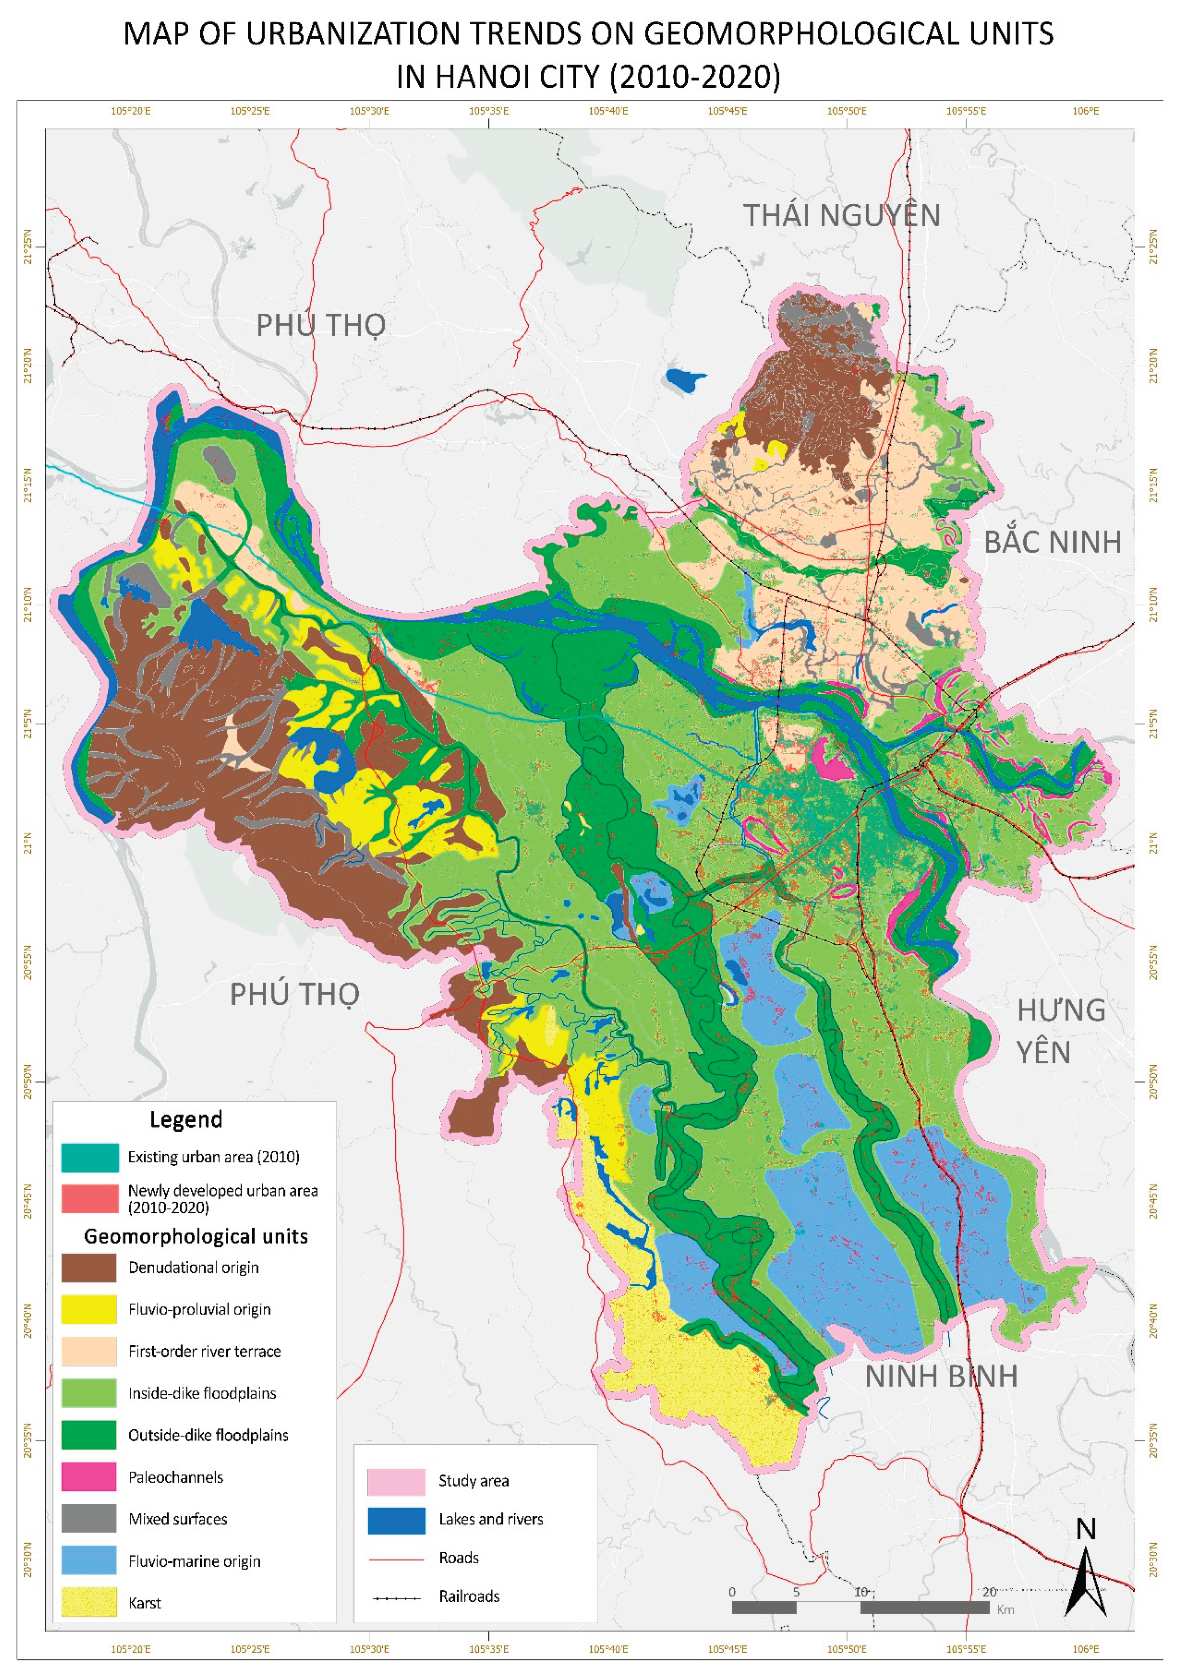
Figure 10.
Map of inundation distribution on geomorphological units in Hanoi city. High-resolution version is available in the Supplementary Materials (Figure S13).
Figure 10.
Map of inundation distribution on geomorphological units in Hanoi city. High-resolution version is available in the Supplementary Materials (Figure S13).
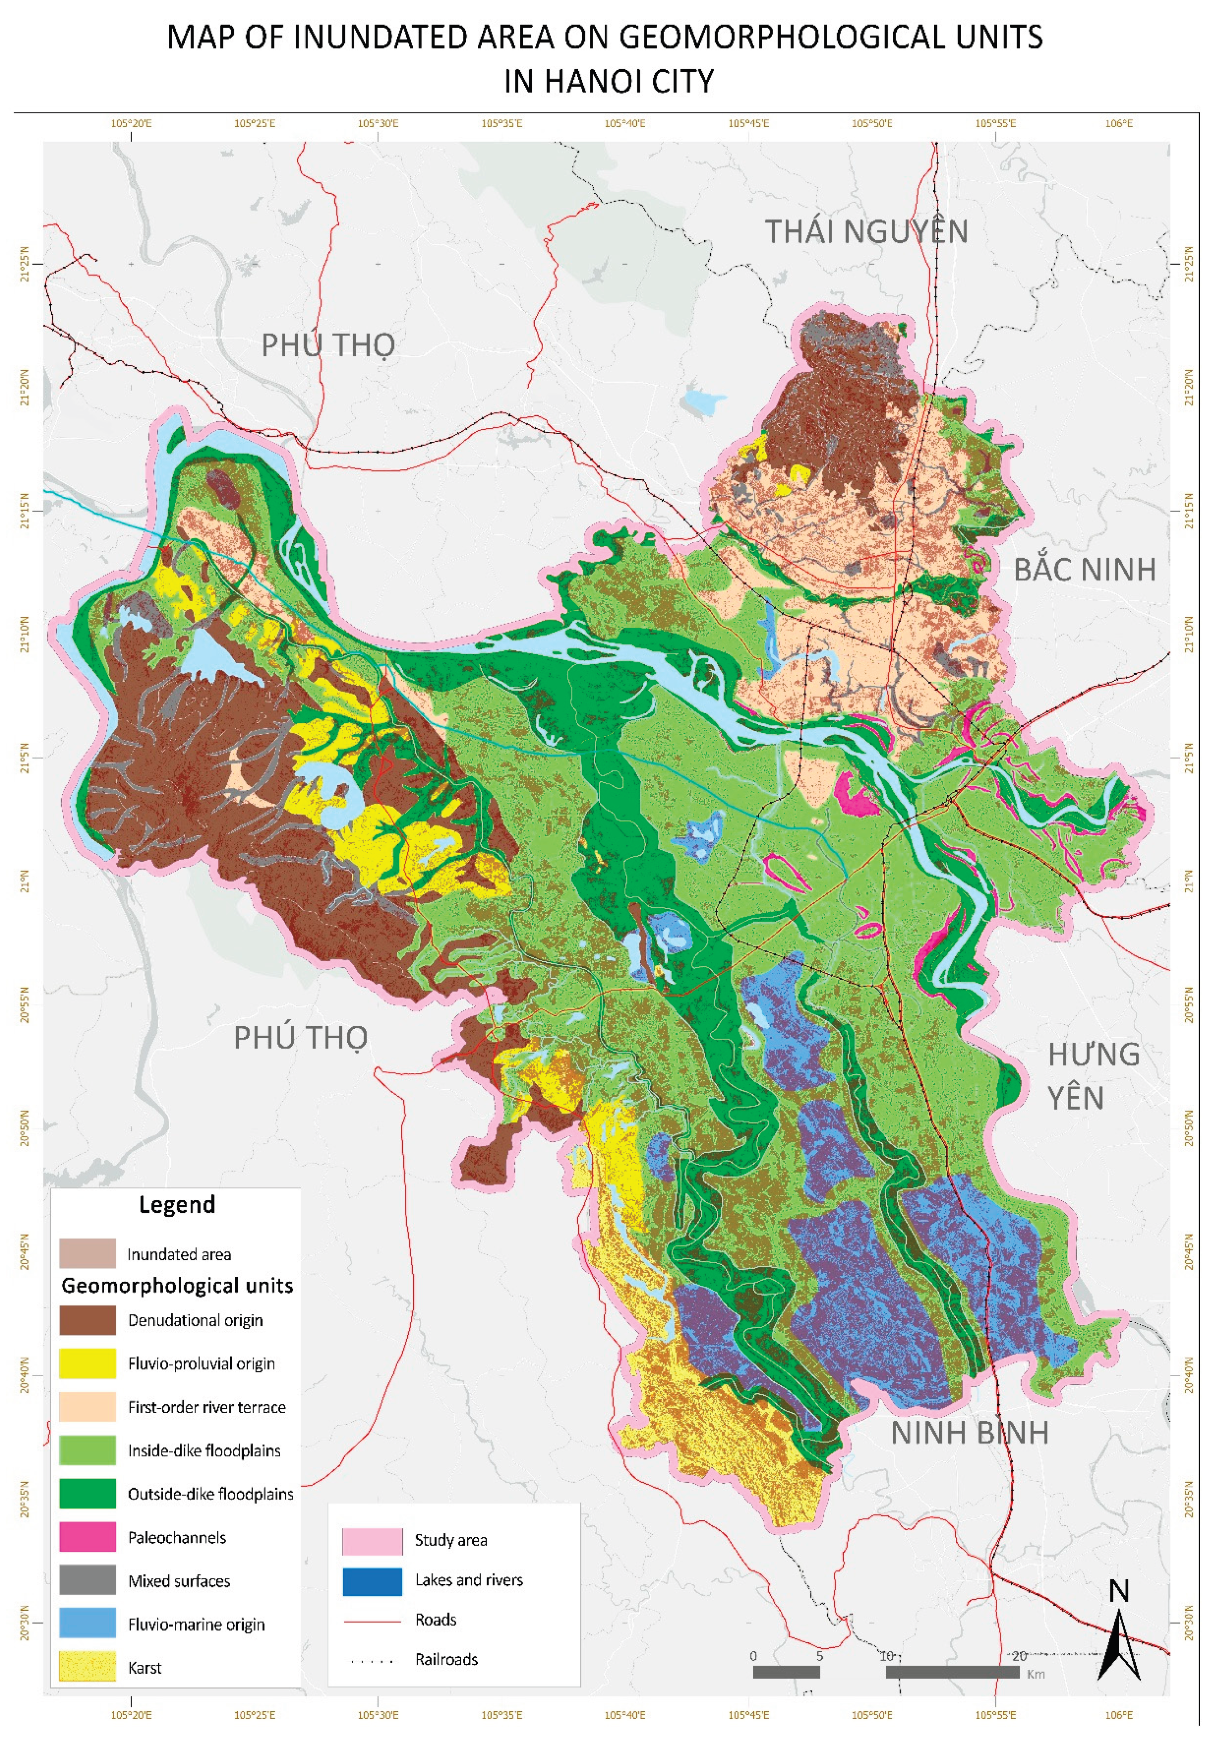
Figure 11.
Flood map of urban areas in Hanoi. High-resolution version is available in the Supplementary Materials (Figure S14).
Figure 11.
Flood map of urban areas in Hanoi. High-resolution version is available in the Supplementary Materials (Figure S14).
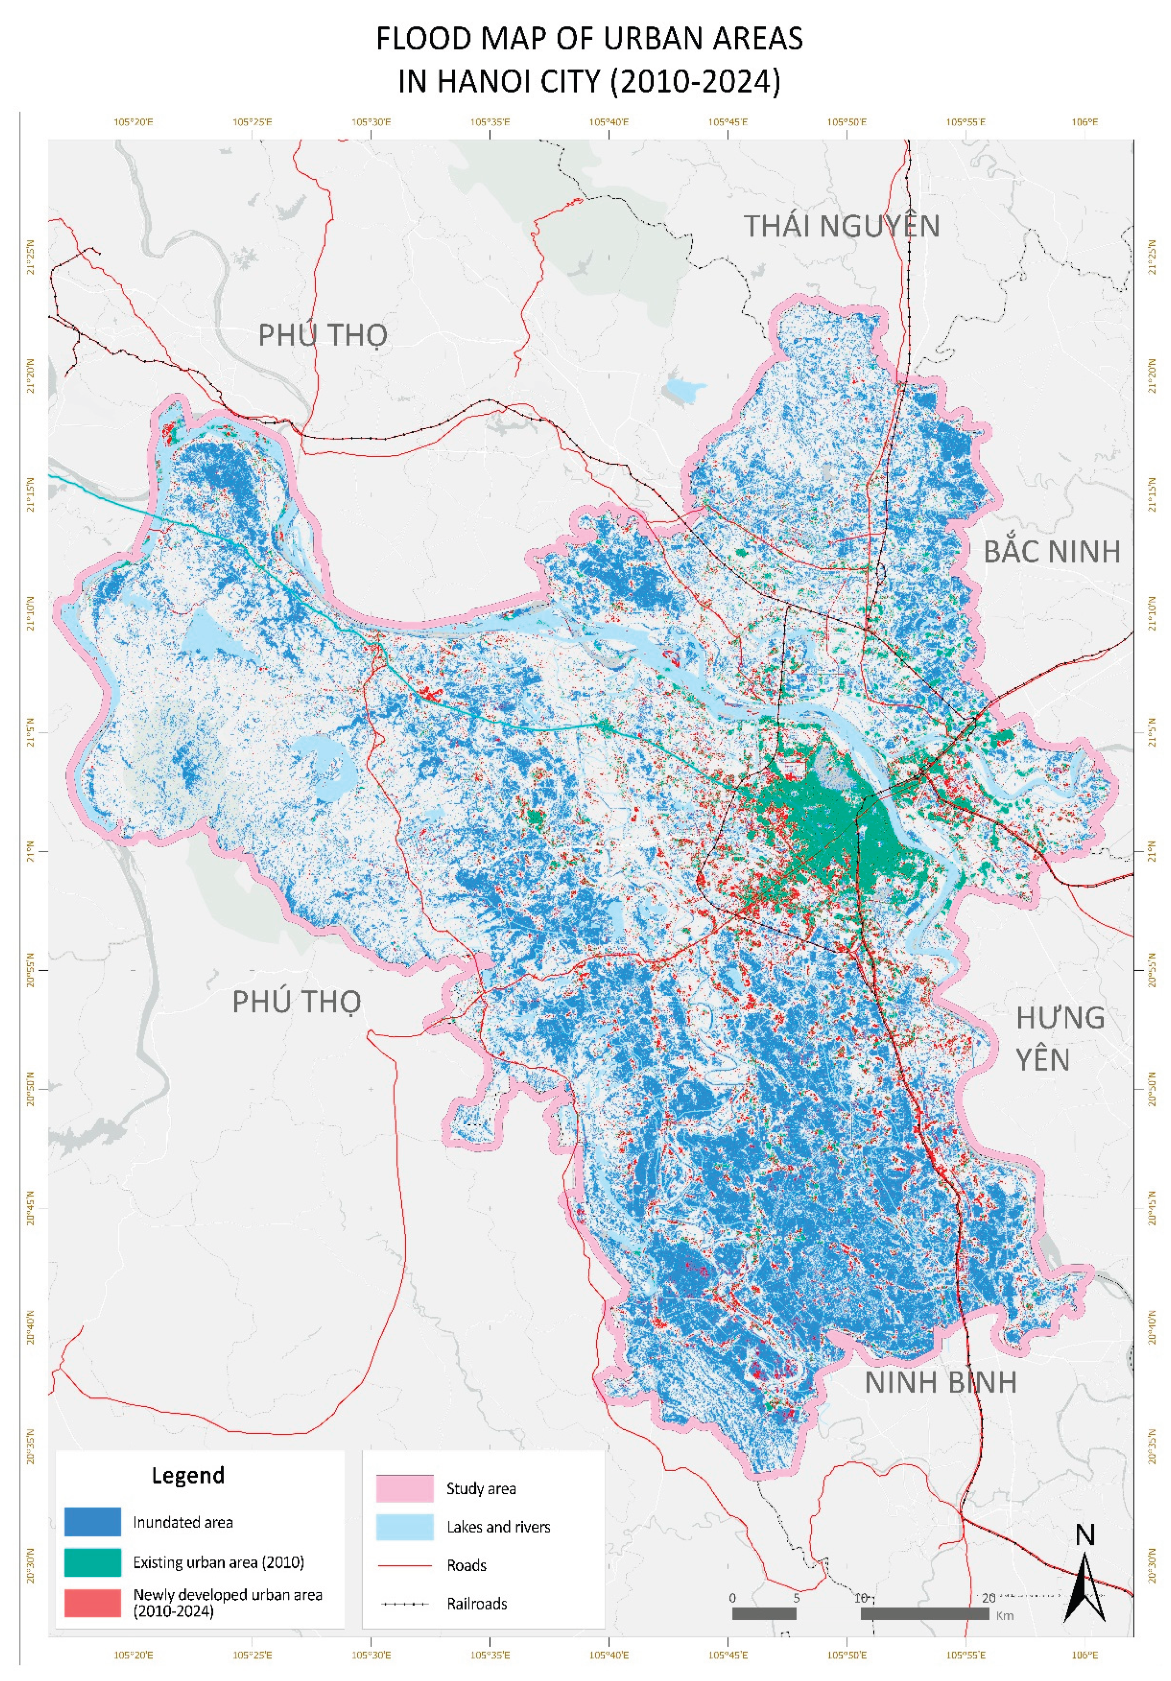
Figure 12.
Flood risk assessment map of Hanoi using a geomorphological approach. High-resolution version is available in the Supplementary Materials (Figure S15).
Figure 12.
Flood risk assessment map of Hanoi using a geomorphological approach. High-resolution version is available in the Supplementary Materials (Figure S15).
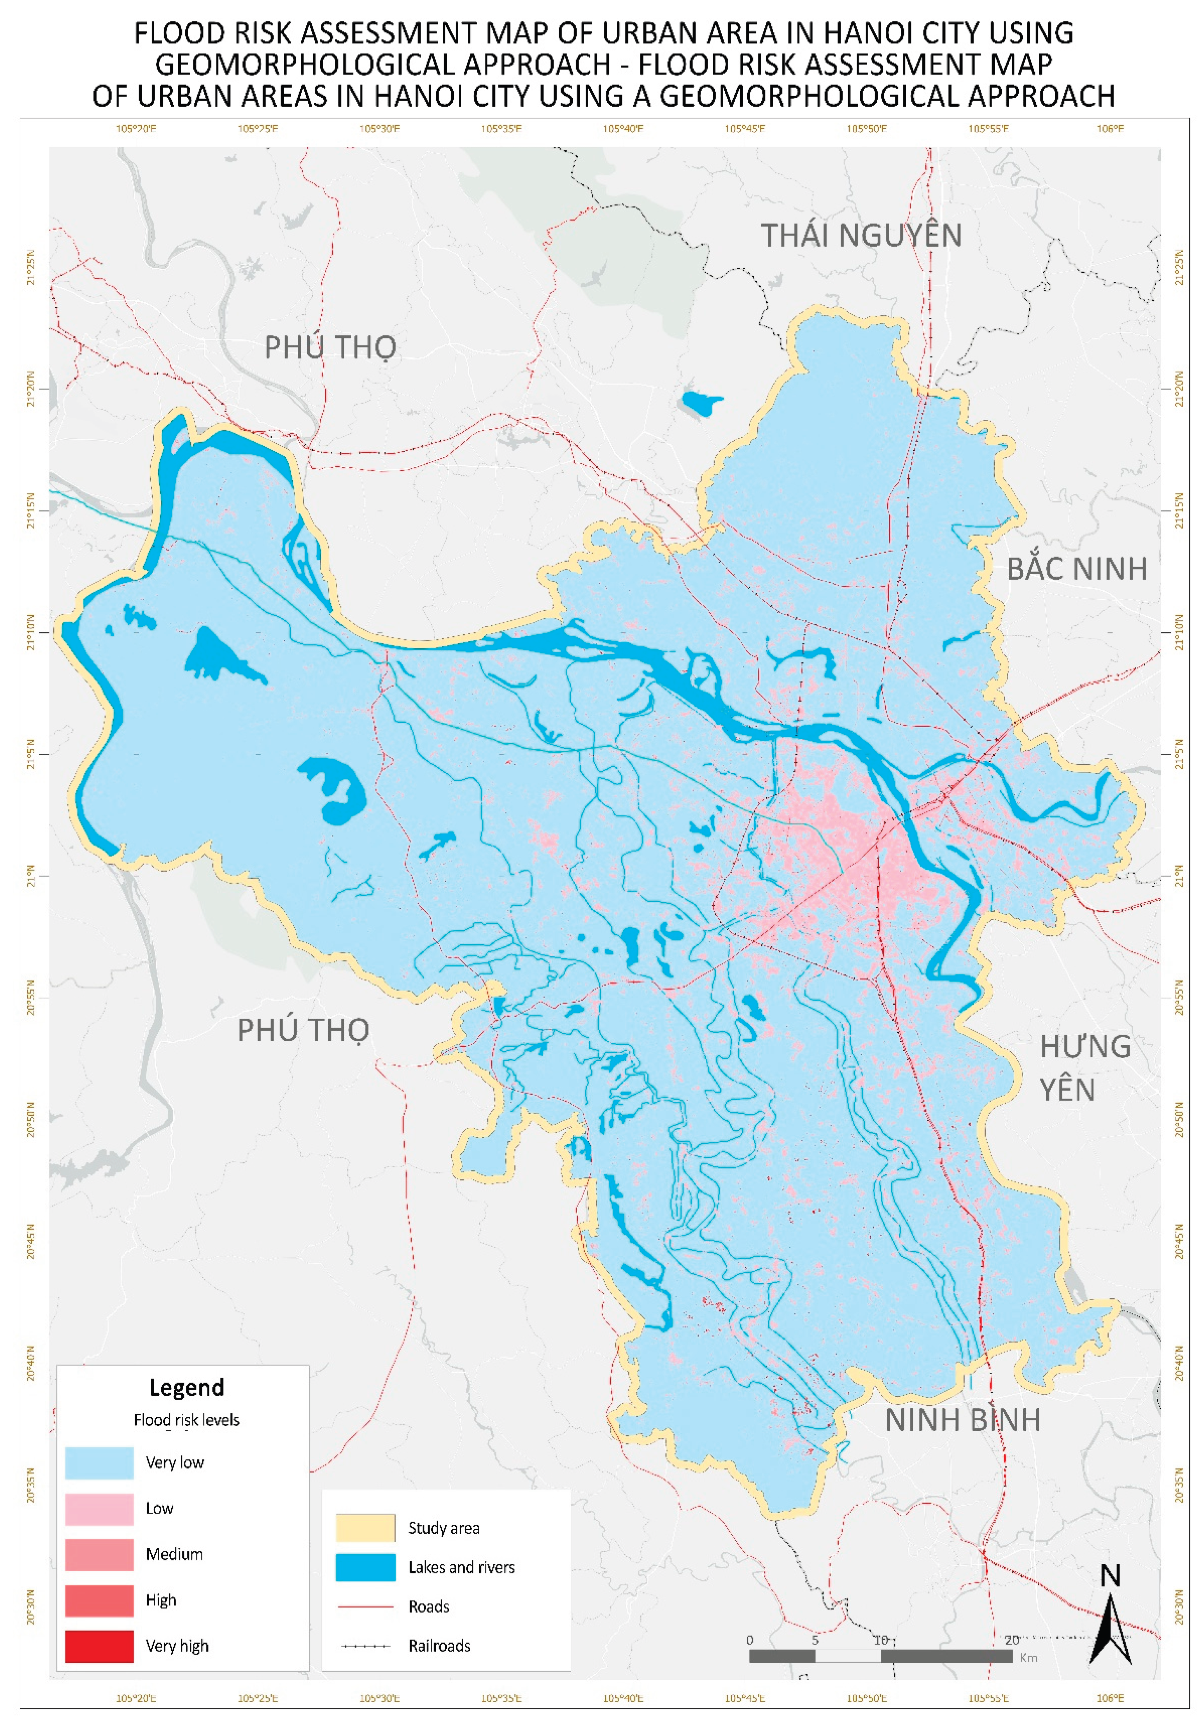
Figure 13.
Survey of residents’ perceptions of the current drainage system. High-resolution version is available in the Supplementary Materials (Figure S16).
Figure 13.
Survey of residents’ perceptions of the current drainage system. High-resolution version is available in the Supplementary Materials (Figure S16).
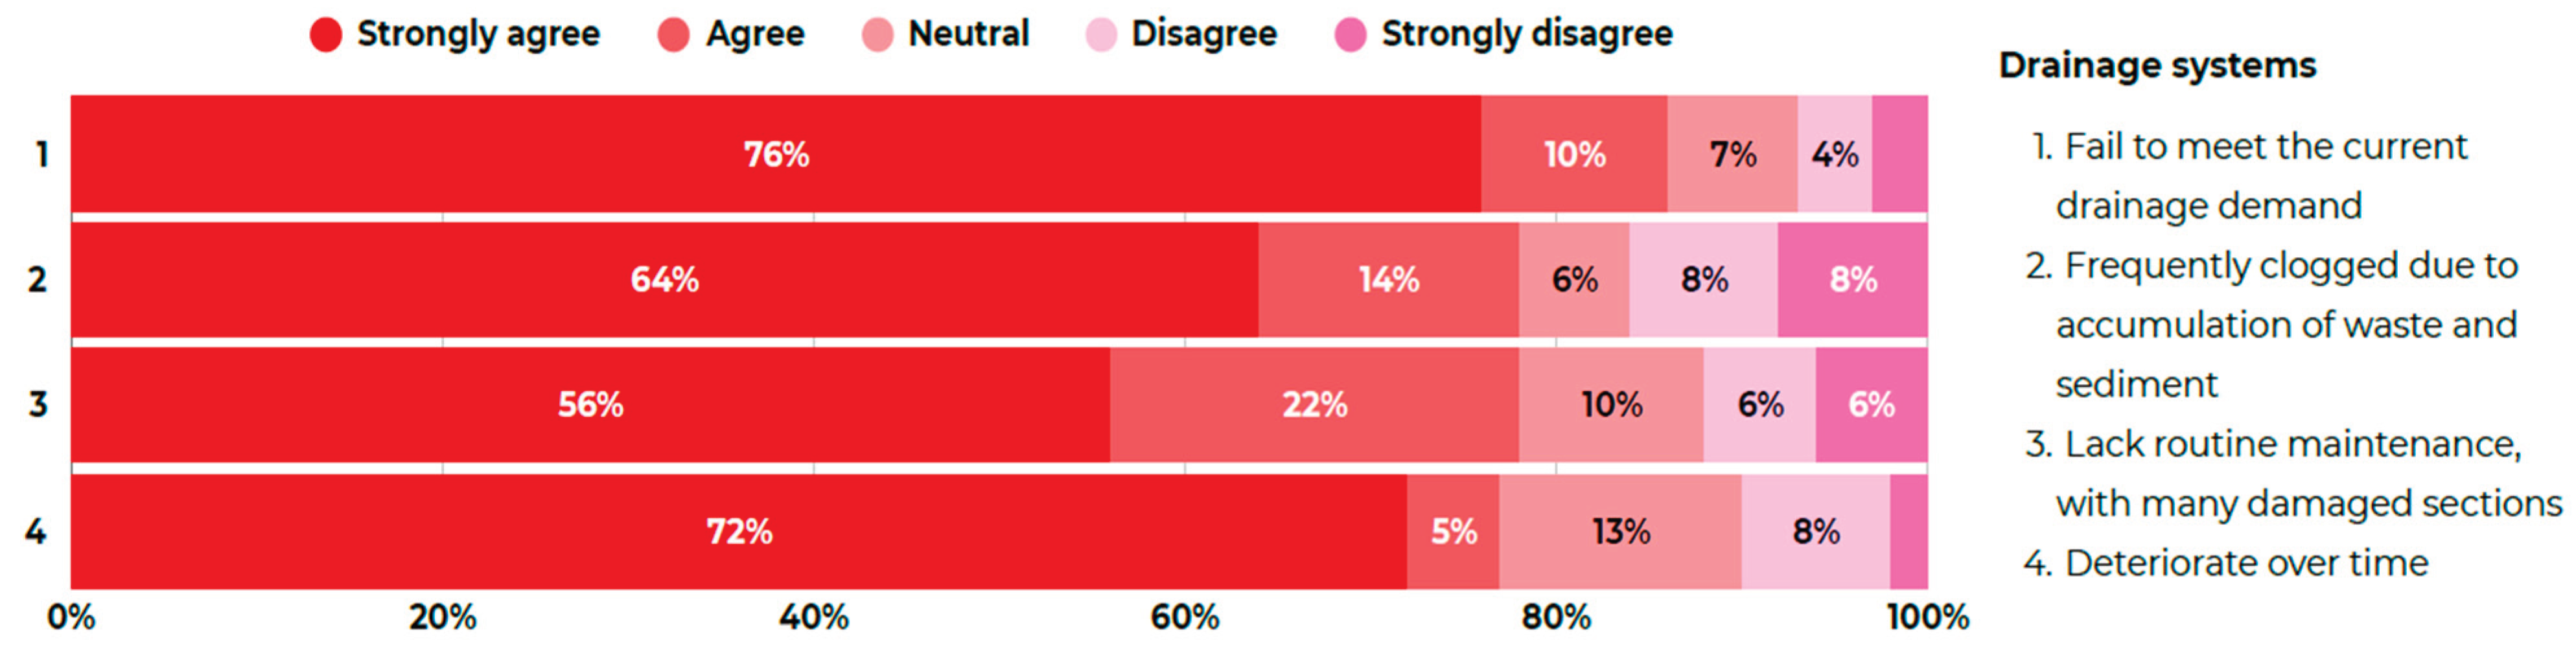
Figure 14.
Flooding state chart by district for the period 2012-2022 [34]. High-resolution version is available in the Supplementary Materials (Figure S17).
Figure 14.
Flooding state chart by district for the period 2012-2022 [34]. High-resolution version is available in the Supplementary Materials (Figure S17).
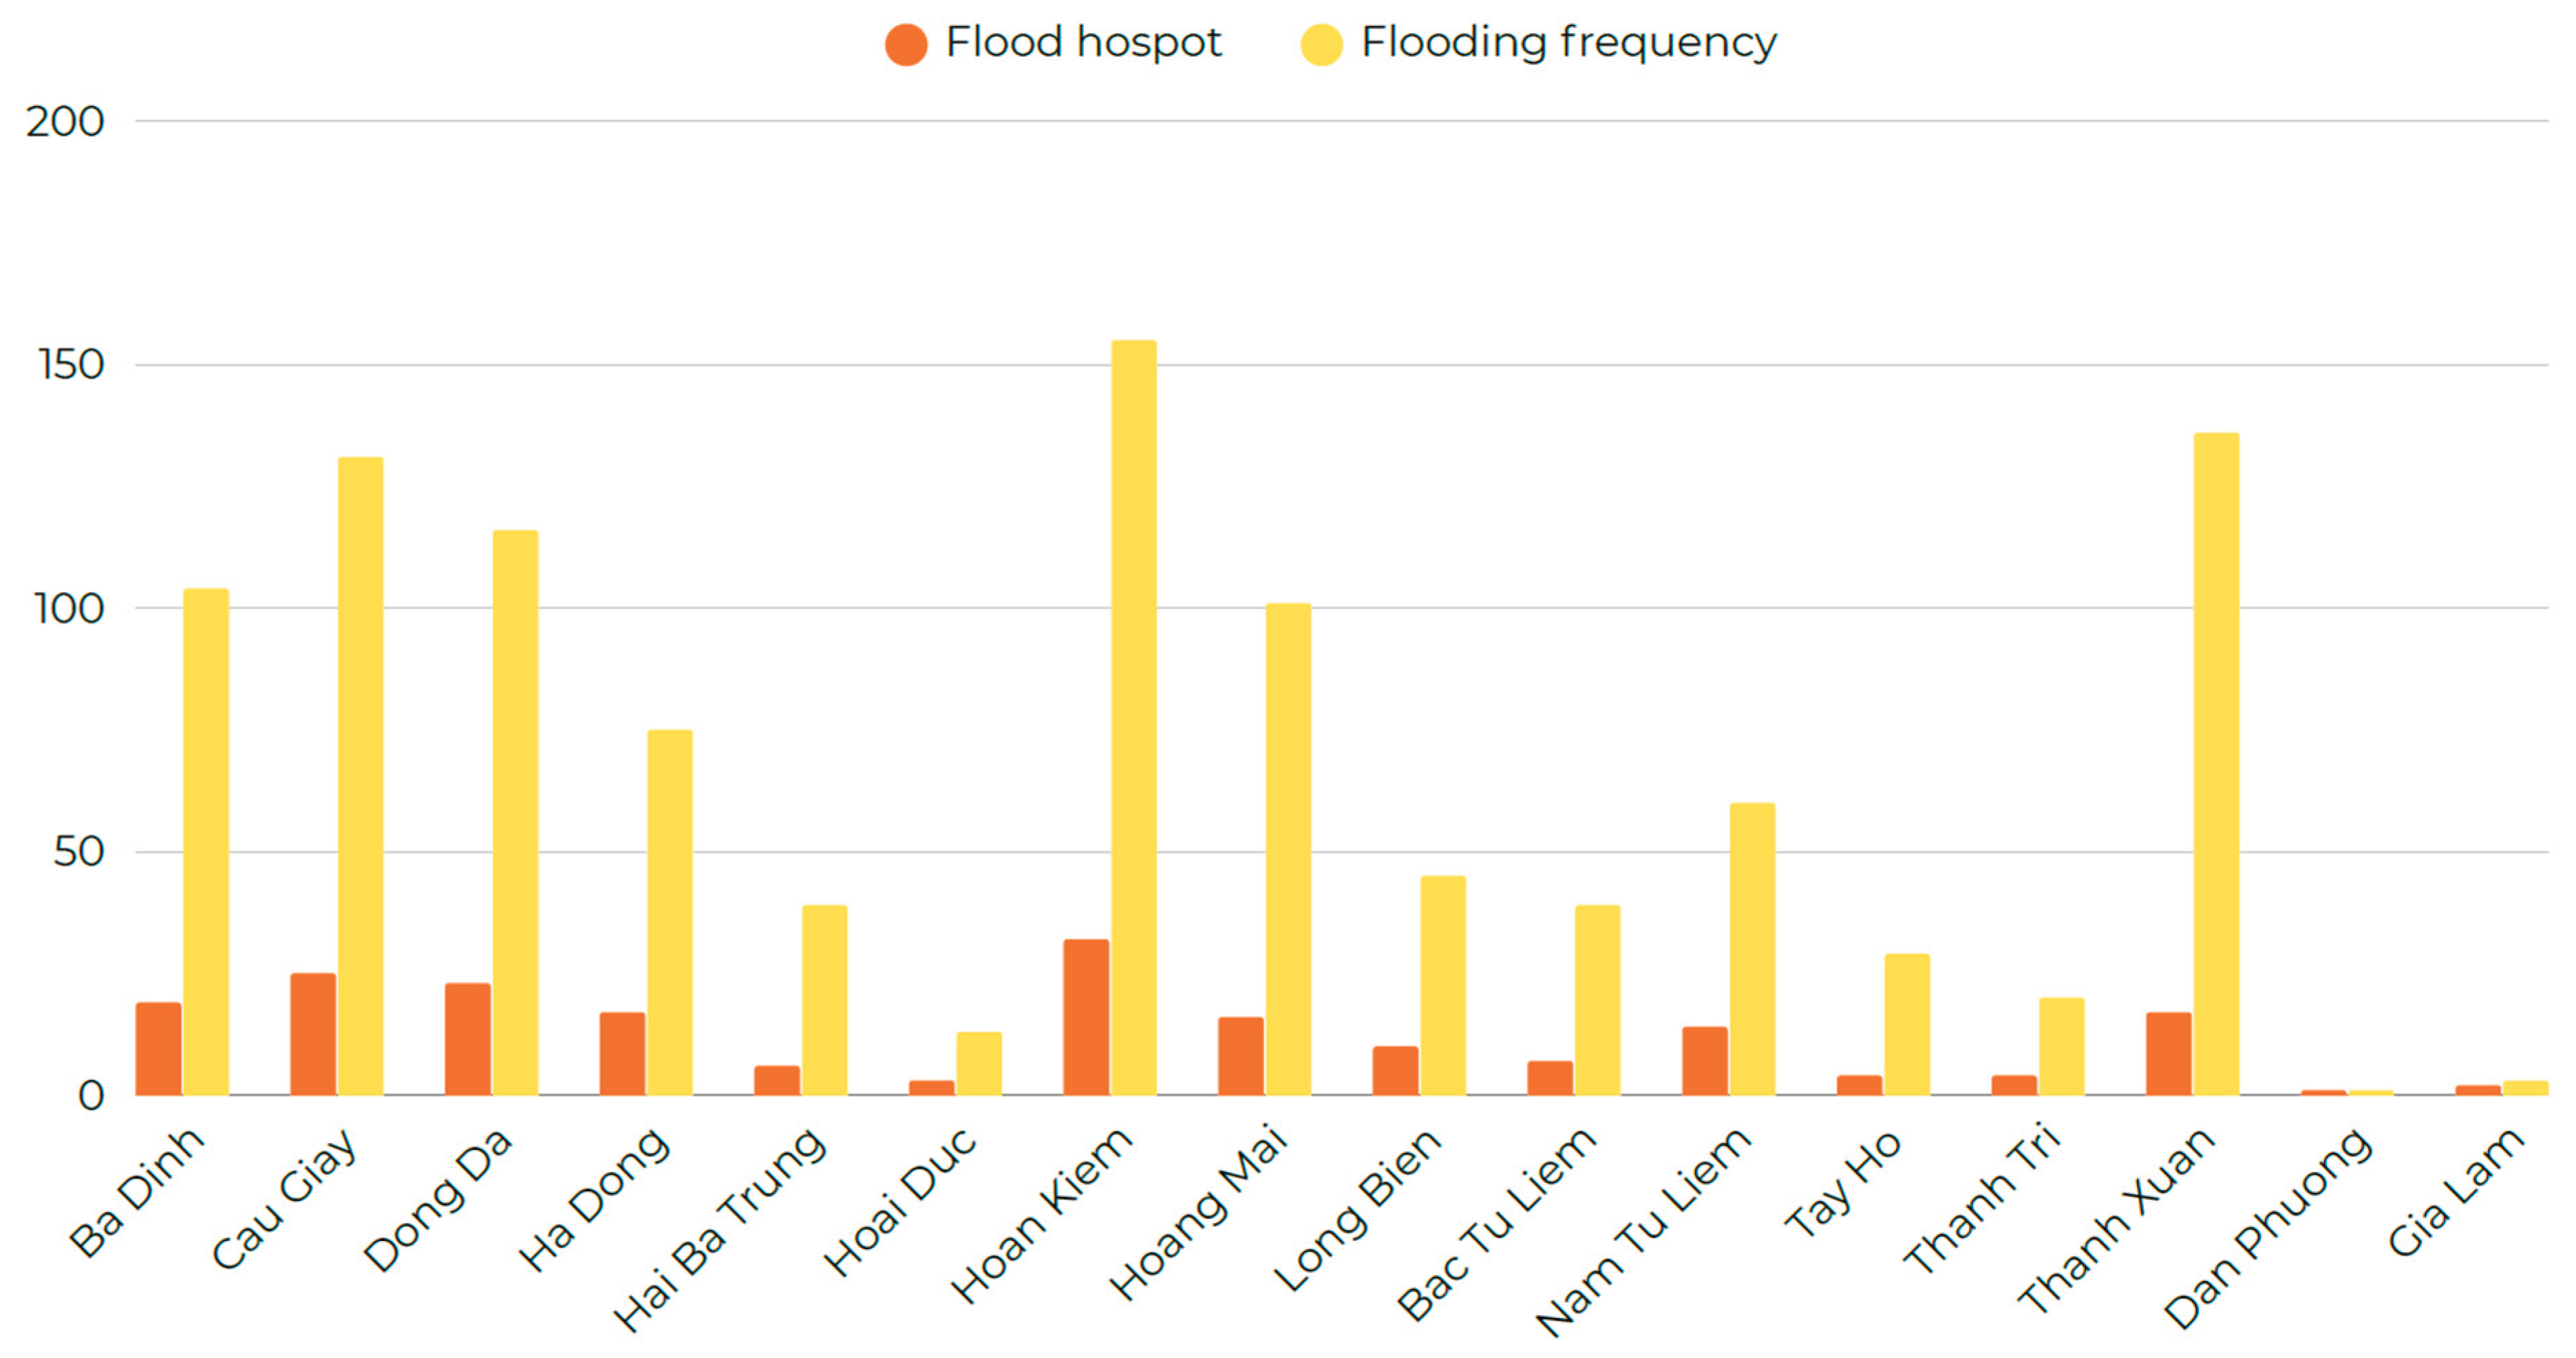
Figure 15.
DPSIR table on flooding in Hanoi. High-resolution version is available in the Supplementary Materials (Figure S18).
Figure 15.
DPSIR table on flooding in Hanoi. High-resolution version is available in the Supplementary Materials (Figure S18).
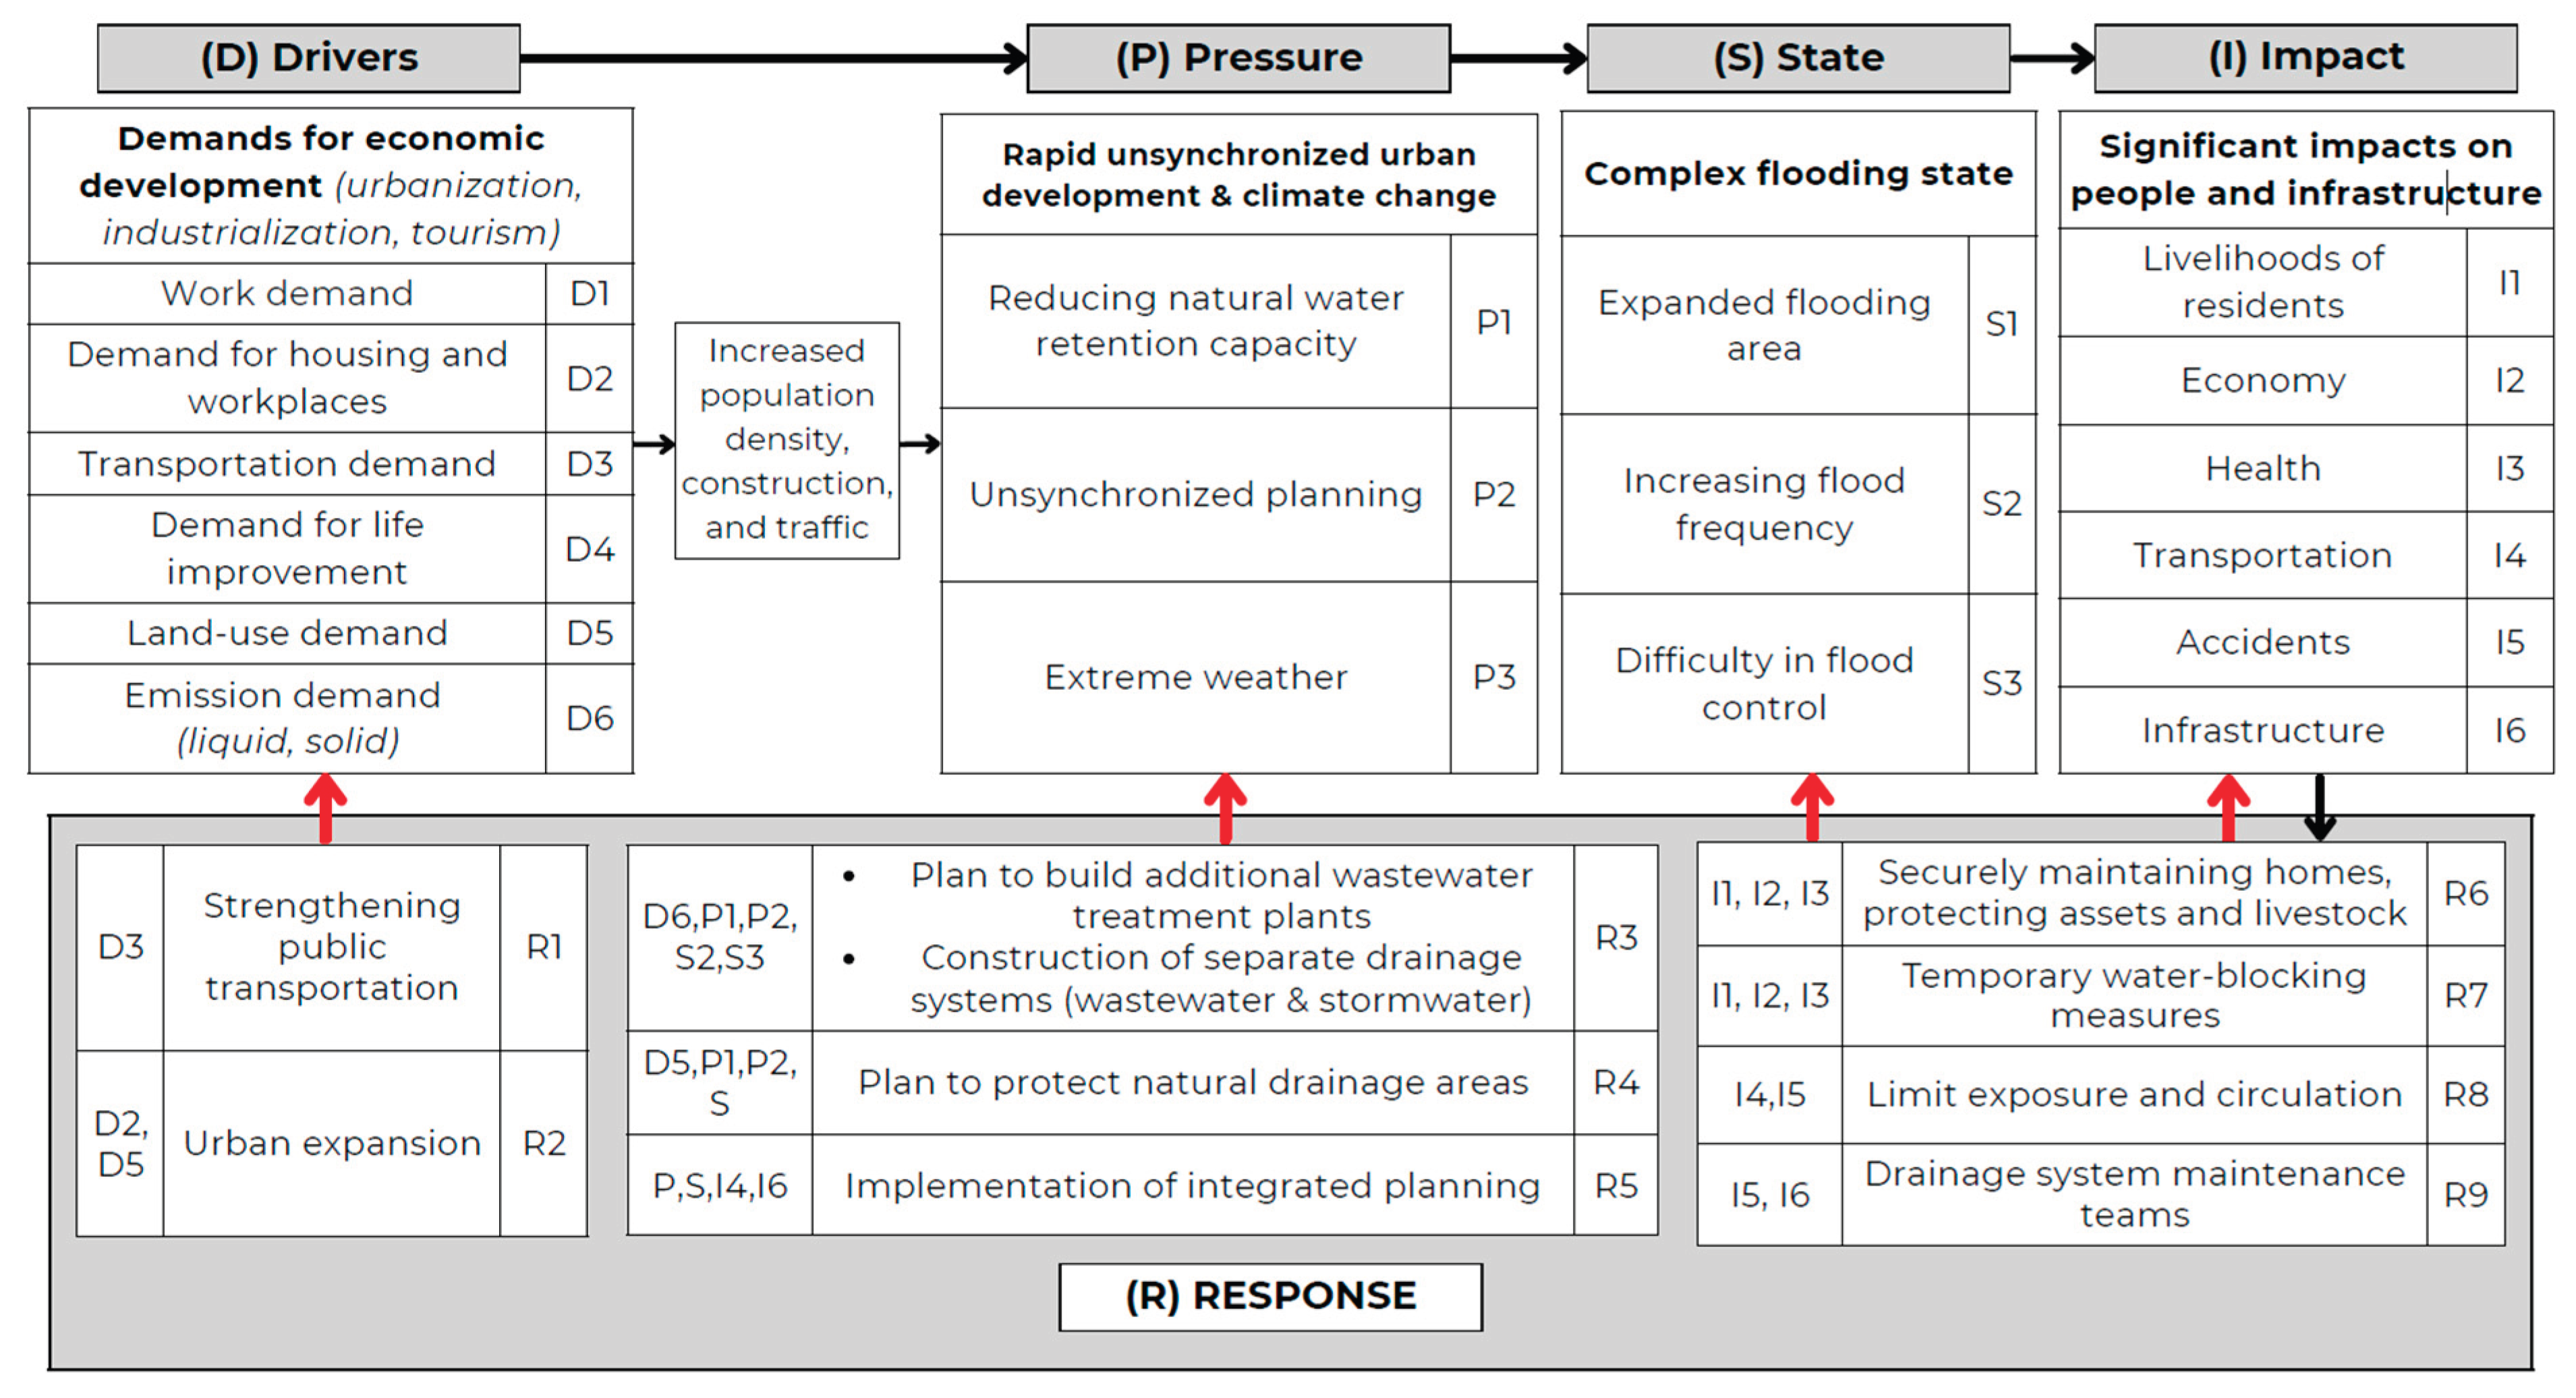
Table 1.
Statistics of area of flood frequency levels in Hanoi (2015-2024).
| Flood frequency level | Area (ha) | Rate (%) |
|---|---|---|
| Very low | 225626.191 | 67 |
| Low | 47631.217 | 14 |
| Medium | 24061.699 | 7 |
| High | 30347.222 | 9 |
| Very high | 7435.072 | 2 |
Table 2.
Urbanization area and rate in Hanoi.
| Urban types | Area (ha) | Rate (%) |
|---|---|---|
| Old urban area | 37,122.096 | 66 |
| New urban area | 19,421.6 | 34 |
Table 4.
Statistics of inundated area in Hanoi’s urban areas.
| Urban types | Inundated area (ha) | Rate (%) |
|---|---|---|
| New urban area | 3,500.197 | 73 |
| Old urban area | 1,278.992 | 27 |
Table 5.
Weighting system for flood risk assessment by geomorphological units.
| Risk level | Denudation origin | Fluvial-origin surfaces | River terrace | Inner-dike floodplains | Outer-dike floodplains | Paleo-channels | Mixed surfaces | Karst | Fluvio-marine plain |
|---|---|---|---|---|---|---|---|---|---|
| Very low | 0 | 0 | 0 | 0 | 0 | 0 | 0 | 0 | 0 |
| Low | 0 | 2 | 0 | 2 | 2 | 2 | 2 | 0 | 2 |
| Medium | 0 | 3 | 0 | 3 | 3 | 3 | 3 | 0 | 3 |
| High | 2 | 4 | 2 | 4 | 4 | 4 | 4 | 2 | 4 |
| Very high | 3 | 5 | 3 | 5 | 5 | 5 | 5 | 3 | 5 |
Notes: Applied consistently to both old and new urban areas.
Disclaimer/Publisher’s Note: The statements, opinions and data contained in all publications are solely those of the individual author(s) and contributor(s) and not of MDPI and/or the editor(s). MDPI and/or the editor(s) disclaim responsibility for any injury to people or property resulting from any ideas, methods, instructions or products referred to in the content. |
© 2025 by the authors. Licensee MDPI, Basel, Switzerland. This article is an open access article distributed under the terms and conditions of the Creative Commons Attribution (CC BY) license (http://creativecommons.org/licenses/by/4.0/).
Copyright: This open access article is published under a Creative Commons CC BY 4.0 license, which permit the free download, distribution, and reuse, provided that the author and preprint are cited in any reuse.


