
Submitted:
07 October 2025
Posted:
08 October 2025
You are already at the latest version
Abstract
Diabetic kidney disease and hypertension are the leading causes of kidney failure. The reduction in an estimated glomerular filtration rate (eGFR) in response to chronic exposure to low levels of cadmium (Cd) has been causally linked, however, the exact mechanism is poorly understood. We postulate that the toxicity of Cd and lead (Pb) towards kidney tubular cells impairs their function, particularly their ability to clear filtered proteins, notably β2-microglobulin (β2M). As proteins in the glomerular filtrate is concentrated, it becomes toxic to cells, and thus a further reduction in eGFR. In this study we analyzed data from a Thai cohort of 137 persons of which 72 were diagnosed with diabetes. Blood Cd, blood Pb and urinary excretion of Cd (ECd) were measured to obtain an indication of exposure to these metals. Tubular cell injury and tubular cell function were assessed by measurement of urinary N-acetylglucosaminidase (ENAG) and fractional tubular degradation of β2M (FrTDβ2M), respectively. FrTDβ2M was more strongly associated with eGFR in those with diabetes (β = 0.476) than those without (β = 0.360). Intriguingly, only in those with diabetes, FrTDβ2M was inversely associated with ECd (β = −0.295) as was an association of ENAG with ECd (R2 = 0.071). The mediation analysis infers that a falling eGFR was partially linked to a diminished tubular degradation of β2M, caused by Cd-induced tubular cell injury. In conclusion, individuals with diabetes were especially susceptible to tubular cell injury, reductions in both eGFR and the degradation of filtered proteins following Cd/Pb exposure.
Keywords:
β2-microglobulin
; cadmium
; diabetes
; eGFR
; N-aceylglucosaminidase
; lead
1. Introduction
Diabetes, defined as fasting plasma glucose (FPG) levels ≥ 126 mg/dL, is one of the chronic ailments with high prevalence worldwide [1]. Among people with diabetes hypertension and chronic kidney disease (CKD) are common comorbidities [2,3,4,5]. Notably, however, hypertension can be both a cause and a consequence of kidney damage [4,5,6]. The diagnosis of CKD is based on the presence of albuminuria for at least 3 months, and/or a fall of an estimated glomerular filtration rates (eGFR) ≤ 60 mL/min/1.73 m2 [7,8,9]. Another notable hallmark of kidney disease is proteinuria, which can predict continued progressive eGFR decline to end-stage kidney disease [10,11,12,13,14], a condition that requires dialysis or a kidney transplant for survival. The associated healthcare costs are substantial.
Due to the widespread contamination of arable soils and staple foods, exposure to cadmium (Cd) and lead (Pb) is inevitable for most people [15,16]. This is reflected by several population studies that reported an association of CKD risk with exposure to the metals [17,18,19,20,21]. A cross-sectional study on the U.S. population observed increased risk of CKD by Pb exposure, especially in non-smoking women, aged over 50 years, who had diabetes and body mass index (BMI) higher than 25 kg/m2 [22]. In a cohort of Swedish women aged 64 years, an increased risk of albuminuria was found only in those with diabetes who had blood Cd within the top quartile [23]. A prospective cohort study from the Netherlands suggested that Cd exposure promoted eGFR deterioration in patients with diabetes [24].
The present study aimed to investigate the mechanisms of the nephrotoxicity of Cd and Pb in people with diabetes, emphasizing the connection between kidney tubular cell injury and the catabolism of filtered proteins, notably β2-microglobulin (β2M). We hypothesize that Cd/Pb exposure and/or diabetes (hyperglycemia) causes injury/damage to kidney tubular cells, which, in turn, diminishes the catabolism of filtered proteins, leading eventually to proteinuria and a declining eGFR.
Our hypothesis was constructed from our previous observations; a decrease in fractional tubular degradation of β2M (FrTDβ2M) by diabetes [25], and increased risks of hyperglycemia, eGFR reduction, and albuminuria by Cd/Pb exposure [26]. Studies by others have found that risks of hypertension, kidney damage and diabetes-related mortality may rise with an increment of plasma β2M levels [27,28,29]. Through the SH2B3-β2M axis of blood pressure control, β2M has been causally linked to hypertension development and kidney damage [30,31,32]. For these reasons, FrTDβ2M was our main focus.
2. Materials and Methods
2.1. Data Sourcing
Study subjects were chosen from a cohort of 88 individuals diagnosed with diabetes and 88 individuals without diabetes. The recruitment criteria for the participants in the pre-exiting cohort and findings have been reported previously [26]. In brief, the inclusion criteria for cases were residents of the Pak Poon municipality, Nakhon Si Thammarat Province, Thailand, aged at least 40 years, who attended annual health checkups, and who were diagnosed with type 2 diabetes. For the control group, exclusion criteria were non-resident status, pregnancy and/or breastfeeding, and hospital records or a physician’s diagnosis of an advanced chronic disease, including heart disease, stroke, and cancer.
Participants were provided with the study objectives, study procedures, potential risks, and benefits, and they gave written informed consent prior to participation. Structured interview questionnaires were used to collect sociodemographic data, educational attainment, occupation, health status, family history of diabetes, use of dietary supplements, alcohol consumption, and smoking status. After individuals with missing data were excluded, a total of 137 individuals (72 with diabetes and 65 without diabetes) were analyzed in the present study. The % of hypertension in subjects with diabetes and without were 64.6 and 44.9, respectively
2.2. Procurement and Storage of Blood and Urine Samples
Collection of blood and urine samples was undertaken at the Pak Poon health center on the morning after an overnight fast. Morning voided urine samples were collected in acid-washed polypropylene collection cups. Blood samples for the glucose assay were collected in tubes containing heparin as an anticoagulant and fluoride as an inhibitor of glycolysis. Blood samples for Cd and Pb analysis were collected in tubes containing ethylene diamine tetra acetic acid as an anticoagulant.
Blood and urine samples were kept on ice and transported within one hour to the laboratory at Walailak University, where aliquots of plasma and serum were prepared. To prevent the degradation of β2M in acidic conditions, an alkaline (NaOH) solution was added to adjust the pH of urine aliquots to >6 before storage. Aliquots of urine, whole blood, serum, and plasma were stored at −80 °C for later analysis.
2.3. Quantification of Metals and Biomarkers of Kidney Effects
We used the human beta-2 microglobulin/β2M ELISA pair set (Sino Biological Inc., Wayne, PA, USA) to determine urine and serum concentration of β2M, with a lower limit of detection of 3.13 pg/mL. The plasma glucose assay was based on the oxidase–peroxidase method (Glu Colorimetric Assay Kit, Elabscience, Catalog No: E-BC-K234-M, Houston, TX, USA) [33]. The urinary NAG assay was based on colorimetry, using 4-nitrophenyl N-acetyl-β-D-glucosaminide as a substrate (Merck KGaA, Darmstadt, Germany). Assays of creatinine in urine and plasma were based on Jaffe’s alkaline picrate method [34]. The coefficients of variation (CV) for all blood and urine assays were within acceptable clinical chemistry standards.
Urinary and whole blood Cd and Pb concentrations were determined with GBC System 5000 graphite furnace atomic absorption spectrometry (AAS) (GBC Scientific Equipment, Hampshire, IL, USA) [35]. Standards with As, Be, Cd, Cr (VI), Hg, Ni, Pb, Se, and Tl were used to calibrate the instrument (Merck KGaA, Darmstadt, Germany). Reference urine metal levels 1, 2, and 3 (Lyphocheck, Bio-Rad, Hercules, CA, USA) were used for quality control, accuracy, and precision assurance purposes. When urinary and blood concentrations of Cd and Pb were less than their detection limits, the concentration assigned was the detection limit value divided by the square root of 2 [36].
2.4. Normalization of ECd, Eβ2M and ENAG
Given that urine samples were collected at a single time point (voided urine), a correction for interindividual differences in the urine volume was required. Thus, we normalized urinary excretion of Cd, β2M and NAG (ECd, Eβ2M and ENAG) to creatinine clearance (Ccr), using the equation; Ex/Ccr = [x]u[cr]p/[cr]u, where x = Cd, β2M or NAG; [x]u = urine concentration of x (mass/volume); [cr]p = plasma creatinine concentration (mg/dL); and [cr]u = urine creatinine concentration (mg/dL). Ex/Ccr was expressed as an amount of x excreted per volume of the glomerular filtrate [37]. This Ccr-normalization simultaneously corrects for differences in urine volume and the number of functioning nephrons, and it is not affected by the variation in muscle mass.
For comparison purposes, we provided also data on ECd, Eβ2M and ENAG normalized to creatinine excretion (Ecr), using the equation; Ex/Ecr = [x]u/[cr]u, where x = Cd, β2M or NAG; [x]u = urine concentration of x (mass/volume) and [cr]u = urine creatinine concentration (mg/dL). Ex/Ecr was expressed as an amount of x excreted per g of creatinine.
Ecr-normalization corrects for difference in urine volume only. Notably, however, it is affected by a large variation in Ecr due to differences in muscle mass, especially between men and women. Ecr-adjustment can create non-differential errors/imprecisions that bias the dose-response relationships toward the null [38]. A dose-response relationship could not be established between ECd and risk of abnormal Eβ2M values when ECd and Eβ2M were adjusted to Ecr [39].
2.5. Computation of eGFR, Fβ2M, TDβ2M and FrTDβ2M
Estimated GFR (eGFR) was computed with Chronic Kidney Disease Epidemiology Collaboration (CKD-EPI) equations [40]. CKD stages 1, 2, 3, 4, and 5 corresponded to eGFR of 90–119, 60–89, 30–59, 15–29, and <15 mL/min/1.73 m2, respectively.
The parameters used to describe kidney handling of β2M were; (i) rate of glomerular filtration of β2M (Fβ2M), mg/d; (ii) amount of β2M undergoing tubular degradation per volume of glomerular filtrate (TDβ2M/Ccr), mg/L; and (iii) fractional tubular degradation of filtered β2M (FrTDβ2M), decimal fraction. These parameters were computed with below equations [25].
Equation L: Fβ2M = eGFR[β2M]s
Equation II: TDβ2M/Ccr = [β2M]s – Eβ2M/Ccr
Equation III: FrTDβ2M = TDβ2M/Ccr)/[β2M]s
2.6. Analysis for Cause-Effect Relationship
To gain insight into the mediators of effects of Cd/Pb exposure on kidney tubular and glomerular functions, we employed the Baron and Kenny method [41,42,43], and their generic simple mediation models are depicted together with statistics parameters (β coefficients) describing the direct and indirect effects of the independent variable tested. (Scheme 1).
2.7. Statistical Analysis
Data were analyzed with IBM SPSS Statistics 21 (IBM Inc., New York, NY, USA). The variation in any continuous variable and differences in percentages across the Cd/Pb exposure levels were assessed by the Kruskal–Wallis’s test and the Pearson chi-squared test, respectively. Spearman’s rank correlation analysis was employed to produce the correlation matrices of nine variables: FrTDβ2M, age, BMI, eGFR, FPG, ECd/Ccr, ENAG/Ccr, and Cd/Pb exposure levels.
The one-sample Kolmogorov–Smirnov test was used to assess departure from a normal distribution of any continuous variable. Logarithmic transformation was applied to ECd/Ccr, Eβ2M/Ccr and ENAG/Ccr that showed rightward skewing before they were subjected to parametric statistics analyses, scatterplots, and linear regressions.
Multiple linear regression modeling was employed to identify the variables contributing to the variability of FrTDβ2M among subjects with/without diabetes.
3. Results
3.1. Cd/Pb Exposure Categorization
We used the mean blood Cd (0.3 µg/L) and the median blood Pb (2.12 µg/dL) to describe Cd/Pb exposure levels among study subjects. Those with blood Cd and blood Pb levels ≤ medians, blood Cd or blood Pb ≥ the median, and blood Cd and blood Pb both ≥ medians were assigned to Cd/Pb exposure levels 1, 2 and 3, respectively. The corresponding numbers of subjects in the Cd/Pb exposure levels 1, 2 and 3 were 44, 54, and 39. Characteristics of Cd/Pb categorical exposure groups can be found in Table 1.
Among 137 study subjects, 107 (78.1%) were women with overall mean age (range) of 59.7 (41−80) years. The group with the Cd/Pb exposure level 3 had the highest percentages of smokers (23.1) diagnosed diabetes (64.1), hypertension (71.8) and fasting plasma glucose (FPG) ≥ 126 mg/dL (56.4).
Nearly half (48.9%) of study subjects had FPG ≥ 110 mg/dL, commensurate with prediabetes status and they seemed to distribute equally; the different % distribution of FPG ≥ 110 mg/dL across Cd/Pb exposure groups did not reach a statistically significant level (p = 0.115). The overall % low eGFR was 12.4, and the prevalences of low eGFR across the Cd/Pb exposure levels did not differ (p = 0.469).
The parameters showing significant variations across the Cd/Pb exposure levels were [Cd]b, [Cd]u, [Pb]b, ECd and Eβ2M. The variations in age, BMI, FPG, eGFR and ENAG across the Cd/Pb exposure levels were not statistically different.
3.2. Cd/Pb Exposure and Kidney Handling of β2M
Figure 1 provides results of an analysis aimed to identify the components of β2M homeostasis that may be affected by Cd/Pb exposure. The tested β2M homeostasis parameters were filtration of β2M (Fβ2M), tubular degradation of β2M (TDβ2M/Ccr), fractional tubular degradation of β2M (FrTDβ2M) and urinary excretion of β2M (Eβ2M/Ccr). The calculations of these parameters are described in Section 2.5.
Neither Fβ2M nor TDβ2M/Ccr varied with the Cd/Pb exposure levels (Figures 1A,1B). However, FrTDβ2M fell as the Cd/Pb exposure levels rose (p = 0.014) (Figure 1C), while Eβ2M/Ccr rose with the increment of Cd/Pb exposure levels (p = 0.001) (Figure 1D). Thus, Cd/Pb exposure appeared to have a significant effect on β2M homeostasis, reflected by two parameters, FrTDβ2M and Eβ2M/Ccr.
To gain further mechanistic insights, we conducted the Spearman’s rank correlation analysis to examine the interrelationship relationships of indicators/biomarkers of kidney tubular and glomerular functions (Table 2).
FrTDβ2M varied directly with eGFR (r = 0.434), and inversely with FPG (r = −0.215), ECd/Ccr (r =−0.527), ENAG/Ccr (r =−0.536) and Cd/Pb exposure (r = −0.249). The correlation between FrTDβ2M and ECd/Ccr was particularly strong as was for the correction between FrTDβ2M and ENAG/Ccr.
The potential tubulo-glomerular effects of Cd/Pb exposure were evident from the eGFR vs. ENAG/Ccr (r = −0.467) and ECd/Ccr vs. ENAG/Ccr (r = 0.328) and Cd/Pb exposure levels vs. ECd/Ccr (r = 0.301) correlations.
Scatterplots and regression analysis were used to examines the correlations of FrTDβ2M with ENAG/Ccr in subgroups (Figure 2).
In subjects with diagnosed diabetes, FrTDβ2M rose linearly with ENAG/Ccr (R2 = 0.340, p < 0.001), but not in those without diabetes (R2 = 0.050, p = 0.133) (Figure 2a). In subjects with FPG ≥ 110 mg/dL, FrTDβ2M was more closely associated ENAG/Ccr (R2 = 0.354, p < 0.001), compared to those who had FPG <110 mg/dL (R2 = 0.098, p = 0.032) (Figure 2b).
Additional scatterplots and regression analysis were conducted based on correlation between ENAG/Ccr and FrTDβ2M together with FPG and ECd/Ccr, identified in Table 2. Results are reported in Figure 3.
In subjects with diagnosed diabetes, ENAG/Ccr rose linearly with ECd/Ccr (R2 = 0.071, p = 0.047), but not in controls (R2 0.017, p = 0.386) (Figure 3a). In contrast, a significant association between ENAG/Ccr and ECd/Ccr was found only in subjects with FPG levels commensurate with prediabetes (R2 0.082, p = 0.034) (Figure 3b).
3.3. Multiple Linear Regression Models for FrTDβ2M in Diabetes vs. Controls
To confirm results of FrTDβ2M bivariate and regression analyses, multiple regression model analysis was conducted to adjusted for effects of covariates. The independent variables incorporated in each regression model were for age, years BMI, eGFR, ECd/Ccr, diagnosed diabetes, gender, smoking hypertension and FPG (Table 3).
All independent variables explained 31.1, 30.1 and 21.5% of the FrTDβ2M variability in all subjects (p < 0.001), the diagnosed diabetes group (p < 0.001) and controls (p = 0.003). FrTDβ2M showed a strong positive association with eGFR in both diabetes (β = 0.476, p <0.001) and controls (β = 0.360, p = 0.033).
Intriguingly, an inverse association of FrTDβ2M and ECd/Ccr was found only in the diabetes group (β = −0.295, p = 0.009). A moderate positive association of FrTDβ2M and FPG was evident in the control group only (β = 0.247, p = 0.033).
3.4. Mediation Analysis of Effects of Cd/Pb Exposure on FrTDβ2M
To investigate the mediating role of tubular injury, indicated by ENAG/Ccr, a simple mediation model with a single mediator was employed. As depicted in Figure 4, the independent variable, ECd/Ccr was indicative of Cd/Pb exposure, given a significant correlation between ECd/Ccr and Cd/Pb exposure levels, revealed in Table 2.
3.5. Mediation Analysis of Effects of Cd/Pb Exposure on eGFR and FPG
Two additional simple mediation models were conducted with eGFR and FPG were the independent variables to investigate the mediating role of reduced tubular degradation of β2M, reflected by FrTDβ2M (Figure 5). Similarly, ECd/Ccr was the independent variable that reflected also a Pb co-exposure.
4. Discussion
Low-level environmental exposure to Cd and Pb experienced by subjects in the present study was indicated by median values for blood Pb, blood Cd and urinary Cd excretion rate (ECd/Ecr) of 2.12 µg/dL, 0.3 µg/L and 0.12 µg/g creatinine, respectively. These Cd/Pb exposure levels were less than the levels found to be associated with increased risk of diabetes reported in the studies from U.S. [44,45] and Korea [46]. In the Korean study, a correlation was observed between ECd and FPG levels together with the increases in prevalence of diabetes by 81% and 39% in men and women who had ECd/Ecr levels ≥ 2 and ≥ 3 µg/g creatinine, respectively [46].
As can be expected from low ECd levels and modest sample size (n = 137), the correlation between FPG and urinary Cd exposure levels in our subjects (mean 0.98 µg/g creatinine) did not reach statistically significant levels (r = 0.166, p = 0.053) (Table 2). Notably, however, ECd/Ccr showed a positive correlation with a tubular injury biomarker (ENAG) (r = 0.328, p = 0.001). In subgroup analysis (Figure 3), a significant correlation between ENAG and ECd was found only in those with diabetes (R2 0.071, p = 0.047), and those with FPG ≥ 110 mg/dL (R2 0.082, p = 0.034). Thus, an observed tubular injury could be attributed to the Cd/Pb exposure plus the presence of diabetes and/or hyperglycemia (FPG ≥110 mg/dL). Hyperglycemia and diabetes are known to have an impact on kidney tubular and glomerular functions [2].
Evidence for a significant impact of co-exposure to low levels of Cd and Pb on the function of tubular cells comes from an analysis of tubular degradation of the filtered protein, β2M (Figure 1). The protein β2M, by virtue of its small mass, readily passes through the glomerular membrane to tubular lumen, and is reabsorbed and degraded totally by proximal tubular cells [47]. In conventional Cd toxic risk assessment, an increased urinary excretion of β2M (Eβ2M/Ecr) has been used as an indicator of tubular dysfunction. A recent analysis on β2M homeostasis, however, has recommended the use of fractional tubular degradation of β2M (FrTDβ2M) instead of Eβ2M [25].
Herein, we observed that FrTDβ2M dropped as the Cd/Pb exposure levels rose (p = 0.014) (Figure 1C). The excretion of β2M (Eβ2M/Ccr) rose with the increment of Cd/Pb exposure levels (p = 0.001) (Figure 1D). Thus, Cd/Pb co-exposure even in low doses appeared to have a significant effect on tubular cell function, when FrTDβ2M was employed an effect indicator. Also, we observed that FrTDβ2M varied directly with ENAG/Ccr in subjects with diabetes (R2 = 0.340, p < 0.001) (Figure 2a) and those with hyperglycemia (R2 = 0.354, p < 0.001) (Figure 2b). Results from the mediation analysis (Figure 4) inferred that tubular injury (ENAG/Ccr) mediated about 26% of the reduction in tubular degradation of β2M induced by Cd with Pb co-exposure.
In multiple regression modelling (Table 3), we observed a more closely association of FrTDβ2M with eGFR in subjects with diabetes (β = 0.476, p <0.001) than controls (β = 0.360, p = 0.033). In comparison, however, FrTDβ2M inversely associated with ECd/Ccr only in the diabetes group (β = −0.295, p = 0.009), while it showed a moderate positive association with FPG in the control group only (β = 0.247, p = 0.033). These may reflect increased susceptibility to the nephrotoxicity of a low-dose Cd among people with diabetes. A similar observation was made in the Cadmibel study [48] and a Swedish cohort study [23]. By mediation analysis (Figure 5), effects of Cd on eGFR and FPG both were mediated fully through tubular functional impairment (a reduced FrTDβ2M).
The above results suggested that the toxicity of Cd/Pb to the kidney tubular cells impairs their function, assessed with the degradation of β2M (Figure 4), leading to a reduction in eGFR and hyperglycemia (Figure 5). In benchmark dose modeling study [49], urinary Cd excretion rates of 0.0536 and 0.1140 µg/g creatinine were identified to be Cd exposure levels associated with increased protein excretion rates by 5 and 10%, respectively. Because the respective median ECd/Ecr and mean ECd/Ecr in subjects of the present study were 0.12 and 0.98 µg/g creatinine, we speculate that the 5 and 10% increases in protein excretion rates could also be the results of a deceased in tubular protein degradation caused by the metal Cd.
5. Conclusions
In people with hyperglycemia/diabetes, chronic exposure to Cd and Pb, even in low doses, can cause tubular cell injury, accompanied by a reduction in tubular cell function, especially the degradation of filtered proteins, notably β2M. Hyperglycemia, eGFR reduction may follow such kidney tubular functional impairment. It remains to be investigated if a diminished tubular degradation of β2M following Cd/Pb exposure increases plasma β2M and consequential rising blood pressure, given that kidney damage can cause hypertension [4,5,6].
Author Contributions
Conceptualization, S.S., D.A.V. and S.Y.; methodology, S.Y., T.K. and D.W.; formal analysis, S.Y. and S.S.; investigation, S.Y., D.W., and T.K.; resources, S.Y. and D.A.V.; original draft preparation, S.S., D.A.V., and S.Y.; review and editing, S.S. and D.A.V. All authors have read and agreed to the published version of the manuscript.
Funding
This research project was funded by the Research Grant, WU-IRG-63-026, of Walailak University, Nakhon Si Thammarat Province, Thailand.
Institutional Review Board Statement
This study was undertaken in compliance with the guidelines of the Declaration of Helsinki and approved by the Office of the Human Research Ethics Committee of Walailak University, Nakhon Si Thammarat Province, Thailand. Approval number WUEC-24-275-01 (7 August 2024).
Informed Consent Statement
Written informed consent was obtained from all subjects involved in the study.
Data Availability Statement
All data are contained within this article.
Acknowledgments
We thank the staff of a health promoting center in Pakpoon Municipality, Nakhon Si Thammarat Province, Thailand for their assistance with collection of biological and biochemical samples and data.
Conflicts of Interest
The authors declare no conflicts of interest.
Abbreviations
The following abbreviations are used in this manuscript:
| GFR | glomerular filtration rate |
| eGFR | estimated GFR |
| Cd | cadmium |
| ECd | urinary excretion rate of Cd |
| Pb | Lead |
| cr | creatinine |
| Ccr | Creatinine clearance |
| β2M | β2-microglobulin |
| Fβ2M | rate of glomerular filtration of β2M |
| Eβ2M | urinary excretion rate of β2M |
| TDβ2M | rate of tubular degradation of β2M |
| FrTDβ2M | fractional tubular degradation of filtered β2M |
References
- Guariguata, L.; Whiting, D.R.; Hambleton, I.; Beagley, J.; Linnenkamp, U.; Shaw, J.E. Global estimates of diabetes prevalence for 2013 and projections for 2035. Diabetes Res. Clin. Pract. 2014, 103, 137–149. [Google Scholar] [CrossRef]
- Zac-Varghese, S. Diabetes and the kidney. Clin. Med. (Lond) 2025, 100512. [Google Scholar] [CrossRef] [PubMed]
- Santulli, G. The 2025 AHA/ACC hypertension guidelines: implications for cardiovascular and renal risk in patients with diabetes. Cardiovasc. Diabetol. Endocrinol. Rep. 2025, 11, 21. [Google Scholar] [CrossRef] [PubMed]
- Semenikhina, M.; Mathew, R.O.; Barakat, M.; Van Beusecum, J.P.; Ilatovskaya, D.V.; Palygin, O. Blood Pressure Management Strategies and Podocyte Health. Am. J. Hypertens. 2025, 38, 85–96. [Google Scholar] [CrossRef] [PubMed]
- Haruhara, K.; Kanzaki, G.; Tsuboi, N. Nephrons, podocytes and chronic kidney disease: Strategic antihypertensive therapy for renoprotection. Hypertens. Res. 2023, 46, 299–310. [Google Scholar] [CrossRef]
- Ilatovskaya, D.V.; Behr, A.; Staruschenko, A.; Hall, G.; Palygin, O. Mechanistic Insights Into Redox Damage of the Podocyte in Hypertension. Hypertension 2025, 82, 14–25. [Google Scholar] [CrossRef]
- Murton, M.; Goff-Leggett, D.; Bobrowska, A.; Garcia Sanchez, J.J.; James, G.; Wittbrodt, E.; Nolan, S.; Sörstadius, E.; Pecoits-Filho, R.; Tuttle, K. Burden of Chronic Kidney Disease by KDIGO Categories of Glomerular Filtration Rate and Albuminuria: A Systematic Review. Adv. Ther. 2021, 38, 180–200. [Google Scholar] [CrossRef]
- Kalantar-Zadeh, K.; Jafar, T.H.; Nitsch, D.; Neuen, B.L.; Perkovic, V. Chronic kidney disease. Lancet 2021, 398, 786–802. [Google Scholar] [CrossRef] [PubMed]
- Farrell, D.R.; Vassalotti, J.A. Screening, identifying, and treating chronic kidney disease: Why, who, when, how, and what? BMC Nephrol. 2024, 25, 34. [Google Scholar] [CrossRef]
- Liu, D.; Lv, L.L. New Understanding on the Role of Proteinuria in Progression of Chronic Kidney Disease. Adv. Exp. Med. Biol. 2019, 1165, 487–500. [Google Scholar]
- Sharma, S.; Smyth, B. From Proteinuria to Fibrosis: An Update on Pathophysiology and Treatment Options. Kidney Blood Press. Res. 2021, 46, 411–420. [Google Scholar] [CrossRef]
- Makhammajanov, Z.; Gaipov, A.; Myngbay, A.; Bukasov, R.; Aljofan, M.; Kanbay, M. Tubular toxicity of proteinuria and the progression of chronic kidney disease. Nephrol. Dial. Transplant. 2024, 39, 589–599. [Google Scholar] [CrossRef] [PubMed]
- Faivre, A.; Verissimo, T.; de Seigneux, S. Proteinuria and tubular cells: Plasticity and toxicity. Acta Physiol. 2025, 241, e14263. [Google Scholar] [CrossRef] [PubMed]
- Hall, A.M. Protein handling in kidney tubules. Nat. Rev. Nephrol. 2025, 21, 241–252. [Google Scholar] [CrossRef] [PubMed]
- Hou, D.; Jia, X.; Wang, L.; McGrath, S.P.; Zhu, Y.G.; Hu, Q.; Zhao, F.J.; Bank, M.S.; O’Connor, D.; Nriagu, J. Global soil pollution by toxic metals threatens agriculture and human health. Science 2025, 388, 316–321. [Google Scholar] [CrossRef]
- Zhou, B.; Liao, Y.; Zheng, X.; Wang, Z.; Li, Q.; Chen, M. The effects of amendments on Cd and Pb under different fertilizer application conditions. Sci. Rep. 2025, 15, 5385. [Google Scholar] [CrossRef]
- Zhao, R.; Lin, S.; Han, M.; Lin, Z.; Yu, M.; Zhang, B.; Ma, L.; Li, D.; Peng, L. Association between machine learning-assisted heavy metal exposures and diabetic kidney disease: a cross-sectional survey and Mendelian randomization analysis. Front. Public Health 2024, 12, 1367061. [Google Scholar] [CrossRef]
- Wang, R.; Long, T.; He, J.; Xu. Y.; Wei, Y.; Zhang, Y.; He, X.; He, M. Associations of multiple plasma metals with chronic kidney disease in patients with diabetes. Ecotoxicol. Environ. Saf. 2022, 244, 14048.
- Hagedoorn, I.J.M.; Gant, C.M.; Huizen, S.V.; Maatman, R.G.H.J.; Navis, G.; Bakker, S.J.L.; Laverman, G.D. Lifestyle-Related Exposure to Cadmium and Lead is Associated with Diabetic Kidney Disease. J. Clin. Med. 2020, 9, 2432. [Google Scholar] [CrossRef]
- Choudhury, T.R.; Zaman, S.Z.; Chowdhury, T.I.; Begum, B.A.; Islam, M.A.; Rahman, M.M. Status of metals in serum and urine samples of chronic kidney disease patients in a rural area of Bangladesh: An observational study. Heliyon 2021, 7, e08382. [Google Scholar] [CrossRef]
- Cai, L.; Yan, J.; Sun, L.; Dan, W. The independent and combined effects of blood heavy metal concentrations on all-cause mortality and cardiovascular mortality in adult patients with diabetes mellitus. Front. Public Health 2025, 13, 1588078. [Google Scholar] [CrossRef]
- Zhao, H.; Yin, R.; Wang, Y.; Wang, Z.; Zhang, L.; Xu, Y.; Wang, D.; Wu, J.; Wei, L.; Yang, L.; et al. Association between blood heavy metals and diabetic kidney disease among type 2 diabetic patients: A cross-sectional study. Sci. Rep. 2024, 14, 26823. [Google Scholar] [CrossRef] [PubMed]
- Barregard, L.; Bergström, G.; Fagerberg, B. Cadmium, type 2 diabetes, and kidney damage in a cohort of middle-aged women. Environ. Res. 2014, 135, 311–316. [Google Scholar] [CrossRef] [PubMed]
- Oosterwijk, M.M.; Hagedoorn, I.J.M.; Maatman, R.G.H.J.; Bakker, S.J.L.; Navis, G.; Laverman, G.D. Cadmium, active smoking and renal function deterioration in patients with type 2 diabetes. Nephrol. Dial. Transplant. 2023, 38, 876–883. [Google Scholar] [CrossRef]
- Phelps, K. R.; Yimthiang, S.; Pouyfung, P.; Khamphaya, T.; Vesey, D. A.; Satarug, S. Homeostasis of β2-microglobulin in diabetics and non-diabetics with modest cadmium intoxication. J. Environ. Expo. Assess. 2025, 4, 23. [Google Scholar] [CrossRef]
- Yimthiang, S.; Pouyfung, P.; Khamphaya, T.; Kuraeiad, S.; Wongrith, P.; Vesey, D.A.; Gobe, G.C.; Satarug, S. Effects of Environmental Exposure to Cadmium and Lead on the Risks of Diabetes and Kidney Dysfunction. Int. J. Environ. Res. Public Health 2022, 19, 2259. [Google Scholar] [CrossRef]
- Zhang, Y.; Peng, G.; Leng, W.; Li, Y.; Li, H.; Zhou, L.; Ge, L.; Shao, J.; Li, X.; Long, M. Association between serum β2-microglobulin and left ventricular hypertrophy in patients with type 2 diabetes mellitus: A cross-sectional study. J. Diabetes 2024, 16, e13599. [Google Scholar] [CrossRef]
- Cheung, C.L.; Lam, K.S.; Cheung, B.M. Serum beta-2 microglobulin predicts mortality in people with diabetes. Eur. J. Endocrinol. 2013, 169, 1–7. [Google Scholar] [CrossRef]
- Kim, M.K.; Yun, K.J.; Chun, H.J.; Jang, E.H.; Han, K.D.; Park, Y.M.; Baek, K.H.; Song, K.H.; Cha, B.Y.; Park, C.S.; et al. Clinical utility of serum beta-2-microglobulin as a predictor of diabetic complications in patients with type 2 diabetes without renal impairment. Diabetes Metab. 2014, 40, 459–465. [Google Scholar] [CrossRef]
- Huan, T.; Meng, Q.; Saleh, M.A.; Norlander, A.E.; Joehanes, R.; Zhu, J.; Chen, B.H.; Zhang, B.; Johnson, A.D.; Ying, S.; et al. Integrative network analysis reveals molecular mechanisms of blood pressure regulation. Mol. Syst. Biol. 2015, 11, 799. [Google Scholar] [CrossRef]
- Keefe, J.A.; Hwang, S.J.; Huan, T.; Mendelson, M.; Yao, C.; Courchesne, P.; Saleh, M.A.; Madhur, M.S.; Levy, D. Evidence for a causal role of the SH2B3-β2M axis in blood pressure regulation. Hypertension 2019, 73, 497–503. [Google Scholar] [CrossRef] [PubMed]
- Pandey, K.N. Genetic and Epigenetic Mechanisms Regulating Blood Pressure and Kidney Dysfunction. Hypertension 2024, 81, 1424–1437. [Google Scholar] [CrossRef] [PubMed]
- Xu, R.; Tan, X.; Li, T.; Liu, S.; Li, Y.; Li, H. Norepinephrine-induced AuPd aerogels with peroxidase- and glucose oxidase-like activity for colorimetric determination of glucose. Mikrochim. Acta 2021, 188, 362. [Google Scholar] [CrossRef]
- Apple, F.; Bandt, C.; Prosch, A.; Erlandson, G.; Holmstrom, V.; Scholen, J.; Googins, M. Creatinine clearance: Enzymatic vs Jaffé determinations of creatinine in plasma and urine. Clin. Chem. 1986, 32, 388–390. [Google Scholar] [CrossRef] [PubMed]
- Trzcinka-Ochocka, M.; Brodzka, R.; Janasik, B. Useful and Fast Method for Blood Lead and Cadmium Determination Using ICP-MS and GF-AAS; Validation Parameters. J. Clin. Lab. Anal. 2016, 30, 130–139. [Google Scholar] [CrossRef]
- Hornung, R.W.; Reed, L.D. Estimation of average concentration in the presence of nondetectable values. Appl. Occup. Environ. Hyg. 1990, 5, 46–51. [Google Scholar] [CrossRef]
- Phelps, K.R.; Gosmanova, E.O. A generic method for analysis of plasma concentrations. Clin. Nephrol. 2020, 94, 43–49. [Google Scholar] [CrossRef] [PubMed]
- Grandjean, P.; Budtz-Jørgensen, E. Total imprecision of exposure biomarkers: Implications for calculating exposure limits. Am. J. Ind. Med. 2007, 50, 712–719. [Google Scholar] [CrossRef]
- Satarug, S.; Vesey, D. A.; Buha Đorđević, A. Use of Urinary β2-Microglobulin in the Assessment of the Health Risk from Environmental Cadmium Exposure. Preprints 2025, 2025092442. [Google Scholar] [CrossRef]
- Levey, A.S.; Becker, C.; Inker, L.A. Glomerular filtration rate and albuminuria for detection and staging of acute and chronic kidney disease in adults: A systematic review. JAMA 2015, 313, 837–846. [Google Scholar] [CrossRef]
- Preacher, K.J. Advances in mediation analysis: A survey and synthesis of new developments. Annu. Rev. Psychol. 2015, 66, 825–852. [Google Scholar] [CrossRef]
- MacKinnon, D.P.; Warsi, G.; Dwyer, J.H. A simulation study of mediated effect measures. Multiv. Behav. Res. 1995, 30, 41–62. [Google Scholar] [CrossRef]
- Preacher, K.J.; Hayes, A.F. SPSS and SAS procedures for estimating indirect effects in simple mediation models. Behav. Res. Meth. Instrum. Comput. 2004, 36, 717–731. [Google Scholar] [CrossRef] [PubMed]
- Little, B.B.; Reilly, R.; Walsh, B.; Vu, G.T. Cadmium is associated with type 2 diabetes in a Superfund Site Lead Smelter community in Dallas, Texas. Int. J. Environ. Res. Public Health 2020, 17, 4558. [Google Scholar] [CrossRef] [PubMed]
- Reilly, R.; Spalding, S.; Walsh, B.; Wainer, J.; Pickens, S.; Royster, M.; Villanacci, J.; Little, B.B. Chronic environmental and occupational lead exposure and kidney function among African Americans: Dallas Lead Project II. Int. J. Environ. Res. Public Health 2018, 15, 2875. [Google Scholar] [CrossRef]
- Son, H.S.; Kim, S.G.; Suh, B.S.; Park, D.U.; Kim, D.S.; Yu, S.D.; Hong, Y.S.; Park, J.D.; Lee, B.K.; Moon, J.D.; et al. Association of cadmium with diabetes in middle-aged residents of abandoned metal mines: The first health effect surveillance for residents in abandoned metal mines. Ann. Occup. Environ. Med. 2015, 27, 20. [Google Scholar] [CrossRef]
- Argyropoulos, C.P.; Chen, S.S.; Ng, Y.-H.; Roumelioti, M.-E.; Shaffi, K.; Singh, P.P.; Tzamaloukas, A.H. Rediscovering Beta-2 Microglobulin As a Biomarker across the Spectrum of Kidney Diseases. Front. Med. 2017, 4, 73. [Google Scholar] [CrossRef] [PubMed]
- Buchet, J.P.; Lauwerys, R.; Roels, H.; Bernard, A.; Bruaux, P.; Claeys, F.; Ducoffre, G.; de Plaen, P.; Staessen, J.; Amery, A.; et al. Renal effects of cadmium body burden of the general population. Lancet 1990, 336, 699–702. [Google Scholar] [CrossRef]
- Satarug, S.; Vesey, D. A.; Đorđević A., B. The NOAEL equivalent for the cumulative body burden of cadmium: focus on proteinuria as an endpoint. J. Environ. Expo. Assess. 2024, 3, 26. [Google Scholar] [CrossRef]
Scheme 1.
A simple mediation model for cause-effect relationship inference. The unstandardized β coefficients and the Sobel test for the indirect effect of the independent variable (a), the standardized β coefficients for the direct and mediating effects of the independent variable (b). IV, independent variable; DV, dependent variable.
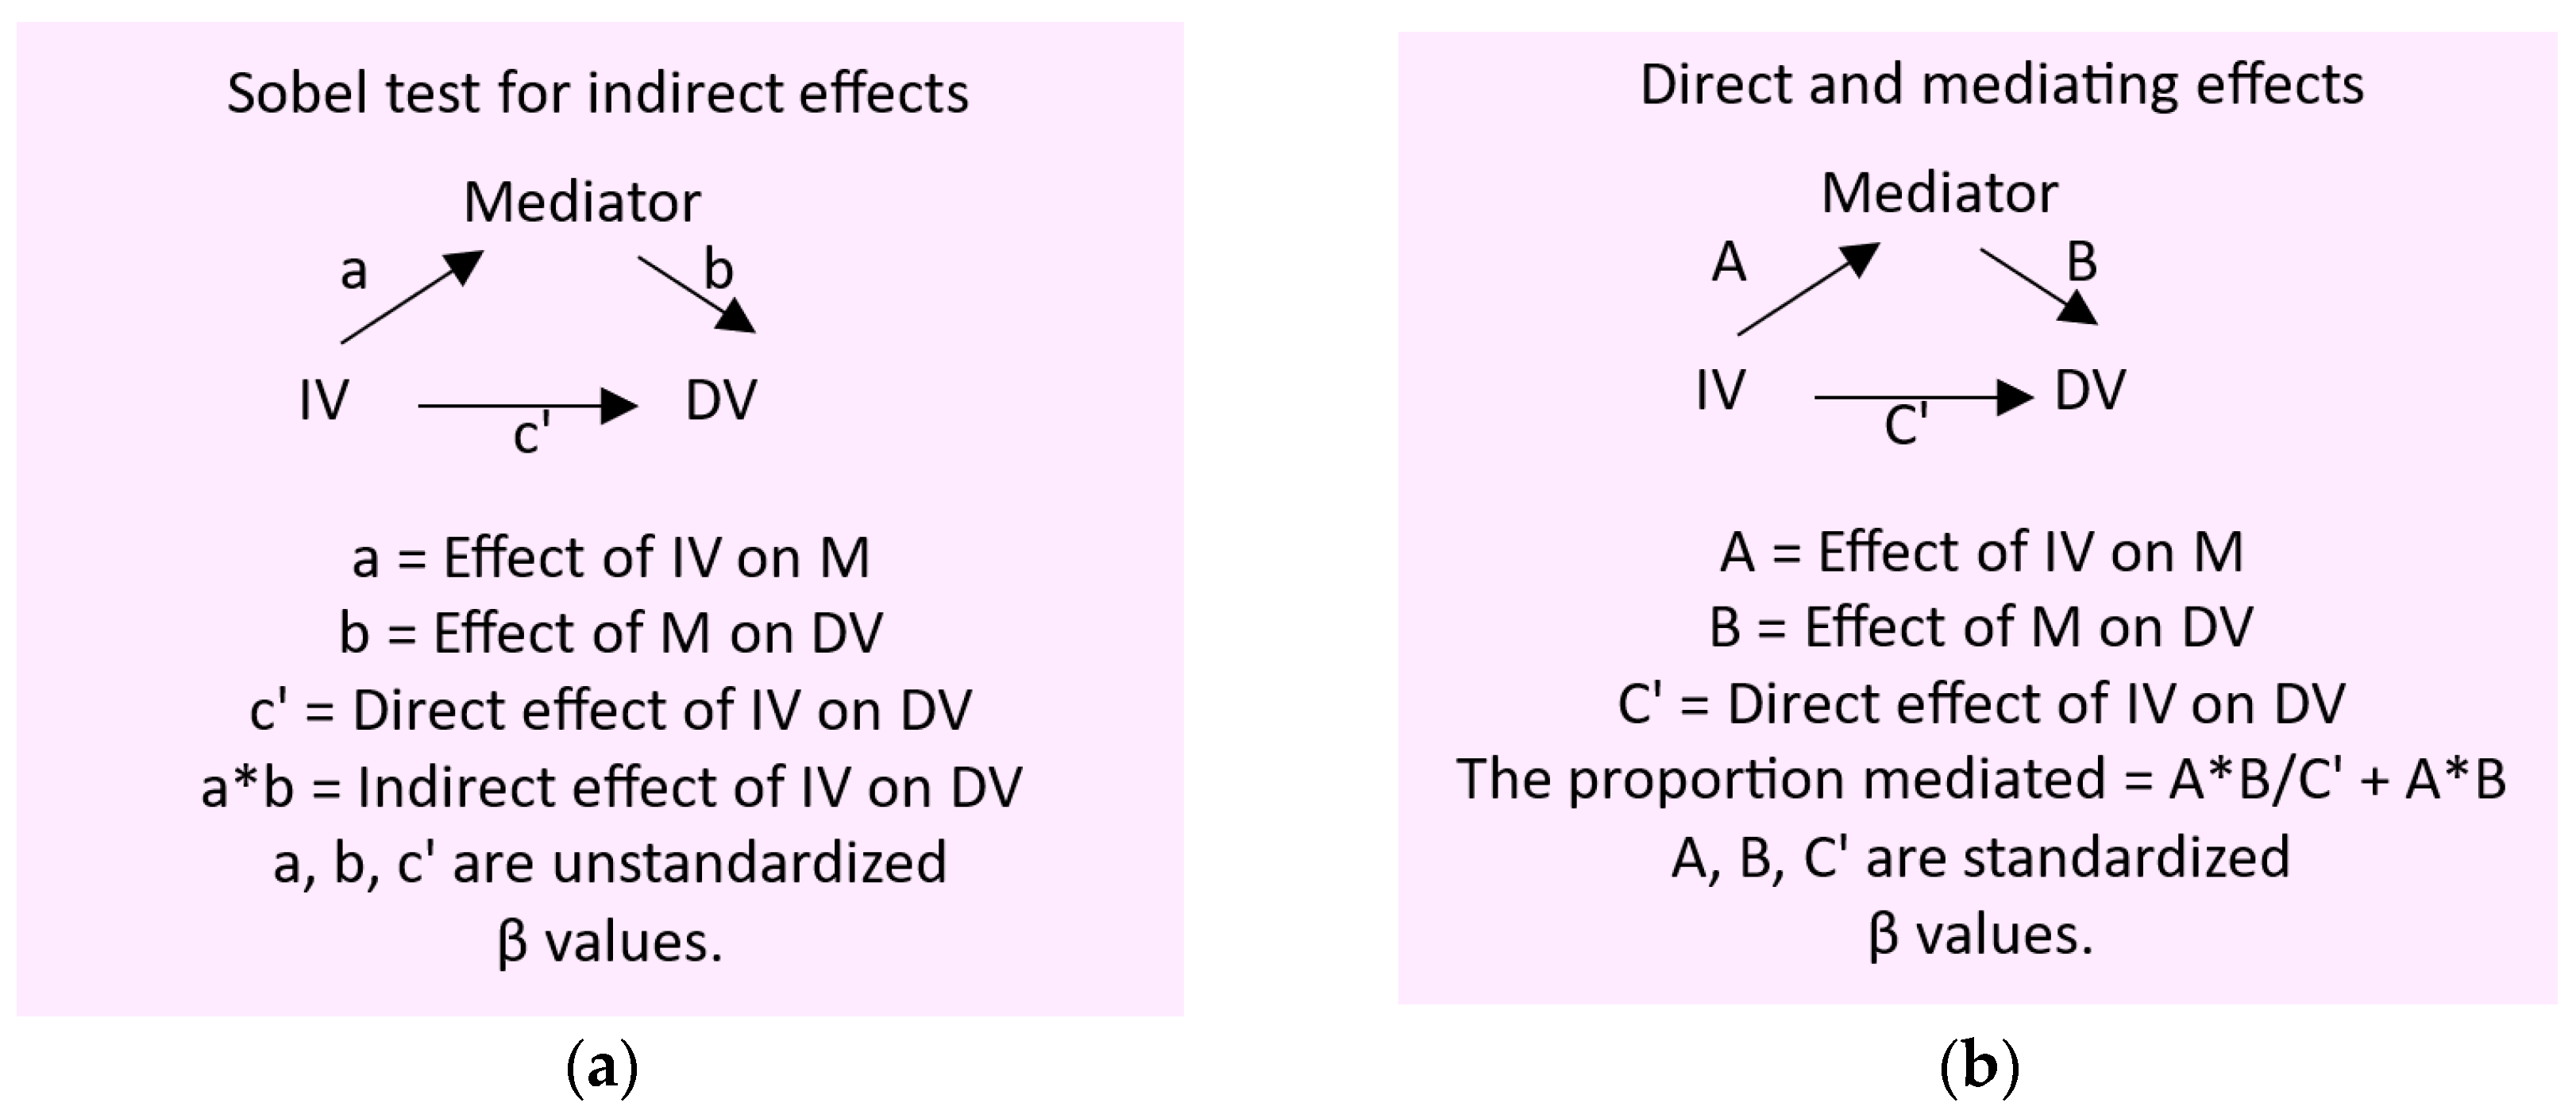
Figure 1.
Boxplot distributions of β2M homeostasis parameters in subjects grouped by Cd/Pb exposure levels. Boxplots of data on Fβ2M (A), TDβ2M/Ccr (B), FrTDβ2M (C) and Eβ2M/Ccr (D) in subjects with Cd/Pb exposure levels 1, 2 and 3, respectively. Each box represents the 25th and 75th percentile values of the variable indicated on the x-axis. A horizontal line inside each box represents the median. Circles and asterisks represent outliers.
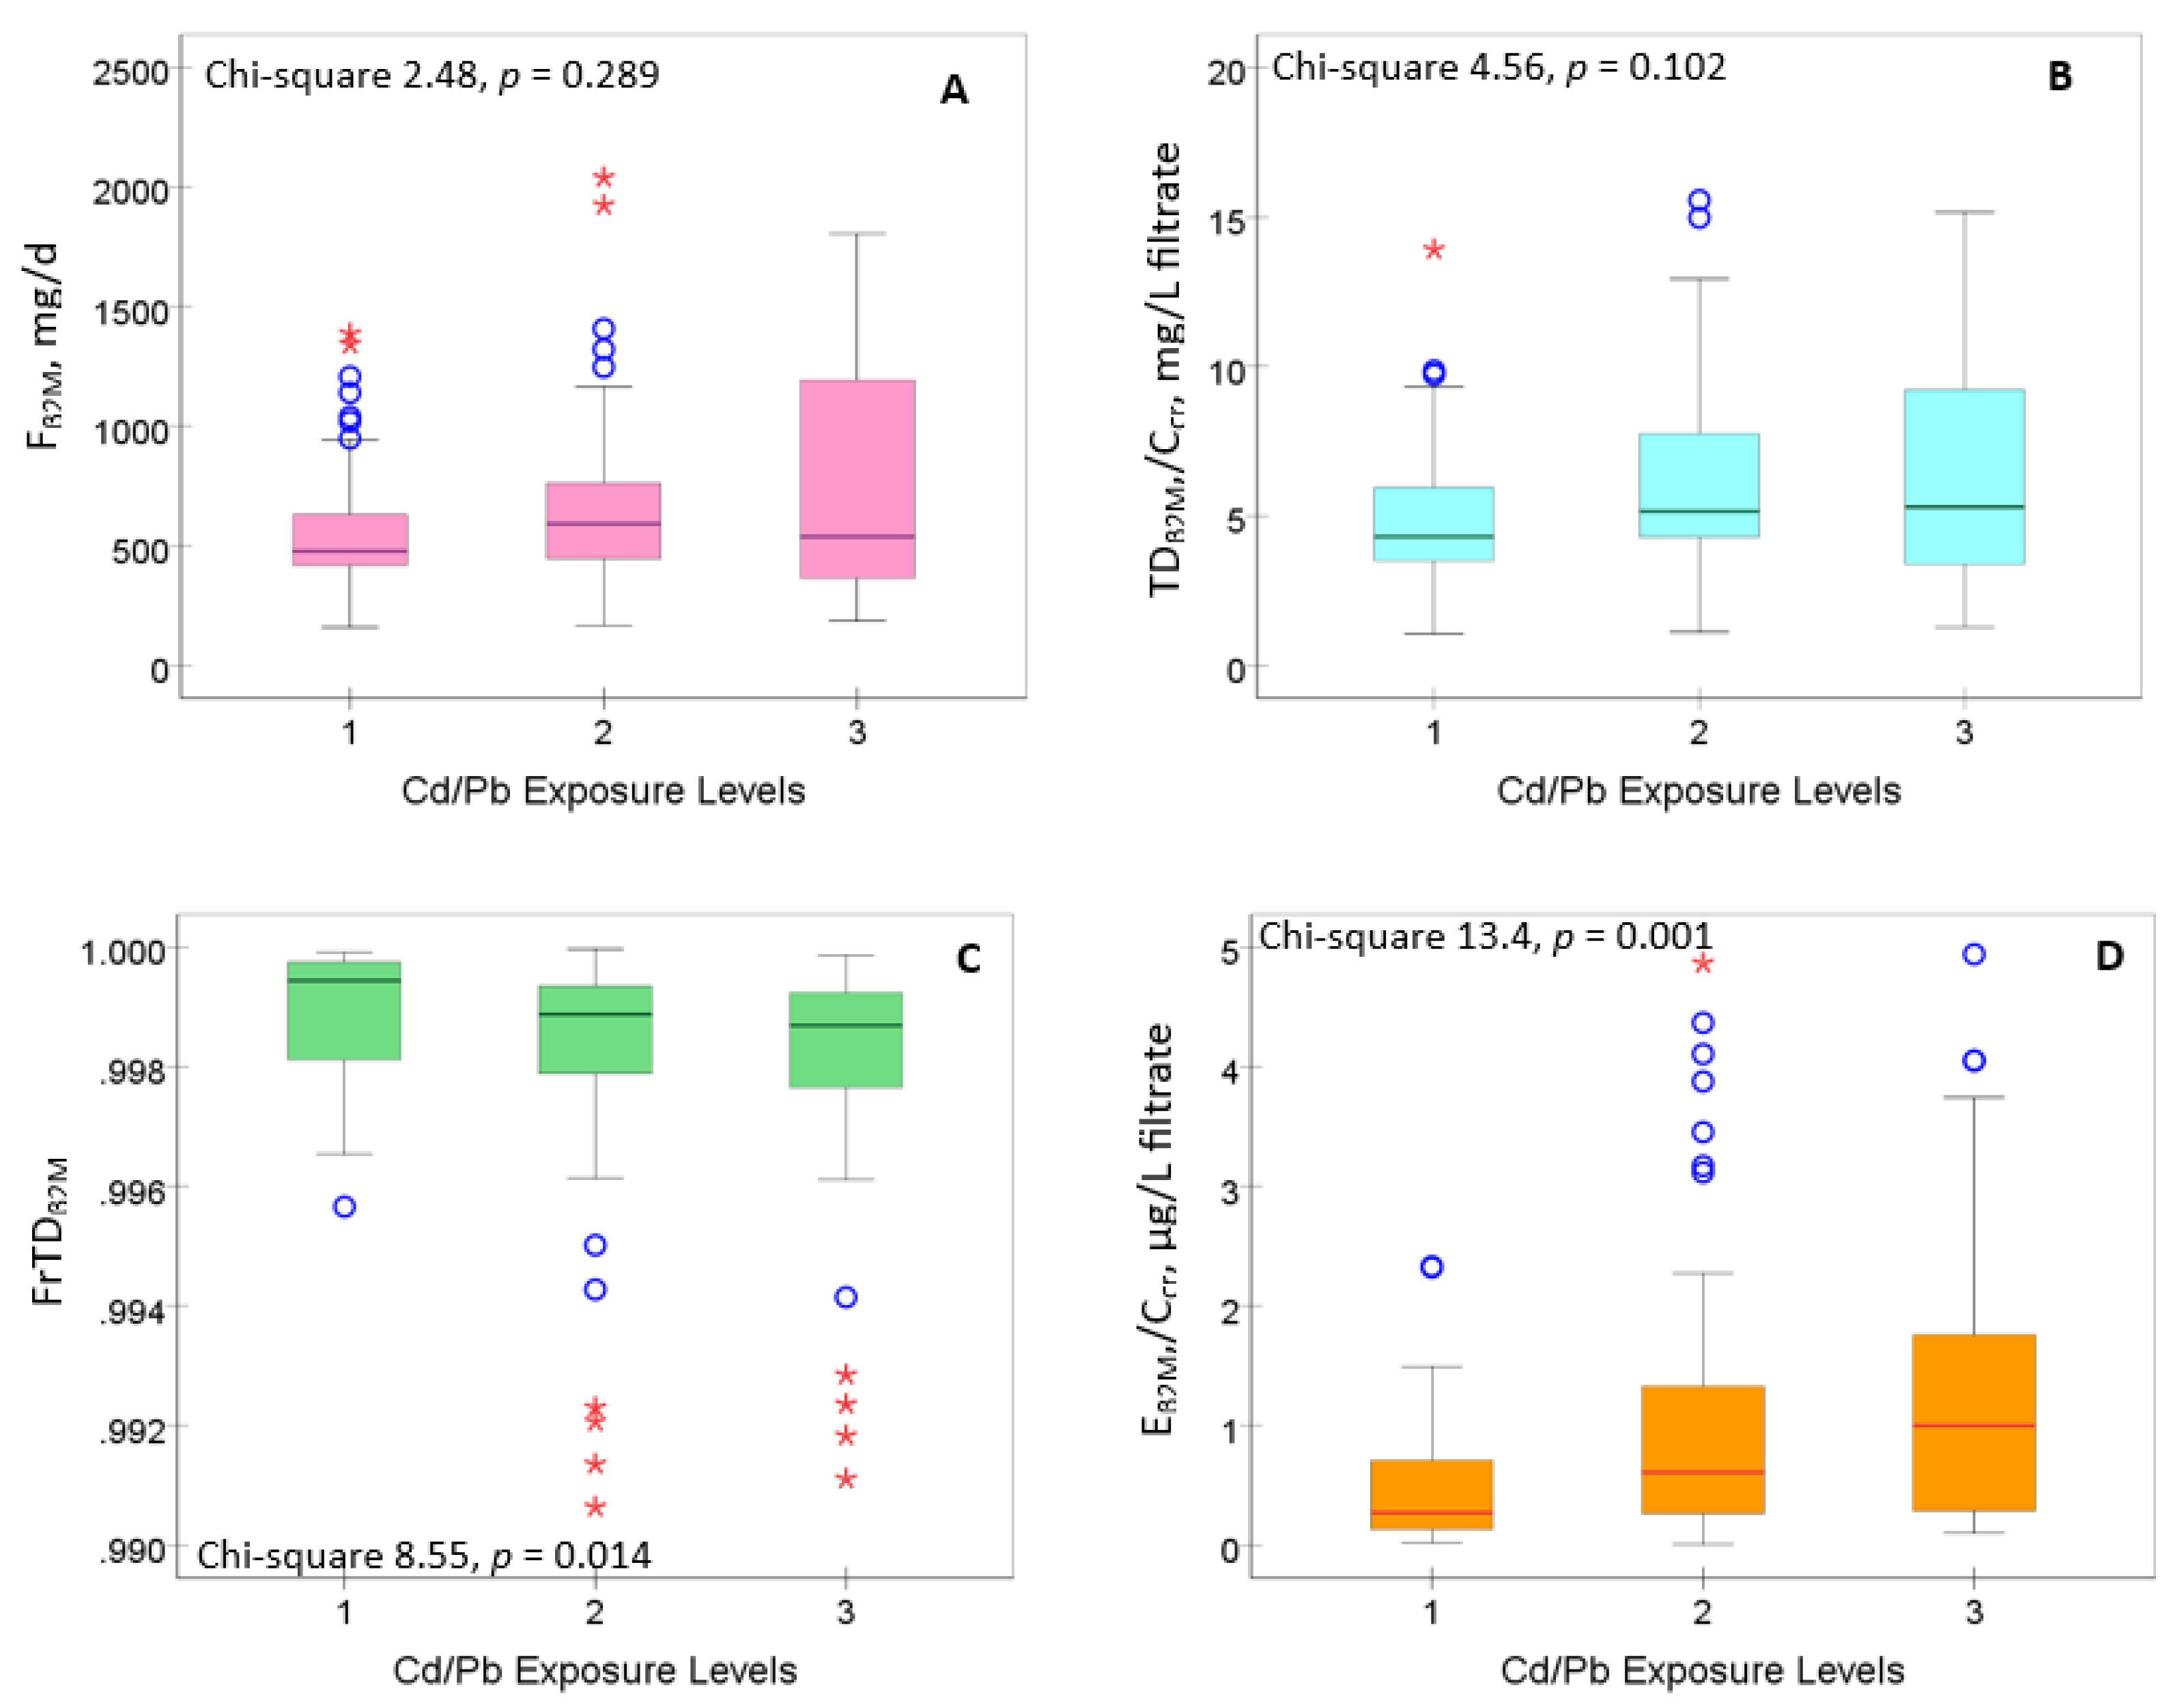
Figure 2.
Reduction in fractional tubular degradation of β2M as a function of NAG excretion rates. Scatterplots related FrTDβ2M to ENAG/Ccr in subjects in subjects with and without diagnosed diabetes (a) those with FPG <110 and ≥ 110 mg/dL (b). FrTDβ2M; fractional tubular degradation of β2M; NAG, N-acetly- β-D-glucosaminidase; ENAG, urinary excretion of NAG; FPG, fasting plasma glucose concentration; Cd, cadmium; ECd, urinary excretion of Cd.
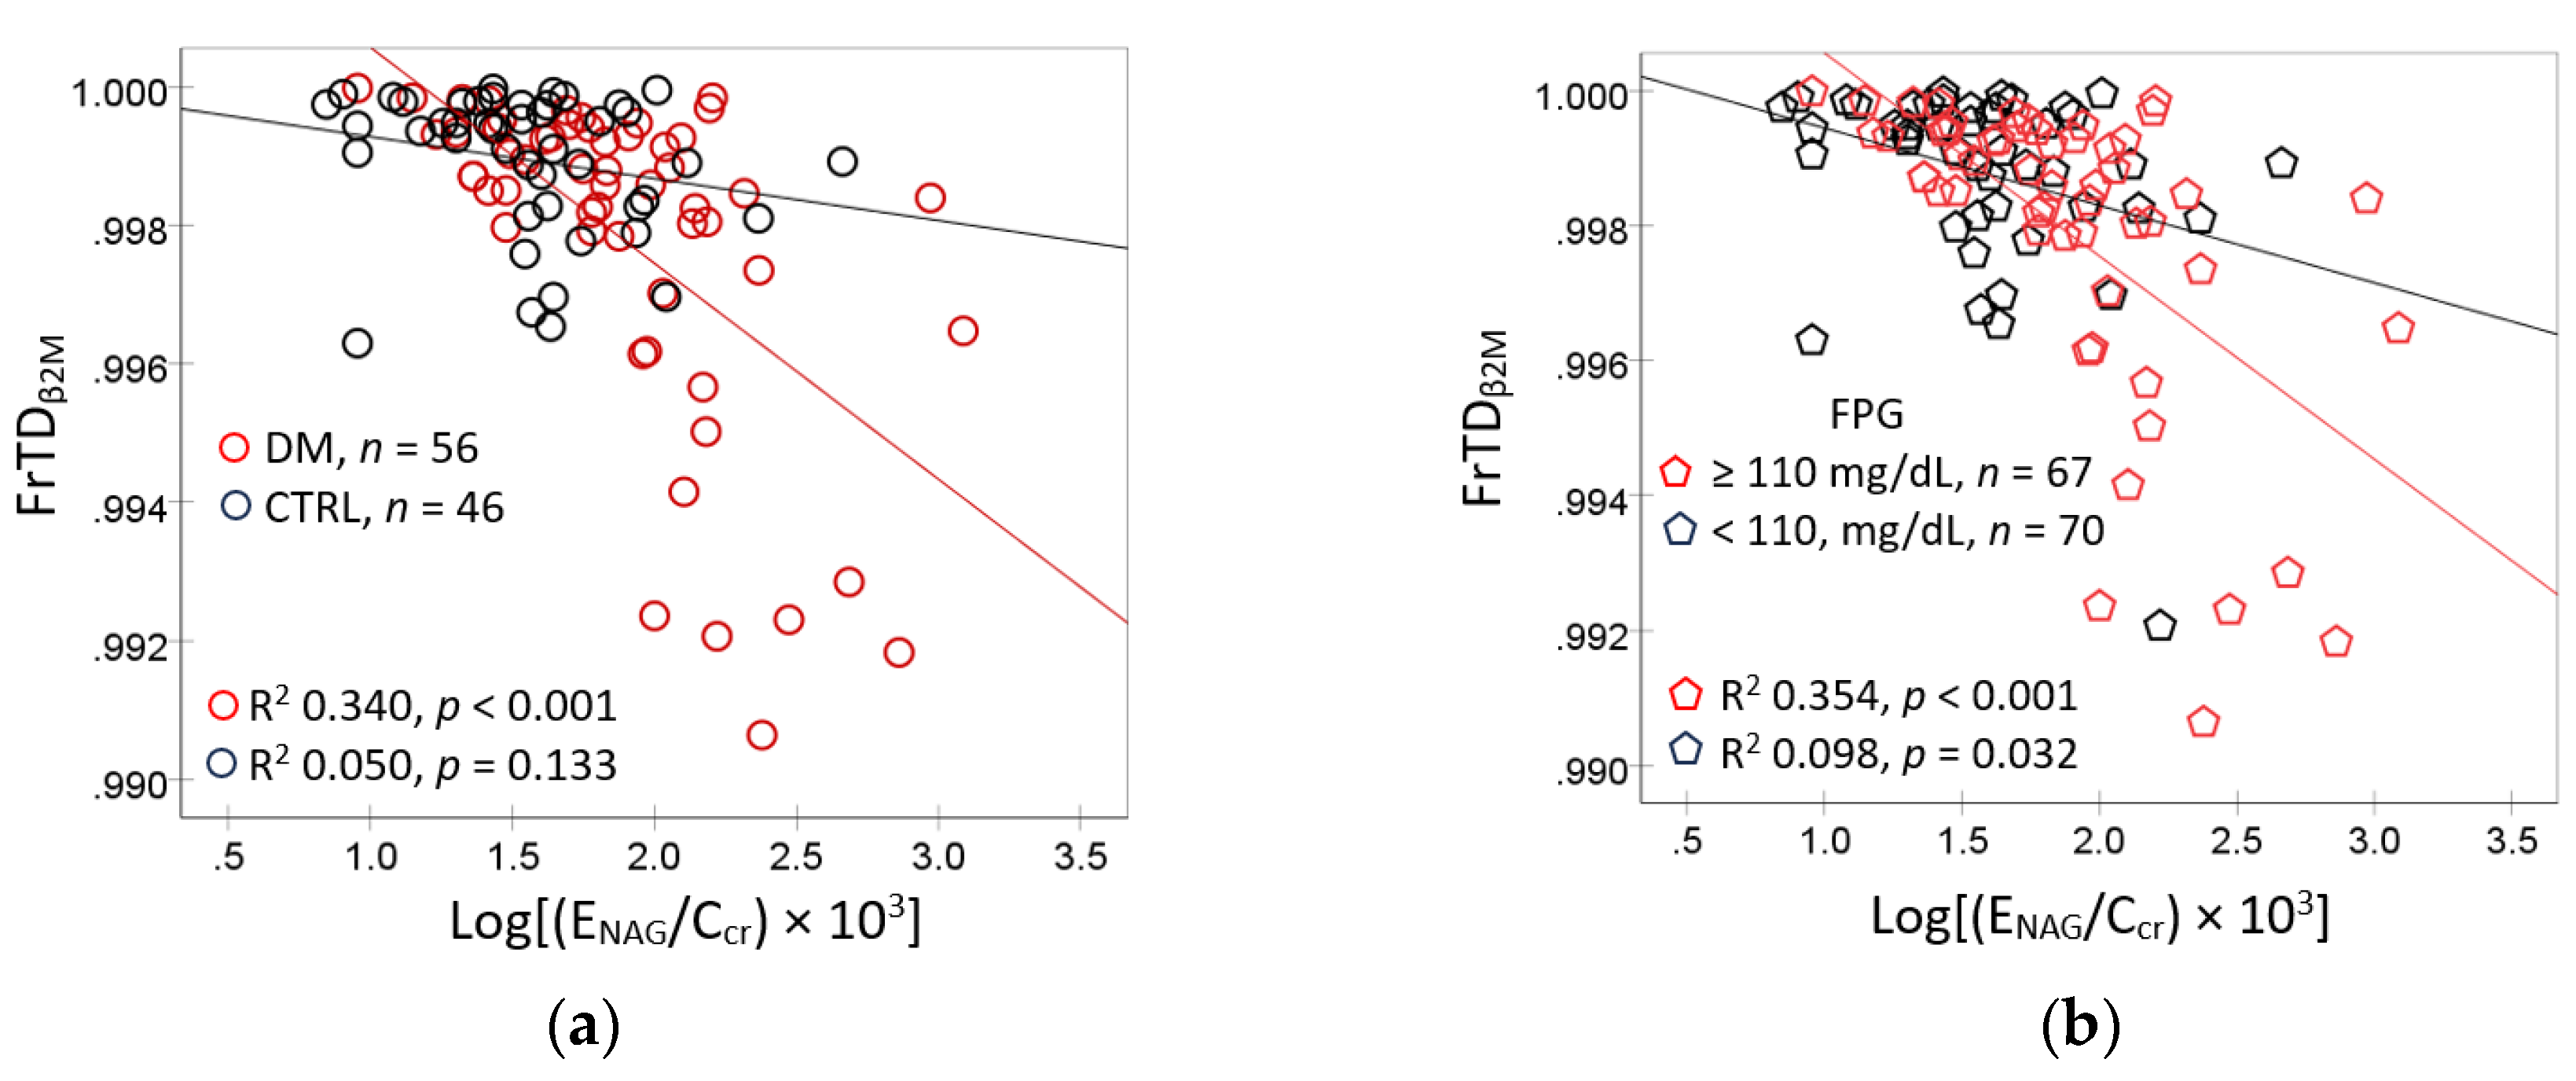
Figure 3.
NAG excretion rates as a function of Cd excretion rates. Scatterplots related ENAG/Ccr to ECd/Ccr in subjects with and without diabetes (a) those with FPG <110 and ≥ 110 mg/dL (b). NAG, N-acetly- β-D-glucosaminidase; ENAG, urinary excretion of NAG; FPG, fasting plasma glucose concentration; Cd, cadmium; ECd, urinary excretion of Cd.
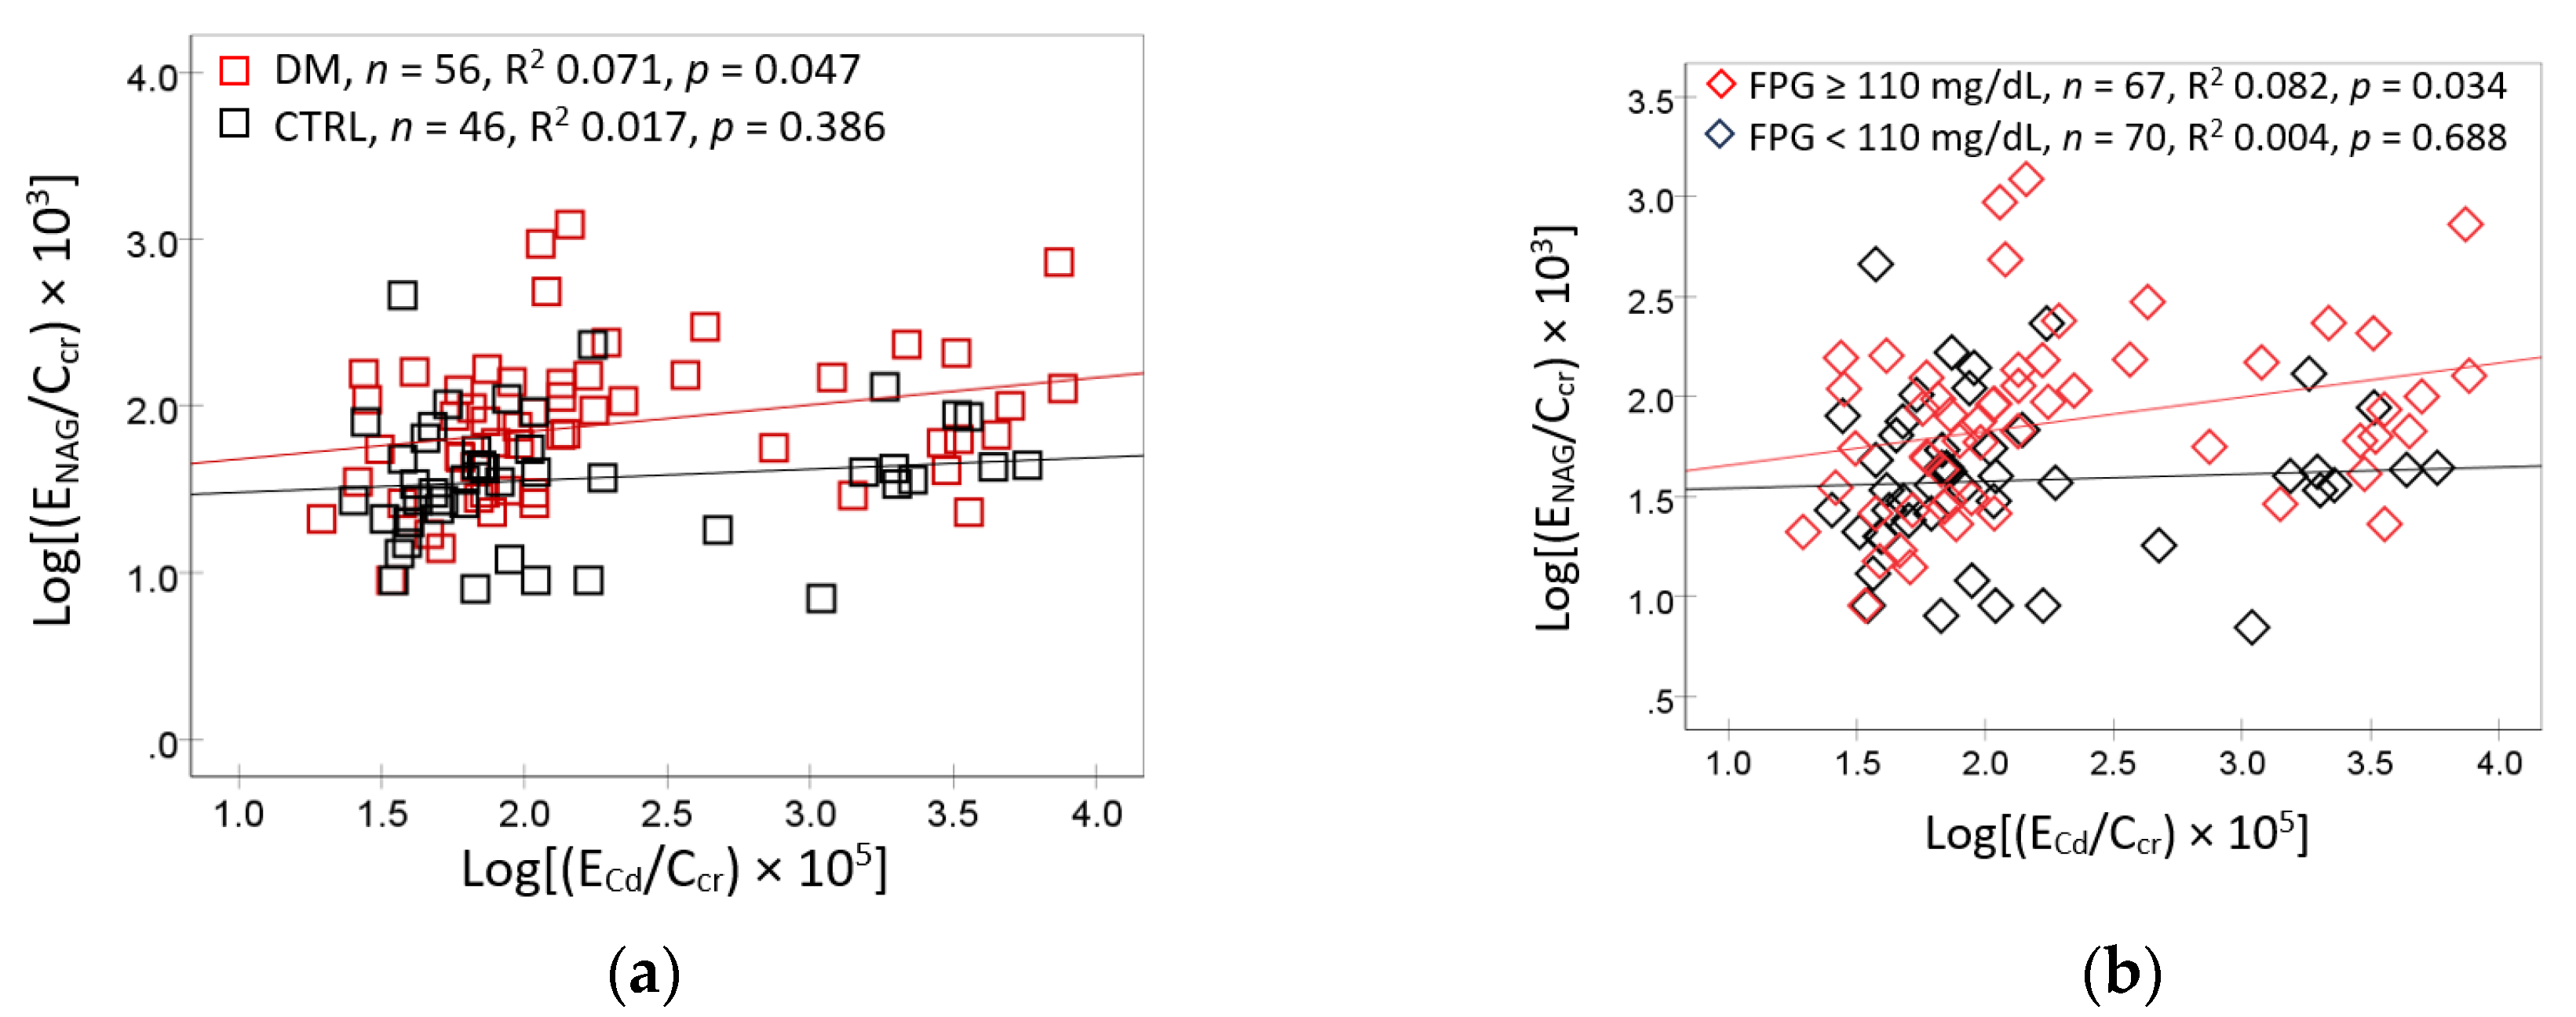
Figure 4.
Kidney tubular cell injury as the mediator of Cd effect on β2M degradation. A mediating effect of Cd on FrTDβ2M by ENAG and the Sobel test (a) the proportion of the effect of Cd mediated by ENAG (b). ENAG, excretion of NAG; FrTDβ2M, fractional tubular degradation of β2M.
Figure 4.
Kidney tubular cell injury as the mediator of Cd effect on β2M degradation. A mediating effect of Cd on FrTDβ2M by ENAG and the Sobel test (a) the proportion of the effect of Cd mediated by ENAG (b). ENAG, excretion of NAG; FrTDβ2M, fractional tubular degradation of β2M.
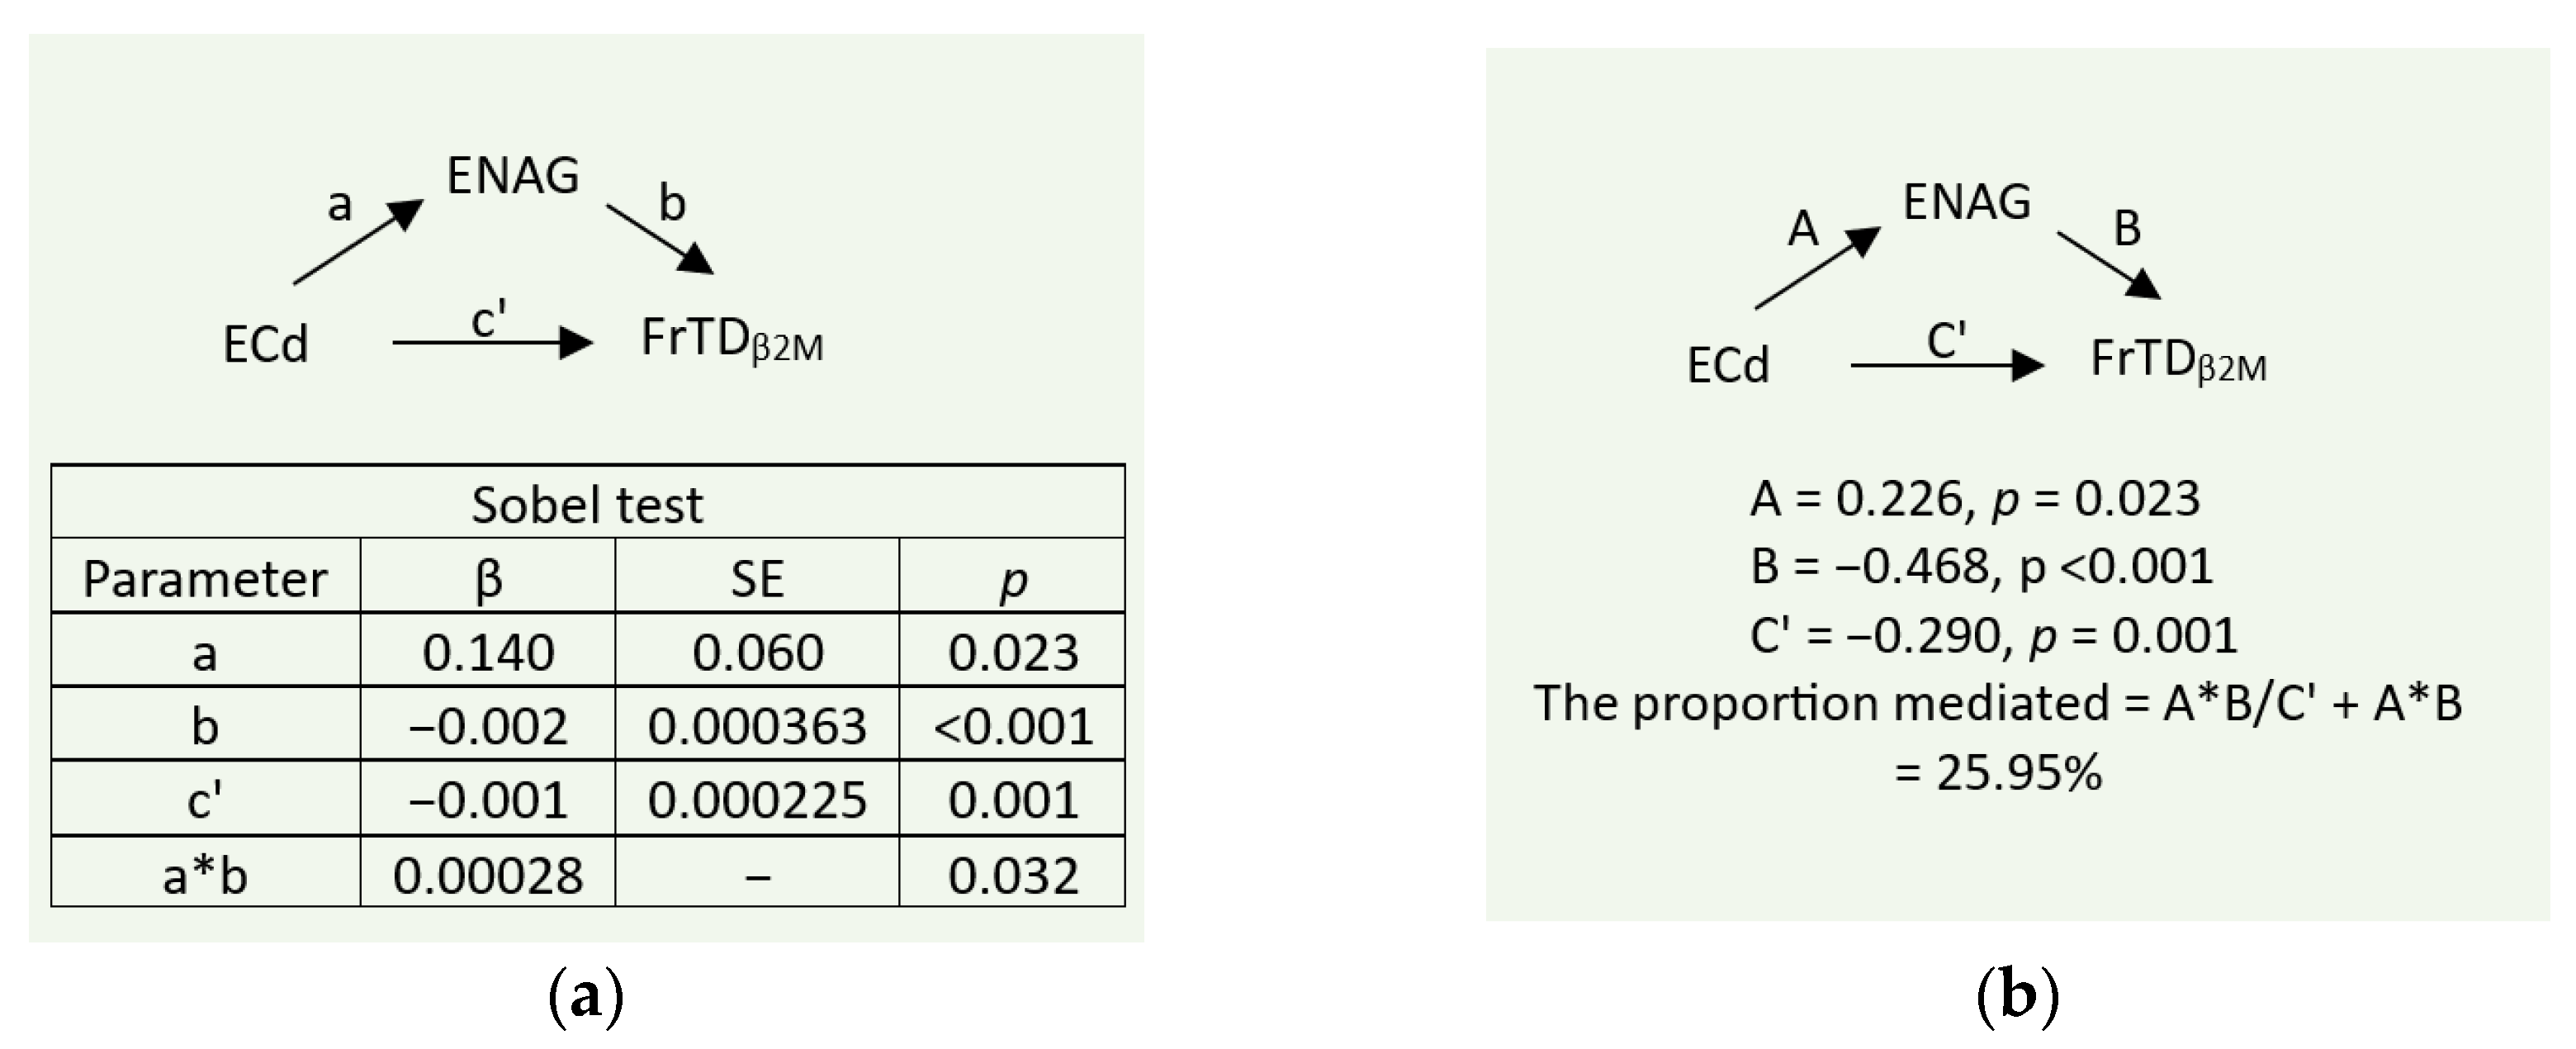
Figure 5.
Kidney tubular cell dysfunction as the mediator of Cd effects. The mediating effect of Cd on eGFR (a) and FPG (b) together with the Sobel test. FrTDβ2M, fractional tubular degradation of β2M; eGFR, estimated glomerular filtration rate; FPG, fasting plasma glucose fractional tubular degradation of β2M.
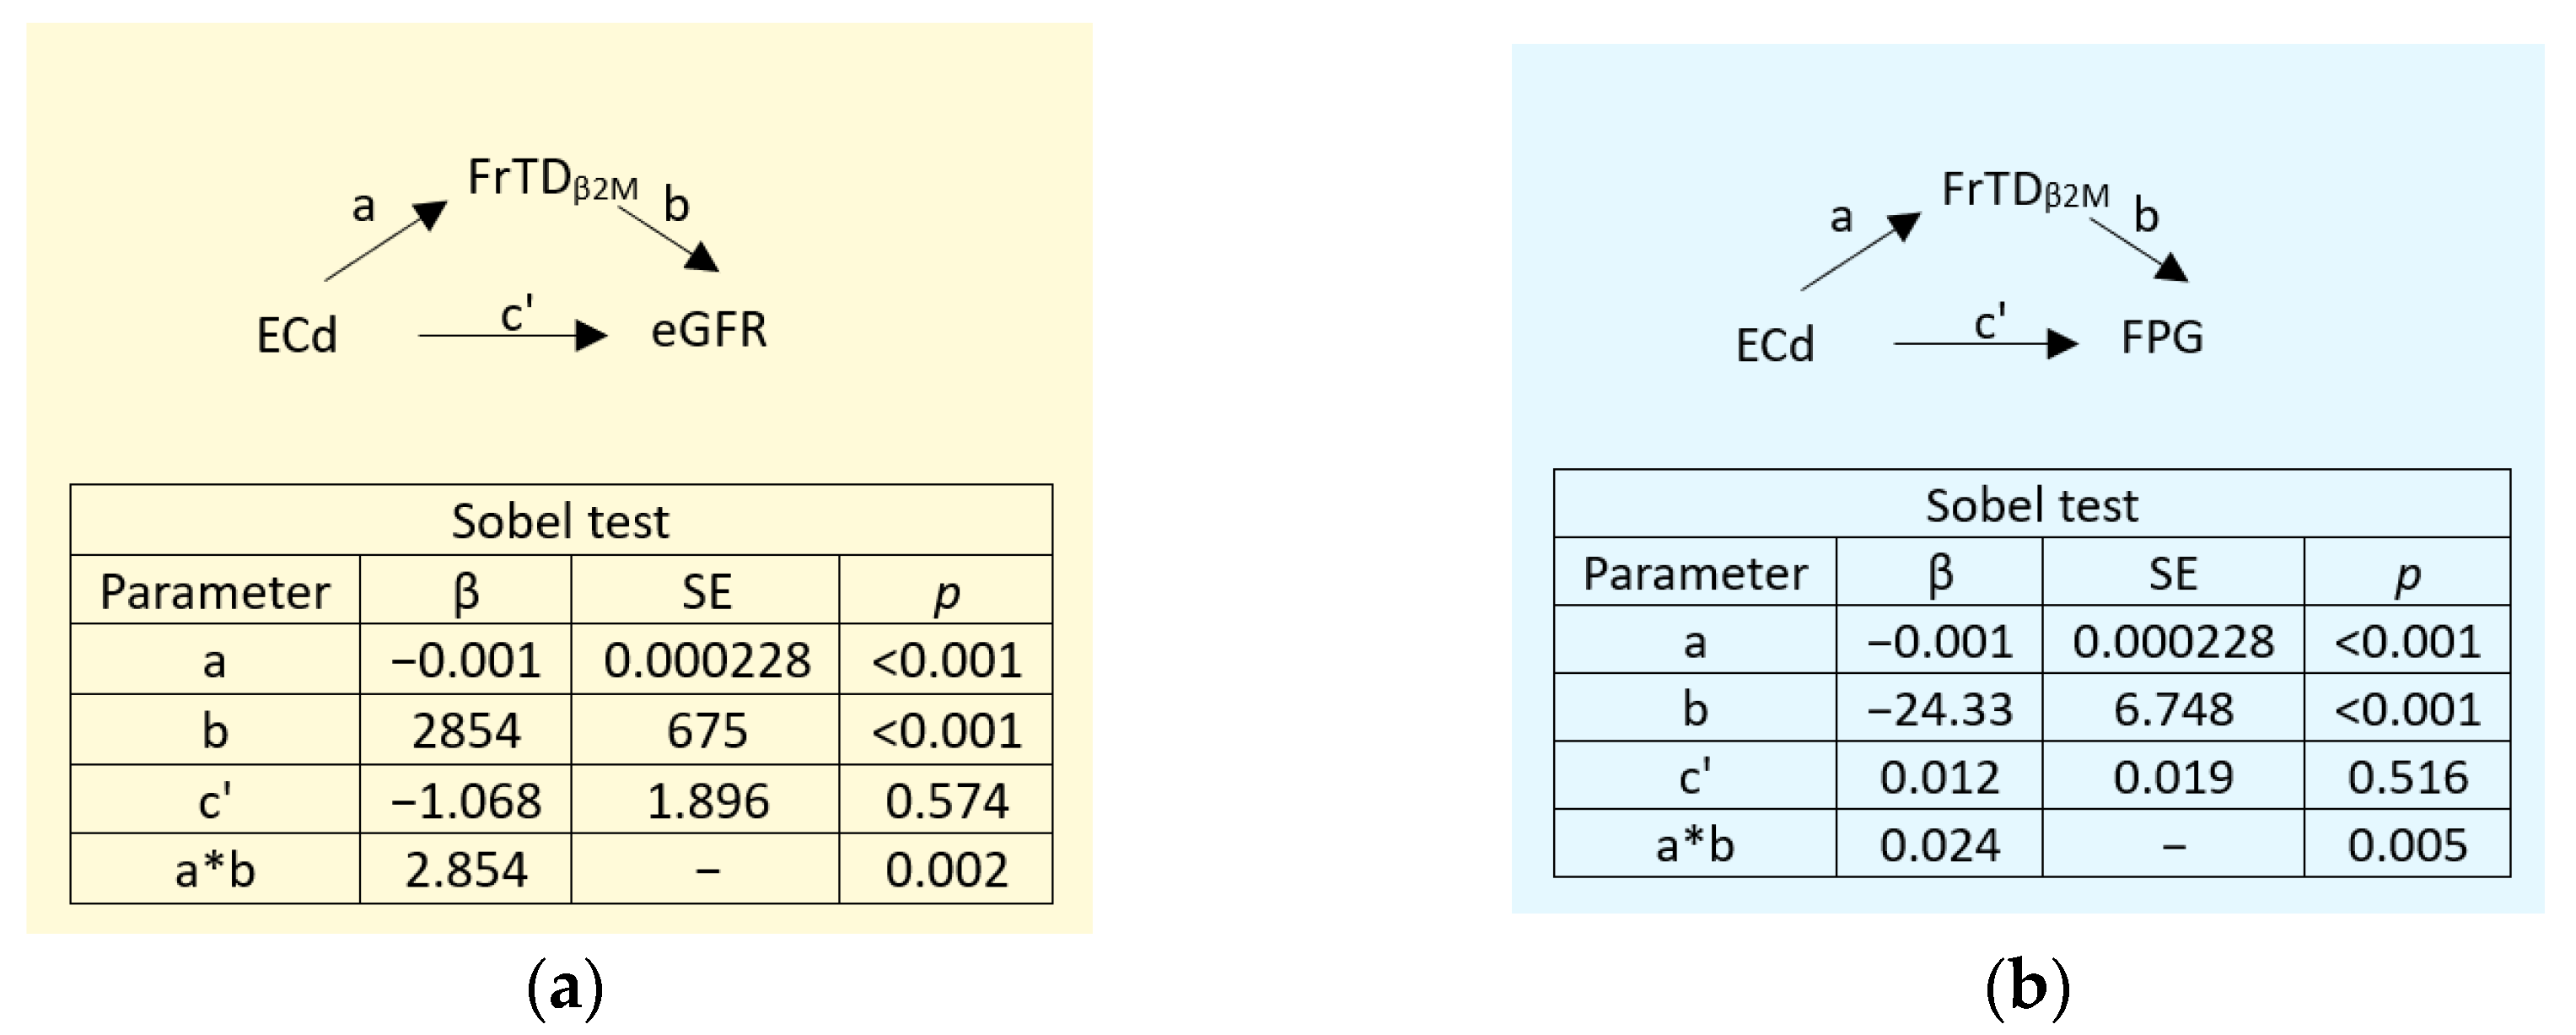

Table 1.
Descriptive data on study subjects according to Cd and Pb exposure levels.
| Variables | All Subjects n = 137 |
Cd/Pb Exposure Levels | p | ||
|---|---|---|---|---|---|
| Level 1 n = 44 |
Level 2 n = 54 |
Level 3 n = 39 |
|||
| Women, % | 78.1 | 90.9 | 72.2 | 71.8 | 0.045 |
| Smoking, % | 10.2 | 0 | 9.3 | 23.1 | 0.002 |
| Diagnosed diabetes, % | 47.4 | 34.1 | 46.3 | 64.1 | 0.023 |
| Hypertension, % | 54.5 | 51.2 | 44.4 | 71.8 | 0.029 |
| Age (range), years | 59.7 (41−80) | 59.6 (42−80) | 59.8 (45−78) | 59.5 (41−78) | 0.994 |
| BMI, kg/m2 | 25.6 (4.8) | 25.6 (4.2) | 25.4 (4.0) | 25.9 (6.2) | 0.805 |
| FPG, mg/dL | 129 (61) | 115 (40) | 131 (73) | 143 (59) | 0.099 |
| FPG ≥ 110 mg/dL, % | 48.9 | 38.6 | 48.1 | 61.5 | 0.115 |
| FPG ≥ 126 mg/dL, % | 39.4 | 29.5 | 35.2 | 56.4 | 0.031 |
| eGFR, mL/min/1.73 m2 | 79 (16) | 81 (15) | 77 (16) | 80 (18) | 0.461 |
| a Low eGFR, % | 12.4 | 9.1 | 16.7 | 10.3 | 0.469 |
| [β2M]s, mg/L | 5.98 (3.29) | 5.01 (2.47) | 6.16 (3.12) | 6.83 (4.06) | 0.099 |
| [Pb]b, mg/dL | 4.49 (4.78) | 2.12 (0.00) | 4.65 (5.63) | 6.95 (5.00) | <0.001 |
| [Cd]b, µg/L | 0.57 (0.70) | 0.05 (0.05) | 0.60 (0.68) | 1.10 (0.73) | <0.001 |
| [Cd]u, µg/L | 0.65 (1.11) | 0.27 (0.69) | 0.59 (1.09) | 1.17 (1.33) | <0.001 |
| Ecr-normalized data | |||||
| ECd/Ecr, µg/g creatinine | 0.98 (1.86) | 0.33 (0.72) | 0.99 (2.06) | 1.70 (2.20) | 0.006 |
| Eβ2M/Ecr, µg/g creatinine | 108 (118) | 60 (58) | 116 (128) | 151 (136) | 0.002 |
| ENAG/Ecr, U/g creatinine | 10.6 (14.5) | 6.67 (4.93) | 11.6 (16.7) | 13.4 (17.6) | 0.288 |
| Ccr-normalized data | |||||
| ECd/Ccr, (µg/L filtrate) × 100 | 0.86 (1.68) | 0.28 (0.62) | 0.86 (1.78) | 1.50 (2.11) | 0.001 |
| Eβ2M/Ccr, (μg/L filtrate) × 100 | 99 (115) | 52 (56) | 108 (123) | 139 (134) | 0.001 |
| ENAG/Ccr, (U/L filtrate) × 100 | 10.2 (17.4) | 5.31 (4.03) | 10.6 (16.0) | 14.6 (24.5) | 0.154 |
eGFR, estimated glomerular filtration rate; a Low eGFR was defined as eGFR values ≤ 60 mL/min/1.73 m2; FPG, fasting plasma glucose; β2M, β2-microglobulin; Cd; cadmium; Pb, lead; [x]p, plasma concentration of x; [x]u, urine concentration of x; Ecr, creatinine excretion; Ccr, creatinine clearance; NAG, N-acetyl-β-D-glucosaminidase. Values for continuous variables are mean (standard deviation, SD). Data on NAG were from 102 subjects. All other data were from 137 subjects. The variability of continuous variables across Cd/Pb exposure levels 1,2 and 3 was assessed with the Kruskal-Wallis test. The distribution of categorial variables was assessed with Chi-square test. For all tests, p-values ≤ 0.05 indicate statistical significance.
Table 2.
Bivariate relationship analysis of the fractional tubular degradation of β2-microglobulin.
| Variables | Spearman’s rank correlation coefficient | ||||||
|---|---|---|---|---|---|---|---|
| FrTDβ2M | Age | BMI | eGFR | FPG | ECd/Ccr | ENAG/Ccr | |
| Age | −0.096 | ||||||
| BMI | 0.048 | −0.262** | |||||
| eGFR | 0.434** | −0.356** | 0.161 | ||||
| FPG | −0.215* | −0.222** | 0.184* | 0.089 | |||
| ECd/Ccr | −0.527** | 0.078 | −0.083 | −0.227** | 0.166 | ||
| ENAG/Ccr | −0.536** | −0.115 | 0.002 | −0.467** | 0.278** | 0.328** | |
| Cd/Pb exposure a | −0.249** | 0.009 | −0.012 | −0.013 | 0.181* | 0.301** | 0.165 |
FrTDβ2M, fractional tubular degradation of β2-microglobulin; BMI, body mass index; eGFR, estimated glomerular filtration rate FPG, fasting plasma glucose concentration. a Cd/Pb exposure was categorized as Cd/Pb exposure level 1, 2 or 3 using the median blood Cd of 0.3 µg/L and median blood Pb of 2.12 µg/dL. Subjects with blood Cd or blood Pb below median, blood Cd or blood Pb above its median, and blood Cd and blood Pb levels above medians were classed as Cd/Pb exposure level 1, 2 and 3, respectively. * Significant correlation at the 0.05 level. ** Significant correlation at the 0.01 level.
Table 3.
Multiple linear regression of FrTDβ2M in subjects with and without diabetes.
| Independent Variables |
FrTDβ2M | |||||
|---|---|---|---|---|---|---|
| All, n = 137 | Diabetes, n = 72 | Controls, n = 65 | ||||
| β | p | β | p | β | p | |
| Age, years | −0.009 | 0.913 | 0.095 | 0.483 | −0.079 | 0.513 |
| BMI, kg/m2 | 0.082 | 0.300 | 0.123 | 0.300 | 0.082 | 0.471 |
| eGFR, mL/min/1.73 m2 | 0.372 | <0.001 | 0.476 | <0.001 | 0.360 | 0.003 |
| (ECd/Ccr) ×100, µg/L filtrate | −0.189 | 0.013 | −0.295 | 0.009 | −0.102 | 0.383 |
| Diagnosed diabetes | −0.222 | 0.021 | − | − | − | − |
| Gender | 0.057 | 0.544 | 0.036 | 0.790 | 0.140 | 0.337 |
| Smoking | −0.016 | 0.866 | 0.021 | 0.877 | −0.085 | 0.559 |
| Hypertension | 0.052 | 0.492 | 0.172 | 0.113 | −0.239 | 0.053 |
| FPG, mg/dL | −0.258 | 0.007 | −0.220 | 0.055 | 0.247 | 0.033 |
| Adjusted R2 | 0.311 | <0.001 | 0.301 | <0.001 | 0.215 | 0.003 |
FrTDβ2M, fractional tubular degradation of β2M; BMI, body mass index; eGFR, estimated glomerular filtration rate; β, standardized regression coefficient; adjusted R2, coefficient of determination. β indicates strength of association of FrTDβ2M with nine independent variables (first column). Adjusted R2 indicates the proportion of FrTDβ2M variability explained by all independent variables. For all tests, p-values ≤ 0.05 indicate a statistically significant association of FrTDβ2M with an individual independent variable.
Disclaimer/Publisher’s Note: The statements, opinions and data contained in all publications are solely those of the individual author(s) and contributor(s) and not of MDPI and/or the editor(s). MDPI and/or the editor(s) disclaim responsibility for any injury to people or property resulting from any ideas, methods, instructions or products referred to in the content. |
© 2025 by the authors. Licensee MDPI, Basel, Switzerland. This article is an open access article distributed under the terms and conditions of the Creative Commons Attribution (CC BY) license (http://creativecommons.org/licenses/by/4.0/).
Copyright: This open access article is published under a Creative Commons CC BY 4.0 license, which permit the free download, distribution, and reuse, provided that the author and preprint are cited in any reuse.


