Submitted:
29 November 2024
Posted:
29 November 2024
You are already at the latest version
Abstract
Exposure to the environmental pollutant cadmium (Cd) is inevitable for most people because of its ubiquitous presence in the human diet. Concerningly, the risk of developing hypertension has been linked to dietary Cd exposure. The mechanisms involved are however, unclear. Because the kidneys play an indispensable role in long-term blood pressure regulation, and they are also the principal site of Cd accumulation and toxicity, a retrospective analysis was conducted to examine if the kidney damage and malfunction, reflected by urinary β2-microglobulin excretion (Eβ2M), and the estimated glomerular filtration rate (eGFR), are related to blood pressure variation and urinary Cd excretion (ECd). Data were obtained from 689 non-diabetic Thai subjects, chronically exposed to environmental Cd, of which 32.4% had hypertension. People in the top quartile of ECd had much higher risks of having β2-microglobulinuria [POR = 10.7 (95%CI:1.36, 83.4), p = 0.024), and hypertension [POR = 2.79 (95% CI:1.60, 4.87), p <0.001]. Only in subjects with an eGFR below 90 mL/min/1.73 m2, systolic blood pressure (SBP) and diastolic blood pressure (DBP) both increased linearly with Eβ2M (respective β = 0.182 and 0.192 for SBP and DBP) after adjustment for age, body mass index, gender, and smoking. The present study confirms the significant impact of Cd on risk of having hypertension, following GFR loss induced by Cd. A simple mediation model analysis has provided, for the first time, evidence that may link rising SBP and DBP in Cd-exposed people to the SH2B3-β2M axis of blood pressure regulation.
Keywords:
blood pressure
; regulation β2-microglobulin
; cadmium
; hypertension
; kidneys
1. Introduction
Long-term exposure to the metal cadmium (Cd) is one of the most significant global public health threats because it is a contaminant in nearly all food types; as such, dietary exposure to Cd is inevitable for most people [1,2,3]. Polluted air and cigarette smoke are additional exposure sources [4,5,6]. Importantly, Cd has no nutritional value or physiological role, but because a physiologic mechanism does not exist for its elimination, Cd is retained in most cells, tissues, and organs, especially the kidney cortex which is the principal Cd accumulation site and toxicity [1,7,8].
Increased risks of kidney damage and dysfunction [9,10,11], hypertension [12,13,14] and chronic kidney disease (CKD) [15,16] in the general population have repeatedly been linked to low environmental Cd exposure. The mortality from CKD in 2000 rose from the 13th to the 10th leading cause of death in 2019 (17,18). It is now the 7th top cause of global mortality, and will be the 5th leading cause of years of life lost by 2040 [17,18]. Concerningly, the incidence of CKD is projected to increase further as its major risk factors, obesity, diabetes, hypertension, and non-alcoholic fatty liver disease continue to rise [19,20,21,22].
CKD is diagnosed when the estimated glomerular filtration rate (eGFR) falls below 60 mL/min/1.73 m2, or there is albuminuria which persist for at least 3 months [19,20,21]. However, an early detection is required for the initiation of early treatment, which can significantly prevent CKD progression to end-stage kidney disease, defined as eGFR falls below 15 mL/min/1.73 m2, at which time, dialysis or kidney transplant is required for survival [21]. Epidemiological studies from U.S. [23,24,25], Canada [26], China [27,28], Korea [29,30], Japan [31] and Thailand [32,33,34,35] have implicated chronic exposure to environmental Cd in the development of hypertension either as a cause or as a consequence of CKD. However, investigations into the mechanisms of Cd-linked hypertension are limited.
In Cd toxicity research, an increased excretion of the low-molecular-weight protein β2-microglobulin (β2M) ≥ 300 µg/g creatinine is used to signify a defective tubular reabsorption of proteins [36]. Current data, however, suggest that β2M has a wide diversity of biological role, which include blood pressure control, named the SH2B3-β2M axis [37,38,39,40]. The potential role of β2M in blood pressure regulation was observed in the Framingham Heart Study (n = 7065), where an elevated plasma β2M has been linked to increased risks of both prevalent and incident hypertension [40]
The present study was a retrospective analysis of data recorded for 689 non-diabetic Thai Nationals (251 males, 438 females), 16 to 80 years of age (mean 42.7), of which 32.4% had hypertension, while 7.8% had β2-microglobulinuria, described also as tubular proteinuria. It was aimed to explore the potential role of β2M in the variation of systolic and diastolic blood pressure and the risk of having hypertension in relation to eGFR and Cd body burden. In addition, it was aimed to examine gender differences in Cd effects on hypertension risk.
2. Materials and Methods
2.1. Participant Selection
This study analyzed archived data from 689 healthy non-diabetic Thai Nationals, selected from a large Thai population-based cohort of 1500 persons, conducted in compliance with the principles outlined in the Declaration of Helsinki [32,41,42,43,44]. Of a total 689 subjects, 308 were residents of a Cd contaminated area of the Mae Sot District, Tak Province, and 381 persons were selected from the following three low-exposure localities; a non-contaminated part of the Mae Sot District (n = 63), Bangkok (n = 248) and Nakhon-Si-Thammarat Province (n = 70). For the Bangkok group, those aged 16 years or older were selected. The health status was ascertained by physician’s examination reports and routine blood and urinary chemistry profiles. For the Nakhon-Si-Thammarat group, and the two Mae Sot groups, those had resided at their current addresses for 30 years or longer were selected.
Exclusion criteria for all groups were pregnancy, breast-feeding, a history of metal work, and a hospital record or physician’s diagnosis of an advanced chronic disease. The sociodemographic data, educational attainment, occupation, health status, family history of diabetes, and smoking status were obtained by structured interview questionnaires. Hypertension was defined as systolic blood pressure ≥140 mmHg, diastolic blood pressure ≥ 90 mmHg [45], a physician’s diagnosis, or recorded use of anti-hypertensive medications.
2.2. Measurement of Cadmium Exposure and Its Effects on the Function of Kidneys
Urinary Cd and β2M were used to assess exposure to Cd and its effect on tubular reabsorption of protein, respectively [32,41,42,43,44]. The estimated glomerular filtration rate (eGFR) was used as a measure of glomerular function [34]. For these measurements, samples of urine, whole blood, and plasma were collected from all participants after overnight fast, and were stored at -80 ºC for later analysis. Plasma samples were assayed the concentration of creatinine, while urine samples were assayed for the concentrations of creatinine, Cd, and β2M, detailed in previous reports [32,34,41,42,43,44].
The eGFR was computed with equations of the Chronic Kidney Disease Epidemiology Collaboration (CKD-EPI) [46,47,48]. CKD stages 1, 2, 3, 4, and 5 corresponded to eGFR of 90–119, 60–89, 30–59, 15–29, and <15 mL/min/1.73 m2, respectively [48].
Urinary Cd concentrations, expressed as µg/L were determined by the graphite furnace atomic absorption spectrophotometry with the Zeeman effect background correction system. Multielement standards (Merck KGaA, Darmstadt, Germany) were used to calibrate the instrument. The reference urine metal control levels 1, 2, and 3 (Lyphocheck, Bio-Rad, Hercules, CA, USA) were employed for quality control and quality assurance of Cd quantitation. The coefficient of variation in Cd in the reference urine was within acceptable clinical chemistry standards.
The limit of detection (LOD) for urinary Cd was 0.1 µg/L. This LOD figure was 3 times the standard deviation of a repeated measurement of blank samples. When a urine sample contained Cd below its LOD, the Cd concentration assigned was the LOD value divided by the square root of 2 [49].
2.3. Normalization of Cadmium Excretion Rate and β2-Microglobulin Excretion Rate
The urinary excretion rates for Cd and β2M (ECd, Eβ2M) were normalized to creatinine clearance (Ccr) and creatinine excretion (Ecr) using the equations below. These normalization of ECd and Eβ2M were necessary because urine samples were collected at a single time point (term voided urine). The purpose of normalization of ECd and Eβ2M to Ecr as ECd/Ecr and Eβ2M/Ecr was to correct for differences in urine dilution among people. However, this Ecr has been shown to introduce non-differential errors, which bias the dose-response relationship toward null [50,51]. In comparison, the purpose of normalization of ECd and Eβ2M to Ccr as ECd/Ccr and Eβ2M /Ccr was to simultaneously correct for interindividual differences in urine dilution, and the number of surviving nephrons. This Ccr-normalization has unveiled an unambiguous effect of Cd on GFR [52].
The urinary excretion of x (Ex) was normalized to Ecr as [x]u/[cr]u, where x= Cd or β2M; [x]u = urine concentration of x (mass/volume) and [cr]u = urine creatinine concentration (mg/dL). Ex/Ecr was expressed as an amount of x excreted per g of creatinine.
The urinary excretion of x (Ex) was normalized to creatinine clearance (Ccr) as Ex/Ccr = [Cd]u[cr]p/[cr]u, where x = Cd or β2M; [x]u = urine concentration of x (mass/volume); [cr]p = plasma creatinine concentration (mg/dL); and [cr]u = urine creatinine concentration (mg/dL). Ex/Ccr was expressed as an amount of x excreted per volume of the glomerular filtrate [53].
2.4. Mediation Analysis
A simple mediation model was used to explore the potential mediator for an effect of Cd on systolic blood pressure and diastolic blood pressure [54,55,56]. Figure 1 depicts a generalized simple mediation model, where “M” is a single mediator of the effect of the independent variable X on the dependent variable Y.
Diagram 1.
A generalized mediation model with a single mediator.
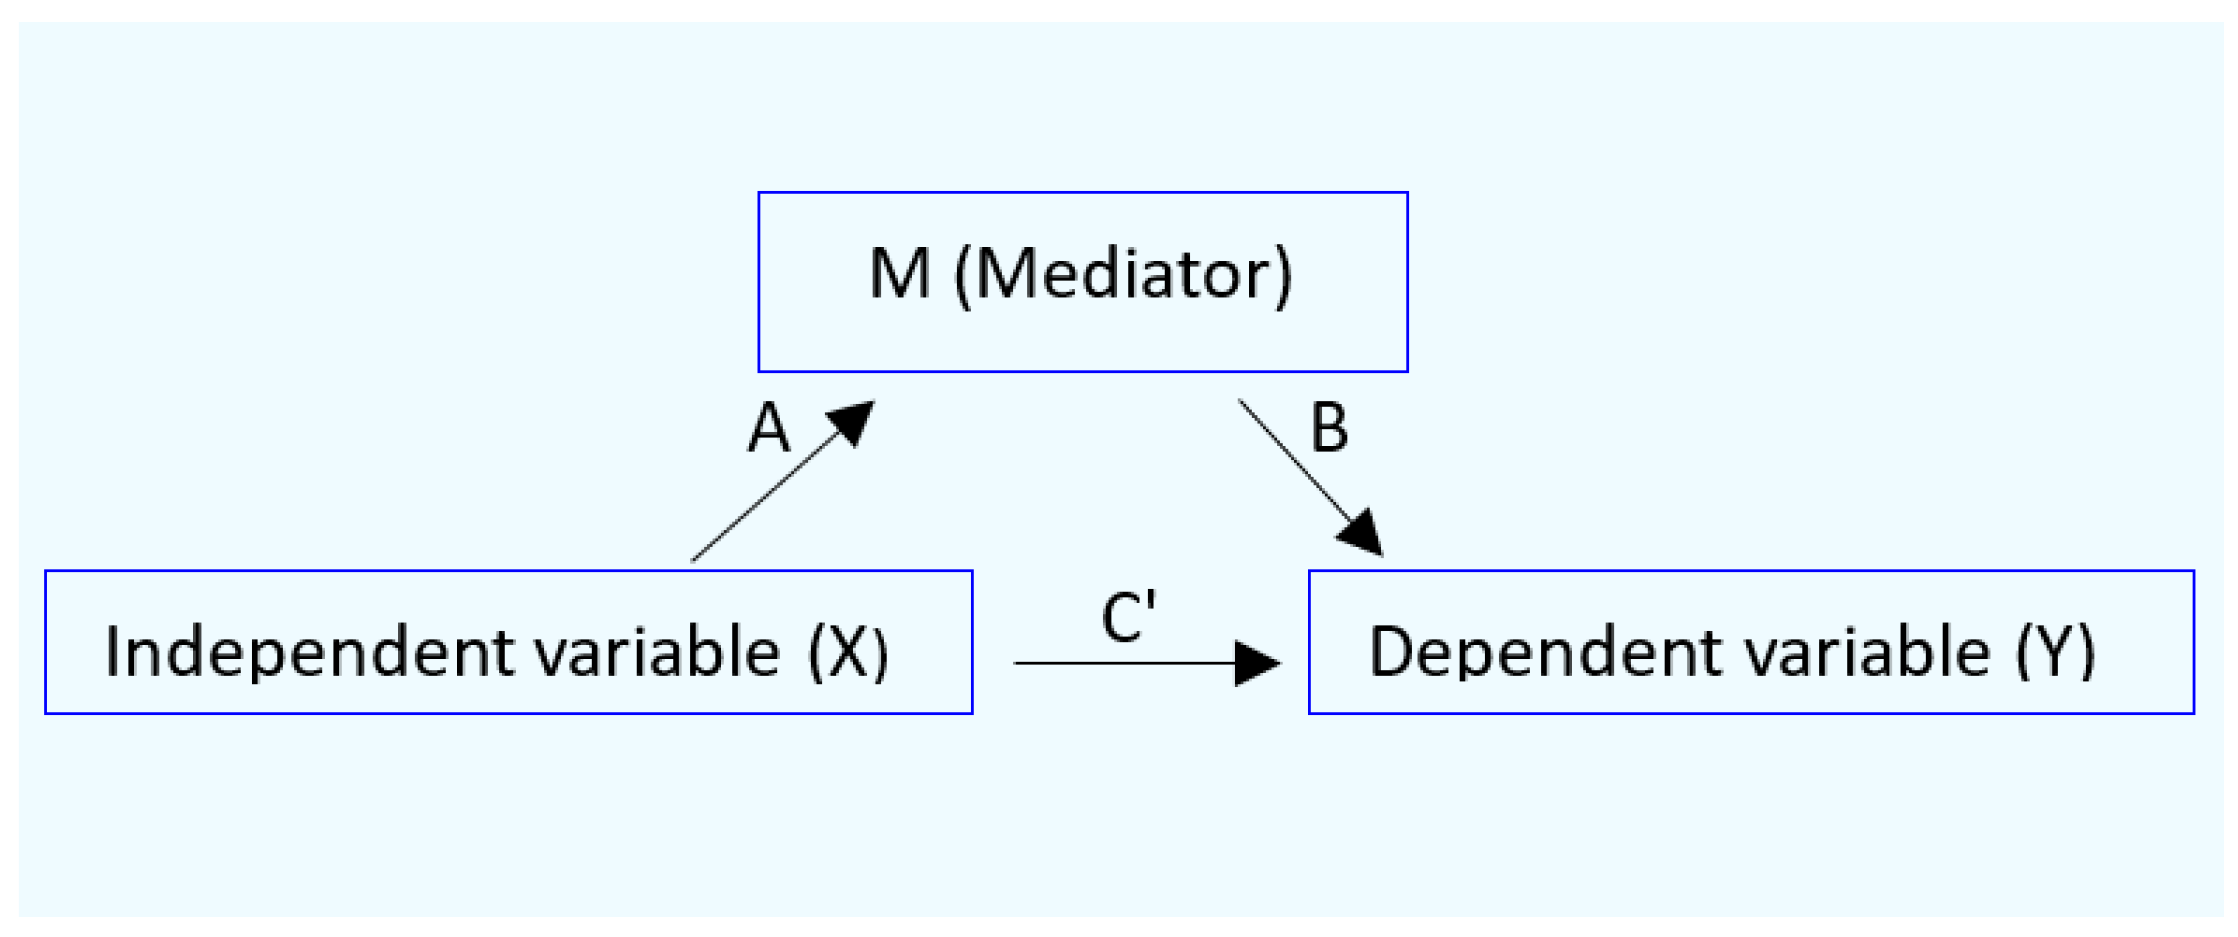
In the diagram above, A, B, and C’ are standardized β coefficients, describing an effect of X on Y with M as a mediator. These β values are used for computing, (1) total effect of X on Y designed as C’, (2) the ratio of indirect effect, and (3) the proportion mediated [54,55,56].
C = C’ + A*B
The ratio of indirect effect = A*B/C’
The proportion mediated = A*B/C’+ A*B
2.5. Statistical Analysis
Data were analyzed with IBM SPSS Statistics 21 (IBM Inc., New York, NY, USA). The Mann–Whitney U test. was used to assess the differences in mean values between males and females. The Kruskal Wallis test for differences in mean values across the quartile of Eβ2M. The Pearson’s chi-squared test was used to determine differences in percentages and prevalences of smoking, hypertension, low eGFR, and proteinuria. The conformity to a normal distribution of continuous variables was assessed by the one-sample Kolmogorov–Smirnov test. Logarithmic transformation was applied to ECd and Eβ2M, which showed a right-skewed distribution. For eGFR, no data transformation was required because this variable showed a left-skewed distribution. Multiple linear regression was used to identify the variables that influence systolic and diastolic blood pressure levels.
Effects of Cd exposure on the prevalence odds ratio (POR) values for hypertension and β2-microglobulinuria were determined by logistic regression with adjustment for potential confounders (age, body mass index, smoking, and gender). For the Ecr-normalized data, β2-microglobulinuria was defined as Eβ2M/Ecr ≥ 300 µg/g creatinine. For the Ccr-normalized data, β2-microglobulinuria was defined as Eβ2M/Ccr ≥ 3 µg/L filtrate. For all tests, p-values ≤ 0.05 were considered to indicate statistical significance.
3. Results
3.1. Characterization of Participants According to eGFR and β2-Microglobulin Excretion
The description of participants can be found in Table 1.
Of a total 689 participants, respective percentages (%) of females, smokers, and those with hypertension were 63.4, 28.3 and 32.4. The overall % of low eGFR and β2-microglobulinuria, defined as Eβ2M/Ecr ≥300 µg/g creatinine, and Eβ2M/Ccr ≥ 3 µg/ L filtrate were 2.6, 7.3 and 6.8, respectively.
Respective overall mean values for age, BMI, eGFR, SBP and DBP were 42.7 years, 23.4 kg/m2, 97.4, mL/min/1.73 m2, 121 mm Hg, and 78 mm Hg. The overall mean ECd/Ecr and mean ECd/Ccr were 2.77 µg/g creatinine and 0.0219 µg/L filtrate, respectively.
Given that Eβ2M and eGFR have been shown to be inversely related, participants were assigned to the normal eGFR group or the reduced eGFR group. The normal eGFR group included those with eGFR values ≥ 90 mL/min/1.73 m2, while the reduced eGFR group enlisted those with GFR values < 90 mL/min/1.73 m2.
The parameters showing male-female differences in both normal and reduced eGFR groups were % smokers (particularly high among males), age, BMI, and Cd exposure levels (assessed as ECd/Ecr, and ECd/Ccr). In comparison, % hypertension was higher in females (30.7) than males (22.4) in the normal eGFR group only. Similarly, % β2-microglobulinuria, based on both Ecr and Ccr normalized data were more prevalent, in males, compared to females in the normal eGFR group only. In the reduced eGFR group, however, the % β2-microgloubinuria and hypertension in males were similarly high as in females.
The inverse relationship between eGFR and Eβ2M, were apparent also when participants were grouped according to the quartiles of β2-microglobulin excretion rate, assessed as Eβ2M/Ccr (Table 2).
The % of females, smokers, hypertension, and those with BMI values > 30 kg/m2 were similar across the Eβ2M/Ccr quartile groups. Mean BMI, mean SBP and mean DBP were also similar across the Eβ2M/Ccr quartile groups. However, there were significant differences in % low eGFR, mean values for age, eGFR, ECd/Ecr, and ECd/Ccr across Eβ2M/Ccr quartile groups. Notably, the prevalence of low eGFR in the Eβ2M/Ccr quartiles were markedly different (p <0.001). In the top Eβ2M/Ccr quartile, the prevalence of low eGFR was as high as 10 .3%, and it was nil in the bottom quartile. The prevalence of low eGFR in the Eβ2M/Ccr quartiles 2 and 3 were 0.7% and 1.4 %, respectively.
3.2. Effects of Cadmium Exposure on Risks of Hypertension and β2-Microglobulinuria
Two logistic regression models were constructed to evaluate an effect of Cd exposure on the prevalence odds ratio for hypertension and β2-microglobulinuria (Table 3).
The POR for hypertension was influenced by age, BMI and ECd/Ccr, but not gender or smoking. Per every one year older, the POR for hypertension increased 5.9% (95% CI: 4.0, 7.8, p <0.001). The respective POR values for hypertension rose 2.08-fold (95% CI: 1.442, 3.001, p < 0.001) and 3.34-fold (95% CI: 1.481, 7.543, p = 0.004) in those with BMI of 24−30 and > 30 kg/m2, compared to the BMI < 24 kg/m2. Comparing with the bottom quartile, respective POR values for hypertension rose 2.52-fold (95% CI: 1.465, 4.342, p = 0.001) and 2.79 (95% CI: 1.595, 4.871, p <0.001) in the ECd/Ccr quartiles 3 and 2.
Among five independent variables tested, the POR for β2-microglobulinuria was affected markedly by Cd (ECd/Ccr). Comparing with the bottom quartile of ECd/Ccr, the POR for β2-microglobulinuria in the top quartile rose 10.67-fold (95%CI: 1.364, 83.4, p = 0.024). However, the 6.98-fold (95% CI: 0.887, 54.93, p = 0.065) increase of POR for β2-microglobulinuria in the ECd/Ccr quartile 3 did not reach a statistically significant level.
3.3. Urinary β2-Microglobulin as a Predictor of Rising Blood Pressure
Scatterplots were constructed to visualize the correlations of SBP and DBP with β2-microglobulin excretion rate only in female gender (Figure 1).
Additional scatterplots (Figure 2) show the correlations of SBP and DBP with β2-microglobulin excretion rate only in the reduced eGFR group.
Results of multiple linear regressions of SBP and DBP are reported for all subjects, the normal and the reduced eGFR groups (Table 4).
Respective proportions of the SBP variation in all subjects, the normal eGFR group, and the reduced eGFR group that were related to a set of six independent variables (age, BMI, ECd/Ccr, Eβ2M/Ccr, smoking and gender) were 14.5% (p < 0.001), 10.6% (p < 0.001) and 10.3% (p <0.001). In comparison, the same set of independent variables explained only 5.4% (p <0.001) and 5.3% (p <0.001) of the DBP variation in all subjects and the normal eGFR group. The DBP variability among those with a reduced eGFR was minimally related to these variables.
Notably, however, the associations of Eβ2M/Ccr with SBP (β= 0.182, p = 0.013) and DBP (β = 0.192, p = 0.012) were found only in the reduced eGFR group. These results were in line with scatterplots in Figure 2,
3.4. GFR and β2-Microglobulin as Mediators of Cadmium-Induced Blood Pressure Elevation
Figure 3 provides results of a simple mediation model that assessed whether Cd increased blood pressure through a fall of eGFR.
In SBP model, Cd had a direct effect on a mediator (eGFR) (β =− 0.116, p < 0.001) as well a significant indirect effect on SBP (Sobel test p = 0.006) (Figure 3a,c). The indirect effect of Cd on SBP was mediated by a decline in eGFR. The proportion mediated by a decline in eGFR, calculated from the equation (A*B/C’+ A*B) was 19%.
In DBP model, Cd had a direct effect a mediator (eGFR) (β =− 0.133, p < 0.001) as well an indirect effect (Sobel test p = 0.012) (Figure 3b,d). The indirect effect of Cd on DBP was also through a reduction in eGFR. Using the equation (A*B/C’+ A*B), the proportion of effect mediated through eGFR was 16%.
Figure 4 provides results of a simple mediation model that assessed whether Cd increased blood pressure through β2M.
In SBP model, Cd had a direct effect on a mediator (β2M) (β = 0.294, p < 0.001) (Figure 4a). Cd had also a significant indirect effect on SBP (Sobel test p = 0.007) (Figure 4c). In DBP model, Cd had a direct effect on a mediator (β2M) (β = 0.296, p < 0.001), as well as a significant indirect effect on SBP (Sobel test p = 0.024) (Figure 4b,d). The indirect effects of Cd on SBP and DBP were mediated completely through β2M.
4. Discussion
This study analyzed data from 689 non-diabetic persons, aged between 16 to 80 years (mean age 42.7). They were selected from a large cohort of apparently healthy Thai Nationals. The % females, smokers, obese subjects, hypertension, tubular proteinuria, and CKD (eGFR ≤ 60 mL/min/1.73 m2) were, 63.4, 28.3, 4.9, 32.4, 7.3, and 2.6, respectively. Mean age, mean BMI, mean eGFR were 23.4 kg/m2, 97.4, mL/min/1.73 m2, respectively. Age and BMI histograms of this study group conformed to a normal distribution. This group could thus be considered to represent a sample of the general population. The mean ECd/Ecr and mean ECd/Ccr were 2.77 µg/g creatinine and 0.0219 µg/L filtrate, respectively. These environmental Cd exposure (body burden) levels were comparable to those reported for non-occupationally exposed populations. Notably, however, it is well recognized that blood pressure levels and prevalence differ in males and females [57,58,59], the inequal number of males and females recruited to a study was a limitation. A one-time-only assessment of Cd exposure and its effects was also its limitation.
4.1. Effects of Cadmium Exposure on Blood Pressure and Tubular Reabsorptive Function
In the logistic regression analysis (Table 3), age, BMI and Cd exposure were three variables associated with increased risk of having hypertension. For every one-year older, average risk of hypertension rose 5.9%. The risk of hypertension increased with BMI and ECd in a dose-dependent manner. There was a 2.5-fold increase in risk of hypertension at (ECd/Ccr) ×100 value of 0.71 µg/L filtrate, corresponding to 0.68 µg/g creatinine. In comparison, however, neither age nor BMI influenced the risk of having tubular proteinuria. An increase in risk of having such proteinuria was statistically significant only in the top quartile of Cd exposure (ECd/Ccr) ×100 value of 2.74 µg/L filtrate, corresponding to 2.32 µg/g creatinine. These data suggest that tubular proteinuria could be a consequence of hypertension; a significant increase in risk of hypertension was observed at the exposure level producing ECd/Ecr of 0.68 µg/g creatinine, which much lower than ECd/Ecr of 2.32 µg/g creatinine. Thus, blood pressure increase could be a sensitive biomarker for an early detection of an adverse effect of Cd on kidneys.
In the SBP regression model, including all subjects (Table 4), SBP did not correlate with ECd or Eβ2M, but it was associated with age (β = 0.323), BMI (β = 0.188), and gender (β = 0.105). The DBP regression model showed similar correlative patterns, but the strengths of correlation were weaker, compared with SBP. In subgroup analysis, association of SBP with Eβ2M (β= 0.182) and DBP with Eβ2M (β = 0.192) were found only in the reduced eGFR group. These results were evident also from scatterplots in Figure 2.
A mediated effect analysis (Figure 3) has revealed that respective SBP and DBP increases by 19% and 16% were mediated by a declining eGFR. This explained the presence of SBP/Eβ2M and DBP/Eβ2M correlations only in those with eGFR <90 mL/min/1.73m2. Previously, GFR loss was found to mediate completely the SBP and DBP increasement in people exposed to relatively higher Cd doses than participants in the present study [35].
Effects of Cd on SBP and DBP were found to be fully mediated by β2M (Figure 4). This mediated effect of β2M provided an explanation for the absence of SBP-ECd and DBP-ECd correlations in multiple regression analysis (Table 4). Further study is warranted to examine the potential role for β2M as a mediator of Cd effect on the risk of hypertension, most likely involved the SH2B3-β2M axis in blood pressure regulation [39,40].
In a cross-sectional study from Japan, an increased risk of hypertension was associated with an elevated β2M excretion [60]. In another Japanese prospective cohort study, a 79% increased risk of GFR loss at 10 mL/min/1.73 m2 over a five-year observation period was found in the cohort participants who had β2-microglobulinuria [61].
4.2. Gender Differences in Blood Pressure Variability and Cadmium Effects
In the descriptive characteristics of cohort participants (Table 1), % hypertension in the normal eGFR group was higher in females than males ((30.7 vs 22.4). In the reduced eGFR group, however, the % hypertension and % β2-microgloubinuria and in males and females were similar. REF on GEN
Further evidence for gender differences in risk of hypertension was apparent from a multiple regression analysis (Table 4), where SBP, not DBP, was found to be associated with gender (β = 0.105) after adjustment effects of other variables (age, BMI, smoking). The scatterplots in Figure 1, revealed significant SBP-Eβ2M and DBP-Eβ2M correlations in females.
The female preponderance effect of Cd on blood pressure has been observed in several studies, and a few are discussed herein. A study from U.S. found that white and Mexican-American women were more susceptible to Cd-induced blood pressure increases than black women; an increased risk of hypertension was seen in Caucasian (OR 1.54) and Mexican-American women (OR 2.38) who had blood Cd as little as 0.4 µg/L, but not in black women or white, black, or Mexi-can-American men [25]. In a study from Taiwan, an association of kidney damage marker (urinary N-acetyl-β-D-glucosaminidase, NAG) with Cd was found only in women [62]. A study from Thailand reported that the risk of hypertension rose 20% in Cd-exposed persons, who showed evidence of kidney damage, assessed with urinary NAG excretion [32].
Previously, the gender differential effects of Cd on blood pressure were attributable to the effects of Cd on sex hormones [33,34]. An increment of urinary Cd levels from <2 to ≥ 3 μg/g creatinine, found to be associated with a 28% rise in serum testosterone levels in postmenopausal Japanese women [63]. An inverse association between urinary Cd and serum estradiol levels was seen in postmenopausal Japanese and Swedish women [64,65]. In the Swiss Kidney Project on Genes in Hypertension [66], urinary Cd correlated with testosterone excretion in men, while there was a trend for an association in women.
5. Conclusions
This study shows that exposure to environmental Cd, producing urinary Cd excretion rate of 0.68 µg/g creatinine increases the risk of hypertension. In comparison, an increased risk of having β2-microglobulinuria is observed at urinary Cd excretion rate of 2.32 µg/g creatinine. The development of hypertension in Cd-exposed people is an outcome of rising SBP and DBP because of a decrease in eGFR induced by Cd. This GFR loss occurs long before the excretion of β2M reaching 300 µg/g creatinine. The increases in SBP and DBP by 16-19% are found to be causally related to a declining eGFR. There is evidence for an independent effect of β2M on blood pressure variability.
Funding
This research received no external funding. It was supported by resources from the Centre for Kidney Disease Research, Translational Research Institute, the Department of Kidney and Transplant Services, Princess Alexandra Hospital.
Institutional Review Board Statement
Not applicable. This study analyzed archived data.
Informed Consent Statement
Informed consent was obtained from all subjects involved in the study.
Data Availability Statement
All data are contained within this article.
Acknowledgments
The author gratefully acknowledges overseas travel grants through the Reverse Brain Drain Project, the Commission of Higher Education, Thailand Ministry of Education, and the National Science and Technology Development Agency, Thailand Ministry of Sciences and Technology.
Conflicts of Interest
The author declares no conflict of interest.
References
- Satarug, S.; Vesey, D.A.; Gobe, G.C.; Phelps, K.R. Estimation of health risks associated with dietary cadmium exposure. Arch. Toxicol. 2023, 97, 329–358. [Google Scholar] [CrossRef] [PubMed]
- Fechner, C.; Hackethal, C.; Höpfner, T.; Dietrich, J.; Bloch, D.; Lindtner, O.; Sarvan, I. Results of the BfR MEAL Study: In Germany, mercury is mostly contained in fish and seafood while cadmium, lead, and nickel are present in a broad spectrum of foods. Food Chem. X 2022, 14, 100326. [Google Scholar] [CrossRef] [PubMed]
- Watanabe, T.; Kataoka, Y.; Hayashi, K.; Matsuda, R.; Uneyama, C. Dietary exposure of the Japanese general population to elements: Total diet study 2013–2018. Food Saf. 2022, 10, 83–101. [Google Scholar] [CrossRef] [PubMed]
- Hill, D.T.; Jandev, V.; Petroni, M.; Atallah-Yunes, N.; Bendinskas, K.; Brann, L.S.; Heffernan, K.; Larsen, D.A.; MacKenzie, J.A.; Palmer, C.D.; et al. Airborne levels of cadmium are correlated with urinary cadmium concentrations among young children living in the New York state city of Syracuse, USA. Environ. Res. 2023, 223, 115450. [Google Scholar] [CrossRef]
- Almerud, P.; Zamaratskaia, G.; Lindroos, A.K.; Bjermo, H.; Andersson, E.M.; Lundh, T.; Ankarberg, E.H.; Lignell, S. Cadmium, total mercury, and lead in blood and associations with diet, sociodemographic factors, and smoking in Swedish adolescents. Environ. Res. 2021, 197, 110991. [Google Scholar] [CrossRef]
- Pappas, R.S.; Fresquez, M.R.; Watson, C.H. Cigarette smoke cadmium breakthrough from traditional filters: Implications for exposure. J. Anal. Toxicol. 2015, 39, 45–51. [Google Scholar] [CrossRef]
- Thévenod, F.; Herbrechter, R.; Schlabs, C.; Pethe, A.; Lee, W.K.; Wolff, N.A.; Roussa, E. Role of the SLC22A17/lipocalin-2 receptor in renal endocytosis of proteins/metalloproteins: a focus on iron- and cadmium-binding proteins. Am. J. Physiol. Renal Physiol. 2023, 325, F564–F577. [Google Scholar] [CrossRef]
- Thévenod, F.; Lee, W.K.; Garrick, MD. Iron and Cadmium Entry Into Renal Mitochondria: Physiological and Toxicological Implications. Front. Cell Dev. Biol. 2020, 8, 848. [Google Scholar] [CrossRef]
- Wei, Y.; Wang, X.; Sun, Q.; Shi, W.; Zhang, W.; Gao, X.; Li, Y.; Hao, R.; Dong, X.; Chen, C.; et al. Associations of environmental cadmium exposure with kidney damage: Exploring mediating DNA methylation sites in Chinese adults. Environ. Res. 2024, 251 (Pt 1), 118667. [Google Scholar] [CrossRef]
- Sakuma, S.; Nogawa, K.; Watanabe, Y.; Sakurai, M.; Nishijo, M.; Ishizaki, M.; Morikawa, Y.; Kido, T.; Nakagawa, H.; Suwazono, Y. Effect of renal tubular damage on non-cancer mortality in the general Japanese population living in cadmium non-polluted areas. J. Appl. Toxicol. 2023, 43, 1849–1858. [Google Scholar] [CrossRef]
- Smereczański, N.M.; Brzóska, M.M. Current levels of environmental exposure to cadmium in industrialized countries as a risk factor for kidney damage in the general population: A comprehensive review of available data. Int. J. Mol. Sci. 2023, 24, 8413. [Google Scholar] [CrossRef] [PubMed]
- Aramjoo, H.; Arab-Zozani, M.; Feyzi, A.; Naghizadeh, A.; Aschner, M.; Naimabadi, A.; Farkhondeh, T.; Samarghandian, S. The association between environmental cadmium exposure, blood pressure, and hypertension: a systematic review and meta-analysis. Environ. Sci. Pollut. Res. Int. 2022, 29, 35682–35706. [Google Scholar] [CrossRef] [PubMed]
- Martins, A.C.; Almeida Lopes, A.C.B.; Urbano, M.R.; Carvalho, M.F.H.; Silva, A.M.R.; Tinkov, A.A.; Aschner, M.; Mesas, A.E.; Silbergeld, E.K.; Paoliello, M.M.B. An updated systematic review on the association between Cd exposure, blood pressure and hypertension. Ecotoxicol. Environ, Saf. 2021, 208, 111636. [Google Scholar] [CrossRef] [PubMed]
- Verzelloni, P.; Giuliano, V.; Wise, L.A.; Urbano, T.; Baraldi, C.; Vinceti, M.; Filippini, T. Cadmium exposure and risk of hypertension: a systematic review and dose-response meta-analysis. Environ. Res. 2024, 120014. [Google Scholar] [CrossRef] [PubMed]
- Doccioli, C.; Sera, F.; Francavilla, A.; Cupisti, A.; Biggeri, A. Association of cadmium environmental exposure with chronic kidney disease: A systematic review and meta-analysis. Sci. Total Environ. 2024, 906, 167165. [Google Scholar] [CrossRef] [PubMed]
- Akinleye, A.; Oremade, O.; Xu, X. Exposure to low levels of heavy metals and chronic kidney disease in the US population: A cross sectional study. PLoS One 2024, 19, e0288190. [Google Scholar] [CrossRef]
- Foreman, K.J.; Marquez, N.; Dolgert, A.; Fukutaki, K.; Fullman, N.; McGaughey, M.; Pletcher, M.A.; Smith, A.E.; Tang, K.; Yuan, C.W.; et al. Forecasting life expectancy, years of life lost, and all-cause and cause-specific mortality for 250 causes of death: Reference and alternative scenarios for 2016-40 for 195 countries and territories. Lancet 2018, 392, 2052–2090. [Google Scholar] [CrossRef]
- GBD 2021 Forecasting Collaborators. Burden of disease scenarios for 204 countries and territories, 2022–2050: A forecasting analysis for the Global Burden of Disease Study 2021. Lancet 2024, 403, 2204–2256. [Google Scholar] [CrossRef]
- Murton, M.; Goff-Leggett, D.; Bobrowska, A.; Garcia Sanchez, J.J.; James, G.; Wittbrodt, E.; Nolan, S.; Sörstadius, E.; Pecoits-Filho, R.; Tuttle, K. Burden of Chronic Kidney Disease by KDIGO Categories of Glomerular Filtration Rate and Albuminuria: A Systematic Review. Adv. Ther. 2021, 38, 180–200. [Google Scholar] [CrossRef]
- Kalantar-Zadeh, K.; Jafar, T.H.; Nitsch, D.; Neuen, B.L.; Perkovic, V. Chronic kidney disease. Lancet 2021, 398, 786–802. [Google Scholar] [CrossRef]
- Farrell, D.R.; Vassalotti, J.A. Screening, identifying, and treating chronic kidney disease: Why, who, when, how, and what? BMC Nephrol. 2024, 25, 34. [Google Scholar] [CrossRef]
- Cirovic, A.; Satarug, S.; Jevtic, J.; Ivanovski, A.; Orisakwe, O.E.; Jankovic, S.; Cirovic, A.J. Trace Elem. Med. Biol. 2024, 86, 127542.
- Oliver-Williams, C.; Howard, A.G.; Navas-Acien, A.; Howard, B.V.; Tellez-Plaza, M.; Franceschini, N. Cadmium body burden, hypertension, and changes in blood pressure over time: Results from a prospective cohort study in American Indians. J. Am. Soc. Hypertens. 2018, 12, 426–437.e9. [Google Scholar] [CrossRef] [PubMed]
- Tellez-Plaza, M.; Navas-Acien, A.; Crainiceanu, C.M.; Guallar, E. Cadmium exposure and hypertension in the 1999-2004 National Health and Nutrition Examination Survey (NHANES). Environ. Health Perspect. 2008, 116, 51–56. [Google Scholar] [CrossRef] [PubMed]
- Scinicariello, F.; Abadin, H.G.; Murray, H.E. Association of low-level blood lead and blood pressure in NHANES 1999–2006. Environ. Res. 2011, 111, 1249–1257. [Google Scholar] [CrossRef] [PubMed]
- Garner, R.E.; Levallois, P. Associations between cadmium levels in blood and urine, blood pressure and hypertension among Canadian adults. Environ. Res. 2017, 155, 64–72. [Google Scholar] [CrossRef] [PubMed]
- Zhong, Q.; Wu, H.B.; Niu, Q.S.; Jia, P.P.; Qin, Q.R.; Wang, X.D.; He, J.L.; Yang, W.J.; Huang, F. Exposure to multiple metals and the risk of hypertension in adults: A prospective cohort study in a local area on the Yangtze River, China. Environ. Int. 2021, 153, 106538. [Google Scholar] [CrossRef]
- Wu, W.; Liu, D.; Jiang, S.; Zhang, K.; Zhou, H.; Lu, Q. Polymorphisms in gene MMP-2 modify the association of cadmium exposure with hypertension risk. Environ. Int. 2019, 124, 441–447. [Google Scholar] [CrossRef]
- Lee, B.K.; Kim, Y. Association of blood cadmium with hypertension in the Korean general population: Analysis of the 2008–2010 Korean National Health and Nutrition Examination Survey data. Am. J. Ind. Med. 2012, 55, 1060–1067. [Google Scholar] [CrossRef]
- Kwon, J.A.; Park, E.; Kim, S.; Kim, B. Influence of serum ferritin combined with blood cadmium concentrations on blood pressure and hypertension: From the Korean National Health and Nutrition Examination Survey. Chemosphere 2022, 288, 132469. [Google Scholar] [CrossRef]
- Kaneda, M.; Wai, K.M.; Kanda, A.; Ando, M.; Murashita, K.; Nakaji, S.; Ihara, K. Low Level of Serum Cadmium in Relation to Blood Pressures Among Japanese General Population. Biol. Trace Elem. Res. 2022, 200, 67–75. [Google Scholar] [CrossRef] [PubMed]
- Satarug, S.; Nishijo, M.; Ujjin, P.; Vanavanitkun, Y.; Moore, M.R. Cadmium-induced nephropathy in the development of high blood pressure. Toxicol. Lett. 2005, 157, 57–68. [Google Scholar] [CrossRef] [PubMed]
- Boonprasert, K.; Vesey, D.A.; Gobe, G.C.; Ruenweerayut, R.; Johnson, D.W.; Na-Bangchang, K.; Satarug, S. Is renal tubular cadmium toxicity clinically relevant? Clin. Kidney J. 2018, 11, 681–687. [Google Scholar] [CrossRef] [PubMed]
- Satarug, S.; Boonprasert, K.; Gobe, G.C.; Ruenweerayut, R.; Johnson, D.W.; Na-Bangchang, K.; Vesey, D.A. Chronic exposure to cadmium is associated with a marked reduction in glomerular filtration rate. Clin. Kidney J. 2018, 12, 468–475. [Google Scholar] [CrossRef] [PubMed]
- Satarug, S.; Vesey, D.A.; Yimthiang, S.; Khamphaya, T.; Pouyfung, P.; Đorđević, A.B. Environmental Cadmium Exposure Induces an Increase in Systolic Blood Pressure by Its Effect on GFR. Stresses 2024, 4, 436–451. [Google Scholar] [CrossRef]
- Hayashi, T.; Nogawa, K.; Watanabe, Y.; Kido, T.; Sakurai, M.; Nakagawa, H.; Suwazono, Y. Benchmark Dose of Urinary Cadmium for Assessing Renal Tubular and Glomerular Function in a Cadmium-Polluted Area of Japan. Toxics 2024, 12, 836. [Google Scholar] [CrossRef]
- Sivanathan, P.C.; Ooi, K.S.; Mohammad Haniff, M.A.S.; Ahmadipour, M.; Dee, C.F.; Mokhtar, N.M.; Hamzah, A.A.; Chang, E.Y. Lifting the Veil: Characteristics, Clinical Significance, and Application of β-2-Microglobulin as Biomarkers and Its Detection with Biosensors. ACS Biomater Sci Eng. 2022, 8, 3142–3161. [Google Scholar] [CrossRef]
- Huan, T.; Meng, Q.; A Saleh, M.; E Norlander, A.; Joehanes, R.; Zhu, J.; Chen, B.H.; Zhang, B.; Johnson, A.D.; Ying, S.; et al. Integrative network analysis reveals molecular mechanisms of blood pressure regulation. Mol. Syst. Biol. 2015, 11, 799. [Google Scholar] [CrossRef]
- Alexander, M.R.; Hank, S.; Dale, B.L.; Himmel, L.; Zhong, X.; Smart, C.D.; Fehrenbach, D.J.; Chen, Y.; Prabakaran, N.; Tirado, B.; et al. A single nucleotide polymorphism in SH2B3/LNK promotes hypertension development and renal damage. Circ. Res. 2022, 131, 731–747. [Google Scholar] [CrossRef]
- Keefe, J.A.; Hwang, S.J.; Huan, T.; Mendelson, M.; Yao, C.; Courchesne, P.; Saleh, M.A.; Madhur, M.S.; Levy, D. Evidence for a causal role of the SH2B3-β2M axis in blood pressure regulation. Hypertension 2019, 73, 497–503. [Google Scholar] [CrossRef]
- Satarug, S.; Swaddiwudhipong, W.; Ruangyuttikarn, W.; Nishijo, M.; Ruiz, P. Modeling cadmium exposures in low- and high-exposure areas in Thailand. Environ. Health Perspect. 2013, 121, 531–536. [Google Scholar] [CrossRef] [PubMed]
- Teeyakasem, W.; Nishijo, M.; Honda, R.; Satarug, S.; Swaddiwudhipong, W.; Ruangyuttikarn, W. Monitoring of cadmium toxicity in a Thai population with high-level environmental exposure. Toxicol. Lett. 2007, 169, 185–195. [Google Scholar] [CrossRef] [PubMed]
- Honda, R.; Swaddiwudhipong, W.; Nishijo, M.; Mahasakpan, P.; Teeyakasem, W.; Ruangyuttikarn, W.; Satarug, S.; Padungtod, C.; Nakagawa, H. Cadmium induced renal dysfunction among residents of rice farming area downstream from a zinc-mineralized belt in Thailand. Toxicol. Lett. 2010, 198, 26–32. [Google Scholar] [CrossRef] [PubMed]
- Yimthiang, S.; Pouyfung, P.; Khamphaya, T.; Kuraeiad, S.; Wongrith, P.; Vesey, D.A.; Gobe, G.C.; Satarug, S. Effects of Environmental Exposure to Cadmium and Lead on the Risks of Diabetes and Kidney Dysfunction. Int. J. Environ. Res. Public Health 2022, 19, 2259. [Google Scholar] [CrossRef] [PubMed]
- Bloch, M.J.; Basile, J.N. Review of recent literature in hypertension: Updated clinical practice guidelines for chronic kidney disease now include albuminuria in the classification system. J. Clin. Hypertens. 2013, 15, 865–867. [Google Scholar] [CrossRef]
- Levey, A.S.; Stevens, L.A.; Scmid, C.H.; Zhang, Y.; Castro, A.F., III; Feldman, H.I.; Kusek, J.W.; Eggers, P.; Van Lente, F.; Greene, T.; et al. A new equation to estimate glomerular filtration rate. Ann. Intern. Med. 2009, 150, 604–612. [Google Scholar] [CrossRef]
- White, C.A.; Allen, C.M.; Akbari, A.; Collier, C.P.; Holland, D.C.; Day, A.G.; Knoll, G.A. Comparison of the new and traditional CKD-EPI GFR estimation equations with urinary inulin clearance: A study of equation performance. Clin. Chim. Acta 2019, 488, 189–195. [Google Scholar] [CrossRef]
- Levey, A.S.; Becker, C.; Inker, L.A. Glomerular filtration rate and albuminuria for detection and staging of acute and chronic kidney disease in adults: a systematic review. JAMA 2015, 313, 837–846. [Google Scholar] [CrossRef]
- Hornung, R.W.; Reed, L.D. Estimation of average concentration in the presence of nondetectable values. Appl. Occup. Environ. Hyg. 1990, 5, 46–51. [Google Scholar] [CrossRef]
- Satarug, S.; Vesey, D.A.; Gobe, G.C. Cadmium-Induced Proteinuria: Mechanistic Insights from Dose–Effect Analyses. Int. J. Mol. Sci. 2023, 24, 1893. [Google Scholar] [CrossRef]
- Grandjean, P.; Budtz-Jørgensen, E. Total imprecision of exposure biomarkers: implications for calculating exposure limits. Am. J. Ind. Med. 2007, 50, 712–719. [Google Scholar] [CrossRef] [PubMed]
- Satarug, S.; Vesey, D.A.; Nishijo, M.; Ruangyuttikarn, W.; Gobe, G.C.; Phelps, K.R. The Effect of Cadmium on GFR Is Clarified by Normalization of Excretion Rates to Creatinine Clearance. Int. J. Mol. Sci. 2021, 22, 1762. [Google Scholar] [CrossRef] [PubMed]
- Phelps, K.R.; Gosmanova, E.O. A generic method for analysis of plasma concentrations. Clin. Nephrol. 2020, 94, 43–49. [Google Scholar] [CrossRef] [PubMed]
- Preacher, K.J. Advances in mediation analysis: A survey and synthesis of new developments. Annu. Rev. Psychol. 2015, 66, 825–852. [Google Scholar] [CrossRef] [PubMed]
- MacKinnon, D.P.; Warsi, G.; Dwyer, J.H. A simulation study of mediated effect measures. Multiv. Behav. Res. 1995, 30, 41–62. [Google Scholar] [CrossRef]
- Preacher, K.J.; Hayes, A.F. SPSS and SAS procedures for estimating indirect effects in simple mediation models. Behav. Res. Meth. Instrum. Comput. 2004, 36, 717–731. [Google Scholar] [CrossRef]
- Reckelhoff, J.F. Gender differences in the regulation of blood pressure. Hypertension 2001, 37, 1199–1208. [Google Scholar] [CrossRef]
- Reckelhoff, J.F. Mechanisms of sex and gender differences in hypertension. J. Hum. Hypertens. 2023, 37, 596–601. [Google Scholar] [CrossRef]
- Connelly, P.J.; Currie, G.; Delles, C. Sex differences in the prevalence, outcomes and management of hypertension. Curr. Hypertens. Rep. 2022, 24, 185–192. [Google Scholar] [CrossRef]
- Mashima, Y.; Konta, T.; Kudo, K.; Takasaki, S.; Ichikawa, K.; Suzuki, K.; Shibata, Y.; Watanabe, T.; Kato, T.; Kawata, S.; et al. Increases in urinary albumin and beta2-microglobulin are independently associated with blood pressure in the Japanese general population: The Takahata Study. Hypertens. Res. 2011, 34, 831–835. [Google Scholar] [CrossRef]
- Kudo, K.; Konta, T.; Mashima, Y.; Ichikawa, K.; Takasaki, S.; Ikeda, A.; Hoshikawa, M.; Suzuki, K.; Shibata, Y.; Watanabe, T.; et al. The association between renal tubular damage and rapid renal deterioration in the Japanese population: The Takahata study. Clin. Exp. Nephrol. 2011, 15, 235–241. [Google Scholar] [CrossRef] [PubMed]
- Liao, K.W.; Chien, L.C.; Chen, Y.C.; Kao, H.C. Sex-specific differences in early renal impairment associated with arsenic, lead, and cadmium exposure among young adults in Taiwan. Environ. Sci. Pollut. Res. Int. 2022, 29, 52655–52664. [Google Scholar] [CrossRef] [PubMed]
- Nagata, C.; Nagao, Y.; Shibuya, C.; Kashiki, Y.; Shimizu, H. Urinary cadmium and serum levels of estrogens and androgens in postmenopausal Japanese women. Cancer Epidemiol. Biomarkers Prev. 2005, 14, 705–708. [Google Scholar] [CrossRef] [PubMed]
- Nagata, C.; Konishi, K.; Goto, Y.; Tamura, T.; Wada, K.; Hayashi, M.; Takeda, N.; Yasuda, K. Associations of urinary cadmium with circulating sex hormone levels in pre- and postmenopausal Japanese women. Environ. Res. 2016, 150, 82–87. [Google Scholar] [CrossRef] [PubMed]
- Ali, I.; Engström, A.; Vahter, M.; Skerfving, S.; Lundh, T.; Lidfeldt, J.; Samsioe, G.; Halldin, K.; Åkesson, A. Associations between cadmium exposure and circulating levels of sex hormones in postmenopausal women. Environ. Res. 2014, 134, 265–269. [Google Scholar] [CrossRef]
- Bochud, M.; Jenny-Burri, J.; Pruijm, M.; Ponte, B.; Guessous, I.; Ehret, G.; Petrovic, D.; Dudler, V.; Haldimann, M.; Escher, G.; et al. Urinary Cadmium Excretion Is Associated with Increased Synthesis of Cortico- and Sex Steroids in a Population Study. J. Clin. Endocrinol. Metab. 2018, 103, 748–758. [Google Scholar] [CrossRef]
Figure 1.
Urinary β2-microglobulin as a predictor of blood pressure in females. Scatterplots relate systolic blood pressure (a) and diastolic blood pressure (b) to log(Eβ2M/Ccr) × 104 in men and women. Coefficients of determination (R2) and standardized β-coefficients for all scatterplots, numbers of participants in subgroups, and p-values are provided.
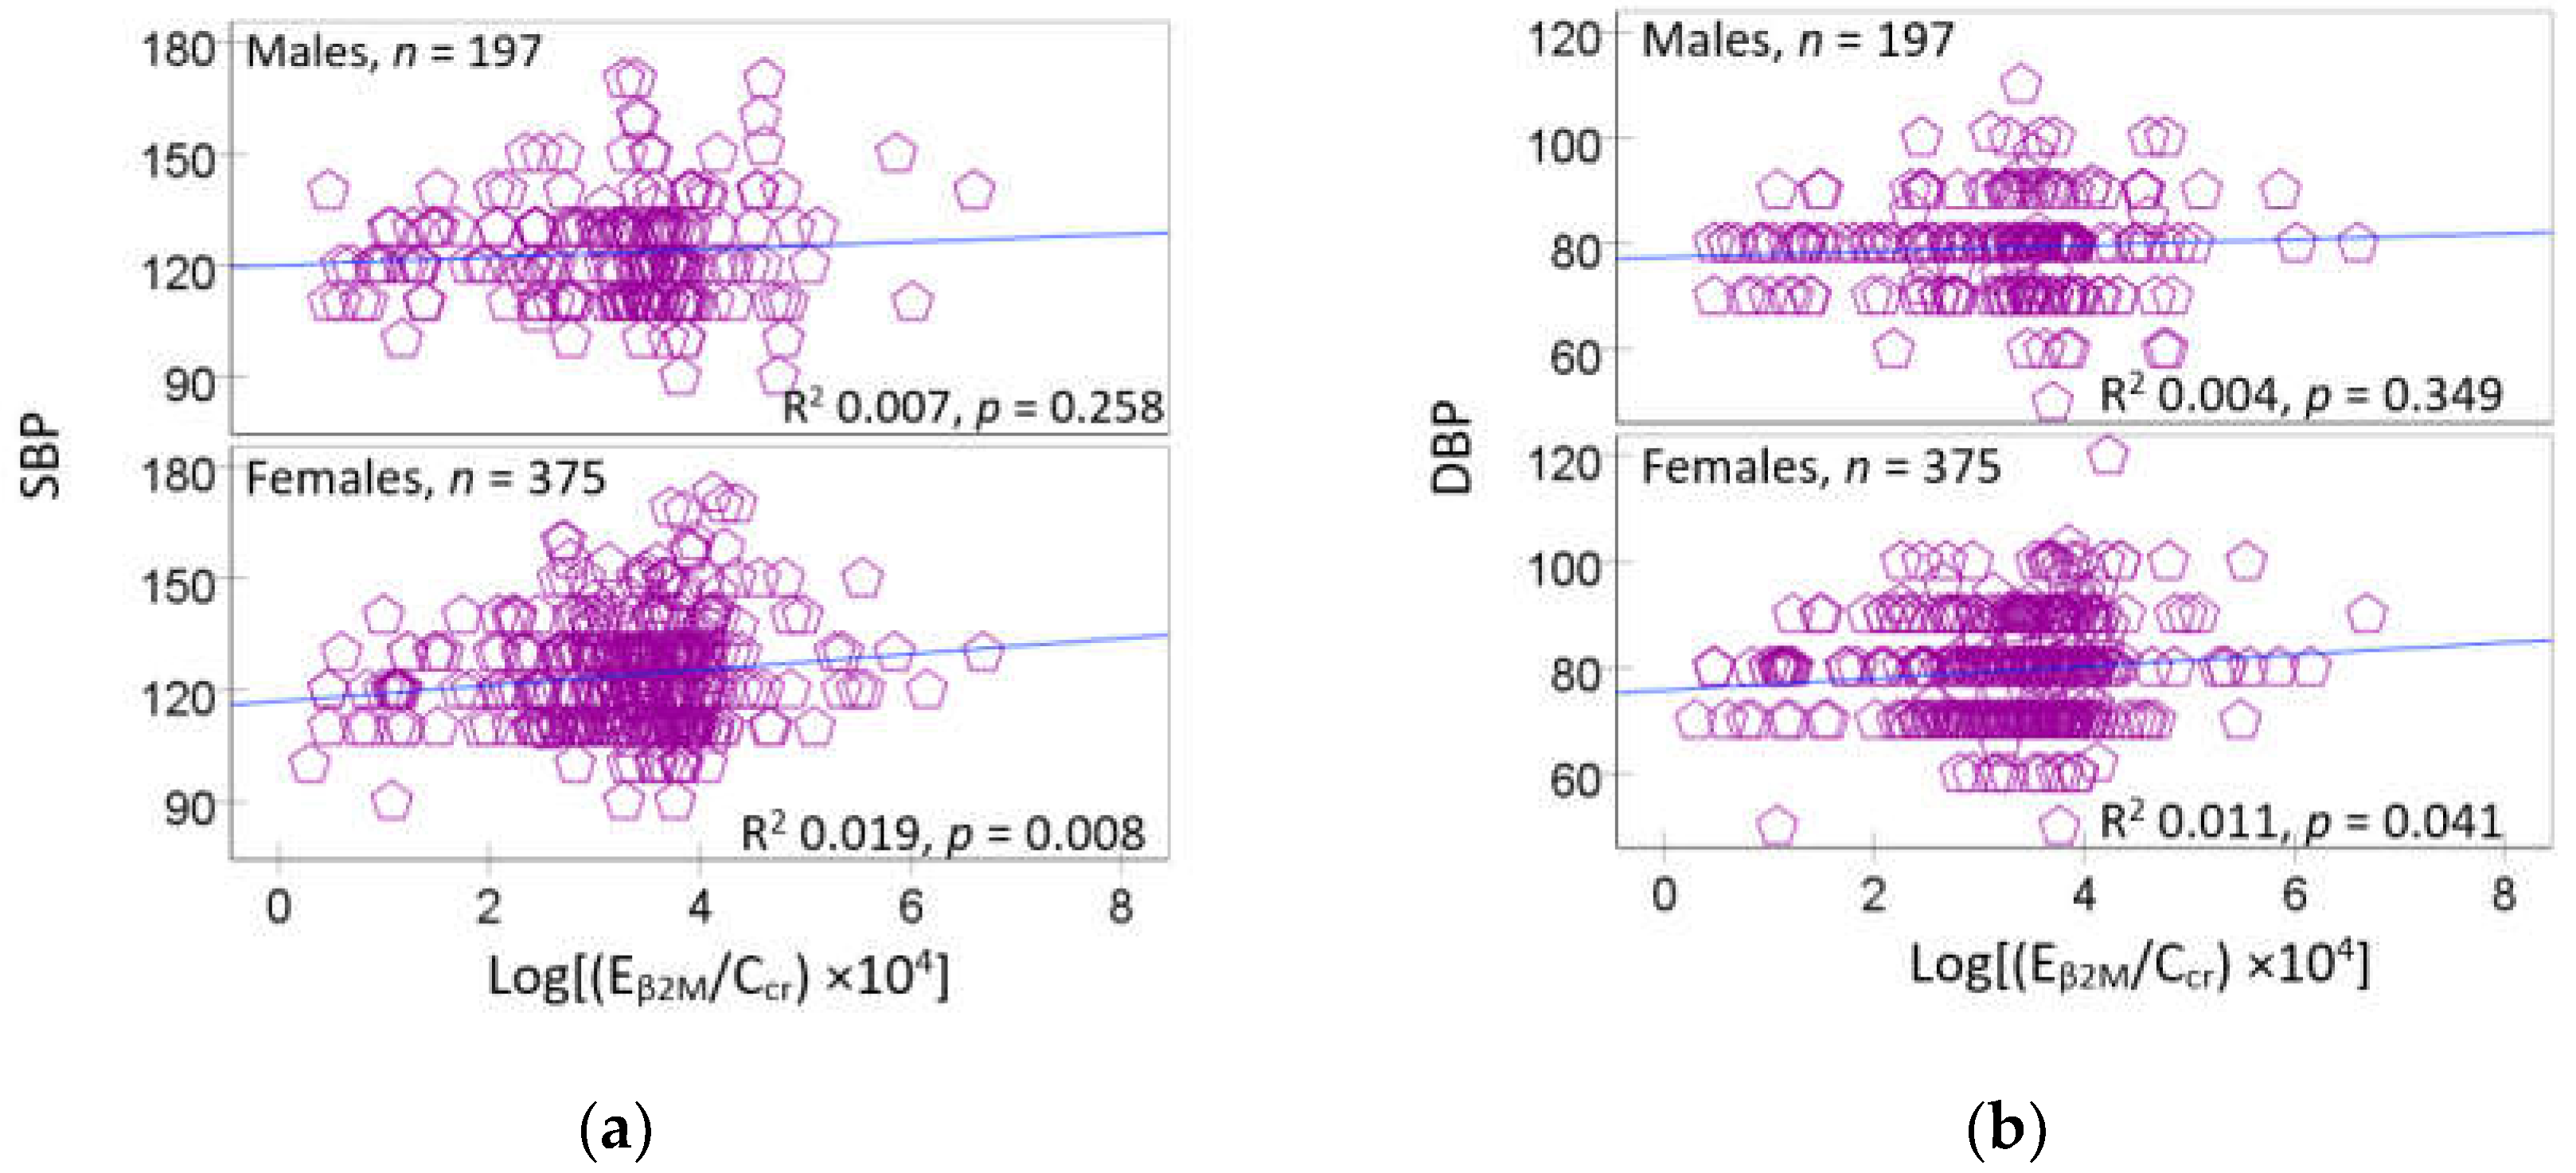
Figure 2.
Urinary β2-microglobulin as a predictor of blood pressure in subjects with a reduced eGFR. Scatterplots relate systolic blood pressure (a) and diastolic blood pressure (b) to log(Eβ2M/Ccr) × 104 in groups of subjects with normal and reduced eGFR. Coefficients of determination (R2) and standardized β-coefficients for all scatterplots, numbers of participants in subgroups, and p-values are provided.
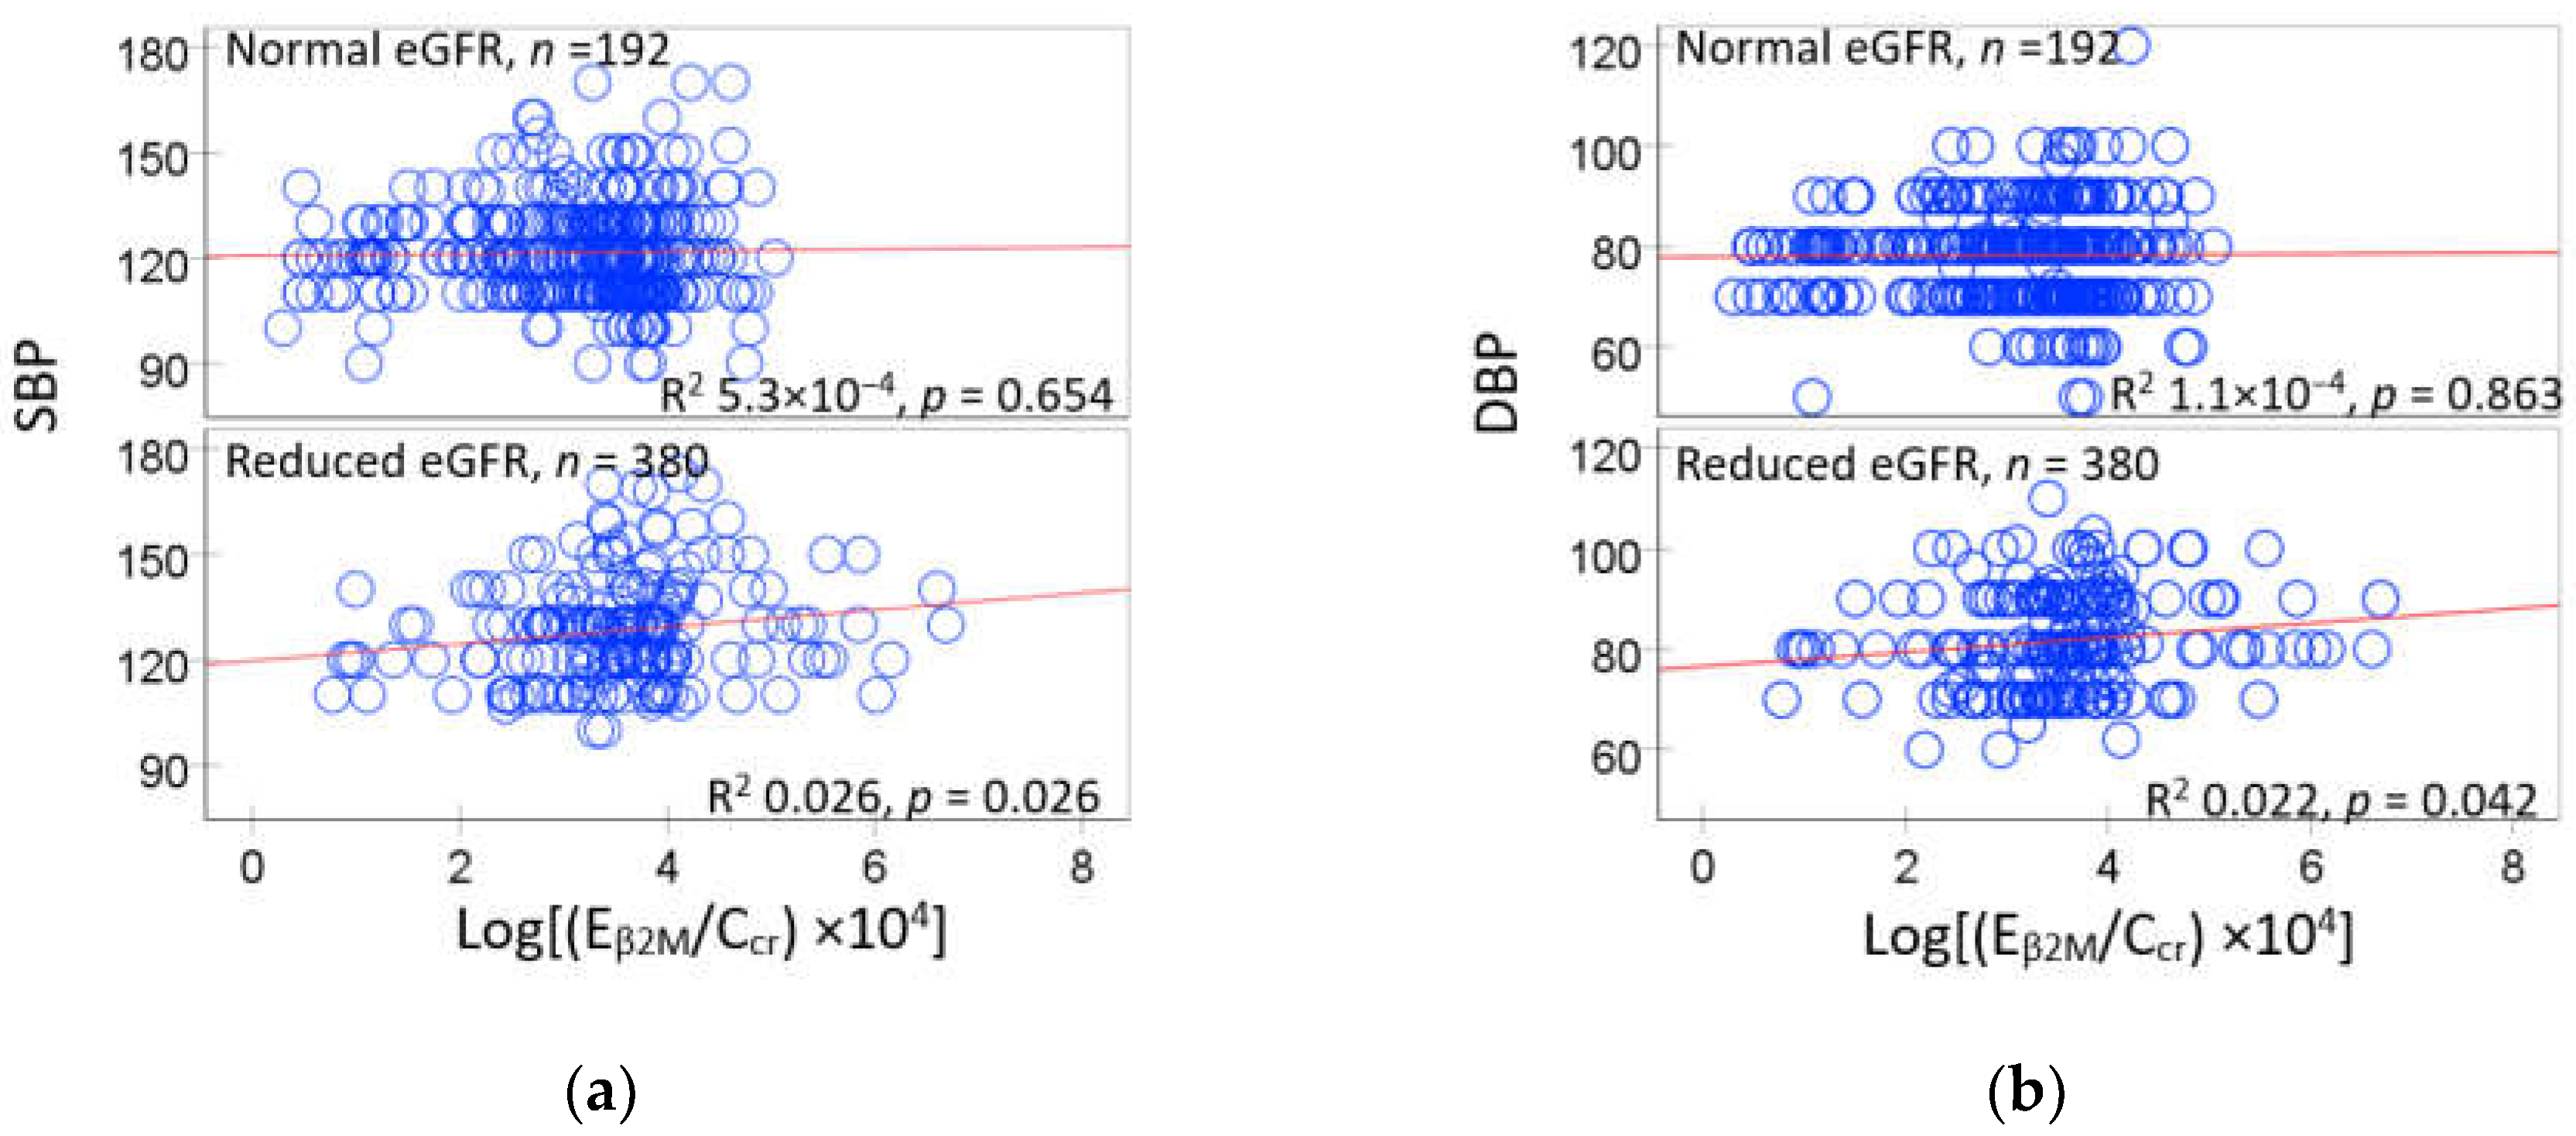
Figure 3.
A simple mediation model of eGFR as a mediator. The model depicts eGFR as a mediator of the effect of Cd on SBP (a), DBP (b), the Sobel tests for indirect effects of Cd on SBP (c) and DBP (d).
Figure 3.
A simple mediation model of eGFR as a mediator. The model depicts eGFR as a mediator of the effect of Cd on SBP (a), DBP (b), the Sobel tests for indirect effects of Cd on SBP (c) and DBP (d).
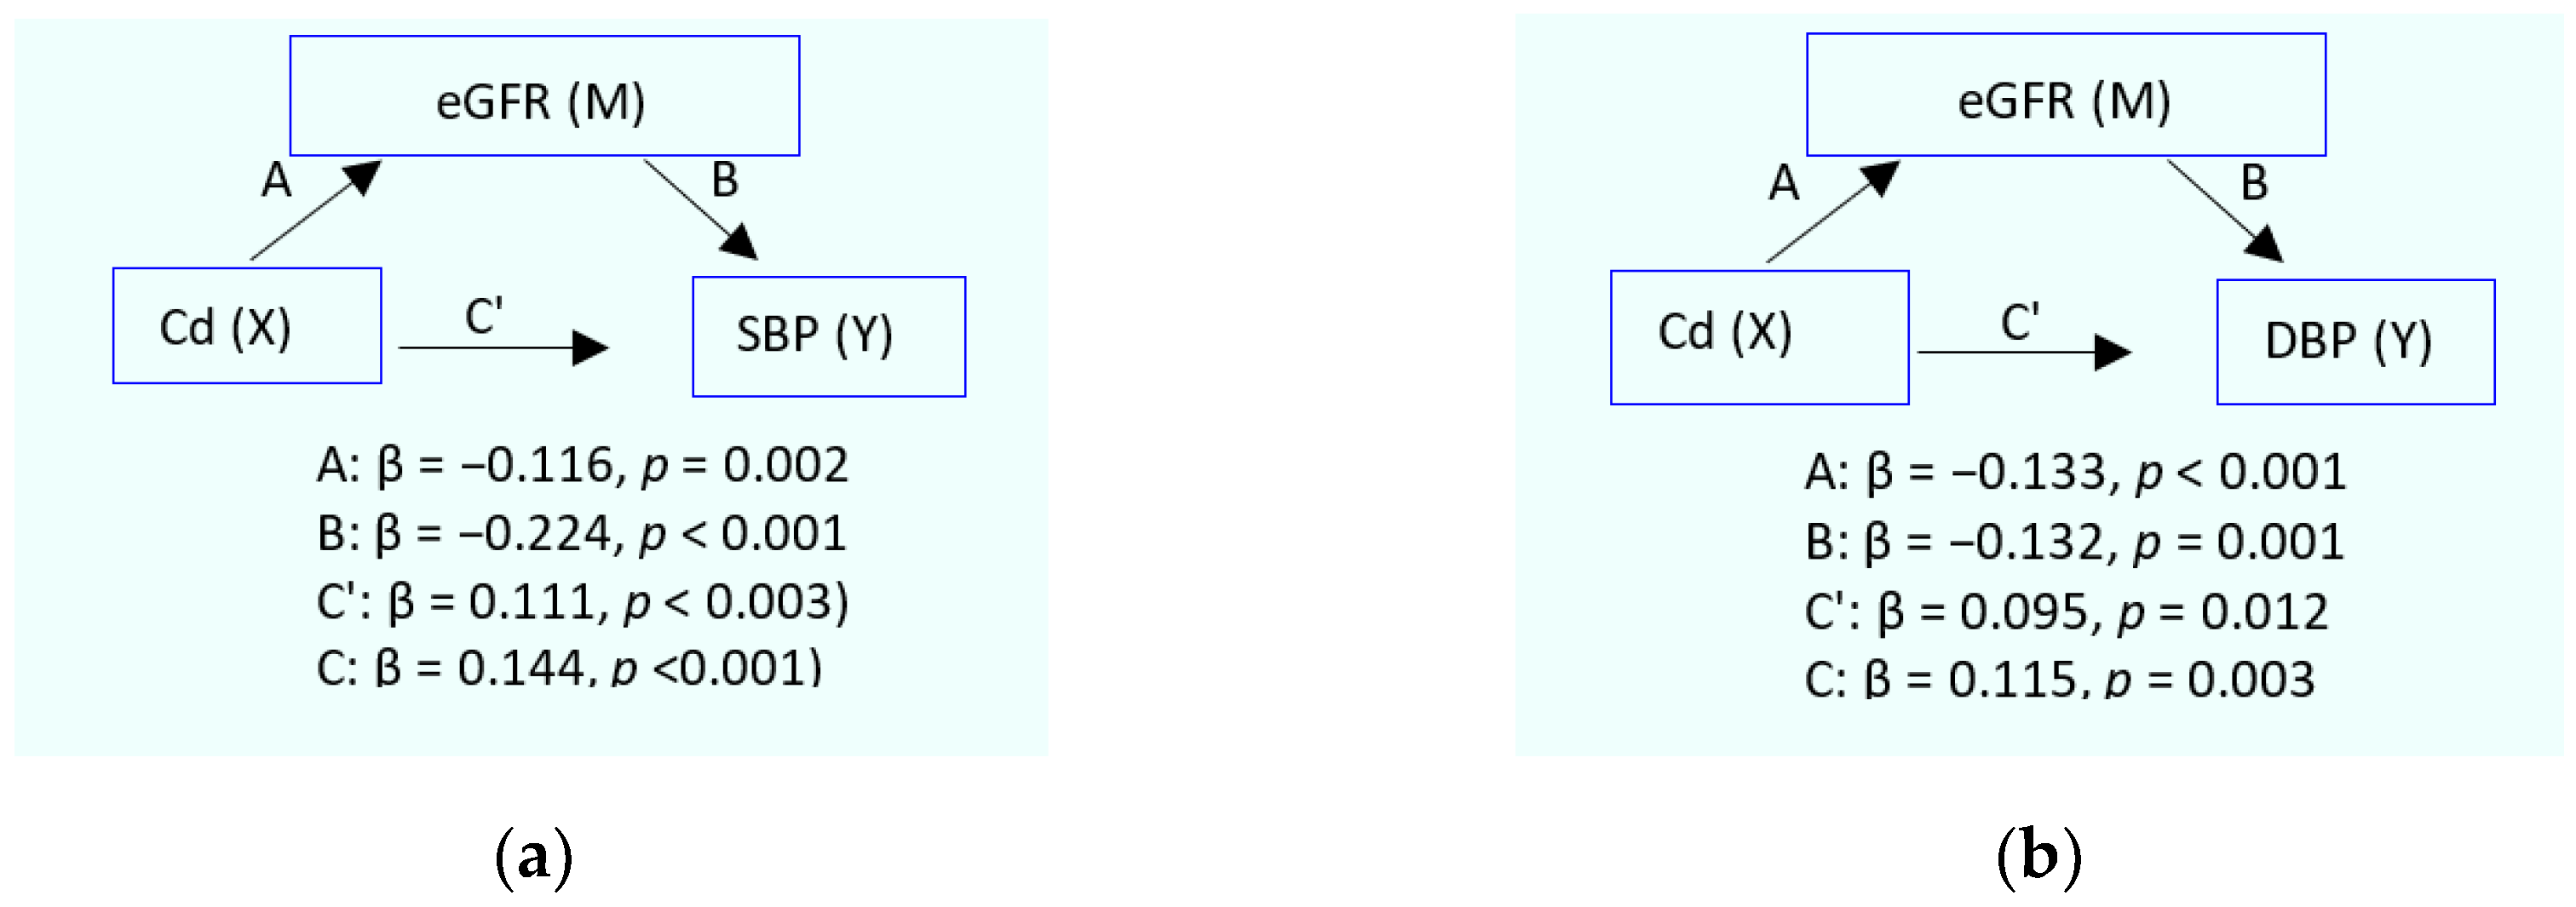
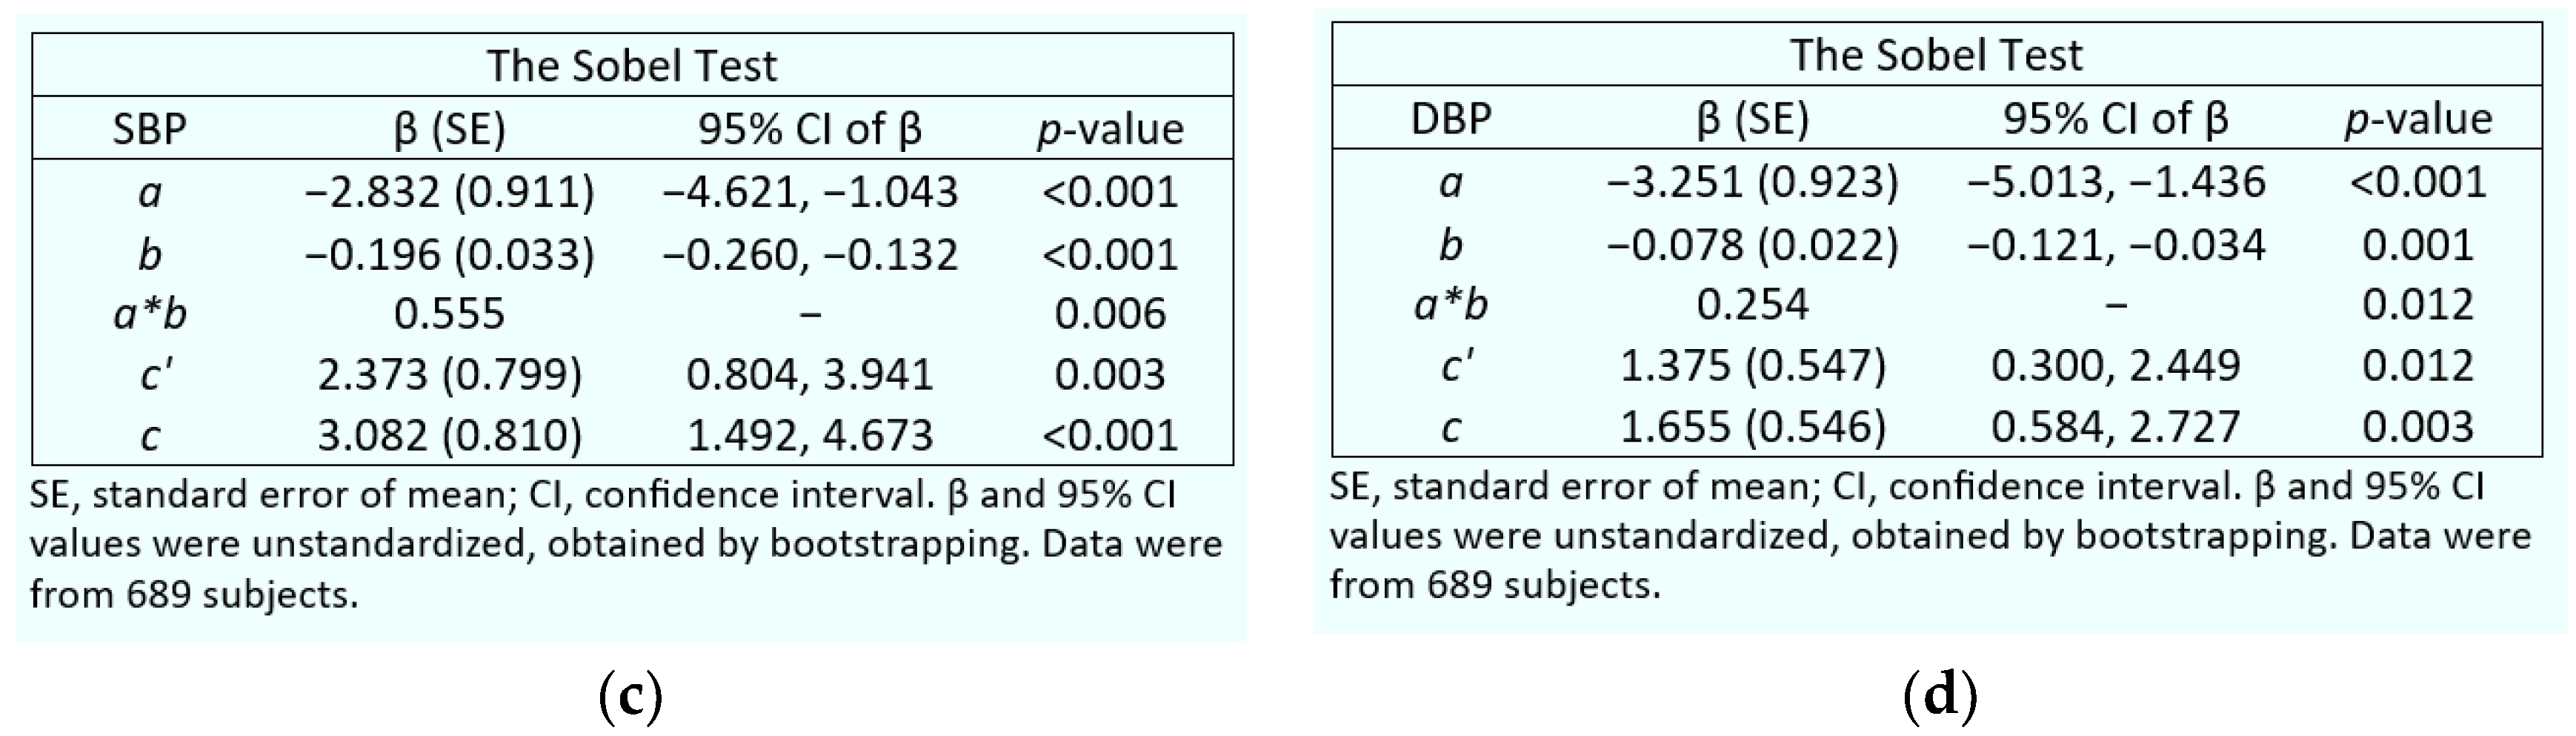
Figure 4.
A simple mediation model of β2-microglobulin as a mediator. The model depicts β2M as a mediator of the effect of Cd on SBP (a), DBP (b), the Sobel tests for indirect effects of Cd on SBP (c) and DBP (d).
Figure 4.
A simple mediation model of β2-microglobulin as a mediator. The model depicts β2M as a mediator of the effect of Cd on SBP (a), DBP (b), the Sobel tests for indirect effects of Cd on SBP (c) and DBP (d).
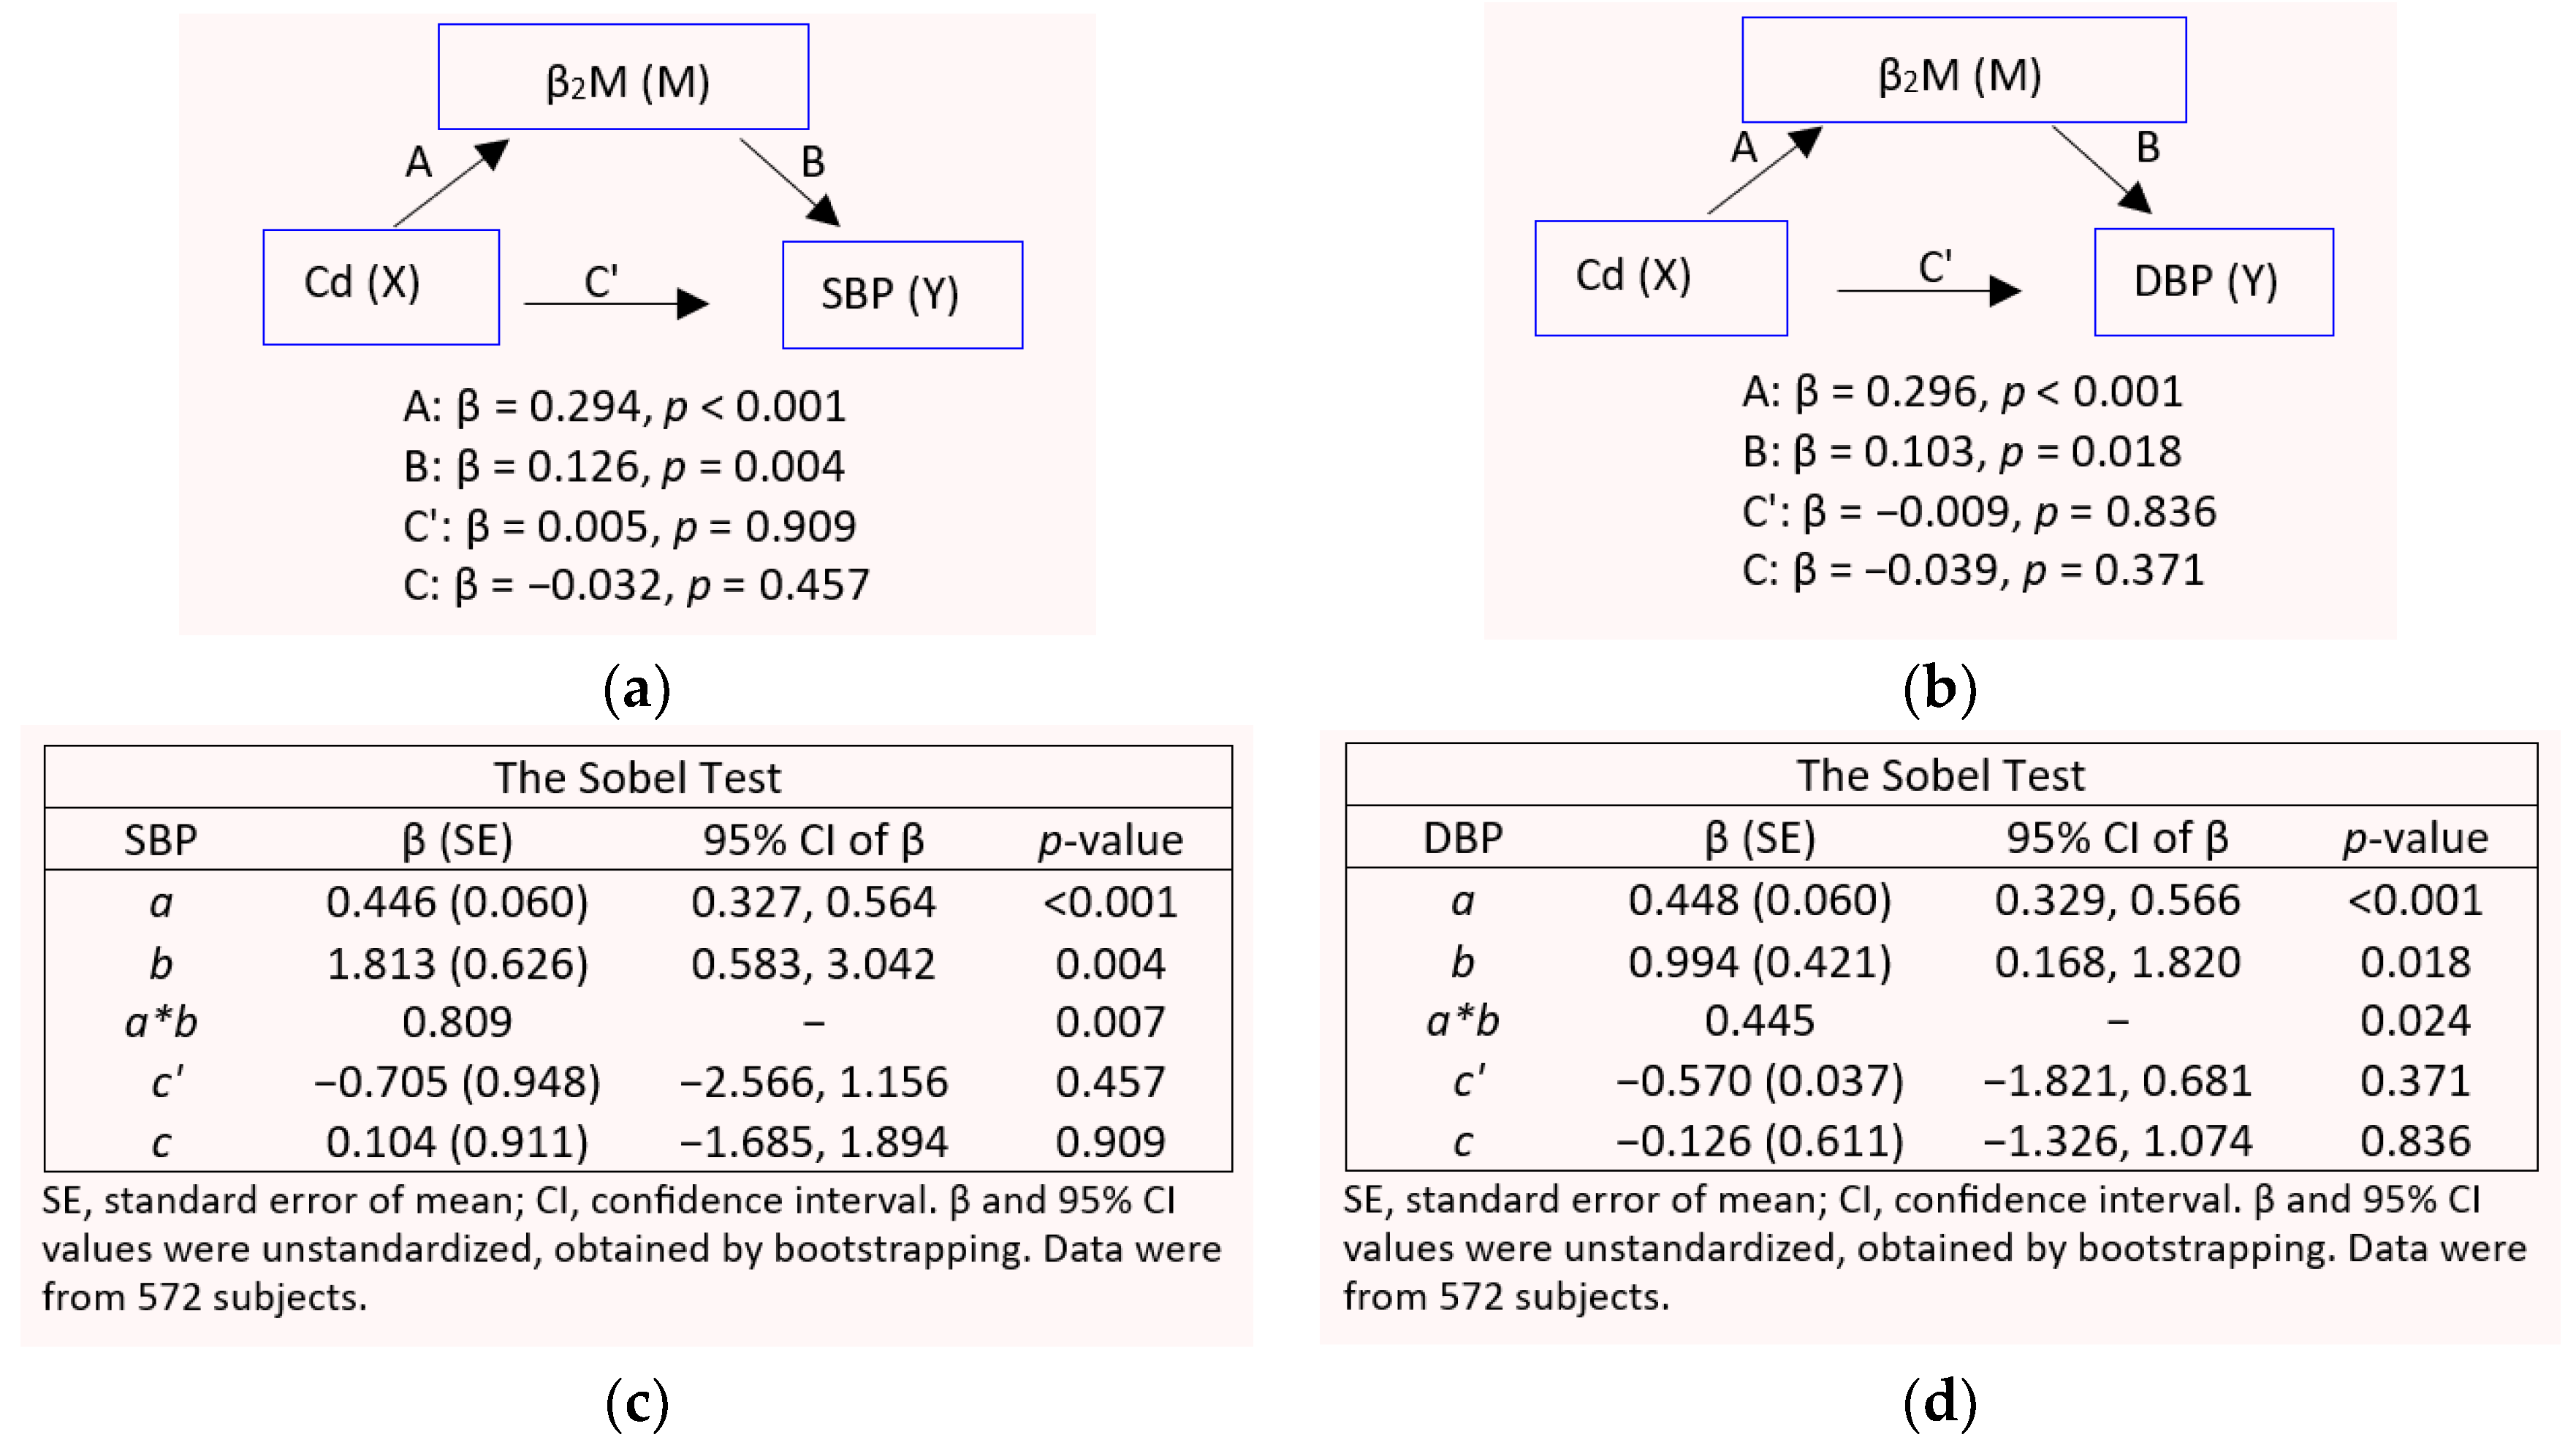

Table 1.
Descriptive characteristics of study subjects according to eGFR and gender.
| Parameters | All, n = 689 | Normal eGFR a | Reduced eGFR b | ||
|---|---|---|---|---|---|
| Males, n = 183 |
Females, n = 280 |
Males, n = 68 |
Females, n = 158 |
||
| % Female | 63.4 | 39.5 | 60.5 *** | 30.1 | 69.5 *** |
| % Smoking | 28.3 | 48.5 | 17.7 *** | 53.0 | 13.2 *** |
| % Hypertension | 32.4 | 22.4 | 30.7 * | 42.0 | 42.4 |
| Age, years | 42.7 (12.4) | 37.8 (11.5) | 40.8 (11.4) ** | 44.6 (12.5) | 51.0 (11.0) ** |
| Age range, years | 16−80 | 16−73 | 18−69 | 19−71 | 19−80 |
| BMI, kg/m2 | 23.4 (3.9) | 22.6 (3.1) | 23.7 (4.3) ** | 23.6 (3.6) | 24.6 (3.7) * |
| eGFR c, mL/min/1.73 m2 | 97.4 (17.6) | 106.7 (10.7) | 107.6 (10.0) | 77.9 (9.4) | 76.7 (11,0) |
| % eGFR ≤ 60 mL/min/1.73 m2 | 2.6 | 0 | 0 | 2.9 | 10.1 |
| Systolic blood pressure, mmHg | 121 (15) | 120 (14) | 119 (14) | 125 (16) | 126 (17) |
| Diastolic blood pressure, mmHg | 78 (10) | 77 (10) | 77 (10) | 80 (11) | 80 (11) |
| ECd/Ecr, µg/g creatinine | 2.77 (3.9) | 1.70 (2.88) | 3.29 (3.94) *** | 1.73 (2.74) | 3.51 (4.95) ** |
| Eβ2M/Ecr, µg/g creatinine | 253 (1975) | 83 (174) | 70 (118) * | 748 (2868) | 549 (3522) |
| % Eβ2M/Ecr ≥ 300 µg/g creatinine | 7.3 | 8.6 | 2.7 * | 16.7 | 10.0 |
| (ECd/Ccr) × 100, µg/L filtrate | 2.19 (3.27) | 1.46 (2.41) | 2.13 (2.56) ** | 2.04 (3.35) | 3.22 (4.69) * |
| (Eβ2M/Ccr) × 100, µg/L filtrate | 301 (2753) | 71 (151) | 46 (77) | 1297 (5949) | 597 (4182) |
| % (Eβ2M/Ccr) × 100 ≥ 300 µg/L filtrate | 6.8 | 7.9 | 1.8 ** | 16.7 | 10.1 |
n, number of subjects; BMI, body mass index; eGFR, estimated glomerular filtration rate; Cd, cadmium; β2M, β2-microglobulin; cr, creatinine; Ccr, creatinine clearance. a Normal eGFR was defined as eGFR values ≥ 90 mL/min/1.73 m2. b Reduced eGFR was defined as eGFR values < 90 mL/min/1.73 m2. c eGFR was determined using the CKD-EPI equations. Data for continuous variables were expressed as arithmetic mean and arithmetic standard (SD) values. Data for Eβ2M were from 548 subjects. All other data were from 689 subjects. For all tests, p ≤ 0.05 identifies statistical significance, determined with the Pearson chi-squared test for differences in percentages and the Mann–Whitney U for male–female differences in mean values. *** p < 0.001, ** p = 0.001–0.009, and * p = 0.012−0.050.
Table 2.
Characteristics of participants according to β2-microglobulin excretion rate.
| Parameters | All, n = 572 | Quartile of β2M excretion rate a | |||
|---|---|---|---|---|---|
| Quartile 1, n =142 |
Quartile 2, n =143 |
Quartile 3, n = 142 |
Quartile 4, n = 145 |
||
| % Female | 65.6 | 57.0 | 69.2 | 67.6 | 68.3 |
| % Smoking | 31.5 | 27.5 | 27.3 | 34.5 | 36.6 |
| % Hypertension | 37.1 | 34.5 | 31.5 | 28.7 | 43.4 |
| Age, years | 46.2 (10) | 44.2 (9.3) | 45.9 (10.2) | 45.0 (10.2) | 49.7 (9.6) *** |
| Age range, years | 16−80 | 16−68 | 18−74 | 18−70 | 21−80 |
| BMI, kg/m2 | 24.1 (3.8) | 24.3 (3.4) | 24.4 (4.4) | 24.0 (3.5) | 23.6 (3.5) |
| % BMI > 30 kg/m2 | 4.9 | 5.3 | 4.9 | 4.3 | 4.3 |
| eGFR b, mL/min/1.73 m2 | 96.8 (17.5) | 100.4 (14.4) | 99.6 (16.6) | 99.8 (17.5) | 87.6 (18.3)*** |
| % eGFR ≤ 60 mL/min/1.73 m2 | 3.1 | 0 | 0.7 | 1.4 | 10.3 *** |
| Systolic blood pressure, mmHg | 124 (14) | 122 (12) | 124 (14) | 122 (14) | 126 (17) |
| Diastolic blood pressure, mmHg | 79 (10) | 79 (8) | 79 (9) | 79 (10) | 81 (10) |
| ECd/Ecr, µg/g creatinine | 3.23 (4.13) | 2.05 (2.67) | 2.56 (3.34) | 3.50 (4.58) | 4.80 (4.99) *** |
| Eβ2M/Ecr, µg/g creatinine | 276 (2070) | 2.54 (2.54) | 21.4 (9.7) | 59 (21) | 1009 (4032) *** |
| % Eβ2M/Ecr ≥ 300 µg/g creatinine | 7.2 | 0 | 0 | 0 | 28.3 |
| (ECd/Ccr) × 100, µg/L filtrate | 2.56 (3.46) | 1.55 (1.98) | 1.86 (2.43) | 2.64 (3.50) | 4.14 (4.65) *** |
| (Eβ2M/Ccr) × 100, µg/L filtrate | 314 (2757) | 1.95 (1.89) | 15.7 (6.2) | 44 (12) | 1179 (5396) *** |
| % (Eβ2M/Ccr) × 100 ≥ 300 µg/L filtrate | 6.6% | 0 | 0 | 0 | 26.2 |
n, number of subjects; BMI, body mass index; eGFR, estimated glomerular filtration rate; Cd, cadmium; β2M, β2-microglobulin; cr, creatinine; Ccr, creatinine clearance. a Quartile of β2M excretion rate was based on (Eβ2M/Ccr) × 100. b eGFR was determined using the CKD-EPI equations. Data for continuous variables were expressed as arithmetic mean and arithmetic standard (SD) values. Data for Eβ2M were from 548 subjects. All other data were from 572 subjects. For all tests, p ≤ 0.05 identifies statistical significance, determined with the Pearson chi-squared test for differences in percentages and the Kruskal Wallis test for differences in mean values across the Eβ2M quartile groups. *** p < 0.001.
Table 3.
The prevalence odds ratios hypertension and β2-microglobulinuria in relation to cadmium excretion rate normalized to creatinine clearance.
Table 3.
The prevalence odds ratios hypertension and β2-microglobulinuria in relation to cadmium excretion rate normalized to creatinine clearance.
| Independent Variables/Factors | Hypertension | β2-microglobulinuria a | ||
|---|---|---|---|---|
| POR (95% CI) | p | POR (95% CI) | p | |
| Age, years | 1.059 (1.040, 1.078) | <0.001 | 0.998 (0.948, 1.050) | 0.926 |
| Gender | 1.477 (0.953, 2.290) | 0.081 | 2.165 (0.946, 4.955) | 0.068 |
| Smoking | 1.524 (0.974, 2.363) | 0.065 | 0.600 (0.266, 1.354) | 0.219 |
| BMI, kg/m2 | ||||
| < 24 | Referent | Referent | ||
| 24−30 | 2.080 (1.442, 3.001) | <0.001 | 0.605 (0.287, 1.276) | 0.187 |
| > 30 | 3.342 (1.481, 7.543) | 0.004 | 1.121 (0.230, 5.466) | 0.887 |
| ECd/Ccr quartile: (ECd/Ccr) ×100 µg/L filtrate | ||||
| Q1: < 0.18 | Referent | Referent | ||
| Q2: 0.18−0.70 | 1.078 (0.583, 1.994) | 0.811 | 0.574 (0.034, 9.658) | 0.700 |
| Q3: 0.71−2.73 | 2.522 (1.465, 4.342) | 0.001 | 6.982 (0.887, 54.93) | 0.065 |
| Q4: ≥ 2.74 | 2.787 (1.595, 4.871) | <0.001 | 10.67 (1.364, 83.40) | 0.024 |
POR, prevalence odds ratio; CI, confidence interval; BMI, body mass index; a β2-microglobulinuria was defined as Eβ2M/Ccr ≥ 3 µg/L filtrate. Numbers of subjects in the calculation of POR values for hypertension and β2-microglobulinuria were 689 and 548, respectively. For all tests, p-values ≤ 0.05 indicate statistical significance.
Table 4.
Predictors of rising systolic and diastolic blood pressure levels.
| Independent Variables/Factors |
SBP or DBP | |||||
|---|---|---|---|---|---|---|
| All, n = 548 |
Normal eGFR a n = 362 |
Reduced eGFR b n = 186 |
||||
| β | p | β | p | β | p | |
| Model 1: SBP | ||||||
| Age, years | 0.323 | <0.001 | 0.281 | <0.001 | 0.250 | 0.002 |
| BMI, kg/m2 | 0.188 | <0.001 | 0.201 | <0.001 | 0.158 | 0.029 |
| Log[(ECd/Ccr) ×105, µg/L filtrate | −0.037 | 0.400 | −0.038 | 0.510 | −0.012 | 0.885 |
| Log(Eβ2M/Ccr) ×104, µg/L fltrate | 0.080 | 0.059 | 0.000425 | 0.993 | 0.182 | 0.013 |
| Smoking | −0.059 | 0.207 | −0.008 | 0.888 | -0.138 | 0.094 |
| Gender | 0.105 | 0.029 | −0.106 | 0.080 | 0.087 | 0.283 |
| Adjusted R2 | 0.145 | <0.001 | 0.106 | <0.001 | 0.103 | <0.001 |
| Model 2: DBP | ||||||
| Age, years | 0.121 | 0.006 | 0.114 | 0.045 | −0.035 | 0.675 |
| BMI, kg/m2 | 0.199 | <0.001 | 0.229 | <0.001 | 0.090 | 0.231 |
| Log[(ECd/Ccr) ×105, µg/L filtrate | −0.038 | 0.406 | −0.068 | 0.245 | −0.051 | 0.563 |
| Log(Eβ2M/Ccr) ×104, µg/L fltrate | 0.078 | 0.081 | −0.004 | 0.945 | 0.192 | 0.012 |
| Smoking | −0.041 | 0.406 | 0.007 | 0.903 | −0.132 | 0.125 |
| Gender | 0.054 | 0.286 | 0.034 | 0.585 | 0.074 | 0.379 |
| Adjusted R2 | 0.054 | <0.001 | 0.053 | <0.001 | 0.023 | 0.114 |
SBP, systolic blood pressure; DBP, diastolic blood pressure; adjusted R2, coefficient of determination. a Normal eGFR was defined as eGFR values ≥ 90 mL/min/1.73 m2. b Reduced eGFR was defined as eGFR values < 90 mL/min/1.73 m2. Adjusted R2 indicates the fraction of SBP and DBP variability that all independent variables explained, while β indicates strength of association of SBP or with six independent variables (first column). p-values ≤ 0.05 indicate statistically significant associations of independent variables and blood pressure.
Disclaimer/Publisher’s Note: The statements, opinions and data contained in all publications are solely those of the individual author(s) and contributor(s) and not of MDPI and/or the editor(s). MDPI and/or the editor(s) disclaim responsibility for any injury to people or property resulting from any ideas, methods, instructions or products referred to in the content. |
© 2024 by the authors. Licensee MDPI, Basel, Switzerland. This article is an open access article distributed under the terms and conditions of the Creative Commons Attribution (CC BY) license (http://creativecommons.org/licenses/by/4.0/).
Copyright: This open access article is published under a Creative Commons CC BY 4.0 license, which permit the free download, distribution, and reuse, provided that the author and preprint are cited in any reuse.


