
Submitted:
10 October 2025
Posted:
11 October 2025
You are already at the latest version
Abstract
Inaccurate citrate anticoagulant concentration in a blood collection tube after specimen collection can influence the results of coagulation tests. A comprehensive methodology is necessary to reveal differences between the tubes of different brands. We provide insight into anionic-cationic composition and pH of anticoagulant solution in commercial tubes by using high-performance ion exchange chromatography on a purified water model. We made the anticoagulant-volume accuracy assessment possible by a direct dye-dilution method. The results revealed differences between the tubes of two producers, Greiner BIO-ONE (A, and A(nr)), and BD (C). Tubes C have the most accurate anticoagulant amount. Both brands contain buffered citrate. The method of buffer preparation is not a source of interferant for spectrometric method of the tubes’ quality evaluation. Acetate, formate, chloride, nitrite, sulphate, oxalate, bromide, and nitrate impurities were determined in anticoagulant solutions, all in tubes A and some in the others. Tubes C exhibit the highest contamination with cations.
Keywords:
blood collection tubes
; citrate anticoagulant concentration
; ion exchange chromatography
; anionic contaminants
; cationic contaminants
; dye-dilution method
; anticoagulant volume accuracy
1. Introduction
All steps of the total laboratory testing process can contribute to errors [1]. Blood collection tubes, as medical devices, are involved in pre-analytical stage. Professional bodies analyse processes and promote good laboratory practices to reduce errors [2,3]. Blood collection tubes quality is usually evaluated on blood samples by comparison.
Citrate anticoagulant tubes contain anticoagulant solution. To ensure correct anticoagulant concentration in blood after specimen collection, the anticoagulant volume, concentration, and draw volume should all be correct, what is difficult to evaluate.
We previously suggested methods providing direct insight into quality of the tubes [4,5]. First, we suggested a direct spectrometric method to evaluate the quality on a water model. The pH adjustment was necessary, since the anticoagulant can be buffered or unbuffered. The method proved useful, but in one of the tube brands, C, an unknown additive or impurity influenced the absorption spectrum of citrate. Next, we introduced ion exclusion chromatograph for comparison and interferant identification. The source of the problem was not identified.
There are different opinions regarding the clinical implications of buffered or unbuffered citrate [6,7]. Citrate of the problematic tubes was declared buffered, but not of the others, what raised a doubt if the origin of the problem lies in a method of buffer preparation, potentially involving a UV light absorbing substance.
For the determination of anticoagulant volume, we offered an indirect method, comprising two chromatographic steps, but a direct method would have been more accurate. The dye-dilution method might be a choice.
Dye-dilution technique for cardiac output measurements in dogs, which was introduced in the early fifties [8], became widely used in medicine at the beginning of the sixties [9], and remains in use as a diagnostic tool [10]. Revaluation of the Evans blue-dye dilution method of plasma volume measurement as another medical application remains widely recognised [11]. Applications to flow systems not associated or related to medicine or similar disciplines are far less frequent, one of the more recent is dye-dilution based evaluation of mixing in a microfluidic system [12].
Calibration of micropipettes of the volumes between 1 and 50 µL, by using a solution of nicotinamide as a light absorbing substance, which was with a blow-out technique transferred into water of known volume, was an early application of the method in discrete systems [13]. With the dye-dilution method, the volumetric accuracy and precision of positive displacement microlitre diluting device were evaluated [14], validation and verification of pipettes mounted on an automated liquid handler were performed [15], sub-microlitre volume dispensing was assessed with a dual-dye method [16], and a single dye approach [17].
Ion exchange chromatography involving the IonPac AS 11 column enables the determination of citrate, together with other organic ions. Isocratic and gradient methods were reported [18,19,20,21,22,23,24].
Clinical evaluations of low-volume tubes receive more attention [25,26,27]. In this study, we limit ourselves to the low volume, 1.8 mL draw volume citrate tubes of producers for which we previously detected problems.
The research objectives of this paper can be expressed in four hypotheses (H1 to H4):
H1: The tubes C presumably have the citrate anticoagulant buffered, and the tubes A unbuffered, according to declarations. The pH measurements after introducing boiled purified water into the tubes A and C, in a volume corresponding to the nominal draw volume, is going to confirm the difference in pH values.
H2: An easy-to-perform, rapid dye-dilution method for preanalytical determination of anticoagulant solution volume in blood collection tubes, that is going to differentiate effectively volumes around 200 µL, can be developed to replace the time-consuming and less reliable indirect method.
H3: By switching from ion exclusion chromatography to anionic ion exchange chromatography, better separation of the citrate chromatographic peak from the system peak can be achieved, and previously undetectable anionic contaminants can become recognisable.
H4: The determination of anionic-cationic composition of anticoagulant solution is going to reveal if the buffered citrate anticoagulant of the tubes B is prepared from trisodium citrate and citric acid or by using some other auxiliary buffering agent, which could have affected the ultraviolet range absorption spectra of the previously suggested method for the preanalytical quality evaluation of the blood collection tubes.
2. Results
2.1. Anions Determination with Ion Exchange Chromatography—Method Development and Performance
As Figure 1 reveals, two separate isocratic methods were necessary, since the requirements for citrate quantification were contradictory to the requirements for anionic impurities determination. Chromatograms of the tubes A, A(nr), C, A_old, B_old, and C_old are presented. A suffix (nr) means non-ridged. More details on the tubes are given in Section 4.1. A suffix _citrate method distinguishes the chromatograms for citrate quantification from the chromatograms of the impurities determination.
The two dominant peaks at approximately 4 and 8.5 minutes pertain to citrate; the between-method difference is reflected in their shape and size. More details on other peaks are given in relation to Figure 2.
As Table 1 demonstrates, the within-day repeatability of retention times, tr, and peak area is comparable to the ion exclusion method for citrate determination [5], but the elution time is shorter, and citrate peak is better separated from the system water peak (Figure 1), as the hypothesis H3 assumed.
The relative percent standard deviation sr(%), appearing in Table 1, is defined by equation (1) and derived from the sample standard deviation, s, and the sample mean, .
Figure 2 presents the impurities which were possible to quantify in anticoagulant solutions of the tubes of different brands and confirms the second part of the hypothesis H3, assuming that additional anionic impurities are going to be revealed by switching from ion exclusion to ion exchange chromatography. The amount concentrations are provided at the end of the Results section.
Within-laboratory reproducibility of calibration equations for citrate determination is demonstrated in Table 2; x was mass concentration in mg/L and y was peak area.
Table 3 provides insight into the precision and accuracy of citrate determination at three concentration levels. Standard uncertainty of interpolation of concentration x0 from the calibration line equation is denoted by sx0 and evaluated by applying Equation (2). The symbols , y0, , and , not explained previously, stand for the concentration, the peak area, and the coordinates of the centroid of the calibration line equation, respectively. The symbol m stands for the number of calibration points (in Table 3 was for m used 5).
The bias, B, is calculated from equation (3), τ designates the true or expected value.
Equation (4) defines the relative percent bias, Br(%).
Method performance parameters confirm that the ion chromatographic method is fit for the purpose of determining citrate and identifying anionic impurities, reliable results of the tubes evaluations can be expected.
2.2. Cations Determination with Ion Exchange Chromatography—Method Enhancement and Performance
Figure 3 demonstrates the enhancement of the quality of separation for the determination of sodium, potassium, magnesium, and calcium in anticoagulant solutions of the three brands, if we compare the chromatograms with those of the previous method [5]. The replacement of the 22 mmol/L eluent with the 20 mmol/L eluent makes a difference.
Table 4 presents the within-day repeatability of retention times, tr and the peak area of sodium peak of composite anticoagulant samples of blood collection tubes of the three brands.
Table 5 demonstrates the within laboratory reproducibility of regression parameters of calibration line equations for the determination of sodium.
Table 6 confirms accuracy and precision of sodium determination.
Method performance parameters confirm that the ion chromatographic method is fit for the purpose of determining sodium; reliable results of the tubes evaluations can be expected.
2.3. pH of Anticoagulant Solution
Table 7 summarises the pH values determined in blood collection tubes of the three brands after the addition of boiled Milli-Q water in a volume equal to the nominal draw volume.
2.4. Determination of Anticoagulant Solution Volume
A brief overview of the experimental steps of the dye-dilution method makes the results of this section easier to follow. The procedure outline is as follows:
- Preparation of a working dye solution from a stock dye solution.
- Preparation of calibration solutions from the working dye solution.
- Dye dilution of the working dye solution involving either the examined model solutions or the blood collection tubes.
- Spectrometric measurements, calibration line equation definition, interpolation of the dye mass concentrations from the absorbance measurements pertaining to the examined model solutions or to the blood collection tubes by using the calibration line equation.
- Calculation of the anticoagulant volumes by regarding the experimentally obtained dye dilution insight.
2.4.1. Dye Choice and Calibration
Table 8 summarises the linear regression parameters of the calibration line equations (y = a × x + b) of the dyes Tartrazine and Erioglaucine. The citrate added to the dye name means that citrate concentration was adjusted; if the pH follows, it was adjusted too. For the Series 0-3, conditions were the same as stated in the preceding cell.
2.4.2. Volume Prediction – Proof-of-Concept and Method Performance
As the proof-of-concept, the volume prediction capability test of the dye-dilution method was performed. The results are summarised in Table 9. The dye dilutions modelled the dye concentrations as would have been achieved with the dye-dilution method performed on the tubes with the 150, 180, 200, or 220 μL anticoagulant volume. The model solutions evaluation was based on the absorbance measurement and the Series 0 calibration. The interpolated dye mass concentration, γDTM, the dye working solution mass concentration, γD, and the dye volume, VD, define the corresponding anticoagulant volume, as stated in equation (5).
In the continuation, we explain the parameters, which appear in Table 9. Equation (6) summarises the t-test expression.
The quantity generally presented as x is volume, and the true or expected values are the nominal volumes stated in the head of Table 9.
The relative percent errors, er(%), as specified by equation (7):
are given in Table 10, for 36 volume predictions obtained for the dyes model solutions during the three experimental series (S1-S3) in which the Series 1 to 3 calibration line equations were applied (Table 8). The results demonstrate the method’s performance. The p-values of the single-factor ANOVA are given at the end of the lines if the expected volume was the controlled factor. If the experimental series was the controlled factor, they are provided at the bottom of the columns, respectively.
2.4.3. Anticoagulant Volume Determination in Blood Collection Tubes
The single-factor ANOVA was applied to the results of the dye-dilution method predictions of the anticoagulant volume in the tubes of the three brands (Table 11). The tube brand was the controlled factor.
Tukey’s honestly significant difference (HSD) test was applied to evaluate the differences between the means. The qk,α, MSWG, and n, in equation (8), denote the q-distribution for k groups, the mean square within groups and the sample size, respectively.
The asterisks in Table 11 indicate which differences between the group’s means proved significant.
2.5. Anionic-Cationic Composition
Concentrations of the predominant ions, determined in parallel in the tubes of the three brands after the addition of Milli-Q water in a volume corresponding to the nominal draw volume, are given in Table 12.
Anionic impurities retention times and amount concentrations determined in composite samples of anticoagulant solutions of the tubes of different brands are summarised in Table 13.
3. Discussion
3.1. pH of Anticoagulant Solution
All pH values, measured immediately after the pre-boiled Milli-Q water in a volume corresponding to the nominal draw volume was introduced into the tubes A, A(nr), and C, by not being far off the pH 6 (Table 7), confirm similarity between the brands, even though only the producer C declares the anticoagulant solution buffered. The unbuffered sodium citrate model solution, measured along, exhibited a pH of 8.63. A laboratory-prepared phosphate reference buffer served as a control of the reliability of measurements. The pH of 6.80, measured at 24 °C, did not differ much of the reference pH values of 6.865, as reported by Bates, for 25 °C [28].
Single-factor ANOVA with the blood collection tube brand as a controlled factor confirmed the significant differences between the mean pH values of the groups (p = 2.76 × 10⁻¹⁰). All the mean differences between A and A(nr), between C and A, and between C and A(nr), by being 0.0390, 0.1978, and 0.2368, exceeded the HSD of 0.0258 and 0.0362, at the 0.05 and 0.01 significant levels, respectively.
If the tubes are considered an industrial product, different brands are all significantly different, but on the other hand, the differences probably have no clinical implications, even though it is important to know that the tubes A and A(nr) also contain the buffered citrate, despite of not being specified. The hypothesis H1 presuming a pH difference between the tubes A and C was not confirmed.
3.2. Determination of Anticoagulant Solution Volume
Adequate anticoagulant level in a blood specimen can only be reached if the draw volume, the tube anticoagulant amount and anticoagulant volume at the instant of specimen collection are all correct.
Until now, no direct method for the determination of anticoagulant volume in blood collection tubes before their intended use for specimen collection was available. We previously suggested an indirect approach comprising three steps [4]. During the first, the average anticoagulant amount per tube is calculated from the citrate anticoagulant concentration determination in a composite sample. During the second, the anticoagulant concentration is determined after purified water in a volume corresponding to the nominal draw volume is added to individual tubes. Finally, the anticoagulant volume in a tube before dilution is derived. Indirect methods are never the most desirable, since their results are associated with additional sources of uncertainty if compared to direct methods.
The gravimetric approach, which is the most obvious solution for volume evaluations, is not feasible in this case, since the liquid is not delivered but already contained in a tube. Volume determination by differential weighing is time-consuming. It requires emptying, cleaning and drying the tube, and the density of the anticoagulant solution should be known. The dye-dilution method proved a rapid alternative for liquid dispensing devices for microtiter plate format [15].
Dong et al confirmed the comparability of the spectrometric and gravimetric calibration procedure on the example of 200 µL volume, measured with an Eppendorf pipette [29]. The dye-dilution method can be assumed a potent option for the anticoagulant volume determination in blood collection tubes.
We set the following requirements for method development:
- The approach should enable direct spectrometric measurements in blood collection tubes.
- The spectra of a selected dye should not be influenced by changes in citrate media.
- Citrate should be added to the calibration solutions, model solutions, and a blank to mimic the composition of anticoagulant in blood collection tubes to avoid differences in the optical density. The composition should be adjusted so that a dilution with Milli-Q water in a proportion of one to nine results in a solution of pH 6.0. The nominal anticoagulant concentration and volume are assumed to be compliant with the declaration, and the required anticoagulant amount is derived from them.
- The calibration range should be selected so that the linearity of the absorbance dependence on the dye mass concentration is confirmed. The absorbance of the dye solutions corresponding to the dilution with the nominal anticoagulant volume should be evaluated close to the middle of the range and as close to 0.434 as possible.
- Differentiation of volumes around the nominal anticoagulant volume of 200 µL is essential.
In the dye-dilution experiments involving titer plates, the dedicated spectrometric setups are already involved [15,16]. A spectrometric probe can offer a similar vertical measuring geometry but needs to be introduced into the solution. The fibre optics Dip Probe Coupler attached to the Varian Cary 50 UV-Vis proved suitable for measurements in low volumes to fulfil requirement 1 of the method development. We observed the differences in the wall thickness of blood collection tubes of different producers influencing the liquid level at equal volumes. We confirmed that the total solution volume of 500 µL enables the probe to dip adequately no matter the tube brand. Since it was previously observed that not all tubes are water-tight [4], we set a dye volume addition to 400 µL to allow for anticoagulant volume determination down to half of the nominal value, namely 100 µL. Regarding conformity, this limit seems reasonable, since by assuming the correct anticoagulant amount and draw volume, a dilution factor is already changed from tenfold to nineteenfold, and the anticoagulant concentration is increased from 10.9 to 11.47 mmol/L. Blood, after being sucked into such tube would come in contact with the citrate anticoagulant solution of a concentration of 218 mmol/L, which is twofold nominal. Quantitative evaluations beyond these limits are probably of no practical interest.
To choose an appropriate dye as requested by requirement 2, we preliminarily evaluated the influence of changing citrate media composition and pH on the acquired absorption spectra of four candidate food dyes, namely Erytrosine, Sunset Yellow, Tartrazine, and Erioglaucine. We examined spectra while gradually diluting trisodium citrate solution or citric acid solution, or gradually adding citric acid to citrate medium, or vice versa. The Tartrazine and Erioglaucine spectra proved the least prone to the medium influence. The same two dyes appeared in literature, in drug delivery studies, even though not in equal medium, but in 0.9% sodium chloride, for which the absorption maxima of 430 and 630 nm were reported [30]. Our observations in 36.33 mmol/L citrate medium were 427 nm and 629 nm, respectively, for Tartrazine and Erioglaucine as the prospect dye candidates.
Because it is well known since the early dye-dilution studies that an unmatched dye medium leads to erroneous results [31], to fulfil requirement 3, the citrate medium had to be corrected for if not present. Since we confirmed that the tubes of all three brands contain the buffered citrate (Table 7), the pH adjustment of the citrate medium was justifiable. We confirmed that 200 µL of trisodium citrate solution, with concentration of 109 mmol/L and an amount of 21.8 µmol, requires equal volume of 0.1000 mol/L standard HCl solution, to ensure that after the 10-fold dilution the solution reaches a pH of 6.0. We further confirmed that the presence of Tartrazine or Erioglaucine dye does not affect the pH.
From an early patent [32], we learn that for the preparation of 1 L of buffered citrate anticoagulant solution of pH 6.1 with a concentration of 109 mmol/L or 129 mmol/L; 83.98 mmol of citrate and 21.03 mmol of citric acid; or 108.8 mmol of citrate and 21.03 mmol of citric acid are required, respectively. Contrary to the total citrate concentration of 109 mmol/L as stated in the patent, a simple calculation confirms that the first two amounts of 83.98 mmol and 21.03 mmol do not add up to 109 mmol but 105 mmol, resulting in a 105 mmol/L concentration. Therefore, the citric acid amount fraction of the total citrate of the 105 mmol/L buffer is 0.200, and the sodium to total citrate amount proportion is 2.40. The corresponding values for the 129 mol/L buffer are 0.162 and 2.51, respectively. If, in our way of preparing the buffered citrate solution, we consider that citric acid would have been generated from citrate with the addition of HCl, the citric acid amount fraction would have accounted for 0.306 of the total citrate. The sodium to total citrate amount ratio remains 3.00, as characteristic of trisodium citrate. Differences in amount fractions can be attributed to a slight difference in pH, which is in our case 0.1 lower, to a difference in the total citrate concentration which is neither 105 nor 129 but 109 mmol/L, and to the presence of chloride ions, which contribute to the total ionic strength, consequently influencing the citric acid constants [33]. We selected the approach with HCl for practical reasons. The proportion considerations will come into function in the next section.
The calibration ranges of Tartrazine and Erioglaucine mass concentrations 8-16 mg/L and 2.5-5.5 mg/L, respectively, fulfilled the requirement 4. The citrate medium and the citrate medium with the adjusted pH were tested. The difference in calibration line equations of neither of the dyes in the two media proved significant (Table 8, first four series). The coefficients of determination were high (R2 > 0.99). Both dyes fulfil the requirements 2. and 4. Since the calibration line slope of Erioglaucine was approximately 2.75 times higher than that of Tartrazine, both in the citrate medium with the adjusted pH, the former was selected for the dye dilution method, as the higher method selectivity promises better anticoagulant volume differentiations, which aligns with the requirement 5. The regression parameters of four additional Erioglaucine calibration line equations (Table 8, Series 0-3) confirm the reproducibility of the procedure.
The results of the volume prediction capability test of the dye-dilution method are summarised in Table 9. The accuracy and precision of the volume predictions were confirmed, and the t-test proved that the predicted mean volumes agree with the theoretically expected, since all the p-values were greater than 0.3. The results served as a proof-of-concept of the suitability of the dye-dilution method for anticoagulant volume evaluations and differentiation. The method development requirement 5 was confirmed.
The volume prediction accuracy evaluated on the model dye solutions and expressed as a relative percent error was considered as the method performance criterion (Table 10). The single-factor ANOVA confirmed no significant difference between the means of the relative percent errors of different volume predictions for neither of the series, all three p-values were greater than 0.20. The accuracy of volume predictions in the range between 150 μL and 220 μL proved comparable.
On the other hand, for neither of the volumes, the single-factor ANOVA confirmed significant differences between the means of the relative percent errors at the significance level of 0.05, if the series were the controlled factor. The p-values were 0.06 at 150 μL, 0.24 at 220 μL, 0.57 at 180 μL, and 0.70 at 200 μL. The method proved reproducible for volume predictions. The lowest-between series variability was observed for the target volume of 200 μL.
Because, for the blood collection tubes of the three brands, which were evaluated in parallel with the method performance tests, a single-factor ANOVA confirmed insignificant differences between the predicted anticoagulant volume means of the three experimental series, the results of each brand were considered a homogeneous group for the between-brands evaluations (Table 11). The single-factor ANOVA with the brand as a controlled factor confirmed the significant differences between the anticoagulant volume means (p-value of 0.015 < 0.05).
The HSD(0.05) and the HSD(0.01) values as the criteria of the significant mean differences were 9.86 and 13.4, respectively. The mean anticoagulant volumes of A of 189.8 μL and of A(nr) of 191.7 μL proved comparable. The mean anticoagulant volume of C of 177.8 μL differed at the 0.05 significance level from A or A(nr), and at the 0.01 significance level from A(nr). The t-test confirmed that the mean anticoagulant volumes of all three brands were significantly lower than the nominal anticoagulant volume of 200 μL, since the p-values of A, C, and A(nr) were 1.9 × 10⁻⁴, 1.6 × 10⁻³, and 4.6 × 10⁻⁴. It is worth mentioning that the tubes C were evaluated only 27 days before the expiration date, but the tubes A and A(nr) 181 days before the expiration date. In the tubes C, approximately 10 times higher variance of the anticoagulant volume was observed if compared to A and A(nr).
The relative percent bias of the anticoagulant volume of the tubes A, C and A(nr) was −5.1, −11.1, and −4.2 %, respectively. All the values are negative as previously estimated with the indirect method and as reasonably expected due to a potential water loss over time, but they differ less from the nominal volumes than previously considered [4].
The dye dilution method proved to be the method of choice for anticoagulant volume determination due to its simplicity, speed and quality of results if compared to the previously suggested indirect method [4]. The hypothesis H2 is confirmed.
3.3. Anionic-Cationic Composition
For the anionic-cationic composition evaluations, the anions and cations, respectively, were determined in parallel in the same solutions. The experiment consisted of three series following the same protocol. The model solution of trisodium citrate served as a quality control indicator. Within each series six blood collection tubes were evaluated, two of each brand. The Milli-Q water was introduced into each tube in a volume corresponding to the nominal draw volume of 1.8 mL.
The percent anionic-cationic balance ACB(%) in equation (9):
which compares the difference between the total anionic and total cationic equivalent concentrations, in the nominator, to the total ionic equivalent concentration, in the denominator, serves as a criterion of the ionic analysis completeness and quality. The mismatch below 5% is considered a confirmation. The cE− or cE+ stands for equivalent concentrations of individual anions or cations. The equivalent concentration, in contrast to the amount concentration of an ion, regards the charge of an ion, e.g. citrate anion equivalent concentration is three times its amount concentration, but the sodium ion equivalent concentration equals the amount concentration. Therefore, due to the charge neutrality of the solution, the total anionic and total cationic equivalent concentrations would have ideally matched completely if there were no uncertainty contributions to the results of analyses.
The mean ACB(%) of 3.08% (n = 9) of the trisodium citrate model solution, by being lower than 5%, confirms the overall quality of ion chromatographic analyses. The between-series comparability of the ACB(%) values of the trisodium citrate model solution, tested with a single factor ANOVA, proves the method reproducibility. Consequently, the blood collection tubes can be evaluated and hypothesis H4 tested.
Sodium to citrate amount proportions of the buffered 105 mmol/L and 129 mmol/L anticoagulant solutions of pH 6.1, derived from the description of preparation in the patent [32], which comprised the addition of trisodium citrate and citric acid, were 2.40 and 2.51, respectively.
For the proportions derived from the results of Table 12, the single factor ANOVA proved no significant differences between the mean sodium to citrate amount proportions of 2.47, 2.43, and 2.48 of the tubes A, A(nr), and C. On the other hand, the three means significantly differ from the mean of the trisodium model solution. The values confirm that the anticoagulant solutions in the tubes, which after the ten-fold dilution all have a pH between 5.9 and 6.1, were prepared from trisodium citrate and citric acid, similarly as described in the patent. An approach involving the addition of e.g. HEPES, as suggested to the laboratories during the COVID crisis [34], or of any other auxiliary buffering substance, proved unlikely. Consequently, the distortion effect on the citrate spectra as observed for the tubes C and to a lower extent for the tubes A [4] does not originate from the buffer preparation method. The H4 hypothesis was confirmed.
It needs to be mentioned that the sodium to citrate amount proportion of the citrate model solution was 2.80, which significantly differs from the theoretically expected value of 3. Contamination of the trisodium citrate with some other citric acid equilibrium forms is a possible explanation. By attributing the contamination to the citric acid form and by applying equation (10):
we confirm that the citric acid amount fraction of the total citrate amount, XH3Cit reveals the 6.8% contamination of trisodium citrate with citric acid. The cNa and cDTM are the amount concentrations of sodium ions and total citrate. The pH of the trisodium citrate solution of 8.63 also supports the claim, since with no contamination, the pH should have been higher. Another indirect evidence might be that the impurities were thoroughly examined for the potassium dihydrogen buffer solution [35], but trisodium citrate was not considered for buffer preparation.
3.4. Synthesis of Results of the Blood Collection Tubes Quality Evaluation
The dye-dilution method for the anticoagulant volume evaluation (VAC), together with the chromatographic method for the determination of the total citrate amount concentrations in the tubes after adding the Milli-Q water in a volume equal to the nominal draw volume of 1800 µL (cDTM), enabled the calculation of the anticoagulant concentration in a tube before dilution, cAC, by applying equation (11):
The fAC_dil defines a factor of dilution of the anticoagulant solution with the nominal draw volume.
From the VAC and cAC the anticoagulant amount, nAC was calculated.
In Table 14, an overall blood collection tube quality comparison is provided. In addition to already introduced parameters, the amount concentrations of potassium, magnesium, and calcium are given, namely the cK, cMg and cCa. Their concentrations below 38.4, 206, and 3.74 µmol/L, respectively, were not quantified.
The comparison of the results reveals that even though the VAC, fAC, and cAC of the tubes C exhibit the highest Br(%), the effects are in different directions, consequently the anticoagulant amount in the tubes and the anticoagulant concentration after dilution with the water in a volume equal to the nominal draw volume are the most accurate, with the Br(%) of −0.5% and 0.6%, respectively. Even though, the VAC of tubes A and A(nr) is better preserved, the anticoagulant amount demonstrates positive bias. The conclusion previously derived from the indirect method of the VAC determination, that the anticoagulant of tube A is too high, was confirmed [4].
On the other hand, the cationic contamination of tubes C is the most profound. It must be noted that we confirmed a low-level contamination with calcium for all the tubes. Since contamination of 0.006 mmol/L was also confirmed for the sodium citrate model solution, the source is probably the chemical and not the tube. Contrastingly, the tubes A and A(nr) are contaminated with anionic contaminants to a higher extent than the tubes C, as Table 13 reveals. Acetate, formate, chloride, nitrite, sulphate, oxalate, bromide, and nitrate were all determined in tubes A.
Neither anionic nor cationic contaminants are present in concentrations that would importantly contribute to the anionic-cationic balance. But among the anions are several light-absorbing species. Their influence on the citrate anticoagulant absorption spectra of the molecular absorption spectrometric method for tubes preanalytical quality evaluation [4] will need to be further examined.
4. Materials and Methods
4.1. Trisodium Citrate, Purified Water, and Evacuated Blood Collection Tubes
All the chemicals were of the analytical reagent grade. Trisodium citrate dihydrate C6H5Na3O7 × 2H2O (M = 294.10 g/mol, 0.99 ≤ w ≤ 1.01), CAS: 6132-04-3, Sigma-Aldrich, St. Louis, Darmstadt, Germany, was used to prepare a stock solution with a concentration of 1.7 g/L. Five citrate calibration solutions with concentrations ranging from 6.9 to 34.4 mg/L were prepared from it.
Trisodium citrate dihydrate C6H5Na3O7 × 2H2O (M = 294.10 g/mol, w ≥ 0.99), CAS: 6132-04-3, Sigma-Aldrich, Belgium, was used to prepare model solutions. More details on other chemicals are given concerning dedicated procedures.
Deionised water, additionally purified through the Milli-Q system (Millipore, Billerica, MA, USA), was used to prepare all solutions—Milli-Q water in continuation.
The evacuated blood collection tubes were obtained from the Slovenian local dealers. The letters assigned to were the same as previously. The letter A stands for Vacuette®, Greiner BIO-ONE; B for Vacutube, LT Burnik d.o.o., Skaručna, Slovenia; and C for BD Vacutainer®. More details are summarised in Table 15.
4.2. Ion Chromatography
4.2.1. Determination of Anions with Ion Exchange Chromatography
The ICS-5000 Ion Chromatograph (Thermo Fisher Scientific Inc., USA), consisting of the Eluent Generator Cartridge with hydroxide (KOH), Isocratic Pump, IonPac AS11-HC (4 × 250 mm) column, ADRS 600 (4 mm) suppressor connected in a closed mode, and the Electrochemical detector with a conductometric cell were used for the determination of anions. The eluent flow rate was 1.5 mL/min, and the injection volume was 30 µL. For the determination of citrate in the blood collection tubes, after the addition of Milli-Q water in the volume corresponding to the nominal draw volume the eluent concentration of 35 mmol/L was used. Anionic impurities were determined in composite samples by using the 25 mmol/L eluent.
A composite sample was prepared from three tubes of the same kind and the same lot. The content of each tube was quantitatively transferred into an A-class 20 mL volumetric flask with four successive additions of 1.5 mL of Milli-Q water. After each addition the tube was plugged and inverted several times, and the content was transferred into the flask through a funnel. The potential residuals of citrate were afterwards washed out of the funnel into a volumetric flask and the volume of solution was made up to the mark with Milli-Q water. The tubes A, A(nr), C, A_old, B_old and C_old were evaluated.
Chemicals for impurities determinations were sodium sulphate, Na2SO4 (M = 142.04 g/mol, w ≥ 0.99), Supelco, Darmstadt, Germany; sodium acetate, CH3COONa (M = 82.03 g/mol, w ≥ 0.99), Supelco, Darmstadt, Germany; sodium formate, HCOONa (M = 68.01 g/mol, w ≥ 0.99), Kemika, Zagreb, Croatia; sodium nitrite, NaNO2 (M = 69.00 g/mol, w ≥ 0.99), MERCK, Darmstadt, Germany; potassium bromide, KBr (M = 119.01 g/mol, w ≥ 0.995), MERCK, Darmstadt, Germany; sodium nitrate, NaNO3 (M = 84.99 g/mol), Alkaloid, Skopje, Macedonia; disodium oxalate, (NaCOO)2 (M = 134.00 g/mol, w = 0.995), PanReac AppliChem, Darmstadt, Germany; and sodium chloride, NaCl (M = 58.44 g/mol, w ≥ 0.995 or 0.990 ≤ w ≤ 1.005 when dried), EMSURE, Merck, Denmark. Sodium chloride for the determination of chloride was dried at 500 °C for two hours. Other chemicals were dried at 105 °C for two hours. Eight multi-ion calibration solutions comprising acetate, formate, chloride, nitrite, oxalate, bromide, nitrate and sulphate were prepared; the concentrations of all ions in the calibration solution were equal, the levels in the consecutive solutions were 0.1, 0.2, 0.5, 0.8, 1.5, 2.3, 3.1 and 5.1 mg/L, respectively.
4.2.2. Determination of Cations with Ion Exchange Chromatography
The DX-500 Ion Chromatograph (Dionex Corporation, Sunnyvale, CA, USA), consisting of the GP-40 Gradient Pump and the ED-40 Electrochemical detector with a conductometric cell, was used for the determination of cations. Other components were a 50 µL injection loop, IonPac CS12A (4 × 250 mm) column, IonPac CG12A (4 × 250 mm) guard column, and CSRS 300 (4 mm) suppressor in closed mode of operation. The current was set to 50 mA. The eluent was 20 mmol/L methanesulfonic acid, CH3SO3H (M = 96.11 g/mol, w ≥ 0.990, ρ = 1.481 g/cm3 at 25 °C, CAS: 75-75-2, Sigma Aldrich, Steinheim, Germany), flow rate was 1 mL/min.
Potassium chloride, KCl (M = 74.55 g/mol, 0.990 ≤ w ≤ 1.005, ρ = 2 g/cm3), Fluka, Germany, and sodium chloride, NaCl (M = 58.44 g/mol, w ≥ 0.995 or 0.990 ≤ w ≤ 1.005 when dried), EMSURE, Merck, Denmark, were dried at 300 °C for two hours. Five potassium ion calibration solutions, prepared from the intermediate solution with a concentration of 75 mg/L, had concentrations ranging from 0.75 to 3.75 mg/L. Five sodium ion calibration solutions, prepared from the stock solution with a concentration of 5.0 g/L, had concentrations ranging from 250 to 450 mg/L.
Magnesium standard solution, γ(Mg2+) 1000 mg/L (traceable to SRM from NIST, Mg(NO3)2 in HNO3 0.5 mol/L, ρ = 1.016 g/cm3, Merck KGaA, Darmstadt, Germany) was used to prepare five magnesium ion calibration solutions with concentrations ranging from 2.5 to 4.5 mg/L. Calcium standard solution γ(Ca2+) 1000 mg/L (traceable to SRM from NIST, Ca(NO3)2 in HNO3 0.5 mol/L, ρ = 1.014 g/cm3, Merck KGaA, Darmstadt, Germany) was used to prepare an intermediate standard solution with a concentration of 30 mg/L. Five calcium ion calibration solutions with concentrations ranging from 0.075 to 0.375 mg/L were prepared from it.
4.3. Determination of pH
For pH measurements the SevenCompact™ S220 pH/Ion meter (Mettler-Toledo GmbH, Greifensee, Switzerland) and a pH Sensor InLab® Micro (Mettler-Toledo GmbH, Greifensee, Switzerland) combined pH electrode were used. Three-point calibration was performed with the NIST traceable calibration buffers of pH 4.00 ± 0.02 (25 °C), pH 7.00 ± 0.02 (25 °C), and pH 10.00 ± 0.02 (25 °C) (Metrohm Ltd., Herisau, Switzerland). Ambient temperature was 24 °C.
A control reference phosphate buffer was prepared with boiled Milli-Q water, from potassium dihydrogen phosphate, KH2PO4 ((M = 136.09 g/mol, w ≥ 99.5 %) Merck, Darmstadt, Germany) and disodium hydrogen phosphate, Na2HPO4 ((M = 141.96 g/mol, w ≥ 99 %) POCH S.A., Gliwice, Poland). The chemicals were dried at 105 °C for two hours. Buffer concentration was 25.01 mmol/L and 25.00 mmol/L for KH2PO4 and Na2HPO4, respectively.
4.4. Spectrometric Determination of Anticoagulant Volume Accuracy
For direct spectrometric measurements in blood collection tubes, the fibre optics absorbance measuring Dip Probe Coupler (02-101593-00, VARIAN, made in Australia, non-patient equipment, 31-1027, EL02036518) was attached to the Varian Cary 50 UV-Vis spectrometer, Agilent Technologies, Santa Clara, CA, USA, ZDA. The spectrometer settings for spectra acquisition were scan rate 300.00 nm/min, a data interval of 0.50 nm, averaging time of 0.1 s, dual beam mode, and baseline correction on.
For weighing dyes, a Balance XPR2U, (Mettler Toledo, Greifensee, Switzerland, d = 0.1 μg) was used.
Tartrazine, C16H9N4Na3O9S2 (M = 534.36 g/mol, CAS: 1934-21-0, Sigma-Aldrich, Toluca, Mexico) stock solution was prepared in a 25-mL, class A volumetric flask, from 17.7886 mg of the chemical.
A stock solution of Erioglaucine, disodium salt, C37H34Na2N2O9S3 (M = 792.86 g/mol, CAS: 3844-45-9, Sigma-Aldrich, Jiangsu, China) was prepared in a 500-mL, class A volumetric flask, from 12.7286 mg of the chemical.
Spectra of Tartrazine and Erioglaucine solutions were acquired in the wavelength range 300-600 nm and 500-800 nm, respectively, against the buffered citrate blank. For anticoagulant volume determination, the absorbances were read at the absorption maxima of Tartrazine and Erioglaucine, which were at 427 and 629 nm.
Seven calibration solutions with equidistant dye mass concentrations ranging from 2.5 to 5.5 mg/L were prepared from the Erioglaucine stock dye solution. The 109 mmol/L trisodium citrate solution and 0.1 mol/L standard HCl solution were added to match the composition as expected for the tubes. For the dye-dilution method, the stock solution was diluted 4.25-fold to obtain the working solution of the mass concentration of 5.990 mg/L. The solution was added into each blood collection tube in a volume of 400 μL, and the content was well mixed to achieve uniform composition.
5. Conclusions
Comprehensive methodology comprising the anionic and cationic chromatography, a direct dye dilution method for anticoagulant volume determination, and pH measurements, revealed that the anticoagulant of the tubes A and C is buffered. Tubes C exhibit the highest anticoagulant amount and concentration accuracy at dilution with the nominal draw volume. Acetate, formate, chloride, nitrite, sulphate, oxalate, bromide, and nitrate impurities were determined in anticoagulant solutions, all in tubes A and some of them in the others. Tubes C exhibit the highest contamination with cations. Calcium was confirmed in low concentrations in all the tubes and in the trisodium citrate model solution. Its origin is probably the chemical and not the tube or the stopper. The sodium to citrate amount proportion was very similar for the anticoagulant solutions of all the tube brands, and characteristic of the preparation of buffer solution from trisodium citrate and citric acid. Any other auxiliary chemical does not seem to be involved, and the buffering method cannot explain the distortion of the absorption spectra of the tubes C, which we observed in the spectrometric method of quality evaluation [4]. The potential influence of the UV light-absorbing anionic contaminants will yet need to be further examined.
Author Contributions
Conceptualisation, N.G.; Methodology, N.G.; Validation, Z.H.; Formal analysis, N.G.; Investigation, Z.H.; Resources, N.G.; Data curation, N.G., Z.H.; Writing—review and editing, N.G.; Visualisation, N.G., Z.H.; Supervision, N.G. All authors have read and agreed to the published version of the manuscript.
Funding
This research was funded by the Slovenian Research and Innovation Agency, grant number P1-0153.
Data Availability Statement
The original contributions presented in the study are included in the article, further inquiries can be directed to the corresponding author.
Conflicts of Interest
The authors declare no conflicts of interest.
References
- Mrazek, C.; Lippi, G.; Keppel, M.H.; Felder, T.K.; Oberkofler, H.; Haschke-Becher, E.; Cadamuro, J. Errors within the total laboratory testing process, from test selection to medical decision-making - A review of causes, consequences, surveillance and solutions. Biochemia Medica 2020, 30. [Google Scholar] [CrossRef]
- Kitchen, S.; Adcock, D.M.; Dauer, R.; Kristoffersen, A.H.; Lippi, G.; Mackie, I.; Marlar, R.A.; Nair, S. International Council for Standardization in Haematology (ICSH) recommendations for processing of blood samples for coagulation testing. Int. J. Lab. Hematol. 2021, 43, 1272–1283. [Google Scholar] [CrossRef] [PubMed]
- Kitchen, S.; Adcock, D.M.; Dauer, R.; Kristoffersen, A.H.; Lippi, G.; Mackie, I.; Marlar, R.A.; Nair, S. International Council for Standardisation in Haematology (ICSH) recommendations for collection of blood samples for coagulation testing. Int. J. Lab. Hematol. 2021, 43, 571–580. [Google Scholar] [CrossRef] [PubMed]
- Gros, N.; Klobucar, T.; Gaber, K. Accuracy of Citrate Anticoagulant Amount, Volume, and Concentration in Evacuated Blood Collection Tubes Evaluated with UV Molecular Absorption Spectrometry on a Purified Water Model. Molecules 2023, 28. [Google Scholar] [CrossRef] [PubMed]
- Gros, N.; Stopar, T. Preanalytical Quality Evaluation of Citrate Evacuated Blood Collection Tubes-Ultraviolet Molecular Absorption Spectrometry Confronted with Ion Chromatography. Molecules 2023, 28. [Google Scholar] [CrossRef]
- Patscheke, H. SHAPE AND FUNCTIONAL-PROPERTIES OF HUMAN-PLATELETS WASHED WITH ACID CITRATE. Haemostasis 1981, 10, 14–27. [Google Scholar] [CrossRef]
- Germanovich, K.; Femia, E.A.; Cheng, C.Y.; Dovlatova, N.; Cattaneo, M. Effects of pH and concentration of sodium citrate anticoagulant on platelet aggregation measured by light transmission aggregometry induced by adenosine diphosphate. Platelets 2018, 29, 21–26. [Google Scholar] [CrossRef]
- Shadle, O.W.; Ferguson, T.B.; Gregg, D.E.; Gilford, S.R. EVALUATION OF A NEW CUVETTE DENSITOMETER FOR DETERMINATION OF CARDIAC OUTPUT. Circulation Research 1953, 1, 200–205. [Google Scholar] [CrossRef]
- Miller, E.; Gleason, W.L.; McIntosh, H.D. COMPARISON OF CARDIAC OUTPUT DETERMINATION BY DIRECT FICK METHOD AND DYE-DILUTION METHOD USING INDOCYANINE GREEN DYE AND A CUVETTE DENSITOMETER. J. Lab. Clin. Med. 1962, 59, 345. [Google Scholar]
- Muroke, V.; Jalanko, M.; Simonen, P.; Holmström, M.; Ventilä, M.; Sinisalo, J. Non-invasive dye dilution method for measuring an atrial septal defect shunt size. Open Heart 2020, 7. [Google Scholar] [CrossRef]
- Elsayed, H.; Goodall, S.R.; Hainsworth, R. REEVALUATION OF EVANS BLUE-DYE DILUTION METHOD OF PLASMA-VOLUME MEASUREMENT. Clin. Lab. Haematol. 1995, 17, 189–194. [Google Scholar] [PubMed]
- Zivkovic, V.; Ridge, N.; Biggs, M.J. Experimental study of efficient mixing in a micro-fluidized bed. Appl. Therm. Eng. 2017, 127, 1642–1649. [Google Scholar] [CrossRef]
- Dixit, P.K.; Lazarow, A. CALIBRATION OF MICROPIPETTES. J. Lab. Clin. Med. 1961, 58, 499. [Google Scholar] [PubMed]
- Rideout, J.M.; Renshaw, A.; Snook, M. SWIZZLESTICK - NOVEL POSITIVE DISPLACEMENT MICROLITER DILUTING DEVICE. Anal. Biochem. 1978, 90, 744–751. [Google Scholar] [CrossRef]
- Stangegaard, M.; Hansen, A.J.; Froslev, T.G.; Morling, N. A Simple Method for Validation and Verification of Pipettes Mounted on Automated Liquid Handlers. Jala 2011, 16, 381–386. [Google Scholar] [CrossRef]
- Quintero, C.; Tran, K.; Szewczak, A.A. High-Throughput Quality Control of DMSO Acoustic Dispensing Using Photometric Dye Methods. Jala 2013, 18, 296–305. [Google Scholar] [CrossRef]
- Ando, T.; Hirano, M.; Ishige, Y.; Adachi, S. Development of Liquid Handling Technology for Single Blood Drop Analysis. Bunseki Kagaku 2020, 69, 299–304. [Google Scholar] [CrossRef]
- Rantakokko, P.; Mustonen, S.; Yritys, M.; Vartiainen, T. Ion chromatographic method for the determination of selected inorganic anions and organic acids from raw and drinking waters using suppressor current switching to reduce the background noise. J. Liq. Chromatogr. Rel. Technol. 2004, 27, 829–842. [Google Scholar] [CrossRef]
- Lu, S.B.; Sun, X.M.; Shi, C.O.; Zhang, Y.X. Determination of tricarboxylic acid cycle acids and other related substances in cultured mammalian cells by gradient ion-exchange chromatography with suppressed conductivity detection. Journal of Chromatography A 2003, 1012, 161–168. [Google Scholar] [CrossRef]
- Geng, X.M.; Zhang, S.F.; Wang, Q.; Zhao, Z.B. Determination of organic acids in the presence of inorganic anions by ion chromatography with suppressed conductivity detection. Journal of Chromatography A 2008, 1192, 187–190. [Google Scholar] [CrossRef]
- Jenke, D.; Sadain, S.; Nunez, K.; Byrne, F. Performance characteristics of an ion chromatographic method for the quantitation of citrate and phosphate in pharmaceutical solutions. J. Chromatogr. Sci. 2007, 45, 50–56. [Google Scholar] [CrossRef]
- Ritter, J.B.; Genzel, Y.; Reichl, U. High-performance anion-exchange chromatography using on-line electrolytic eluent generation for the determination of more than 25 intermediates from energy metabolism of mammalian cells in culture. Journal of Chromatography B-Analytical Technologies in the Biomedical and Life Sciences 2006, 843, 216–226. [Google Scholar] [CrossRef] [PubMed]
- DeBorba, B.M.; Rohrer, J.S.; Bhattacharyya, L. Development and validation of an assay for citric acid/citrate and phosphate in pharmaceutical dosage forms using ion chromatography with suppressed conductivity detection. Journal of Pharmaceutical and Biomedical Analysis 2004, 36, 517–524. [Google Scholar] [CrossRef] [PubMed]
- Waithaisong, K.; Robin, A.; Martin, A.; Clairotte, M.; Villeneuve, M.; Plassard, C. Quantification of organic P and low-molecular-weight organic acids in ferralsol soil extracts by ion chromatography. Geoderma 2015, 257, 94–101. [Google Scholar] [CrossRef]
- Adam, E.H.; Zacharowski, K.; Hintereder, G.; Zierfuss, F.; Raimann, F.; Meybohm, P. Validation of a New Small-Volume Sodium Citrate Collection Tube for Coagulation Testing in Critically Ill Patients with Coagulopathy. Clinical Laboratory 2018, 64, 1083–1089. [Google Scholar] [CrossRef]
- Chang, S.H. Comparison of Low Voleme and Conventional Sodium Citrate Tubes for Routine Coagulation Testing. Clinical Laboratory 2021, 67, 1555–1560. [Google Scholar] [CrossRef]
- Salvagno, G.L.; Demonte, D.; Poli, G.; Favaloro, E.J.; Lippi, G. Impact of low volume citrate tubes on results of first-line hemostasis testing. Int. J. Lab. Hematol. 2019, 41, 472–477. [Google Scholar] [CrossRef]
- Bates, R.G. Revised Standard Values for Ph Measurements from 0 to 95 Degrees C. J Res Nbs a Phys Ch 1962, 66, 179. [Google Scholar] [CrossRef]
- Dong, H.J.; Zheng, O.Y.; Liu, J.; Jemal, M. The use of a dual dye photometric calibration method to identify possible sample dilution from an automated multichannel liquid-handling system. Clin. Lab. Med. 2007, 27, 113. [Google Scholar] [CrossRef]
- Tsao, A.C.; Lovich, M.A.; Parker, M.J.; Zheng, H.; Peterfreund, R.A. Delivery interaction between co-infused medications: an in vitro modeling study of microinfusion. Pediatric Anesthesia 2013, 23, 33–39. [Google Scholar] [CrossRef]
- Bousvaros, G.A.; Sekelj, P.; McGregor, M.; Palmer, W.H. COMPARISON OF CENTRAL AND PERIPHERAL INJECTION SITES IN ESTIMATION OF CARDIAC OUTPUT BY DYE DILUTION CURVES. Circulation Research 1963, 12, 317. [Google Scholar] [CrossRef]
- Smith, W.C.; Carroll, R.L. Anticoagulant Solution for Use in Blood Chemistry-Related Techniques and Apparatus. 5,667,963, 1997.
- Crea, F.; De Stefano, C.; Millero, F.J.; Crea, F. Dissociation constants for citric acid in NaCl and KCl solutions and their mixtures at 25°C. J. Solution Chem. 2004, 33, 1349–1366. [Google Scholar] [CrossRef]
- Gosselin, R.C.; Bowyer, A.; Favaloro, E.J.; Johnsen, J.M.; Lippi, G.; Marlar, R.A.; Neeves, K.; Rollins-Raval, M.A. Guidance on the critical shortage of sodium citrate coagulation tubes for hemostasis testing. J. Thromb. Haemost. 2021, 19, 2857–2861. [Google Scholar] [CrossRef]
- Lito, M.; Camoes, M.; Covington, A.K. Effect of citrate impurities on the reference pH value of potassium dihydrogen buffer solution. Anal. Chim. Acta 2003, 482, 137–146. [Google Scholar] [CrossRef]
Figure 1.
Comparison of chromatograms of the citrate method using KOH of 35 mmol/L (the _citrate method suffix in legend) and method for anionic impurities using KOH of 25 mmol/L on the example of the composite samples of the tubes of the brands A, A(nr), B, and C. Composite samples were prepared by transferring anticoagulant solution of several tubes of the same kind into a volumetric flask to ensure a defined dilution.
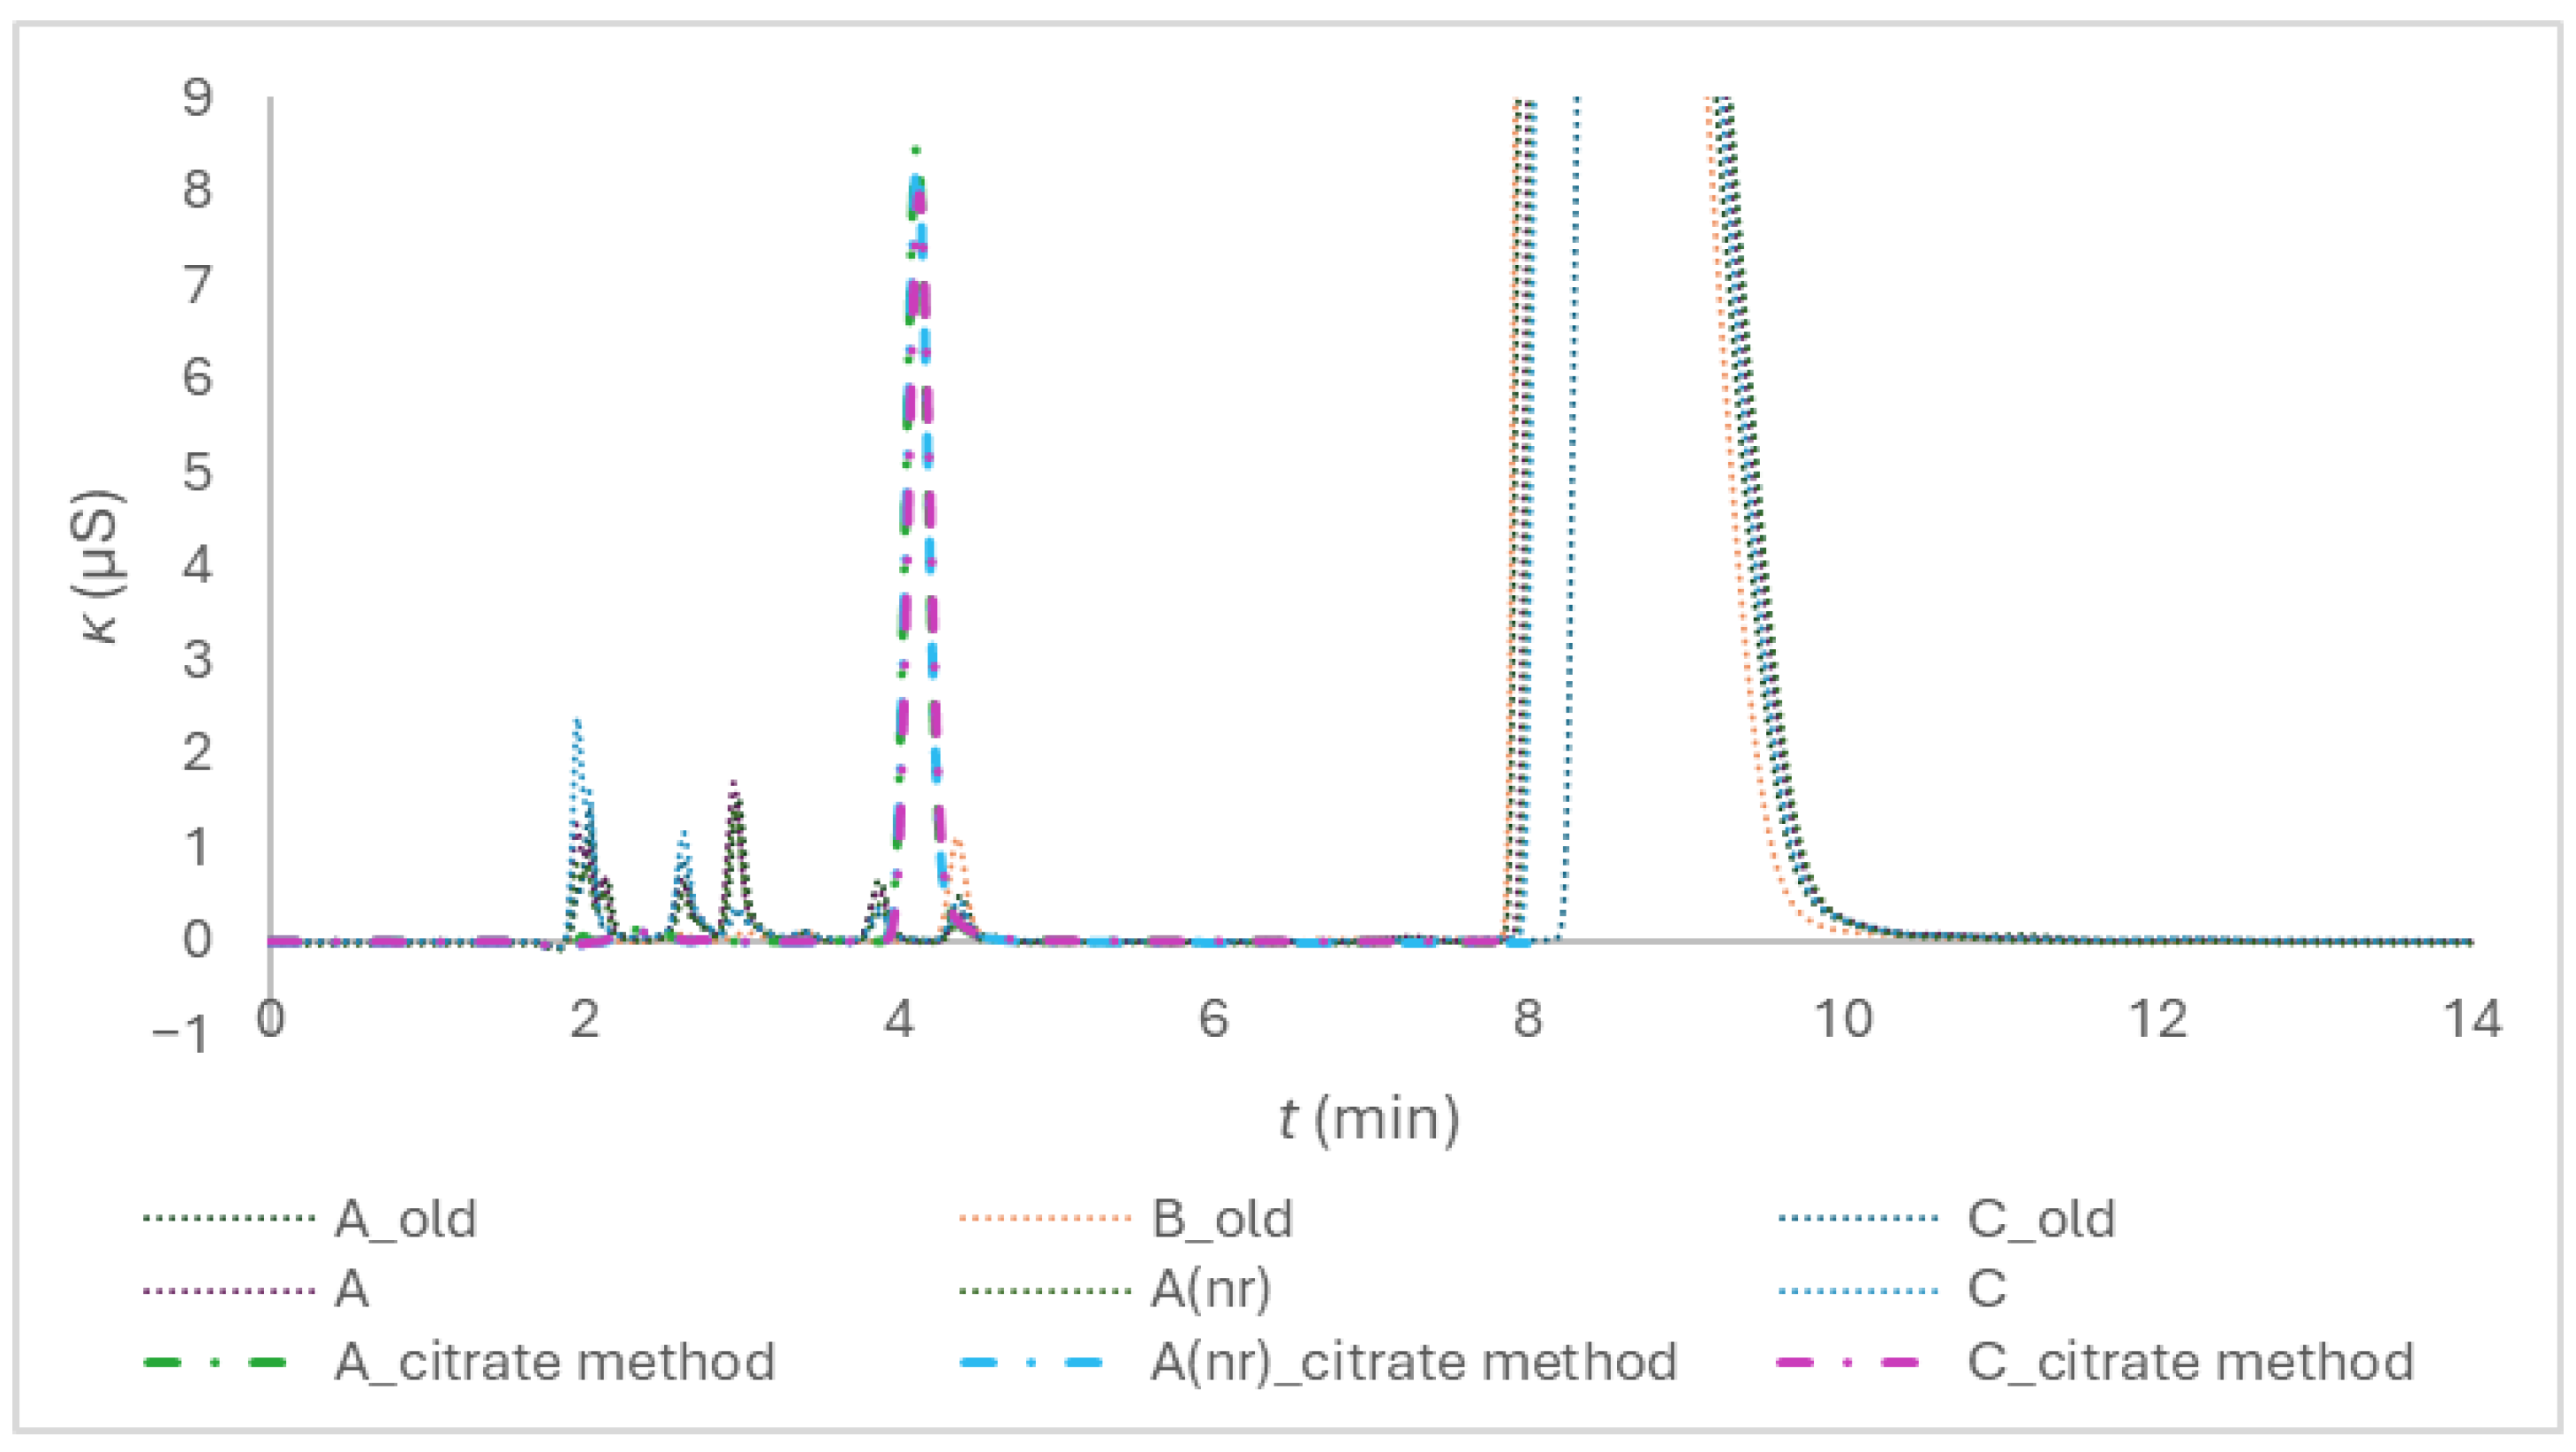
Figure 2.
Chromatogram of composite samples prepared from the tubes of different brands, the peak numbers are 1 for acetate, 2 for formate, 3 for chloride, 4 for nitrite, 5 for sulphate, 6 for oxalate, 7 for bromide, and 8 for nitrate.
Figure 2.
Chromatogram of composite samples prepared from the tubes of different brands, the peak numbers are 1 for acetate, 2 for formate, 3 for chloride, 4 for nitrite, 5 for sulphate, 6 for oxalate, 7 for bromide, and 8 for nitrate.
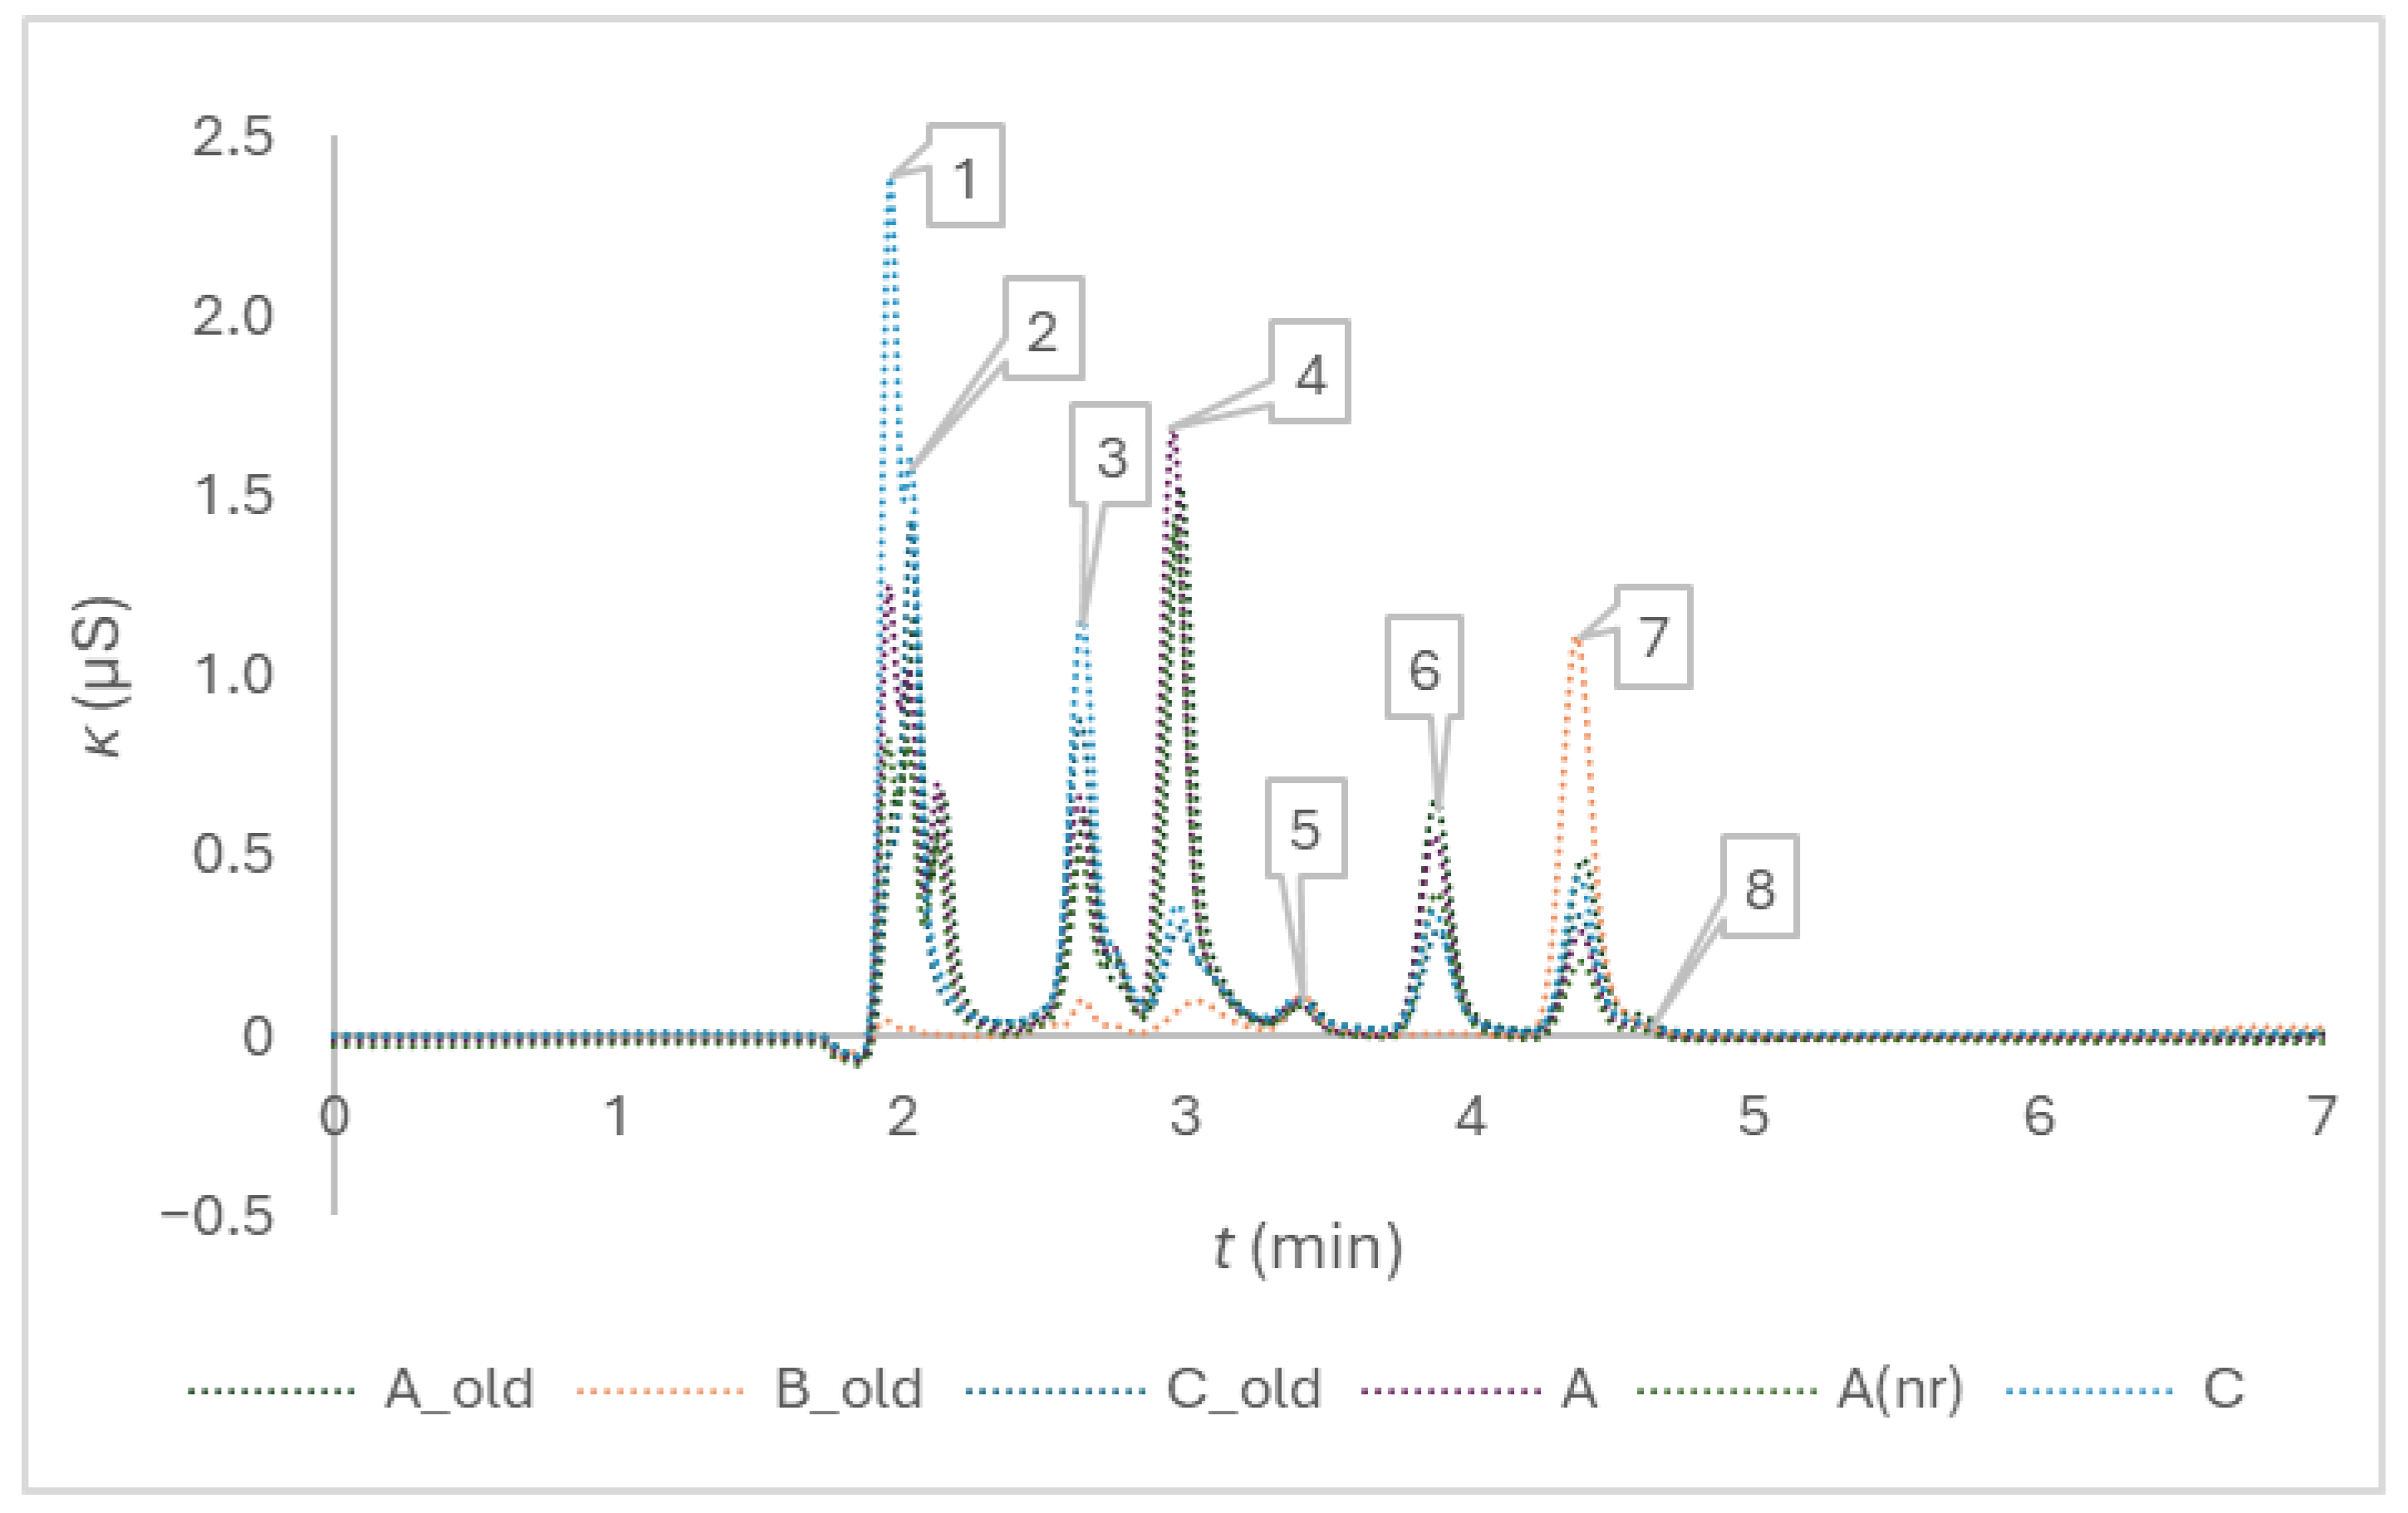
Figure 3.
Chromatograms of trisodium citrate model solution and citrate anticoagulant solutions of the blood collection tubes of three brands after the addition of Milli-Q in a volume corresponding to the nominal draw volume of 1.8 mL, and a twofold dilution. The peak numbers are 1 for sodium, 2 for potassium, 3 for magnesium and 4 for calcium; the eluent was 20 mmol/l methanesulfonic acid.
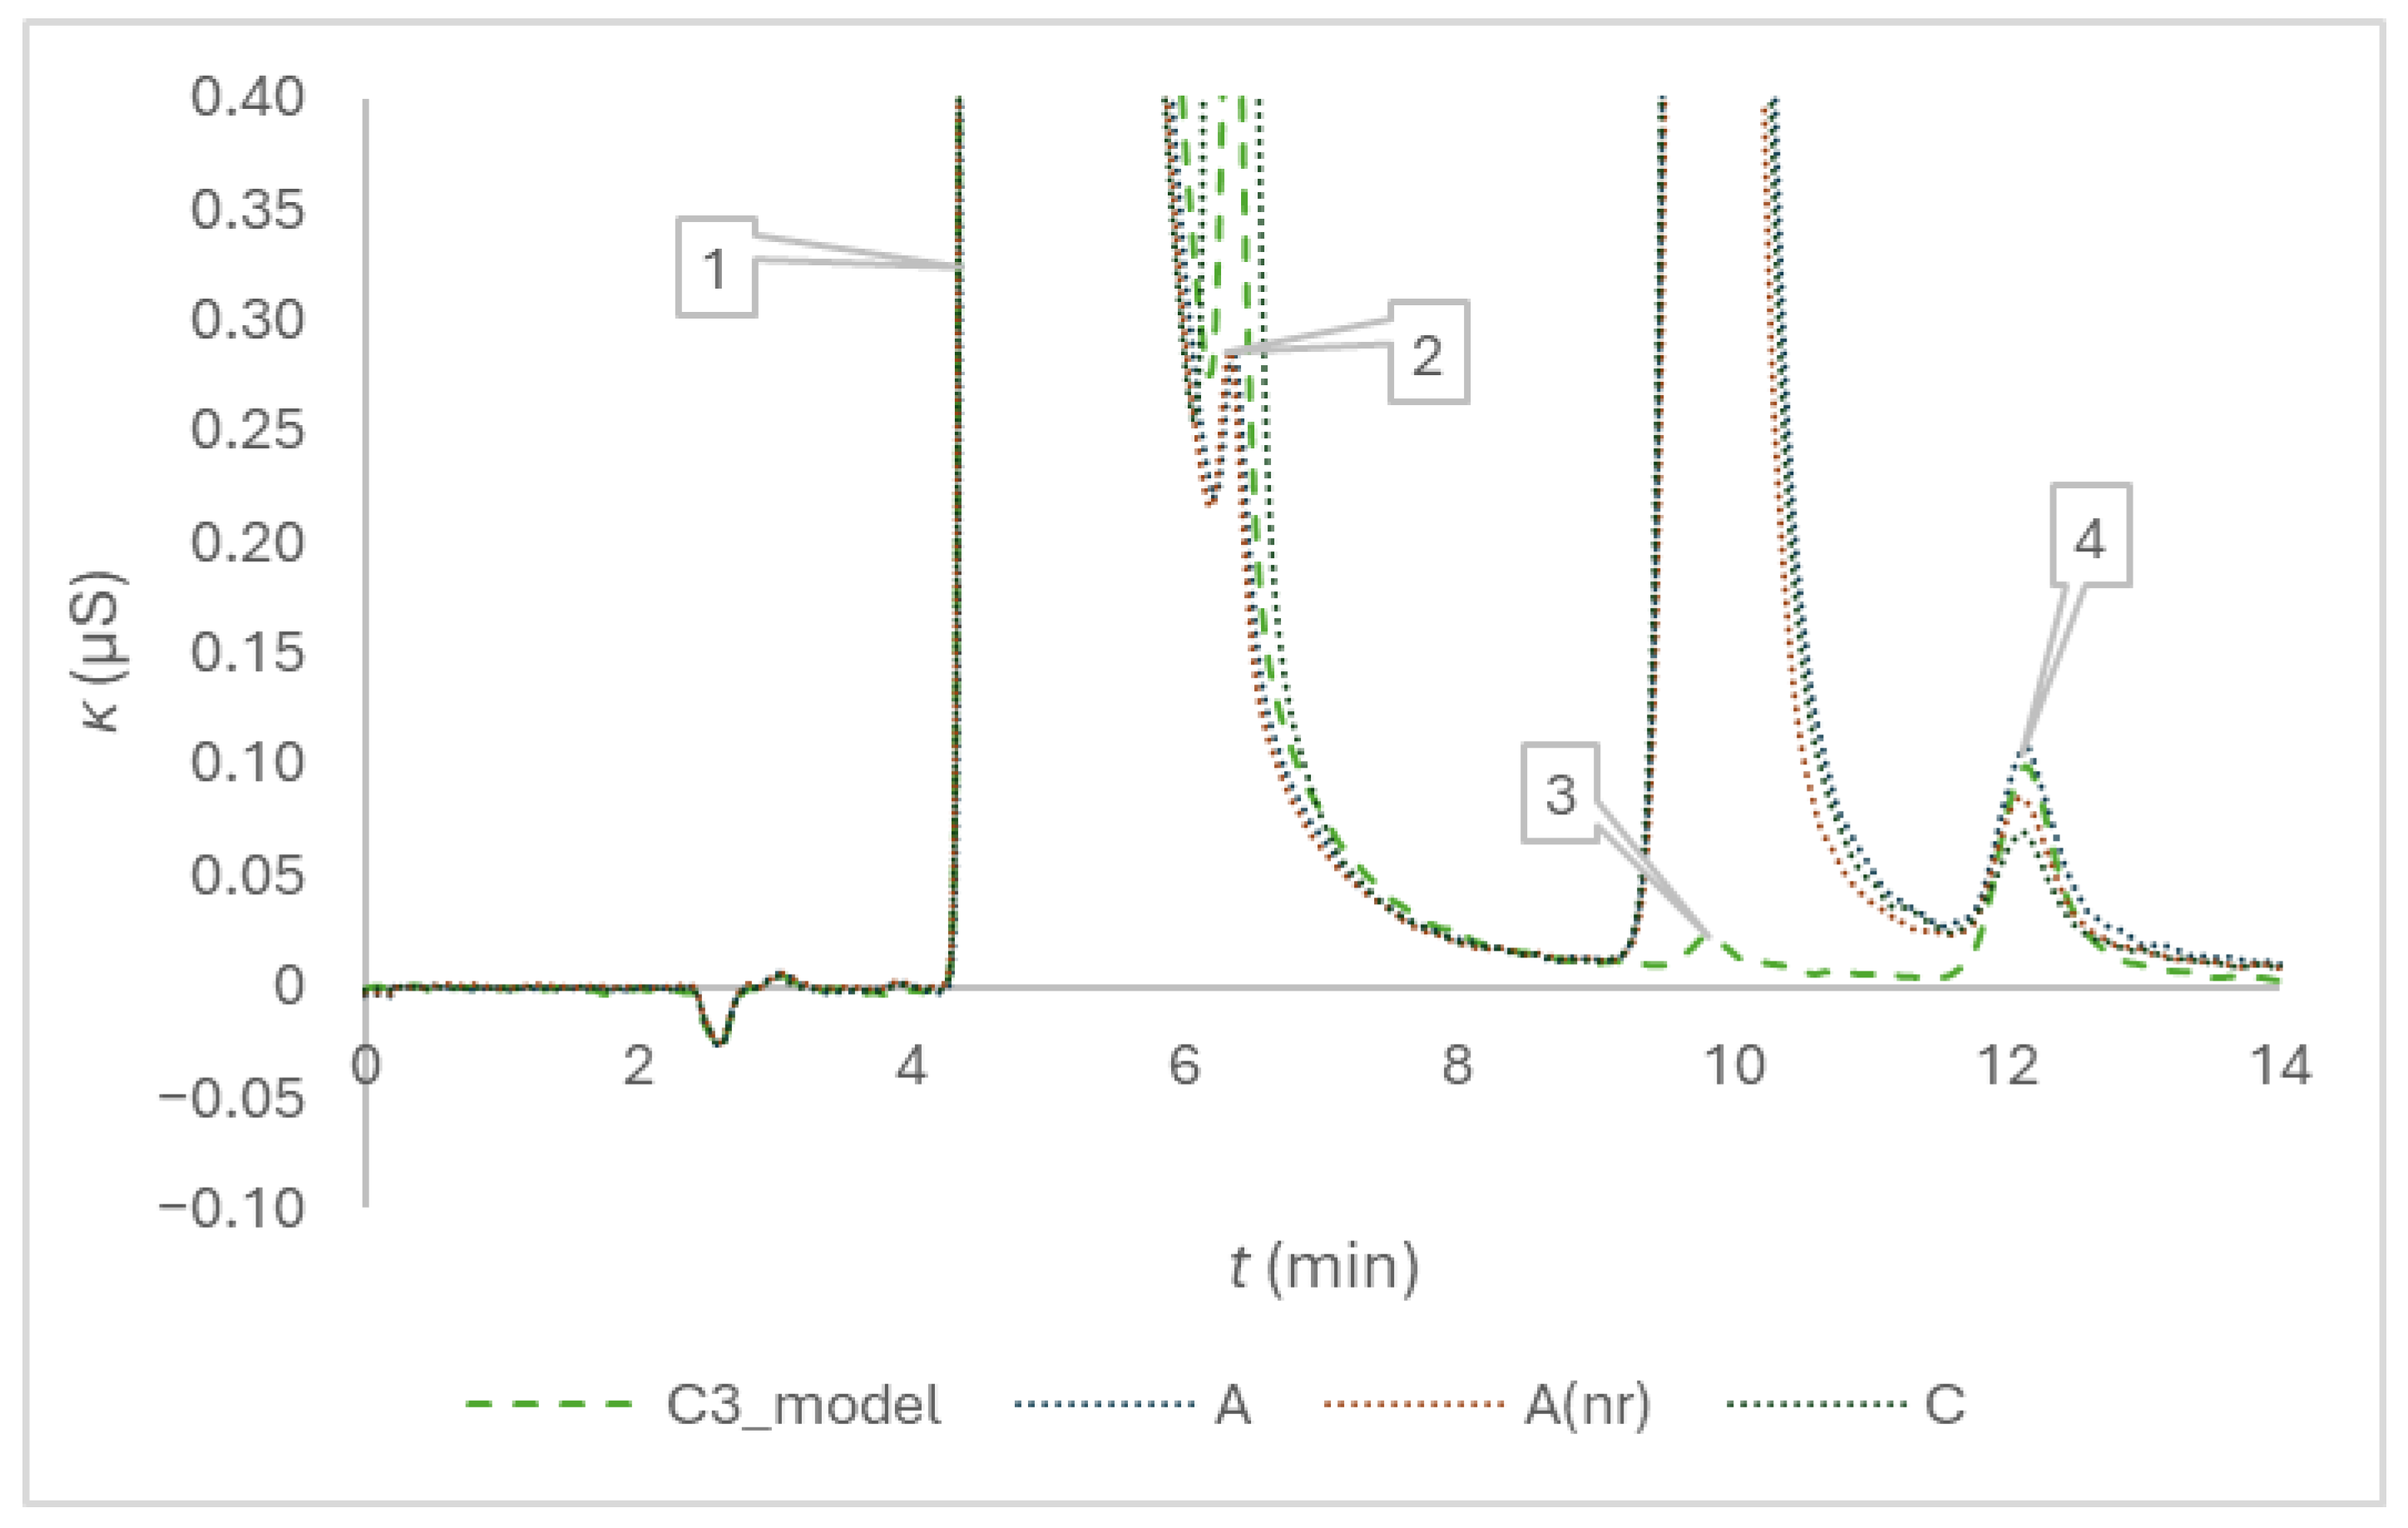

Table 1.
Within-day repeatability (n = 5) of citrate retention times (tr) and peak area measurements of the examined composite blood-collection tubes anticoagulant solutions, s and sr(%) stand for sample standard deviation and relative percent standard deviation.
Table 1.
Within-day repeatability (n = 5) of citrate retention times (tr) and peak area measurements of the examined composite blood-collection tubes anticoagulant solutions, s and sr(%) stand for sample standard deviation and relative percent standard deviation.
| Repetition | 1. | 2. | 3. | 4. | 5. | s | sr(%) (%) | |
|---|---|---|---|---|---|---|---|---|
| Tubes | tr (min) | |||||||
| A | 4.243 | 4.220 | 4.227 | 4.230 | 4.230 | 4.230 | 0.008 | 0.2 |
| C | 4.163 | 4.213 | 4.170 | 4.217 | 4.217 | 4.196 | 0.03 | 0.6 |
| A(nr) | 4.173 | 4.183 | 4.173 | 4.177 | 4.193 | 4.180 | 0.008 | 0.2 |
| Tubes | Peak area (AU) | |||||||
| A | 1.4506 | 1.4455 | 1.4414 | 1.4538 | 1.4509 | 1.4484 | 0.0049 | 0.34 |
| C | 1.3729 | 1.3692 | 1.3726 | 1.3729 | 1.3728 | 1.3732 | 0.00099 | 0.07 |
| A(nr) | 1.4595 | 1.4618 | 1.4623 | 1.4598 | 1.4624 | 1.4612 | 0.0014 | 0.10 |
Table 2.
Within-laboratory reproducibility of regression parameters (y = a × x + b) their standard uncertainties, standard error of estimate and coefficient of determination (sa, sb, sy/x, and R2) of the five-point calibration (n = 5) for citrate determination during a four-month period, the peak areas were measured as y.
| Date | a | sa | b | sb | sy/x | R2 |
|---|---|---|---|---|---|---|
| 2 April 2025 | 0.0639 | 0.0013 | 0.1039 | 0.0290 | 0.0276 | 0.9988 |
| 3 April 2025 | 0.0654 | 0.0017 | 0.0741 | 0.0392 | 0.0374 | 0.9979 |
| 7 April 2025 | 0.0653 | 0.0012 | 0.0969 | 0.0265 | 0.0253 | 0.9990 |
| 8 April 2025 | 0.0640 | 0.0021 | 0.1207 | 0.0476 | 0.0454 | 0.9968 |
| 9 April 2025 | 0.0645 | 0.0017 | 0.1179 | 0.0382 | 0.0364 | 0.9980 |
| 10 April 2025 | 0.0639 | 0.0010 | 0.0448 | 0.0234 | 0.0223 | 0.9992 |
| 11 April 2025 | 0.0652 | 0.0015 | 0.0877 | 0.0349 | 0.0333 | 0.9983 |
| 15 April 2025 | 0.0638 | 0.0011 | 0.1109 | 0.0260 | 0.0248 | 0.9990 |
| 7 May 2025 | 0.0586 | 0.0011 | 0.0778 | 0.0256 | 0.0244 | 0.9989 |
| 8 May 2025 | 0.0600 | 0.0008 | 0.0840 | 0.0184 | 0.0175 | 0.9995 |
| 9 May 2025 | 0.0595 | 0.0009 | 0.0946 | 0.0205 | 0.0195 | 0.9993 |
| 14 May 2025 | 0.0601 | 0.0013 | 0.1073 | 0.0291 | 0.0277 | 0.9987 |
| 3 June 2025* | 0.0624 | 0.0009 | 0.1184 | 0.0202 | 0.0192 | 0.9994 |
| 4 June 2025* | 0.0631 | 0.0013 | 0.0967 | 0.0286 | 0.0272 | 0.9988 |
| 5 June 2025* | 0.0626 | 0.0012 | 0.0961 | 0.0267 | 0.0254 | 0.9990 |
| 6 June 2025* | 0.0636 | 0.0012 | 0.0796 | 0.0265 | 0.0253 | 0.9990 |
| 16 June 2025* | 0.0641 | 0.0014 | 0.1099 | 0.0308 | 0.0293 | 0.9987 |
| 23 July 2025* | 0.0614 | 0.0011 | 0.0991 | 0.0255 | 0.0243 | 0.9990 |
| 24 July 2025* | 0.0624 | 0.0012 | 0.1046 | 0.0265 | 0.0253 | 0.9990 |
| 25 July 2025* | 0.0622 | 0.0011 | 0.1056 | 0.0244 | 0.0233 | 0.9991 |
* Chromatograph was thermostatted to 25 °C.
Table 3.
Accuracy of citrate amount concentration determination evaluated at three concentration levels.
Table 3.
Accuracy of citrate amount concentration determination evaluated at three concentration levels.
| Date | τ (mmol/L) | Mean (mmol/L) (n = 3) | s (mmol/L) | sx0/x0 | B (mmol/L) | Br(%) (%) |
|---|---|---|---|---|---|---|
| 9 April 2025 | 0.0655 | 0.0650 | 0.0002 | 0.038 | −0.0005 | −0.8 |
| 16 June 2025 | 0.1092 | 0.1108 | 0.0003 | 0.016 | 0.0016 | 1.4 |
| 14 May 2025 | 0.1525 | 0.1532 | 0.0007 | 0.013 | 0.0007 | 0.4 |
| 3 June 2025 | 0.1092 | 0.1113 | 0.0007 | 0.011 | 0.0021 | 1.9 |
| 25 July 2025 | 0.1091 | 0.1108 | 0.0002 | 0.013 | 0.0017 | 1.6 |
Table 4.
Within-day repeatability (n = 3) of sodium retention times (tr) and peak area measurements of examined composite blood-collection tubes anticoagulant solutions, s and sr(%) stand for standard deviation and relative percent standard deviation.
Table 4.
Within-day repeatability (n = 3) of sodium retention times (tr) and peak area measurements of examined composite blood-collection tubes anticoagulant solutions, s and sr(%) stand for standard deviation and relative percent standard deviation.
| Repetition | 1. | 2. | 3. | s | sr(%) | |
|---|---|---|---|---|---|---|
| Tubes | tr (min) | |||||
| A | 5.25 | 5.24 | 5.25 | 5.247 | 0.006 | 0.1 |
| C | 5.21 | 5.22 | 5.22 | 5.217 | 0.006 | 0.1 |
| A(nr) | 5.26 | 5.26 | 5.27 | 5.263 | 0.006 | 0.1 |
| Tubes | Peak area (AU) | |||||
| A | 2.401 × 10⁸ | 2.393 × 10⁸ | 2.407 × 10⁸ | 2.400 × 10⁸ | 7.2 × 10⁵ | 0.30 |
| C | 2.237 × 10⁸ | 2.275 × 10⁸ | 2.280 × 10⁸ | 2.264 × 10⁸ | 2.4 × 10⁶ | 1.0 |
| A(nr) | 2.371 × 10⁸ | 2.381 × 10⁸ | 2.387 × 10⁸ | 2.380 × 10⁸ | 8.4 × 10⁵ | 0.35 |
Table 5.
Within-laboratory reproducibility of the regression parameters of five-point (n = 5) calibration function (y = a × x + b) for sodium determination during a two-month period.
Table 5.
Within-laboratory reproducibility of the regression parameters of five-point (n = 5) calibration function (y = a × x + b) for sodium determination during a two-month period.
| Date | a | sa | b | sb | sy/x | R2 |
|---|---|---|---|---|---|---|
| 3 June 2025 | 3.779 × 10⁵ | 1.174 × 10⁴ | −3.723 × 10⁶ | 4.193 × 10⁶ | 1.857 × 10⁶ | 0.9971 |
| 4 June 2025 | 3.785 × 10⁵ | 1.717 × 10³ | −1.575 × 10⁶ | 6.129 × 10⁵ | 2.714 × 10⁵ | 0.9999 |
| 5 June 2025 | 3.597 × 10⁵ | 6.208 × 10³ | 4.023 × 10⁶ | 2.217 × 10⁶ | 9.815 × 10⁵ | 0.9991 |
| 23 July 2025 | 3.550 × 10⁵ | 2.511 × 10³ | 1.754 × 10⁶ | 8.966 × 10⁵ | 3.970 × 10⁵ | 0.9999 |
| 24 July 2025 | 3.563 × 10⁵ | 4.198 × 10³ | 1.795 × 10⁶ | 1.499 × 10⁶ | 6.637 × 10⁵ | 0.9996 |
| 25 July 2025 | 3.576 × 10⁵ | 2.799 × 10³ | 1.287 × 10⁶ | 9.994 × 10⁵ | 4.426 × 10⁵ | 0.9998 |
Table 6.
Accuracy of sodium amount concentration determination.
| Date | τ (mmol/L) | Mean (mmol/L) (n = 3) | s (mmol/L) | sx0/x0 | B (mmol/L) | Br(%) (%) |
|---|---|---|---|---|---|---|
| 3 June 2025* | 15.22 | 15.17 | 0.06 | 0.0012 | −0.05 | −0.3 |
| 4 June 2025* | 15.22 | 15.16 | 0.03 | 0.00018 | −0.06 | −0.4 |
| 5 June 2025* | 15.22 | 15.23 | 0.04 | 0.00069 | 0.01 | 0.1 |
| 23 July 2025** | 16.36 | 16.18 | 0.30 | 0.00027 | −0.18 | −1.1 |
| 24 July 2025** | 16.36 | 16.40 | 0.005 | 0.00045 | 0.04 | 0.2 |
| 25 July 2025** | 16.36 | 16.09 | 0.46 | 0.00030 | −0.27 | −1.7 |
*NaCl, **trisodium citrate.
Table 7.
pH of anticoagulant solution in blood collection tubes after the addition of 1.8 mL of boiled Milli-Q water.
Table 7.
pH of anticoagulant solution in blood collection tubes after the addition of 1.8 mL of boiled Milli-Q water.
| pH | A | A(nr) | C |
|---|---|---|---|
| Measured | 5.948 | 5.901 | 6.115 |
| 5.964 | 5.896 | 6.125 | |
| 5.940 | 5.891 | 6.122 | |
| 5.900 | 5.903 | 6.157 | |
| 5.912 | 5.878 | 6.134 | |
| Mean Standard deviation |
5.93 | 5.89 | 6.13 |
| 0.03 | 0.01 | 0.02 |
Table 8.
Between series reproducibility of the seven-point (n = 7) calibration function (y = a × x + b) of the dye-dilution method.
Table 8.
Between series reproducibility of the seven-point (n = 7) calibration function (y = a × x + b) of the dye-dilution method.
| Series | a | sa | b | sb | sy/x | R2 |
|---|---|---|---|---|---|---|
| Tartrazine, citrate | 0.0462 | 0.0005 | −0.0364 | 0.0060 | 0.0035 | 0.9994 |
| Tartrazine, citrate, pH | 0.0437 | 0.0012 | −0.0080 | 0.0146 | 0.0085 | 0.9962 |
| Erioglaucine, citrate | 0.1234 | 0.0035 | −0.0233 | 0.0144 | 0.0144 | 0.9960 |
| Erioglaucine, citrate, pH | 0.1206 | 0.0021 | 0.0076 | 0.0088 | 0.0056 | 0.9984 |
| Series 0 | 0.1205 | 0.0010 | −0.0106 | 0.0042 | 0.0027 | 0.9997 |
| Series 1 | 0.1164 | 0.0035 | 0.0006 | 0.0144 | 0.0092 | 0.9956 |
| Series 2 | 0.1179 | 0.0035 | −0.0021 | 0.0143 | 0.0092 | 0.9957 |
| Series 3 | 0.1134 | 0.0011 | 0.0134 | 0.0046 | 0.0030 | 0.9995 |
Table 9.
Dye-dilution method anticoagulant volume prediction capability – proof of concept.
| Parameter | 150 μL | 180 μL | 200 μL | 220 μL |
|---|---|---|---|---|
| VAC_1_esitmated (μL) | 157.83 | 197.05 | 213.54 | 229.59 |
| VAC_2_esitmated (μL) | 163.27 | 183.77 | 208.36 | 217.47 |
| VAC_3_esitmated (μL) | 146.22 | 177.92 | 198.28 | 216.15 |
| VAC_4_esitmated (μL) | − | 181.42 | 198.28 | 213.54 |
| n | 3 | 4 | 4 | 4 |
| Mean | 155.8 | 185.0 | 204.6 | 219.2 |
| s | 8.7 | 8.4 | 7.6 | 7.1 |
| sr(%) (%) | 5.6 | 4.5 | 3.7 | 3.3 |
| B (µL) | 5.77 | 5.04 | 4.62 | −0.81 |
| Br(%) (%) | 3.85 | 2.80 | 2.31 | −0.37 |
| tcalculated | 1.148 | 1.206 | 1.213 | 0.226 |
| p-value | 0.37 | 0.31 | 0.31 | 0.83 |
Table 10.
Relative percent error of volume predictions, er(%), derived from the dye mass concentrations interpolated from the Series 1 to 3 calibration lines equations, based on the absorbance measurements of the model dye solutions, and the p-values of the single-factor ANOVA tests, with the experimental series or expected volumes as the controlled factors.
| Series | 150 μL | 180 μL | 200 μL | 220 μL | p-value |
|---|---|---|---|---|---|
| S1 | −9.4 | 1.6 | −2.3 | 0.6 |
0.21 |
| 2.2 | 0.3 | −6.2 | 5.7 | ||
| −4.6 | 2.3 | 1.7 | 1.3 | ||
|
S2 |
1.6 | 4.9 | 0.4 | −5.9 |
0.26 |
| 2.9 | 0.3 | −2.3 | −2.3 | ||
| 0.3 | −4.1 | 1.7 | −1.6 | ||
|
S3 |
1.0 | −3.2 | 1.9 | −1.3 |
0.81 |
| −2.2 | 2.1 | 1.9 | 2.4 | ||
| 2.9 | −1.3 | −2.9 | 2.4 | ||
| p-value | 0.24 | 0.70 | 0.57 | 0.06 |
Table 11.
Results of the ANOVA test for the anticoagulant volume determined in the blood collection tubes of different brands, the asterisk at a hanging indent indicates that the between-groups differences proved statistically significant.
Table 11.
Results of the ANOVA test for the anticoagulant volume determined in the blood collection tubes of different brands, the asterisk at a hanging indent indicates that the between-groups differences proved statistically significant.
| Tube-brands | Count | Sum | Average | Variance | Differences | ||||
|---|---|---|---|---|---|---|---|---|---|
| A | 9 | 1708 | 189.8 | 27.4 | * | ||||
| C | 9 | 1600 | 177.8 | 257 | * | ||||
| A(nr) | 9 | 1725 | 191.7 | 23.6 | * | ||||
Table 12.
Concentrations of sodium and citrate determined in parallel in the tubes of the three brands after the addition of Milli-Q water in a volume corresponding to the nominal draw volume of 1.8 mL and relative uncertainties of interpolation of concentrations of the calibration line equations.
Table 12.
Concentrations of sodium and citrate determined in parallel in the tubes of the three brands after the addition of Milli-Q water in a volume corresponding to the nominal draw volume of 1.8 mL and relative uncertainties of interpolation of concentrations of the calibration line equations.
| Tubes | Sodum ion, cNa (mmol/L) | Citrate, cDTM (mmol/L) | ||||||||||
|---|---|---|---|---|---|---|---|---|---|---|---|---|
| A | 27.980 | 29.040 | 28.531 | 28.215 | 28.743 | 27.918 | 11.71 | 11.65 | 11.57 | 11.35 | 11.15 | 11.56 |
| A(nr) | 28.986 | 26.366 | 27.400 | 28.195 | 28.591 | 27.922 | 12.25 | 10.74 | 11.16 | 11.78 | 11.46 | 11.56 |
| C | 26.699 | 27.545 | 26.617 | 26.877 | 26.744 | 28.748 | 11.11 | 10.94 | 10.71 | 10.90 | 10.78 | 11.37 |
| Tubes | sx0/x0 | |||||||||||
| A | 4 × 10⁻³ | 4 × 10⁻³ | 6 × 10⁻³ | 6 × 10⁻³ | 4 × 10⁻³ | 4 × 10⁻³ | 0.02 | 0.02 | 0.02 | 0.02 | 0.01 | 0.01 |
| A(nr) | 4 × 10⁻³ | 4 × 10⁻³ | 7 × 10⁻³ | 6 × 10⁻³ | 4 × 10⁻³ | 4 × 10⁻³ | 0.01 | 0.02 | 0.02 | 0.02 | 0.01 | 0.01 |
| C | 4 × 10⁻³ | 4 × 10⁻³ | 7 × 10⁻³ | 7 × 10⁻³ | 5 × 10⁻³ | 4 × 10⁻³ | 0.02 | 0.02 | 0.02 | 0.02 | 0.02 | 0.01 |
Table 13.
Retention times and amount concentrations of anionic impurities in composite samples prepared from the blood collection tubes of a particular type and expressed in μmol/L.
Table 13.
Retention times and amount concentrations of anionic impurities in composite samples prepared from the blood collection tubes of a particular type and expressed in μmol/L.
| Tubes | Year |
c (C2H3O2−) ± s (n = 3) |
c (HCOO−) ± s (n = 3) |
c (Cl−) ± s (n = 3) |
c (NO2−) ± s (n = 3) |
c (SO42−) ± s (n = 3) |
c (C2O42−) ± s (n = 3) |
c (Br−) ± s (n = 3) |
c (NO3−) ± s (n = 3) |
|---|---|---|---|---|---|---|---|---|---|
| tR (min) | 1.980 | 2.045 | 2.650 | 2.972 | 3.418 | 3.885 | 4.392 | 4.601 | |
| A_old | 2024 | (6 ± 1) ×10 | 34 ± 2 | 41 ± 5 | 76 ± 4 | 7 ± 2 | 21 ± 3 | 31 ± 4 | 5.6 ± 0.2 |
| C_old | 2023 | 8 ± 1 | − | 48 ± 2 | − | 6.4 ± 0.1 | 3.8 ± 0.3 | 8.6 ± 0.2 | 14.3 ± 0.3 |
| B_old | 2024 | − | − | − | − | 6.95 ± 0.04 | − | 7.39 | − |
| C | 2025 | 1.72 | − | 56.3 ± 0.9 | − | 7.3 ± 0.9 | 3 ± 1 | 11 ± 1 | 14 ± 2 |
| A | 2026 | 114 ± 7 | 24 ± 1 | 31 ± 3 | 66.9 ± 0.2 | 3.63 ± 0.02 | 16.01 ± 0.02 | 21 ± 1 | 4.9 ± 0.1 |
| A(nr) | 2026 | 71 ± 3 | 21.4 ± 0.5 | 19.62 ± 0.08 | 56.5 ± 0.3 | 3.5 ± 0.1 | 12.0 ± 0.3 | 17.9 ± 0.1 | − |
Table 14.
Overall blood collection tubes quality comparison.
| Parameter | A | A(nr) | C | τ |
|---|---|---|---|---|
| MEAN cDTM (mmol/L) | 11.5 | 11.5 | 11.0 | 10.9 |
| s (mmol/L) | 0.2 | 0.5 | 0.2 | — |
| sr(%) (%) | 1.8 | 4.5 | 2.2 | — |
| Br(%) (%) | 5.5 | 5.4 | 0.6 | — |
| MEAN VAC (µL) | 190 | 192 | 178 | 200 |
| s (µL) | 5 | 5 | 16 | — |
| sr(%) (%) | 2.8 | 2.5 | 9.0 | — |
| Br(%) (%) | −5.1 | −4.2 | −11 | — |
| MEAN fAC_dil (1) | 10.5 | 10.4 | 11.1 | 10 |
| Br(%) (%) | 4.8 | 3.9 | 11 | |
| MEAN cAC (mmol/L) | 121 | 119 | 122 | 109 |
| s (mmol/L) | 2 | 5 | 3 | — |
| sr(%) (%) | 1.8 | 4.5 | 2.2 | — |
| Br(%) (%) | 11 | 9.5 | 12 | — |
| MEAN nAC (µmol) | 22.9 | 22.9 | 21.7 | 21.8 |
| Br(%) (%) | 5.0 | 5.0 | −0.5 | — |
| MEAN cK (mol/L) | * | * | 0.131 (n = 6)** | — |
| MEAN cMg (mmol/L) | * | * | 0.233 (n = 4)** | — |
| MEAN cCa(mmol/L) | 0.007 (n = 3)** | 0.004 (n = 3)** | 0.004 (n = 1)** | — |
* Below the calibration range. **In parentheses, the number of tubes, out of the total of six, in which the impurity was possible to quantify, is given.
Table 15.
Characteristics of the examined evacuated citrate or buffered citrate blood-collection tubes.
Table 15.
Characteristics of the examined evacuated citrate or buffered citrate blood-collection tubes.
| Abbreviation | Anticoagulant c (mmol/L) |
Expiration Date | Draw Volume (mL) |
|---|---|---|---|
| A_old** | 109 | 4 July 2024 | 1.8 |
| B_old** | 109 | 31 January 2024 | 1.8 |
| C_old** | 109* | 31 December 2023 | 1.8 |
| A | 109 | 1 February 2026 | 1.8 |
| A(nr) | 109 | 1 February 2026 | 1.8 |
| C | 109* | August 2025 | 1.8 |
* Buffered trisodium citrate according to specification. **Included because they were involved in the previous study [5].
Disclaimer/Publisher’s Note: The statements, opinions and data contained in all publications are solely those of the individual author(s) and contributor(s) and not of MDPI and/or the editor(s). MDPI and/or the editor(s) disclaim responsibility for any injury to people or property resulting from any ideas, methods, instructions or products referred to in the content. |
© 2025 by the authors. Licensee MDPI, Basel, Switzerland. This article is an open access article distributed under the terms and conditions of the Creative Commons Attribution (CC BY) license (http://creativecommons.org/licenses/by/4.0/).
Copyright: This open access article is published under a Creative Commons CC BY 4.0 license, which permit the free download, distribution, and reuse, provided that the author and preprint are cited in any reuse.


