
Submitted:
07 October 2025
Posted:
08 October 2025
You are already at the latest version
Abstract
This study explicitly considers dynamic axle load transfer and load-sensitive tire–road friction characteristics in estimating the safe speed of multi-axle trucks negotiating curved road segments. Conventional standards, which assume a constant friction coefficient, fail to capture wheel-specific load variations and tend to underestimate rollover and skidding risks. To overcome these limitations, a load-sensitive friction model is integrated with the friction ellipse and the static rollover threshold (SRT), and a forward–backward pass is applied to compute dynamically feasible speed trajectories. The framework was demonstrated through accident reconstruction of a curved ramp rollover scenario using TruckSim–Simulink co-simulation based on reported geometric and vehicle parameters. The results show that ignoring load sensitivity systematically overestimates safe speeds and underestimates lateral deviations. Moreover, variations in the SRT level demonstrated the trade-off between structural stability and frictional constraints, with rollover dominating at lower stability and skidding at higher stability. These findings highlight the necessity of incorporating dynamic load distribution and load-sensitive friction into truck safety speed estimation. The proposed framework provides a foundation for speed control strategies in autonomous trucks and for improvements in road design standards, with potential for enhanced applicability when combined with emerging real-time friction estimation and load measurement technologies.
Keywords:
Load-sensitive friction
; Dynamic load transfer
; Safe speed estimation
; Multi-axle truck dynamics
; Autonomous heavy vehicles
; TruckSim-Simulink
1. Introduction
The commercialization of autonomous heavy trucks is rapidly progressing, and driving safety on curved road segments has become a critical issue in traffic safety research. According to the NHTSA report, approximately 9.8% of fatal heavy truck crashes occur while negotiating a curve [1]. Rollover and skidding, primarily caused by excessive speed, have been identified as the main contributors to such accidents. These facts highlight the necessity of reliable safe speed estimation and control strategies for autonomous heavy trucks.
Conventional road design standards [2,3] estimate safe speeds based on road curvature and an assumed constant static friction coefficient (). While these standards provide a baseline level of safety, they neglect dynamic load transfer and the load sensitivity of tire–road friction, both of which play a crucial role in real driving conditions. Numerous studies have also adopted the constant assumption. For instance, Xin et al. [4] estimated the critical safe speed of trucks on sharp curves by treating friction as constant. However, this approach is structurally limited, as it fails to capture friction reduction resulting from wheel-specific load variations during actual driving.
To overcome such limitations, vehicle dynamics research has focused on more precise tire–road interaction modeling. Wong [5] and Rajamani [6] analyzed vehicle limit behavior considering slip angle and slip ratio. Pacejka’s Magic Formula [7] introduced a nonlinear representation of tire forces, which has since become a standard tool in handling-limit analysis. Subsequent experimental studies [8,9] demonstrated that the friction coefficient decreases nonlinearly with increasing normal load, thereby confirming load sensitivity as a significant physical phenomenon.
Truck-oriented studies have provided further evidence. Segel and Ervin [10] reported that heavy truck tires exhibit a more pronounced reduction in friction coefficient than passenger car tires under the same load increase. More recently, Zhang et al. [11] reconstructed real rollover accidents using TruckSim-based simulations and showed that increases in center-of-gravity (CG) height significantly amplify the Lateral Load Transfer Ratio (LTR), thus raising rollover risk. These studies underscore the necessity of jointly considering load-sensitive friction and dynamic load transfer in curve safety evaluation.
Recent research has also advanced real-time safety technologies. Chen and Peng [12] developed an LTR-based rollover warning system, while Kamnik et al. [13] established the Static Rollover Threshold (SRT) as a key indicator of structural stability. Non-contact friction estimation methods using video, radar, and infrared sensors have been proposed [14,15,16], and machine learning–based prediction models have also been developed [17,18]. In addition, curve speed planning has been formulated as an optimization problem to enable real-time implementation [19,20], while predictive indices such as the PLTR [21] have been introduced for rollover-preventive control.
Nevertheless, approaches that simultaneously incorporate wheel-level dynamic load variations and load-sensitive friction coefficients in safe speed estimation for multi-axle trucks remain scarce. To address this gap, the present study proposes a new framework that integrates structural stability (SRT), dynamic load transfer, and load-sensitive friction. The framework combines the friction ellipse theory to capture trade-offs among traction, braking, and steering demands. It is implemented in a TruckSim–Simulink environment and benchmarked against constant assumptions. Furthermore, its validity is examined through reconstructed curved ramp scenarios based on real accident data. The proposed framework provides a generalized procedure for safe speed assessment that considers both rollover and skidding constraints, offering practical implications for real-time speed control in autonomous heavy trucks and for future improvements in road design standards.
2. Materials and Methods
2.1. Problem Definition and Overview
The maximum safe speed of a heavy truck negotiating a curved road segment is primarily governed by two mechanisms: friction utilization leading to skidding and excessive lateral load transfer leading to rollover. Both phenomena represent critical safety limits, and a realistic speed profile must satisfy both simultaneously.
In this study, we propose a method that computes wheel-level normal loads, applies a load-sensitive friction coefficient , and determines the available lateral and longitudinal forces at each wheel. These available forces are compared against the required tire forces using the friction ellipse constraint to check for incipient skidding. In parallel, the Load Transfer Ratio (LTR) is evaluated to assess rollover risk. The maximum speed at each station is numerically determined as the largest speed that satisfies both constraints, and a forward–backward speed shaping procedure is performed to account for realistic longitudinal dynamics and yield a feasible speed profile.
2.2. Road Geometry and Required Tire Forces
The road is parameterized by station coordinate , curvature , radius , longitudinal grade , and superelevation . For a given speed , the geometric and effective lateral accelerations are
and the required longitudinal acceleration due to grade is
The corresponding total lateral and longitudinal force demands are
Static axle loads are computed from the total vehicle mass, payload distribution, and axle shares. The dynamic left–right load transfer at axle is modeled as
where is the track width and is the fractional load transfer share of axle (). The instantaneous left and right axle loads are then
For tandem or dual tires, these loads are evenly split to obtain wheel-level normal loads , which serve as the basis for computing available tire forces.
2.3. Load-Sensitive Friction and Skid Constraint
The peak tire–road friction coefficient is not constant but decreases as the normal load per tire increases. This behavior has been well established in experimental studies [5,10], which show that although the total friction force grows with load, the coefficient of friction per unit load exhibits a mild reduction. This effect can be captured by a power-law load-sensitivity model:
where is a reference normal load, is the peak friction at , and represents the load-sensitivity exponent. To avoid non-physical results at extreme loads, the friction coefficient is clamped within .
Given the instantaneous wheel loads and the corresponding , the available combined tire forces are limited by the friction ellipse. Introducing a safety margin factor , the combined longitudinal–lateral force constraint for each wheel is expressed as
The total required lateral force is distributed among wheels proportionally to their vertical loads:
This allocation yields the residual longitudinal force capacity per wheel:
If the demanded longitudinal force exceeds on any wheel, a skid event is predicted. The friction-limited speed at a given station is thus the maximum speed at which the sum of available lateral forces across all wheels still satisfies the total lateral demand.
2.4. Rollover Criterion and Safe Speed Determination
The rollover propensity of a multi-axle truck is evaluated using the Load Transfer Ratio (LTR), defined as
where and denote the normal loads on the outer and inner wheels of the -th axle, respectively. An LTR of 1.0 indicates that all inner wheels are completely unloaded, corresponding to incipient rollover. To maintain rollover safety, the following condition must be satisfied at every station along the path:
where is the vehicle speed, the curvature radius, the road grade and the superelevation angle. In this study, a nominal threshold of was initially adopted, which is widely used in rollover studies to represent the onset of wheel lift with a safety margin before complete rollover.
Since the absolute value of LTR depends on model assumptions such as suspension roll stiffness distribution, center-of-gravity height, and payload configuration, a calibration procedure was introduced to ensure physical consistency.
Specifically, the Static Rollover Threshold (SRT) of the model was obtained by gradually increasing the steady-state lateral acceleration on a level surface until LTR reached unity, yielding
The resulting was compared with representative values summarized in Table 1, which compiles experimental and simulation-based data from previous studies.
According to the literature, typical tractor–semitrailer combinations exhibit SRT values in the range of 0.35–0.50 g, while light rigid trucks with favorable geometric configurations can reach values approaching 0.80-1.00 g. These findings indicate that rollover resistance is strongly influenced by factors such as vehicle loading condition, center-of-gravity height, and suspension geometry. Considering this range, three representative SRT levels—0.3 g, 0.5 g, and 0.7 g—were selected as reference targets in this study. These values correspond to low-stability (0.3 g), moderate-stability (0.5 g), and high-stability (0.7 g) configurations, respectively, and adequately cover the practical stability spectrum of multi-axle trucks.
When the computed exceeded the selected target value, a global scaling factor was applied to the roll moment distribution so that exactly matched . This calibration step aligns the model with standardized safety metrics such as the Static Stability Factor (SSF), which is numerically equivalent to SRT expressed in g-units, thereby ensuring that the predicted rollover speeds are neither overly conservative nor overly optimistic.
Finally, the safe speed envelope is determined by solving for the maximum speed at each station that satisfies the calibrated rollover criterion:
To validate the choice of , Table 1 summarizes representative SRT values from recent literature [22,23,24] for trucks ranging from light two-axle to heavy multi-axle configurations. The selected target lies near the center of the reported range for tractor–semitrailer combinations and is consistent with international safety guidelines.
2.5. Longitudinal Dynamics and Final Speed Shaping
The lateral-stability-based speed profile defines the maximum allowable speed envelope considering only tire force saturation and rollover constraints. In practice, vehicles are also limited by engine power, drivetrain efficiency, aerodynamic drag, rolling resistance, and comfort limits on acceleration and braking. To produce a realizable speed trajectory, these longitudinal effects are incorporated through a forward–backward pass.
2.5.1. Residual Longitudinal Capacity
At each station , the remaining tire force capacity after satisfying the lateral demand is converted into an equivalent longitudinal acceleration:
After subtracting aerodynamic drag , rolling resistance , and grade resistance , the net available acceleration is further limited by the powertrain:
The final feasible acceleration and braking deceleration are
Here and are driver-imposed comfort limits.
2.5.2. Final Speed Shaping
Once the tire-limited longitudinal acceleration and braking capabilities have been computed, a forward–backward pass algorithm is applied to shape a dynamically feasible speed trajectory along the path.
In the forward pass, each station’s speed is updated by propagating the maximum allowable acceleration without exceeding the local lateral stability envelope:
are feasible by iteratively adjusting the speed profile in the reverse direction:
This forward–backward iteration continues until the profile converges within a predefined tolerance. The resulting trajectory satisfies friction, rollover, and longitudinal acceleration constraints, providing a smooth and physically realizable speed profile for trajectory planning or intelligent speed advisory applications.
3. Results
This section presents the validation results of the proposed dynamic load–sensitive friction coefficient model and safe speed estimation framework using TruckSim–Simulink co-simulation. For comparison, two cases were considered: one assuming a constant friction coefficient and the other applying the proposed -based load-sensitive friction model. The validation scenario was reconstructed from an actual accident case involving a curved ramp.
3.1. Simulation Setup
The simulation was conducted using a co-simulation environment linking TruckSim with MATLAB/Simulink. The test vehicle was a four-axle rigid truck, with its configuration shown in Figure 1. Figure 2 illustrates the curved ramp section reconstructed from a fatal rollover accident of a multi-axle truck [11]. The simulation route incorporated the actual geometric conditions of the accident site, including curve radius and longitudinal/lateral slope.
The major physical parameters—including gross vehicle weight, axle load distribution ratio, center of gravity (CG) height, axle track width, roll stiffness distribution ratio, and load-sensitive friction parameters—were derived from the accident vehicle data, and their detailed values are summarized in Table 2.
As shown in Table 2, the gross vehicle weight was set to approximately 32 tons, and the CG height increased from about 1.60 m (empty) to 2.73 m (full), which is a critical factor influencing the Static Rollover Threshold (SRT). The axle load distribution ratio [0.21, 0.30, 0.25, 0.24] reflects the fact that load transfer during cornering may be concentrated on specific axles. The axle track width (2.04–1.82 m) and the roll stiffness distribution ratio [0.15, 0.20, 0.30, 0.35] serve as important inputs in calculating the Lateral Load Transfer Ratio (LTR).
In particular, the proposed formulation employs a reference normal load and a load-sensitivity exponent to characterize how the tire–road friction coefficient varies with vertical load. The chosen corresponds to the average static wheel load of the vehicle under a half-loaded condition, approximately representing the midpoint between the curb-weight and fully loaded wheel loads obtained from TruckSim’s static analysis. With this setup, the simulation environment enables a quantitative assessment of rollover and skidding risks of multi-axle trucks negotiating curved ramps.
3.2. Dominant Constraints in Safe Speed Determination
Figure 3 illustrates how the dominant constraint on safe speed varies along the curved ramp as a function of the tire–road friction coefficient (). The color shading distinguishes whether rollover or skidding governs the speed limit, and each panel corresponds to a different Static Rollover Threshold (SRT) setting: 0.3, 0.5, and 0.7. The ramp consists of an entry straight, spiral-in (increasing curvature), circular arc (apex), spiral-out (decreasing curvature), and exit straight, with the governing factor shifting as the lateral demand changes with curvature.
When the SRT is low (Figure 3a, SRT = 0.3), rollover dominates across the entire ramp due to poor structural stability, and the apex region is governed by rollover even under high friction. This indicates that for vehicles with high centers of gravity or weak roll stiffness, rollover remains the critical constraint regardless of road surface conditions. At a moderate SRT (Figure 3b, SRT = 0.5), skidding governs at low friction (μ = 0.3–0.5), but rollover becomes dominant at the apex once μ exceeds 0.7. With a high SRT (Figure 3c, SRT = 0.7), skidding is the prevailing constraint under most friction conditions, and rollover appears only locally near the apex under very high μ.
These results confirm that safe speed cannot be explained by a single factor. At low SRT values, rollover is the dominant constraint; at intermediate levels, the governing factor alternates between skidding and rollover depending on μ; and at high SRT values, skidding dominates except under extreme friction. Therefore, both vehicle structural stability (SRT) and road surface conditions (μ) must be jointly considered in safe speed estimation. Neglecting either factor risks overestimating or underestimating the true safe speed. This finding underscores the necessity of integrated approaches in curve safety assessment and the design of speed control algorithms for autonomous multi-axle trucks.
3.3. Effects of the Load-Sensitivity Exponent
As discussed in Section 3.2, the safe speed of a multi-axle truck on curved ramps is governed by the interplay between rollover and skidding constraints. This section investigates the quantitative influence of the load-sensitivity coefficient (c) in the proposed load-sensitive friction model, defined as hereafter referred to as the . The exponent c represents the rate at which the tire–road friction coefficient decreases with increasing vertical load.
To validate the proposed model, experimental data from Segel and Ervin [10] were analyzed for both passenger-car and heavy-truck tires. Their experiments were conducted on dry Portland cement concrete with coarse surface texture, where vertical load was incrementally varied while measuring the tire–road friction coefficient (). The measured data were normalized by a reference load () to enable comparison across vehicle types. Figure 4 presents the fitting results obtained using the proposed model. For passenger-car tires, and , showing a relatively mild reduction in friction with increasing load. For heavy-truck tires, and were identified, indicating a stronger load sensitivity. This implies that under equivalent load increases, truck tires experience a greater loss in friction compared to passenger-car tires. These results confirm that the exponent c captures the actual load–friction behavior observed in experiments, supporting its role as a physically meaningful parameter rather than a theoretical assumption.
Based on this validation, the effect of varying on the vehicle’s dynamic behavior was further analyzed. Figure 5 illustrates the simulation results for c values ranging from 0.4 to 1.0, with SRT fixed at 0.5 and μ₀ at 0.3. Here, corresponds to the idealized case with no variation in friction regardless of load. Figure 5(a) shows the simulated vehicle speed under the same reference safe-speed condition, Figure 5(b) presents the minimum friction coefficient among all wheels, and Figure 5(c) displays the lateral offset from the lane centerline.
The results indicate that as decreases, friction on the outer wheels drops more sharply due to higher vertical loads, leading to increased lateral deviation. Particularly at , pronounced outward displacement occurred, whereas for , friction remained uniform across wheels, resulting in minimal deviation and stable trajectory tracking. In other words, higher load sensitivity (smaller ) significantly degrades vehicle stability even at the same nominal speed.
Figure 6 provides a detailed view of dynamic wheel loads and the corresponding friction variations during ramp negotiation under SRT = 0.5, μ₀ = 0.3, and c = 0.4. Figure 6(a) shows the left–right wheel load distribution, where the outer wheels experience load increases while the inner wheels unload due to centrifugal effects. Wheel positions correspond to those defined in Figure 1 and Table 2. Figure 6(b) applies the model to calculate the resulting friction coefficients. For the outer wheels, the friction coefficient dropped markedly with increasing load: for instance, the L4 wheel decreased from μ₀ = 0.3 to a minimum of 0.229 (a 23.5% reduction), while the L3 and L1 wheels fell to 0.236 and 0.237, respectively (approximately 21% reduction). In contrast, the R1 wheel showed only a 6% reduction ( = 0.281). These results quantitatively demonstrate that load redistribution during cornering directly translates into asymmetric friction loss, where the minimum μ among wheels governs overall vehicle stability.
Figure 7 compares the simulation results between cases with and without load sensitivity (c = 0.4). Following the procedure established in Section 2, the safe speed was calculated by considering vertical loads at each wheel, applying the model, and incorporating both the friction ellipse and LTR-based rollover constraints. Figure 7(a) compares the safe-speed profiles for the two cases. When assuming a constant μ, the estimated safe speed remained relatively high even in sharp curvature sections. In contrast, applying the model produced lower safe-speed estimates as the reduced friction on the outer wheels became dominant in the friction-limited zones. Quantitatively, the average difference between the two cases was approximately 7.5 km/h. Figure 7(b) shows the corresponding lateral offset. With load sensitivity considered, the average offset increased to +0.080 m (standard deviation 0.163 m), and the maximum reached 0.52 m. Without load sensitivity, the average offset was −0.044 m (standard deviation 0.075 m) with a maximum of only 0.12 m. This indicates that neglecting load sensitivity leads to underestimation of trajectory deviation and overestimation of stability, whereas including it reflects the actual instability and risk more realistically.
Overall, the results demonstrate that incorporating the load-sensitive friction model enables a more realistic estimation of safe speed and lateral behavior during cornering. Conversely, assuming a constant friction coefficient leads to optimistic and potentially unsafe predictions. Therefore, accounting for load sensitivity is essential for accurate stability evaluation and for improving real-time speed control algorithms and road design standards for autonomous heavy trucks.
4. Discussion
This section discusses the physical implications and practical significance of dynamic load transfer and load-sensitive friction characteristics on the estimation of safe speed for multi-axle trucks negotiating curved road segments.
First, the Static Rollover Threshold (SRT) served as a key parameter determining the absolute level of safe speed, as it represents the vehicle’s inherent structural stability. When SRT = 0.3, rollover dominated throughout the curve, and the safe speed remained around 50–55 km/h. As SRT increased to 0.5, rollover and skidding constraints alternated, expanding the safe-speed range to 55–70 km/h. At SRT = 0.7, skidding became the dominant constraint, allowing speeds exceeding 75 km/h. These results indicate that, even under identical geometric conditions, differences in structural stability can lead to more than a 20 km/h variation in the estimated safe speed.
Second, the load-sensitivity coefficient (c) proved to be a critical factor explaining the stability differences among vehicle types. Based on the fitting results from Segel and Ervin (1981), the value of c was estimated as 0.893 for passenger-car tires and 0.821 for heavy-truck tires, demonstrating that truck tires experience a greater friction reduction under equivalent load increases. Consistent with this finding, the simulation results of the present study showed that when c = 0.4, the friction coefficient of the outer wheels decreased by more than 20% from its nominal value, while the lateral offset increased to an average of 0.080 m and a maximum of 0.52 m. In contrast, when c = 1.0, no friction degradation occurred with varying load, and the trajectory deviation was negligible. These results empirically confirm that the minimum outer-wheel friction coefficient governs the overall vehicle stability during curve negotiation.
Third, a systematic difference was observed between the constant-μ and -based models in both safe-speed estimation and trajectory stability evaluation. The constant-μ model overestimated the safe speed by an average of approximately 7.5 km/h and underestimated the lateral deviation (average −0.044 m, maximum 0.12 m). In contrast, the model, which incorporated the load increase on the outer wheels and the corresponding friction reduction, yielded more realistic results—average offset of 0.080 m and maximum offset of 0.52 m. This clearly indicates that the constant-μ assumption tends to underestimate the actual driving risk on curved ramps.
Overall, these findings suggest that integrating dynamic load transfer and load-sensitive friction characteristics provides a quantitatively more accurate representation of the actual driving risk during curve negotiation than the traditional constant-friction assumption. The present discussion provides strong evidence supporting the adoption of load-sensitive friction models in real-time speed control algorithms for autonomous heavy trucks and in the development of improved road design standards.
5. Conclusions
This study proposed a new framework for realistically estimating the safe speed of multi-axle trucks on curved road segments by integrally considering dynamic load transfer and load-sensitive tire–road friction characteristics. Conventional approaches based on a constant friction coefficient () have been widely used in road design and vehicle control systems; however, this study quantitatively demonstrated that such methods can systematically underestimate actual driving risks by neglecting the friction reduction caused by load transfer during cornering. Through TruckSim–Simulink co-simulations, the proposed model captured the nonlinear interaction between load variation and friction degradation, providing a more accurate prediction of rollover and skidding risks. The constant-μ approach tended to overestimate the safe speed by about 7–10 km/h and underestimate lateral deviation, whereas the proposed framework reproduced how the increase in outer-wheel load and the associated friction loss affect the rollover–skidding boundary under realistic driving conditions.
These results highlight the academic and practical significance of establishing a generalized safety-speed estimation procedure that accounts for the interaction between load dynamics and tire–road friction. The proposed framework provides a quantitative basis for the development of real-time speed control algorithms for autonomous heavy trucks, the improvement of road design standards by incorporating dynamic stability considerations, and the integration with on-board sensing systems for adaptive safety-speed evaluation. Future work will extend the framework to various surface conditions (e.g., wet, icy, or worn roads) and multi-combination vehicle configurations and will link it with on-vehicle measurement-based online estimation and validation. Through these extensions, the proposed approach is expected to make a practical contribution to improving the safety and reliability of autonomous heavy trucks under real-world driving environments.
Author Contributions
Conceptualization, S.-S.Y.; methodology, S.-S.Y.; software, S.-S.Y. and P.-A.K.; validation, S.-S.Y. and P.-A.K.; formal analysis, S.-S.Y.; investigation, S.-S.Y.; resources, H.-S.L.; data curation, P.-A.K.; writing—original draft preparation, S.-S.Y.; writing—review and editing, S.-S.Y. and H.-S.L.; visualization, S.-S.Y.; supervision, H.-S.L.; project administration, H.-S.L.; funding acquisition, H.-S.L.. All authors have read and agreed to the published version of the manuscript.
Acknowledgments
This work is supported by the Korea Agency for Infrastructure Technology Advancement (KAIA) grant funded by the Ministry of Land, Infrastructure and Transport (Grant 21AMDP-C162388-01).”
Conflicts of Interest
The authors declare no conflicts of interest.
References
- NHTSA. Traffic Safety Facts—Large Trucks, 2022; National Highway Traffic Safety Administration: Washington, DC, USA, 2022. [Google Scholar]
- AASHTO. A Policy on Geometric Design of Highways and Streets, 7th ed.; American Association of State Highway and Transportation Officials: Washington, DC, USA, 2018. [Google Scholar]
- Korean Society of Civil Engineers (KSCE). Highway Design Manual; KSCE: Seoul, Republic of Korea, 2020. [Google Scholar]
- Xin, Y.; Zhao, H.; Wu, Q.; Liu, Y. Critical speed estimation for heavy trucks on sharp curves considering road geometry and load conditions. Adv. Mech. Eng. 2021, 13(9), 1–14. [Google Scholar] [CrossRef]
- Wong, J.Y. Theory of Ground Vehicles, 4th ed.; Wiley: New York, NY, USA, 2008. [Google Scholar]
- Rajamani, R. Vehicle Dynamics and Control, 2nd ed.; Springer: Boston, MA, USA, 2012. [Google Scholar]
- Pacejka, H.B. Tire and Vehicle Dynamics, 2nd ed.; Elsevier: Oxford, UK, 2005. [Google Scholar]
- Braghin, F.; Cheli, F.; Melzi, S.; Resta, F. Tyre models for road vehicle dynamics analysis. Veh. Syst. Dyn. 2006, 44 (Suppl. 1), 3–29. [Google Scholar] [CrossRef]
- Besselink, I.J.M.; Ploeg, J.; de Waard, E. Experimental analysis of load sensitivity of heavy-vehicle tire friction. Veh. Syst. Dyn. 2010, 48(12), 1503–1520. [Google Scholar] [CrossRef]
- Segel, L.; Ervin, R.D. Measurement and analysis of tire cornering characteristics under varying loads. SAE Tech. Pap. 1981, 810175. [Google Scholar] [CrossRef]
- Zhang, Q.; Zhao, L.; Han, S.; Liu, Y. Rollover risk assessment of heavy trucks on curved ramps using dynamic simulation. Appl. Sci. 2024, 14, 13456. [Google Scholar] [CrossRef]
- Chen, B.C.; Peng, H. Differential-braking-based rollover prevention for sport utility vehicles with human-in-the-loop evaluations. Veh. Syst. Dyn. 2005, 43(6–7), 357–381. [Google Scholar] [CrossRef]
- Kamnik, R.; Vrančić, D.; Božič, D. Static rollover threshold and dynamic stability of heavy trucks. Int. J. Heavy Veh. Syst. 2010, 17(1–2), 36–52. [Google Scholar] [CrossRef]
- Zhao, Y.; Wang, Z.; Zhang, Y. Real-time estimation of tire–road friction using multi-sensor fusion for autonomous vehicles. Sensors 2024, 24(3), 912. [Google Scholar] [CrossRef]
- Ma, J.; Liu, C.; Wang, T. Infrared-based estimation of road surface friction for intelligent vehicles. IEEE Trans. Intell. Transp. Syst. 2022, 23(7), 10123–10133. [Google Scholar] [CrossRef]
- Jiang, L.; Sun, Z.; He, L. Vision-based road friction estimation under varying illumination conditions. IEEE Access 2024, 12, 43526–43537. [Google Scholar] [CrossRef]
- Rasol, S.; Zhou, Y.; Gao, H. Machine-learning-based tire–road friction prediction for heavy trucks. Appl. Sci. 2023, 13(5), 2974. [Google Scholar] [CrossRef]
- Li, K.; Chen, J.; Feng, Z. Deep learning approach for friction estimation using vehicle dynamics data. Sensors 2023, 23(15), 6661. [Google Scholar] [CrossRef]
- Consolini, L.; Maggiali, F.; Minati, L. Optimal curve-speed planning for heavy vehicles under dynamic stability constraints. IEEE Trans. Veh. Technol. 2024, 73(8), 9124–9137. [Google Scholar] [CrossRef]
- Ardizzoni, M.; Raffo, G.V.; Todeschini, F. Real-time trajectory planning for heavy trucks on curved roads using nonlinear MPC. IEEE Access 2025, 13, 12876–12889. [Google Scholar] [CrossRef]
- Song, J.; Yi, K.; Kim, S. Development of predictive lateral load transfer ratio (PLTR) index for rollover prevention. Proc. Inst. Mech. Eng. D J. Automob. Eng. 2013, 227(5), 679–692. [Google Scholar] [CrossRef]
- Tomar, R.S. Rollover threshold determination of heavy trucks using simulation. Int. J. Veh. Struct. Syst. 2015, 7(4), 141–147. [Google Scholar]
- Prem, H.; McLean, J.; Aumann, P. Heavy vehicle rollover performance on curved roads: Simulation and analysis. In Austroads Rep. AP-R593-19; Austroads: Sydney, Australia, 2019. [Google Scholar]
- NHTSA. Heavy Vehicle Rollover Prevention Research Program Report; National Highway Traffic Safety Administration: Washington, DC, USA, 2003. [Google Scholar]
- FHWA. Rollover Prevention and Stability Evaluation of Heavy Vehicles; Federal Highway Administration: Washington, DC, USA, 2003. [Google Scholar]
- Perry, M.; Winkler, C.B.; Campbell, K.L. Static rollover threshold evaluation of commercial vehicles. SAE Tech. Pap. 2005, 2005-01-3579. [Google Scholar] [CrossRef]
Figure 1.
Four-axle rigid truck model.
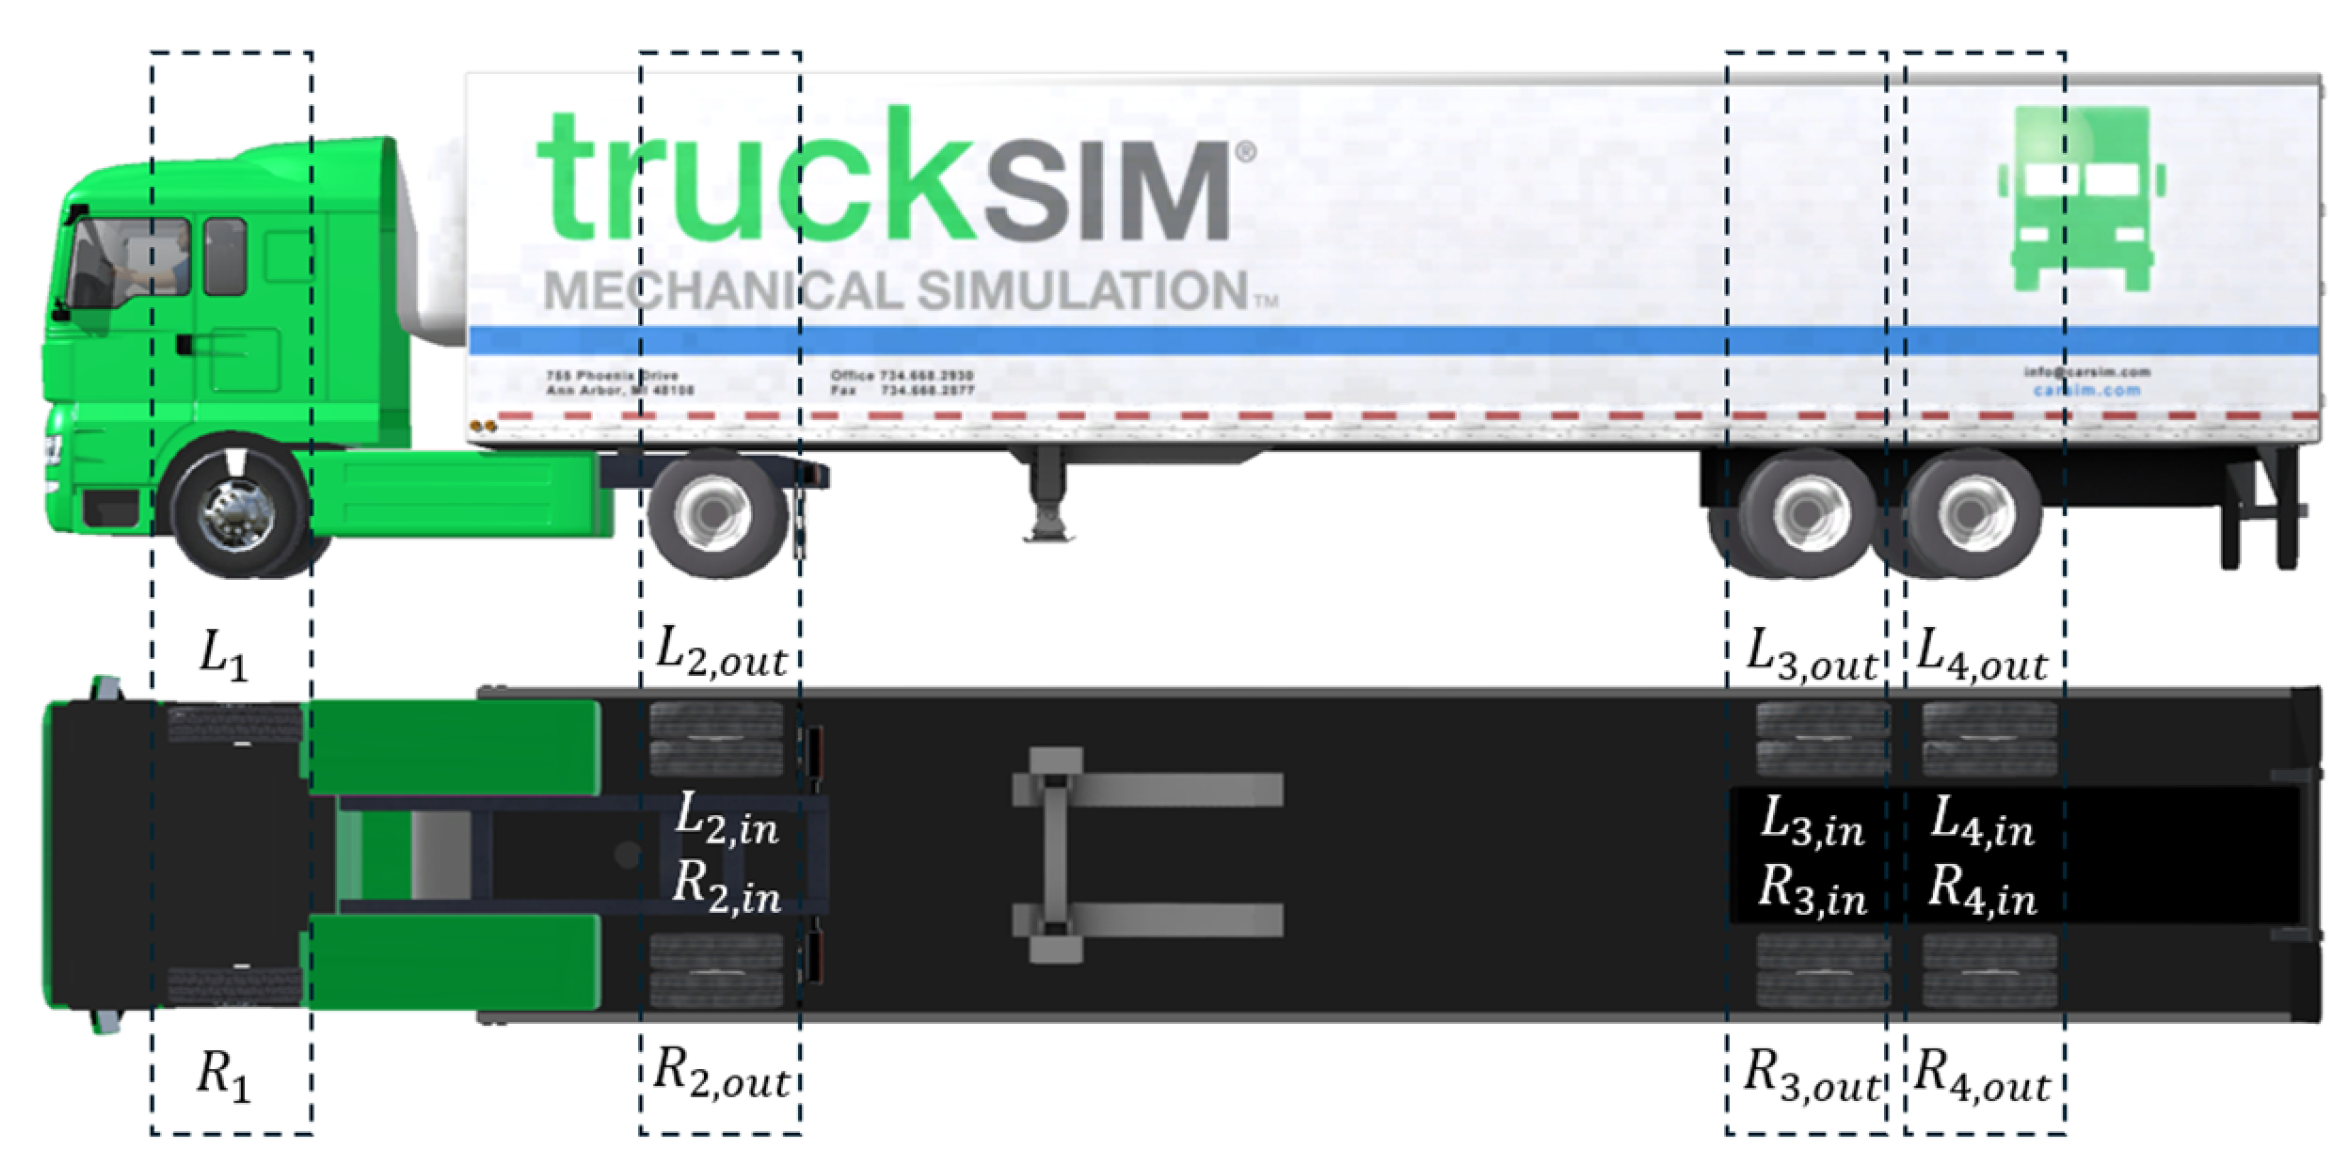
Figure 2.
Curved ramp reconstructed from a multi-axle truck rollover accident [11].
Figure 2.
Curved ramp reconstructed from a multi-axle truck rollover accident [11].
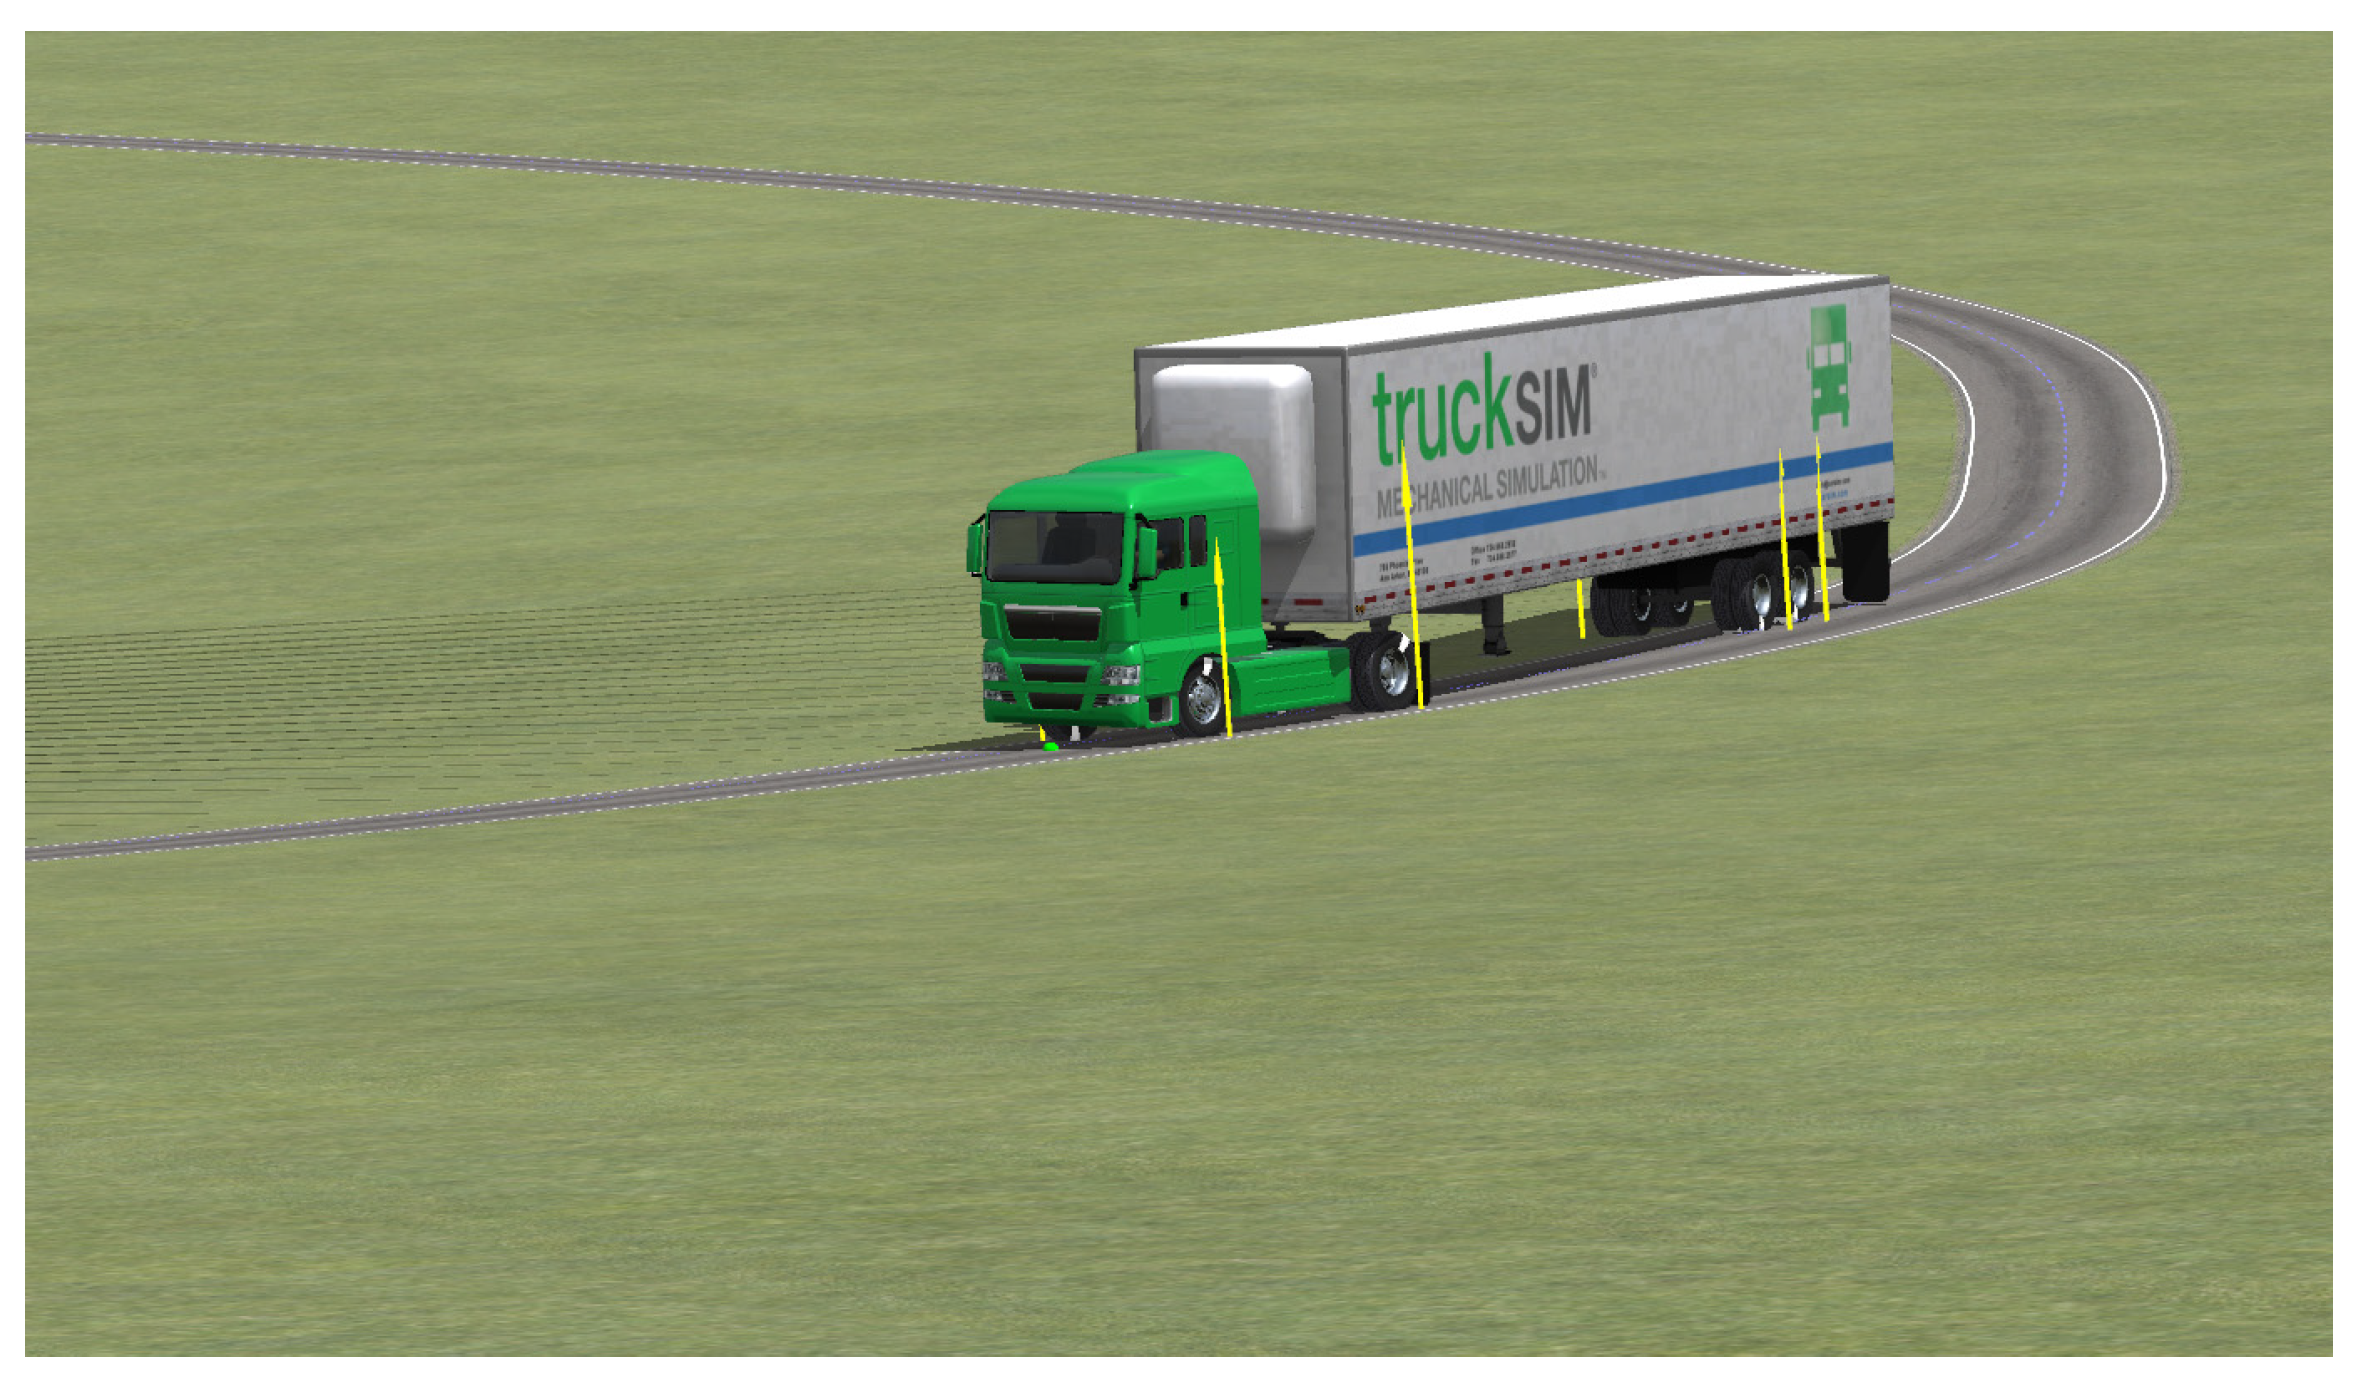
Figure 3.
Dominant constraints on safe speed along the curved ramp under different SRT values (0.3, 0.5, 0.7) and tire–road friction coefficients (μ). Colors indicate whether skidding or rollover governs the speed limit.
Figure 3.
Dominant constraints on safe speed along the curved ramp under different SRT values (0.3, 0.5, 0.7) and tire–road friction coefficients (μ). Colors indicate whether skidding or rollover governs the speed limit.

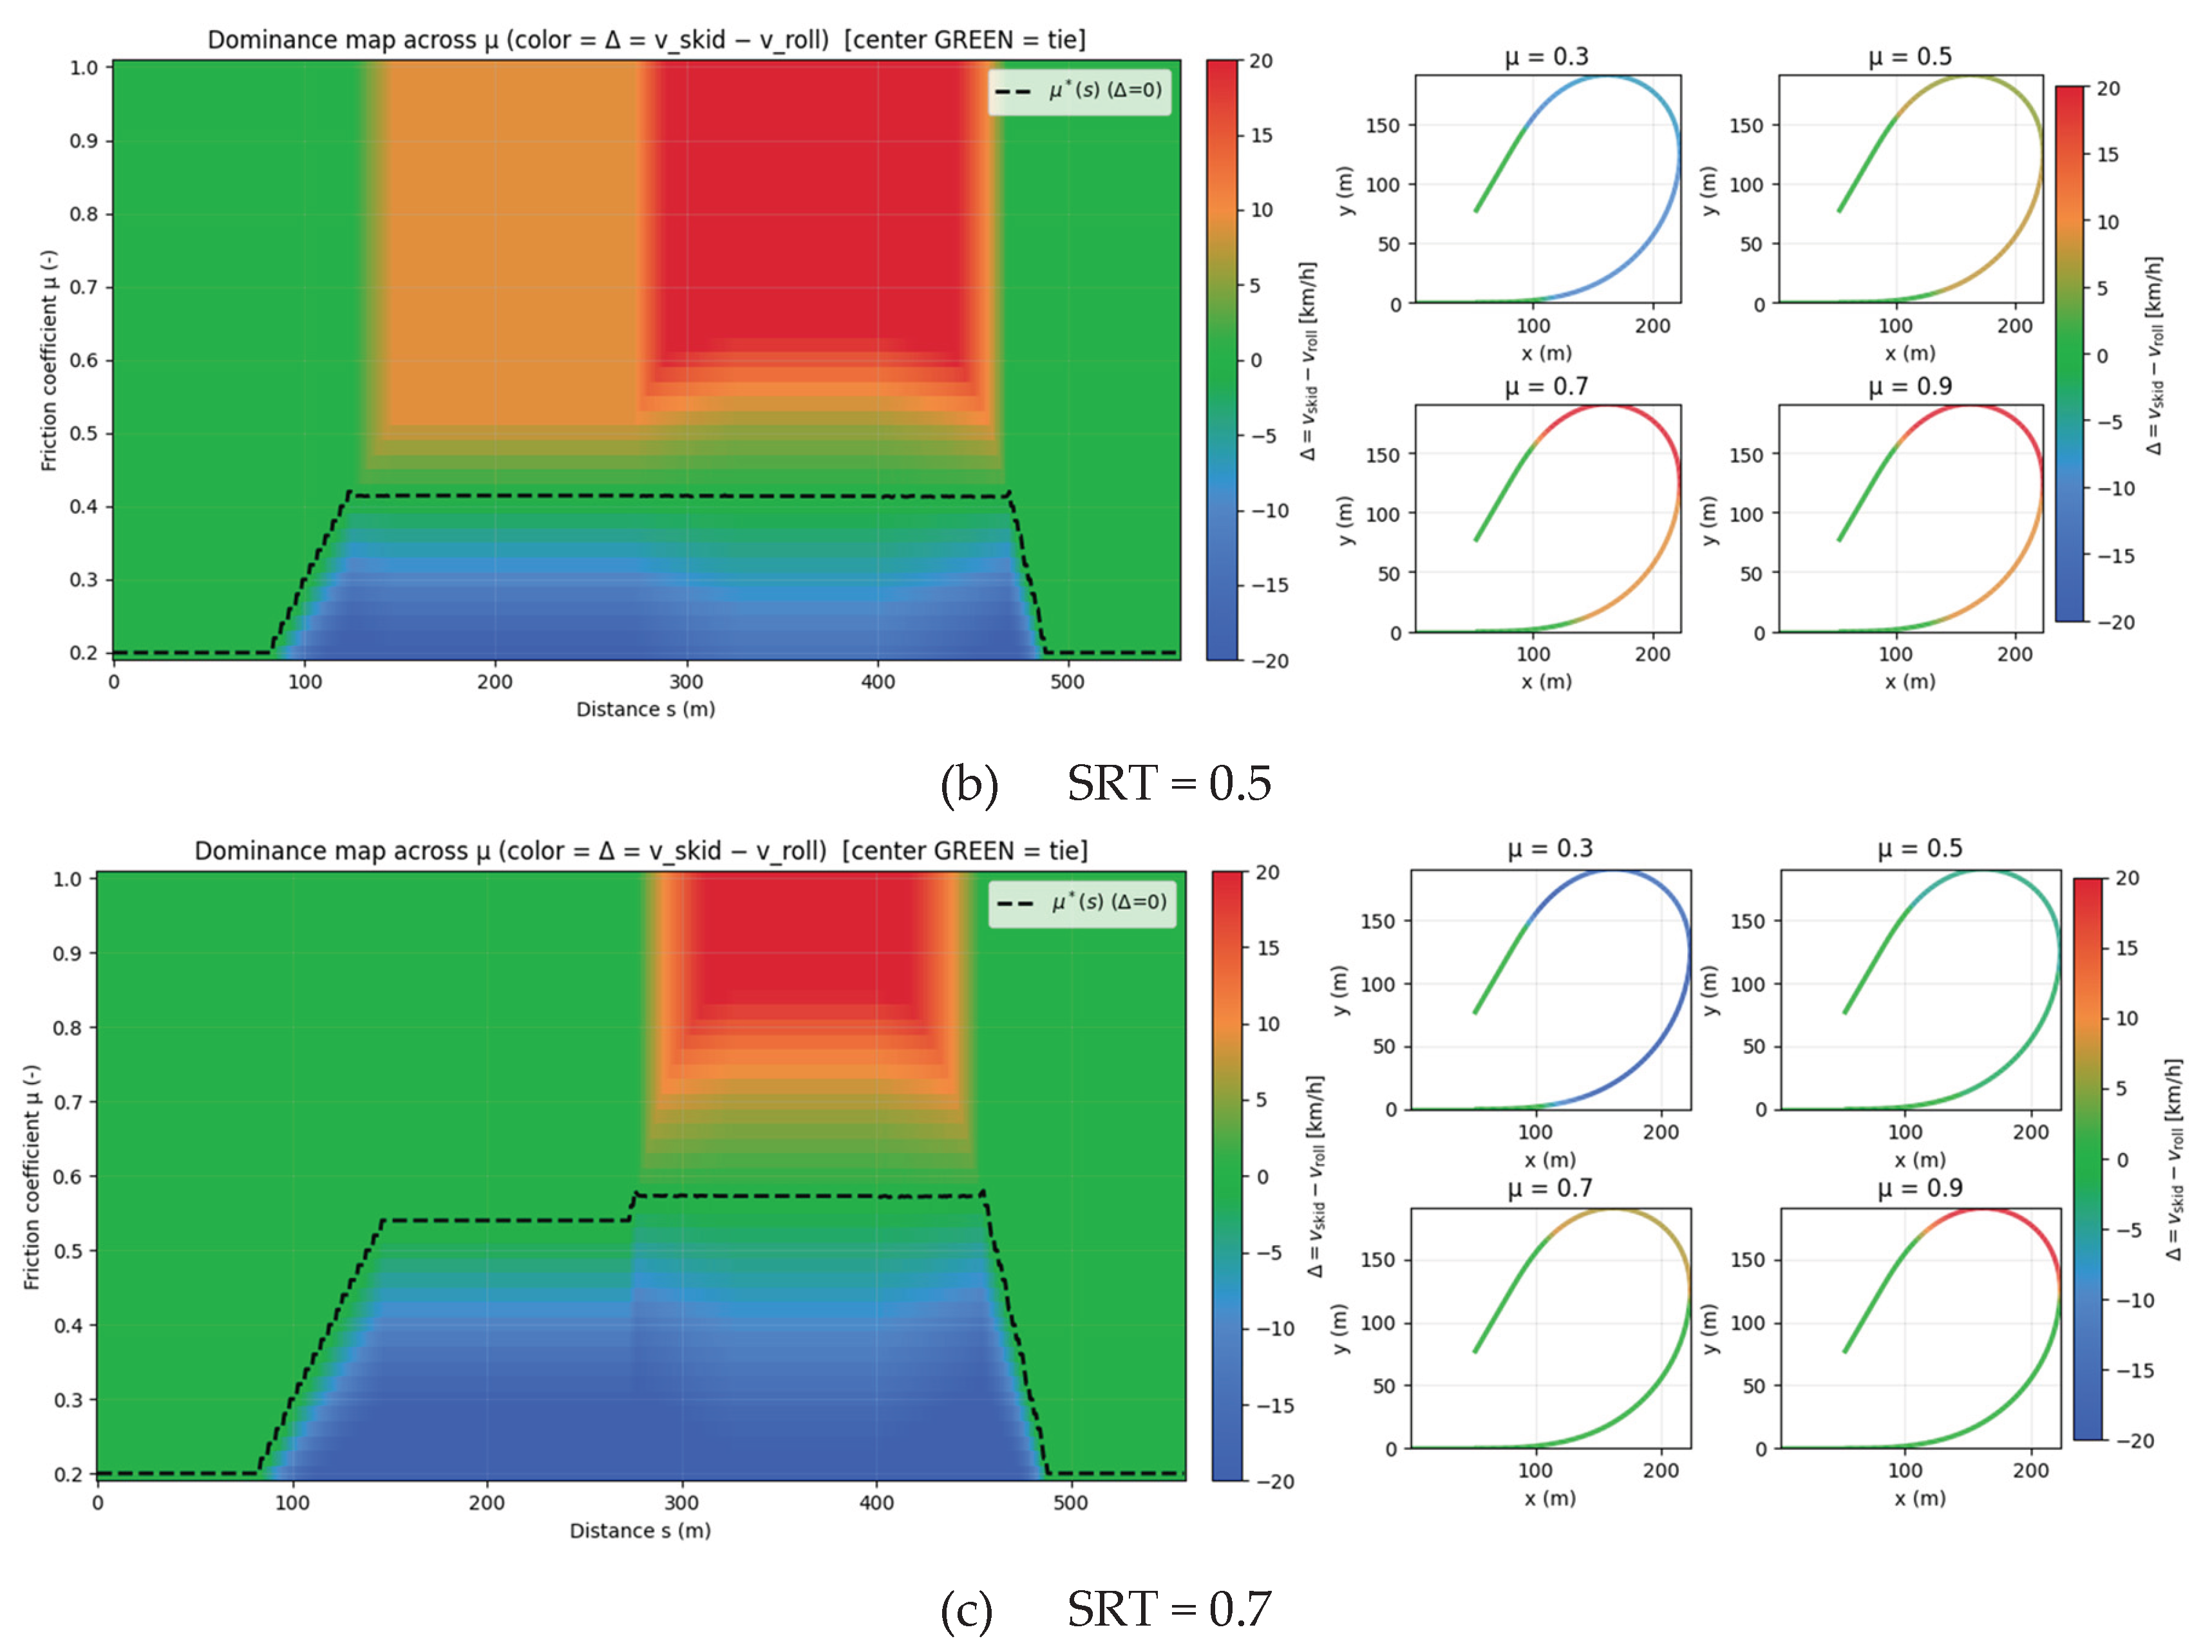
Figure 4.
Comparison of load–friction characteristics for passenger car and heavy truck tires based on Segel & Ervin [10] data and fitting results using the proposed load-sensitive friction model. The fitted parameters are: car (μ₀ = 0.880, c = 0.893), heavy truck (μ₀ = 0.749, c = 0.821).
Figure 4.
Comparison of load–friction characteristics for passenger car and heavy truck tires based on Segel & Ervin [10] data and fitting results using the proposed load-sensitive friction model. The fitted parameters are: car (μ₀ = 0.880, c = 0.893), heavy truck (μ₀ = 0.749, c = 0.821).
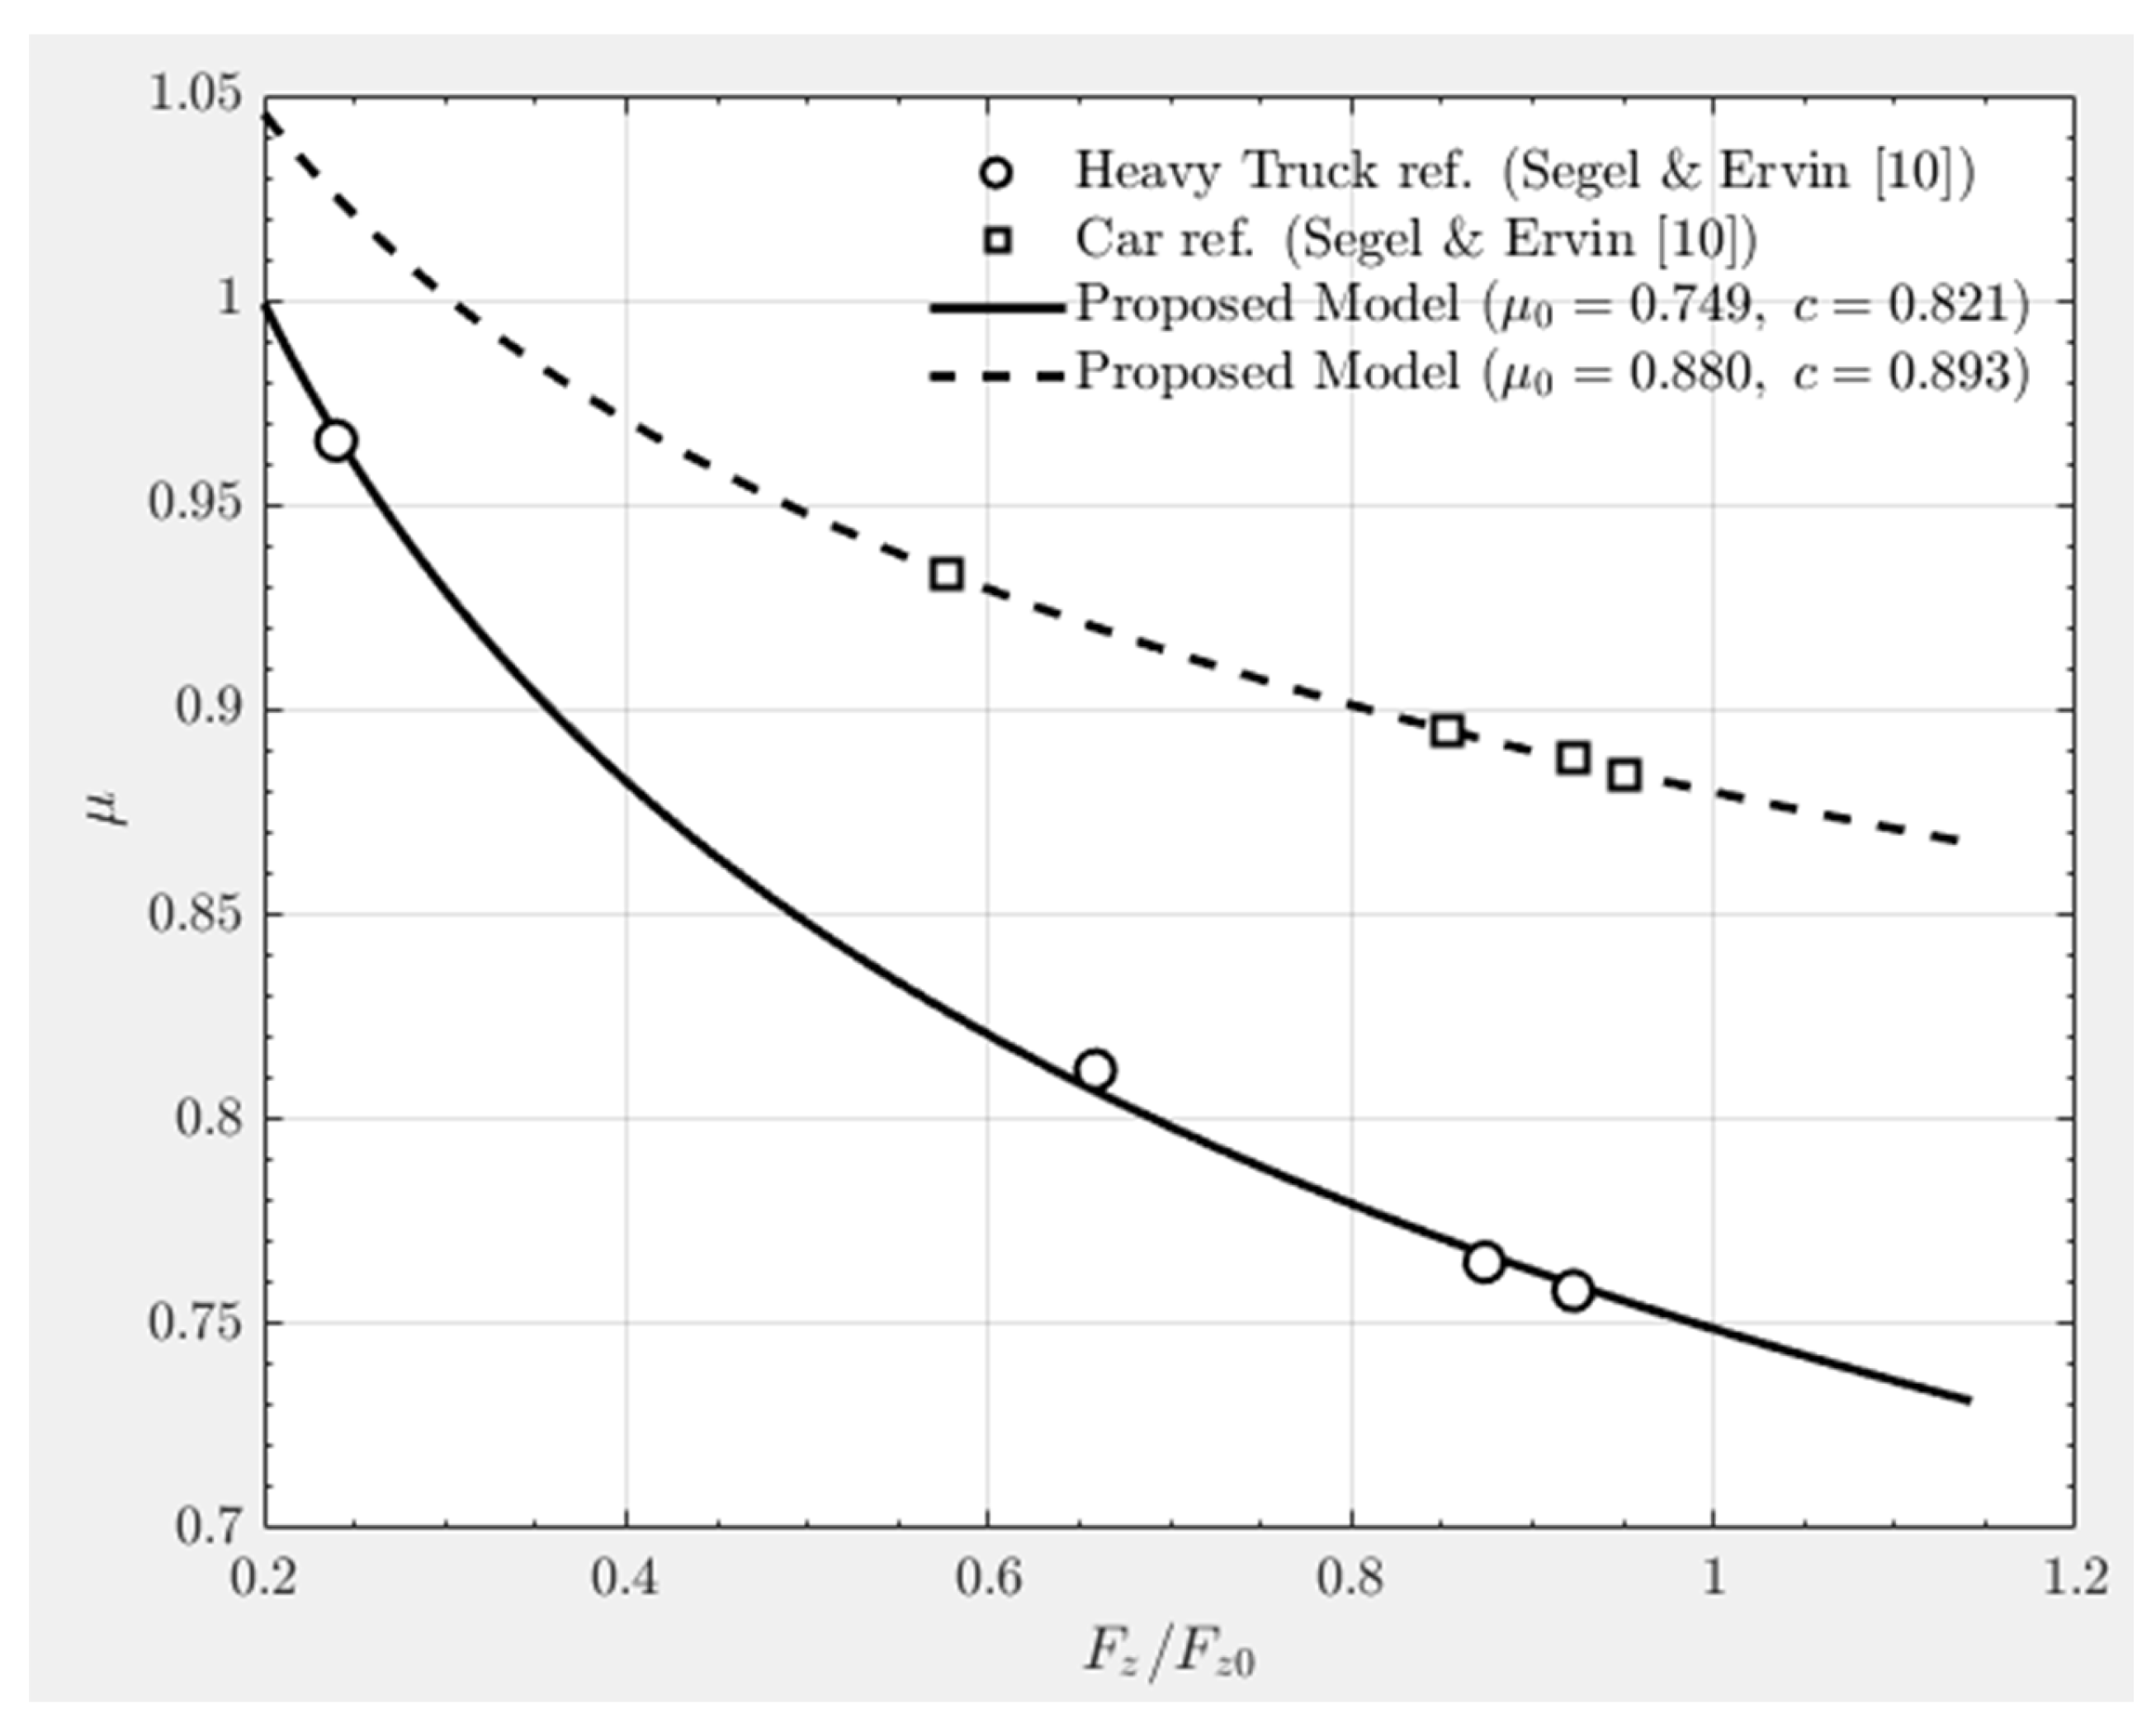
Figure 5.
Effects of load-sensitive friction coefficient c on ramp driving: (a) reference safe speed, (b) minimum wheel
, and (c) lateral offset. Simulations with, SRT = 0.5, and show that neglecting load-sensitive friction can underestimate driving risk.
Figure 5.
Effects of load-sensitive friction coefficient c on ramp driving: (a) reference safe speed, (b) minimum wheel
, and (c) lateral offset. Simulations with, SRT = 0.5, and show that neglecting load-sensitive friction can underestimate driving risk.
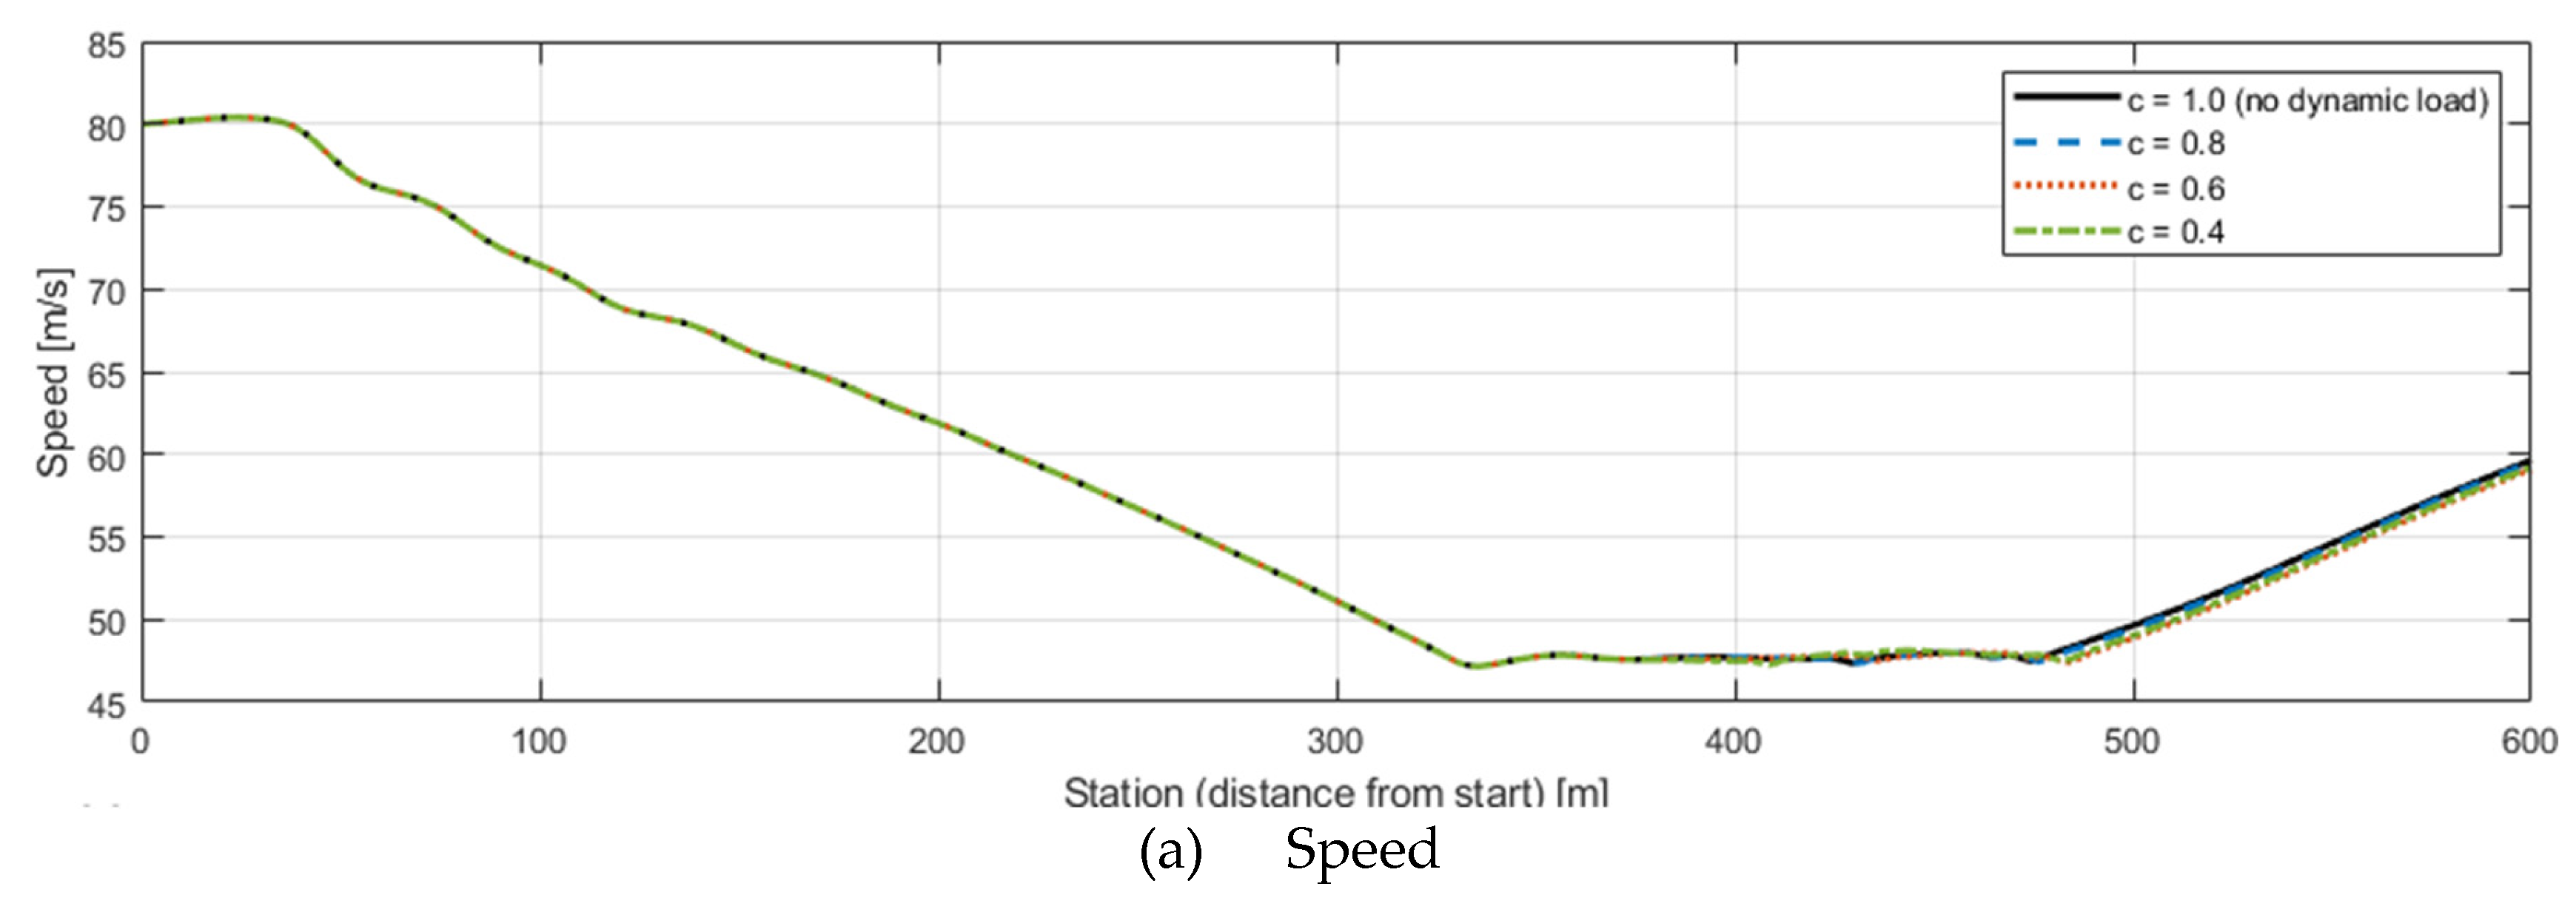
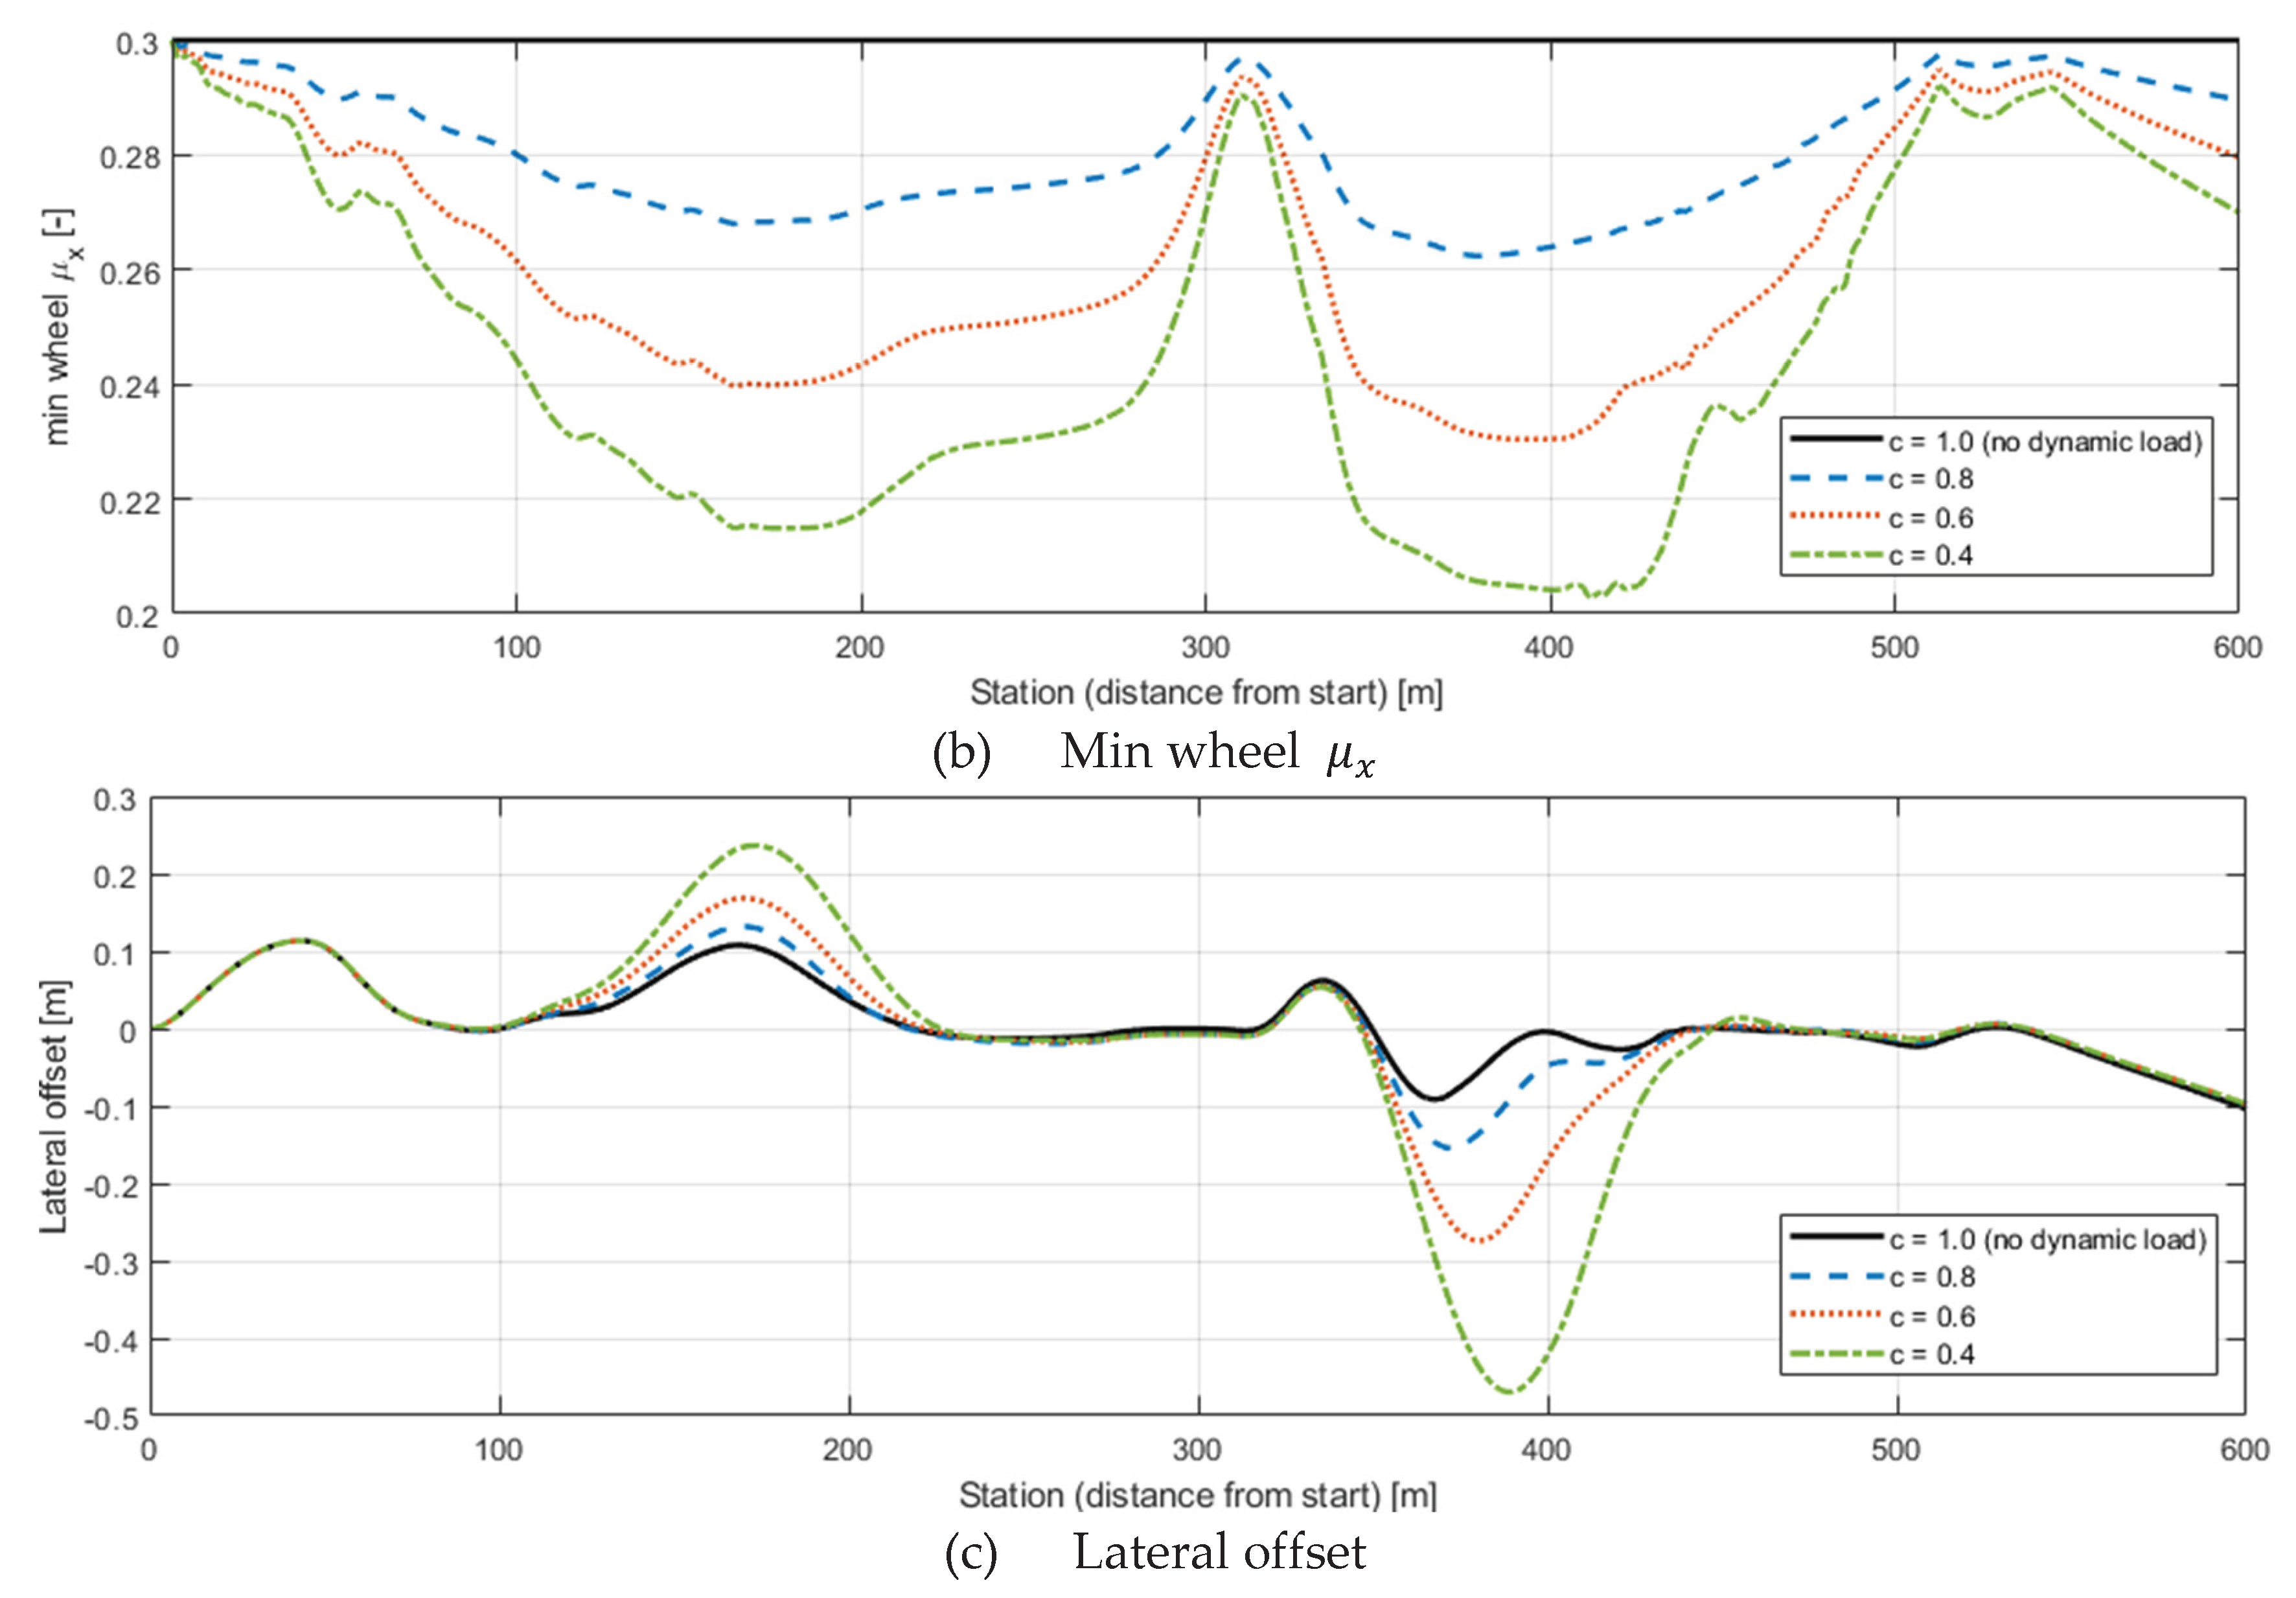
Figure 6.
Dynamic wheel load and corresponding friction coefficient variation in the ramp section (μ0 = 0.3, c = 0.4, SRT = 0.5): (a) left and right wheel loads, (b) resulting friction coefficients showing outer‐wheel μ reduction.
Figure 6.
Dynamic wheel load and corresponding friction coefficient variation in the ramp section (μ0 = 0.3, c = 0.4, SRT = 0.5): (a) left and right wheel loads, (b) resulting friction coefficients showing outer‐wheel μ reduction.
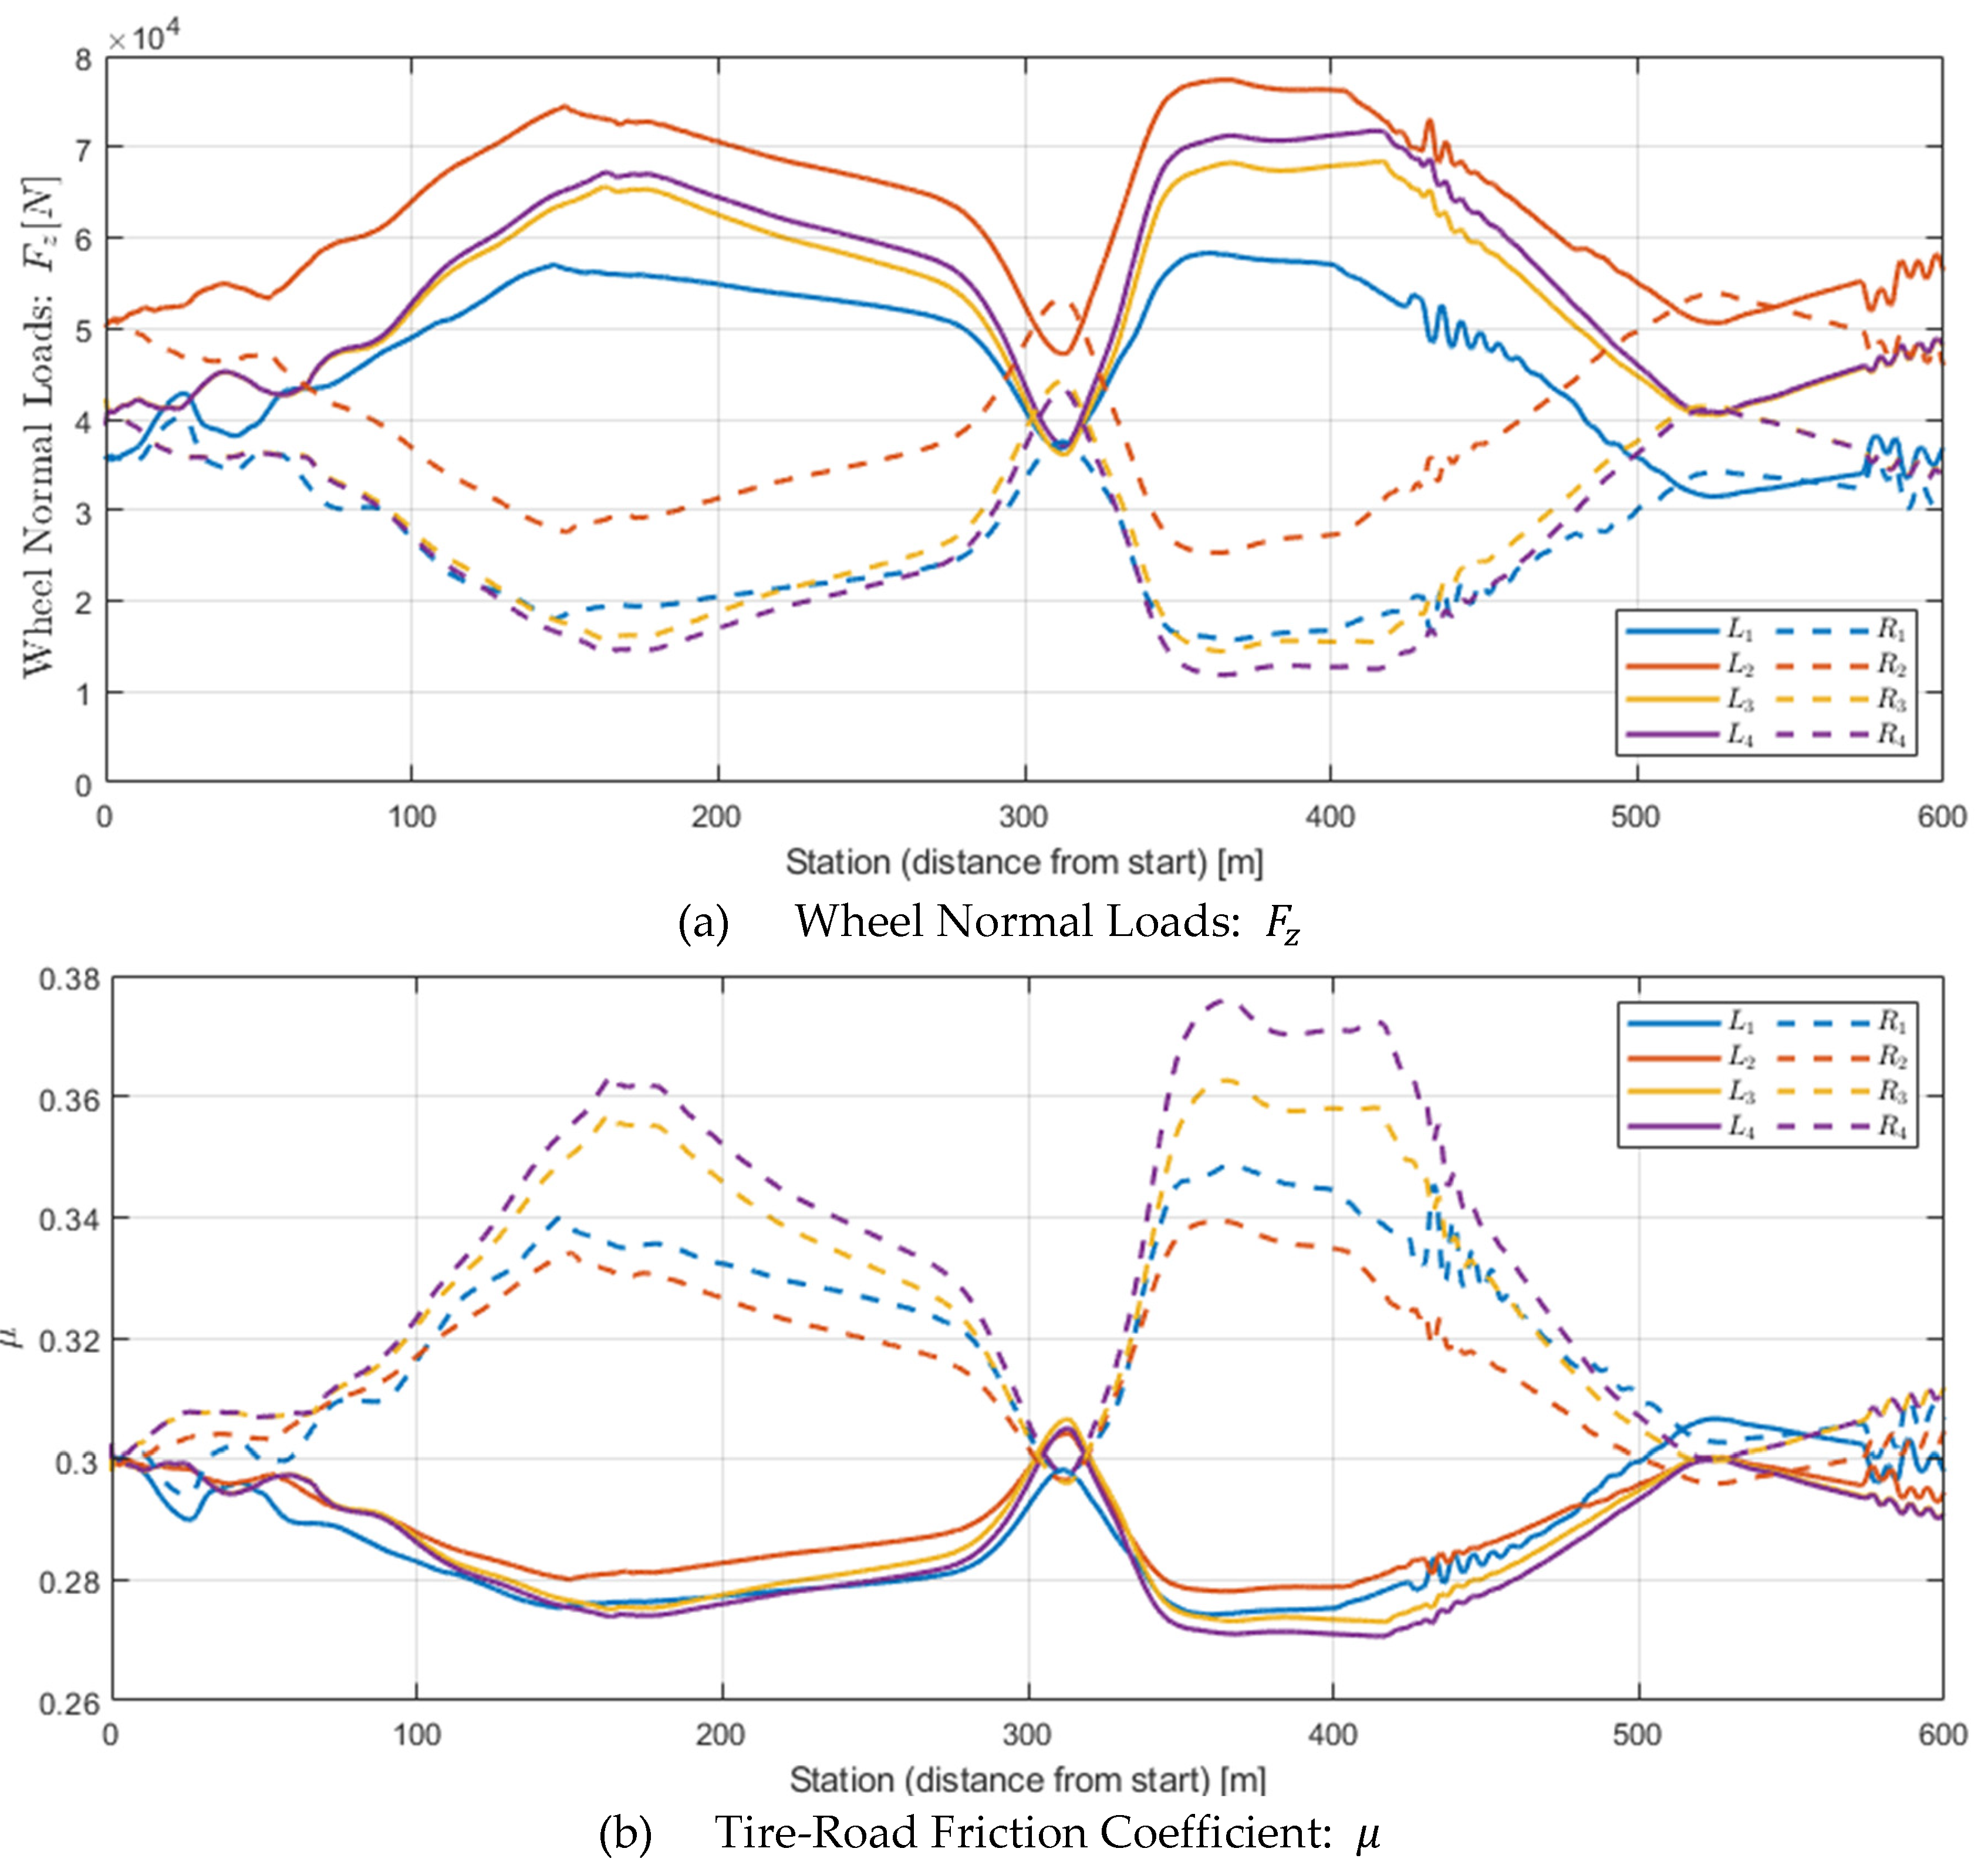
Figure 7.
Safe speed and lateral offset comparison for : (a) calculated safe speeds with and without load-sensitive friction, (b) resulting lateral offsets showing larger deviations when load sensitivity is considered.
Figure 7.
Safe speed and lateral offset comparison for : (a) calculated safe speeds with and without load-sensitive friction, (b) resulting lateral offsets showing larger deviations when load sensitivity is considered.
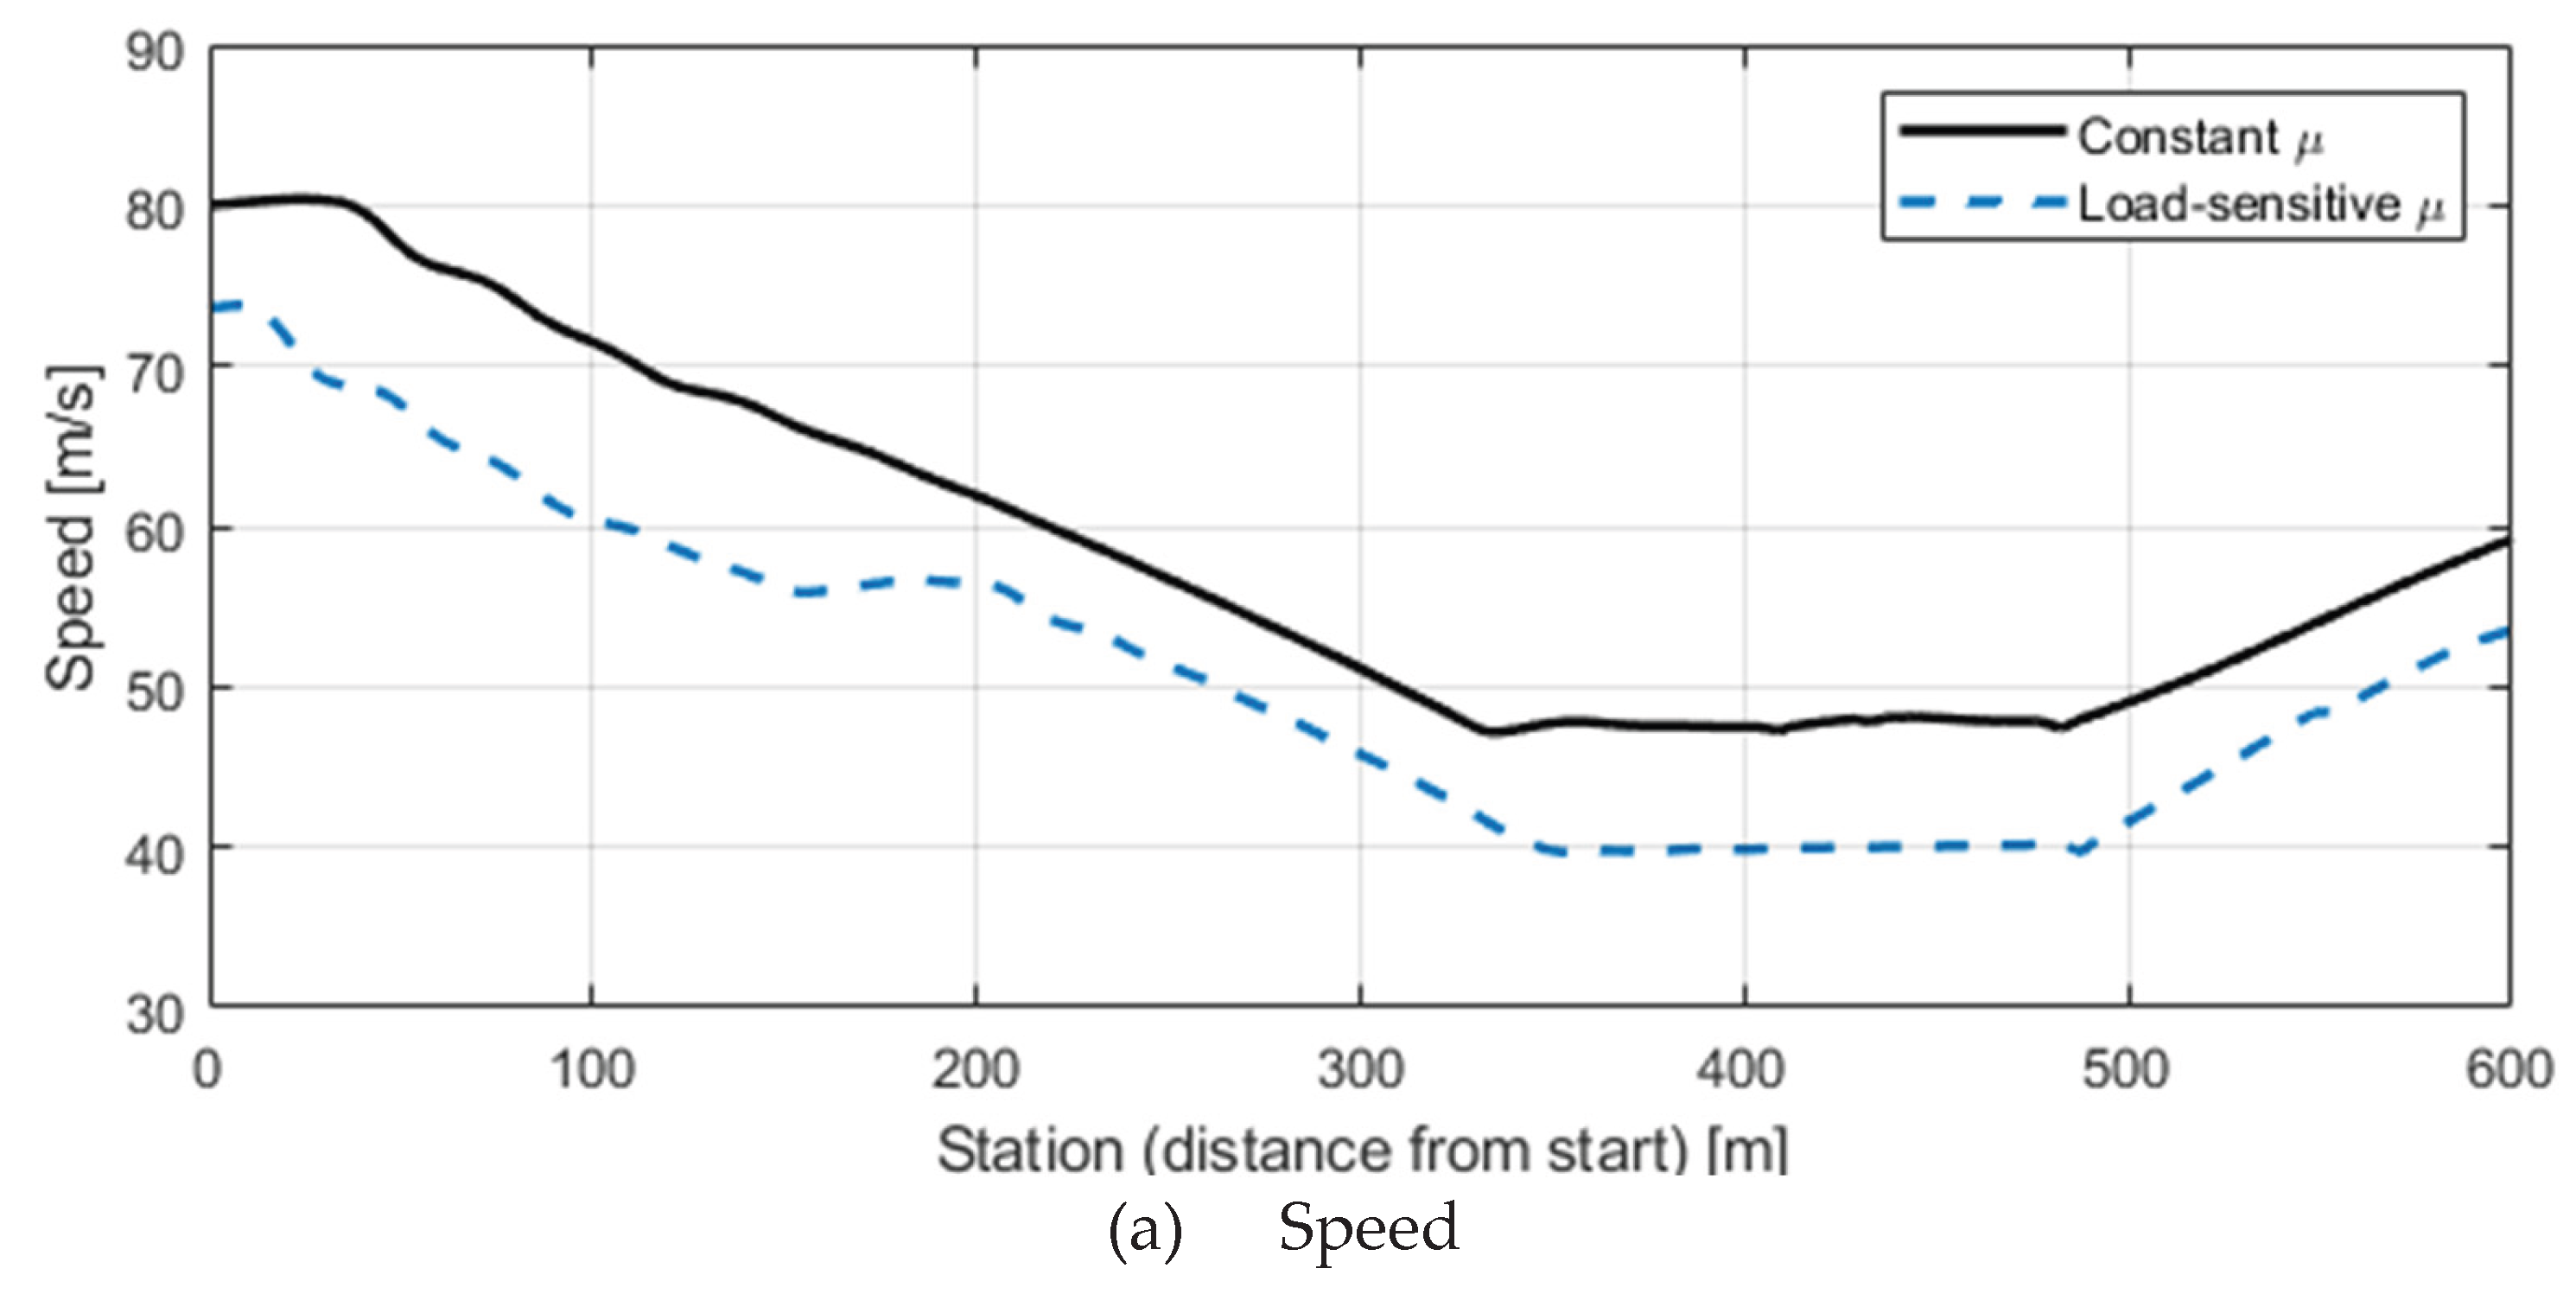
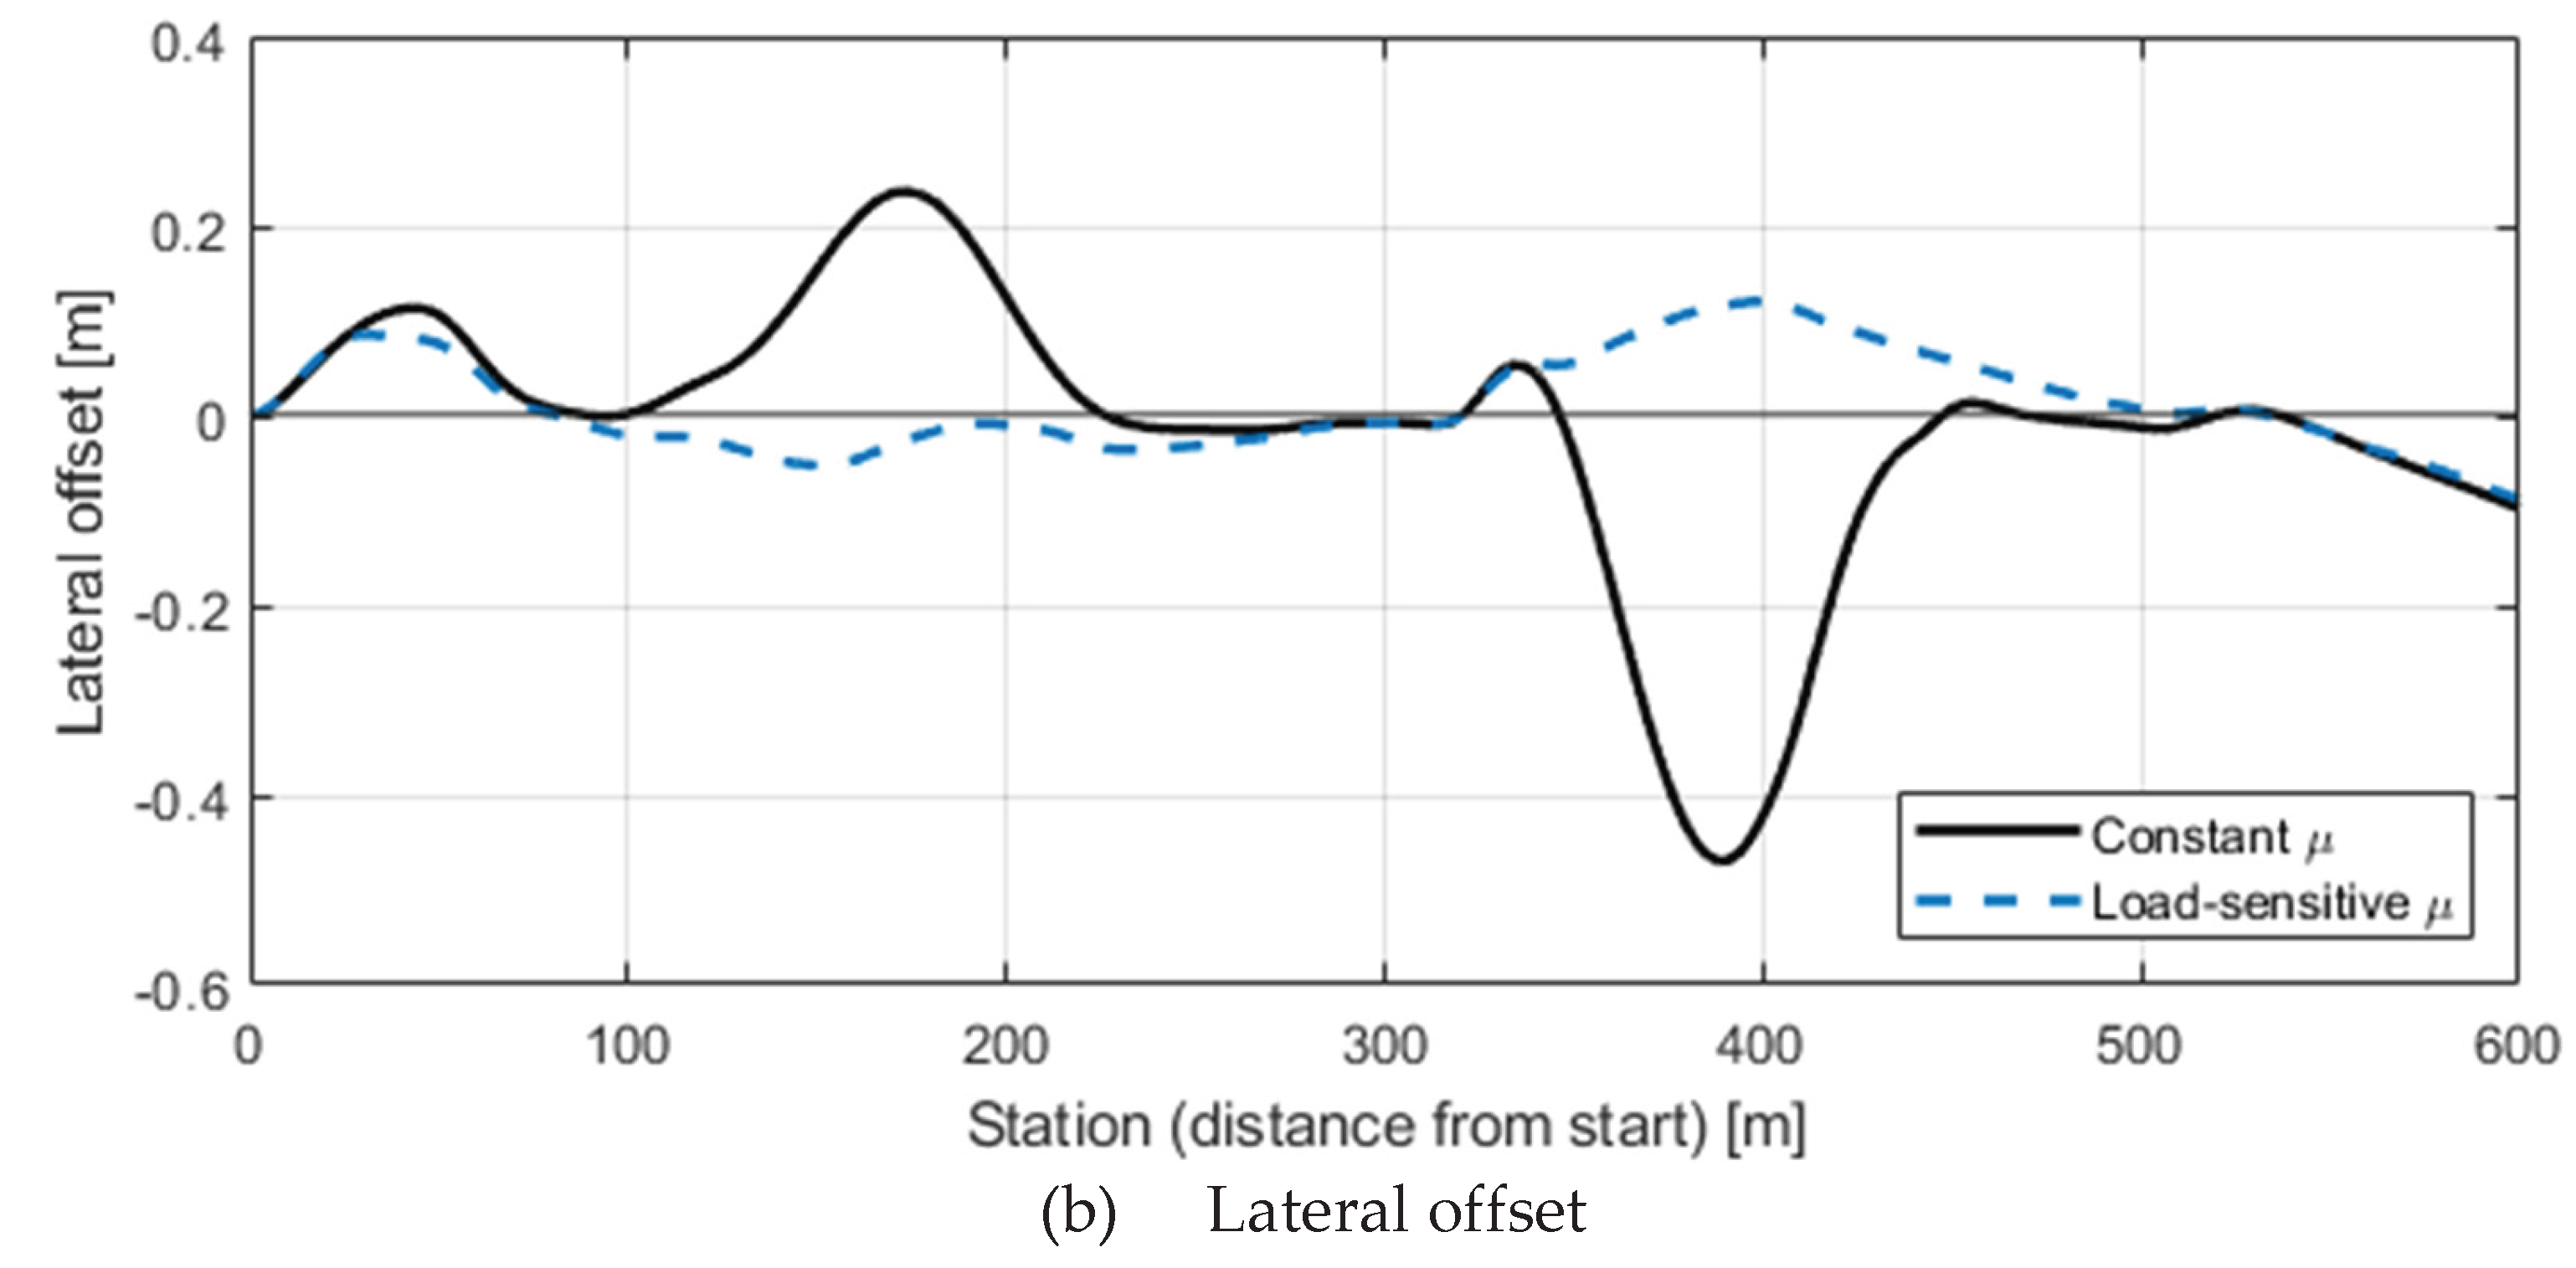

Table 1.
Representative Static Rollover Threshold (SRT) values for different truck configurations and load conditions [22,23,24].
| Vehicle (Axles) | Load Condition | SRT (g) | Source |
|---|---|---|---|
| Turntable trailer (4-axle) | Unloaded | 0.368 | Tomar [22] |
| Tractor–semitrailer (5-axle) | Unloaded | 0.377 | Tomar [22] |
| Tractor–semitrailer (5-axle) | Loaded | 0.380 | Prem et al. [23] |
| Rigid truck (3-axle) | Unloaded | 0.406 | Tomar [22] |
| Road tanker (8×4) | Loaded | ≈ 0.50 | Prem et al. [23] |
| Light/medium truck (2-axle) | Unloaded | 0.80–1.00 | NHTSA [24] |
Table 2.
Vehicle parameters and load-sensitive friction model inputs.
| Section | Parameter | Value | Unit |
|---|---|---|---|
| Vehicle Mass & CG | Tractor empty mass | ton | |
| Trailer empty mass | ton | ||
| Payload mass | ton | ||
| CG height (empty) | 1.60 | m | |
| CG height (full) | 2.725 | m | |
| Axle & Load | Axle load distribution ratio | [0.21, 0.30, 0.25, 0.24] | — |
| Distribution | Track width per axle | [2.04, 1.82, 1.82, 1.82] | m |
| Roll stiffness distribution ratio | [0.15, 0.20, 0.30, 0.35] | — | |
| Friction Parameters | Reference load () | 4000.0 | N |
| Load-sensitivity exponent (c) | 0.4-1.0 | — | |
| Safety margin factor () | 0.2 | — | |
| Minimum friction coefficient | 0.05 | — | |
| Maximum friction coefficient | 0.95 | — | |
| Stability Thresholds | LTR threshold | 0.80 | — |
| Target SRT | 0.3-0.5 | g | |
| SRT tolerance | 0.005 | g | |
| Longitudinal | Air density | 1.225 | kg/m³ |
| Dynamics | Drag area (CdA) | 8.5 | m² |
| Rolling resistance coefficient | 0.008 | — | |
| Engine maximum power | 300.0 | kW | |
| Driver acceleration comfort limit | 0.5 | m/s² |
Disclaimer/Publisher’s Note: The statements, opinions and data contained in all publications are solely those of the individual author(s) and contributor(s) and not of MDPI and/or the editor(s). MDPI and/or the editor(s) disclaim responsibility for any injury to people or property resulting from any ideas, methods, instructions or products referred to in the content. |
© 2025 by the authors. Licensee MDPI, Basel, Switzerland. This article is an open access article distributed under the terms and conditions of the Creative Commons Attribution (CC BY) license (https://creativecommons.org/licenses/by/4.0/).
Copyright: This open access article is published under a Creative Commons CC BY 4.0 license, which permit the free download, distribution, and reuse, provided that the author and preprint are cited in any reuse.


