
Submitted:
03 October 2025
Posted:
06 October 2025
You are already at the latest version
Abstract
Background: The current definition of metabolic dysfunction-associated steatotic liver disease (MASLD) requires a classical assessment of steatosis via liver biopsy, with steatosis grades of S0–S3 (5–100% fat) potentially underestimating low-grade steatosis. We propose a new, more sensitive classification based on magnetic resonance imaging proton-density fat-fraction (MRI-PDFF), splitting the standard S0 and S1 grades into three classes: new-S0, very early S1 (S1A), and a second early (S1B) grade. We aim to determine whether these early steatosis phenotypes differed clinically or biologically from the new-S0 grade using large population cohort datasets.
Methods: We assess the prevalence of the new PDFF grades in 29,252 healthy UK-Biobank participants and six previously published databases (n = 149,498) using SteatoTest or a proxy. We performed a multimodal steatosis assessment with longitudinal PDFF and liver biopsy data (n = 286). Models were used to adjust for phenotypes and overall mortality based on age, gender and cardiometabolic factors.
Results: In the UK-Biobank, the new-S0, S1A, and S1B prevalences were 54%, 26%, and 17%, respectively. Between S1A vs S0, the most discriminating characteristics were triglycerides, odds ratio=2.40 (95% CI: 2.07–2,77; P < 0.00001), and BMI=1.30 (1.27–1.33; P < 0.00001), similar to those between S1A vs S1B, plus systolic-blood-pressure (SBP) and HbA1c. Adjustment on age, sex, SBP, BMI, HbA1c, triglycerides, and HDL-cholesterol) revealed a significant 15-year lower survival in the high-risk (97.2%; 95%CI = 96.9–97.7) vs the low-risk group (99.4%; 95%CI = 99.2–99.6; P < 0.00001).
Conclusion: The early trajectory of liver steatosis is invisible and undetected in 26% of the middle-aged population. This early steatosis phenotype differs clinically and biologically from the new-S0 in large population cohorts.
Keywords:
very early steatosis
; PDFF
; UK-Biobank
; FibroTest
; SteatoTest-2
; NashTest-2
; FibroSure
Introduction
Since 2005, the severity of the three basic features of metabolic dysfunction-associated steatotic liver disease (MASLD) has been graded with the Clinical Research Network (CRN) histological score [1]. Inflammatory activity is classified from A0 to A3, and fibrosis from F0 to F4. Both are expressed on a 0–100% scale, with an estimated measurement uncertainty of 20–25% for a 20 mm biopsy sample [2,3,4].
Hepatocyte steatosis (S0–S3) has traditionally been assessed using a 5%–100% scale an arbitrary lower threshold that poorly captures early changes in liver fat accumulation [5]. In this context, redefining low-grade steatosis with narrower high-precision proton-density-fat-fraction (PDFF)-based bands may allow earlier detection and more precise monitoring. Indeed, PDFF offers ten-fold higher accuracy and reproducibility than biopsy, making it suitable for identifying early trajectories of hepatic fat with very low uncertainty [6,7].
In a cohort of 728 biopsy-proven MASLD cases, Kim et al. showed that liver biopsy tended to overestimate steatosis grades compared to PDFF. Their findings The PDFF distribution suggested the following cutoffs for steatosis grading according to fat fraction: S0: < 6.4%, S1: 6.4–17.4%, S2: 17.4–22.1%, and S3: ≥ 22.1% (Kim-cutoffs) [7]. These findings highlight the need for more sensitive classification systems that can capture the earliest stages of liver fat accumulation.
Also, a reference method with just 2 % uncertainty—ten times more precise than the CRN score— would better support the development of circulating non-invasive tests (NITs) in MASLD [6]. In a recent 60-patient-per-arm recent randomized trial, lubiprostone reduced hepatic steatosis by ~2 % PDFF (−4.2 % vs −2.3 %) versus placebo after 48 weeks, demonstrating the clinical utility of such high-precision measurements [4,8,9].
We hypothesized that further subdividing the early steatosis spectrum would identify a previously "invisible" subpopulation with distinct clinical characteristics and prognostic relevance. Therefore, we proposed splitting the standard S0 grade into two categories: new-S0 representing truly minimal steatosis and S1A representing very early steatosis. The traditional S1 grade becomes S1B, while S2 and S3 remain unchanged.
Using large population cohorts datasets, we aimed to determine whether individuals with S1A steatosis differ clinically and biologically from those with new-S0, and whether this early phenotype has a prognostic value. The American Association for the Study of Liver Diseases (AASLD) and the American Gastroenterological Association (AGA) recognize the FibroTest (FibroSure in the US), and Nash-FibroTest (Nash-FibroSure+ in the US) panels as second-line noninvasive tools for assessing fibrosis and steatosis in MASLD/MASH [5,8,9,10].
Materials and Methods
Study Design
To sharpen early MASLD detection, we suggest splitting S0 into two sub-grades: < 3.2 % PDFF is new-S0, 3.2–6.4 % is% is very early steatosis becomes S1A, and 6.4–17.4 % is early steatosis becomes S1B; S2 moderate steatosis (17.4–22.1 %) and S3 severe steatosis (≥ 22.1 %) are unchanged. Adding the S1A grade should increase classification granularity and test sensitivity, enabling rigorous evaluation of early-stages therapies.
We first examined associations between the new stages (new-S0, S1A, S1B) and three holistic MASLD traits—obesity, type 2 diabetes, and systolic blood pressure—in two prospective datasets, the apparently healthy participants of the large, UK-Biobank [10,11,12] and in the QuidNash subset outpatients participants with type-2 diabetes [3,4] (Table 1). Then, in five prospective MASLD studies, we carried out a post-hoc analysis of steatosis-grade prevalence (Table 2) [12,13,14,15,16,17,18]. Finally we asked whether S1A differs clinically and biologically from new-S0 and from S1B in these various contexts of use.
Outcomes
The primary outcome was to determine whether S1A identifies participants at higher cardiometabolic risk in the UK-Biobank. Risk was scored from 0 to 5 using the five criteria specified in the new nomenclature [5]: hypertension (SBP ≥ 130 mmHg), obesity (BMI ≥ 25 kg/m2 or ≥ 23 for participants of Asian descent), high triglycerides (≥ 1.70 mmol/L, 150 mg/dL), low HDL cholesterol (≤ 1.3 mmol/L, 50 mg/dL for females; ≤ 1.0 mmol/L, 40 mg/dL for males), and T2D (HbA1c ≥ 5.7%; 39 mmol/L) (Table 1).
The second outcome was to determine whether 15-year all-cause mortality differed significantly between PDFF-defined S1A and either new-S0 or S1B in the UK Biobank. A Cox proportional-hazards analysis (there after named the risk model), incorporating the same five cardiometabolic traits, quantified their relative impact; participants whose predicted mortality exceeded the cohort median were classified as High Risk, and all others as Low Risk.
The third outcome was to quantify how the revised PDFF cut-offs (< 6.4 %) arithmetically inflate the prevalence of early-grade MASH, a group previously excluded by the < 5 % steatosis threshold in SLD criteria [5]. Given that MASLD already affects ≈ 38 % of adults worldwide, we recalculated the UK age-standardized rate (ASR) per 100,000 in the UK-Biobank, adjusting it by the percentage increase produced by the new early-steatosis category [19]. Finally, as a sensitivity analysis, we applied the cardiometabolic liver phenotypes described by Raverdy et al. (MASLD-Clusters) [20] to the two prospective subsets with complete cluster data.
Study Population
The impact of the new steatosis grading was assessed across seven cohorts [11,12,13,14,15,16,17,18]. Two core subsets (Table 1) underwent prospective PDFF: the UK-Biobank discovery cohort (n = 29,252; S1 Figure) [11,12,13] and the QuidNash clinic cohort (n = 286) [3,4]. Unlike the population-based UK-Biobank, QuidNash comprises tertiary center (Paris, France) T2D outpatients with abnormal liver tests and very high risk of MASLD. UK-Biobank, therefore, allowed prevalence estimates for new-S0, S1A and S1B in apparently healthy adults [10,11,12]. Analyses were restricted to white participants to reduce geographic-origin confoundment. Five cohorts [14,15,16,17], without PDFF (Table 2; n = 149,212) were re-graded with non-invasive tests. SteatoTest-2, embedded in FibroSure®Plus (USA) and NashFibroTest (Europe)—here termed NashTest/FibroSure—was the primary tool; where unavailable, a validated SteatoTest-2 proxy was used. The CPAM cohort represents the general French adult population [16], while USA-FibroSure and France-FibroTest are large laboratory series of at risk of fibrosis subjects [16]. France-FibroTest also includes a prospective biopsy subset (n = 1,081) [14]. The PEG-IFN-Ribavirin cohort (n = 1,428) is a post-hoc analysis of a chronic hepatitis C trial [17]. Male and female adults with anonymously recorded prospective data were included, allowing the NITs assessment of the three key features of MASLD: steatosis grades, inflammatory activity grades, and fibrosis stages.
Data Sources and Study Tools
Steatosis was assessed with PDFF (almost perfect reference) and two validated blood-based NITs: serum triglycerides and the composite NashTest/FibroSure. Histology used both the standard CRN score and a refined version that divides CRN S0–S1 into new-S0, S1A and S1B while retaining S2 and S3 [1]. In line with the new SLD classification, we also assessed prevalences of overweight, type 2 diabetes and systolic blood pressure, plus age, sex and alcohol intake as potential confounders [5]. The examinations were performed according to the manufacturer’s recommendations, UK-Biobank for PDFF [10,11,12], and BioPredictive, Paris, France, for NashTest/FibroSure [21]. The standard PDFF fat fraction distribution cutoffs (Kim cutoffs) followed the recently established CRN steatosis grading system [7]. The new steatosis grading splits the original S0 into two equal sub-grades, establishing the following categories: new-S0, < 3.2%; S1A, 3.2–6.4%; S1B, 6.4–17.4%. S2 (17.4–22.1% fat fraction) and S3 (≥22.1% fat fraction) remained unchanged. For the histological hepatocyte steatosis grades, the cutoffs followed the standard CRN steatosis grading: S0, 0 to <5%; S1, 5 to < 33%; S2, 33 to < 66%; and S3, 66 to 100% [1].
For the SteatoTest2 grades, the cutoffs followed the standard CRN steatosis grading: S0, 0 to < 5%; S1, 5 to < 33%; S2, 33 to < 66%; S3, 66 to 100% [1]. The NashTest/FibroSure components SteatoTest2, NashTest2, and FibroTest were used to assess the prevalence of CRN MASH grades and fibrosis stages in a large population.
Ethical Considerations
Informed consent was obtained from all subjects involved in the seven studies already published. All procedures conformed to the Declaration of Helsinki. The Faculty of Medicine, Helwan University Ethics Committee approved the study (serial 11-2020; 11 February 2020), and all UK-Biobank participants provided written informed consent [10,11,12].
QUIDNASH (NCT03634098) was cleared by the Research Ethics Committee (#18.021-2018-A00311-54) [3]. France-CPAM enrolled adults ≥ 40 years screened at two Social Security centers; all procedures met the Declaration of Helsinki, were approved by the Pitié-Salpêtrière ethics board, and written consent was obtained [14]. USA-FibroSure and France-FibroTest were large anonymous BioPredictive series of MASLD-risk subjects [14,15,16]. All authors accessed the data and approved the manuscript. FibroFrance (NCT01927133), funded by the National Clinical Research Programme, clinical conduct still followed Helsinki principles (). The PegIFN-Ribavirin trial, run in 62 centers worldwide, secured written consent and local board approval at each site [17].
Statistical Analysis
The clinical interest of a new phenotype is its utility in terms of diagnostic or prognostic in comparison with old phenotypes.
Introducing the new phenotype S1A among SLD subsets [5] —representing a very early steatosis grade between strict S0 (“no steatosis”) and early S1B—sharpens granularity without altering the CRN S2 (moderate) or S3 (severe) categories. Univariate and multivariate models were applied to distinguish S1A from new-S0 and from S1B.
S1A was distinguished from lower (new-S0) and higher (S1B) grades using separate multivariate logistic regressions. The models were constructed after matrix correlation assessment and adjustment by age and sex, and their discriminative performances were assessed by odds ratios (ORs). We then tested whether baseline S1A and S1B improved the median four-year prediction of incident S2–S3 steatosis versus S0 in participants who underwent repeat PDFF.
Participants with S1A versus S0, pancreatic and visceral fat, as measured by PDFF, were detailed and compared after being adjusted by age and separately in women and men.
Fifteen-year trajectories and survival were analyzed with repeated PDFF. Survival curves were compared by Kaplan–Meier and log-rank tests. Model risk was classed as low when the predicted 15-year multivariate risk lay below the cohort median and high when it exceeded it. Overall, 15-year mortality was examined twice: first, to determine whether the baseline count of cardiometabolic factors predicted death; second, in the longitudinal subset, to test whether 4-year shifts in early-steatosis grade (new-S0, S1A, S1B) affected mortality. Multiple testing was controlled with Bonferroni adjustment, Tukey–Kramer pairwise confidence intervals and P-values, and the Cochran–Armitage trend test with continuity correction. All statistical analyses were performed using NCSS 2024 and R 4.4 software with standard libraries, including dplyr, Cox models, pROC, and ANCOVA.
Results
The primary finding of this study was the identification of a previously unrecognized early steatosis phenotype (here called S1A) with distinct clinical features and potential prognostic relevance.
Prevalence and Differences in Clinical Characteristics
Our results revealed the characteristics of the new early steatosis category named S1A, distinct from the category new-S0 (liver PDFF ≤ 3.2) that served as the control, and also distinct from S1B, the second grade of steatosis. The prevalences of the three new grades were as follows: new-S0, 53.6% (95% CI: 0.53–0.54%); S1A, 26.1% (95% CI: 25.6–26.6%); and S1B, 16.6% (16.2–17.0%) (Table 1). The prevalence of S0 using the lower four-tier granularity proposed by Kim et al. was 79.7% (95% CI: 79.2–80.1%), 26.1% higher than the prevalence of new-S0.
The multivariate logistic regression and the univariate analysis of covariance showed several clinically significant characteristics between the groups (for both new-S0 vs S1A and S1A vs S1B), adjusted by age, sex, BMI, SBP, HbA1c, triglycerides, and HDL cholesterol.
In this population-based analysis, the higher flows were the increase from new-S0 to S1A (Figure 1).
In the multivariate comparisons between S1A and new-S0, the most discriminating characteristics were BMI (OR = 1.30; 95%CI: 1.27–1.33; P < 0.00001).
For the comparison between S1A and S1B, the most discriminating characteristics were triglycerides (OR = 0.67; 95%CI: 0.59–0.77; P < 0.00001), BMI (OR = 0.85; 95%CI: 0.84–0.87; P < 0.00001), SBP (OR = 0.992; 95%CI: 0.989–0.997; P = 0.001), and HbA1c (OR = 0.98; 95%CI: 0.97–0.99; P = 0.001). Finally, the earlier S1A and S1B grades (Figure 1A) due to the higher granularity improved the four-year prediction of clinically significant S2–S3 vs S0 as a control (n = 2,012 paired PDFF, P < 0.0001) compared to both the Kim scale, (Figure 1B) and the standard CRN (Figure 1C), neither being able to identify the progression of steatosis grades from S0 to S1A, S1B, then S2S3 (Figure 1A).
Differences in Prognostic Ability (Figure 2)
The 15-year survival rate differed significantly between participants above the median 15-year multivariate model risk (high-risk) and those below the median (low-risk): 97.3% (95%CI; 96.9–0.97.7%) vs. 99.4% (95%CI: 99.2–99.6, P < 0.00001) (Figure 2A). The univariate analysis revealed no significant difference in 15-year survival between participants with S1A steatosis (98.5%; 95%CI: 98.1–98.8) and those categorized as new-S0 (98.5%; 98.3–98.7%; log-rank test, P = 0.72) (Figure 2B) or S1B (98.2%; 95% CI: 97.8–98.7%; P = 0.43) (Figure 2C).
Sixteen holistic candidates for severity markers of S1A vs newS0 were analyzed separately in women using ANCOVA (S2 File) and men (S3 File), adjusted for age (n = 32 comparisons). The most original results were the increase in pancreas PDFF (Figure 3A in women and Figure 3B in men) according to age, as well as an unexpected decrease in pancreas volume according to age but still higher in early steatosis stage-S1A vs new-S0 as control (Figure 3C in women and Figure 3D in men). Age was associated with all characteristics except for HbA1c and total adipose tissue volume in women and men. The liver and pancreas volumes decreased with age, but the pancreas PDFF increased with age, in contrast to the liver PDFF.
Thirty out of 32 characteristics were highly elevated in S1A vs. new-S0 (P < 0.0001): SBP, BMI, liver volume, visceral fat volume, subcutaneous fat volume, visceral adipose tissue volume (VAT), total trunk fat volume, total adipose tissue volume, pancreas volume, liver iron, and pancreas PDFF. In women and men, only the concentration of HbA1c did not differ between S1A and new-S0. Pancreas iron was normal in women and was only marginally elevated in men (P = 0.035). SBP was significantly higher in participants with S1A compared to new-S0 controls (P < 0.00001) (Figure 4) and increased with age both in women (Figure 4A; P < 0.00001) and men (Figure 4B; P < 0.00001).
Impact of the S1A Stage in the Definition of Steatotic Liver Disease
Using PDFF, the prevalence of UK-Biobank participants with liver steatosis at baseline was 34% higher than that using the histological standard, which exhibits approximately 25% diagnostic uncertainty for a 20 mm biopsy sample [2,3,4].
MASLD, the most common chronic liver disease worldwide, has a global prevalence of 38% among the adult population; according to our results, the true prevalence of MASLD could be at least 13% higher (38%×34% = 13%), yielding a prevalence of 51% or more [17].
At baseline, and as expected, participants with S0, S1A, and S1B grades in the UK population-based cohort (n = 1,498 at baseline, 173 with repeated samples) all matched the 'Controls phenotype' in MASLD-Clusters analysis (S4 File). For the QuidNash T2D outpatients (n = 314) all fitted with “Cardiometabolic-SLD”.
Discussion
Our findings indicate that the prevalence of hepatic steatosis among UK Biobank participants was 46.4%, substantially higher than the previously reported 21.3%. This difference is due to the identification of a newly earliest stage of steatosis (here called S1A) which was present in 26.1% of participants (95% CI: 25.6–26.6%) (Table 1). These participants were previously classified as having no steatosis when using the less sensitive 6.4% PDFF cutoff, which is more useful for severe contexts of use, such as T2D outpatients [3,5]. The prevalence of participants without steatosis (new-S0) using 3.2% PDFF was 53.6% (53–54%).
These findings highlight the complementary roles of imaging and blood tests in improving the diagnosis of liver diseases. In 2005, the priority for patients with SLD was diagnosing severe fibrosis stages and MASH grades [1,2]. More recently, the resmetirom phase-3 trial highlighted the need to increase the granularity of the scoring system for early indicators, which permitted the first approval for treating fibrosis stages F2 to F3 [21]. Unlike fibrosis, steatosis is not an optimal candidate for predicting liver-related mortality. Steatosis is the earliest indicator of MASLD [5,22,23,24,25,26,27]; more importantly, it is the first feature quantified using PDFF, a nearly perfect indicator [2,6,23,24] with an uncertainty 10 times lower than the standard 20 mm liver biopsy [3,4,7,8]. If confirmed through independent validation, the S1A stage could became a clinical target for efficient screening using NITs and early intervention using new treatments. NITs validated for producing accurate early-steatosis grades would improve the surveillance and accelerate the approval of new drugs for MASLD.
Clinical Relevance of S1A: First Outcome
The traditional steatosis scoring system, which ranges from 5% to 100%, is no longer justified. Instead, like other major liver features such as inflammation and fibrosis, steatosis should be scored from 0% to 100%.
Steatosis is considered the earliest manifestation of MASLD, although the debates over MASH and fibrosis remain unresolved [22], largely due to the lack of a near-perfect reference indicator such as PDFF for steatosis.
Our findings strongly suggest that the early steatosis grade S1A, defined as 3.2% to ≤ 6.4% PDFF, represents an independent intermediate steatosis grade with a real phenotype profile [5,6]. S1A is positioned between the newly defined new-S0 (≤ 3.2% PDFF) and S1B (6.4–16.4% PDFF) categories. After adjusting for confounding factors, the participants classified as S1A had a significantly higher triglyceride concentration and a greater prevalence of overweight than those classified as new-S0.
We confirmed the clinical relevance of the S1A category, with 86% of characteristics (48 of 56) showing highly significant differences from the two adjacent grades: new-S0 (the UK-Biobank control group) and S1B (the new third steatosis grade). S1A is a stage characterized by increased SBP and various forms of steatosis not present in new-S0, including liver, pancreatic, subcutaneous, total trunk, and adipose tissue steatosis, all being associated with age, but generally similar in women and men. One original result was the absence of a significant association with HbA1c in the very early steatosis grade regardless of age and sex (S2 File).
As expected, compared with participants with S1B, those with S1A had lower triglycerides and a lower prevalence of overweight. Moreover, in contrast to S1A, the S1B stage was associated with two major risk factors: higher SBP, a key cardiovascular risk marker, and elevated HbA1c, a critical indicator of T2D and metabolic risk.
A recent UK-Biobank study confirmed independent associations between liver PDFF, visceral adipose tissue (VAT), and cardiac structure and function [9]. This suggest that different trajectories of cardio-vascular events could be identified according to earlier grades of visceral steatosis as observed here for liver steatosis.
The higher granularity of the new score permitted us to confirm the clinical relevance of the new grades S1A and S1B at baseline, which predicted a higher risk of clinically significant steatosis S2–S3 at four years. The absence of steatosis (S0) was better defined, without changes performed for the more severe grades S2 and S3.
Improved surveillance of individuals at risk of MASLD is necessary, along with the validation of cost-effective early treatments. Non-invasive tests validated for early-steatosis grading will improve the quality of surveillance and accelerate the approval of new anti-steatosis and antifibrosis drugs. As demonstrated in Figure 1, such NITs should detect the progression of early stage to clinically significant steatosis grade S2S3.
Since 2005, the Nash-FibroTest test for SLD and hyperlipidemia has remained the only blood test that assesses the grades of steatosis (SteatoTest-2) and MASH (NahTest-2), and stages of fibrosis (FibroTest) using a single blood sample [4,25,26]. The S1A stage proposed in this study, associated with higher triglycerides, and BMI than the S0 stage, confirms the observations in the National Health and Nutrition Examination Survey (NHANES III) and National Death Index (NDI) for an index combining triglycerides and BMI in individuals without advanced fibrosis [27].
Overall Mortality of Early Steatosis: Second Outcome
Analysis of 15-year survival data revealed a significant mortality difference associated with early steatosis grades. Participants classified as low risk, when their profile was adjusted by the model risk for confounding factors, had a significantly lower 15-year survival rate than those at high risk. Thanks to the UK-Biobank power and to the PDFF performance, there was a modest widely available but significant 2.2% difference in survival. The UK-Biobank participants were apparently healthy; furthermore, those who died before the five-year follow-up were excluded from the survival analysis; this could have contributed to the high 15-year survival (99.4% (95% CI: 99.2–99.6%)) among the participants with low model risk. Finally, we acknowledge, as stated in the limitations, that the higher mortality of S1A participants requires external validation.
Redefining Disease Prevalence: Third Outcome
Redefining steatosis absence through new criteria substantially increases the ‘visible’ prevalence of MASH, MASLD, and MetALD. If our results are independently validated, epidemiological and cost-effectiveness studies in the general population should be conducted, including MASLD features as well as those for MASH and increased alcohol intake (MetALD) [17].
The performance of new NITs calibrated for these contexts of use should be evaluated for both surveillance and the validation of new treatments. Moreover, in the general population, the CRN hepatocyte histological four-tier scoring system for steatosis is not clinically useful regarding grades S2 or S3. When defined by PDFF, these grades are too unbalanced for this type of use.
Strengths
Our analysis of PDFF data from UK-Biobank produced several results across the three outcomes that could improve the clinical management of individuals at risk of MASLD.
Limitations
This study has several limitations. First, the post-hoc character of the analyses, despite the prospective design of the seven cohorts included.
Second, PDFF is costly and not widely available. Here, we used it not for population screening, but as the best reference to validate the prevalence of early steatosis grades, which should permit the construction of widely available NITs with higher diagnostic and prognostic performances.
The cutoff justifications were often disputable for liver features due to the uncertainty of small biopsy samples as the standard reference [2,4]. Here, the redefinition of PDFF-based cutoffs is supported by four main arguments: (1) the need to define hepatocyte steatosis using categories such as “normal,” “not clinically significant,” “moderate,” and “severe”as for fibrosis or inflammatory activity; (2) PDFF has a 10-fold higher accuracy than the CRN biopsy reference, justifying its use for more granular NITs development. The increase of the granularity with much earlier fibrosis stage has permitted validation of the efficacy of resmetirom in MASLD fibrosis [21], and the efficacy of lubiprostone in MASLD steatosis [8]; (3) the trajectories would also be ten times more accurate than those based on histological reference; (4) PDFF-validated NITs will permit validation in large context-of-use populations, including general populations.
Third, while PDFF estimates the volume fraction of liver lipids, the non-hepatocyte cell fraction may represent a potential confounding factor, as histological assessment measures the proportion of macroscopically fatty hepatocytes while PDFF estimates the volume fraction of liver lipids. Our results reinforce the importance of understanding of the non-hepatocyte cell fraction, as this could be lower in the earlier S1A steatosis grade [23].
Finally, cohort-specific limitations must be acknowledged. The UK Biobank is not nationally representative cohort; participants are predominantly white, middle-aged, healthier and socioeconomically advantaged, with self-reported lifestyle data (e.g., alcohol intake, diet) [10]. Only ~5% underwent PDFF with the latest generation of MRI. We excluded 21,522 non-white individuals to reduce possible confounding factors associated with ethnicity (S1 Figure).
The QuidNash dataset, though unique in combining biopsy with morphometric quantification, PDFF, SteatoTest and several recent NITs [29; 30] not previously compared in outpatients with diabetes. It also has limitations, a relatively small number of participants, a longitudinal followup not finalized, and exclusion at baseline of participants with high alcohol intake (MetALD), limiting its applicability to general populations. Only 6% of this cohort had early-grade S1A (Table 2).
In the USA-FibroSure and Fibro-CPAM datasets, missing data—especially on alcohol use—represent also a limitation (Table 2).
Additional studies in younger, multiethnic, and socioeconomically diverse populations are needed. Although adjustments were made for key cardiometabolic confounders, residual confounding cannot be excluded. Therefore, external validation studies are needed, particularly for the prognostic performance at 15 years for all-cause mortality and mortality attributed to cardiovascular- and liver-related causes. Differences observed between pancreas and liver volumes and PDFF values merit further prospective investigation to explore potential associations with inflammation and fibrosis.
Conclusions
Our study suggested that early-onset steatosis and early MASH were undetectable using conventional definitions, affecting a substantial proportion of apparently healthy individuals that could deserve attention. The proposed S1A classification identifies a distinct phenotype at increased cardiometabolic risk. This refined approach increases the detectable prevalence of MASLD by over one-quarter, with significant implications for public health and clinical practice. The development of non-invasive tests with enhanced sensitivity for early-stage detection should improve MASLD surveillance in general populations.
Supplementary Materials
The following supporting information can be downloaded at the website of this paper posted on Preprints.org, S1 Figure. The UK-Biobank discovery cohort; S2 File. ANCOVA analysis S1AvsS0 women phenotype; S3 File. ANCOVA analysis S1AvsS0 men phenotype; S4 File. Medians of the six MASLD-Clusters phenotypes parameters and overall affectation Cluster for the UK population-based cohort (n=1,498) at baseline with S0, or S1A or S1B.
Conflicts of Interest
Thierry Poynard, Olivier Deckmyn and Valentina Peta are full employees of BioPredictive. The royalties of FibroTest' patents belong to national public organizations, Sorbonne Université and Asssistance Publique Hopitaux de Paris (APHP). No other co-author has a conflict of interest to declare.
References
- Kleiner, D.E.; Brunt, E.M.; Van Natta, M.; Behling, C.; Contos, M.J.; Cummings, O.W.; et al. Design and validation of a histological scoring system for nonalcoholic fatty liver disease. Hepatology. 2005, 41, 1313–1321. [Google Scholar] [CrossRef]
- Ratziu, V.; Charlotte, F.; Heurtier, A.; Gombert, S.; Giral, P.; Bruckert, E.; et al. Sampling variability of liver biopsy in nonalcoholic fatty liver disease. Gastroenterology. 2005, 128, 1898–1906. [Google Scholar] [CrossRef]
- Poynard, T.; Paradis, V.; Mullaert, J.; Deckmyn, O.; Gault, N.; Marcault, E.; et al. Prospective external validation of a new non-invasive test for the diagnosis of non-alcoholic steatohepatitis in patients with type 2 diabetes. Aliment Pharmacol Ther. 2021, 54, 952–966. [Google Scholar] [CrossRef] [PubMed]
- Poynard, T.; Deckmyn, O.; Pais, R.; Aron-Wisnewsky, J.; Peta, V.; Bedossa, P.; et al. Three Neglected STARD Criteria Reduce the Uncertainty of the Liver Fibrosis Biomarker FibroTest-T2D in Metabolic Dysfunction-Associated Steatotic Liver Disease (MASLD). Diagnostics (Basel). 2025, 15, 1253. [Google Scholar] [CrossRef] [PubMed]
- Kanwal, F.; Neuschwander-Tetri, B.A.; Loomba, R.; Rinella, M.E. Metabolic dysfunction-associated steatotic liver disease: Update and impact of new nomenclature on the American Association for the Study of Liver Diseases practice guidance on nonalcoholic fatty liver disease. Hepatology. 2024, 79, 1212–1219. [Google Scholar] [CrossRef] [PubMed]
- McHugh, L.C.; Snyder, K.; Yager, T.D. The effect of uncertainty in patient classification on diagnostic performance estimations. PLoS One. 2019, 14, e0217146. [Google Scholar] [CrossRef]
- Kim, B.K.; Bernstein, N.; Huang, D.Q.; Tamaki, N.; Imajo, K.; Yoneda, M.; et al. Clinical and histologic factors associated with discordance between steatosis grade derived from histology vs. MRI-PDFF in NAFLD. Aliment Pharmacol Ther. 2023, 58, 229–237. [Google Scholar] [CrossRef]
- El-Kassas, M.; Mostafa, H.; Abdellatif, W.; Shoman, S.; Esmat, G.; Brahmania, M.; et al. Lubiprostone Reduces Fat Content on MRI-PDFF in Patients With MASLD: A 48-Week Randomised Controlled Trial. Aliment Pharmacol Ther. 2025, 61, 628–635. [Google Scholar] [CrossRef]
- Sanyal, A.J.; Castera, L.; Wong, V.W.-S. Noninvasive Assessment of Liver Fibrosis in NAFLD. Clin Gastroenterol Hepatol. 2023, 21, 2026–2039. [Google Scholar] [CrossRef]
- Targher, G.; Valenti, L.; Byrne, C.D. Metabolic Dysfunction-Associated Steatotic Liver Disease. N Engl J Med. 2025, 393, 683–698. [Google Scholar] [CrossRef] [PubMed]
- Lv, Z.; Fu, Y.; Ma, Y.; Liu, C.; Yuan, M.; Gao, D. Associations Between Visceral and Liver Fat and Cardiac Structure and Function: A UK Biobank Study. J Clin Endocrinol Metab. 2025, 110, e1856–e1865. [Google Scholar] [CrossRef]
- Littlejohns, T.J.; Holliday, J.; Gibson, L.M.; Garratt, S.; Oesingmann, N.; Alfaro-Almagro, F.; et al. The UK Biobank imaging enhancement of 100,000 participants: rationale, data collection, management and future directions. Nat Commun. 2020, 11, 2624. [Google Scholar] [CrossRef]
- Poynard, T.; Deckmyn, O.; Peta, V.; Sakka, M.; Lebray, P.; Moussalli, J.; et al. Clinical and genetic definition of serum bilirubin levels for the diagnosis of Gilbert syndrome and hypobilirubinemia. Hepatol Commun. 2023, 7, e0245. [Google Scholar] [CrossRef]
- Deckmyn, O.; Poynard, T.; Bedossa, P.; Paradis, V.; Peta, V.; Pais, R.; et al. Clinical Interest of Serum Alpha-2 Macroglobulin, Apolipoprotein A1, and Haptoglobin in Patients with Non-Alcoholic Fatty Liver Disease, with and without Type 2 Diabetes, before or during COVID-19. Biomedicines. 2022, 10, 699. [Google Scholar] [CrossRef] [PubMed]
- Poynard, T.; Munteanu, M.; Charlotte, F.; Perazzo, H.; Ngo, Y.; Deckmyn, O.; et al. Diagnostic performance of a new noninvasive test for nonalcoholic steatohepatitis using a simplified histological reference. Eur J Gastroenterol Hepatol. 2018, 30, 569–577. [Google Scholar] [CrossRef] [PubMed]
- Poynard, T.; Lebray, P.; Ingiliz, P.; Varaut, A.; Varsat, B.; Ngo, Y.; et al. Prevalence of liver fibrosis and risk factors in a general population using non-invasive biomarkers (FibroTest). BMC Gastroenterol. 2010, 10, 40. [Google Scholar] [CrossRef] [PubMed]
- Poynard, T.; Deckmyn, O.; Munteanu, M.; Ngo, Y.; Drane, F.; Castille, J.M.; et al. Awareness of the severity of liver disease re-examined using software-combined biomarkers of liver fibrosis and necroinflammatory activity. BMJ Open. 2015, 5, e010017. [Google Scholar] [CrossRef]
- Poynard, T.; Ratziu, V.; McHutchison, J.; Manns, M.; Goodman, Z.; Zeuzem, S.; et al. Effect of treatment with peginterferon or interferon alfa-2b and ribavirin on steatosis in patients infected with hepatitis C. Hepatology. 2003, 38, 75–85. [Google Scholar] [CrossRef]
- Feng, G.; Targher, G.; Byrne, C.D.; Yilmaz, Y.; Wai-Sun Wong, V.; Adithya Lesmana, C.R.; et al. Global burden of metabolic dysfunction-associated steatotic liver disease, 2010 to 2021. JHEP Rep. 2025, 7, 101271. [Google Scholar] [CrossRef]
- Raverdy, V.; Tavaglione, F.; Chatelain, E.; Lassailly, G.; De Vincentis, A.; Vespasiani-Gentilucci, U.; et al. Data-driven cluster analysis identifies distinct types of metabolic dysfunction-associated steatotic liver disease. Nat Med. 2024, 30, 3624–3633. [Google Scholar] [CrossRef]
- Poynard, T.; Munteanu, M.; Deckmyn, O.; Ngo, Y.; Drane, F.; Messous, D.; et al. Applicability and precautions of use of liver injury biomarker FibroTest. A reappraisal at 7 years of age. BMC Gastroenterol. 2011, 11, 39. [Google Scholar] [CrossRef]
- Harrison, S.A.; Bedossa, P.; Guy, C.D.; Schattenberg, J.M.; Loomba, R.; Taub, R.; et al. A Phase 3, Randomized, Controlled Trial of Resmetirom in NASH with Liver Fibrosis. N Engl J Med. 2024, 390, 497–509. [Google Scholar] [CrossRef]
- Ratziu, V. Back to Byzance: Querelles byzantines over NASH and fibrosis. J Hepatol. 2017, 67, 1134–1136. [Google Scholar] [CrossRef]
- Qadri, S.; Vartiainen, E.; Lahelma, M.; Porthan, K.; Tang, A.; Idilman, I.S.; et al. Marked difference in liver fat measured by histology vs. magnetic resonance-proton density fat fraction: A meta-analysis. JHEP Rep. 2024, 6, 100928. [Google Scholar] [CrossRef] [PubMed]
- Chan, W.-K.; Petta, S.; Noureddin, M.; Goh, G.B.B.; Wong, V.W.-S. Diagnosis and non-invasive assessment of MASLD in type 2 diabetes and obesity. Aliment Pharmacol Ther. 2024, 59, S23–S40. [Google Scholar] [CrossRef] [PubMed]
- Poynard, T.; Ratziu, V.; Naveau, S.; Thabut, D.; Charlotte, F.; Messous, D.; et al. The diagnostic value of biomarkers (SteatoTest) for the prediction of liver steatosis. Comp Hepatol. 2005, 4, 10. [Google Scholar] [CrossRef] [PubMed]
- Ratziu, V.; Giral, P.; Munteanu, M.; Messous, D.; Mercadier, A.; Bernard, M.; et al. Screening for liver disease using non-invasive biomarkers (FibroTest, SteatoTest and NashTest) in patients with hyperlipidaemia. Aliment Pharmacol Ther. 2007, 25, 207–218. [Google Scholar] [CrossRef]
- Chen, Q.; Hu, P.; Hou, X.; Sun, Y.; Jiao, M.; Peng, L.; et al. Association between triglyceride-glucose related indices and mortality among individuals with non-alcoholic fatty liver disease or metabolic dysfunction-associated steatotic liver disease. Cardiovasc Diabetol. 2024, 23, 232. [Google Scholar] [CrossRef]
- Castera L, Laouenan C, Vallet-Pichard A, Vidal-Trécan T, Manchon P, Paradis V, Roulot D, Gault N, Boitard C, Terris B, Bihan H, Julla JB, Radu A, Poynard T, Brzustowsky A, Larger E, Czernichow S, Pol S, Bedossa P, Valla D, Gautier JF; QUID-NASH investigators. High Prevalence of NASH and Advanced Fibrosis in Type 2 Diabetes: A Prospective Study of 330 Outpatients Undergoing Liver Biopsies for Elevated ALT, Using a Low Threshold. Diabetes Care. 2023, 46, 1354–1362. [Google Scholar] [CrossRef] [PubMed]
- Fourati O, Manchon P, Garteiser P, Castera L, Burgio MD, Van Beers B, Bedossa P, Albuquerque M, Poynard T, Laouenan C, Valla D, Paradis, V.; QUID-NASHinvestigators Morphometric quantification of steatosis fibrosis in metabolic liver disease associated with type 2 diabetes Clin Gastroenterol Hepatol 2025 Sep, 1.5.:.S.1.5.4.2.-3.5.6.5.(.2.5.).0.0.8.0.2.-X. Epub ahead of print. [CrossRef] [PubMed]
Figure 1.
S1A and S1B earlier grades improve the four-year prediction of clinically significant S2S3 vs S0 as control (n=2,012; paired PDFF, P < 0.0001). (A) Baseline and four-year repeated PDFF 5-tier graded by new-S0, S1A, and S1B cutoffs. The columns display the proportions of subjects with PDFF 5-tier graded by the new-S0, S1A, and S1B cutoffs. The left column is baseline; the right column is the repeated measurements four years later. The colored flow linking the two columns shows the proportion of participants moving from one grade to another during a median of 4 years. (B) Baseline and four-year repeated PDFF 4-tier values graded by the Kim et al. cutoffs. The trajectories between S0, and S1A and S1B were invisible. (1) Baseline and four-year repeated PDFF 4-tier values graded by the CRN cutoffs. The trajectories between S0, and S1A and S1B and S2 and S3 were invisible.
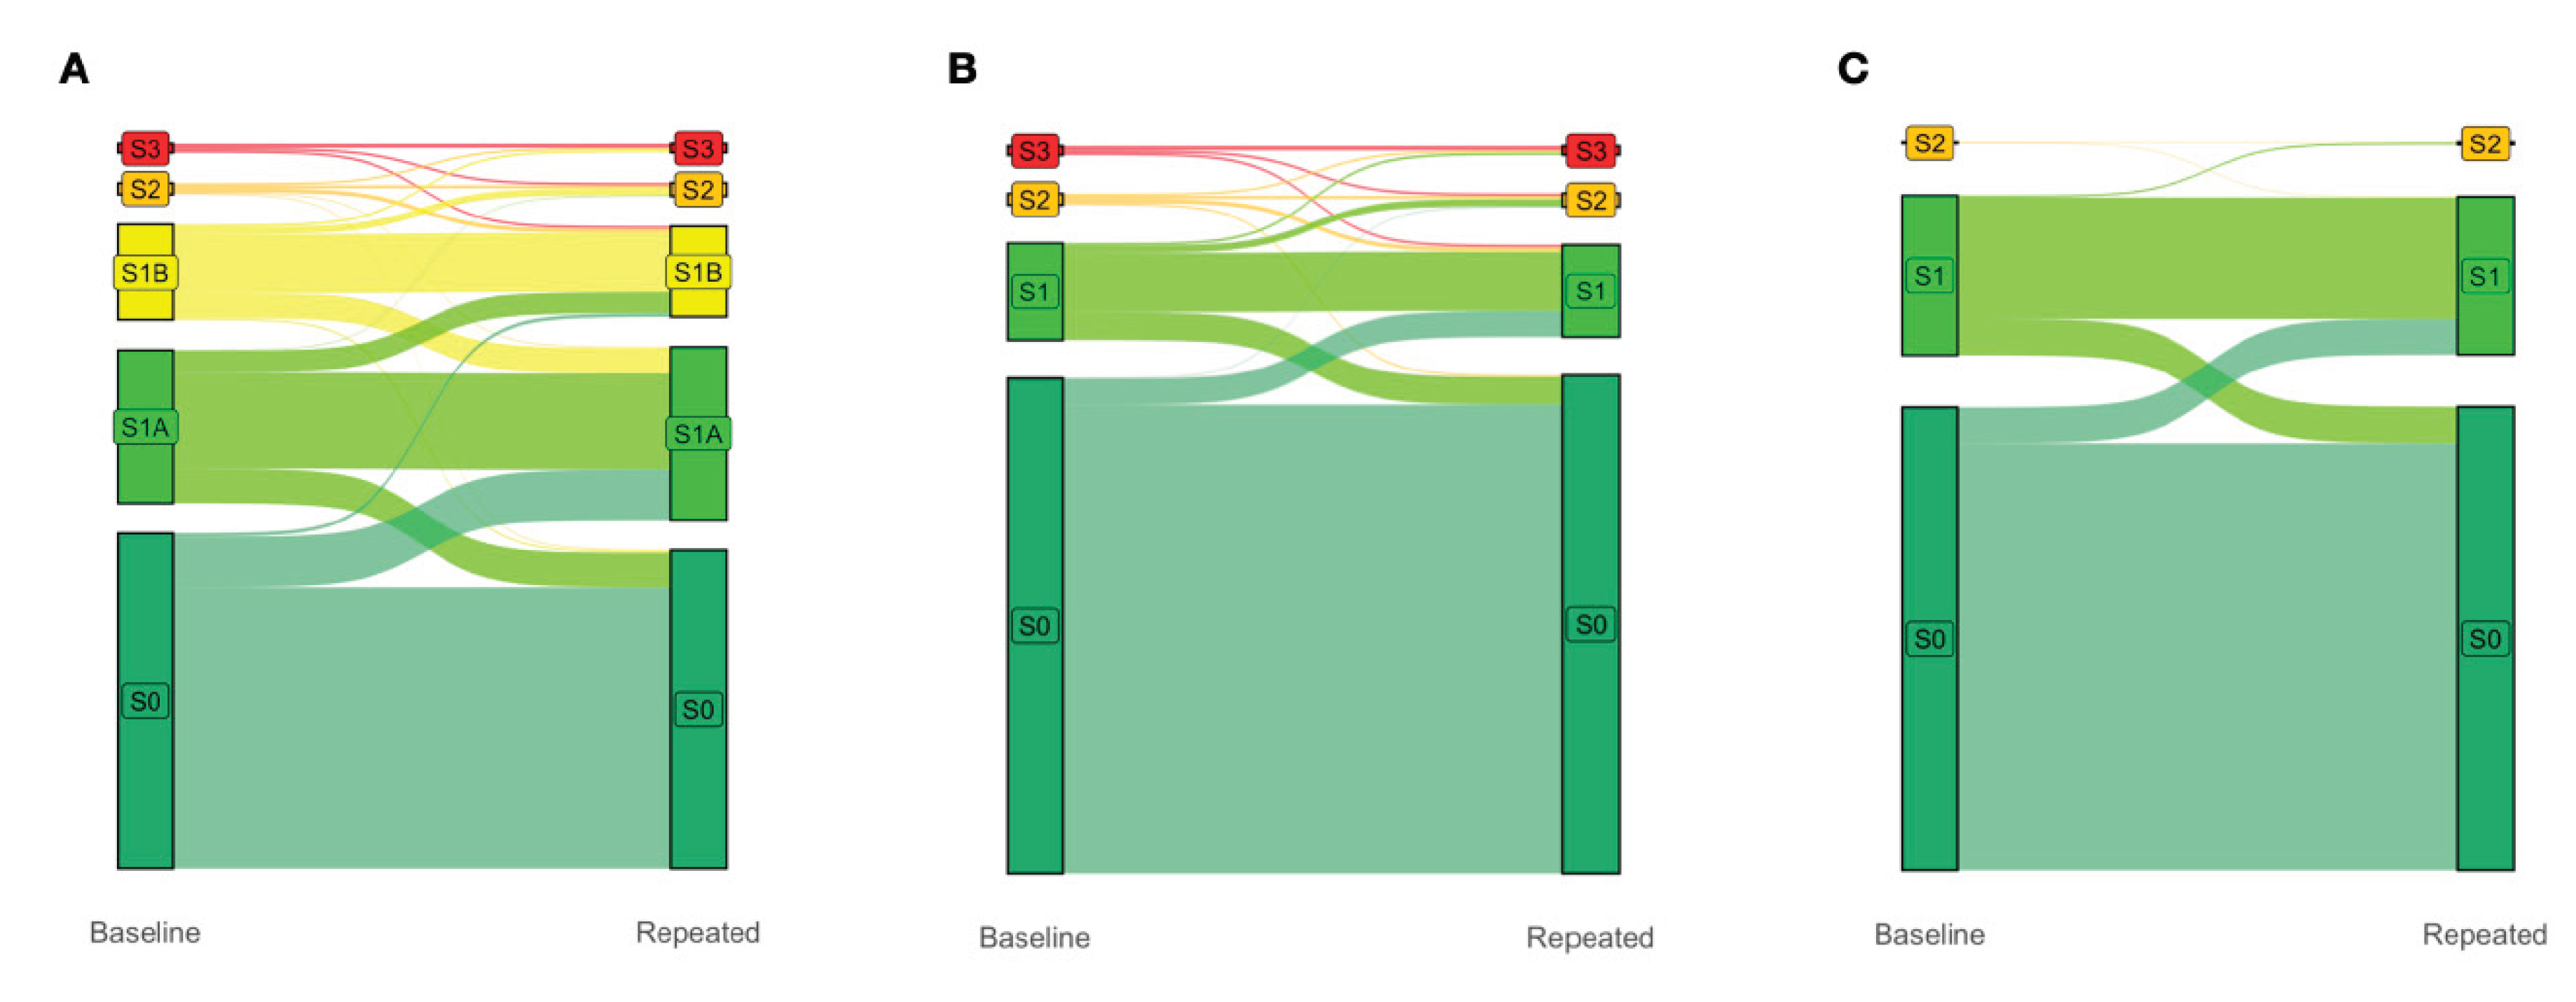
Figure 2.
Fifteen-year all-survival model. (A) Survival of participants in the Low and High Risk groups after Cox multivariate adjustment. (B) S1A vs S0 survival without adjustments. (C) S1A vs S1B survival without adjustments.
Figure 2.
Fifteen-year all-survival model. (A) Survival of participants in the Low and High Risk groups after Cox multivariate adjustment. (B) S1A vs S0 survival without adjustments. (C) S1A vs S1B survival without adjustments.
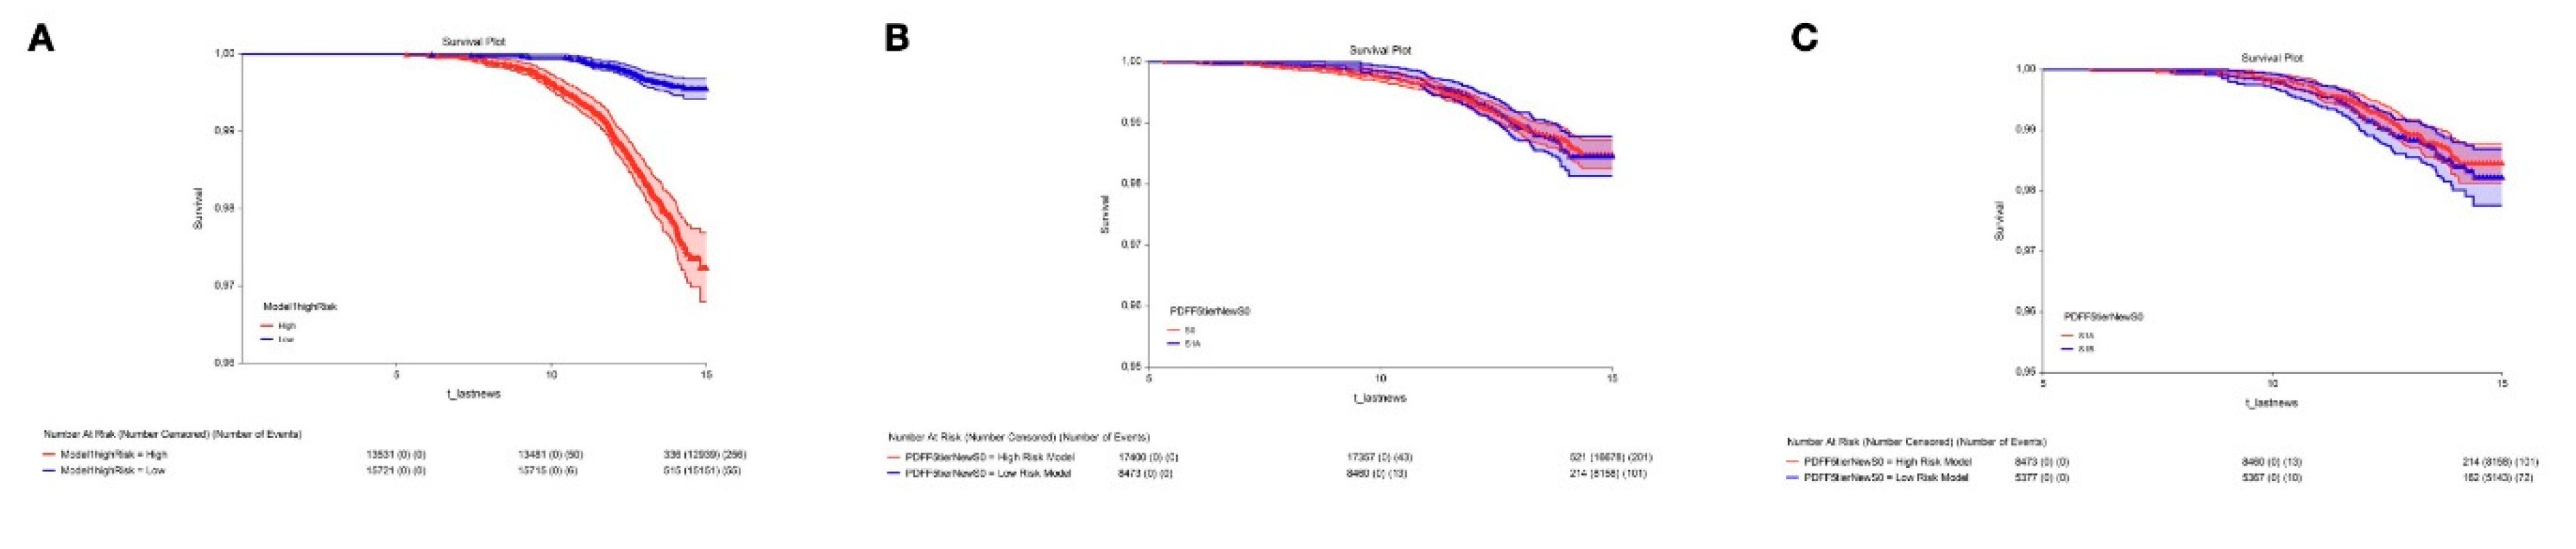
Figure 3.
Pancreas PDFF and volume according to liver early steatosis stage S1A vs the newS0 as a control. (A) Women, pancreas PDFF increased in S1A and age; (B) Men, pancreas PDFF increased with S1A and age; (C) Women’s pancreas volume decreased with S1A and age; (D) Men's pancreas volume decreased in S1A and age.
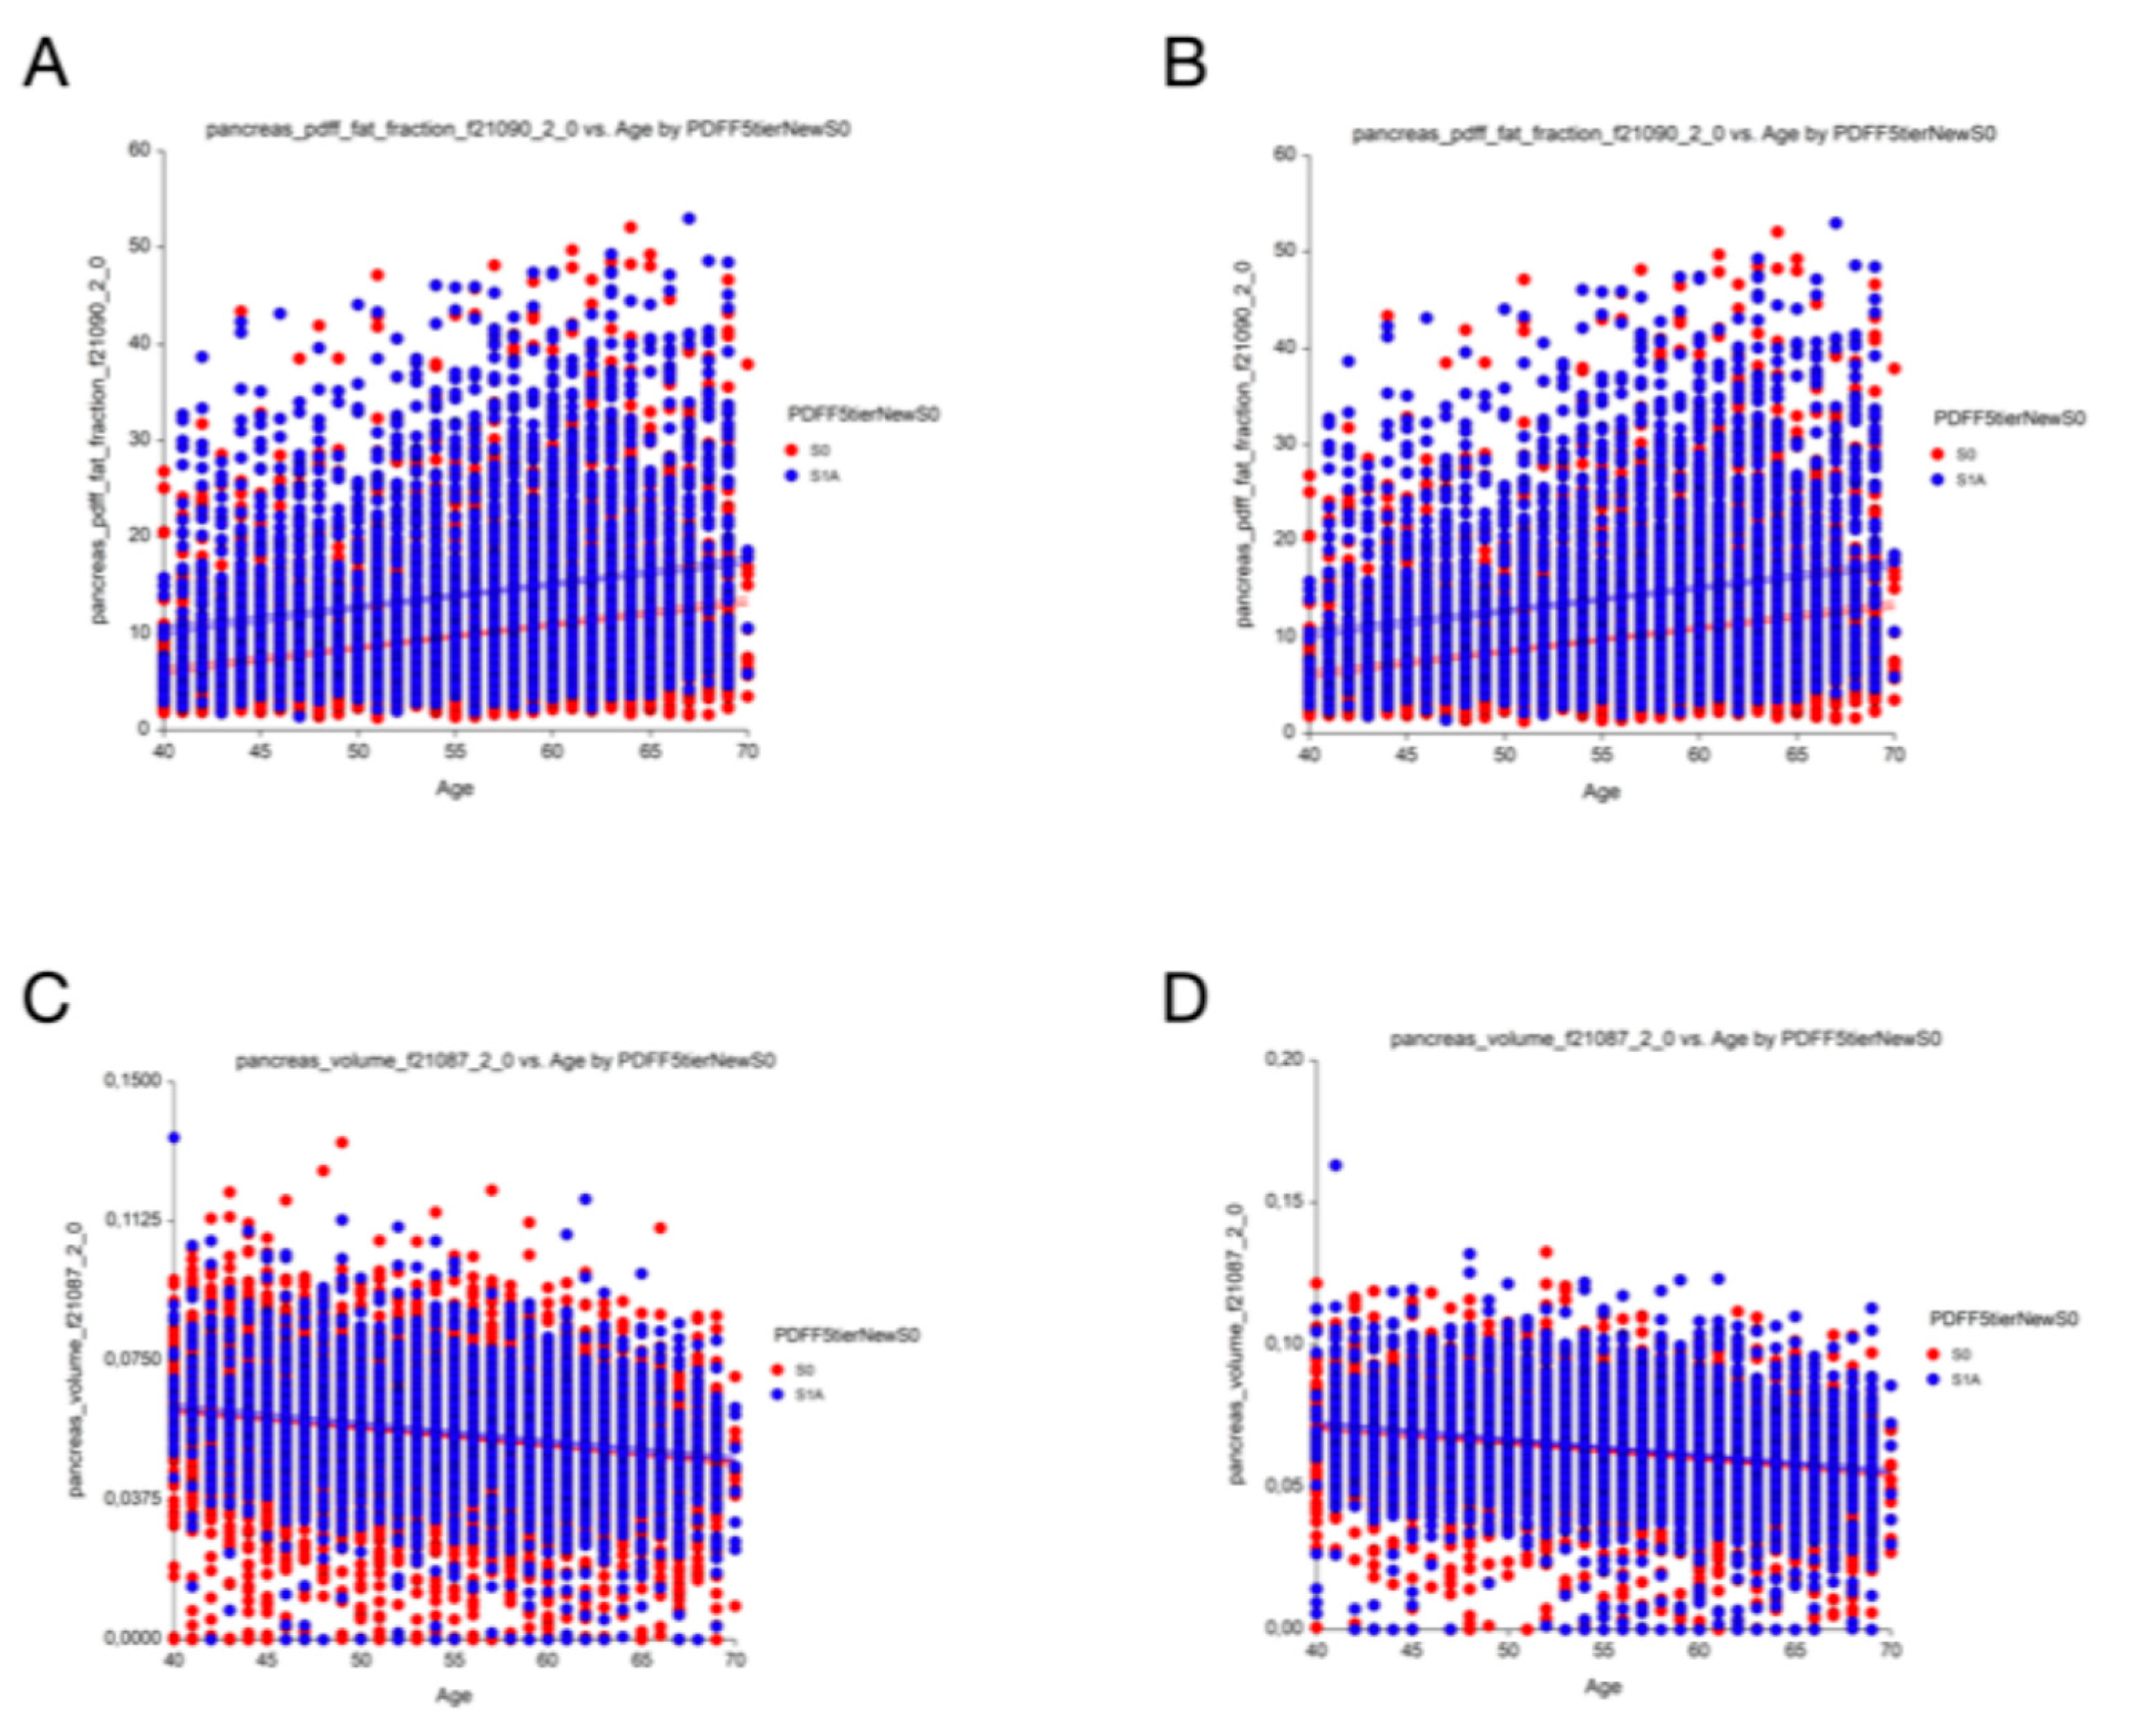
Figure 4.
Systolic blood pressure (SBP) according to liver early steatosis stage S1A vs newS0 as a control. (A) Women SBP; (B) Men’s SBP.
Figure 4.
Systolic blood pressure (SBP) according to liver early steatosis stage S1A vs newS0 as a control. (A) Women SBP; (B) Men’s SBP.
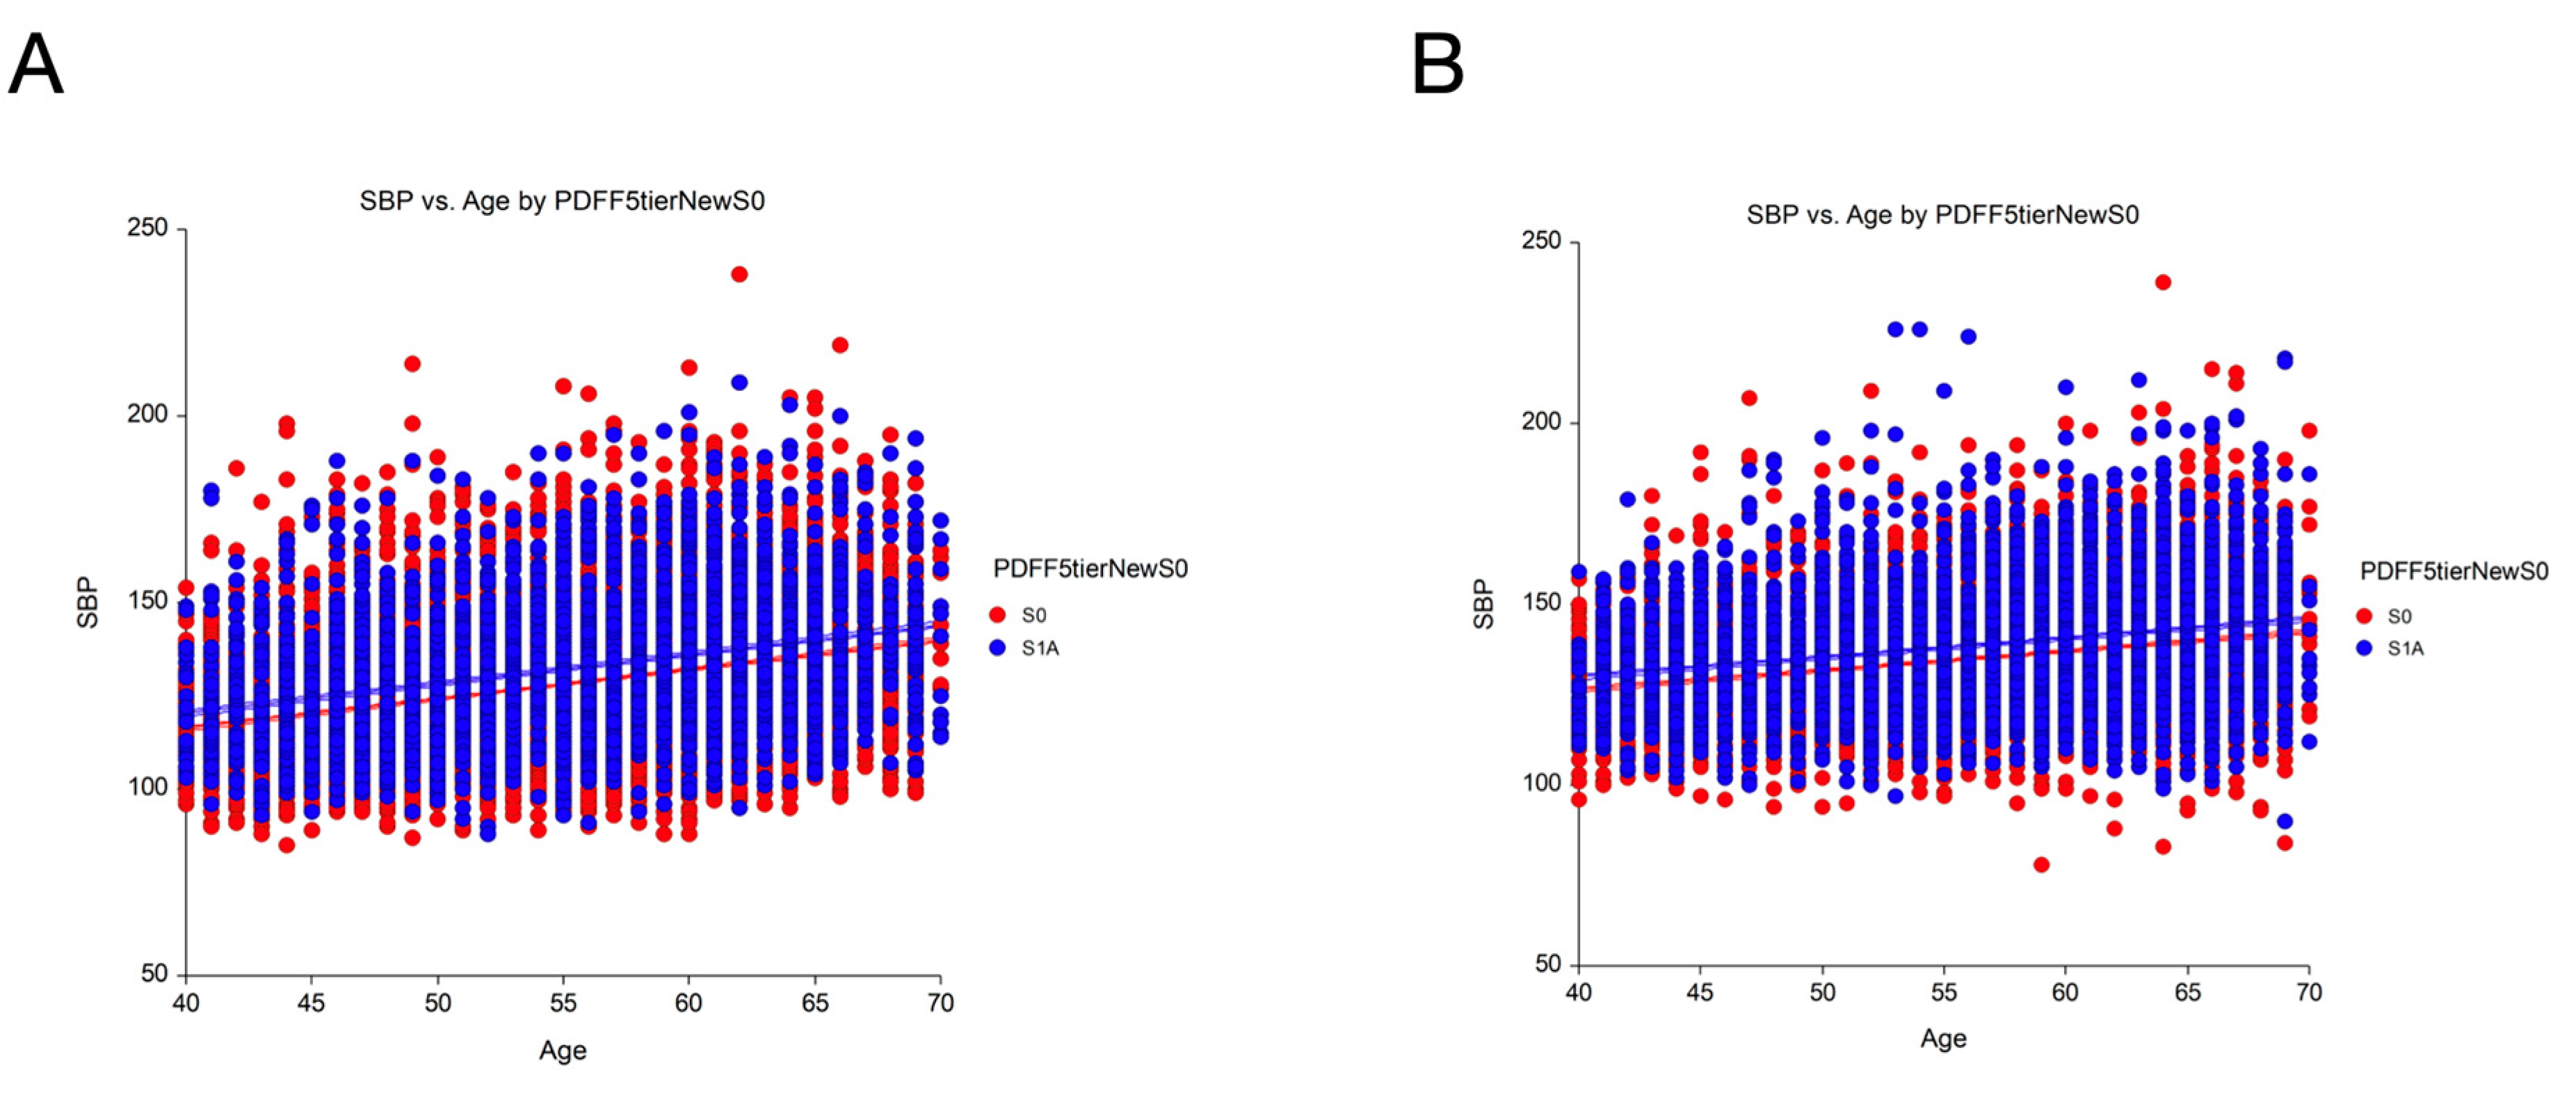

Table 1.
Prevalence of PDFF steatosis grades, and main clinical and biological characteristics in two prospective data sets. NA: Not applicable.
Table 1.
Prevalence of PDFF steatosis grades, and main clinical and biological characteristics in two prospective data sets. NA: Not applicable.
| Context of use Reference |
UK-Biobank population-based cohort [10,11,14] |
QuidNash outpatients Type-2 Diabetes [3,4] | ||||||||
| Number participants with PDFF | 29,252 (100%) | 286 (100%) | ||||||||
| Prevalence steatosis % | ||||||||||
| PDFF Tiers cutoffs | S0 | S1A | S1B | S2 | S3 | S0 | S1A | S1B | S2 | S3 |
|
PDFF early steatosis 5-tier (0-<=3.2=S0/ <6.4=S1A/ <17.4=S1B/ <22.1=S2/ >=21.1=S3) |
53.6 | 26.1 | 16.6 | 1.9 | 1.8 | 0.1 | 6 | 45 | 19 | 30 |
| PDFF steatosis 4-tier (Kim 2023) (<6.4=S0/ <17.4=S1/ <22.1=S2/ >=22.1=S3 | 79.7 | 16.6 | 1.9 | 1.8 | 6.1 | 45 | 19 | 30 | ||
| SteatoTest/Fibrosure 4-tier (<= 0.38= S0/ <0.57=S1A/ <0.69=S2/ >0,69=S3) | NA | 9.8 | 28.7 | 40.6 | 21.0 | |||||
| Biopsy (4-tier CRN standard) | NA | 3.2 | 21.3 | 54.2 | 21.3 | |||||
| Phenotype characteristic % | ||||||||||
| Female sex % Female/Male | 51/ 49 | 41/ 59 | ||||||||
| Ethnicity % white | 100 | 80 | ||||||||
| Age years 5-tier % <40/ 50/ 60/ >70) | 1/ 29/ 48/ 22/ 0 | 20/ 20/ 27/ 26/ 7 | ||||||||
| % and cutoffs of Cardiometabolic risk factors according to recent MASLD nomenclature5 | ||||||||||
| Systolic blood pressure mmHg % >=130 | 53 | 56 | ||||||||
| Body mass index % >=25/m2 | 58 | 92 | ||||||||
| Triglycerides mmol/L (>= 1,7) | 19 | 43 | ||||||||
| HDL-cholesterol % (<= 1.0 mmol/L; 40mg/dL for male <= 1.3 mmol/L; 50mg/dL for female) | 33 female 27 male |
97 female 99 male |
||||||||
| Type-2 diabetes %, HbA1c >=5.7% or Glu >5.6 mmol/L | 12 | 100 | ||||||||
| Number of cardiovascular risk factors Median (range) |
2 (0 - 5) | 3 (1 - 5) | ||||||||
| MASLD Raverdy clusters 18 | Controls | Cardiometabolic SLD | ||||||||
| Mild or high alcohol intake % | 22 | 0 (excluded) | ||||||||
| Smoking % | 39 | 29 | ||||||||
| ApoA1 g/L median (IQR) | 1.63 (0.34) female 1.42 (0.29) male |
1.45 (0.28) female 1.29 (0.23) male |
||||||||
| Biopsy Steatosis CRN 4-tier % (0-<5=S0/ 5-<33=S1/ 33-<66=S2/ 66-100=S3 | NA | 21/ 54/ 21/ 4 | ||||||||
Table 2.
Five data sets without PDFF, clinical and biological characteristics, prevalence of steatosis grades (N=149,212). NA: Not applicable.
Table 2.
Five data sets without PDFF, clinical and biological characteristics, prevalence of steatosis grades (N=149,212). NA: Not applicable.
| Published subsets |
FibroFrance-CPAM [15] |
USA-Fibrosure [16] |
France- Fibrotest [16] |
FibroFrance-Group [14] |
Hepatitis C [17] |
| Context of use (number participants) | General Population (n=7,399) | Steatotic Liver Disease (n=72,026) | Steatotic Liver Disease (n=67,278) | Steatotic Liver Disease (n=1,081) |
Chronic hepatitis C (n=1,428) |
| Phenotype % (cutoffs) | |||||
| Sex (Female/Male) | 45/ 55 | 54/ 46 | 41/ 59 | 38/ 62 | 34/ 66 |
| Age years 5-tier (<40/ 50/ 60/ >70) | 43/ 33/ 13/ 11 | 18/ 29/ 21/ 32 | 39 /28 /15/ 18 | 21/ 30/ 22/ 27 | 15/ 59/ 11/ 15 |
| Ethnicity (white/ Other) | 45/ 55 | 54/ 46 | 41/ 59 | 38/ 62 | 34/ 66 |
| Steatosis Liver Disease risk factors % (cutoffs) | |||||
| Systolic blood pressure (>=130 mmHg) | 42 | NA | NA | NA | NA |
| Body mass index (>=25/m2 (23 for Asia) | 90 | NA | NA | NA | NA |
| Triglycerides g/L 4-tier <1/ 1-1.5/ 1.5-2.0 >2.5 | 43/ 33/ 13/ 11 | 18/ 29/ 21/ 32 | 39 /28 /15/ 18 | 21/ 30/ 22/ 27 | 15/ 59/ 11/ 15 |
| % HDL-cholesterol (<=1.0 mmol/L;40mg/dL male;<=1.3 mmol/L;50mg/dL female | 9 female 8 male |
NA | NA | NA | NA |
| Type-2 diabetes, HbA1c or Glu >=5.7% or >5.6 mmol/L | 26 | 51 | 35 | 40 | 23 |
| MASLD Clusters | Controls faire proxy HBA1c |
faire proxy LDL | faire proxy LDL | ||
| Mild or high alcohol intake % | 48 | NA | 15 | 12 | 34 |
| Smoking % | 18 | NA | NA | NA | NA |
| ApoA1 (g/l) median (IQR) | 1.78 (0.37) female 1.59 (0.34) male |
1.49 (0.39) female 1.31 (0.33) male |
1.55 (0.43) female 1.37 (0.37) male |
1.47 (0.36) female 1.34 (0.33) male |
1.56 (0.32) female 1.33 (0.29) male |
| Prevalence steatosis % (cutoffs) | |||||
| SteatoTest/Fibrosure 4-tier<=0.38=S0/ <0.57=S1A/ <0.69=S2/ >0,69=S3 | 47/ 34/ 11/ 7 | 15/ 24/ 20/ 41 | 27/ 23/ 16/ 34 | 16/ 25/ 23/ 36 | 35/ 38/ 20/ 7 |
Disclaimer/Publisher’s Note: The statements, opinions and data contained in all publications are solely those of the individual author(s) and contributor(s) and not of MDPI and/or the editor(s). MDPI and/or the editor(s) disclaim responsibility for any injury to people or property resulting from any ideas, methods, instructions or products referred to in the content. |
© 2025 by the authors. Licensee MDPI, Basel, Switzerland. This article is an open access article distributed under the terms and conditions of the Creative Commons Attribution (CC BY) license (http://creativecommons.org/licenses/by/4.0/).
Copyright: This open access article is published under a Creative Commons CC BY 4.0 license, which permit the free download, distribution, and reuse, provided that the author and preprint are cited in any reuse.


