1. Introduction
Steatotic liver disease, formerly known as non-alcoholic liver disease, is a clinical entity caused by the deposition of excess fat in the liver. With 25% of the world population affected by the disease and an all-cause mortality of rate of 25.56 per 1000 person –years and a liver-specific mortality rate of 11.77 per 1000 person-years SLD and its complications (MASH, liver cirrhosis, hepatocarcinoma) became an important healthcare problem [
1].
Initially the diagnosis of SLD was based on routine blood chemistry and ultrasound examination and/or liver biopsy in some cases. But the pathophysiological mechanisms involved in SLD are complex, including genetic, epigenetic and environmental factors. Hepatic insulin resistance which is common in most cases of SLD can cause lipid liver accumulation, generation of reactive oxygen species with activation of local inflammasomes and excess inflammatory cytokines production. Inflammatory signals stimulate hepatic stellate cells leading to their activation and production of extracellular matrix [
2].
The implication of epigenetic factors affecting successive generations such as DNA methylation patterns or histone acetylation in the pathogeny of SLD has already been demonstrated. [
3] Micro-RNAs in SLD have gained momentum during the last years due to their role in carbohydrate and lipid metabolism and their value as non-invasive biomarkers for disease staging [
4].
Micro-RNAs are small, non-coding RNAs (21-26 nucleotides long) that modulate gene expression by degrading mRNA or inhibiting gene translation. Their synthesis involves a complex process: the primitive miRNA is cleaved by Drosha and DiGeorge syndrome Chromosomal Region 8 (DGCR8), exported to the cytoplasm, further cleaved by DICER family enzymes, and then attached in single-stranded form to a complex with Argonaut (Ago 1 to 4) and Transactivation Response Element (TRBP). The resulting RNA-induced silencing complex can attach to specific 2-8 nucleotide sites on mRNA, leading to mRNA degradation [
5].
MiR-122 is the most abundant miRNA in the liver and it is involved in liver steatosis, inflammation and development of HCC. In a methionine-choline –deficient diet the serum level of miR-122 is increased 40 fold as compared to controls. [
6]As it is highly influenced by such nutrient deficiencies one might question if we can use miR-122 as a biomarker of risk for SLD/MAFLD for generations of humans that might have been exposed to nutritional imbalances in the past.
In mice fed with a diet lacking choline and folate serum miR-192 levels are correlated with the severity of liver steatosis. In earlier stages of liver fibrosis in humans with NAFLD miR-192 is highly upregulated [
7].
Two other micro-RNAs with considerable impact on lipid metabolism are miR-33a and miR-33b, located in the intron of the sterol regulatory element-binding transcription factor 1. Mir-33a deficiency or inhibition in mice increases cellular cholesterol export through up-regulation of ABCA1 (ATP-binding subfamily A member 1) and the development of liver inflammation and fibrosis is suppressed. Also in high-fat diet mice as a model of NAFLD/NASH, the use of anti-miR-33b reduced liver accumulation of free cholesterol and triglycerides and improved fibrosis [
8].
In recent years, significant progress has been made in understanding the role of microRNAs (miRNAs) in the pathogenesis and diagnosis of steatotic liver disease (SLD). In 2025, recent systematic analyses confirmed that circulating miRNAs and extracellular vesicle-derived miRNAs (EV-miRNAs) provide essential information for early diagnosis and staging of MASLD, with sensitivity and specificity superior to classical biochemical tests[
9].
In 2020, authors have hypothesized that certain Romanian populations, particularly those born between 1945-1954 and 1980-1989, are at elevated risk for metabolic and cardiovascular diseases. [
10] This hypothesis aligns with statistical data from the Romanian Ministry of Health, indicating a rising prevalence of obesity, notably peaking in individuals aged 55-70 years. Additionally, steatotic liver disease (SLD) has emerged as a significant concern. Consistent with the Delphi consensus, we acknowledge that the new nomenclature enhances our ability to identify “at-risk” patients [
11].
In Romania, 23.7% of adult women and 26.3% of adult men are obese, with little progress in controlling obesity, sodium intake, or high blood pressure. While the obesity prevalence in Romanian women is slightly below the regional average of 25.3%, it exceeds the regional average of 24.9% for men. Concurrently, diabetes affects 7.0% of adult women and 8.5% of adult men [
12].
A recent U.S. study, conducted with 15,560 participants from 2017-2020 using the National Health and Nutrition Survey, found an SLD prevalence of 37.87% and MASLD (Metabolic-Associated Steatosis Liver Disease) prevalence of 32.45%. When the transient elastography threshold was lowered to 263 dB/m, the SLD prevalence increased to 49.85% [
13].
While recent epidemiological studies estimating the general prevalence of SLD in Romania are lacking, a study of 426 apparently healthy medical students using VCTE (Vibration-Controlled Transient Elastography) reported a 17.4% prevalence of liver steatosis (Năstasa et al., 2021). Similarly, a study among 380 Romanian diabetic patients using the same diagnostic methods estimated a 72.6% prevalence of liver steatosis [
14].
Globally, the prevalence of SLD has risen by 0.83% annually from 2000 to 2019, with an estimated 70% of overweight patients also having SLD. One-fifth of the SLD population is at risk of advancing to liver fibrosis, and NASH/MASH prevalence is projected to increase by 56% between 2016-2030[
15].
SLD, along with its associated comorbidities (T2DM, obesity, arterial hypertension, dyslipidemia), poses a significant burden on the Romanian healthcare system. Over the past three years, the prevalence of metabolic and cardiovascular diseases has been rising, attributed to factors such as a sedentary lifestyle, consumption of processed foods, and excessive calorie intake.
According to Popa et al in 2016 there is an “unexpected” increase in obesity prevalence and metabolic syndrome among the Romanian population and we proposed that such phenomenon might be influenced not only by lifestyle factors but also by epigenetic factors [
10].
The DOHaD (Developmental Origins of Health and Disease) concept suggests that early exposure to adverse environmental conditions can induce “reprogramming” for immediate adaptation. Discrepancies between the predicted and actual postnatal environments can lead to cardiovascular and metabolic disorders in adulthood. [
16]
Recent reviews confirm the higher risk of cardiovascular diseases (CVD), impaired glucose metabolism, and metabolic syndrome (MetS) among individuals exposed to severe malnutrition during fetal development, such as those affected by the Great Chinese Famine and Dutch Hunger Winter [
17]. It has been demonstrated in several clinical and experimental trials that calorie restriction and micronutrient deficiency during intrauterine life can lead to epigenetic reprogramming.
Several mechanisms contribute to this adaptation process, including changes in the hypothalamus-pituitary-adrenal axis, insulin signaling pathways, and epigenetic factors such as DNA methylation, histone modifications, and micro-RNAs[
18]. Experimental studies have shown that micro-RNAs in the sperm of high-fat diet mice are linked to metabolic disorders in the offspring. For instance, the microinjection of synthetic miRNA-19b into fertilized mouse eggs induces obesity in the offspring. Additionally, in a paternal mouse model fed a high-fat diet, a subset of sperm transfer RNA–derived small RNAs (tsRNAs) can mediate diet-induced metabolic disorders when injected into normal zygotes [
19].
Our case-control study focused on micro-RNAs as potent regulators of gene expression under stressful conditions such as calorie excess/restriction and macronutrient imbalance, aiming to understand their role in environmental adaptation.
We hypothesized that age and nutrition might influence microRNA expression through epigenetic mechanisms. The primary objective was to assess whether the observed microRNA modifications are influenced by epigenetic factors related to age and nutritional status. The secondary objective was to examine the prevalence of MASLD among patients with steatosis.
Our previous research investigated a panel of micro-RNAs—miR-122, miR-192, miR-33a, and miR-33b—in SLD patients compared to healthy controls. These micro-RNAs are critical regulators of lipid and carbohydrate metabolism, as well as liver fibrosis. Moreover, miR-122, miR-33a, and miR-33b are essential for cell proliferation and differentiation. Our earlier study indicated a possible role for miR-33a in impaired thermoregulation in humans [
4]. Building on this foundation, we expanded our research by increasing the patient sample size and refining the inclusion and exclusion criteria according to the latest MASLD guidelines to focus specifically on patients with SLD.
2. Patients and Methods
2.1. Patient Recruitment
We conducted a case-control study to investigate changes in plasma levels of miR-122, miR-192, miR-33a, and miR-33b among patients with ultrasound detected liver steatosis. Recruitment and sample collection occurred between 2020 and 2022, involving 48 patients from the Department II of Gastroenterology at the Fundeni Clinical Institute. Patients were recruited during outpatient visits based on the following inclusion criteria: age over 18 years, ability to understand and sign informed consent, diagnosis of fatty liver confirmed via ultrasound, and presence of obesity and non-insulin-dependent type 2 diabetes.
Exclusion criteria were: infectious hepatitis, autoimmune hepatitis, type 1 diabetes, insulin-dependent type 2 diabetes, recent therapy with pioglitazone or vitamin E, hemochromatosis, Wilson disease, and regular alcohol consumption (over 20g/day for females and over 30g/day for males).
To maintain consistency in sample collection and processing, all procedures adhered to a standardized protocol. Collected demographic and clinical data included age, weight, waist circumference, height, and a comprehensive range of laboratory assessments (e.g., glycated hemoglobin, C-reactive protein, transaminases, lipid profile, and viral markers). Blinding between patient recruitment and analysis was implemented to minimize potential bias.
2.2. Micro-RNA Quantification
Blood samples were collected from each patient using two 7 mL EDTA tubes. Plasma was isolated by centrifugation at 2,000g for 20 minutes and stored at −80°C until RNA extraction. MicroRNA levels were quantified using the MagMax Total RNA Extraction Kit (Catalog no. A27828, Applied Biosystems, Thermo Fisher Scientific). To normalize the data, 3 µL of cel-miR-39 (Sequence: UCACCGGGUGUAAAUCAGCUUG, Catalog no. 10620310, Applied Biosystems, Thermo Fisher Scientific), diluted to 2.34 pg/µL, was spiked in as an exogenous control.
Complementary DNA synthesis was performed using the TaqMan™ MicroRNA Reverse Transcription Kit (Catalog no. 4366597, Applied Biosystems, Thermo Fisher Scientific) with specific primers (Catalog no. 4427975, Applied Biosystems, Thermo Fisher Scientific). MiRNA expression levels were measured using qRT-PCR with the TaqMan™ Universal Master Mix II, no UNG (Catalog no. 4440048, Applied Biosystems, Thermo Fisher Scientific).
2.3. Steatosis Quantification
Ultrasound examinations were carried out using a Siemens ACUSON X700 with a 3.5-MHz transducer. We evaluated parenchymal echogenicity, liver texture, ultrasound attenuation, and visualization of the portal and hepatic veins. Liver health and steatosis grades were categorized as follows:
Grade 1 steatosis (slightly increased echogenicity),
Grade 2 steatosis (moderately increased echogenicity),
Grade 3 steatosis (markedly increased echogenicity).
2.4. Statistical Analysis
Statistical analyses were performed using R version 4.4.0. Normality of each variable’s distribution, including the Fib-4 score, BMI, abdominal circumference, triglycerides, and microRNAs, was assessed using the Shapiro-Wilk test. Distribution histograms were generated for BMI, abdominal circumference (separately for males and females), and triglycerides.
Pearson correlation tests were conducted to examine relationships between the variables (Fib-4, BMI, abdominal circumference, triglycerides) and each microRNA within the steatosis patients. Additional Pearson correlation tests were performed for all pairs of microRNAs. Scatterplots with linear regression lines and R² values were generated to illustrate these relationships.
ANOVA was used to analyze differences in microRNA expression levels across age groups (20-35, 35-50, 50-65, 65+). Boxplots were created to compare microRNA expression levels between these age groups. Significant differences were annotated on the plots, and independent-samples t-tests were used to compare the means of each microRNA between age groups.
All statistical analyses and visualizations were performed using R version 4.4.0 in the RStudio IDE.
4. Results
According to the Delphi consensus all of our recruited patients met at least one cardiometabolic criteria for MASLD. [
20]. All of them had a body mass index (BMI)>25kg/m
2and an abdominal circumference>94cm in men and >80cm in women. Prediabetes or diabetes were diagnosed in 8 out of 48 cases. Most of them (30) had elevated triglycerides plasma levels. Elevated blood pressure was identified in 8 patients
At least 1 out of 5:
BMI ≥ 25 kg/m² [23 Asia] OR WC ≥ 94 cm (M) 80 cm (F) or ethnicity adjusted
Fasting serum glucose ≥ 5.6 mmol/L [100 mg/dL] OR 2-hour post-load glucose levels ≥ 7.8 mmol/L [≥ 140 mg/dL] OR HbA1c ≥ 5.7% [39 mmol/mol] OR type 2 diabetes OR treatment for type 2 diabetes
Blood pressure ≥ 130/85 mmHg OR specific antihypertensive drug treatment
Plasma triglycerides ≥ 1.70 mmol/L [150 mg/dL] OR lipid lowering treatment
Plasma HDL-cholesterol ≤ 1.0 mmol/L [40 mg/dL] (M) and 1.3 mmol/L [50 mg/dL] (F) OR lipid lowering treatment
Table 1.
Summary Statistics and Prevalence of MASLD Criteria. This table presents the minimum, maximum, average, and standard deviation (SD) values for various criteria related to MASLD (Metabolic Associated Steatotic Liver Disease), along with the percentage of individuals meeting each criterion. The criteria include BMI, central adiposity measurements for men (AC Male) and women (AC Female), blood glucose levels, hypertension status, triglyceride levels, LDL cholesterol levels for men (LDL-C Male) and women (LDL-C Female), and lipid treatment status.
| MASLD Criteria |
Min |
Max |
Average |
SD |
No (% of criteria) |
Criteria |
| BMI |
24.9 |
44 |
34.1 |
4.6 |
47 (97.9%) |
>25 |
| AC Male |
92 |
147 |
115.1 |
14.3 |
20 (95.2%) |
>94 |
| AC Female |
73 |
127 |
105.4 |
13.0 |
25 (92.6%) |
>80 |
| Glicemia |
75.4 |
282 |
112.4 |
37.3 |
25 (52.1%) |
>100 or DZ |
| Blood pressure |
- |
- |
- |
- |
8 (16.7%) |
>130/85 OR Treatment |
| Triglycerides |
62 |
440 |
172.8 |
76.8 |
30 (62.5%) |
>150 |
| LDL-C Male |
22.4 |
147 |
115.1 |
43.3 |
2 (9.5%) |
<40 |
| LDL-C Female |
73 |
127 |
105.4 |
12.1 |
3 (11.1%) |
<50 |
| Lipid Treatment |
- |
- |
- |
- |
2 (4.2%) |
Treatment |
Table 2.
Distribution of Patients Fulfilling MASLD Criteria Stratified by Sex. This table displays the number and percentage of male and female patients meeting different quantities of MASLD criteria. The distribution is categorized by the number of criteria met, ranging from 1 to 5. The overall percentages for each category are also provided. Columns represent: The number of MASLD criteria met by the patients (from 1 to 5). Rows represent: The breakdown by sex (male, female) and overall totals. Values represent: The count of patients and the corresponding percentage within each group who met the specified number of criteria. The data indicates how many patients met 1, 2, 3, 4, or all 5 MASLD criteria, highlighting differences in the distribution between male and female patients.
| No. of Criteria |
1 |
2 |
3 |
4 |
5 |
| Male |
4 (19%) |
7 (33.3%) |
6 (28.6%) |
3 (14.3%) |
1 (4.8%) |
| Female |
4 (14.8%) |
12 (44.4%) |
8 (29.6%) |
2 (7.4%) |
1 (3.7%) |
| Overall |
8 (16.7%) |
19 (39.6%) |
14 (29.2%) |
5 (10.4%) |
2 (4.2%) |
Table 3.
Distribution of Patients Fulfilling MASLD Criteria Stratified by Age Groups. This table illustrates the number and percentage of patients within different age groups who meet varying quantities of MASLD criteria. The distribution is categorized by the number of criteria met, ranging from 1 to 5. Columns represent: The number of MASLD criteria met by the patients (from 1 to 5). Rows represent: The breakdown by age groups (20-35, 35-50, 50-65, 65+). Values represent: The count of patients and the corresponding percentage within each age group who met the specified number of criteria. The data highlights how the number of MASLD criteria fulfilled varies across different age groups, providing insight into the prevalence and distribution of MASLD criteria among these groups.
| No. of Criteria |
1 |
2 |
3 |
4 |
5 |
| 20-35 |
3 (27.3%) |
5 (45.5%) |
2 (18.2%) |
1 (9.1%) |
- |
| 35-50 |
2 (22.2%) |
4 (44.4%) |
1 (11.1%) |
2 (22.2%) |
- |
| 50-65 |
3 (15.8%) |
4 (21.1%) |
8 (42.1%) |
2 (10.5%) |
2 (10.5%) |
| 65+ |
- |
6 (66.7%) |
3 (33.3%) |
- |
- |
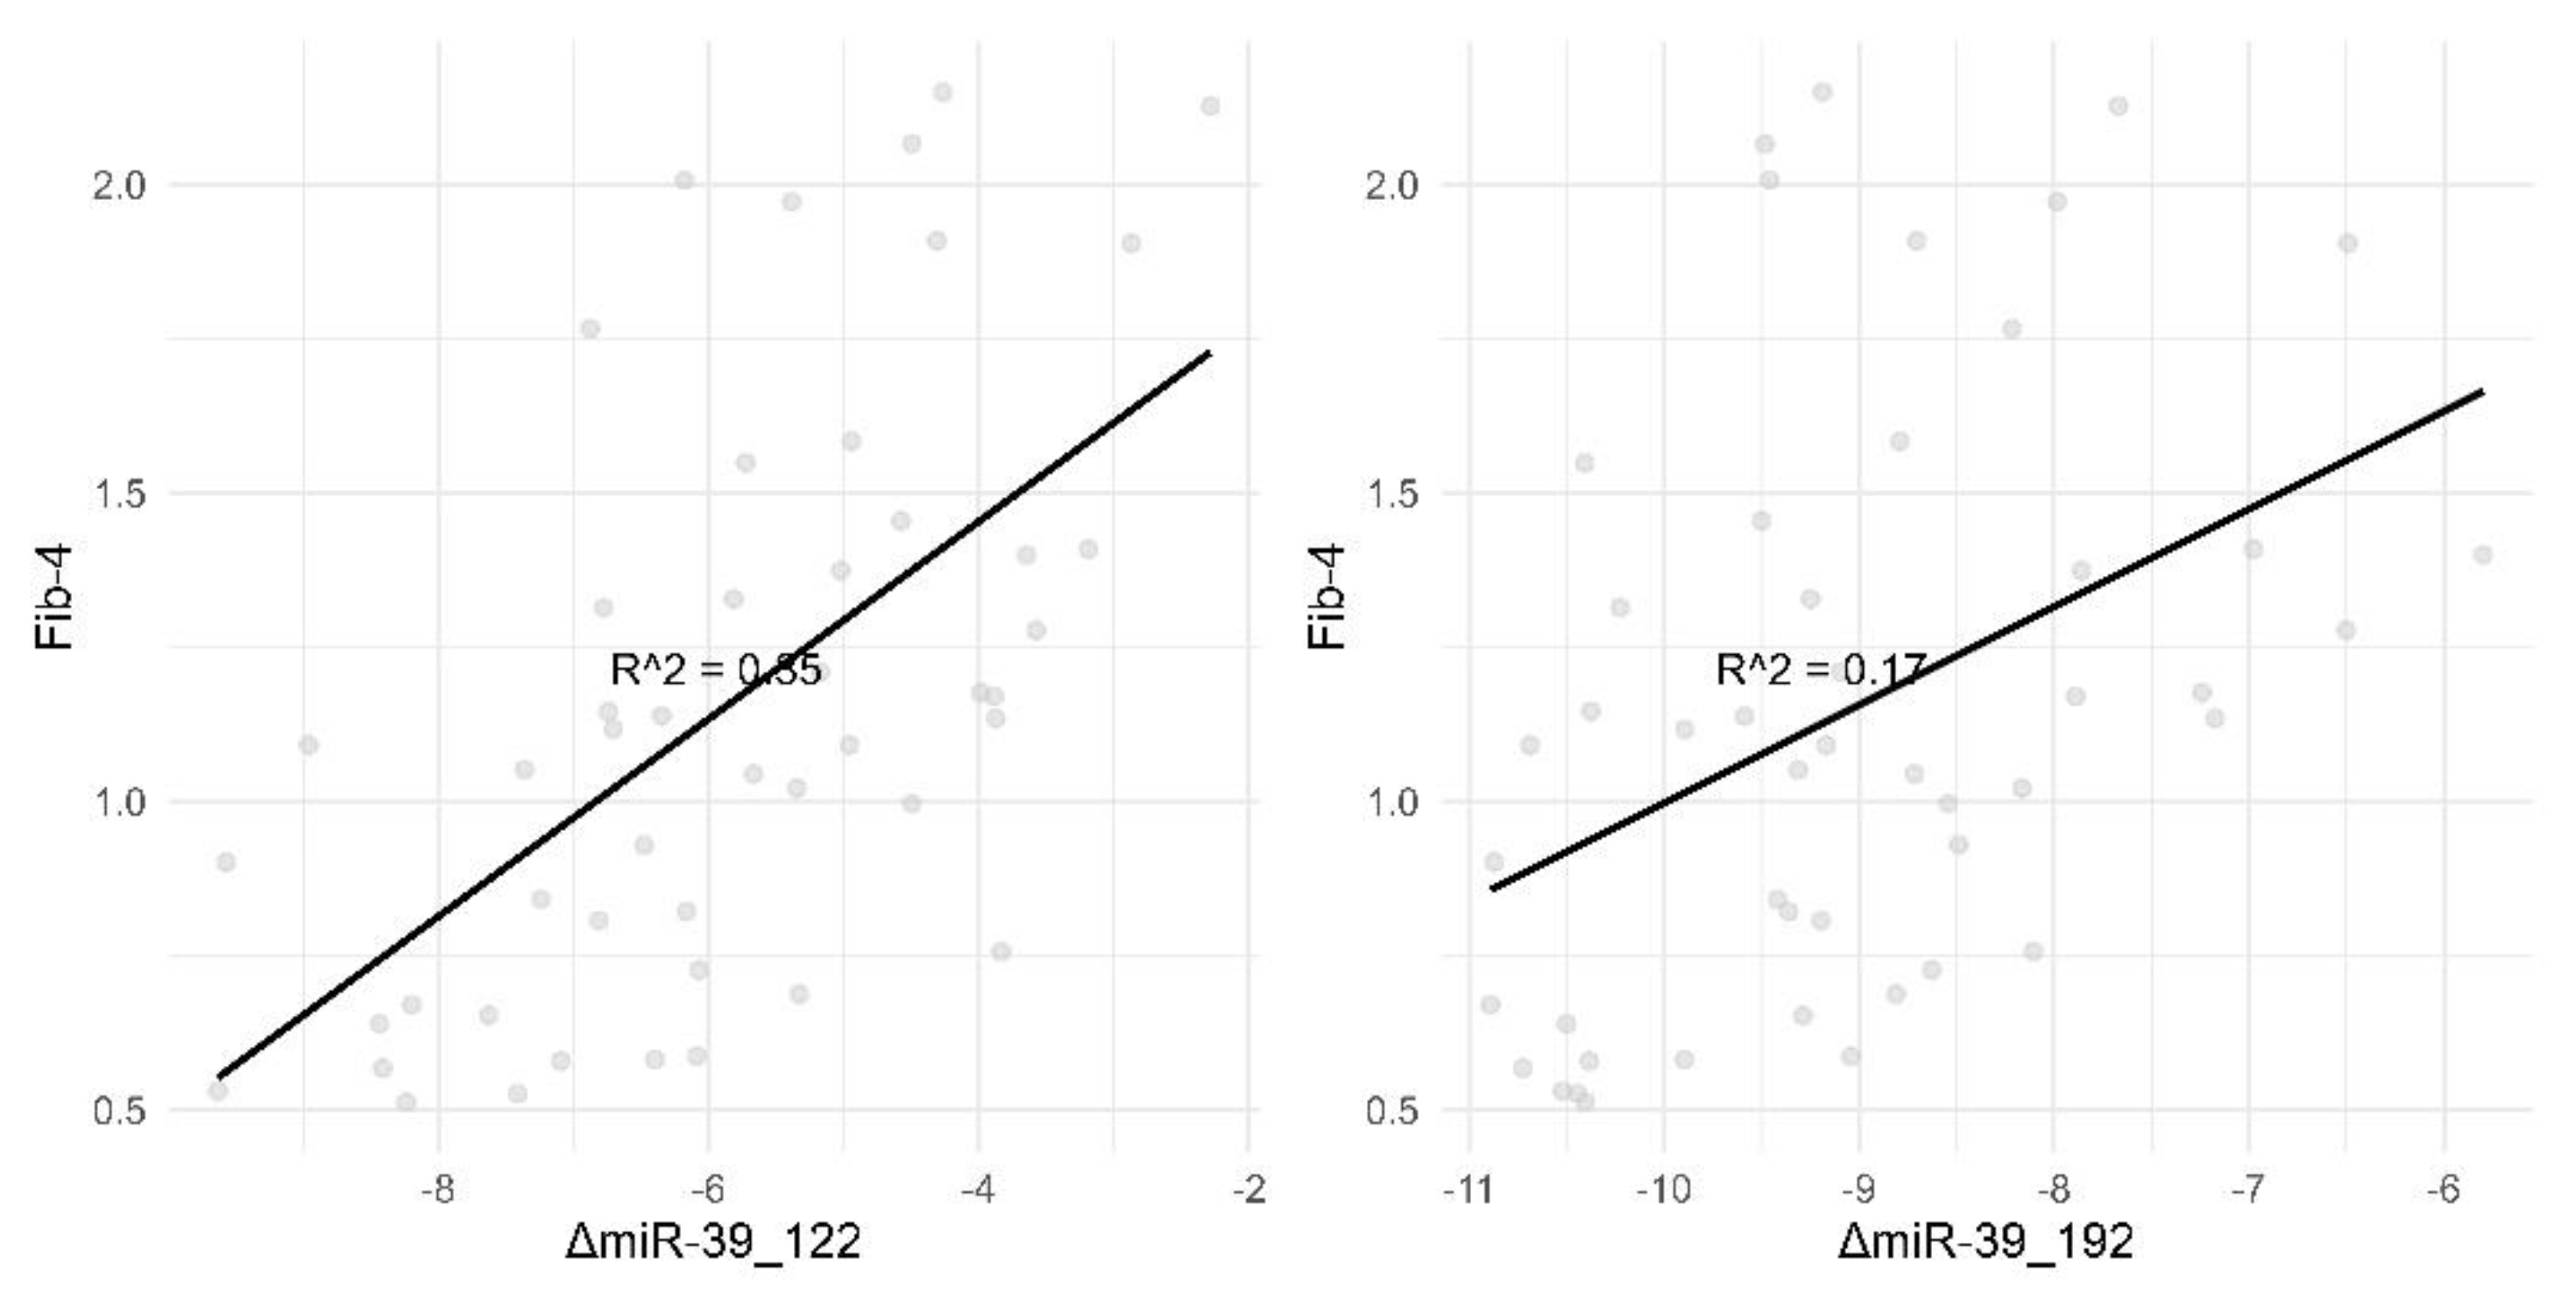
Figure 1.
Correlation of Fib-4 with ΔmiR-39_122 and ΔmiR-39_192. This figure illustrates the correlation between Fib-4 and two different miRNA markers, ΔmiR-39_122 and ΔmiR-39_192. Panel (A): Displays a scatter plot showing a strong positive correlation between Fib-4 and ΔmiR-39_122, with an R-squared value of 0.42. This suggests that changes in miR-39_122 are strongly associated with changes in Fib-4 levels. Panel (B): Shows a scatter plot depicting a relatively weaker positive correlation between Fib-4 and ΔmiR-39_192, with an R-squared value of 0.3. This indicates a moderate association between miR-39_192 changes and Fib-4 levels. Each data point represents individual measurements, and the black line represents the best fit line through the data points.
The correlation between micro-RNA plasma level and “classical “ biomarkers is strong or, in the worst case, it is moderate as seen in the
Figure 1.
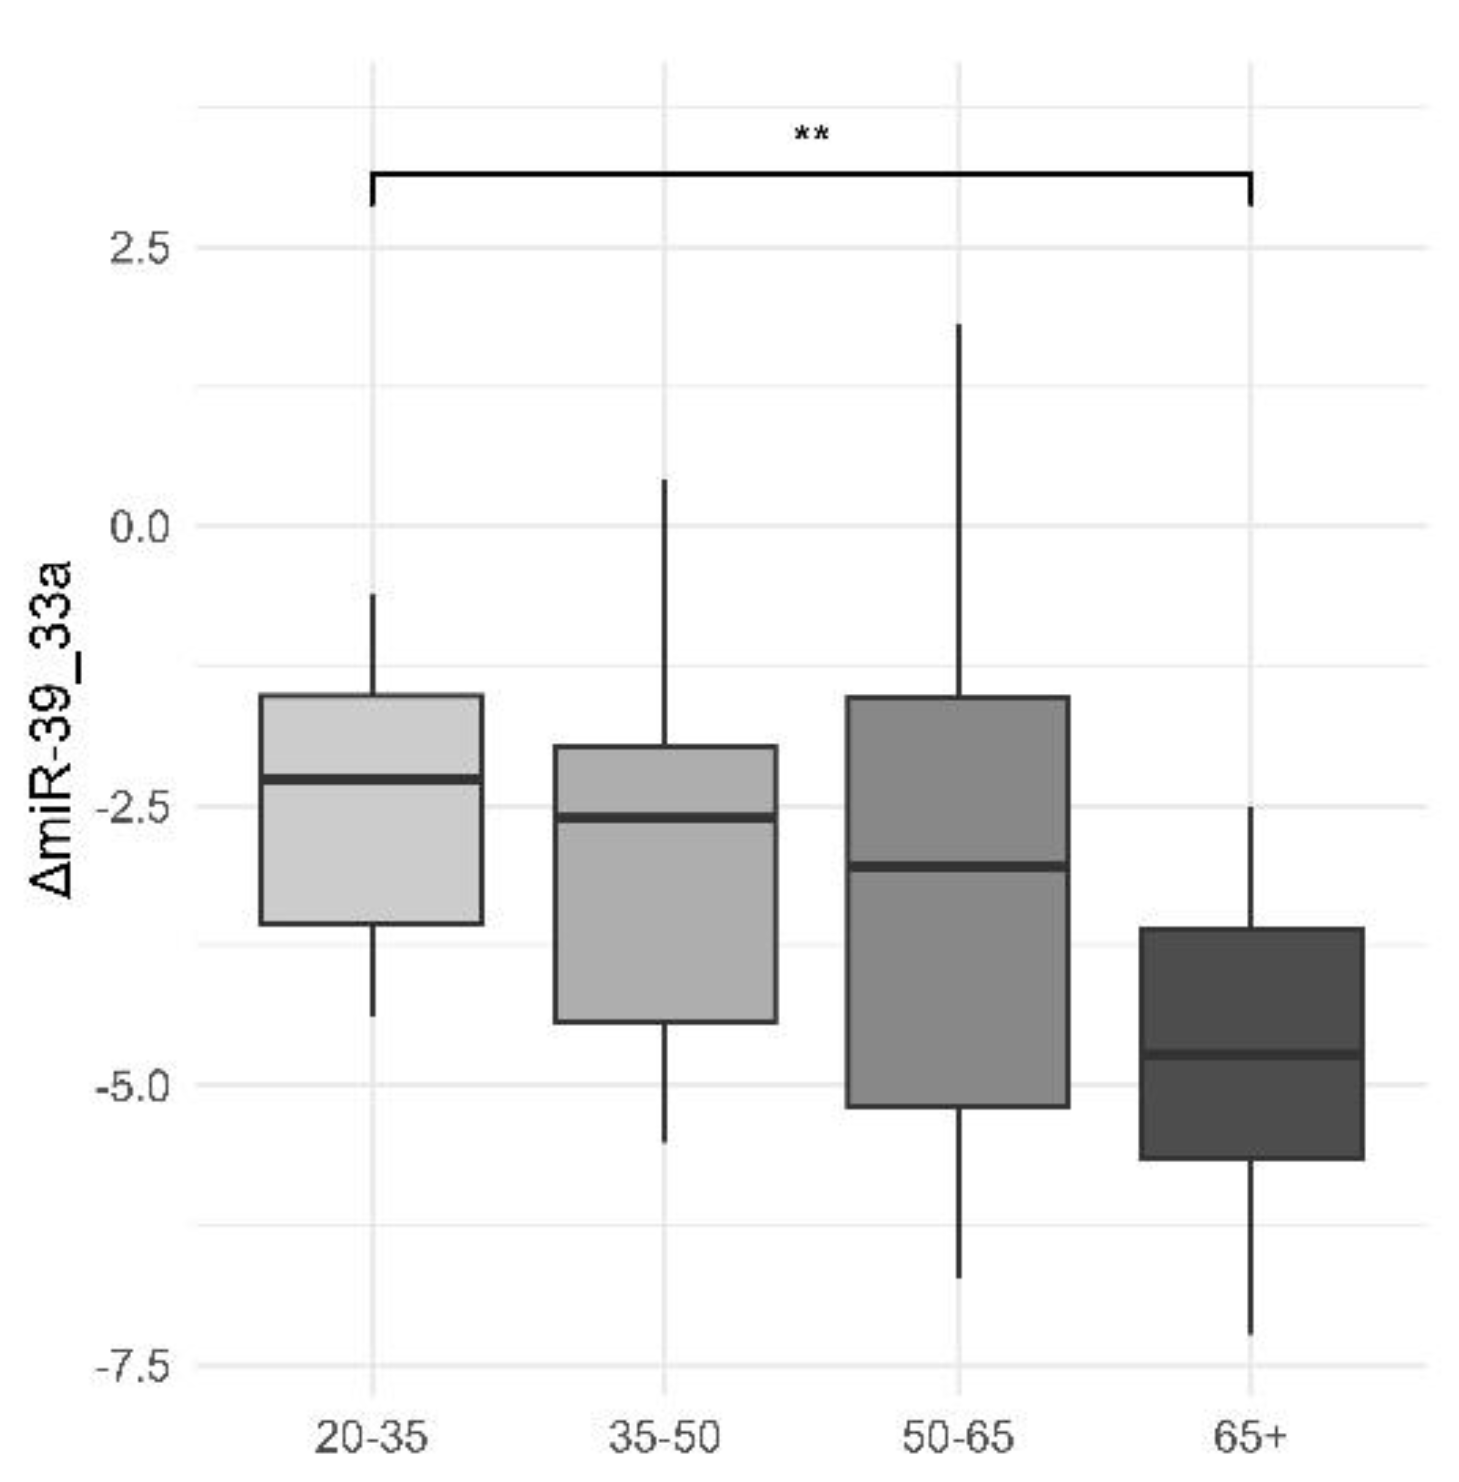
We divided our patients into age groups according the possible historical traumatic events they might have encountered. For example the 65+ group consists of patients born in the 1945-1955 period, a time of food deprivation due to prolonged drought (1945-1947) and war reparations to Soviet Union. One other subgroup is represented by patients born in the ‘80s (the 35-50y group), another period of food shortage in Romania.
We also noticed a slight downwards trend in ΔmiR-39_33a with increasing age, with a significant difference between the 20-35 and 65+ age groups. Correlations with age for ΔmiR-33a_33b, ΔmiR-33a_122 and ΔmiR-122_192 may be viewed in
Figure 2.
Figure 2.
Differences in Plasma Levels of ΔmiR-39_33a Across Age Groups. This boxplot demonstrates the distribution of plasma levels of ΔmiR-39_33a across different age groups. The age groups are divided into four categories: 20-35, 35-50, 50-65, and 65+. The y-axis represents the plasma levels of ΔmiR-39_33a. The box plot shows significant differences in plasma levels of ΔmiR-39_33a in the 65+ age group compared to the other age groups, with a p-value of 0.021 (marked by * on the boxplot) and a 95% confidence interval of 0.319-3.391. The median levels and the interquartile range are depicted by the boxes, while the whiskers show the range excluding outliers. This figure highlights that the 65+ age group has a notably different distribution of ΔmiR-39_33a levels compared to the younger age groups.Cred că asterixul de pe graphic se referă la *p-value< 0.05 dar trebuie văzut sigur.
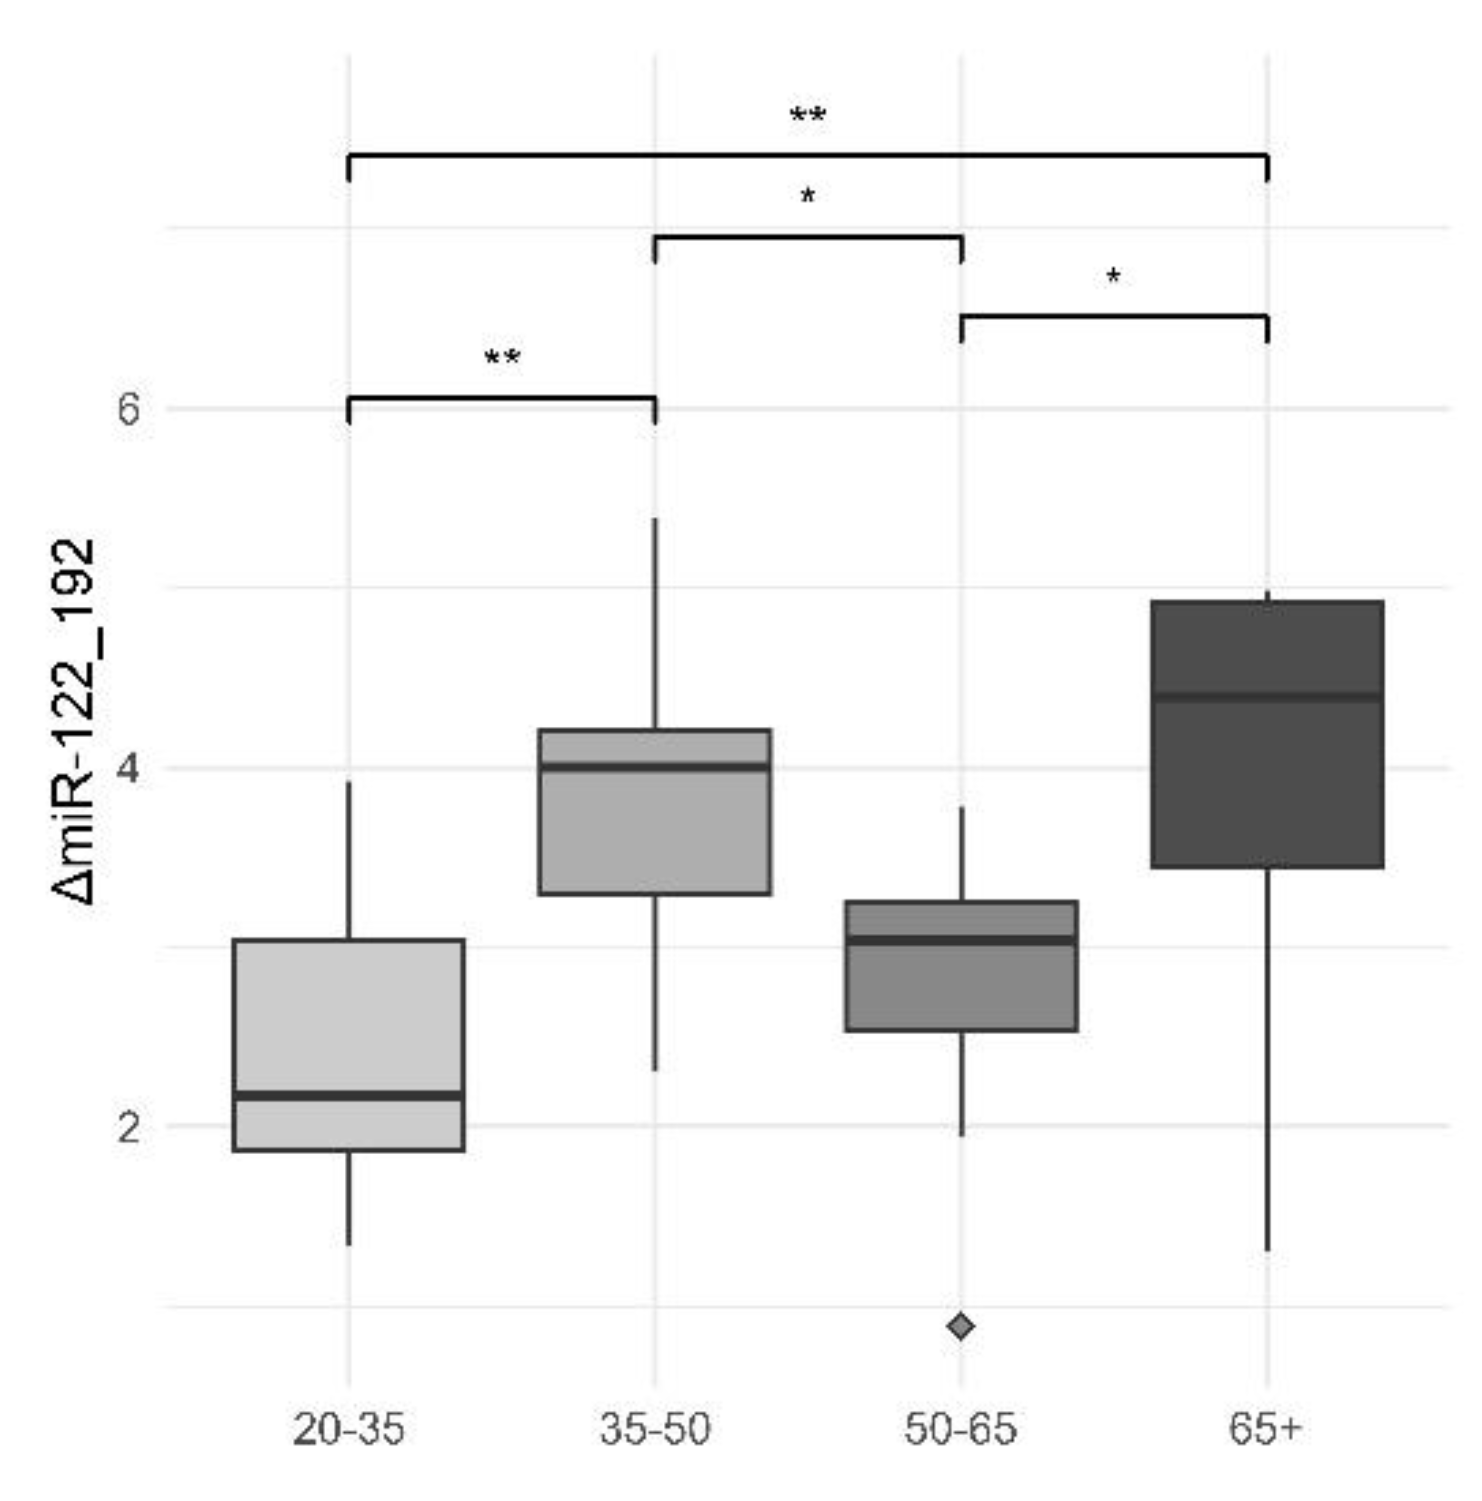
Another significant difference comes from intragroup comparisons for ΔmiR-122_192. As shown in our previous study , the explanation for this phenomenon could be the constant decrease of miR-122 and increase of miR-192 as liver steatosis is worsening [
4], together with the effect of traumatic historical events [
10].
Figure 3.
Plasma Levels of ΔmiR-122_192 Across Different Age Groups. This box plot demonstrates the distribution of plasma levels of ΔmiR-122_192 across four different age groups: 20-35, 35-50, 50-65, and 65+. The y-axis represents the plasma levels of ΔmiR-122_192. The age groups are displayed along the x-axis. The median levels and the interquartile range are depicted by the boxes, while the whiskers show the range excluding outliers. Outliers are presented as individual points. Significant differences are marked between certain groups, with asterisks denoting the level of statistical significance: ** indicates p < 0.01, * indicates p < 0.05. Both the “high risk” groups (65+ and 35-50 years) show significantly greater differences in ΔmiR-122_192 plasma levels compared to the less affected 50-65 years group, highlighting notable variances in miRNA expression associated with age and potential disease risk.
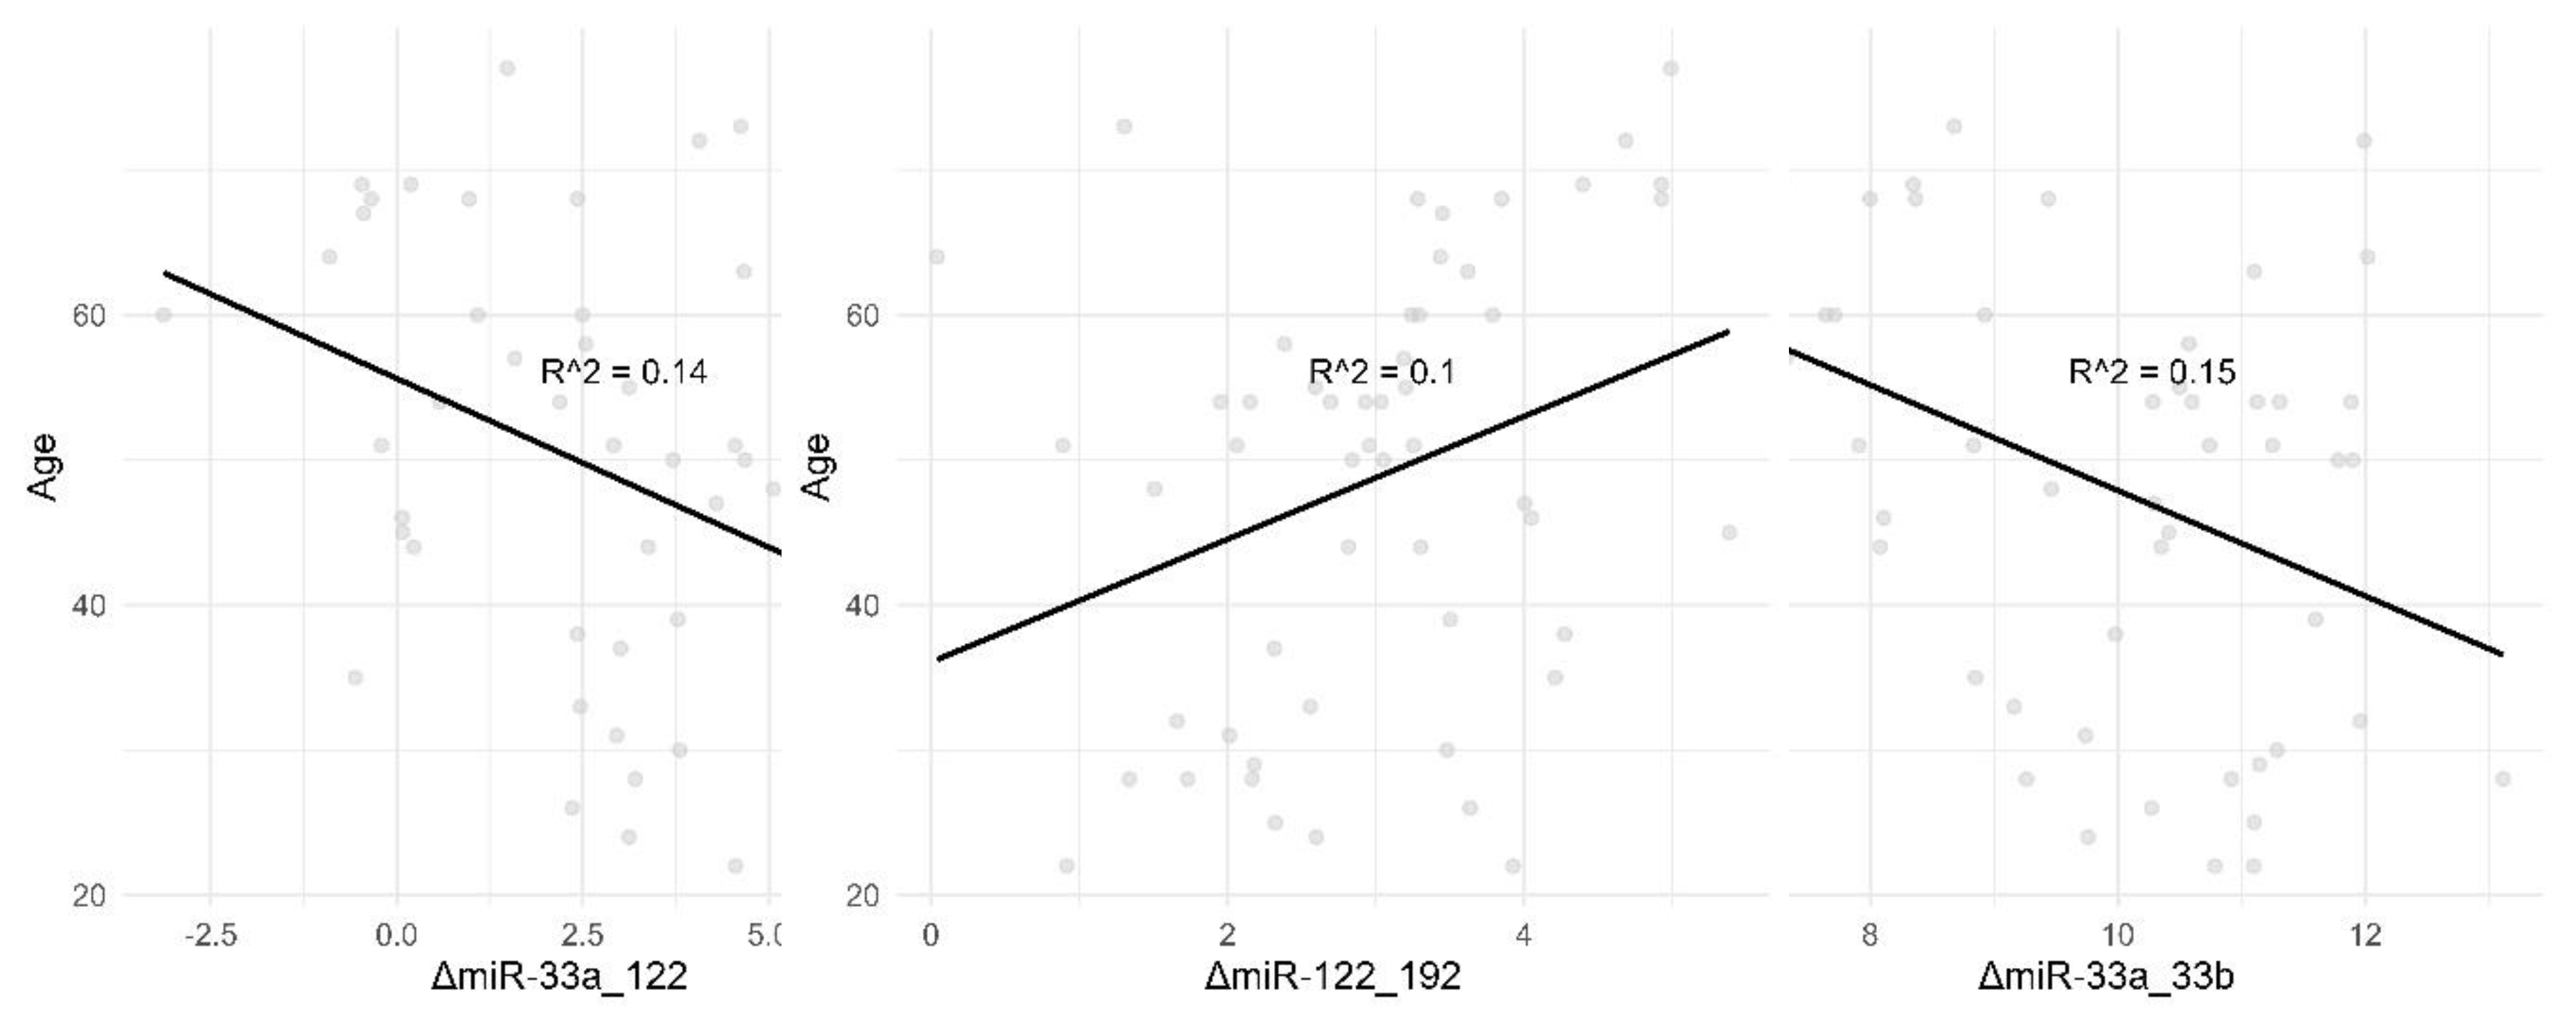
Figure 4.
Correlation Between Age and ΔmiR-33a_33b, ΔmiR-33a_122, ΔmiR-122_192. This figure illustrates the correlation between age and three different miRNA markers: ΔmiR-33a_33b, ΔmiR-33a_122, and ΔmiR-122_192. The data points represent individual measurements, and the black line represents the best fit line through the data points. The R-squared value (R^2) indicates the strength of the correlation. Panel A: Shows a scatter plot depicting the correlation between age and ΔmiR-33a_33b with an R-squared value of 0.15, indicating a weak negative correlation. Panel B: Displays a scatter plot showing the correlation between age and ΔmiR-33a_122 with an R-squared value of 0.14, indicating a weak negative correlation. Panel C: Illustrates a scatter plot depicting the correlation between age and ΔmiR-122_192 with an R-squared value of 0.1, indicating a weak positive correlation.
Table 4.
Statistical Comparison of Plasma Levels of ΔmiR-122_192 Between Age Groups. This table presents the results of t-tests comparing the plasma levels of ΔmiR-122_192 between various age groups. The comparisons include t-values, degrees of freedom (df), p-values, 95th percentile confidence intervals (low and high), and mean values for each age group. t_value: The calculated t-statistic for the comparison. df: Degrees of freedom for the t-test. p_value: The significance level of the comparison. low_95th and high_95th: The lower and upper bounds of the 95th percentile confidence interval. Subtype_1 and Subtype_2: The age groups being compared. Mean_1 and Mean_2: The mean plasma levels of ΔmiR-122_192 for the respective age groups. The table highlights significant differences in plasma levels of ΔmiR-122_192 between certain age groups, as indicated by p-values less than 0.05. These statistical comparisons correspond to the observations presented in Figure W, showing notable differences in miRNA expression across age groups.
| Subtype_1 |
Subtype_2 |
Mean_1 |
Mean_2 |
t_value |
df |
p_value |
low_95th |
high_95th |
| 20-35 |
35-50 |
2.480 |
3.760 |
-3.227 |
16.865 |
0.005 |
-2.118 |
-0.443 |
| 50-65 |
65+ |
2.840 |
3.977 |
-2.653 |
10.635 |
0.023 |
-2.085 |
-0.190 |
| 35-50 |
50-65 |
3.760 |
2.840 |
2.708 |
12.669 |
0.018 |
0.184 |
1.657 |
| 20-35 |
50-65 |
2.480 |
2.840 |
-1.183 |
17.564 |
0.252 |
-1.000 |
0.280 |
| 35-50 |
65+ |
3.760 |
3.977 |
-0.435 |
14.879 |
0.670 |
-1.281 |
0.847 |
| 20-35 |
65+ |
2.480 |
3.977 |
-3.151 |
14.178 |
0.007 |
-2.515 |
-0.479 |
5. Discussion
All our selected SLD (Steatosis Liver Disease) patients met at least one criterion for MASLD (Metabolic-Associated Steatosis Liver Disease). Specifically, all were overweight or obese, with many also presenting with prediabetes, diabetes, or arterial hypertension.
Our findings regarding the micro-RNAs in the 20-35 age group, compared to the “high-risk” groups (35-50 years and 65+ years), appear to validate our initial hypothesis from 2020. There are strong to moderate correlations with classical biomarkers (e.g., ΔmiR-39_122 and ΔmiR-39_192 vs. Fib-4). Notably, high-risk groups exhibit a significant and consistent decrease in miR-122 serum levels compared to low-risk, young controls. In contrast, serum levels of miR-192 significantly increase in the high-risk group relative to controls [
4].
Another noteworthy finding is the abnormal level of miR-33a, significantly lower in the 65+ group compared to controls. As demonstrated in our previous study [
4], low miR-33a levels may correlate with ineffective thermoregulation. This discrepancy in miR-33a levels between low-risk and high-risk generations becomes more comprehensible when considering fetal exposure to a low-calorie diet, potentially resulting in thermoregulatory defects in adulthood. Such an epigenetic program, although adaptive in a context of scarcity, has become maladaptive in post-1990 environments characterized by abundance. It may take an additional 2-3 generations to adapt and regain thermoregulatory efficiency under cold exposure.
Caloric and nutrient deficiencies during fetal life do not necessitate high levels of miR-122, which are essential for liver proliferation and differentiation. Persistently low miR-122 levels into adulthood could explain the metabolic abnormalities observed in high-risk groups and the universal MASLD presence among our patients, more pronounced in higher-risk groups.
Elevated serum miR-192 levels can be understood within the context of chronic inflammation driven by leaky gut, metabolic abnormalities, and a predisposition to fibrosis as a defective liver injury repair mechanism. These patients might benefit from caloric restriction and intermittent fasting as a means to address metabolic comorbidities, possibly rectifying the aberrant intrauterine epigenetic programming.
While this study provides valuable insights into the role of microRNAs and epigenetic factors in steatotic liver disease (SLD), several limitations should be considered:
Sample Size: The relatively small sample size of 48 patients may limit the generalizability of our findings. Larger studies are necessary to confirm the associations observed and to strengthen the statistical power of the results.
Control Group Matching: Although efforts were made to match controls with patients based on demographic characteristics, residual confounding factors may still exist. Further studies with more rigorous matching criteria are recommended.
Cross-Sectional Design: The cross-sectional nature of this study limits the ability to infer causality between miRNA expression and SLD progression. Longitudinal studies are needed to establish temporal relationships and causative links.
Single-Center Study: Conducting the study at a single clinical institute may introduce location-specific biases. Multi-center studies are required to enhance the external validity of the findings.
Measurement Variability: While standardized protocols were used for sample collection and miRNA quantification, there may be inherent variability in measurement techniques. Future studies should aim to replicate findings using different methodologies to ensure robustness.
Epigenetic Analysis Scope: The study focused on a limited number of miRNAs and did not explore the full spectrum of epigenetic modifications potentially involved in SLD. Comprehensive epigenetic profiling could provide a more holistic understanding of the disease.
Nutritional History Data: Detailed historical nutritional data were not available for all participants, which could affect the interpretation of the influence of past nutritional imbalances on miRNA expression and SLD risk.
6. Conclusions
Some findings were unforeseen, reaffirming our 2020 hypothesis on the role of epigenetic factors in MASLD. Future research should aim to recruit more SLD patients and expand the control group to enhance the robustness of the study. Investigating microRNA dynamics in response to specific diets, such as low-calorie or intermittent fasting, could provide valuable insights. Additionally, studying how different foods might influence intrauterine development by simulating conditions of scarcity could help confirm the initial epigenetic programming and offer new perspectives on reversing metabolic dysregulations in SLD patients.
Developing and validating diagnostic tools that utilize miR-122, miR-192, and miR-33a levels for early detection of MASLD, and differentiating between various stages of liver disease, could potentially enhance early intervention strategies. Our findings are in line with emerging directions reported in 2025, in which circulating miRNAs and EV-miRNAs are considered promising biomarkers for MASLD diagnosis and monitoring [
21]. Exploring therapeutic approaches to modulate the expression of key microRNAs, such as miR-122 and miR-33a, through small molecules, gene therapy, or lifestyle interventions might offer new treatment options for MASLD. In particular, miR-122 and miR-33a remain at the forefront, not only for their role in hepatic metabolism but also for their prognostic value in preventing progression toward MASH or hepatocellular carcinoma[
22]. Experimental approaches like anti-miR-33 therapies indicate perspectives for personalized epigenetic treatments, especially in HCC [
23].
Future studies should also examine the role of specific micronutrients in influencing microRNA expression and liver health, which could lead to the development of micronutrient-based interventions to optimize microRNA profiles and mitigate MASLD risk. The effects of different dietary patterns, like Mediterranean or ketogenic diets, on microRNA expression and liver health in diverse populations could be explored to identify diets effective in preventing or managing MASLD.
In clinical practice and public health, the development of personalized nutrition plans based on individual microRNA profiles could be investigated as a means to prevent and manage MASLD. This approach may improve treatment outcomes by tailoring dietary recommendations to the patient’s genetic and epigenetic background. Public health initiatives could focus on raising awareness about the importance of early life nutrition and its long-term impact on metabolic health, potentially influencing policy changes and promoting preventive measures.
Technological advancements, such as high-throughput microRNA analysis, could be utilized to analyze large cohorts and identify additional microRNAs involved in MASLD, facilitating the discovery of new biomarkers and therapeutic targets. Additionally, leveraging artificial intelligence and machine learning to analyze complex datasets could uncover patterns in microRNA expression and predict disease outcomes, enhancing precision medicine strategies for MASLD. Recent reviews also emphasize the importance of a multidimensional approach, including AI and multiomics integration, to identify high-risk patient subgroups and to optimize prevention strategies [
24].
Author Contributions
Conceptualization, Victor Stoica, Ileana Constantinescu.; methodology, Victor Stoica, Dimitri Apostol.; software, Dimitri Apostol.; validation, Victor Stoica, Ileana Constantinescu, Mircea Diculescu, Mircea Mănuc, Simoiu Mădălina.; formal analysis, Codruta Radu, Simoiu Mădălina; investigation, Victor Stoica; resources, Ileana Constantinescu; data curation, Dimitri Apostol, Simoiu Mădălina, Codruta Radu; writing—original draft preparation Victor Stoica, Dimitri Apostol.; writing—review and editing, Victor Stoica, Simoiu Mădălina; visualization Mircea Diculescu, Mircea Mănuc.; supervision, Ileana Constantinescu; project administration Ileana Constantinescu.; funding acquisition, Ileana Constantinescu.
Funding
This research was funded by Fundeni Clinical Institute
Institutional Review Board Statement
The study was conducted in accordance with the Declaration of Helsinki, and approved by the Institutional Ethics Committee of Fundeni Clinical Institute nr. 55046 from November 8th 2019
Informed Consent Statement
Informed consent was obtained from all subjects involved in the study.
Data Availability Statement
We encourage all authors of articles published in MDPI journals to share their research data. In this section, please provide details regarding where data supporting reported results can be found, including links to publicly archived datasets analyzed or generated during the study. Where no new data were created, or where data is unavailable due to privacy or ethical restrictions, a statement is still required. Suggested Data Availability Statements are available in section “MDPI Research Data Policies” at
https://www.mdpi.com/ethics.
Acknowledgments
Publication of this paper was supported by the University of Medicine and Pharmacy Carol Davila, through the institutional program Publish not Perish
Conflicts of Interest
The authors declare no conflicts of interest.
References
- Morishita et al., “MicroRNAs and Nonalcoholic Steatohepatitis: A Review,” Int. J. Mol. Sci., vol. 24, no. 19, 2023. [CrossRef]
- S. Khanmohammadi, B. Ramos-Molina, and M. S. Kuchay, “NOD-like receptors in the pathogenesis of metabolic (dysfunction)-associated fatty liver disease: Therapeutic agents targeting NOD-like receptors,” Diabetes Metab. Syndr. Clin. Res. Rev., vol. 17, no. 7, p. 102788, Jul. 2023. [CrossRef]
- J. S. Rodríguez-Sanabria, R. Escutia-Gutiérrez, R. Rosas-Campos, J. S. Armendáriz-Borunda, and A. Sandoval-Rodríguez, “An update in epigenetics in metabolic-associated fatty liver disease,” Front. Med., vol. 8, p. 770504, 2022.
- V. C. Stoica et al., “Time for micro-RNAs in steatotic liver disease: a case–control study,” Front. Endocrinol., vol. 15, p. 1349524, 2024.
- T. Payet, E. Gabinaud, J.-F. Landrier, and L. Mounien, “Role of micro-RNAs associated with adipose-derived extracellular vesicles in metabolic disorders,” Obes. Rev., vol. n/a, no. n/a, p. e13755, Apr. 2024. [CrossRef]
- Y. Sun, Y. Shen, X. Liang, H. Zheng, and Y. Zhang, “MicroRNAs as Biomarkers and Therapeutic Targets for Nonalcoholic Fatty Liver Disease: A Narrative Review,” Clin. Ther., vol. 45, no. 3, pp. 234–247, Mar. 2023. [CrossRef]
- H. M. Ragab et al., “Significance of MiRNA-34a and MiRNA-192 as a risk factor for nonalcoholic fatty liver disease,” J. Genet. Eng. Biotechnol., vol. 21, no. 1, p. 13, Dec. 2023. [CrossRef]
- S. Miyagawa et al., “Inhibition of microRNA-33b in humanized mice ameliorates nonalcoholic steatohepatitis,” Life Sci. Alliance, vol. 6, no. 8, p. e202301902, Aug. 2023. [CrossRef]
- J. Wang, S. Bao, Q. An, C. Li, and J. Feng, “Roles of extracellular vesicles from different origins in metabolic-associated fatty liver disease: progress and perspectives,” Front. Immunol., vol. Volume 16-2025, 2025, [Online]. Available: https://www.frontiersin.org/journals/immunology/articles/10.3389/fimmu.2025.1544012.
- V. Stoica, D. A. Gardan, I. Constantinescu, I. P. Gardan, B. Calenic, and M. Diculescu, “Transgenerational effects of traumatic historical events on the incidence of metabolic syndrome/nonalcoholic fatty liver disease in the romanian population,” J. Med. Life, vol. 13, no. 4, p. 475, 2020.
- M. E. Rinella et al., “A multisociety Delphi consensus statement on new fatty liver disease nomenclature,” Hepatology, vol. 78, no. 6, pp. 1966–1986, 2023.
- World Health Organization, “Prevalence of obesity among adults, BMI ≥ 30 (age-standardized estimate),” World Health Organization, 2024. Accessed: Jul. 13, 2025. [Online]. Available: https://openknowledge.fao.org/server/api/core/bitstreams/b64a7d04-6d70-488d-95e8-8a9beabb7483/content.
- M. Kalligeros, A. Vassilopoulos, S. Vassilopoulos, D. W. Victor, E. Mylonakis, and M. Noureddin, “Prevalence of Steatotic Liver Disease (MASLD, MetALD, and ALD) in the United States: NHANES 2017–2020,” Clin. Gastroenterol. Hepatol., Nov. 2023. [CrossRef]
- A. Trifan et al., “Simultaneously Screening for Liver Steatosis and Fibrosis in Romanian Type 2 Diabetes Mellitus Patients Using Vibration-Controlled Transient Elastography with Controlled Attenuation Parameter,” Diagnostics, vol. 12, no. 7, 2022. [CrossRef]
- N. W. S. Chew, X. Hui Pan, B. Chong, C. Chandramouli, M. Muthiah, and C. S. P. Lam, “Type 2 diabetes mellitus and cardiometabolic outcomes in metabolic dysfunction-associated steatotic liver disease population,” Diabetes Res. Clin. Pract., p. 111652, Apr. 2024. [CrossRef]
- A. Vaiserman and O. Lushchak, “Prenatal famine exposure and adult health outcomes: an epigenetic link,” Environ. Epigenetics, vol. 7, no. 1, p. dvab013, Nov. 2021. [CrossRef]
- K. Grey et al., “Severe malnutrition or famine exposure in childhood and cardiometabolic non-communicable disease later in life: a systematic review,” BMJ Glob. Health, vol. 6, no. 3, p. e003161, 2021.
- K. Stevenson, K. A. Lillycrop, and M. J. Silver, “Fetal programming and epigenetics,” Fetal Program., vol. 13, pp. 1–6, Aug. 2020. [CrossRef]
- E. Capobianco and I. Pirrone, “Paternal programming of fetoplacental and offspring metabolic disorders,” Trophobl. Res. - Vol. 41 2023, vol. 141, pp. 71–77, Sep. 2023. [CrossRef]
- M. E. Rinella et al., “A multisociety Delphi consensus statement on new fatty liver disease nomenclature,” Ann. Hepatol., vol. 29, no. 1, p. 101133, Jan. 2024. [CrossRef]
- Bhattacharya et al., “MicroRNA: A Novel Class of Potential Biomarkers and Therapeutic Target for Non-Alcoholic Fatty Liver Disease/Nonalcoholic Steatohepatitis,” MicroRNA, 2025. [CrossRef]
- F. Mahdizadeh, P. Sobhi, and S. Banaei, “A class of MicroRNAs as diagnostic biomarkers and therapeutic strategies in non-alcoholic fatty liver disease: A review,” Clin. Res. Hepatol. Gastroenterol., vol. 49, no. 4, p. 102547, Apr. 2025. [CrossRef]
- Q.-Y. Huang, Z.-Y. Zhou, Y.-L. Zhang, Y. Zhou, S.-W. Duan, and J.-Y. Dong, “Transfer RNA-derived small RNAs in liver disease,” Hepatobiliary Pancreat. Dis. Int., Jul. 2025. [CrossRef]
- H. Y. R. S. Huang Kai Markus; Schneider, Carolin, “Big Data Analytics in Large Cohorts: Opportunities and Challenges for Research in Hepatology,” Semin. Liver Dis., no. EFirst, May 2025. [CrossRef]
|
Disclaimer/Publisher’s Note: The statements, opinions and data contained in all publications are solely those of the individual author(s) and contributor(s) and not of MDPI and/or the editor(s). MDPI and/or the editor(s) disclaim responsibility for any injury to people or property resulting from any ideas, methods, instructions or products referred to in the content. |
© 2025 by the authors. Licensee MDPI, Basel, Switzerland. This article is an open access article distributed under the terms and conditions of the Creative Commons Attribution (CC BY) license (http://creativecommons.org/licenses/by/4.0/).