Submitted:
02 October 2025
Posted:
03 October 2025
You are already at the latest version
Abstract
Winter road icing poses significant safety risks, particularly on steep urban slopes with vulnerable populations. While summer heat stress indices such as UTCI, PMV, and PET are widely applied, no equivalent standard exists for winter road hazards. This study introduces and empirically validates two novel indices—Freezing Intensity (FI) and Cold Intensity (CI)—designed to quantify the likelihood and severity of road icing. A case study was conducted on Namgyeong-maeul Road in Daedeok-gu, Daejeon, South Korea, where IoT-based environmental monitoring, including automated weather stations, thermal cameras, and drone imaging, was deployed from December 2024 to January 2025. Results demonstrate that road heating systems (RHS) effectively increased surface temperatures by an average of 4.1 °C compared to non-heated segments, with maximum differences exceeding 12.5 °C. The FI of non-heated slopes reached critical levels above 2400, whereas heated roads reduced FI to near zero. Similarly, CI values dropped from hazardous levels (~12) to below 6 in heated zones, reducing icing severity by more than 50%. These findings confirm that FI and CI can serve as robust metrics for operational assessment of RHS performance, complementing traditional heat-related indices. By integrating FI and CI into monitoring and design, policymakers and engineers can establish data-driven activation thresholds, optimize energy efficiency, and ensure safer winter mobility for vulnerable groups. This research provides the first structured framework for winter road icing quantification, advancing climate adaptation strategies equivalent in rigor to summer climate indices.
Keywords:
winter icing
; freezing intensity (FI)
; cold intensity (CI)
; road heating system
; urban resilience
; IoT monitoring
; climate adaptation
; thermal imaging
1. Introduction
Winter road icing has emerged as a critical safety challenge in many urban areas, especially in regions increasingly affected by severe cold-season events due to climate change. Sloped urban roads are particularly vulnerable, creating hazardous conditions for both pedestrians and vehicles. In South Korea, the risks are especially acute for elderly residents, low-income households, and mobility-limited groups, who constitute a large proportion of winter-vulnerable populations. Conventional mitigation methods—such as de-icing salts and sand—are limited in effectiveness, environmentally harmful, and costly to maintain, As cities seek climate adaptation strategies, the need for systematic and quantitative approaches to assess and manage road icing risks has become urgent [1,2,3].
A representative case is Namgyeong-maeul Road in Daedeok-gu, Daejeon, which was selected as a pilot site for this study. The area is characterized by steep slopes exceeding 10%, dense residential development, and a high concentration of vulnerable groups, including the elderly and basic livelihood beneficiaries. Winter icing here frequently disrupts daily mobility and poses serious risks of slip-and-fall accidents as well as traffic collisions. Long-term climate data show that, despite the overall warming trend in South Korea, the frequency of extreme cold spells and snowfall events has increased, intensifying the risk of road icing. Socially, Daedeok-gu’s rising elderly population and limited emergency response capacity further amplify vulnerability, making the introduction of preventive infrastructure such as road heating systems (RHS) particularly urgent [4,5,6]. An aerial perspective of the study area—including slope and residential clustering—appears in the site overview (Figure 1).
Importantly, the RHS at Namgyeong-maeul Road was installed and operated by the Daejeon city government with financial support from the Korean Ministry of Environment, under a national program targeting climate-vulnerable neighborhoods. The Korea Environment Institute (KEI) was commissioned to conduct monitoring and evaluation of the system, deploying AWS, surface sensors, thermal imaging, drone surveys, and IP cameras to collect multi-modal real-world data [7,8,9].
While extensive attention has been devoted to quantifying summer heat stress using indices such as the Universal Thermal Climate Index (UTCI), Predicted Mean Vote (PMV), and Physiological Equivalent Temperature (PET), no standardized indices exist to evaluate cold-season hazards like road icing [10,11,12]. This absence of a structured winter equivalent has hindered proactive monitoring, real-time decision-making, and policy design for winter resilience.
To address this gap, this study introduces two indices—Freezing Intensity (FI) and Cold Intensity (CI)—which were specifically developed and validated through a pilot monitoring project on Namgyeong-maeul Road (Figure 2). FI quantifies the potential for icing occurrence based on surface and meteorological conditions, while CI measures the actual severity of icing by incorporating slope, sub-threshold temperatures, humidity, and heating operation. Both indices are grounded in formulas derived from field protocols, ensuring their applicability in real-world monitoring [13,14,15].
The objectives of this study are threefold: (1) to evaluate the real-world performance of RHS in reducing icing risks on steep urban roads, (2) to establish FI and CI as quantitative indices that can serve as a winter-season equivalent to existing summer climate indices, and (3) to provide evidence-based insights for policy and engineering applications that enhance mobility safety for vulnerable populations.
Through this work, FI and CI are proposed as foundational constructs for winter climate adaptation science, offering policymakers, engineers, and researchers new tools to improve safety, resilience, and sustainability in cold-season urban environments.
2. Materials and Methods
2.1. Study Site
The field study was conducted on Namgyeong-maeul 3rd Road (Site A) in Daedeok-gu, Daejeon, South Korea, a steep residential slope with a length of approximately 70 m and an average gradient of 11.9%. This site was chosen because it represents the most hazardous segment among three RHS-installed locations, and it has a high frequency of winter icing accidents. The surrounding residential area is densely populated with elderly residents and vulnerable groups, making safe mobility during winter a critical social concern. A site overview image highlighting the steep slope and residential clustering is provided (Figure 3).
- Heated section (RHS installed): equipped with embedded electric heating systems that automatically activate when surface or air temperature drops below 4 °C.
- Reference section (non-heated): immediately adjacent to the heated section, serving as a control under identical meteorological conditions. The delineation of heated versus reference sections and the placement of surface-temperature sensors are schematized (Figure 4).
Although Sites B and C were included in the overall project, only Site A was selected for quantitative FI and CI computation due to accessibility limitations [16]. Sites B and C were used for supplementary qualitative verification through drone and IP camera observations. Representative imagery for these verification activities is presented later in the Results (see Figure 11 and Figure 12).
2.2. Monitoring Instruments and Data Collection
We deployed a layered system from Dec 2024 to Jan 2025: AWS (air temperature, RH, wind, precipitation, radiation), surface temperature loggers, thermal imaging, UAV/drone surveys, and IP cameras for time-lapse states [7,8,9,17,18,19]. The modular monitoring assembly mounted on the utility pole (including AWS, snow sensor, camera, and communications) is shown (Figure 5). Sensor placement across the heated and reference sections with example thermal snapshots under RHS operation is illustrated (Figure 6).
- Automatic Weather Station (AWS, Ecowitt WS series): recorded air temperature, relative humidity, wind speed, precipitation, solar radiation, and UV index at 5-minute intervals.
- Surface Temperature Loggers (T&D TR-71WF): installed in both heated and reference lanes to measure pavement surface temperatures continuously.
- Thermal Imaging (FLIR E6): daily infrared images for visualizing surface temperature differences and de-icing progress.
- Drone Surveys (DJI Mini series): aerial imaging of Sites A–C after snowfall events to confirm de-icing effectiveness.
- IP Cameras: real-time continuous monitoring of icing and de-icing states.
Key parameters and devices are summarized in Table 1.
All sensors were networked to a cloud-based data server, with LTE communication modules for real-time transmission. The system remained operational throughout freezing conditions, with power backup and weather shielding. For this study, “freezing” was assumed when surface temperature ≤ 4 °C with concurrent precipitation (or snowfall sensor ON); dew-point/RH thresholds were referenced for context. Operational criteria used for index computation are compiled (Table 5).
- Sensors: Ecowitt WS69 AWS, T&D TR-71WF data loggers, FLIR E6 thermal camera, drone-based thermal surveys.
- Data Collection: Surface temperature, air temperature, humidity, wind speed, and precipitation were measured at 5-minute intervals from Dec 2024 to Jan 2025
- Comparison: Heated vs. non-heated road sections.
2.3. Freezing Intensity (FI)
The Freezing Intensity (FI) index was developed to quantify the potential for road surface icing by integrating meteorological and surface variables. Following the project’s protocol formula, FI is expressed as:
where:
: freezing trigger function (1 if threshold conditions are met, 0 otherwise)
: instantaneous road surface temperature (°C)
: average surface temperature during the observation period (°C)
: average relative humidity (%)
: precipitation factor (snow/rain intensity and type)
: wind speed factor (m/s)
A schematic of the variables and data flows used to compute FI is provided (Figure 7). FI interpretation follows a grading scheme (Table 3).
F: freezing occurrences counted from 5-min records within each hour when both precipitation is present (snow/rain) and the road surface temperature is ≤ 4 °C. T: total freezing duration per hour, derived from 5-min sampling (i.e., each counted occurrence corresponds to 5 min). : hourly average of road surface temperature at the icing site (°C). : hourly average relative humidity at the icing site (%). P: precipitation factor indicating the presence/intensity of snow/rain during the hour. W: wind factor indicating the presence/intensity of wind during the hour. Data are synchronized at 5-min intervals from AWS and surface loggers.
With (trigger), (surface °C), , , , > 1000 flags high icing potential [13,20]. FI is used as a probabilistic early-warning metric: higher FI means a higher likelihood of icing in the next hour and motivates proactive RHS activation (see the threshold classification, Table 3). Differences between the predictive FI and the evaluative CI are summarized for quick reference (Table 2).
The FI formula used in this study is a project-defined prototype index designed to predict icing potential from synchronized 5-min records (AWS and surface loggers). It counts freezing occurrences per hour when precipitation is present (snow/rain) and the road-surface temperature is ≤ 4 °C, and summarizes co-occurring humidity and wind factors for operational triggering.
2.4. Cold Intensity (CI)
The Cold Intensity (CI) index was formulated to measure the actual severity of icing conditions and the effectiveness of RHS operation. The project-defined formula is:
where:
- : RHS operation factor (heating energy applied; kWh)
- : slope coefficient (normalized by gradient; 1.0 for 10% slope)
- ,,,: as defined in formula
- Interpretation: values greater than 2.0 represent hazardous icing severity, while lower values indicate successful mitigation through RHS activation [13,20].A unified schematic for FI/CI variable linkages and monitoring layout is provided for reference (Figure 7). CI interpretation follows the classification in Table 3.
A: RHS operation factor reflecting heating application/energy during the hour (e.g., heater ON vs. reduced/idle), used to evaluate mitigation effectiveness. B: slope/road-condition coefficient representing site geometry (e.g., normalized by gradient for inclined sections); other symbols (F, T, P, W) follow the definitions in Section 2.3. CI is a severity index that integrates the observed freezing frequency/duration with site conditions (slope) and operation state of the road-heating system. The coefficients A (RHS operation) and B (slope/road condition) are calibrated for the project (e.g., A = 1 for heated, 0.5 for non-heated; B = 1.0 flat, 0.8 slope). CI is suited for after-the-event evaluation: it quantifies residual icing severity and the effectiveness of RHS; larger CI implies greater hazard, as illustrated in the worked example Figure 7.

Table 3.
Classification of FI and CI severity levels [20].
Table 3.
Classification of FI and CI severity levels [20].
| Range | Grade | Description |
|---|---|---|
| 0 ≤ FI ≤ 100 | Very Safe | Very low icing risk; RHS activation not required |
| 101 ≤ FI ≤ 500 | Caution | Mild icing risk; consider RHS activation |
| 501 ≤ FI ≤ 1000 | Risk | Moderate icing risk; RHS activation recommended |
| FI > 1000 | High Risk | Severe icing risk; immediate RHS activation needed |
| CI ≤ 0.5 | Very Safe | Very low icing severity |
| 0.6 ≤ CI ≤ 2.0 | Caution | Potential icing presence |
| 2.1 ≤ CI ≤ 5.0 | Risk | High icing severity |
| CI > 5.0 | High Risk | Severe icing severity; major safety risk |
Figure 7 Schematic of FI and CI computation with monitoring layout. An AWS provides air variables (precipitation, wind, humidity), while surface loggers measure pavement temperature at 5-min intervals in heated and reference sections. Variables used in Eq. (1), (2) are: F, T, , , P, W, A, B (see Section 2.3–2.4). Thermal/drone/IP-camera images are used to validate icing/de-icing states.
2.5. FI–CI Comparative Framework
2.6. Freezing Condition Criteria
To operate the indices, freezing was assumed when the following conditions were satisfied:
Road surface temperature ≤ 4 °C, and Precipitation (rain/snow) ≥ 1 mm/h or presence of snowfall sensor signal. dew point and RH thresholds modulate risk [22,23]. The criteria and contributing factors used in this study are summarized (Table 5).
| Factor | Description |
|---|---|
| Surface Temperature | ≤ 4 °C considered as freezing condition |
| Precipitation | Rain/snow ≥ 1 mm/h or snowfall sensor active |
| Dew Point | Freezing risk if dew point ≤ surface temperature |
| Humidity | ≥ 70% relative humidity increases icing probability |
| Example | At -5 °C surface temp, 0 °C air temp, 80% RH → icing at ~ -2.5 °C |
2.7. Data Processing and Analysis
5-min resolution; synchronized streams; FI/CI computed for both lanes; thermal/UAV/IP-camera cross-verification; gap analysis (heated vs. reference) [17,18,19,21].
- Resolution: All data were recorded at 5-minute intervals, synchronized across AWS and loggers.
- Computation: FI and CI values were calculated for both heated and reference lanes throughout the study period.
- Validation: Indices were cross-verified with thermal images, drone surveys, and CCTV footage to confirm actual icing and de-icing.
- Gap Analysis: FI and CI gaps (heated vs. reference) were calculated to quantify the improvement due to RHS installation. The end-to-end workflow—computation, validation, and gap analysis—is depicted (Figure 8).
Both FI and CI are project-specific operational indices proposed for this pilot; they are not adopted from prior literature verbatim and therefore require site/season calibration before wider deployment.
3. Results
Continuous monitoring of Site A (Namgyeong-maeul 3rd Road, Daedeok-gu, Daejeon) from 17 December 2024 to 14 January 2025 revealed substantial differences between the heated and reference road sections. Results are presented in five categories: (1) surface temperature comparison, (2) thermal/drone/IP camera verification, (3) FI analysis, (4) CI analysis, and (5) integrated gap evaluation.
Across the study period, all data streams (surface loggers, AWS, thermal images, UAV, and IP cameras) consistently indicated superior thermal performance and de-icing behavior in the heated lane. An overview of these multi-source results is visualized across the comparative time series and imaging panels (Figure 9, Figure 10, Figure 11, Figure 12, Figure 13 and Figure 14) and summarized in tables (Table 6, Table 7 and Table 8).
3.1. Surface Temperature Comparison
The heated section (RHS applied) consistently maintained higher surface temperatures compared to the untreated reference.
- The average surface temperature in the heated section was 4.1 °C higher than the reference.
- During peak cold events, the maximum difference exceeded 12.5 °C, and the minimum temperature gap was ~5.3 °C.
3.2. Thermal Imaging and Drone Verification
Independent monitoring further validated quantitative observations.
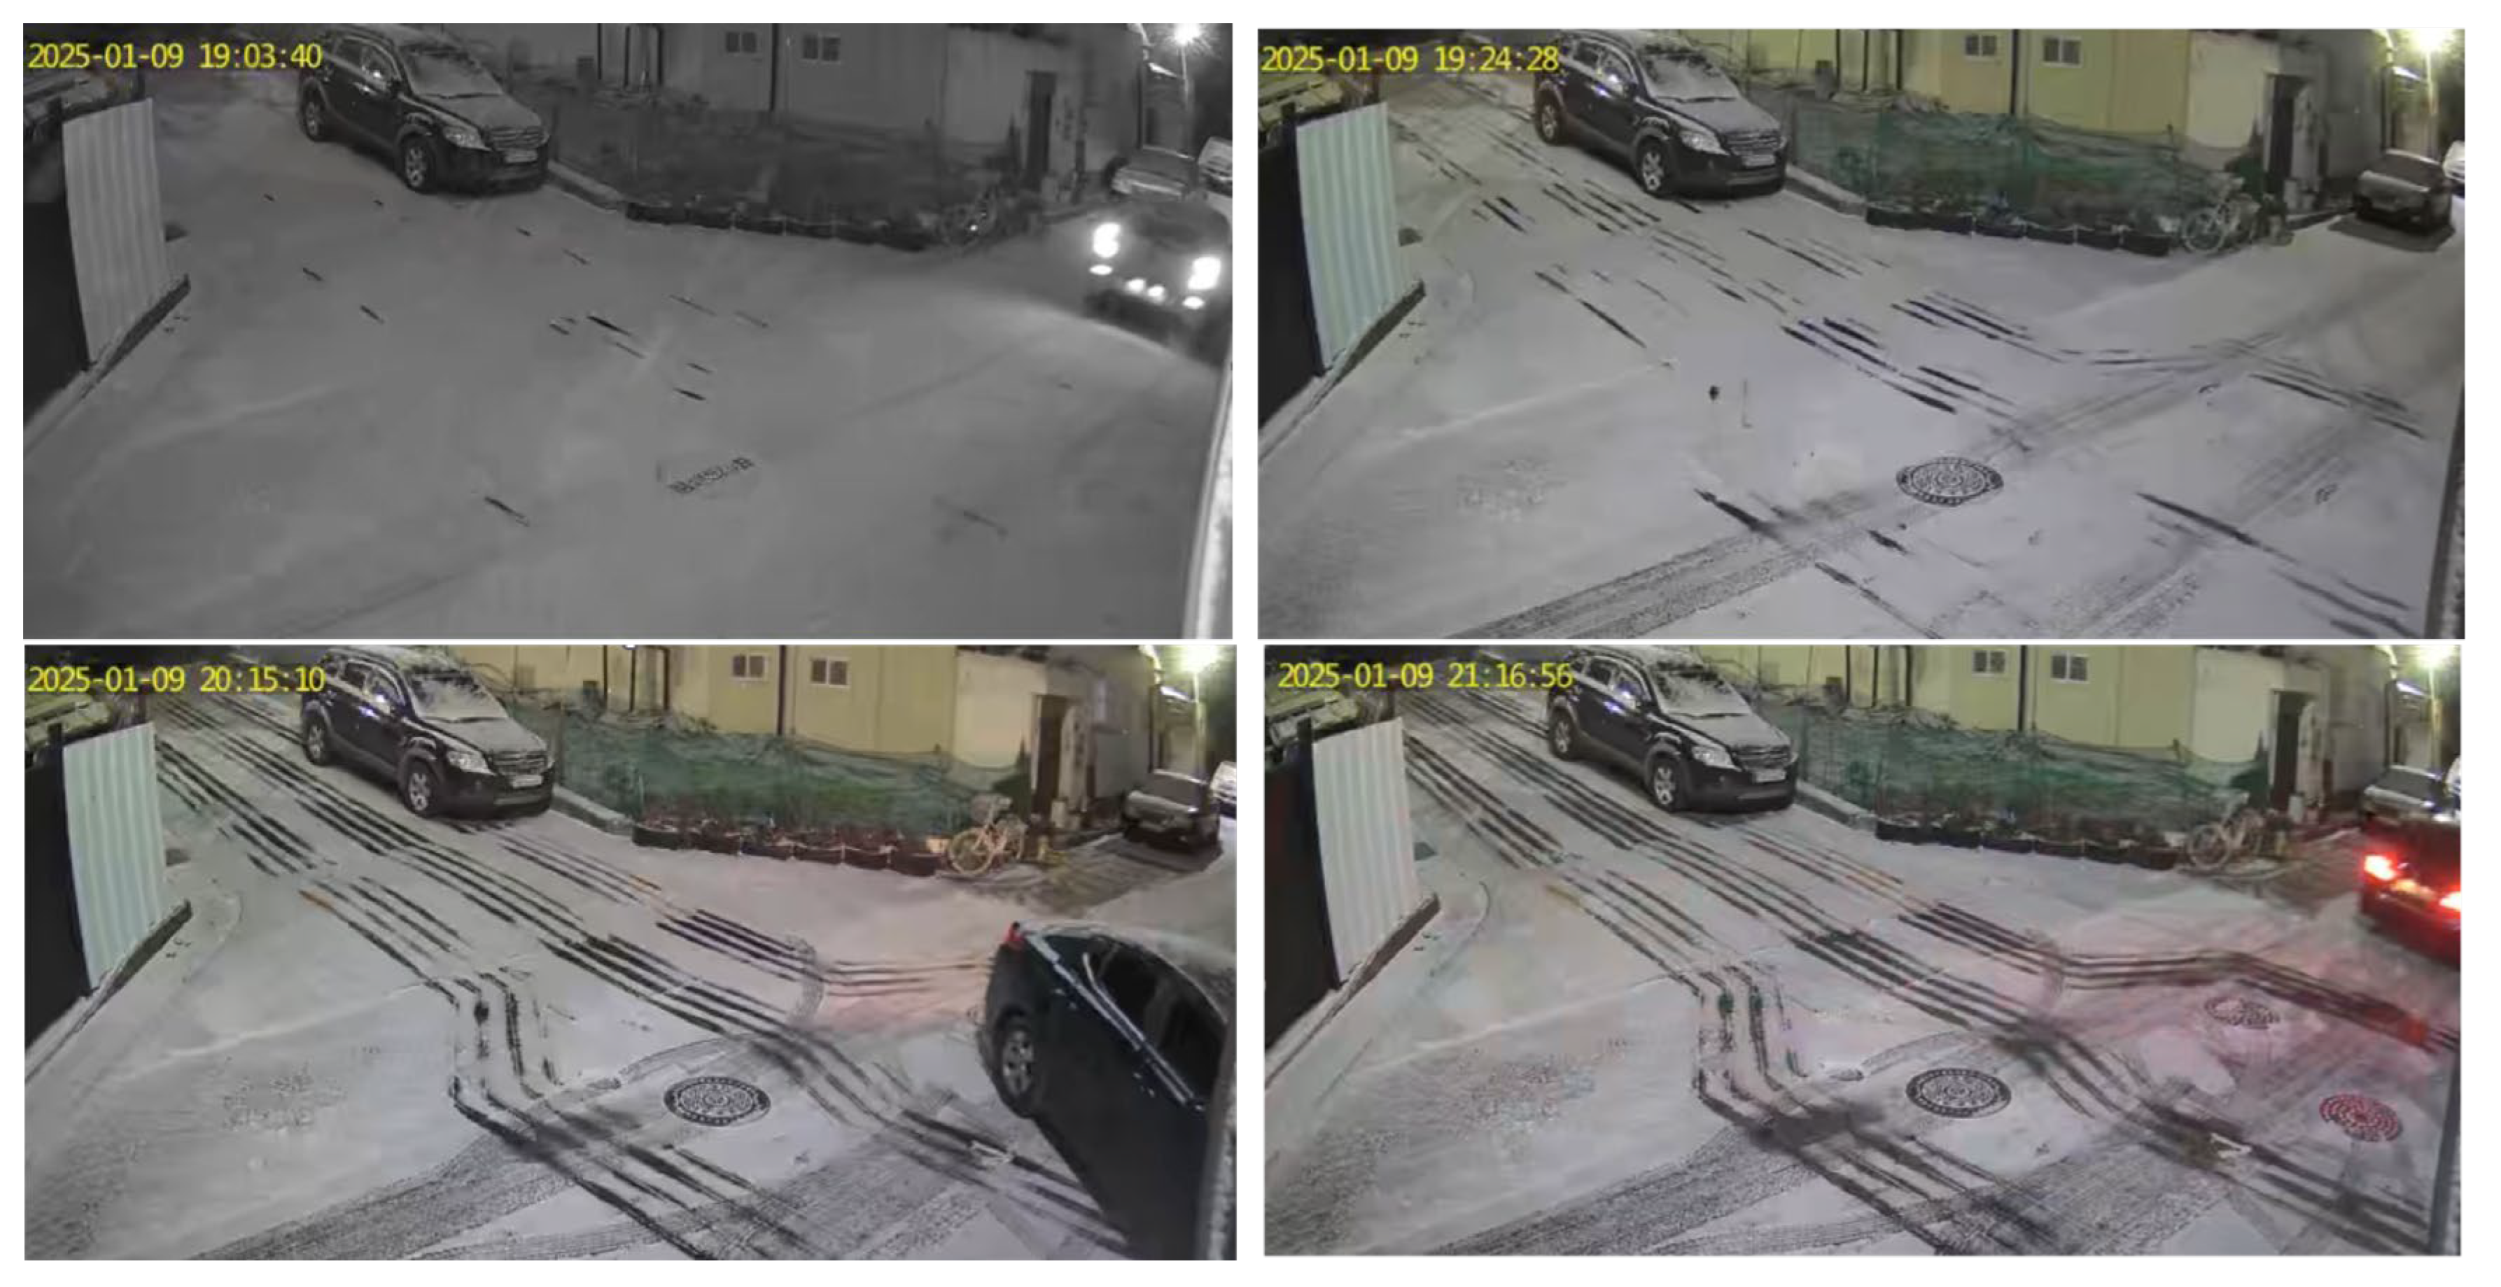
A representative time-lapse sequence documenting the transition from icing to complete melting is summarized in the status-change table (Table 6).
Figure 11.
Drone-based monitoring of Sites A–C illustrating differences in de-icing effectiveness.
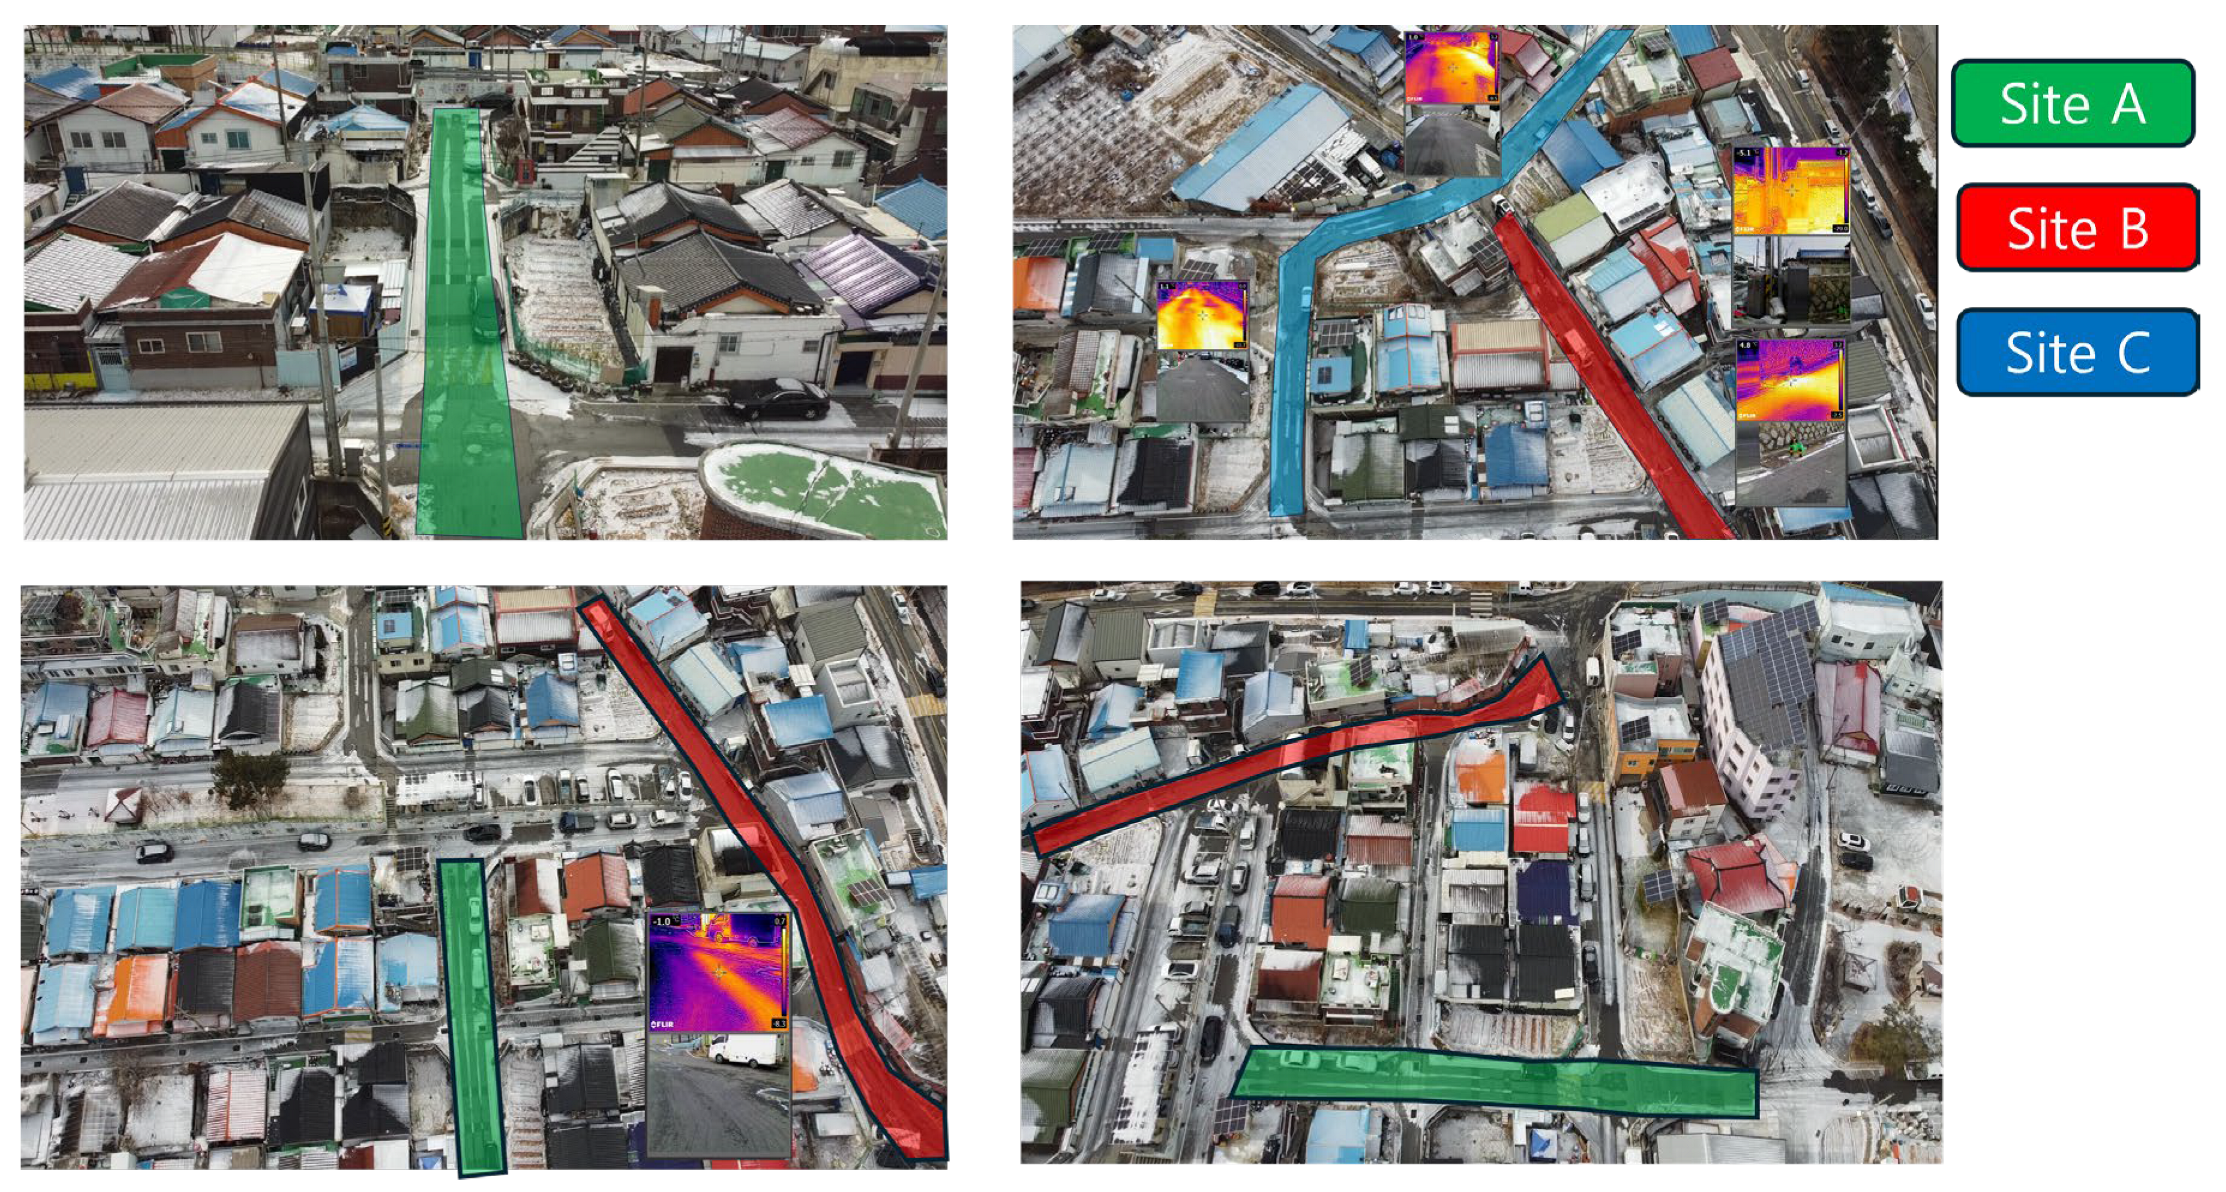
Figure 12.
IP camera-based monitoring of Sites A–C illustrating differences in de-icing effectiveness.
Figure 12.
IP camera-based monitoring of Sites A–C illustrating differences in de-icing effectiveness.
3.3. Freezing Intensity (FI) Results
The FI index successfully captured differences in icing risk between the two sections. In the reference lane, FI values peaked at 2439 during extreme cold events (classified as “very dangerous”), while the heated lane remained consistently near 0, indicating almost complete elimination of icing potential [13,20].
Figure 13 illustrates the time-series FI trends for Site A from December 17, 2024, to January 14, 2025. Peaks in the reference lane aligned with snowfall and sub-zero conditions, whereas the heated lane showed suppressed values throughout the same period.
Figure 13.
Time-series of FI values for heated (Hotcoil) and reference (Road) sections at Site A, Namgyeong-maeul 3rd Road, Daejeon (Dec 17, 2024 – Jan 14, 2025).
Figure 13.
Time-series of FI values for heated (Hotcoil) and reference (Road) sections at Site A, Namgyeong-maeul 3rd Road, Daejeon (Dec 17, 2024 – Jan 14, 2025).
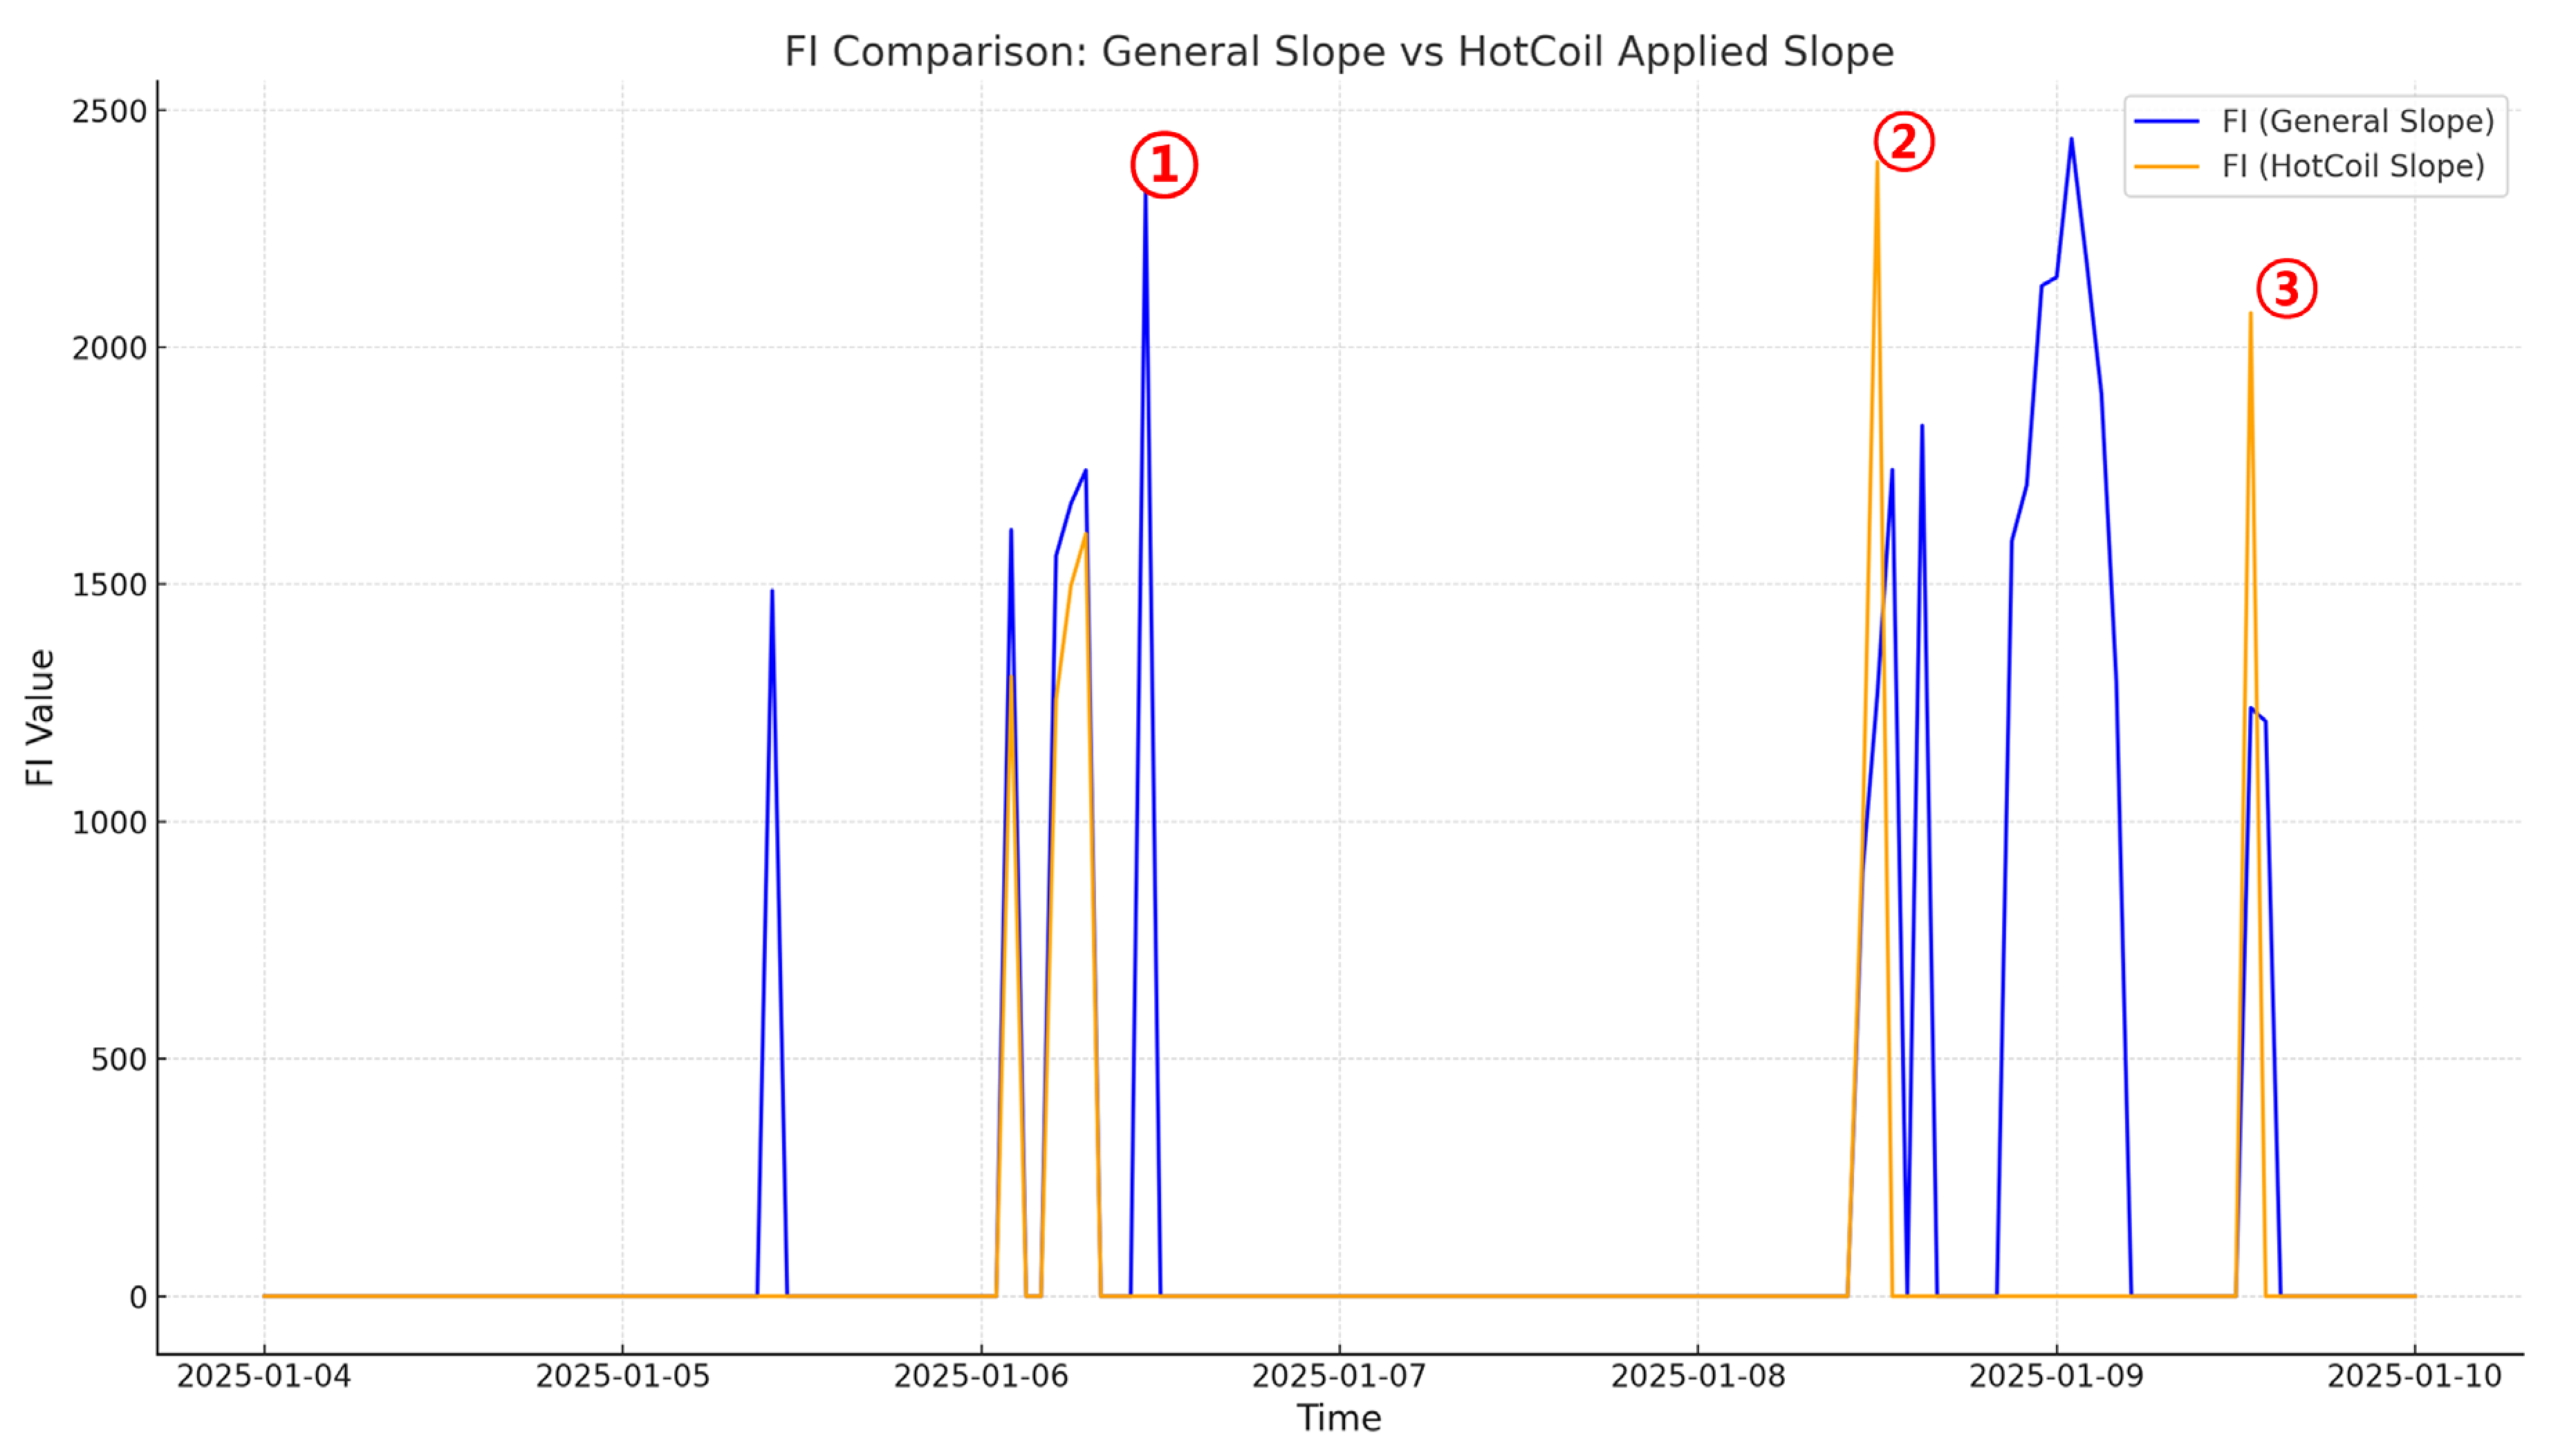
Notably, FI in the heated lane exceeded the reference in Cases ② and ③ (2390 vs. 1270 at 12:00 on 8 Jan; 2072 vs. 1239 at 13:00 on 9 Jan), as shown in Table 7. This counter-intuitive peak arises from two characteristics of the prototype FI: (i) hourly accumulation of 5-min freezing triggers and duration, and (ii) multiplication by the hourly mean surface-temperature term while the freezing trigger requires only that the surface be ≤ 4 °C with precipitation. When precipitation is present and the heated surface briefly hovers just below 4 °C early in the hour, FI can be inflated relative to a colder reference lane, because the same triggers are counted but the hourly temperature multiplier is larger on the heated surface. In these two cases, de-icing commenced within the same hour (partial → full melting), so the hourly FI captured early-hour triggers but not the subsequent clearance, further elevating the heated-lane FI. Elevated relative humidity in Case ② also amplified FI through the humidity term. By contrast, CI—which incorporates RHS operation and slope—remained lower in the heated lane (6 vs. 12 in both Cases ② and ③), correctly reflecting reduced on-site severity. Accordingly, the anomaly analysis supports using CI as a complementary severity metric when FI shows short-lived, precipitation-driven spikes (Figure 13; Table 7).
3.4. Cold Intensity (CI) Results
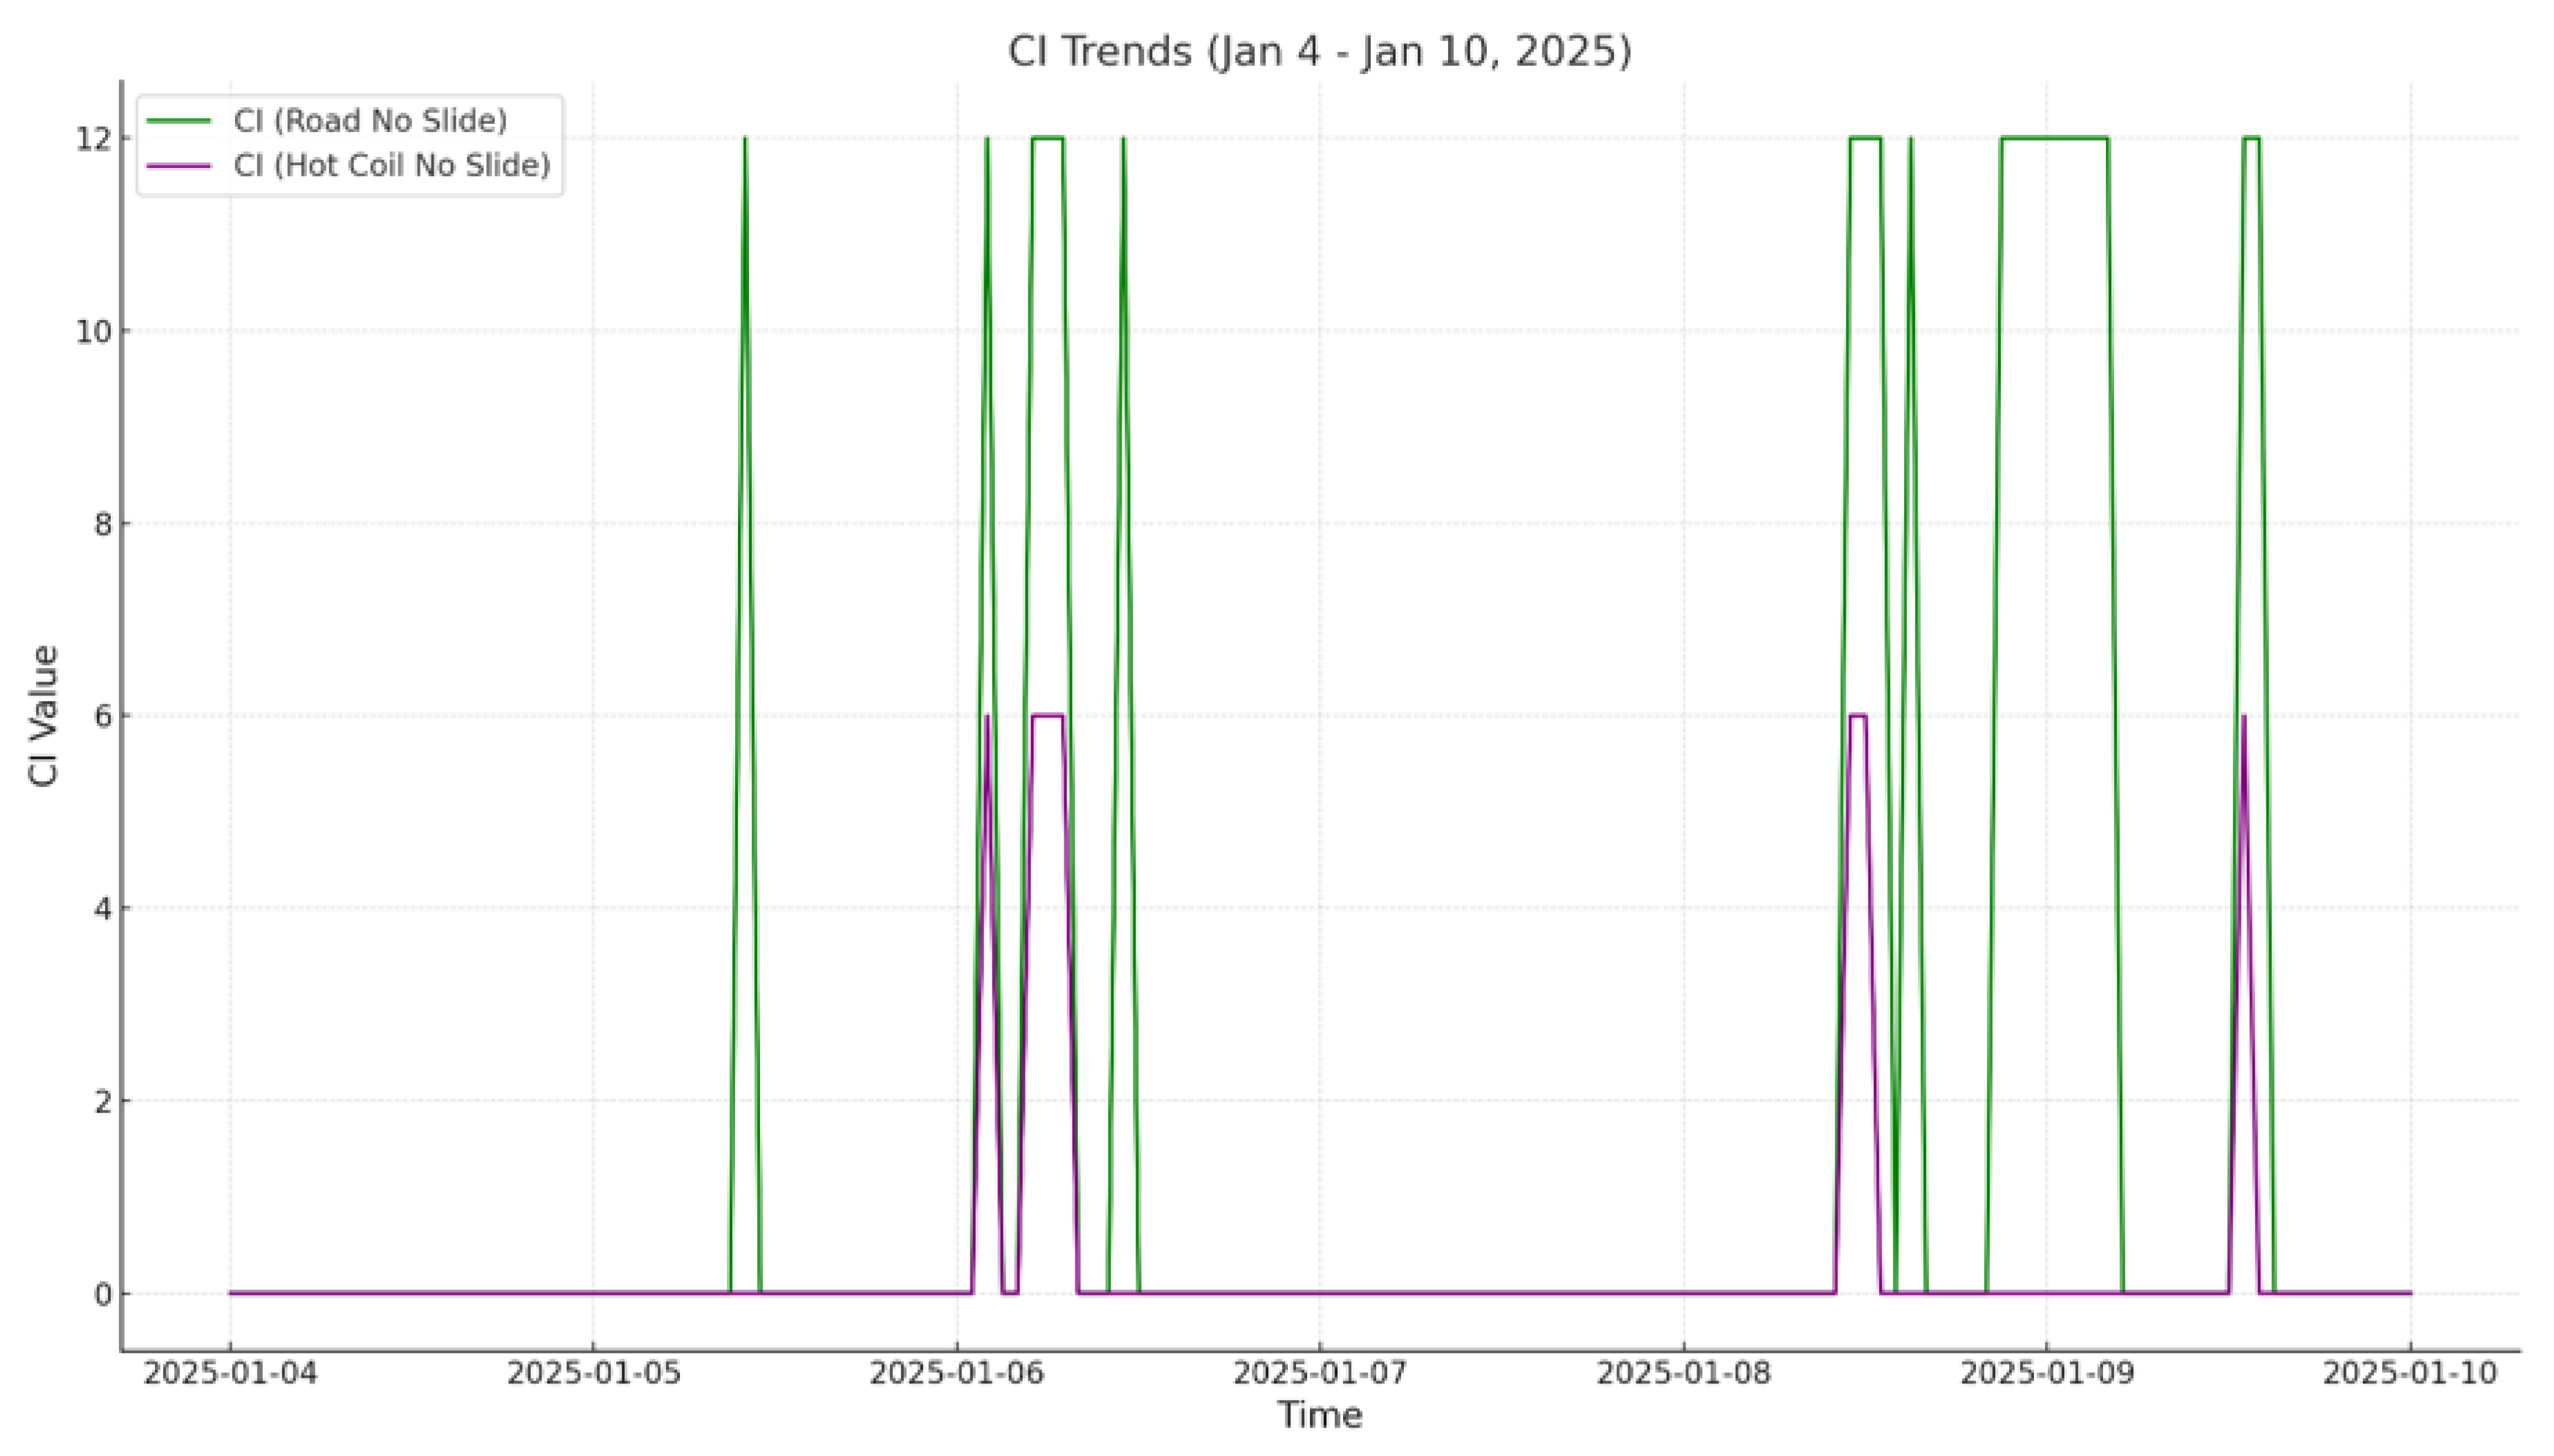
CI provided complementary evaluation of the severity of icing and the effectiveness of RHS operation. The reference lane frequently reached values around 12, representing severe icing hazards, while the heated lane consistently remained below 6, demonstrating a reduction in icing severity by more than 50% [13,20,21].
Figure 14 presents the CI time-series between January 4 and January 10, 2025. This period includes several icing events where RHS activation significantly reduced CI values compared to the untreated reference.
These CI patterns reflect reduced residual hazard in the heated lane during and after cold events, aligning with the temperature and image-based observations. The lane-differentiated CI trajectories and event windows are detailed in the time series (Figure 14).
Figure 14.
Time-series of CI values for heated (Hotcoil) and reference (Road) sections at Site A, Namgyeong-maeul 3rd Road, Daejeon (Jan 4 – Jan 10, 2025).
Figure 14.
Time-series of CI values for heated (Hotcoil) and reference (Road) sections at Site A, Namgyeong-maeul 3rd Road, Daejeon (Jan 4 – Jan 10, 2025).
3.5. Gap Analysis of Heated vs. Reference Sections
Quantitative gap analysis demonstrated RHS effectiveness:
- FI Gap: >2000 during peak cold spells, indicating near-complete suppression of icing potential.
- CI Gap: Average reduction of 6–8 points, representing a significant safety improvement [21].
For reporting, gaps are expressed as (Reference − Heated) for the same hour; positive values indicate advantage of RHS operation. Summary statistics for FI and CI gaps are provided in the comparative table (Table 8).
3.6. Integrated Comparison of Heated vs. Non-Heated Segments (Jan 4–10, 2025)
- Heated section: Maintained average surface temperature at ~7 °C, peaking at 12.5 °C.
- Non-heated section: Averaged only 2 °C, dropping to –2.5 °C.
- FI values: Heated avg. 76.4 (max 2390.5) vs. Non-heated avg. 234.4 (max 2439.5).
- CI values: Heated avg. 0.36 (max 7.5) vs. Non-heated avg. 2.07 (max 15.0).
Taken together, the heated lane maintained warmer surfaces, lower FI/CI levels, and faster recovery following snowfall, whereas the untreated lane showed persistent sub-zero periods and higher residual risk. Together, these results confirm that RHS operation significantly reduced both icing potential (FI) and severity (CI), providing robust improvements in winter road safety [21]. These integrated findings synthesize the temperature observations, index time series, and imaging evidence presented above (Figure 9, Figure 10, Figure 11, Figure 12, Figure 13 and Figure 14; Table 6, Table 7 and Table 8).
4. Discussion
The dual structure of FI and CI offers both predictive capability (FI as an early-warning trigger) and evaluative capability (CI as a severity measure), making them the first structured indices for standardized winter road safety assessment [10,11,12,13,20,21]. This pairing gives operators both a forward-looking trigger and a backward-looking check on residual risk. Beyond academic contribution, these indices provide actionable thresholds for policymakers and engineers to optimize RHS operation, minimize energy costs, and safeguard vulnerable populations. In practice, FI supports proactive activation, while CI confirms whether mitigation has actually reduced on-site hazard.
4.1. Significance of FI and CI as Winter Climate Indices
This study proposed two novel indices—Freezing Intensity (FI) and Cold Intensity (CI)—that create a quantitative framework for winter road icing risk assessment. The framework turns heterogeneous sensor streams into consistent, hour-by-hour indicators. Unlike conventional binary classifications of “frozen” vs. “non-frozen,” FI and CI enable continuous, data-driven monitoring. This enables graded responses rather than all-or-nothing interventions.
- FI captured the probability of icing occurrence, with reference sections exceeding values of 2400 (classified as very dangerous), while heated sections remained near zero.
- CI measured the actual severity of icing, with untreated sections reaching ~12, compared to heated sections consistently below 6.
This dual framework represents a substantial step forward in winter climate adaptation science by coupling proactive prediction with post-event evaluation. Together, they provide an integrated basis for operations, reporting, and safety communication.
4.2. Comparison with Existing Climate Indices
Summer climate adaptation has long benefited from structured indices such as UTCI, PET, and PMV, which are widely used in urban planning, heat warning systems, and thermal comfort research. These tools anchor standards and automate responses. However, until now, no equivalent standardized indices existed for winter icing hazards. FI and CI fill this gap by offering [10,11,12]:
- Predictive capability (FI): analogous to threshold-based activation metrics in heat studies, FI provides data-driven triggers for RHS activation (e.g., FI > 1000).
- Evaluative capability (CI): comparable to heat stress indices, CI quantifies the residual risk of icing, supporting real-time management and post-event safety validation.
This positioning is summarized in the conceptual framework contrasting summer and winter indices (Figure 2) and is operationalized through the FI/CI comparison table (Table 2).
By establishing FI and CI as complementary indices, this study provides a seasonally balanced framework, aligning winter hazard assessment with existing summer-focused approaches. This symmetry helps cities integrate winter safety into existing climate dashboards and SOPs. The practicality of this alignment is illustrated by the observed improvements in surface temperature and indices under RHS operation (Figure 9, Figure 10, Figure 11, Figure 12, Figure 13 and Figure 14).
4.3. Policy and Engineering Implications
Results from Site A demonstrated clear benefits of RHS installation, where FI dropped from >2400 to nearly zero and CI was reduced by more than 50%. These outcomes generalize into actionable rules for operation and investment. These outcomes highlight several implications:
- Operational guidelines: FI thresholds (Table 3) provide clear activation points for RHS, allowing local governments to establish data-driven criteria for automatic system control.
- Safety assurance: CI thresholds (Table 3) verify whether residual hazards remain after mitigation, supporting ongoing risk management.
- Resource optimization: Gap analysis (FI Gap > 2000; CI Gap ~6–8) provides a quantitative basis for cost-benefit analysis, helping municipalities justify energy expenditures against improved safety outcomes.
Taken together, these points support policy adoption (threshold setting), operational automation, and transparent evaluation of RHS effectiveness.
4.4. Limitations and Future Directions
Despite promising results, several limitations remain. These limitations guide next steps for validation and deployment.
- Temporal scope: Monitoring was limited to a single winter season (Dec 2024–Jan 2025), requiring multi-year data to validate the robustness of FI and CI.
- Geographic scope: Quantitative analysis was limited to Site A, while Sites B and C provided only qualitative verification. Broader testing across diverse terrains is necessary.
- Formula refinement: FI and CI were derived from project protocols rather than international standards; calibration with larger, multi-regional datasets will enhance universality.
- Integration with existing models: Linking FI and CI with weather forecasts, pavement condition monitoring, and traffic safety models could further improve accuracy and operational value.
Future research should extend the spatial and temporal scope, refine formulas with expanded datasets, and integrate FI/CI into smart infrastructure and climate-resilient city planning. This roadmap will help standardize the indices and embed them in routine winter operations.
4.5. Overall Contribution
By bridging the gap between meteorological conditions and road safety outcomes, FI and CI advance the scientific understanding of winter road hazards and provide a practical toolset for municipalities. Together, they represent the first structured indices capable of quantifying both the likelihood and severity of road icing. As such, FI and CI form a foundational toolset for winter climate adaptation, enhancing urban resilience, mobility safety, and sustainable infrastructure management. In sum, the indices convert multi-sensor observations into operational decisions, enabling safer, more efficient winter road management.
5. Conclusions
This study introduced and validated two novel indices—Freezing Intensity (FI) and Cold Intensity (CI)—to quantitatively evaluate road icing risks and the effectiveness of Road Heating Systems (RHS). Field monitoring conducted at Namgyeong-maeul 3rd Road in Daedeok-gu, Daejeon, South Korea, from December 2024 to January 2025 revealed the following key findings:
- Surface temperature improvement: RHS installation increased average pavement surface temperature by 4.1 °C compared to the reference lane, with maximum differences exceeding 12.5 °C during extreme cold events.
- Reduction in icing potential (FI): Reference lanes reached FI values up to 2439 (classified as very dangerous), while heated lanes consistently remained near zero, indicating near-complete elimination of icing risk.
- Mitigation of icing severity (CI): Untreated lanes recorded CI values around 12–15, while heated lanes remained below 6, demonstrating a >50% reduction in icing severity.
Quantitative gap analysis: FI Gaps exceeded 2000, and CI Gaps averaged 6–8 points, providing clear numerical evidence of RHS effectiveness. Together, these findings show consistent thermal uplift, suppressed icing potential, and lower residual severity where RHS is installed.
Importantly, the RHS system at Namgyeong-maeul Road was installed and operated by the Daejeon city government with financial support from the Korean Ministry of Environment under a national program targeting climate-vulnerable neighborhoods. The Korea Environment Institute (KEI) conducted independent monitoring and evaluation, using AWS, surface loggers, thermal imaging, drone surveys, and IP cameras to ensure comprehensive, multi-modal assessment. This governance and auditing arrangement strengthens the credibility and transferability of results.
The dual structure of FI and CI offers both predictive capability (FI as an early-warning trigger) and evaluative capability (CI as a severity measure). Together, they represent the first structured indices for winter road safety assessment, filling a critical gap that has long existed compared to summer indices such as UTCI, PET, and PMV. In practice, FI informs proactive activation thresholds, while CI validates on-site effectiveness and residual risk.
Beyond academic contribution, FI and CI provide actionable thresholds for policymakers and engineers to:
- establish data-driven activation guidelines for RHS operation,
- conduct cost–benefit analyses of winter road safety infrastructure, and
- safeguard vulnerable populations in climate-exposed urban neighborhoods.
These applications enable evidence-based standard operating procedures and transparent reporting.
Future research should expand validation across multiple winter seasons and diverse geographic contexts, refine formulas with larger datasets, and integrate FI/CI into smart infrastructure platforms combining IoT and AI.
Priority areas include multi-year calibration, cross-site benchmarking, and coupling with operational forecasting.
By establishing FI and CI as foundational tools for winter climate adaptation science, this study contributes to urban resilience, climate-smart mobility, and sustainable infrastructure management.
Author Contributions
Conceptualization, Y.-S.L. and T.K.K.; methodology, T.H.K. and Y.-S.L.; software, T.K.K.; validation, T.K.K.; formal analysis, Y.-S.L.; investigation, T.H.K.; resources, T.H.K.; data curation, Y.-S.L.; writing—original draft preparation, T.K.K.; writing—review and editing, Y.-S.L. and T.K.K.; visualization, T.K.K.; supervision, T.K.K. and T.H.K. All authors have read and agreed to the published version of the manuscript.
Funding
This research was funded by Korea Environmental Institute’s Climate Crisis Vulnerable. This paper is based on the results of the research work “Local Government Climate Adaptation and Vulnerability Improvement Project” (2025-001-02), conducted by the Korea Environment Institute (KEI) upon the request of the Korea Ministry of Climate, Energy, Environment.
Data Availability Statement
Not applicable
Acknowledgement: This paper is modified based on the findings of the supporting project for climate-vulnerable groups and regions conducted by Korea Environment Institute (2023-001-03))
Conflicts of Interest
The authors declare there are no conflicts of interest
References
- Fay, L.; Shi, X. Environmental impacts of chemicals for snow and ice control: State of the knowledge. Cold Reg. Sci. Technol. 2012, 67, 119–129. [Google Scholar] [CrossRef]
- Shi, X.; Akin, M.; Pan, T.; Fay, L.; Liu, Y.; Yang, Z. Deicer impacts on pavement materials: Introduction and recent developments. Open Civ. Eng. J. 2009, 3, 16–27. [Google Scholar] [CrossRef]
- Błażejczyk, K.; et al. Comparison of UTCI to selected thermal indices. Int. J. Biometeorol. 2012, 56, 515–535. [Google Scholar] [CrossRef]
- Jendritzky, G.; de Dear, R.; Havenith, G. UTCI—why another thermal index? Int. J. Biometeorol. 2012, 56, 421–428. [Google Scholar] [CrossRef]
- Matzarakis, A.; Mayer, H.; Iziomon, M.G. Applications of a universal thermal index: Physiological equivalent temperature. Int. J. Biometeorol. 1999, 43, 76–84. [Google Scholar] [CrossRef]
- Rahman, M.L.; Malakooti, A.; Ceylan, H.; Kim, S.; Taylor, P.C. A review of electrically conductive concrete heated pavement system technology: From the laboratory to the full-scale implementation. Constr. Build. Mater. 2022, 329, 127139. [Google Scholar] [CrossRef]
- Qi, C.; Tang, J.; Fan, F.; Yan, Y. Effects of magnetic field on thermo-hydraulic behaviors of magnetic nanofluids in CPU cooling system. Appl. Therm. Eng. 2020, 179, 115717. [Google Scholar] [CrossRef]
- Jiang, C.; Zheng, J.; Liu, J.; Wu, L.; Yang, J. Studies review of the technology for snow and ice control for winter road maintenance. In Proceedings of the International Conference on Transportation Engineering (ICTE 2011), Chengdu, China, 23–25 July 2011; pp. 3245–3254. [Google Scholar]
- Conductive Concrete for Bridge Deck Deicing. Concrete Technology Today 2004, Portland Cement Association, 25(1). [CrossRef] Available online: (accessed on 27 September 2025).
- Jónsson, P.; Riehm, M. Infrared thermometry in winter road maintenance. J. Atmos. Oceanic Technol. 2012, 29, 846–856. [Google Scholar] [CrossRef]
- Zhao, Y.; Zhang, J.; Li, L.; Hu, T.; Zhao, Y. Analytical solution for the temperature field of an elliptical tunnel in cold regions. Cold Reg. Sci. Technol. 2023, 208, 103793. [Google Scholar] [CrossRef]
- Ranyal, E.; Sadhu, A.; Jain, K. Road condition monitoring using smart sensing and artificial intelligence: A review. Sensors 2022, 22, 3044. [Google Scholar] [CrossRef]
- Grabowski, D.; Czyżewski, A. System for monitoring road slipperiness based on CCTV cameras and convolutional neural networks. J. Intell. Inf. Syst. 2020, 55, 521–534. [Google Scholar] [CrossRef]
- Khan, M.N.; Ahmed, M.M. Weather and surface condition detection based on road-side webcams: Application of pre-trained convolutional neural network. Int. J. Transp. Sci. Technol. 2022, 11, 468–483. [Google Scholar] [CrossRef]
- Johnston, J.M.; Jacobs, J.M.; Hunsaker, A.; Wagner, C.; Vardaman, M. Applications of snow-covered areas from unoccupied aerial systems (UAS) visible imagery: A demonstration in southeastern New Hampshire. Remote Sens. 2025, 17, 1885. [Google Scholar] [CrossRef]
- Boselly, S.E.; Thornes, J.; Ulberg, C.; Ernst, D. Road weather information systems, Volume I. Strategic Highway Research Program Publication SHRP-H-350; National Research Council: Washington, DC, USA, 1993; pp. 90–93. [Google Scholar]
- Tabrizi, S.E.; Xiao, K.; Thé, J.V.G.; Saad, M.; Farghaly, H.; Yang, S.X.; Gharabaghi, B. Hourly road pavement surface temperature forecasting using deep learning models. J. Hydrol. 2021, 603, 126877. [Google Scholar] [CrossRef]
- Anis, M.; Abdel-Raheem, M. A review of electrically conductive cement concrete pavement for sustainable snow-removal and deicing: Road safety in cold regions. Transp. Res. Rec. 2024, 2678, 50–71. [Google Scholar] [CrossRef]
- Ruuhela, R.; Hippi, M.; Hartonen, S. Pedestrian wintertime slip and fall injuries—Effectiveness of weather warning service in prevention. Scand. J. Public Health 2025, 53, 142–148. [Google Scholar] [CrossRef]
- Tarcea, A.; et al. The Slip and Fall Index: Assessing the risk of slipping and falling on ice. Can. J. Public Health 2024, 115, 296–304. [Google Scholar] [CrossRef] [PubMed]
- Jiao, W.; Sha, A.; Liu, Z.; Jiang, W.; Hu, L.; Qin, W. Analytic investigations of snow melting efficiency and temperature field of thermal conductive asphalt concrete combined with electrical-thermal system. J. Clean. Prod. 2023, 399, 136622. [Google Scholar] [CrossRef]
- Zhang, W.; Dong, S.; Song, Z.; Ding, S.; Yi, J.; Han, B. Snow-melting performance and application method of stainless steel wires-modified conductive asphalt concrete based on electrothermal conversion. Appl. Therm. Eng. 2025, 269, 126066. [Google Scholar] [CrossRef]
- Lim, H.; Lee, S.; Lee, J. Effective snow removal devices for road pavement using geothermal heat pipe. Appl. Therm. Eng. 2025, 265, 125624. [Google Scholar] [CrossRef]
- Chen, X.; Huang, G.; Li, Q.; Yang, C. A novel geothermal pavement ice and snow melting system with reversible loop heat pipes to eliminate underground thermal imbalance. Appl. Therm. Eng. 2025, 269, 126052. [Google Scholar] [CrossRef]
- Murray, D.; Ernst, U.F.; An economic analysis of the environmental impact of highway deicing. US Environ. Prot. Agency Report, Office of Research and Development, Municipal Environmental Research Laboratory: Washington, DC, USA, 1976. (accessed on 27 September 2025).
Figure 1.
Aerial view of Namgyeong-maeul Road in Daedeok-gu, Daejeon, showing steep slopes and dense residential clusters.
Figure 1.
Aerial view of Namgyeong-maeul Road in Daedeok-gu, Daejeon, showing steep slopes and dense residential clusters.
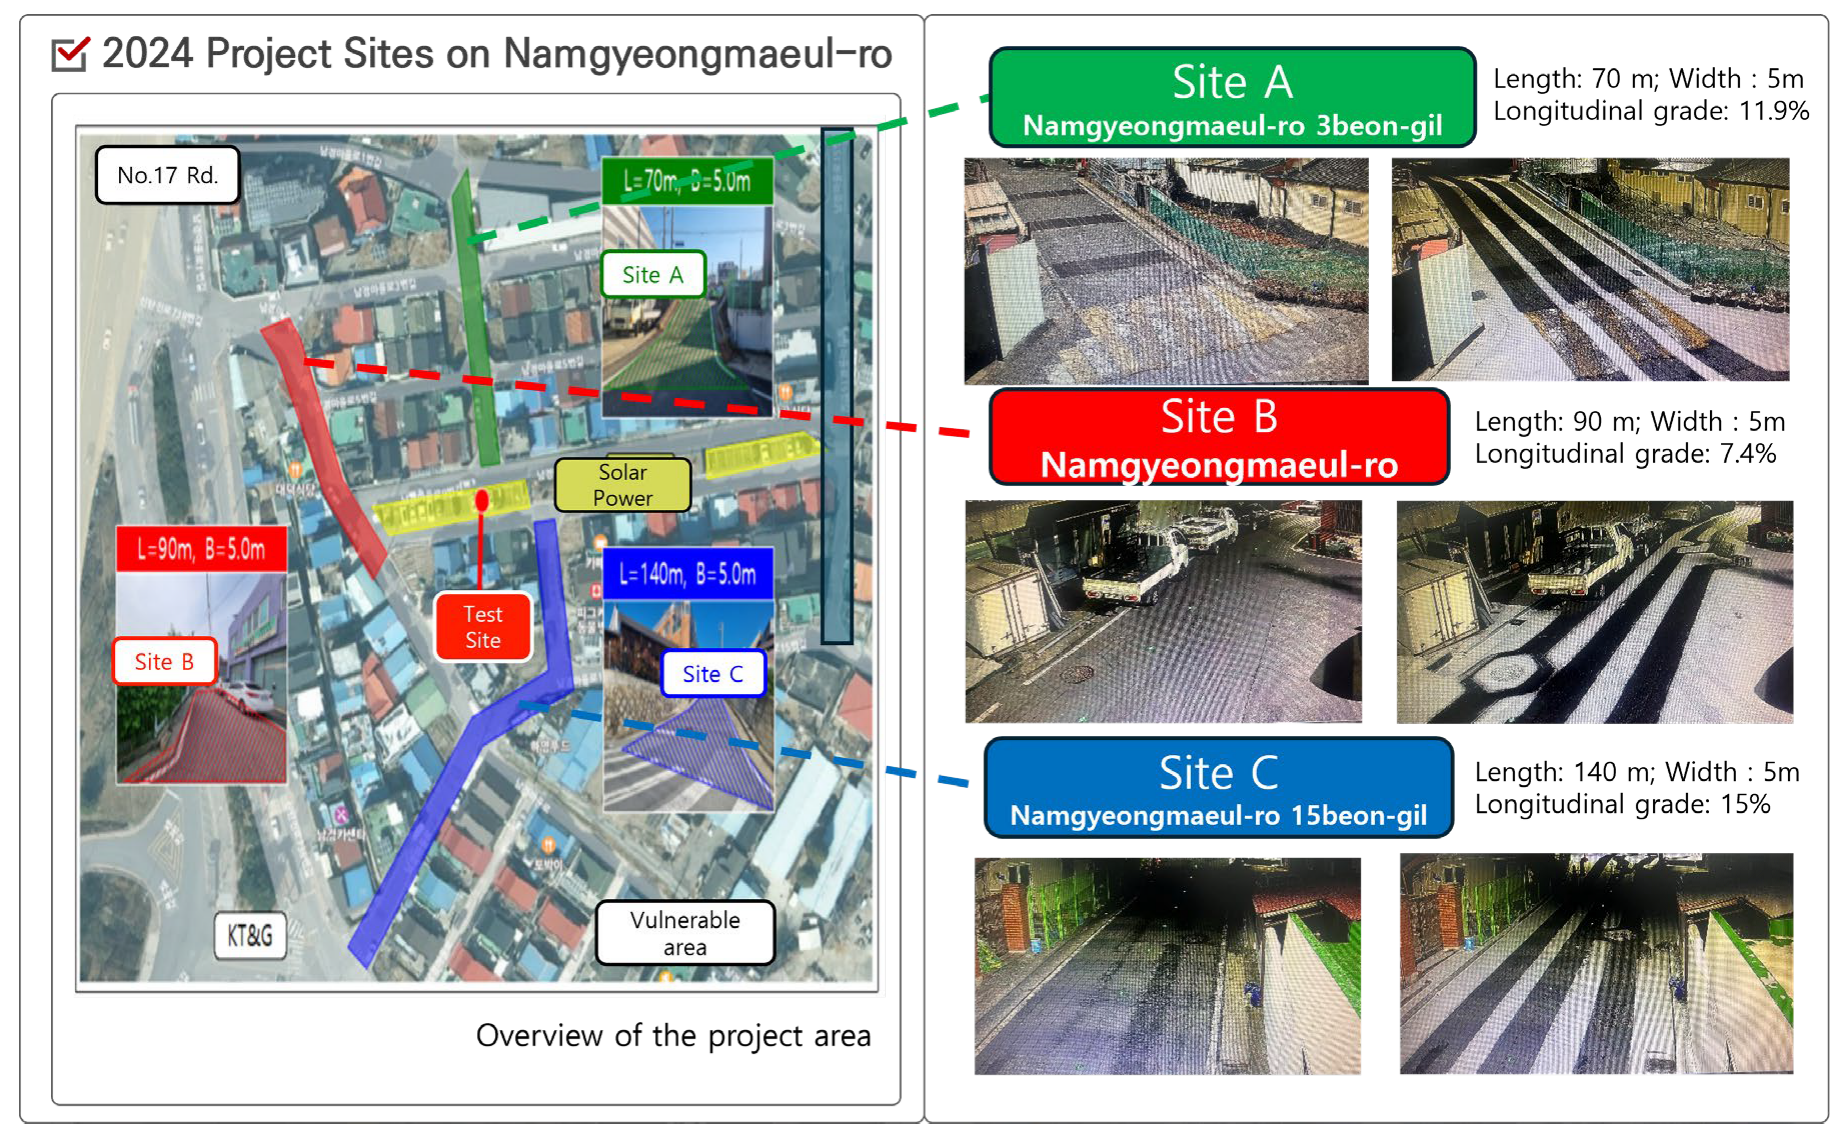
Figure 2.
Conceptual framework comparing established summer heat indices (UTCI, PET, PMV) with the newly proposed winter indices (FI and CI).
Figure 2.
Conceptual framework comparing established summer heat indices (UTCI, PET, PMV) with the newly proposed winter indices (FI and CI).
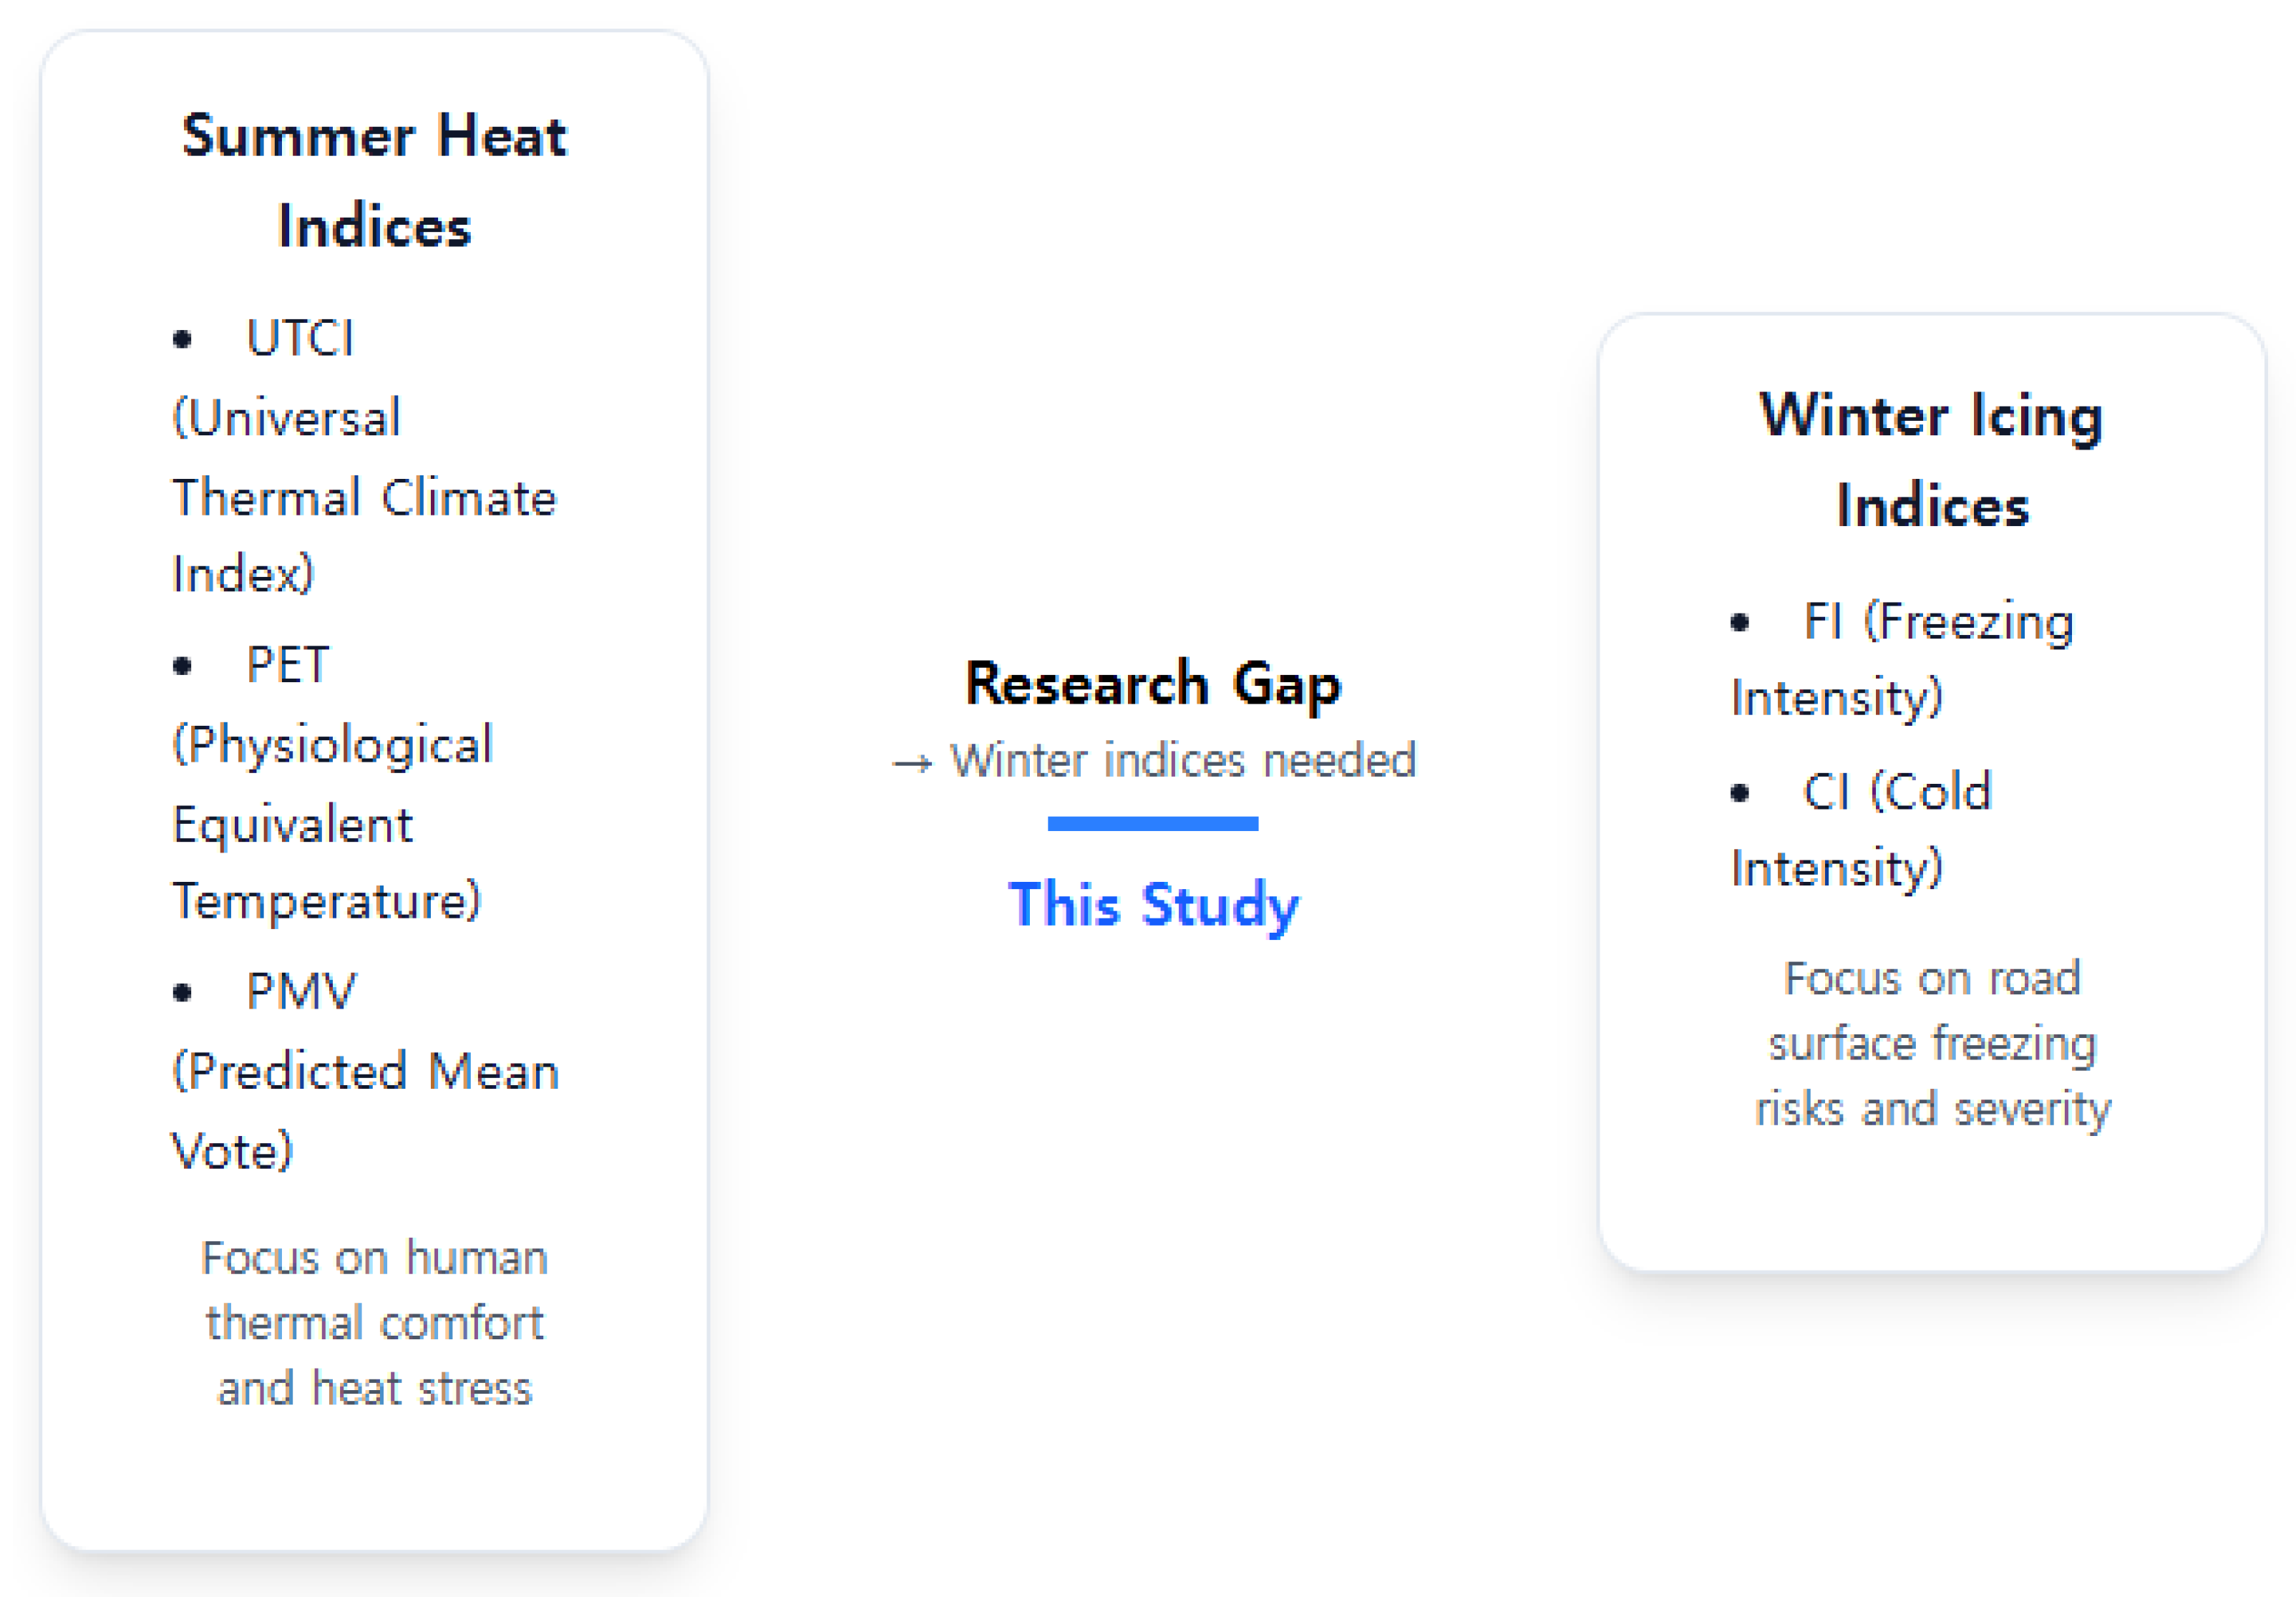
Figure 3.
Heated road surface with embedded RHS coils at Namgyeong-maeul Road (Nov 4, 2024).
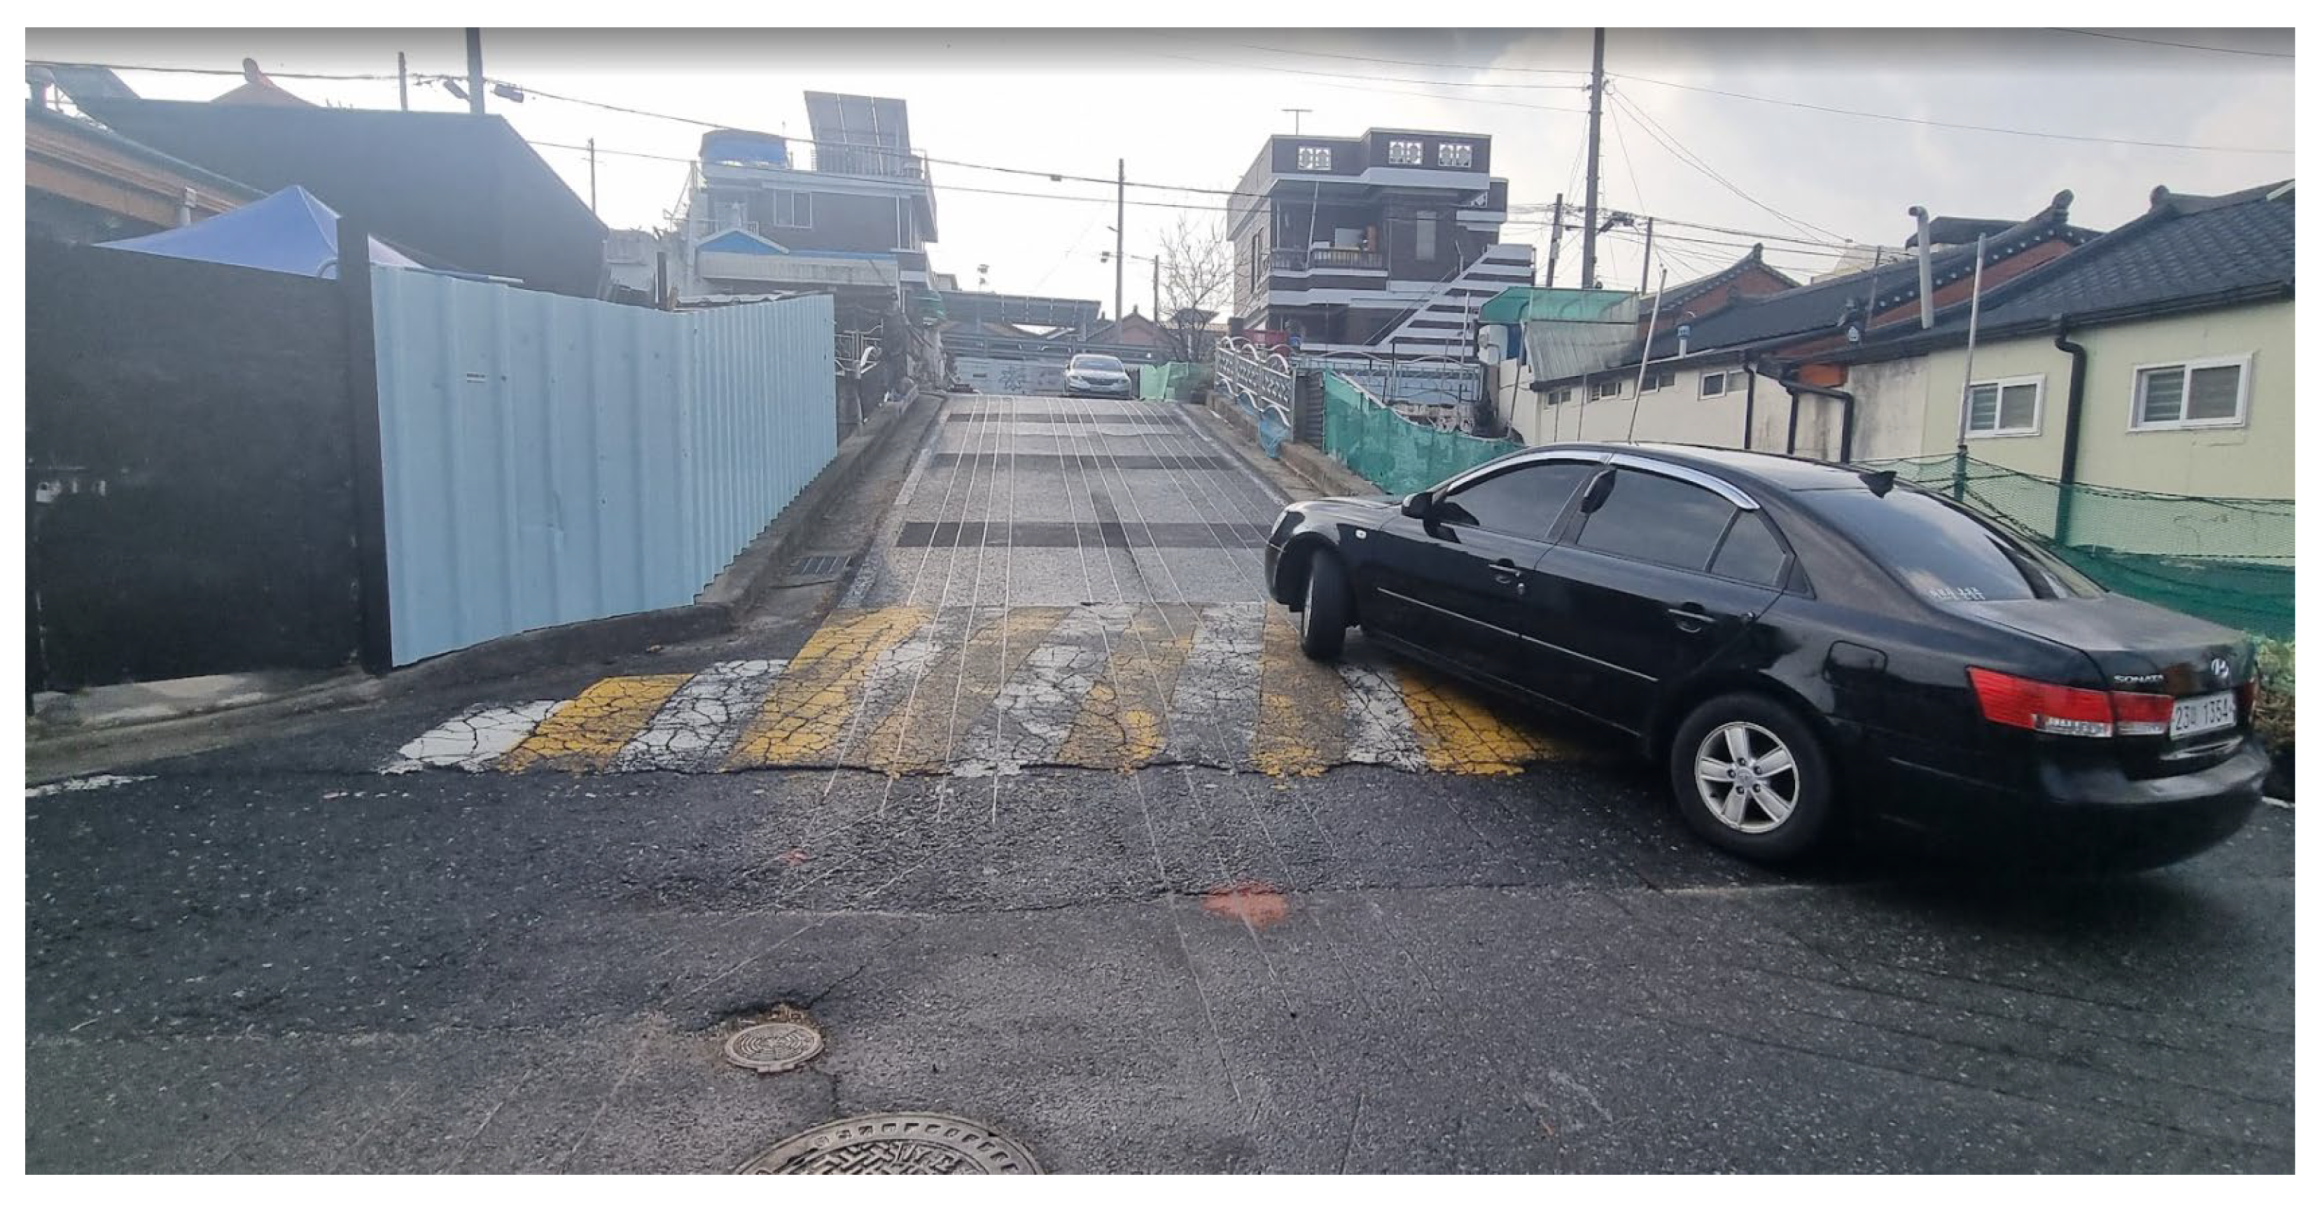
Figure 4.
(a) Aerial context of Site A showing the monitored slope (~70 m, ~11.9%) and the locations of the heated section (H2, “Heat coil”) and the adjacent non-heated reference section (H1, “Non applied”); dashed arrows indicate the downhill direction and the approximate camera lines-of-sight from the pole. (b) Oblique drone view at street level marking the exact positions of surface-temperature sensors in H2 (heated lane) and H1 (reference lane), together with the two fixed cameras (C1, C2) used for time-lapse verification; the intersection geometry and curb line clarify where de-icing initiates and propagates across the carriageway.
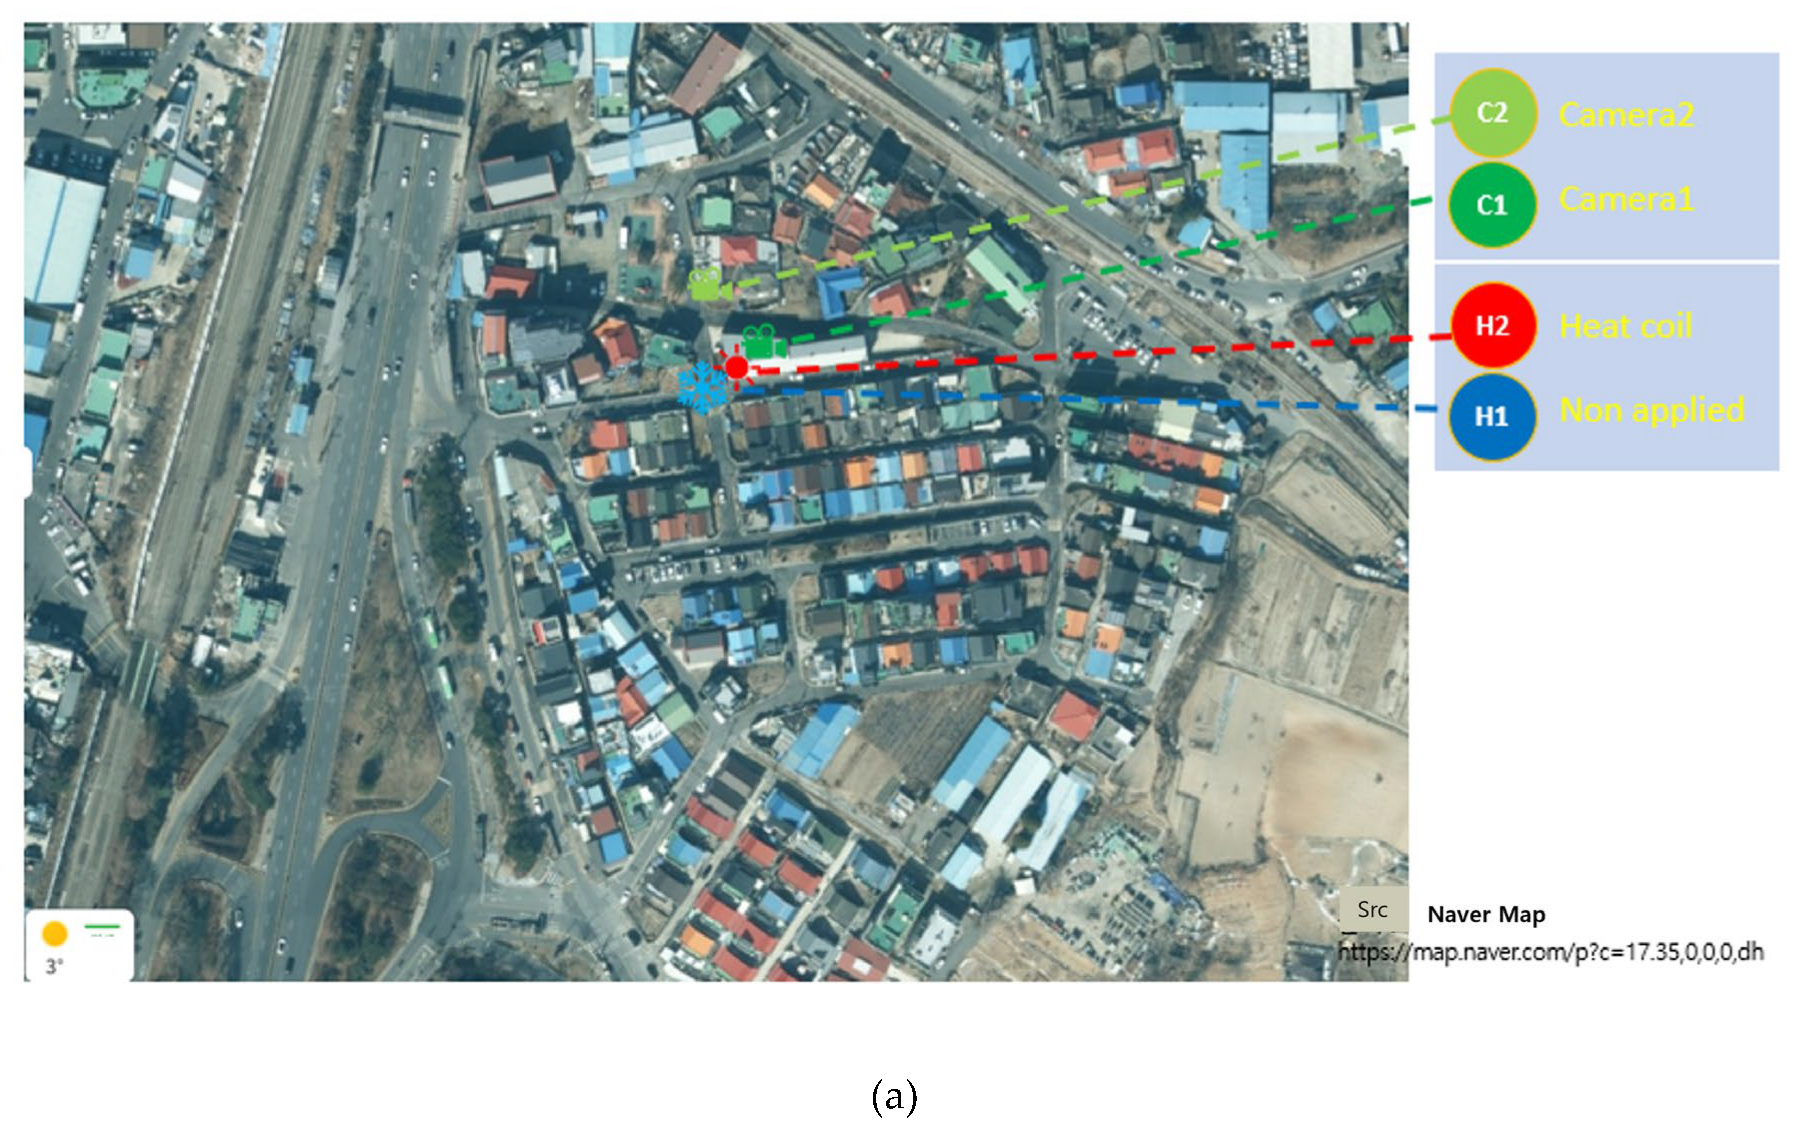
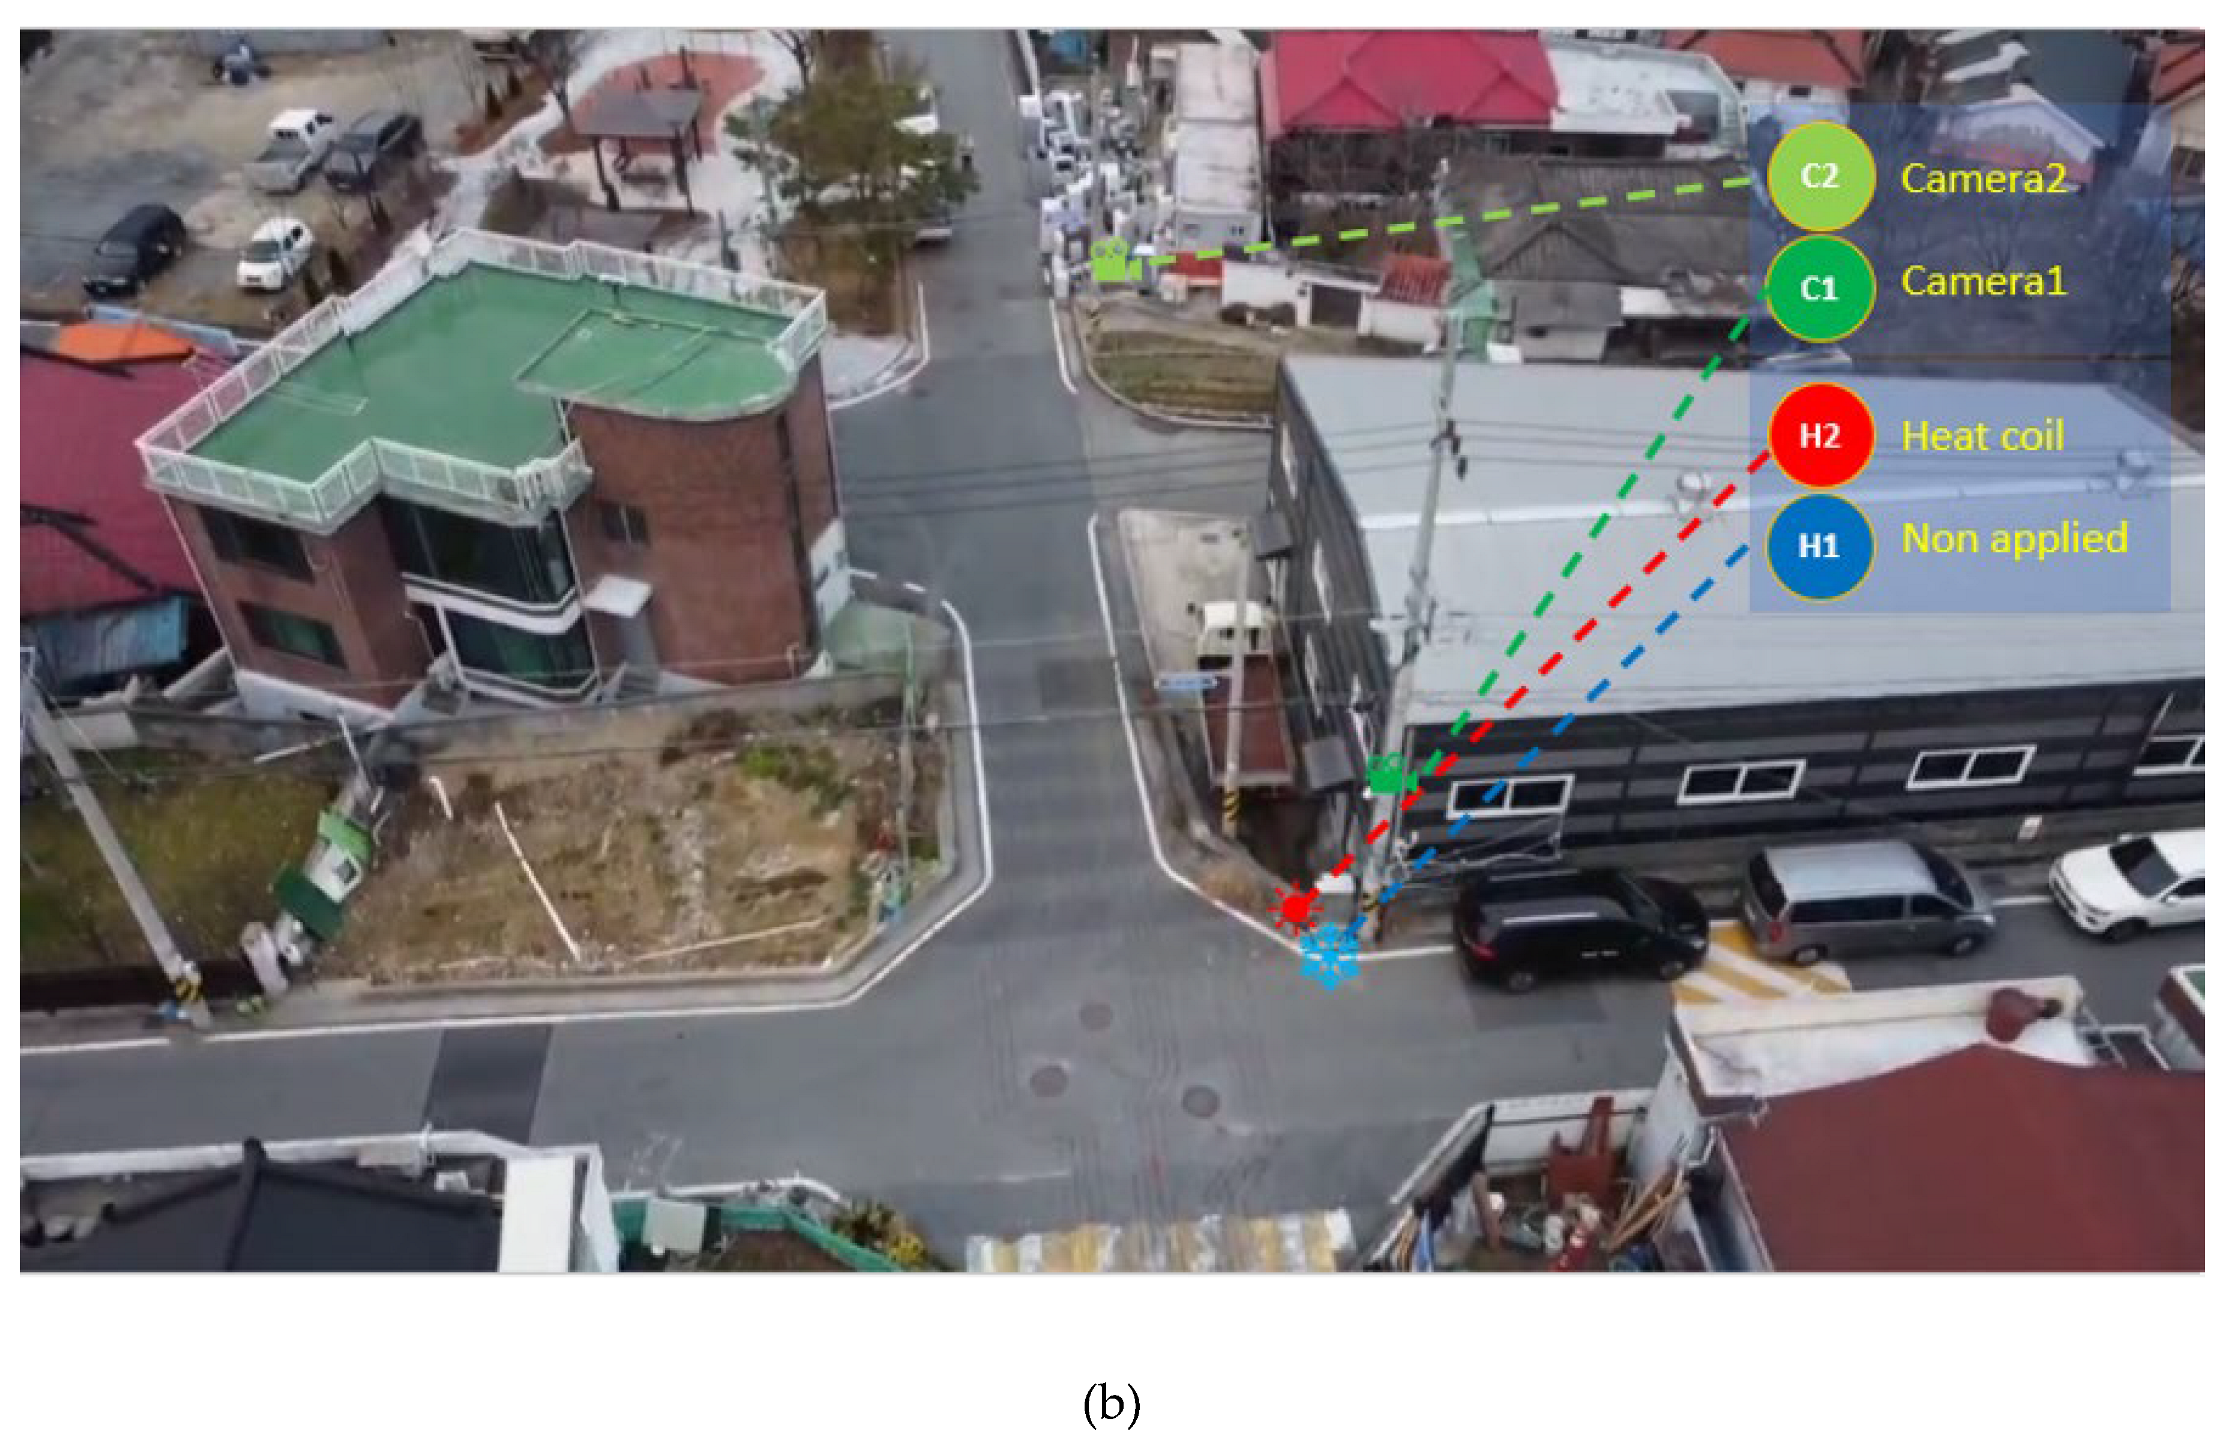
Figure 5.
(a) Street-level view at Site A indicating the camera line-of-sight across the heated (H2, “Heat coil”) and reference (H1, “Non applied”) sections; dashed guides show the downhill direction and the baseline used for time-lapse verification. (b) Environmental monitoring system mounted on the Site A utility pole, labeling C1 = fixed camera, A1 = AWS (automatic weather station), S1 = snow sensor, Sol = solar panel, and W1 = Wi-Fi/LTE gateway for power and real-time telemetry.
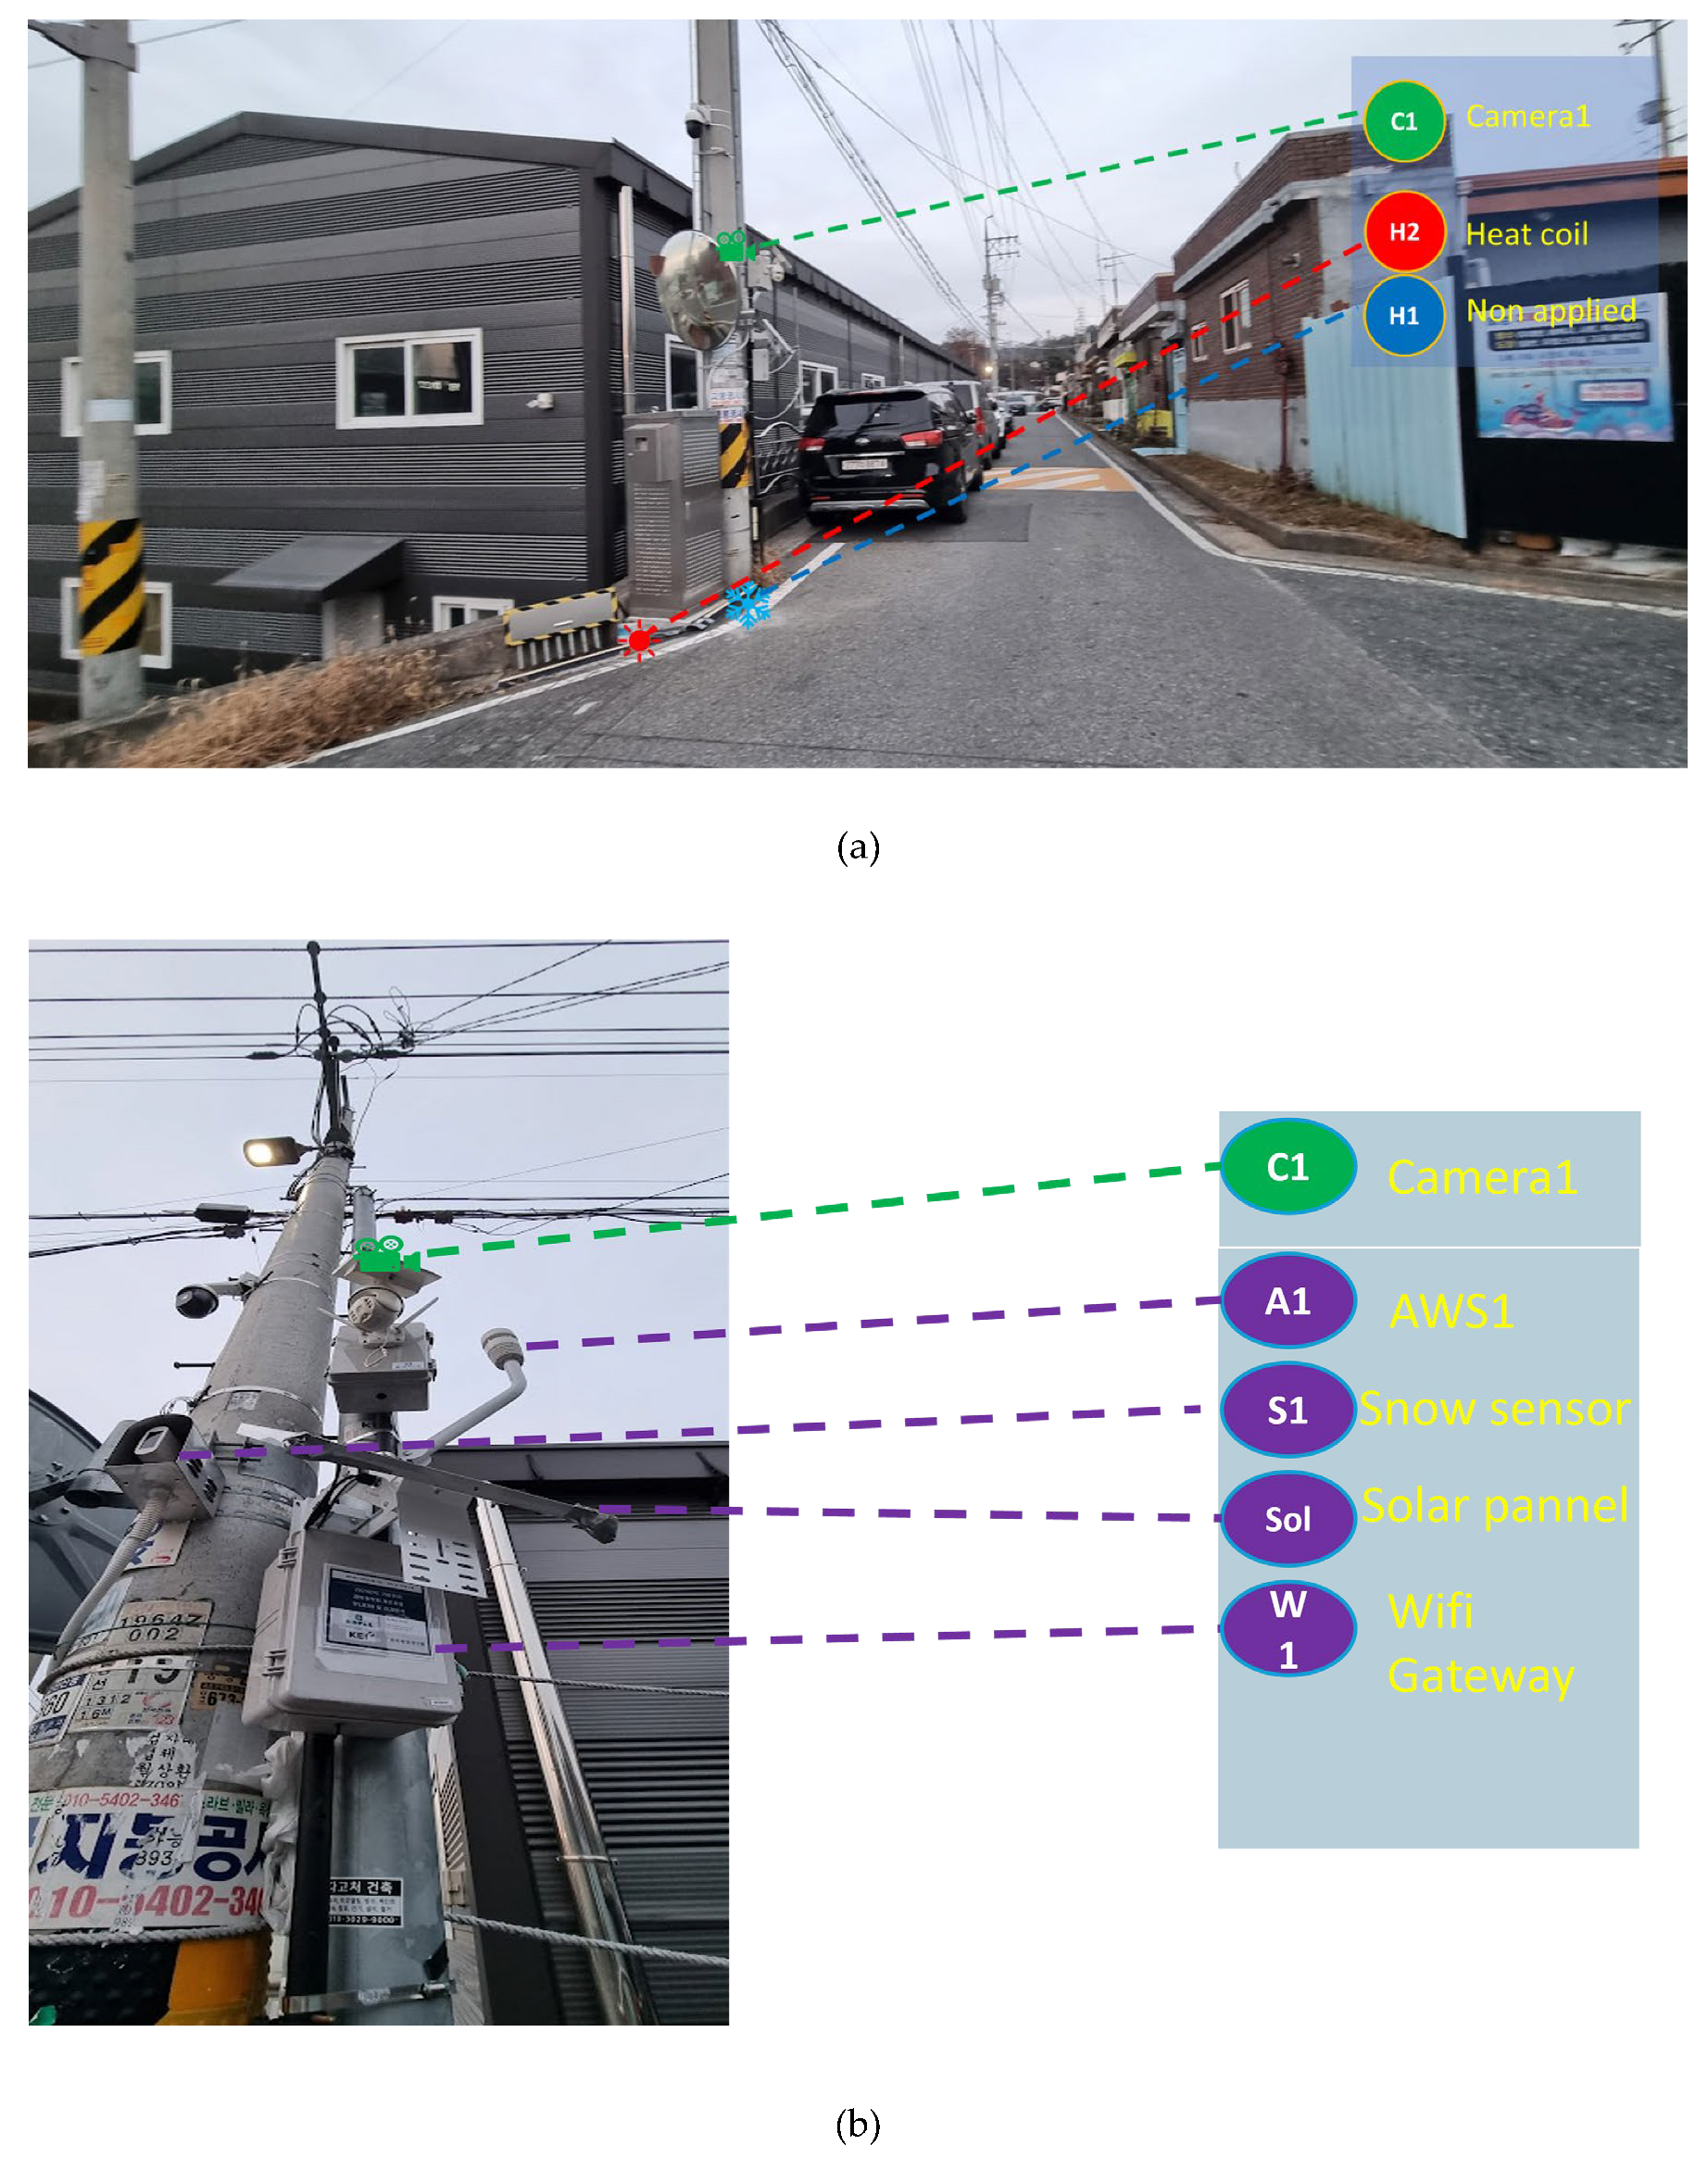
Figure 6.
Placement of surface temperature sensors in heated (H2) and reference (H1) sections, with thermal snapshots during RHS operation.
Figure 6.
Placement of surface temperature sensors in heated (H2) and reference (H1) sections, with thermal snapshots during RHS operation.
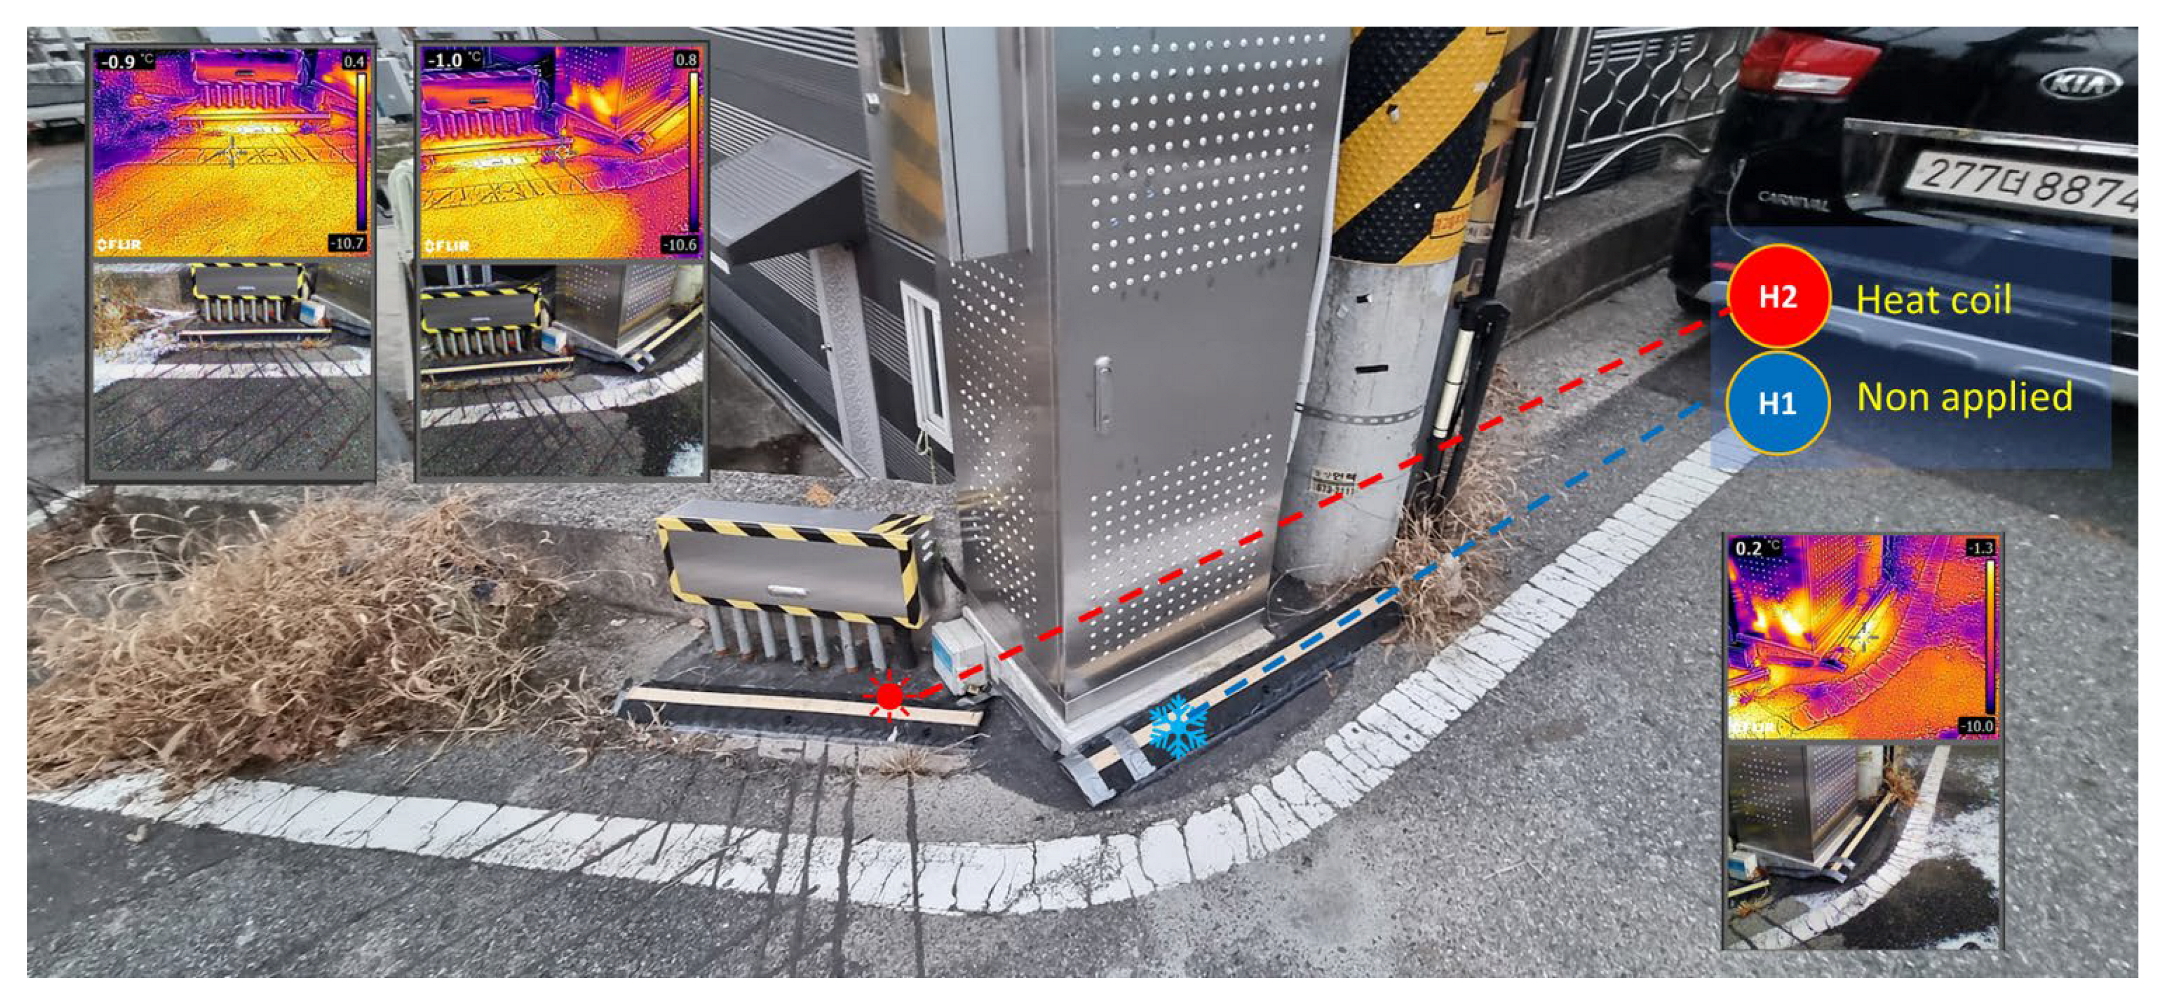
Figure 7.
Schematic diagram of FI and CI formulas with monitoring components.
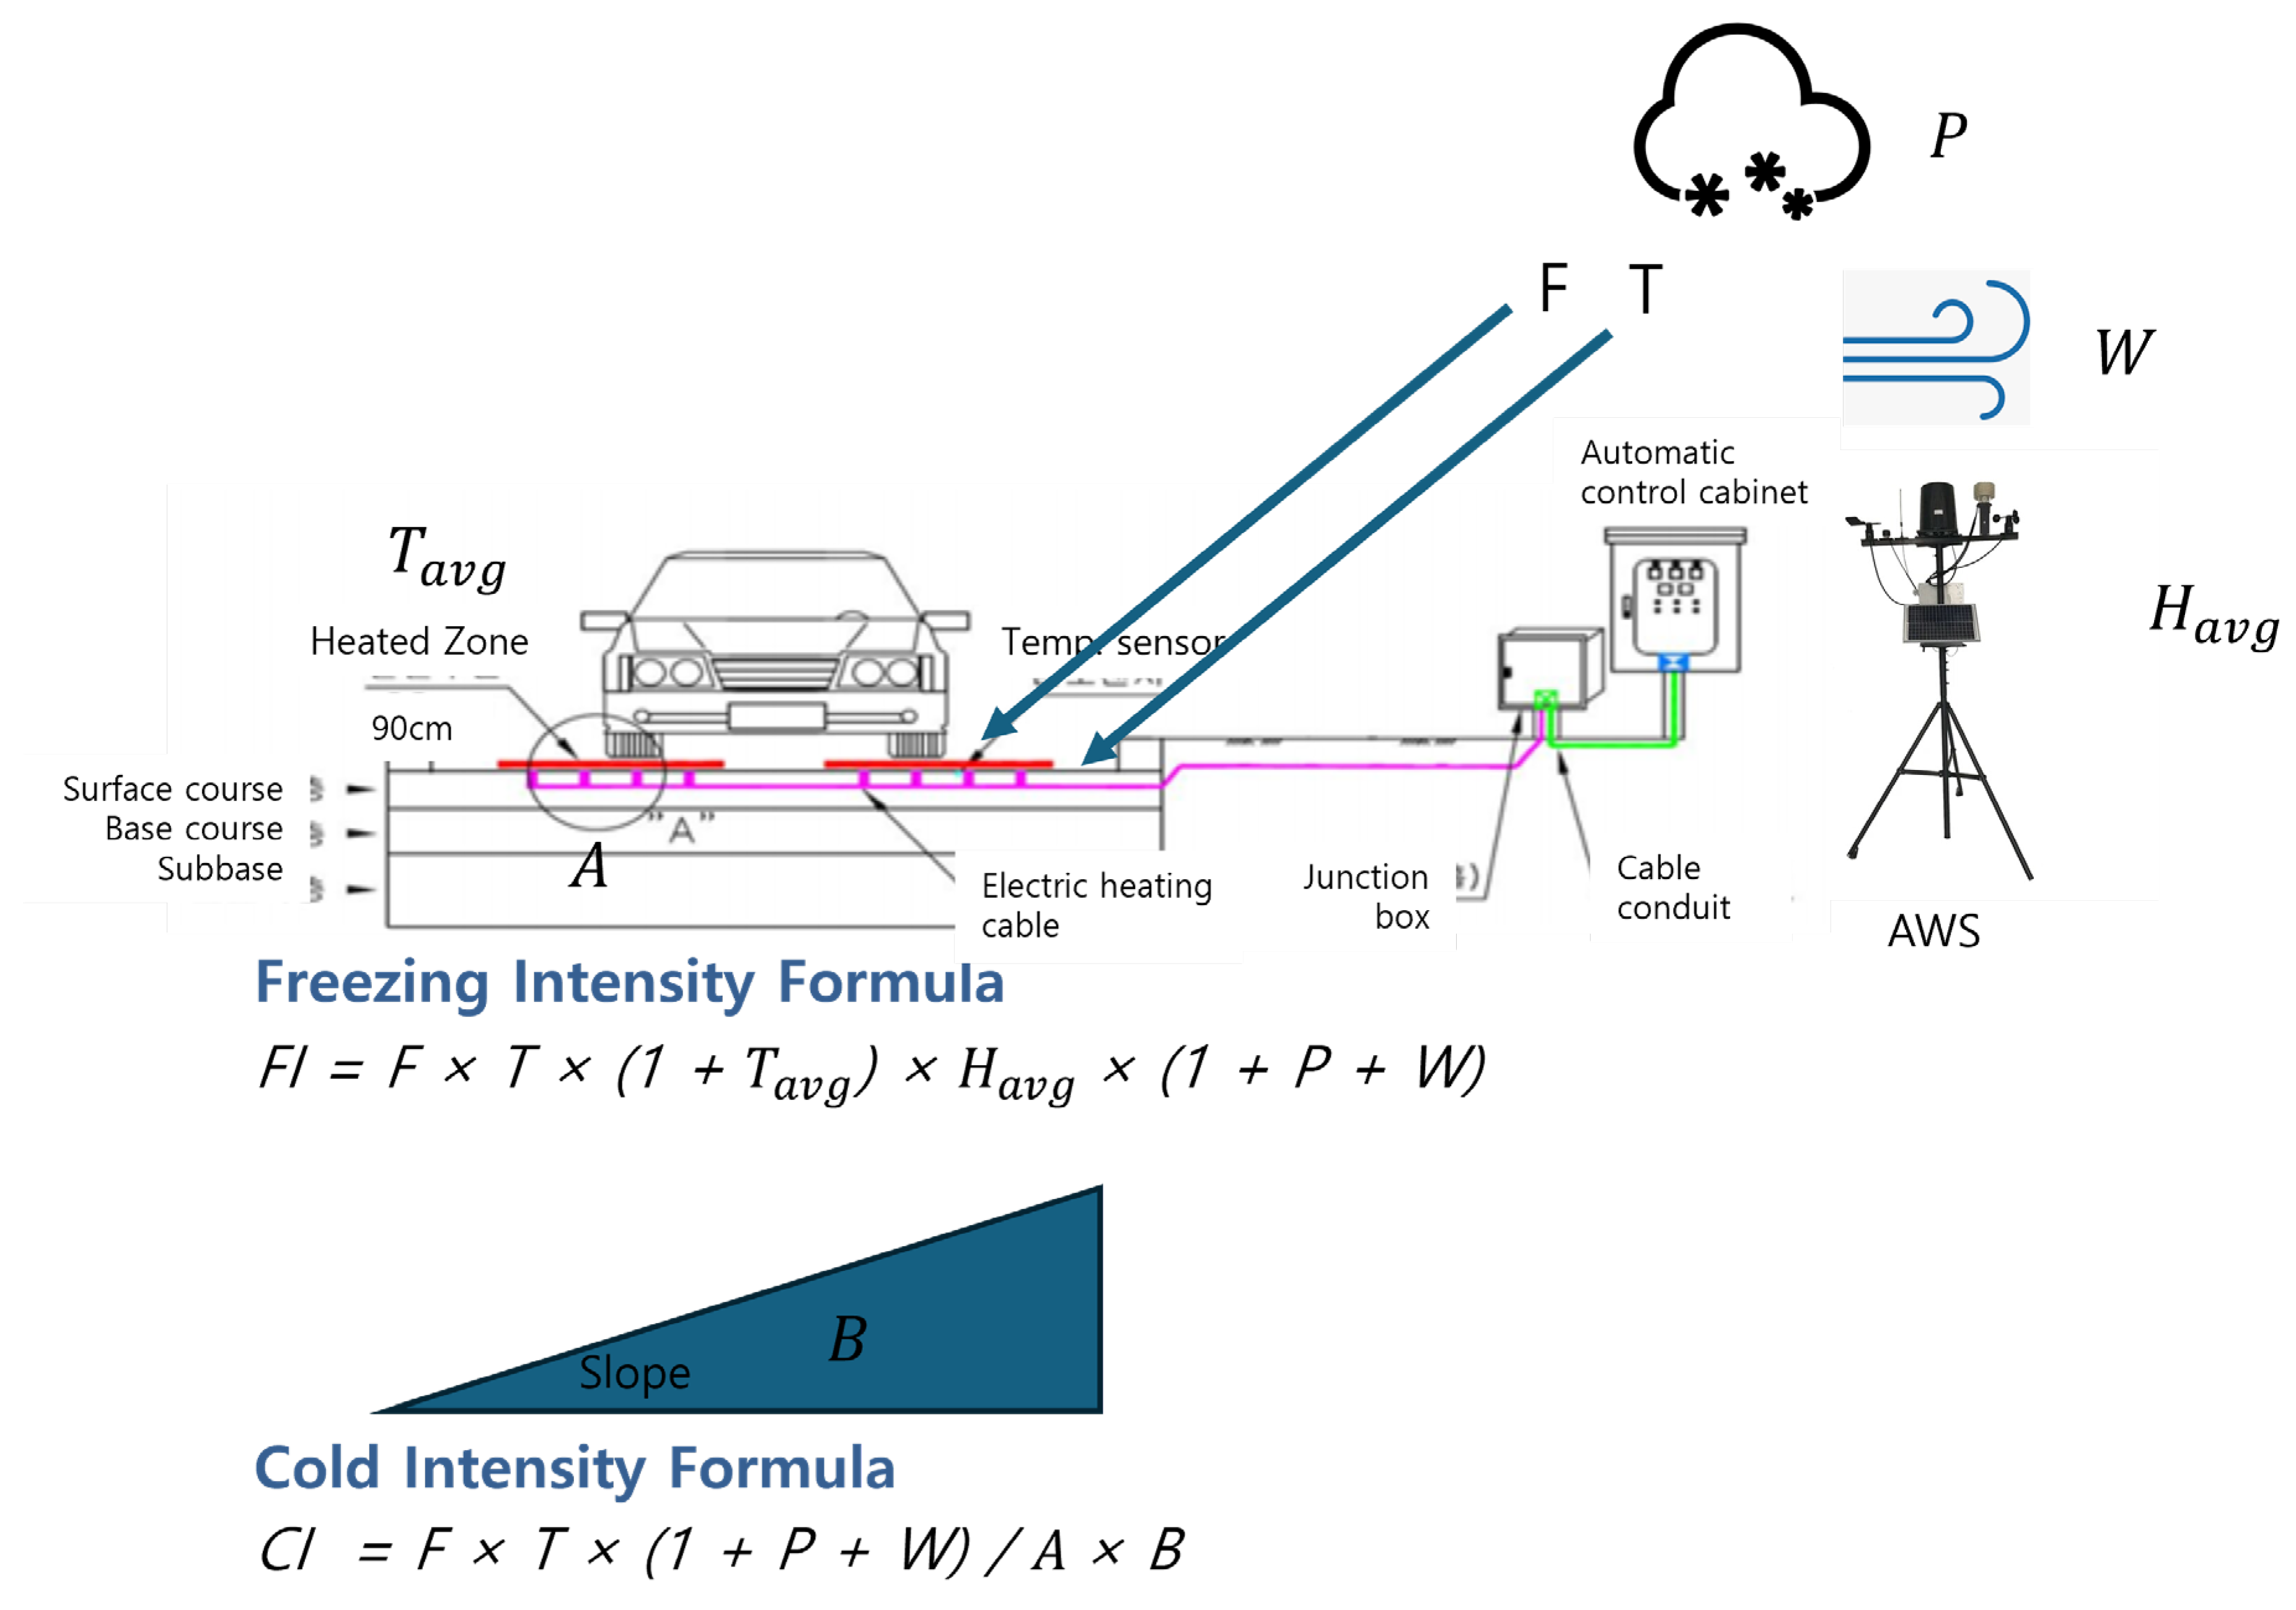
Figure 8.
Workflow diagram of FI and CI calculation, validation, and gap analysis.
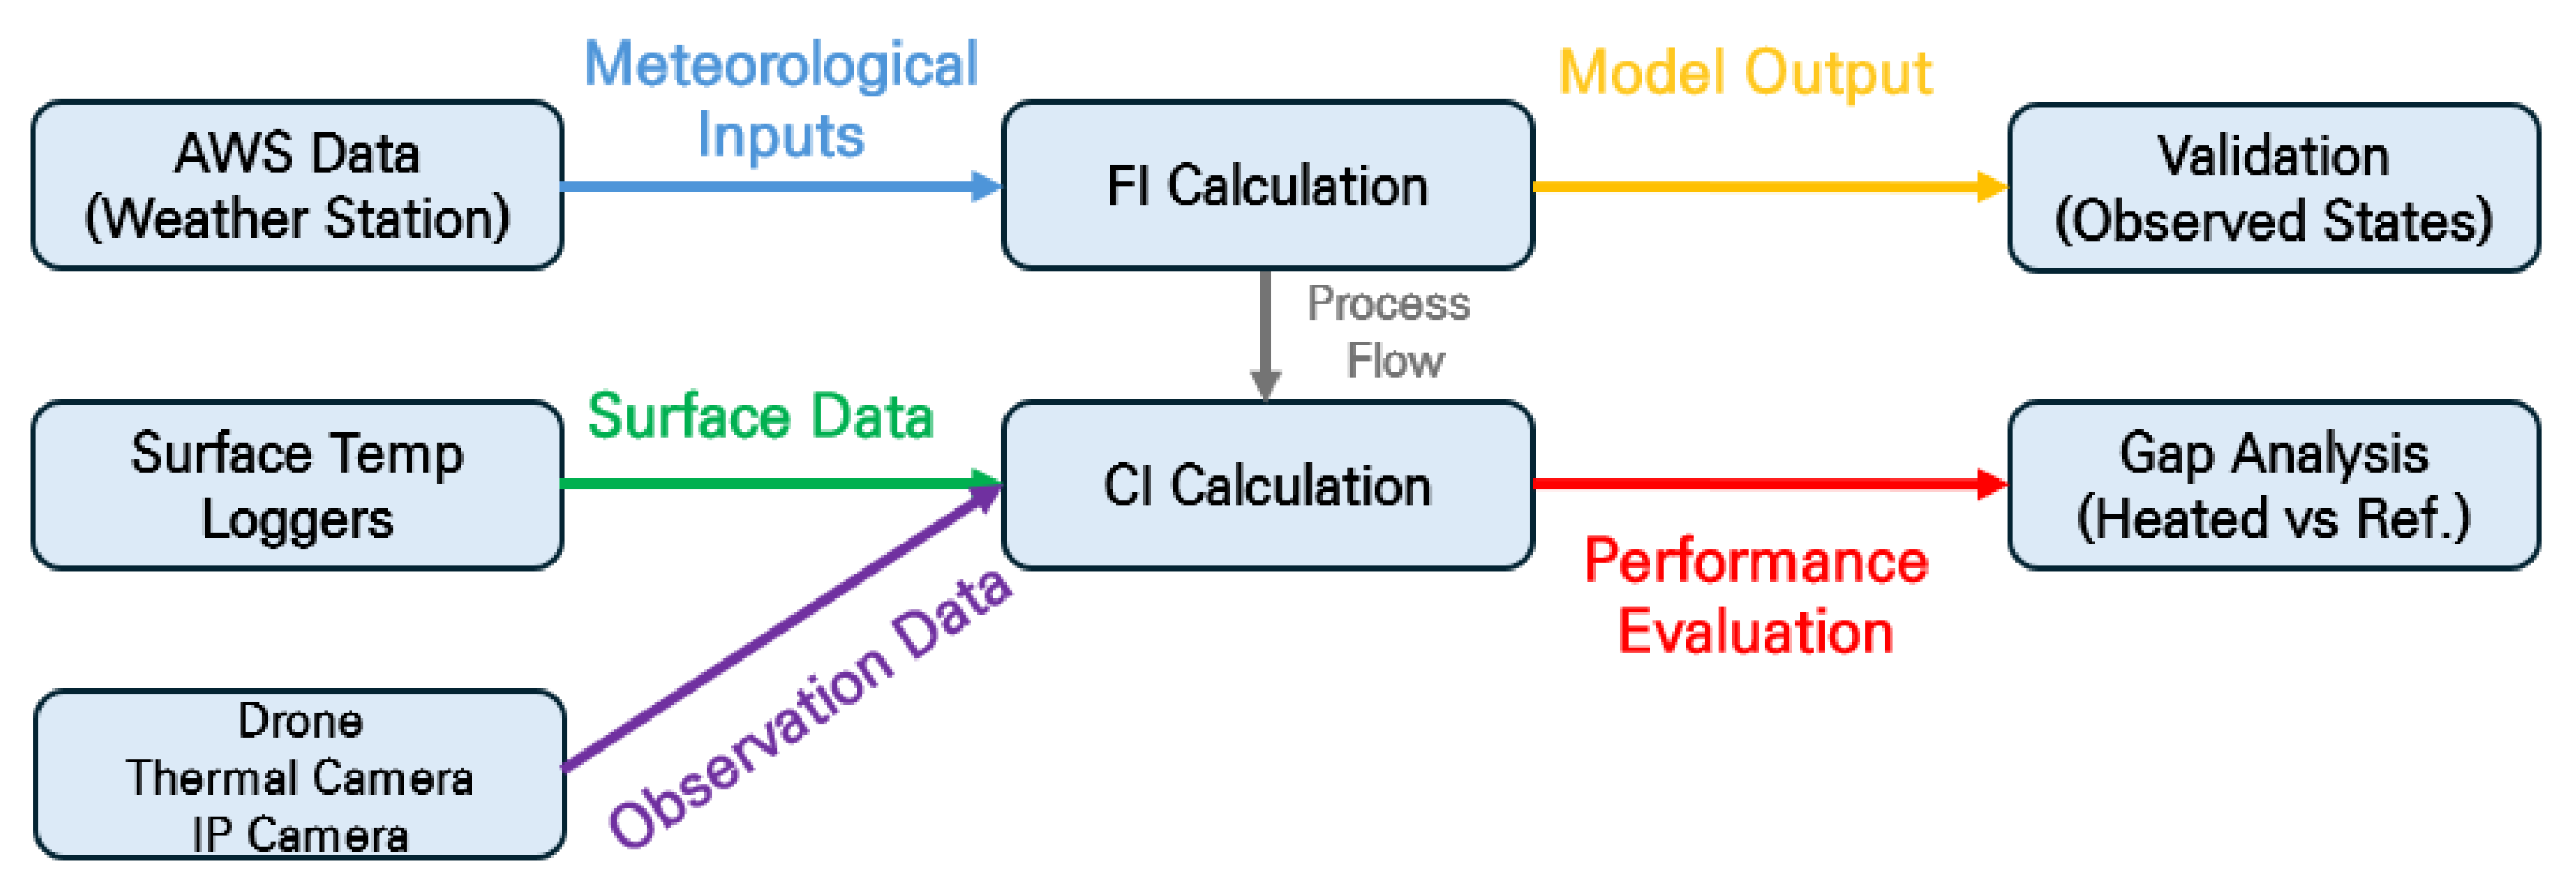
Figure 9.
Comparison of surface temperatures between heated and reference sections (Jan 1–14, 2025).
Figure 9.
Comparison of surface temperatures between heated and reference sections (Jan 1–14, 2025).
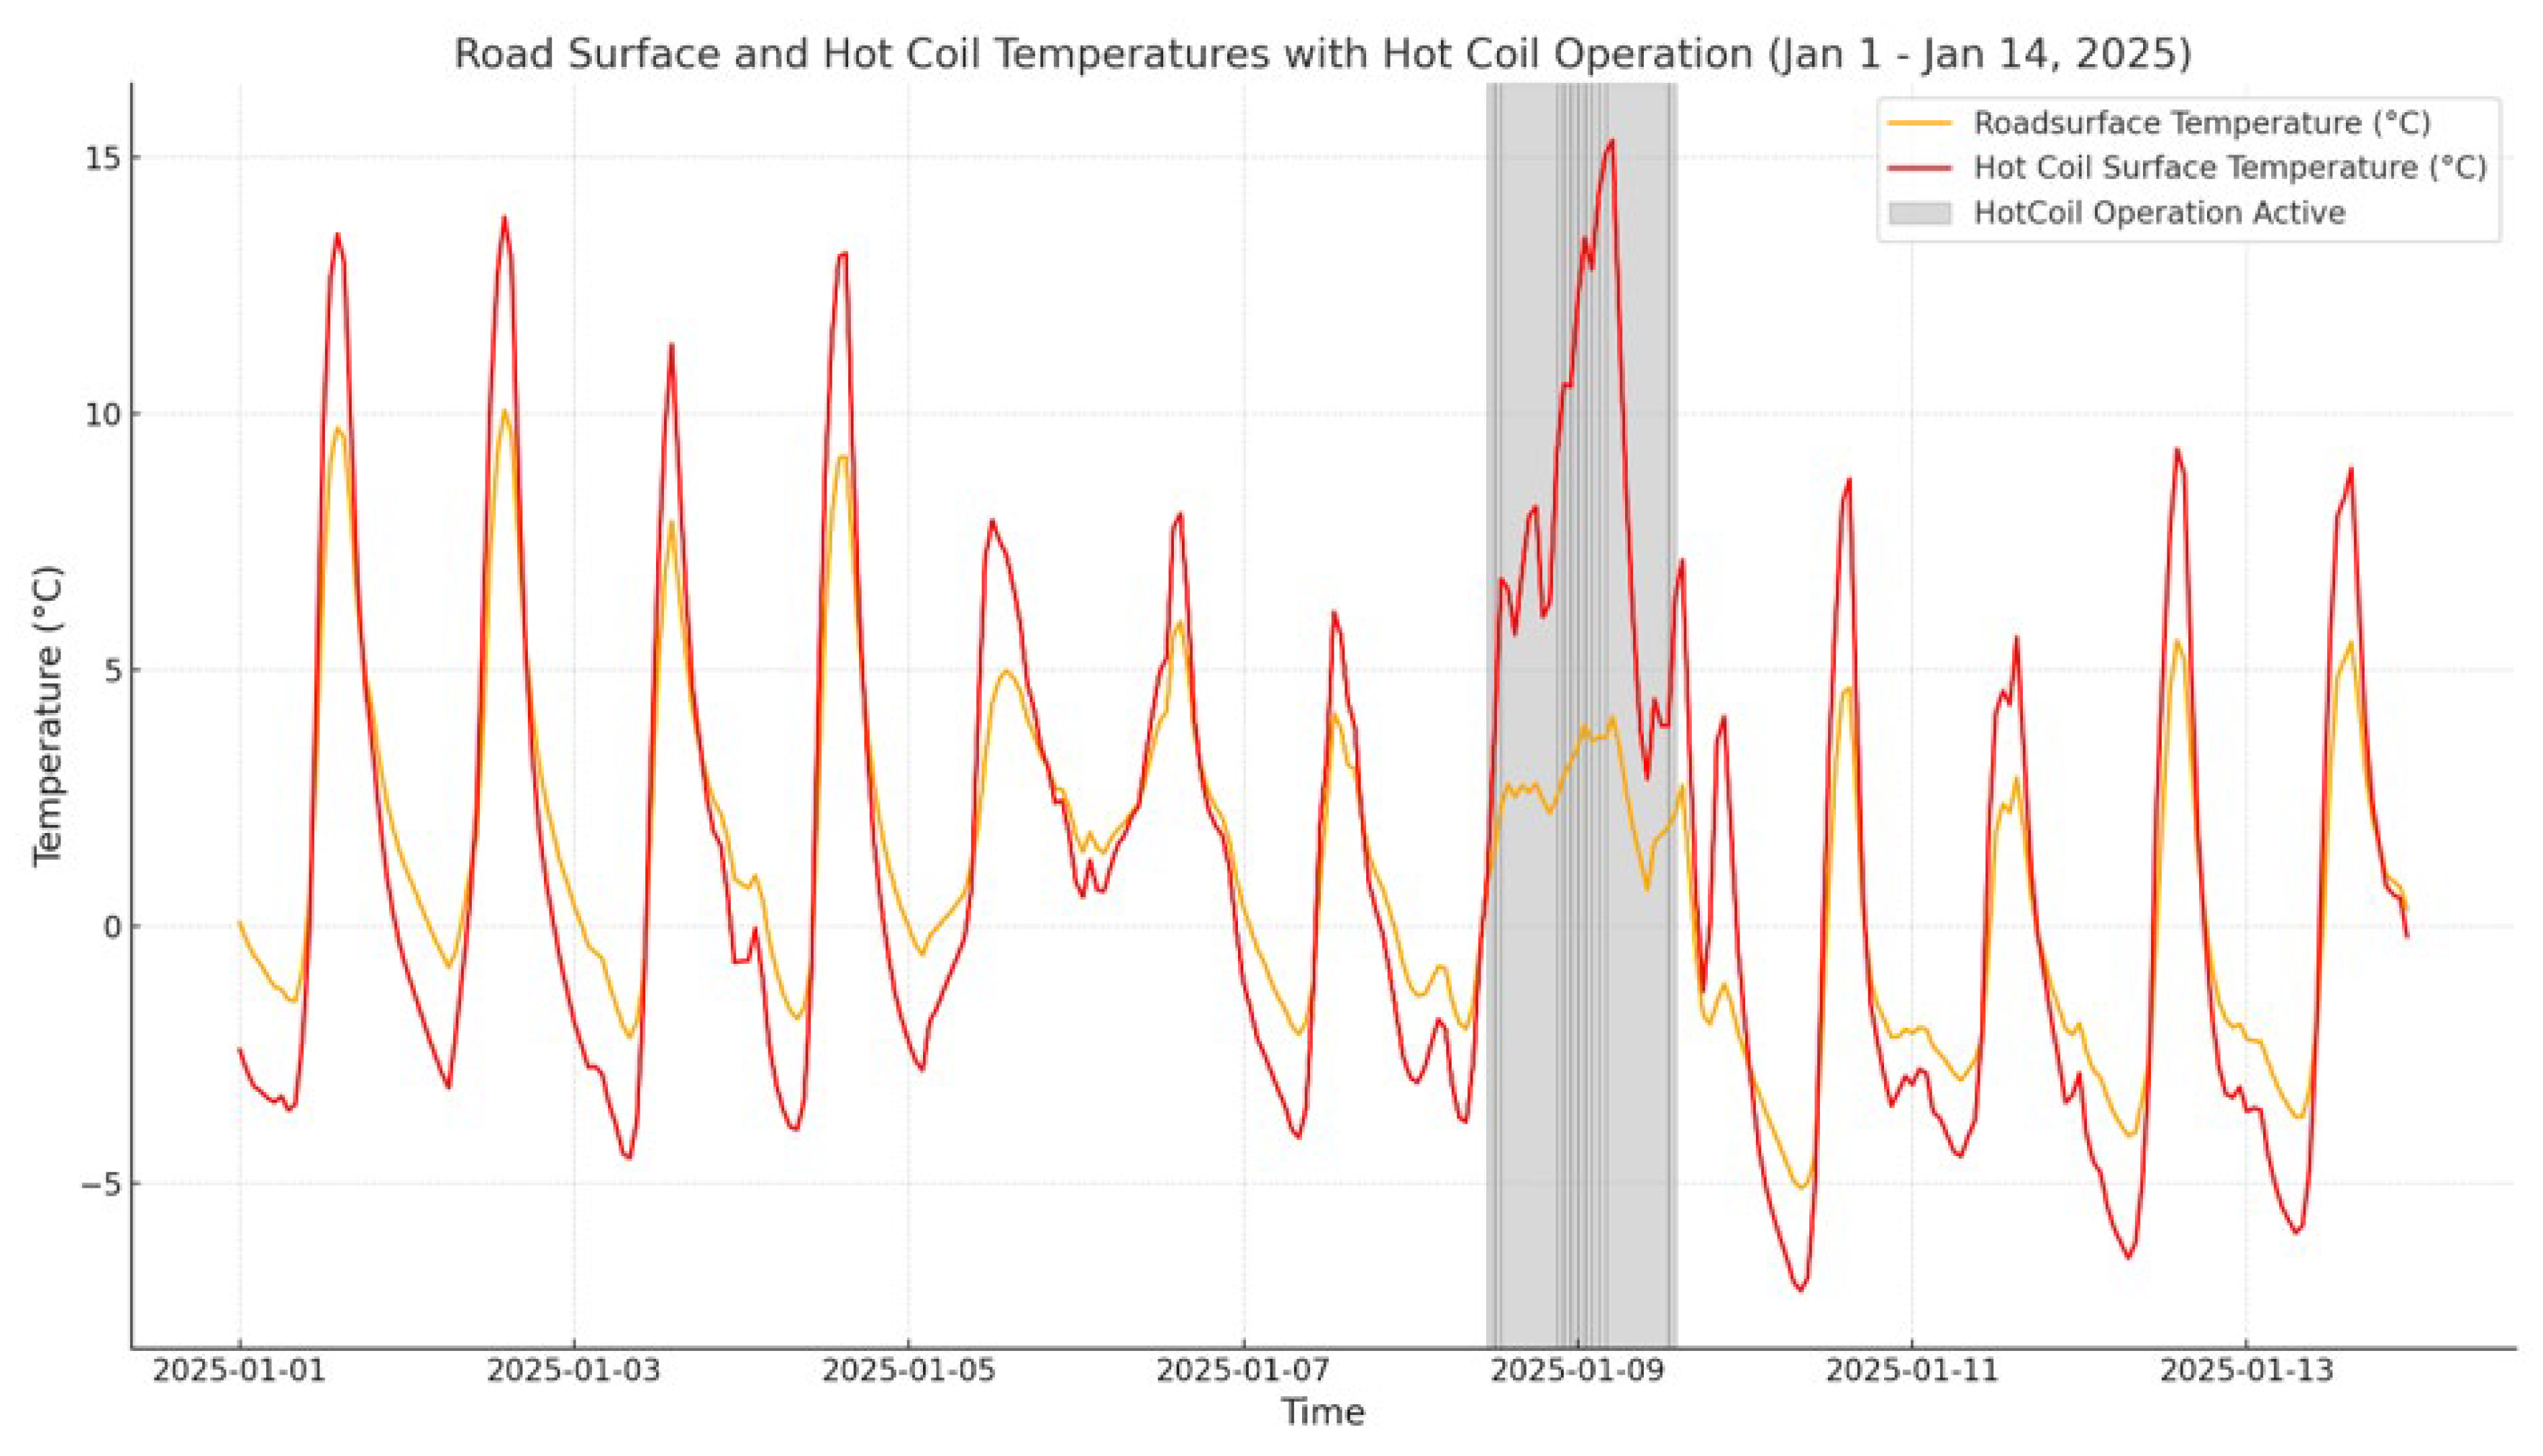
Figure 10.
Thermal camera verification of heated vs. reference segments.
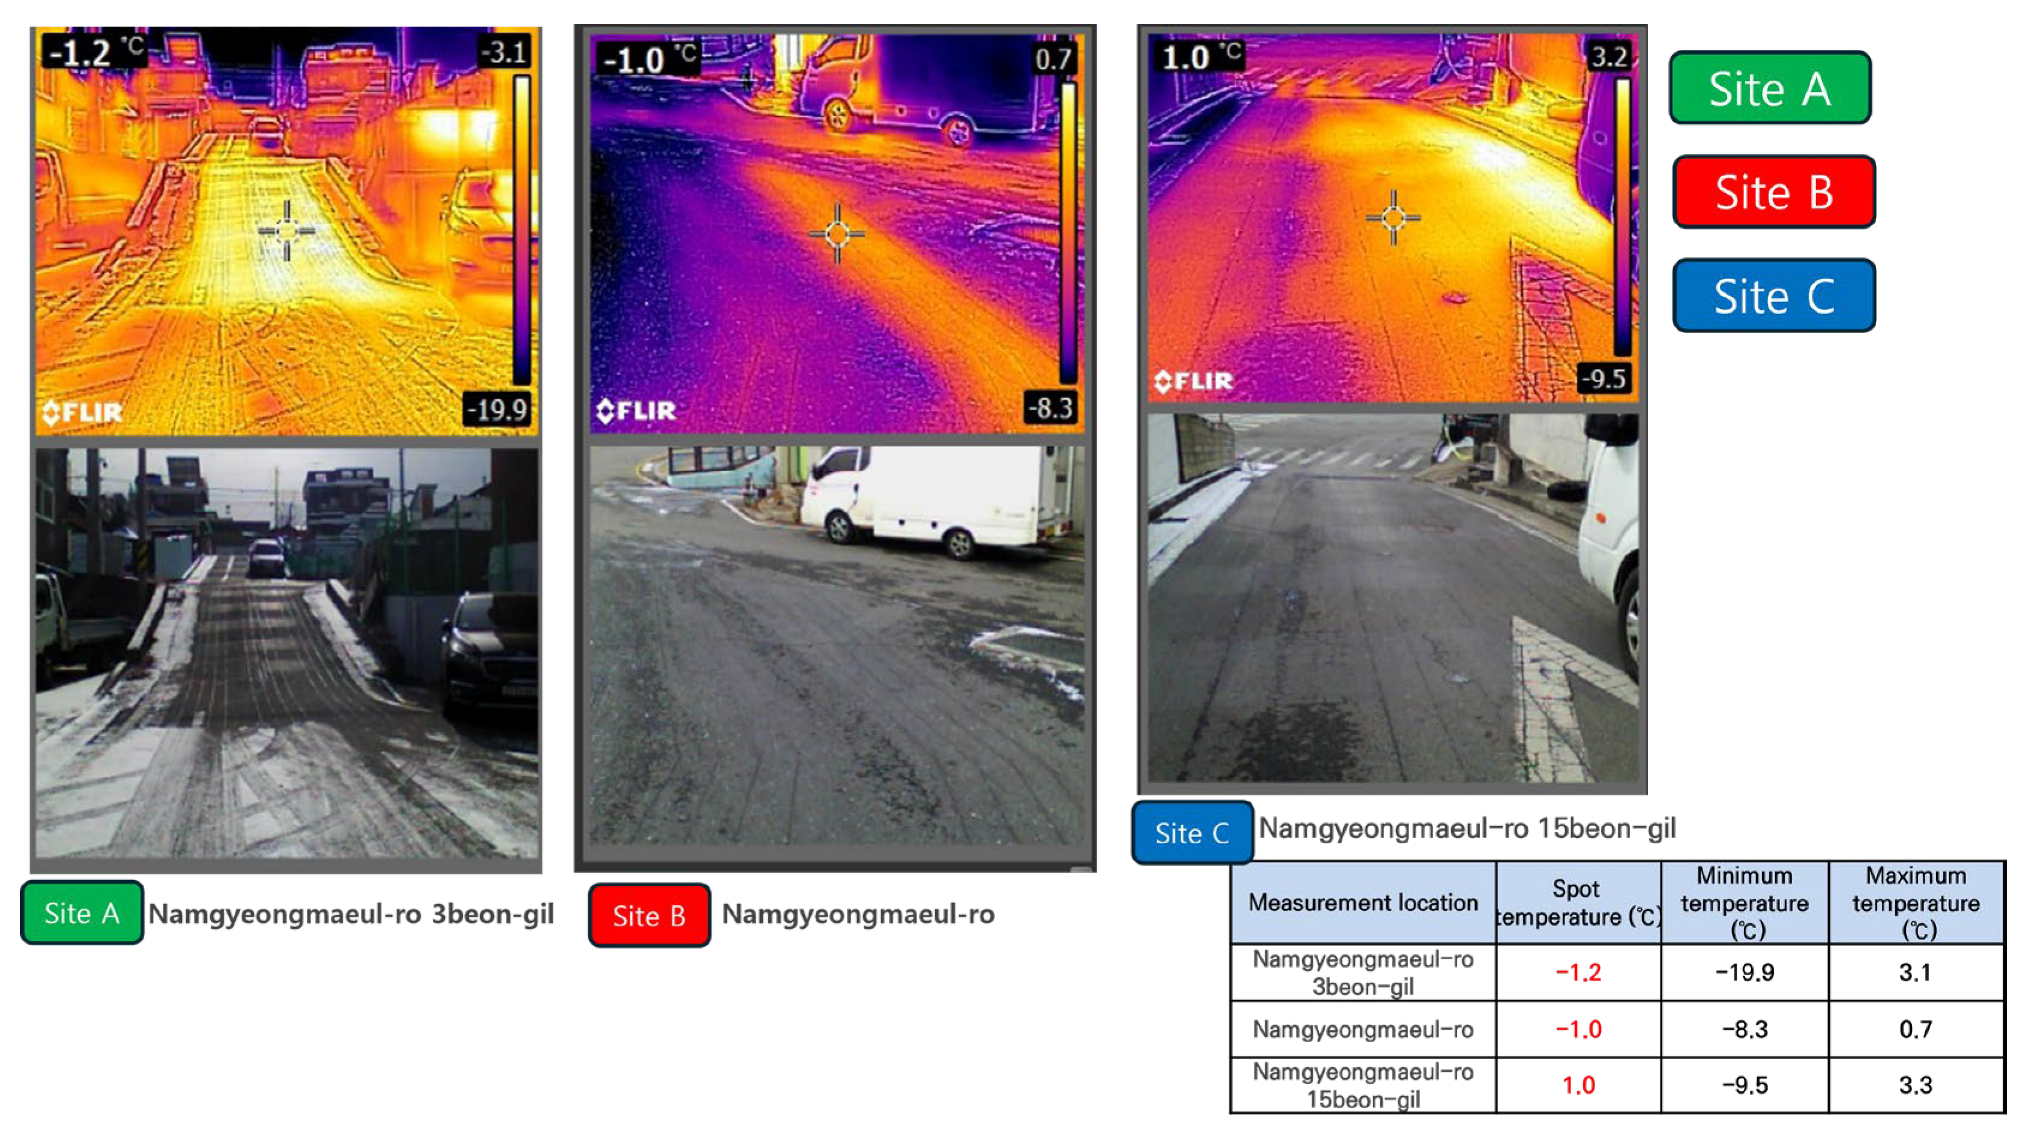
Table 1.
Parameters and devices used for FI/CI computation and monitoring.
| Device | Model | Function | Frequency | Notes |
|---|---|---|---|---|
| AWS (Weather Station) | Ecowitt WS69 | Air temp, humidity, wind, precipitation, UV | 5-min | Winterized version |
| Data Loggers | T&D TR-71WF | Surface temperature logging | 5-min | Heated/non-heated zones |
| Thermal Camera | FLIR E6 | Infrared surface imaging | Daily snapshot | With timestamps |
| Drone | DJI Mini Series | Aerial thermal mapping | Weekly | Post-snow events |
Table 2.
Differences between Freezing Intensity (FI) and Cold Intensity (CI).
| Category | Freezing Intensity (FI) | Cold Intensity (CI) |
|---|---|---|
| Objective | Predicting the likelihood of icing in advance | Assessing icing severity and on-site conditions |
| Base Data | Meteorological conditions (e.g., road surface temperature, precipitation, humidity) | Road condition data (e.g., RHS operation status, slope presence) |
| Application Timing | Pre-event preventive measures (e.g., activation conditions for RHS) | Post-event response, countermeasure evaluation, and effectiveness assessment |
| Strengths | Enhanced predictability, simplified computation | Accurate state reflection, improved safety assurance |
Table 4.
Comparative framework of FI (predictive index) and CI (evaluative index).
| Aspect | FI (Predictive Index) | CI (Evaluative Index) |
|---|---|---|
| Function | Triggers RHS pre-activation based on forecast conditions | Evaluates actual icing severity and RHS effectiveness |
| Application | Used for proactive, pre-icing activation | Used for validation and operational optimization |
| Time | Status | Description |
|---|---|---|
| 19:03:40 | Icing observed | Road surface icing occurred before RHS activation; high slip risk for vehicles. |
| 19:26:28 | Partial melting | RHS activated; partial melting observed with visible changes in vehicle tracks. |
| 19:36:30 | Melting in progress | Continuous melting observed across the road; vehicle tracks clearly visible. |
| 21:16:56 | Complete melting | Road surface fully de-iced; safe passage ensured with no further slip risk. |
Table 7.
Meteorological conditions associated with FI abnormal peaks [21].
Table 7.
Meteorological conditions associated with FI abnormal peaks [21].
| Case | Date & Time | Outside Temp (°C) | Road Temp (°C) | Heated Road Temp (°C) | Humidity (%) | Ref. FI | Heated FI | Ref. CI | Heated CI |
|---|---|---|---|---|---|---|---|---|---|
| ① | 2025-01-06 11:00 | 3.2 | 3.20 | 4.17 | 86.5 | 2326.9 | 0 | 12 | 0 |
| ② | 2025-01-08 12:00 | 3.0 | 3.00 | 3.64 | 85.8 | 1270 | 2390 | 12 | 6 |
| ③ | 2025-01-09 13:00 | 3.5 | 3.50 | 3.92 | 70.3 | 1239 | 2072 | 12 | 6 |
Table 8.
FI and CI gap values between heated and reference sections at Site A.
| Index | Heated Section (Hotcoil) | Reference Section (Road) | Gap (Ref. – Heated) |
|---|---|---|---|
| FI | ~76.4 (avg), max 2390.5 | ~234.4 (avg), max 2439.5 | >2000 (during peaks) |
| CI | ~0.36 (avg), max 7.5 | ~2.07 (avg), max 15.0 | 6–8 points reduction |
Disclaimer/Publisher’s Note: The statements, opinions and data contained in all publications are solely those of the individual author(s) and contributor(s) and not of MDPI and/or the editor(s). MDPI and/or the editor(s) disclaim responsibility for any injury to people or property resulting from any ideas, methods, instructions or products referred to in the content. |
© 2025 by the authors. Licensee MDPI, Basel, Switzerland. This article is an open access article distributed under the terms and conditions of the Creative Commons Attribution (CC BY) license (http://creativecommons.org/licenses/by/4.0/).
Copyright: This open access article is published under a Creative Commons CC BY 4.0 license, which permit the free download, distribution, and reuse, provided that the author and preprint are cited in any reuse.


