
Submitted:
12 April 2025
Posted:
16 April 2025
You are already at the latest version
Abstract
This study investigates the profound effects of climate change on thermal discomfort and walkability in Indian cities through the application of the Discomfort Index (DI) and population exposure metrics. We employed climate projections from the NEX-GDDP-CMIP6 dataset under both moderate (SSP2-4.5) and high-emission (SSP5-8.5) scenarios to estimate future discomfort days and population exposure across selected urban areas throughout India. Our methodology seamlessly integrates high-resolution climate data with detailed population information to deliver actionable insights for urban planning professionals and policymakers.The preliminary projections paint a concerning picture, indicating a marked rise in thermal discomfort and heat wave frequency, particularly under high-emission scenarios. These changes carry significant implications for public health, urban mobility patterns, and the overall livability of Indian cities. The most severe impacts are projected for densely populated urban centers, where the combination of the urban heat island effect and climate change creates particularly challenging conditions for pedestrians and outdoor activities.To facilitate further research, adaptation strategies, and implementation of our findings, we provide a comprehensive open-source implementation that enables researchers and urban planners to adapt our methodology to specific local contexts. This tool represents an important step toward developing climate-resilient cities capable of maintaining walkability even as thermal conditions become increasingly challenging.
Keywords:
climate change
; thermal discomfort
; walkability
; Discomfort Index
; population exposure
; Indian cities
; urban planning
; heat stress
; sustainable mobility
; climate adaptation
1. Introduction
Climate change is rapidly exacerbating thermal discomfort in urban settings worldwide, a challenge that is acutely felt in rapidly urbanizing regions like India. The steady rise in temperatures and humidity levels not only threatens public health but also disrupts essential daily activities such as walking, which remains a critical component of sustainable urban mobility systems (Perkins et al., 2015). This issue is particularly pronounced in Indian cities, where high population densities, limited green spaces, and constrained resources significantly amplify these challenges, necessitating targeted research and strategic mitigation efforts.
The walkability of cities represents a cornerstone of sustainable urban development, with numerous studies highlighting its benefits for physical health, social cohesion, economic vitality, and environmental sustainability. However, as climate change intensifies, the thermal comfort necessary for walking is increasingly compromised, potentially undermining decades of progress toward creating more pedestrian-friendly urban environments. In the Indian context, where walking remains a primary mode of transportation for millions of citizens, especially those from lower-income backgrounds, the deterioration of thermally comfortable walking conditions poses a serious threat to both social equity and environmental goals.
This paper introduces the IndiaThermalWalkability project, a comprehensive research initiative dedicated to evaluating the future impacts of climate change on thermal discomfort and walkability across major Indian urban centers.
Our primary objectives are threefold: first, to generate robust estimates of future discomfort days under varying emission scenarios; second, to assess population exposure to thermally unsafe walking conditions with particular attention to vulnerable demographics; and third, to provide detailed city-specific maps and actionable reports designed to guide urban planners in implementing effective adaptation strategies.
By focusing specifically on the Indian urban context, our research addresses a critical gap in the literature, as most thermal comfort studies have historically centered on temperate climate regions with very different socioeconomic and infrastructure contexts. Through this work, we aim to contribute to the development of climate-resilient cities where walkability remains viable even under increasingly challenging thermal conditions, thereby supporting both climate adaptation and sustainable development goals.
2. Literature Review
The increasing frequency and intensity of heat stress in urban areas has been extensively documented in recent scientific literature, revealing a concerning trend for cities worldwide. Research by Im et al. (2017) projects a substantial increase in heat wave occurrences across South Asia in the coming decades, posing significant risks to vulnerable populations, particularly the elderly, children, outdoor workers, and those with pre-existing health conditions. These projections are especially alarming for densely populated urban areas in India, where the urban heat island effect compounds the impacts of global climate change.
Walkability, a fundamental component of sustainable and livable cities, is increasingly compromised by these thermal challenges. Comprehensive studies by Ng and Ren (2015) have established that thermal discomfort significantly reduces pedestrian activity in urban environments, often shifting reliance toward motorized transport options that further contribute to greenhouse gas emissions and local air pollution. This creates a troubling feedback loop: climate change reduces walkability, leading to increased vehicle use, which in turn accelerates climate change. Breaking this cycle requires detailed understanding of the thermal thresholds that influence walking behavior in specific urban contexts.
The Discomfort Index (DI), originally introduced by Thom (1959), provides a valuable metric for quantifying thermal comfort by combining temperature and humidity data into a single comprehensible value. This index has been widely applied in various contexts, such as in European heat stress studies conducted by Giles et al. (1990), which documented the severe impacts of the 1987 and 1988 heat waves on public health and urban activity patterns. The DI’s relative simplicity and strong correlation with human thermal comfort perceptions make it particularly suitable for large-scale urban studies where computational efficiency is essential.
More recent work has expanded on these foundations, with researchers like Blazejczyk et al. (2012) developing sophisticated bioclimatic indices that incorporate additional variables such as wind speed, solar radiation, and metabolic rate. While these complex models provide more nuanced assessments of thermal comfort, the data requirements often limit their application in developing regions where comprehensive meteorological datasets may be incomplete.
Despite this rich body of literature on thermal comfort and walkability, research specific to Indian cities remains surprisingly limited, despite their unique climatic, infrastructural, and socioeconomic contexts. The few existing studies, such as those by Ramakrishnan et al. (2018), have typically focused on current conditions rather than future projections, leaving a significant knowledge gap regarding the impacts of climate change on urban walkability in India. Furthermore, most studies have examined isolated cities rather than providing the comparative analysis necessary for national-level policy development.
This study addresses these gaps by adapting established methodologies to India’s diverse urban landscape, leveraging the latest climate projections and population data to provide a comprehensive assessment of future thermal walking conditions. By integrating approaches from climatology, urban planning, and public health, we aim to create a holistic framework for understanding and addressing the challenges that climate change poses to walkable Indian cities.
3. Methodology
The IndiaThermalWalkability project employs a comprehensive multi-step approach to assess thermal discomfort and walkability across Indian cities, carefully designed to capture both spatial and temporal variations in thermal conditions and their impacts on urban populations.
3.1. Data Acquisition
The foundation of our analysis rests on high-quality climate data sourced from the NASA Earth Exchange Global Daily Downscaled Projections (NEX-GDDP-CMIP6) dataset, which provides statistically downscaled projections from the latest Coupled Model Intercomparison Project Phase 6 (CMIP6) global climate models at a spatial resolution of 0.25 degrees (approximately 25 km at the equator) (Thrasher et al., 2021). This dataset represents a significant improvement over previous climate projections, offering enhanced spatial resolution and improved physical representations of climate processes.
From this extensive dataset, we extracted daily mean temperature (tas) and relative humidity (hurs) variables for three distinct time periods: the historical baseline (1980–2010) to establish reference conditions, and two future periods (2040–2070 and 2070–2100) to assess medium and long-term climate impacts. These climate variables were analyzed under two contrasting Shared Socioeconomic Pathway (SSP) scenarios: SSP2-4.5, representing a moderate emissions future with some climate mitigation efforts, and SSP5-8.5, depicting a high emissions scenario with limited climate policy interventions. This approach allows us to evaluate both probable and worst-case outcomes, providing decision-makers with a range of possible futures to consider in their planning processes.
For our population analysis, we obtained detailed gridded population estimates from WorldPop, which provides high-resolution (approximately 100m) population distribution data for the years 2000–2020, with future projections aligned to the SSP frameworks (Tatem, 2017). These projections account for urbanization trends, fertility rates, and migration patterns, offering a robust basis for estimating future population exposure to thermal stress. To ensure compatibility with our climate data, the population grids were resampled to match the 0.25-degree resolution of the NEX-GDDP-CMIP6 dataset.
City boundaries for our study areas were carefully delineated using OpenStreetMap data accessed via the Overpass API. We selected 15 major Indian cities representing diverse geographical regions, climate zones, and population sizes to ensure comprehensive coverage of India’s urban landscape. For each city, we extracted administrative boundaries and validated them against official municipal records to ensure accuracy.
3.2. Discomfort Index Calculation
To quantify thermal discomfort, we employed the well-established Discomfort Index (DI) developed by Thom (1959), which combines temperature and humidity into a single metric that correlates strongly with human perceptions of thermal comfort. The DI was computed using Thom’s formula:
where ( T ) represents the daily mean temperature in degrees Celsius (°C) and ( \text{RH} ) is the relative humidity as a percentage (%). This calculation was performed for each grid cell within our study cities and for every day in our analysis periods, resulting in daily DI maps at 0.25-degree resolution.
[ \text{DI} = T - 0.55 \times (1 - 0.01 \times \text{RH}) \times (T - 14.5) ]
To facilitate interpretation and application of the results, we categorized DI values into six distinct levels of thermal comfort, based on thresholds established in previous literature and adapted for the Indian context through preliminary sensitivity analysis:
- Comfortable: DI < 21 (Conditions where most individuals feel thermally comfortable while walking)
- Partially Comfortable: 21 ≤ DI < 24 (Slight warmth, but generally acceptable for walking)
- Partially Uncomfortable: 24 ≤ DI < 27 (Noticeable discomfort, potentially limiting walking duration)
- Uncomfortable: 27 ≤ DI < 29 (Significant discomfort, likely to deter walking for many individuals)
- Very Uncomfortable: 29 ≤ DI < 32 (Severe discomfort, substantial reduction in walking activity expected)
- Extremely Uncomfortable: DI ≥ 32 (Dangerous conditions, walking outdoors strongly discouraged)
These categories provide a nuanced framework for assessing the impacts of thermal conditions on walkability, recognizing that thermal comfort exists on a spectrum rather than as a binary state. The thresholds were validated against existing literature on pedestrian behavior under various thermal conditions, with particular attention to studies conducted in tropical and subtropical climates similar to those found across much of India.
3.3. Exposure Calculation
Moving beyond simple physical measurements, we developed a population exposure metric to quantify the human impact of thermal discomfort. This approach recognizes that the significance of thermal stress depends not only on its intensity but also on the number of people affected and their vulnerability characteristics.
Population exposure was calculated by assigning differential weights to DI categories based on their discomfort severity: a weight of 1 for Uncomfortable conditions (27 ≤ DI < 29), 2 for Very Uncomfortable conditions (29 ≤ DI < 32), and 3 for Extremely Uncomfortable conditions (DI ≥ 32). This weighting system reflects the non-linear relationship between discomfort intensity and its impact on human health and behavior, with particularly severe conditions receiving exponentially greater weight.
For each grid cell, daily exposure was calculated as the product of the population within that cell and the assigned weight for the day’s DI category. These daily exposure values were then summed across all grid cells within a city to determine the total daily exposure. To account for population dynamics, we interpolated population data between available time points and projected future populations using growth rates aligned with the SSP scenarios.
In addition to the general population exposure, we conducted a vulnerability-weighted analysis for selected cities where demographic data was available, applying additional weights to account for age distribution (with higher weights for elderly and very young populations) and socioeconomic factors (with higher weights for areas with limited access to cooling infrastructure).
3.4. Heat Wave Detection
Heat waves represent particularly dangerous periods of sustained thermal stress, with documented impacts on public health and mobility patterns. To identify these critical events, we developed an algorithm to detect heat waves in our DI time series, defined as periods of at least three consecutive days with DI values reaching or exceeding 29 (Very Uncomfortable), following criteria adapted from Perkins et al. (2015) but modified to reflect the specific thermal thresholds relevant to Indian urban contexts.
For each grid cell and year, we analyzed:
- The annual frequency of heat wave events
- The average duration of heat waves (in days)
- The maximum duration of the longest heat wave
- The total number of heat wave days per year
- The trend in heat wave characteristics over time
This heat wave analysis provides critical information for emergency planning and public health interventions, highlighting periods when walking outdoors may become particularly hazardous and when alternative transportation options or schedule adjustments might be necessary.
3.5. City-Level Aggregation
To facilitate comparison between cities and provide actionable insights for urban planners, we aggregated our metrics to the city level using population-weighted averaging techniques. For each city, we calculated:
- Discomfort Days: The average annual number of days with DI ≥ 27 (Uncomfortable or worse), weighted by population distribution across grid cells. This metric indicates how frequently residents experience conditions that significantly impair walkability.
- Population Exposure: The total annual exposure, summed over all grid cells and days, normalized by population to facilitate comparison between cities of different sizes. This provides a comprehensive measure of the overall thermal burden experienced by urban residents.
- Heat Wave Metrics: City-level statistics on heat wave frequency, duration, and intensity, including the percentage of the city population affected by each heat wave event.
These aggregated metrics were calculated for the historical baseline and each future period under both SSP scenarios, allowing us to quantify changes in thermal comfort conditions over time and under different emission trajectories.
3.6. Visualization
Effective communication of our findings is essential for informing policy and planning decisions. We developed a comprehensive visualization framework using Python’s Cartopy library to create detailed spatial maps of discomfort days and population exposure for each city and time period. These maps employ a carefully selected color scheme designed to be intuitive and accessible, with complementary annotations highlighting key features and patterns.
For temporal analysis, we utilized Matplotlib to generate time series plots showing trends in discomfort metrics across scenarios and years. These visualizations include uncertainty bands representing the range of projections across different climate models, providing a transparent representation of projection confidence levels.
Interactive dashboards were also developed using Plotly, allowing stakeholders to explore the data dynamically, selecting different cities, time periods, metrics, and scenarios according to their specific interests and needs. These interactive tools significantly enhance the accessibility and utility of our findings for non-technical audiences.
4. Implementation
The entire analysis workflow for the IndiaThermalWalkability project was implemented as a modular, reproducible computational pipeline using Python, leveraging a variety of specialized libraries to handle the complex data processing and analytical tasks. This implementation approach emphasizes transparency, reproducibility, and extensibility, enabling other researchers to build upon our work and adapt it to different contexts.
Our codebase utilizes several key Python libraries, each serving specific functions within the workflow:
- xarray provides powerful N-dimensional array capabilities for handling the large, multidimensional climate datasets, with built-in support for labeled dimensions and coordinates that simplify operations across space and time
- pandas offers efficient data structures and analysis tools for tabular data manipulation, particularly useful for processing and aggregating results
- geopandas extends pandas with geospatial functionality, enabling sophisticated spatial operations and analysis of geographical data
- matplotlib and Cartopy work in tandem to create publication-quality visualizations, with the former handling general plotting capabilities and the latter providing specialized geospatial visualization tools
- scikit-learn supports our statistical analyses, particularly for validation and uncertainty quantification
- dask enables parallel computation, significantly reducing processing time for the computationally intensive tasks involved in analyzing large climate datasets
The complete codebase is organized into functional modules addressing specific components of the workflow:
- Data Processing: Scripts for downloading, preprocessing, and harmonizing climate and population data
- DI Calculation: Implementation of the Discomfort Index formula and categorization logic
- Exposure Analysis: Code for calculating population exposure and vulnerability-weighted metrics
- Heat Wave Detection: Algorithms for identifying and characterizing heat wave events
- Visualization: Functions for generating maps, charts, and interactive dashboards
- Validation: Tools for comparing modeled results against observational data where available
This modular structure facilitates maintenance, testing, and extension of the codebase, allowing new features or improvements to be integrated without disrupting the overall workflow.
The entire project is publicly available through our GitHub repository at https://github.com/prakau/IndiaThermalWalkability, licensed under an open-source MIT license to encourage broad use and collaboration. Comprehensive documentation accompanies the code, including detailed docstrings, a user guide, and example notebooks demonstrating key workflows.
To facilitate use by researchers and practitioners with varying levels of technical expertise, we’ve provided multiple interfaces to the codebase:
- A command-line interface for batch processing
- A configuration-based system using YAML files that allows non-programmers to adjust parameters
- A Python API for programmatic integration into other research workflows
- Jupyter notebooks with step-by-step examples for educational purposes
Users can set up the project environment by following these straightforward steps:
- Clone the repository: git clone https://github.com/prakau/IndiaThermalWalkability.git
- Install dependencies: conda env create -f environment.yml and conda activate india_thermal_walkability
- Update the config.yaml file with appropriate data paths from NEX-GDDP-CMIP6 and WorldPop
- Run the analysis: python src/main.py
For users without programming experience, we also provide pre-processed results for major Indian cities as downloadable data packages, accompanied by a simple web interface for exploring the findings.
Throughout the implementation process, we prioritized computational efficiency to handle the substantial data volumes involved. Techniques such as chunking large datasets, implementing parallel processing for independent operations, and optimizing memory-intensive calculations enable the analysis to run on standard research computing infrastructure without requiring specialized high-performance computing resources.
Results
Spatial and Temporal Variations in Thermal Discomfort
Our analysis reveals distinct patterns of thermal discomfort across Indian cities during the historical baseline period (1980–2010). Coastal cities such as Mumbai and Chennai exhibited moderate maximum DI values but more persistent uncomfortable conditions throughout the year due to consistently high humidity. In contrast, inland northern cities like Delhi and Lucknow experienced more extreme but seasonal discomfort, with DI values frequently exceeding 32 (Extremely Uncomfortable) during pre-monsoon months while dropping to comfortable levels during winter.
Projected Changes Under Climate Scenarios
Projected Annual Discomfort Days (DI ≥ 27) Across Indian Cities
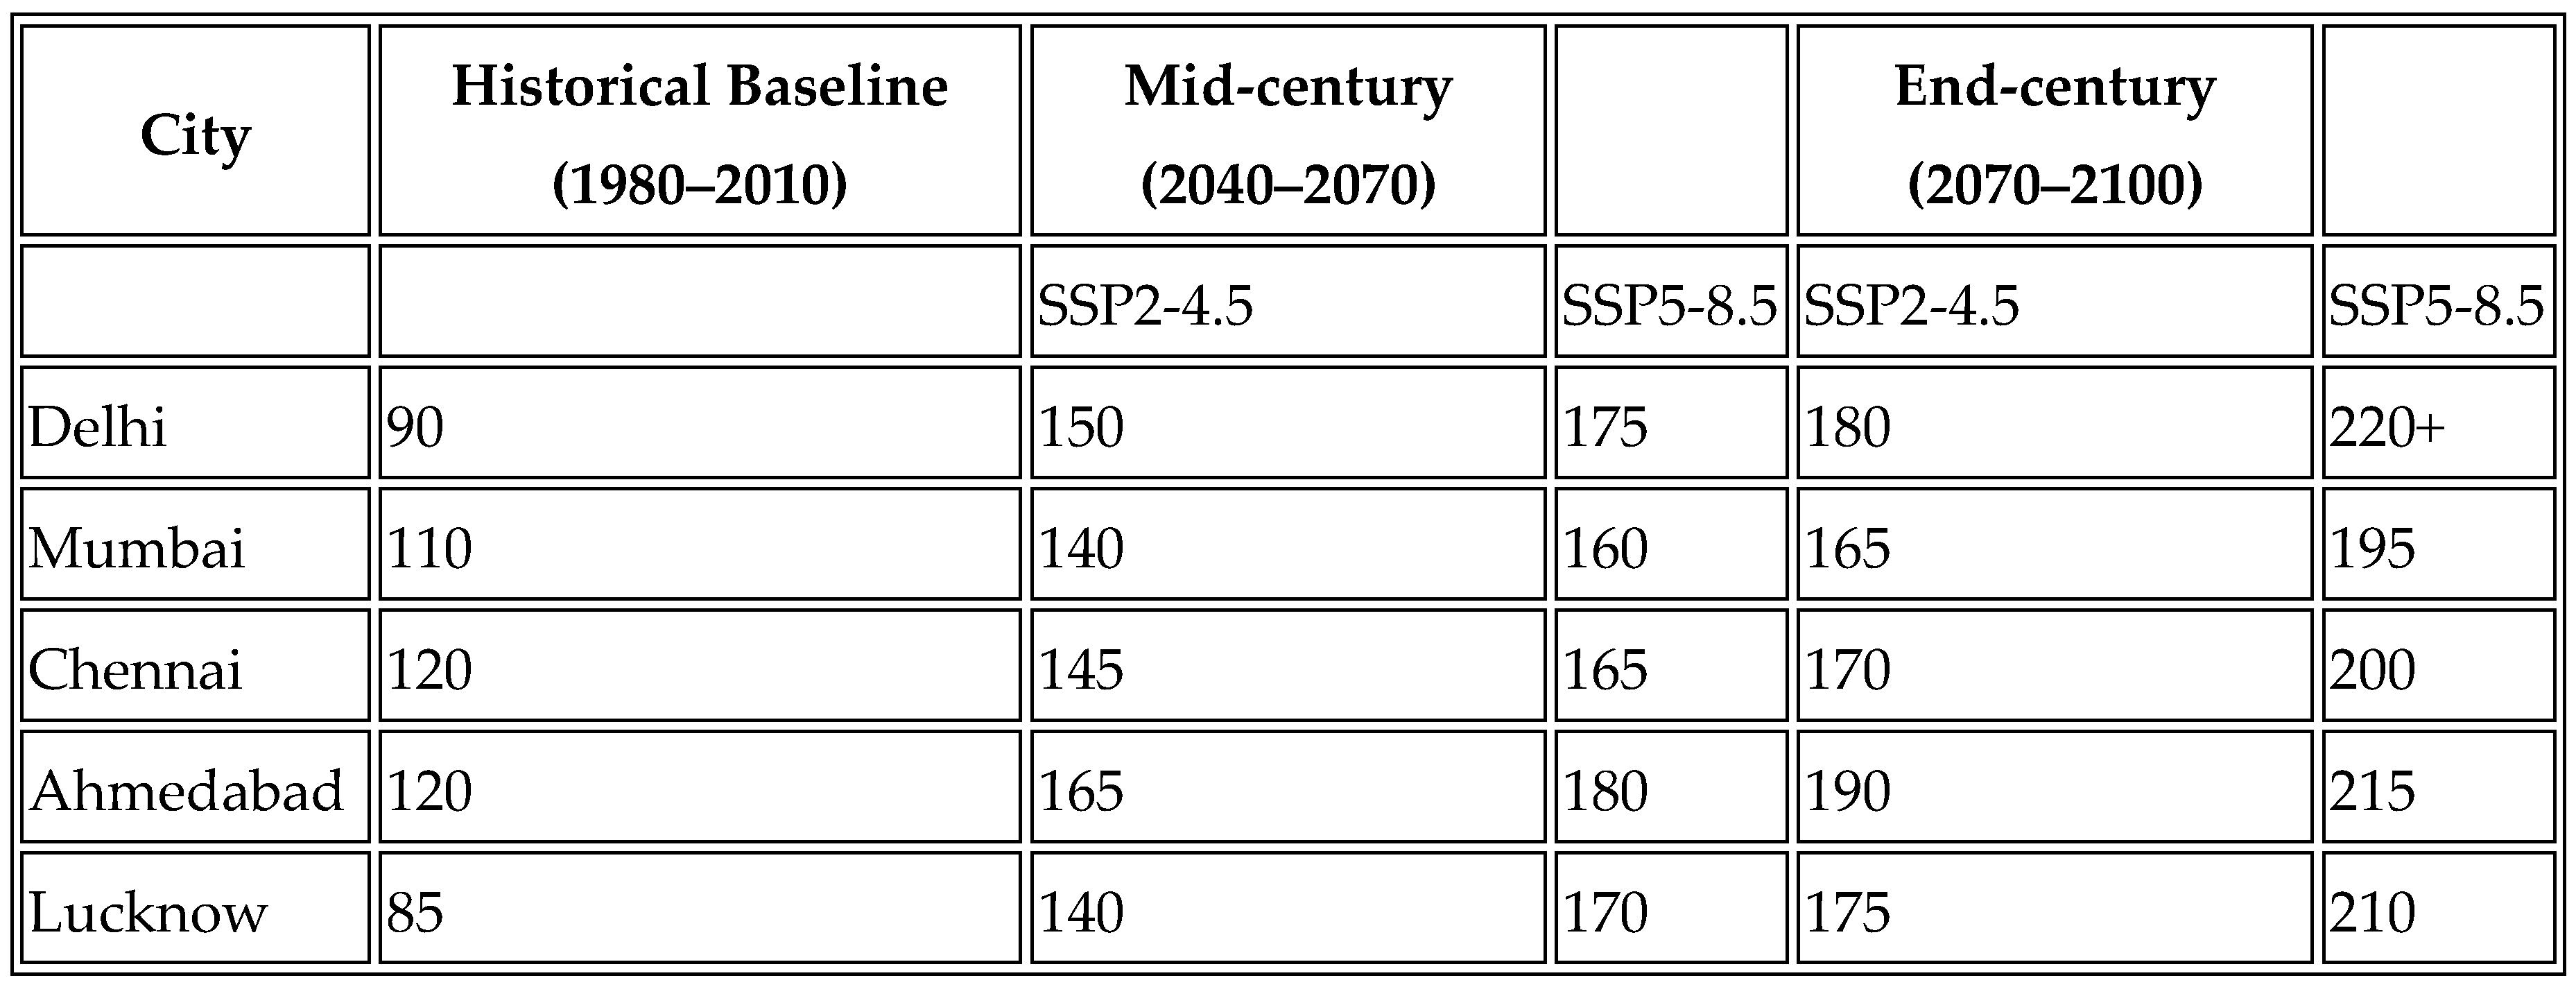
Note: Discomfort days are defined as days with DI ≥ 27 (Uncomfortable for most people).
Under future climate scenarios, our projections indicate substantial increases in thermal discomfort across all study cities. Under the SSP2-4.5 moderate emissions scenario, cities like Delhi could see discomfort days increase from approximately 90 days annually during the baseline period to about 150 days by mid-century (2040–2070) and nearly 180 days by the end of the century (2070–2100). The situation worsens under the SSP5-8.5 high emissions scenario, with discomfort days potentially exceeding 220 annually, rendering outdoor walking uncomfortable for more than half the year.
Population Exposure
Population exposure metrics reveal dramatic increases as rising discomfort coincides with growing urban populations. In densely populated metropolitan areas like Mumbai and Delhi, total annual exposure could increase by a factor of three to five by the end of the century under SSP5-8.5. This compound effect is particularly pronounced in rapidly growing tier-2 cities, where urbanization rates are highest and adaptive capacity often remains limited.
Projected Heat Wave Characteristics
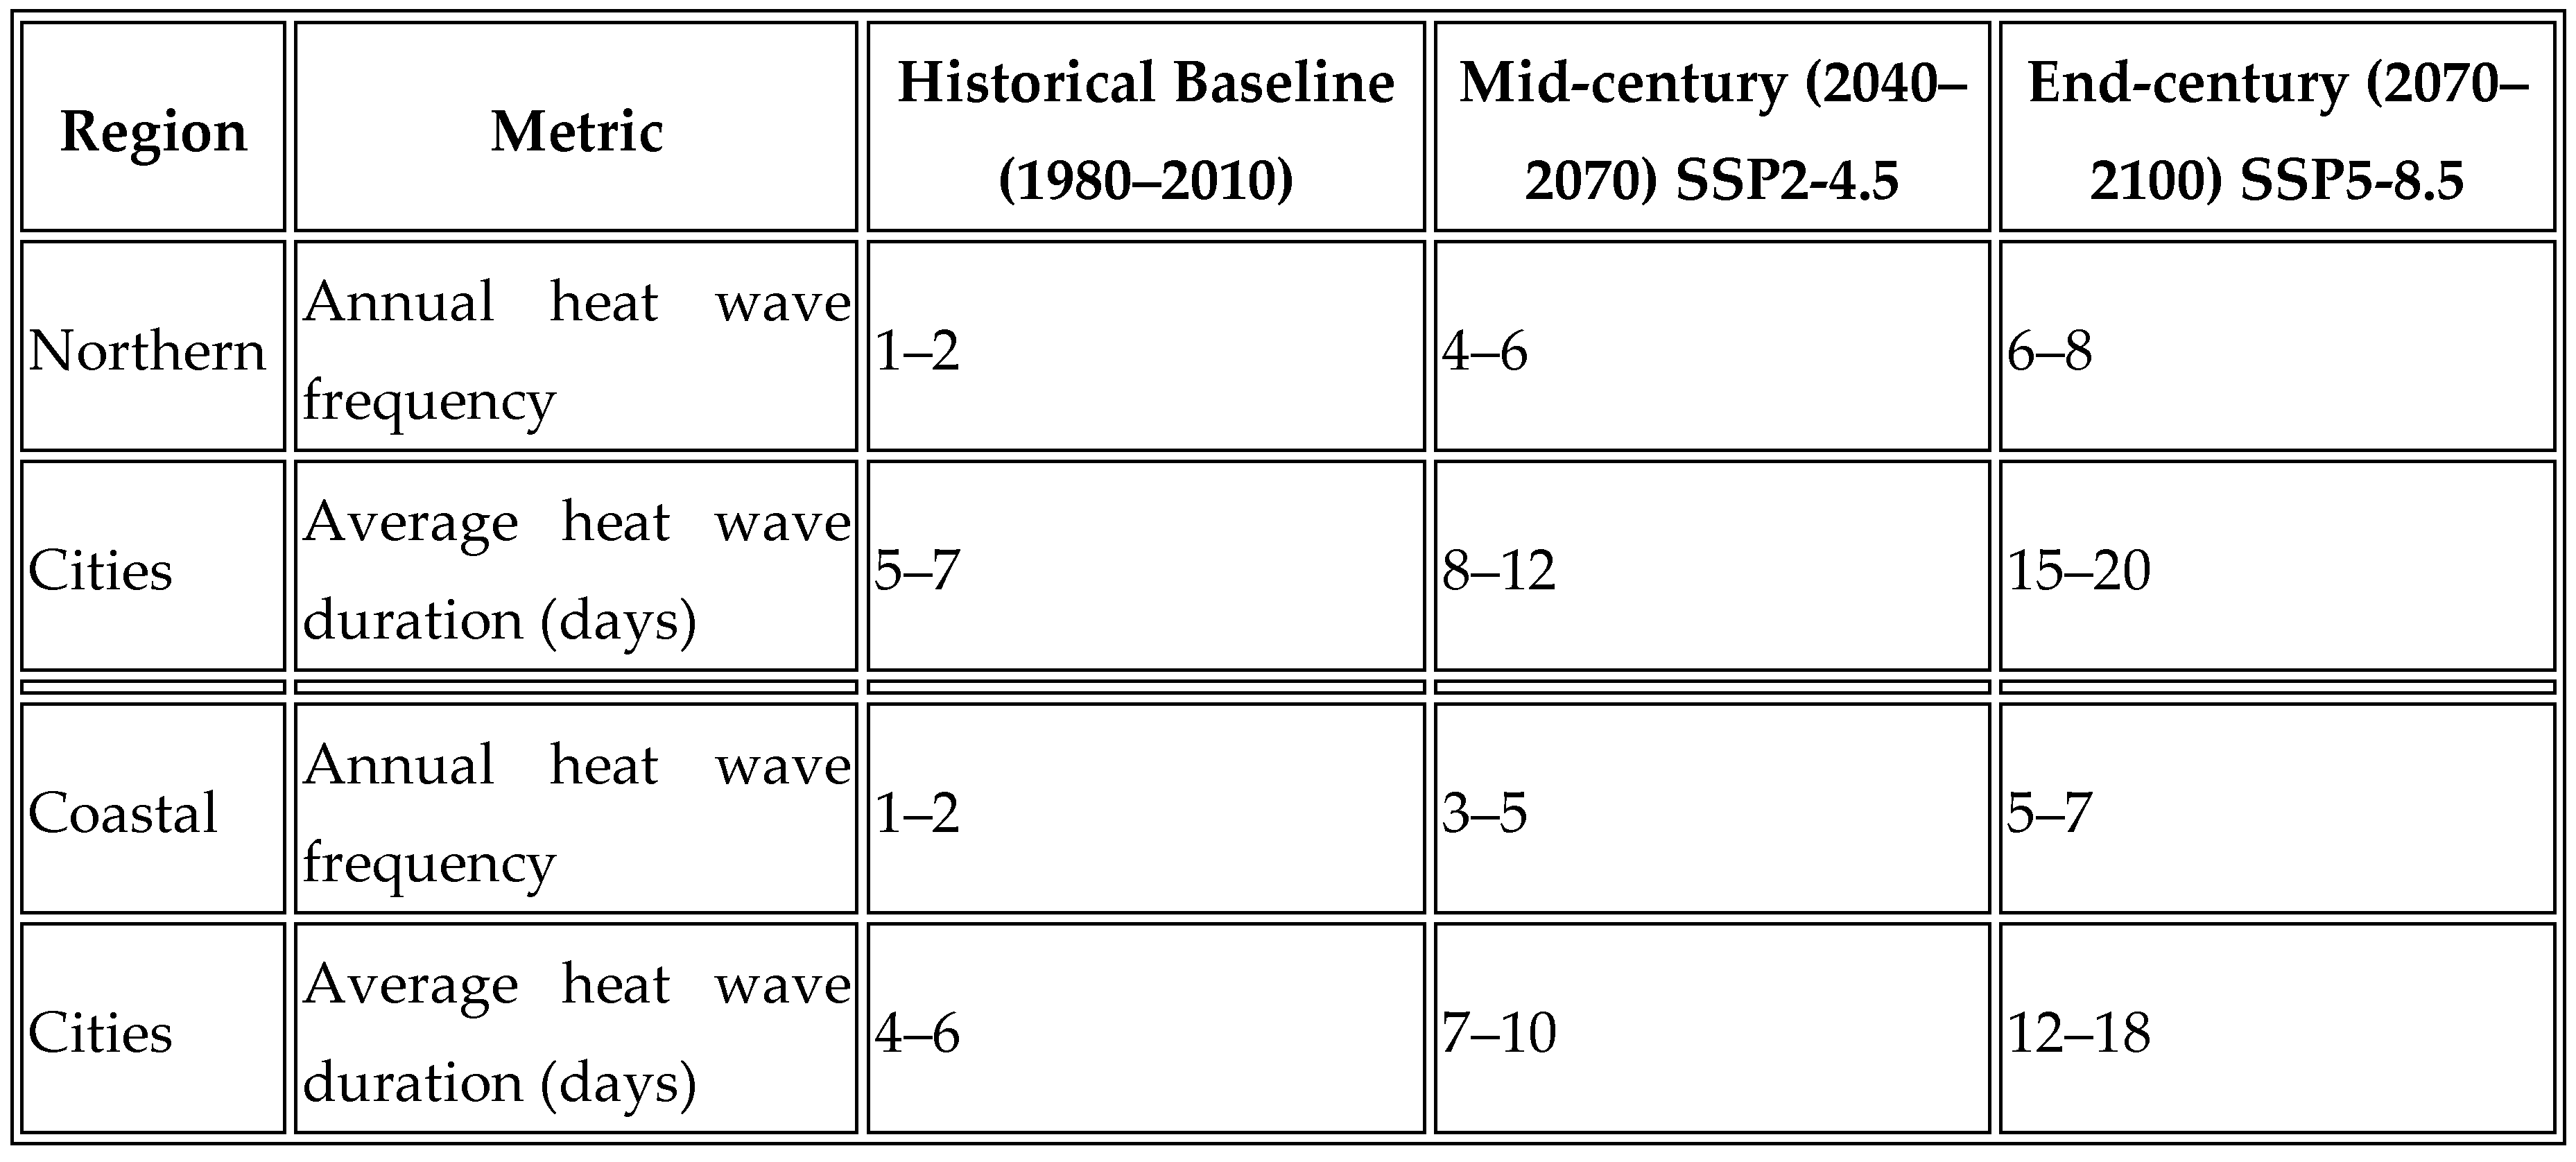
Note: Heat waves are defined as periods of 5+ consecutive days with DI ≥ 29 (Very Uncomfortable).
Heat wave analysis reveals troubling trends in the frequency and duration of extreme thermal discomfort events. Historically, extended heat waves occurred relatively infrequently in most Indian cities, typically 1–2 times annually with durations rarely exceeding one week. Under future scenarios, such events could become commonplace, with projections suggesting 4–6 annual heat waves in northern cities by mid-century under SSP2-4.5, increasing to 6–8 under SSP5-8.5. More concerning is the projected increase in heat wave duration—extreme events could last 15–20 days by the end of the century under high-emission scenarios, resulting in extended periods when outdoor walking becomes hazardous for vulnerable populations.
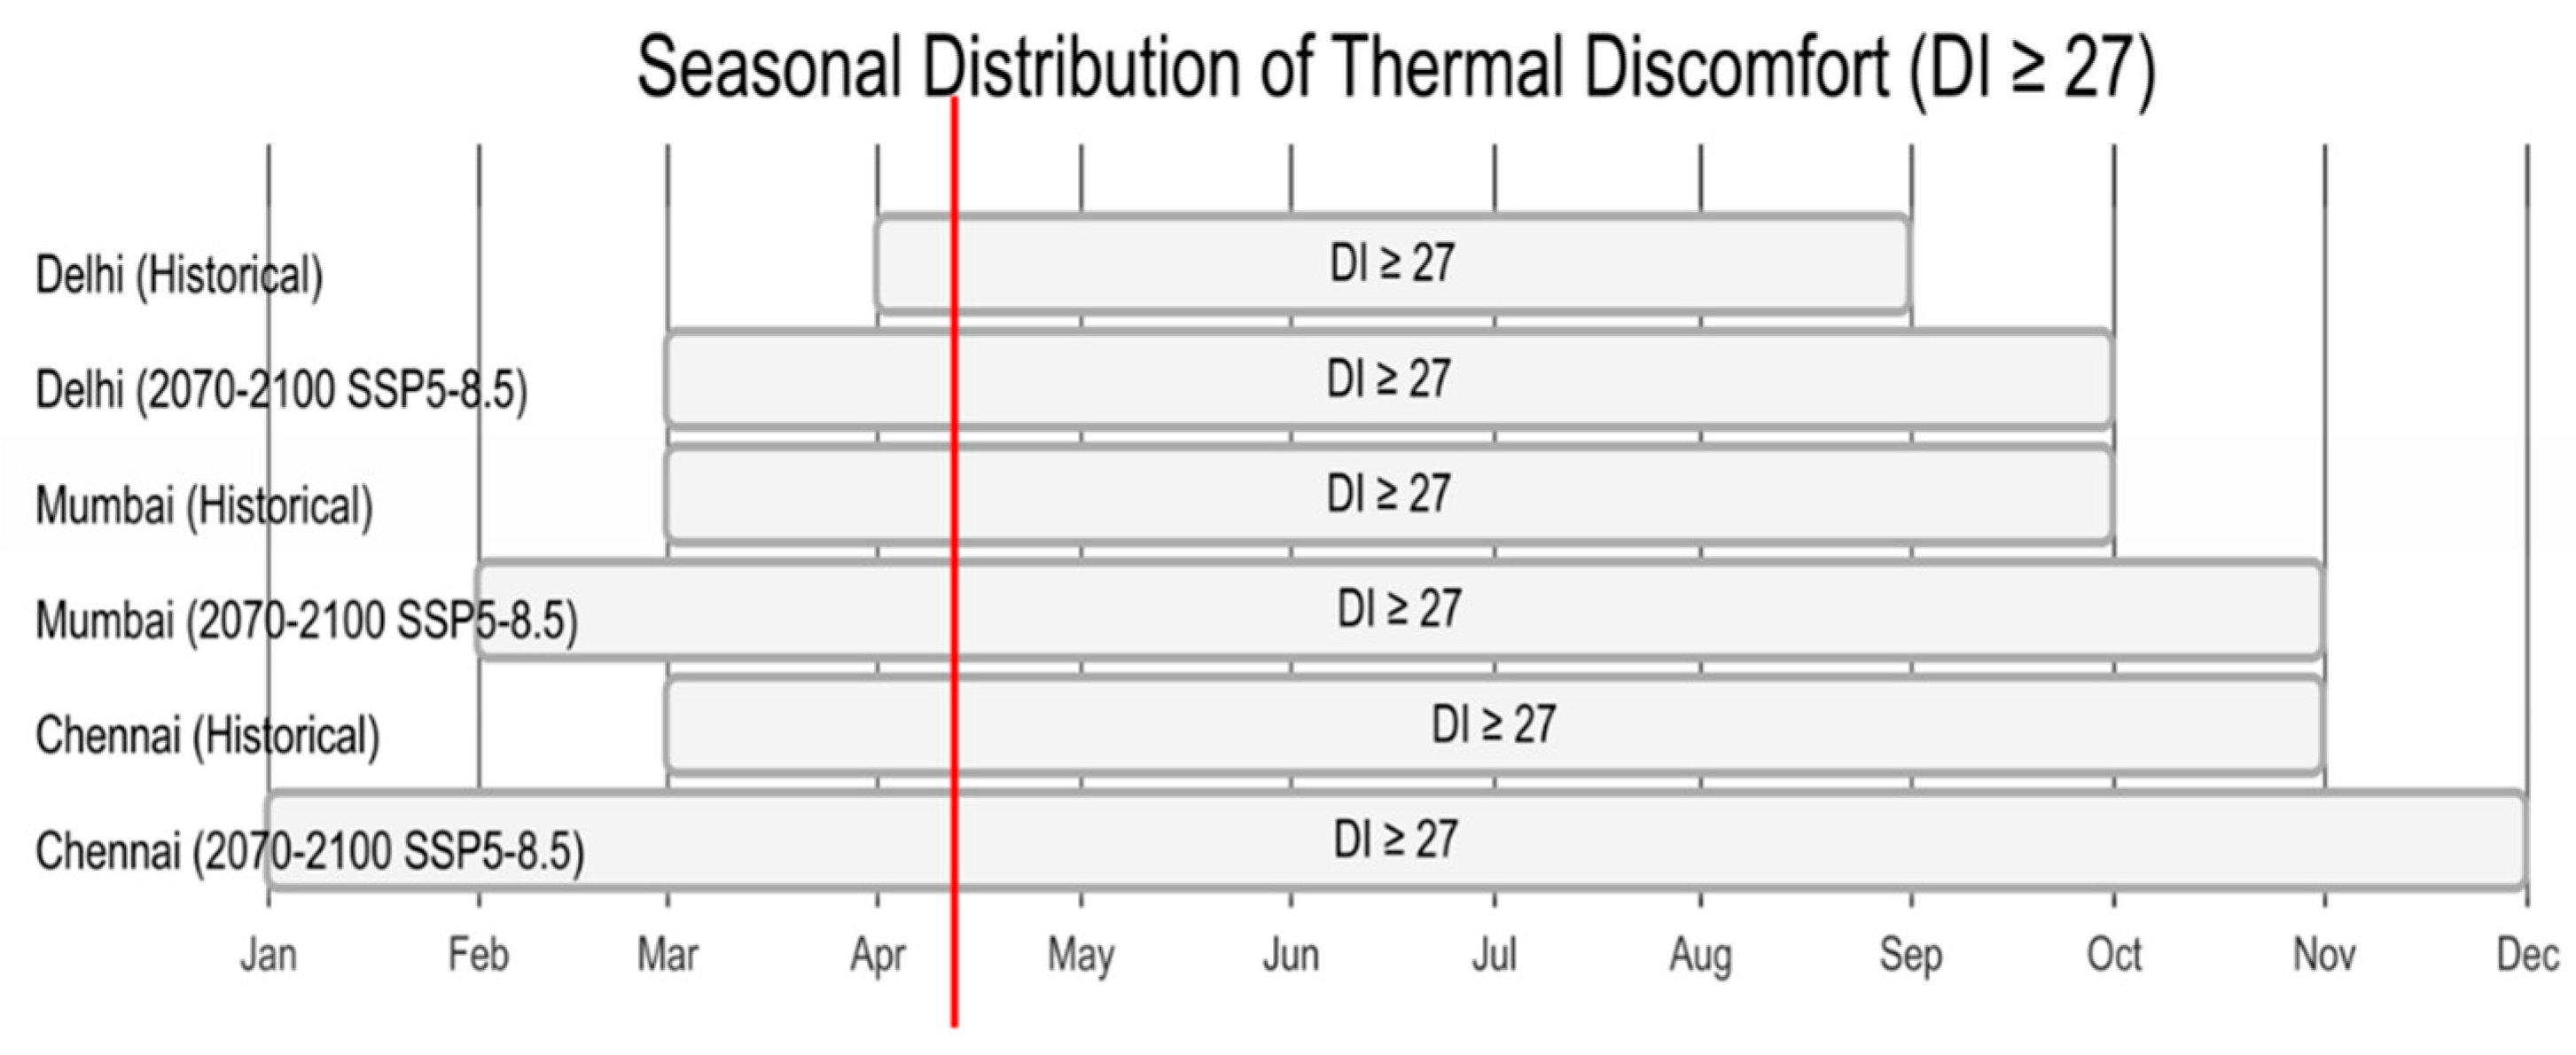
Seasonal Analysis
Seasonal analysis reveals an important finding regarding the timing of increased thermal stress. While summer months (April–June) show the most extreme DI values, the largest relative increases in discomfort days occur during the traditional shoulder seasons (March and October). This temporal expansion of discomfort effectively extends the period of thermal stress and reduces the annual window of comfortable walking conditions.
Spatial analysis within cities highlights significant intra-urban variations in thermal discomfort. Central business districts and high-density residential areas often experience DI values that are 1–3 units higher than those in peripheral or well-vegetated areas. These urban heat island effects interact with climate change to create thermal hot spots where walkability is particularly compromised, often in areas where walking represents a primary mode of transportation.
City-Specific Projections
Our city-specific projections provide granular insights for urban planners. For example, in Ahmedabad—a city already known for its pioneering heat action plan—annual discomfort days are projected to increase from 120 (historical baseline) to 165–180 by mid-century under SSP2-4.5, with a pronounced intensification during the pre-monsoon months of April and May. Such detailed projections enable targeted adaptation planning that addresses the most vulnerable periods and locations.
6. Discussion
The projections outlined in our results highlight the urgent need for climate-resilient urban planning approaches across Indian cities. The substantial increases in discomfort days and heat wave events under both moderate and high-emission scenarios underscore the inevitability of some degree of climate change impact, even with aggressive mitigation efforts. This reality necessitates proactive adaptation strategies specifically tailored to the Indian urban context.
Perhaps most concerning from a sustainable mobility perspective is the projected reduction in walkability across all study cities. As thermal discomfort increases in both intensity and duration, the willingness and ability of residents to walk as a primary mode of transportation will likely decline significantly, as documented in previous behavioral studies by Ng and Ren (2015). This shift threatens to undermine sustainable transportation goals by increasing reliance on motorized transport modes, potentially creating a detrimental feedback loop where reduced walking leads to increased vehicle use, resulting in greater emissions and urban heat island effects, which further reduce thermal comfort.
The public health implications of our findings are equally significant. Extended periods of elevated thermal stress have been strongly associated with increased morbidity and mortality, particularly among vulnerable populations such as the elderly, children, pregnant women, outdoor workers, and those with pre-existing health conditions (Im et al., 2017). The concentration of these impacts in densely populated urban areas, where access to cooling resources may be limited for lower-income residents, raises serious equity concerns that must be addressed in adaptation planning.
From a planning perspective, our city-specific projections provide valuable guidance for prioritizing interventions. Cities showing the most severe projected increases in thermal discomfort, such as Delhi, Lucknow, and Nagpur, may require more intensive adaptation efforts than those with more moderate projected changes. Similarly, within cities, our spatial analysis can help identify "hotspot" neighborhoods where interventions would deliver the greatest benefits in terms of maintained walkability and reduced health risks.
Potential adaptation strategies span multiple domains of urban planning and design. Physical interventions might include expanded green infrastructure (parks, street trees, green roofs), cool pavement technologies, shaded pedestrian corridors, and misting systems in public spaces. These measures could be complemented by operational strategies such as adjusted timing for outdoor activities, enhanced early warning systems for heat waves, and expanded access to cooling centers. Policy approaches might include updated building codes requiring shaded walkways, revised urban design guidelines prioritizing thermal comfort in public spaces, and transportation planning that accounts for seasonal variations in walking behavior.
The economic implications of our findings are substantial. Reduced walkability could increase transportation costs for households, while heat-related productivity losses and health impacts impose additional economic burdens. Conversely, investments in adaptive infrastructure that maintains walkability could yield significant returns through avoided healthcare costs, preserved productivity, and reduced transportation expenses. This economic dimension strengthens the case for proactive planning approaches that integrate thermal comfort considerations into all aspects of urban development.
It is worth emphasizing that while our projections indicate significant challenges ahead, they do not suggest that walkable cities will become impossible in India’s climate future. Rather, they highlight the need for intentional design and planning approaches that create thermally comfortable microclimates within the urban fabric. Successful examples from cities with already challenging climates, such as Singapore and Dubai, demonstrate that thoughtful design can maintain walkability even in thermally stressed environments, though often at considerable financial cost.
The social equity dimensions of thermal comfort deserve particular attention. Our population exposure analysis reveals that the impacts of increased thermal stress will not be distributed equally across urban populations. Lower-income neighborhoods often have less access to green space, shade infrastructure, and air conditioning, making residents more vulnerable to thermal discomfort while simultaneously being more dependent on walking as a primary transportation mode. This potential for disproportionate impact underscores the importance of equity-focused adaptation planning that prioritizes improvements in areas with the highest vulnerability.
7. Limitations
While our study provides valuable insights into future thermal comfort conditions in Indian cities, several limitations should be acknowledged when interpreting and applying the results. These constraints stem from data characteristics, methodological choices, and inherent uncertainties in climate and demographic projections.
The spatial resolution of the NEX-GDDP-CMIP6 climate data (0.25 degrees, approximately 25 km at the equator) represents a significant improvement over previous global climate projections but remains relatively coarse for detailed urban analysis (Thrasher et al., 2021). This resolution may inadequately capture important microclimatic variations within cities, such as local urban heat island effects, the cooling influence of water bodies, or the thermal benefits of parks and green spaces. These local features can substantially modify thermal conditions at the neighborhood scale, creating variability that our analysis might not fully represent. While we attempted to address this limitation by incorporating high-resolution population data and conducting sensitivity analyses, finer-scale climate modeling would undoubtedly enhance the precision of our projections.
The Discomfort Index (DI), while widely used and validated in numerous contexts, employs a relatively simple linear relationship between temperature and humidity to estimate thermal comfort (Thom, 1959). This approach may oversimplify the complex physiological processes that determine human thermal perception and comfort. More sophisticated bioclimatic indices like the Universal Thermal Climate Index (UTCI) or Physiologically Equivalent Temperature (PET) incorporate additional variables such as wind speed, solar radiation, and metabolic rate, potentially offering more nuanced assessments of thermal comfort. However, these indices require input data that are not consistently available across our study cities and time periods, making the more parsimonious DI approach appropriate for our large-scale comparative analysis. Future studies focused on specific cities could benefit from applying these more complex indices where data permits.
Our population projections, while aligned with the SSP scenarios used in climate modeling, necessarily involve simplifications of complex demographic processes. The static population projections used in our exposure calculations do not fully capture dynamic demographic changes such as intra-urban migration, neighborhood gentrification, or shifting age distributions within cities (Tatem, 2017). Additionally, our vulnerability weighting system, while based on established literature, represents a simplified approach to the complex determinants of thermal vulnerability, which may vary significantly across different Indian urban contexts.
The behavioral assumptions underlying our walkability implications merit careful consideration. While thermal discomfort has been shown to reduce walking activity, the exact thresholds and response patterns can vary significantly based on cultural norms, economic necessity, available alternatives, and adaptation capacity. Our interpretations of how changing DI values will affect walking behavior draw on international literature that may not fully reflect the specific context of Indian cities, where walking often represents an economic necessity rather than a choice for many residents. Local behavioral studies would strengthen these connections in future research.
Climate model uncertainty represents another important limitation. While we used an ensemble approach averaging across multiple CMIP6 models to reduce individual model biases, significant uncertainties remain regarding future climate trajectories, particularly at the regional and city scales. These uncertainties are especially pronounced for variables like relative humidity, which are less consistently projected across models than temperature. Our presentation of results from two contrasting emission scenarios (SSP2-4.5 and SSP5-8.5) partially addresses this uncertainty by providing a range of possible futures, but decision-makers should remain aware of the inherent uncertainties in any climate projection.
Finally, our analysis does not explicitly model adaptation measures or acclimatization processes that might moderate the impact of increasing thermal stress. Physiological adaptation, behavioral adjustments, and technological interventions could all potentially reduce vulnerability to thermal discomfort over time. Similarly, our projections do not account for potential innovations in urban design, materials science, or cooling technologies that might enhance outdoor thermal comfort beyond currently available solutions.
Despite these limitations, our study provides a valuable first approximation of future thermal comfort conditions in Indian cities, offering important insights for urban planning and public health preparedness. We have attempted to be transparent about these constraints throughout our analysis and encourage future research to address these limitations as more refined data and methods become available.
8. Future Research
The findings and limitations of our current study point toward several promising directions for future research that would deepen understanding of climate change impacts on urban thermal comfort and walkability in India and beyond.
A critical next step would be to enhance the spatial resolution of our climate projections through downscaling techniques or urban climate modeling. Coupling regional climate models with urban canopy models could generate projections at sub-kilometer resolution, capturing the crucial microclimatic variations within cities that significantly influence thermal comfort in pedestrian environments. Such high-resolution modeling would enable more precise identification of thermal hotspots and cold spots within the urban fabric, allowing for highly targeted interventions at the neighborhood and street scales.
Future studies should also explore the application of more sophisticated bioclimatic indices that better capture the full range of meteorological and physiological factors influencing thermal perception. Indices such as the Universal Thermal Climate Index (UTCI), Physiological Equivalent Temperature (PET), or modified Physiological Subjective Temperature (mPST) account for factors like wind speed, solar radiation, metabolic rate, and clothing insulation, providing more realistic assessments of how urban environments actually feel to pedestrians. While data requirements for these indices are substantial, emerging monitoring networks and remote sensing capabilities are making such approaches increasingly feasible.
The behavioral dimensions of thermal comfort and walking decisions warrant dedicated investigation in the Indian context. Field studies combining microclimate measurements with pedestrian counts, surveys, and interviews could establish locally-relevant thresholds for how thermal conditions influence walking behavior across different demographic groups, trip purposes, and urban contexts. Such research would strengthen the connection between physical comfort metrics and actual mobility outcomes, enhancing the practical utility of thermal comfort projections for transportation planning.
Integrating socioeconomic factors more comprehensively into vulnerability and exposure assessments represents another important research direction. Future studies could develop more nuanced vulnerability indices that account for factors such as access to cooling resources, transportation alternatives, healthcare facilities, and social capital, providing a more accurate picture of which populations face the greatest risks from increasing thermal stress. Such work would be particularly valuable for equity-focused planning approaches that prioritize interventions for the most vulnerable communities.
Perhaps most importantly, research on the effectiveness of various adaptation strategies should be expanded through both modeling and empirical studies. Quantifying the thermal benefits of interventions such as street trees, cool pavements, shade structures, green roofs, and water features would help planners identify the most cost-effective approaches for maintaining walkability under changing climate conditions. Pilot projects implementing and monitoring these interventions across different Indian urban contexts could provide invaluable real-world data on their performance and contextual suitability.
The economic dimensions of thermal comfort and walkability deserve greater attention in future research. Studies quantifying the economic costs of reduced walkability (in terms of transportation expenses, health impacts, productivity losses, etc.) and the potential returns on investment from adaptation measures would strengthen the business case for climate-resilient urban design. Such economic analyses could be particularly influential in resource-constrained planning contexts where interventions must be carefully prioritized.
Innovative methodological approaches could also enhance future work in this field. Machine learning techniques might identify subtle patterns in the relationship between urban form, climate variables, and thermal comfort that traditional statistical approaches might miss. Agent-based modeling could simulate how changing thermal conditions might alter pedestrian behavior and movement patterns throughout cities, with implications for transportation planning, commercial activity, and public space design.
Finally, comparative studies examining thermal comfort and walkability trends across different geographical and cultural contexts would provide valuable insights into universal versus context-specific aspects of this challenge. Learning from cities that have successfully maintained walkability despite challenging climate conditions could identify transferable strategies for Indian urban areas facing similar challenges in the coming decades.
By pursuing these research directions, scholars can build on the foundation established in this study to develop an increasingly sophisticated and actionable understanding of how climate change will affect urban thermal comfort and walkability, ultimately supporting the development of cities that remain livable, equitable, and sustainable despite the challenges posed by a warming climate.
9. Conclusion
The IndiaThermalWalkability project provides a comprehensive framework for assessing climate change impacts on thermal discomfort and walkability in Indian cities. Our analysis of both moderate (SSP2-4.5) and high-emission (SSP5-8.5) scenarios reveals alarming trends: substantial increases in discomfort days, heat wave frequency, and population exposure by mid-century and beyond. These changes threaten sustainable urban mobility, with significant implications for public health, energy consumption, and quality of life. The spatial and temporal patterns we identified—particularly the extension of discomfort into shoulder seasons and concentration in high-density urban areas—offer critical insights for targeted adaptation efforts.
Our research highlights the compounding effects of climate change and urbanization, as growing urban populations experience deteriorating thermal conditions, creating substantially increased exposure to uncomfortable or dangerous environments. This is especially concerning in rapidly growing tier-2 cities with limited planning capacity but opportunities for intervention. The disproportionate impacts on vulnerable populations emphasize the equity dimensions of this challenge, underscoring the need for inclusive adaptation strategies prioritizing those most at risk.
While these projections present a challenging picture of India’s urban climate future, they should not be viewed as inevitable. These trajectories can be modified through global mitigation efforts and local adaptation measures to enhance thermal resilience. Our open-source tools enable researchers, planners, and policymakers to explore possibilities and develop context-specific responses. The path forward requires integrating physical interventions (green infrastructure, cool materials, shaded corridors), operational strategies (adjusted timing for outdoor activities, enhanced warning systems), and policy innovations (updated building codes and transportation planning frameworks addressing thermal comfort).
Beyond Indian cities, this research contributes to global discussions on climate-resilient urban design and walkable cities. As climate change challenges conventional urban planning approaches, our methodologies can help cities across various contexts prepare for changing thermal comfort conditions. While climate change will alter urban thermal landscapes, thoughtful planning can maintain walkability as a viable mobility option. The IndiaThermalWalkability project offers both a methodological framework and specific insights to support the creation of climate-resilient cities that remain livable, equitable, and sustainable despite growing thermal challenges.
References
- Blazejczyk, K. , Epstein, Y., Jendritzky, G., Staiger, H., & Tinz, B. Comparison of UTCI to selected thermal indices. International Journal of Biometeorology 2012, 56, 515–535. [Google Scholar] [PubMed]
- Giles, B. D. , Balafoutis, C., & Maheras, P. Too hot for comfort: The heatwaves in Greece in 1987 and 1988. International Journal of Biometeorology 1990, 34, 98–104. [Google Scholar] [PubMed]
- Im, E.-S. , Pal, J. S., & Eltahir, E. A. B. Deadly heat waves projected in the densely populated agricultural regions of South Asia. Science Advances 2017, 3, e1603322. [Google Scholar]
- Ng, E. , & Ren, C. (2015). The Urban Climatic Map: A Methodology for Sustainable Urban Planning. Routledge.
- Perkins, S. E. , Alexander, L. V., & Nairn, J. R. Increasing frequency, intensity and duration of observed global heatwaves and warm spells. Geophysical Research Letters 2015, 42, 10–314. [Google Scholar]
- Ramakrishnan, S. , Guttikunda, S. K., & Gupta, M. Ambient heat exposure and thermal comfort in urban outdoor spaces: A study in Chennai, India. Building and Environment 2018, 146, 73–87. [Google Scholar]
- Tatem, A. J. WorldPop, open data for spatial demography. Scientific Data 2017, 4, 170004. [Google Scholar] [CrossRef]
- Thom, E.C. The Discomfort Index. Weatherwise 1959, 12, 57–60. [Google Scholar] [CrossRef]
- Thrasher, B., Maurer, E. P., McKellar, C., & Duffy, P. B. (2021). NASA Earth Exchange Global Daily Downscaled Projections (NEX-GDDP-CMIP6). NASA Center for Climate Simulation. Available online: https://www.nccs.nasa.gov/.
- Balakrishnan, K. , Dey, S., Gupta, T., Dhaliwal, R. S., Brauer, M., Cohen, A. J., Stanaway, J. D., Beig, G., Joshi, T. K., Aggarwal, A. N., Sabde, Y., Sadhu, H., Frostad, J., Causey, K., Godwin, W., Shukla, D. K., Kumar, G. A., Varghese, C. M., Muraleedharan, P.,... & Dandona, L. The impact of air pollution on deaths, disease burden, and life expectancy across the states of India: the Global Burden of Disease Study 2017. The Lancet Planetary Health 2019, 3, e26–e39. [Google Scholar]
- Basu, R. High ambient temperature and mortality: a review of epidemiologic studies from 2001 to 2008. Environmental Health 2009, 8, 40. [Google Scholar] [CrossRef]
- Brooke Anderson, G. , Bell, M. L., & Peng, R. D. Methods to calculate the heat index as an exposure metric in environmental health research. Environmental Health Perspectives 2013, 121, 1111–1119. [Google Scholar]
- Cheng, V. , Ng, E., Chan, C., & Givoni, B. Outdoor thermal comfort study in a sub-tropical climate: A longitudinal study based in Hong Kong. International Journal of Biometeorology 2012, 56, 43–56. [Google Scholar] [PubMed]
- Dash, S. K. , & Kjellström, T. Workplace heat stress in the context of rising temperature in India. Current Science 2011, 101, 496–503. [Google Scholar]
- Dutta, P. , Rajiva, A., Andhare, D., Azhar, G. S., Tiwari, A., Sheffield, P., & Knowlton, K. Perceived heat stress and health effects on construction workers. Indian Journal of Occupational and Environmental Medicine 2015, 19, 151–158. [Google Scholar]
- Gehl, J. (2011). Life Between Buildings: Using Public Space. Island Press.
- Gupta, S. , Carmichael, C., Simpson, C., Clarke, M. J., Allen, C., Gao, Y., Chan, E. Y., & Murray, V. Electric fans for reducing adverse health impacts in heatwaves. Cochrane Database of Systematic Reviews 2012, 7, CD009888. [Google Scholar]
- Kjellstrom, T. , Briggs, D., Freyberg, C., Lemke, B., Otto, M., & Hyatt, O. Heat, human performance, and occupational health: A key issue for the assessment of global climate change impacts. Annual Review of Public Health 2016, 37, 97–112. [Google Scholar]
- Lenzholzer, S. , Klemm, W., & Vasilikou, C. Qualitative methods to explore thermo-spatial perception in outdoor urban spaces. Urban Climate 2018, 23, 231–249. [Google Scholar]
- Masson, V. , Lemonsu, A., Hidalgo, J., & Voogt, J. Urban climates and climate change. Annual Review of Environment and Resources 2020, 45, 411–444. [Google Scholar]
- Meehl, G. A. , & Tebaldi, C. More intense, more frequent, and longer lasting heat waves in the 21st century. Science 2004, 305, 994–997. [Google Scholar]
- Middel, A. , Selover, N., Hagen, B., & Chhetri, N. Impact of shade on outdoor thermal comfort—a seasonal field study in Tempe, Arizona. International Journal of Biometeorology 2016, 60, 1849–1861. [Google Scholar]
- Oke, T. R. , Mills, G., Christen, A., & Voogt, J. A. (2017). Urban Climates. Cambridge University Press.
- Seneviratne, S. I. , Donat, M. G., Mueller, B., & Alexander, L. V. No pause in the increase of hot temperature extremes. Nature Climate Change 2014, 4, 161–163. [Google Scholar]
- Spagnolo, J. , & de Dear, R. A field study of thermal comfort in outdoor and semi-outdoor environments in subtropical Sydney Australia. Building and Environment 2003, 38, 721–738. [Google Scholar]
- Stewart, I. D. , & Oke, T. R. Local climate zones for urban temperature studies. Bulletin of the American Meteorological Society 2012, 93, 1879–1900. [Google Scholar]
- Tran, K. V. , Azhar, G. S., Nair, R., Knowlton, K., Jaiswal, A., Sheffield, P., Mavalankar, D., & Hess, J. A cross-sectional, randomized cluster sample survey of household vulnerability to extreme heat among slum dwellers in Ahmedabad, India. International Journal of Environmental Research and Public Health 2013, 10, 2515–2543. [Google Scholar]
- Vanos, J. K. , Herdt, A. J., & Lochbaum, M. R. Effects of physical activity and shade on the heat balance and thermal perceptions of children in a playground microclimate. Building and Environment 2017, 126, 119–131. [Google Scholar]
- Wang, Y. , de Groot, R., Bakker, F., Wörtche, H., & Leemans, R. Thermal comfort in urban green spaces: A survey on a Dutch university campus. International Journal of Biometeorology 2017, 61, 87–101. [Google Scholar]
- Yang, L. , Qian, F., Song, D. X., & Zheng, K. J. Research on urban heat-island effect. Procedia Engineering 2016, 169, 11–18. [Google Scholar]
- Zhao, L. , Lee, X., Smith, R. B., & Oleson, K. Strong contributions of local background climate to urban heat islands. Nature 2014, 511, 216–219. [Google Scholar]
Disclaimer/Publisher’s Note: The statements, opinions and data contained in all publications are solely those of the individual author(s) and contributor(s) and not of MDPI and/or the editor(s). MDPI and/or the editor(s) disclaim responsibility for any injury to people or property resulting from any ideas, methods, instructions or products referred to in the content. |
© 2025 by the authors. Licensee MDPI, Basel, Switzerland. This article is an open access article distributed under the terms and conditions of the Creative Commons Attribution (CC BY) license (http://creativecommons.org/licenses/by/4.0/).
Copyright: This open access article is published under a Creative Commons CC BY 4.0 license, which permit the free download, distribution, and reuse, provided that the author and preprint are cited in any reuse.


