
Submitted:
01 April 2025
Posted:
02 April 2025
You are already at the latest version
Abstract
Urban expansion has a major impact on local climate conditions, particularly through rising land surface temperatures (LST) and the intensification of climate risk zones. With an emphasis on LST variation with abnormal urban growth, this study uses Geographic Information System (GIS) approaches to assess the spatial relationship between urban expansion and urban climate risk zones which offer meaningful characteristics in quantifying urban expansion with the affecting thermal pattern and urban climate risks. Using satellite-derived thermal imagery, land use data and air quality data, the temperature distribution and air quality level across various urbanized and non-urbanized regions in Dhaka City Corporation (DCC) and Rajshahi City Corporation (RCC) has been illustrated as well as a comparison between these cities. Findings show that LST intensified by urban expansion increases the climate risk zones, environmental sensitivity and localized heat stress in DCC and RCC from 2016 to 2024. The study showcases the necessity of integrating GIS-based urban climate risk assessments into urban planning to alleviate the adverse impacts of rising temperatures and ensure sustainable development.
Keywords:
Urban Expansion
; Climate Risk Zones
; Land Surface Temperature
; Air Pollution
; Land use change
; Google Earth Engine
1. Introduction
Rapid urban growth generally leads to the change of land use pattern in many developing countries around the world [1]. As a result, carbon emission, climate change, haphazard condition, and overall environmental degradation has been occurring making the environment of any area unstable for human settlement [2,3]. Besides, urban areas with its natural tendency to expand towards several directions extend sometimes unusually making risk zone to the specific area [4]. Thus, the thermal environment of cities and the adjacent areas is profoundly affected by human-driven urbanization and related land use change processes turning the natural landscape into an impassible surface [5,6,7]. One of the specific effects of urban sprawl is it impact on land surface temperature (LST) which further causes climate risks in the particular areas [8]. Rapid urban growth mostly affects LST forming urban heat islands (UHI) and increases climate risk zones. As a result, UHI become active affecting the climate parameters of the whole urban region. UHIs not only hamper the suitability of urban living environments but also the health of habitants [9]. The severity of UHIs will be more serious with as urban expansion continues to progress. So, with a view to protecting the urban environment, it is crucial to concern how urban expansion influences the temperature on urban climatic parameters and causes severe risk zones [10].
Besides, one of the concerning issues facing many urban regions and its residents globally is the increasing air pollutants’ concentrations and the negative effects on its environment, health, social and economy [11]. The driving force behind this kind of phenomena is the increasing population in the urban core. The urban population of the world was approximately 30% in 1950 which surpassed 50% in the 2014. The prediction of the urban population reach is estimated 60% by 2030 covering for 5 billion of the world’s 8 billion population [12]. Thus, with the expansion of urban population, unplanned urbanization dominates which ultimately causing the degradation of urban climate and environment. For example, research on Brisbane, Australia in 2019 also showcased the heat stress due to the combined effect of climate change and intensification of UHI linked with urban expansion. The study on the impact of urbanization in Doha, Qatar found that rapid urban expansion caused changes in the land use pattern which resulted higher LST in that region affecting local climate conditions and regular energy consumption [13]. Moreover, the study on Hanoi, Vietnam in 2020 depicted that rapid urbanization expansion of Hanoi over the last few decades causes air pollution by traffic, industrial and residential emission sources using Multiregional Input-Output (MRIO).
Some studies also conducted on Dhaka city corporation (DCC) and Rajshahi City Corporation (RCC) on the variation of land surface temperature and air pollution scenario with the increasing urban growth. For instance, Ahmed et al. (2013) and Rahman et al. (2020) conducted the study elaboratively on how rapid urban expansion affects land surface temperature in Dhaka City by visualizing LULC map with supervised classification and calculating LST formula in ArcMap software [14]. Besides, Zarin & Zannat (2023) studied about the impact of land use change in air quality on Dhaka City using Transitional Potential Modeling and Cellular Automata Simulation [15]. Biswas et al. (2016) and Rahnuma et al. (2023) researched about air quality monitoring relation with land use and land cover change using PIXE method for element concentration and Statgraphics and Positive Matrix Factorization (PMF) [16,17]. On the other hand, Akash & Puja (2024) focused on assessing land surface temperature fluctuation with the repeatedly growing urbanization [18]. Thus, various methodologies have been used to illustrate urban climate risk due to urbanization with ground-based and satellite imageries. However, prior studies have showcased crucial impacts on satellite-based observation systems to calculate LST and measuring UHI in terms of time and space [19]. But while processing, many satellite-based indices such as NDVI, NDWI, SAVI, IPVI etc. have been shown to be inadequate for proper illustration [20]. Because the challenges associated with pixel couplings arise the issue in relation to the spectral response of diverse LULC categories including built-up areas, waterbodies, vegetation, agricultural land and barren lands [21]. Thus, the Google Earth Engine (GEE) is a reliable tool for using big data analysis and its ability to do satellite imagery analysis through cloud-based processing, eliminating the necessity of physical storage of information [22].
Henceforth, to assess the urban expansion and climate risk zones due to rapid urban growth in DCC and RCC, this study pioneers the combination of high-resolution satellite imagery processing and an innovative analysis on the GEE platform. Besides, previous studies had considerations about urban expansion with temperature variation but an in-depth analysis in climate risk with urban growth is a crucial matter of discussion. The key goals of this study are to analyze the spatial and temporal patterns of urban expansion in DCC and RCC; identify and delineate climate risk zone related to temperature related issues and air pollution; and showcase the nexus between urban expansion and climate risk zones; and comparative analysis between the two cities. The findings of the study have significance in assessing the changes in urban climatic pattern and future direction. Moreover, this study fills up the gaps of previous studies with this dynamic work-flow and will help researchers for prediction and policy recommendation.
2. Materials & Method
2.1. Study Area
The Study focuses on Dhaka City Corporation and Rajshahi City Corporation.
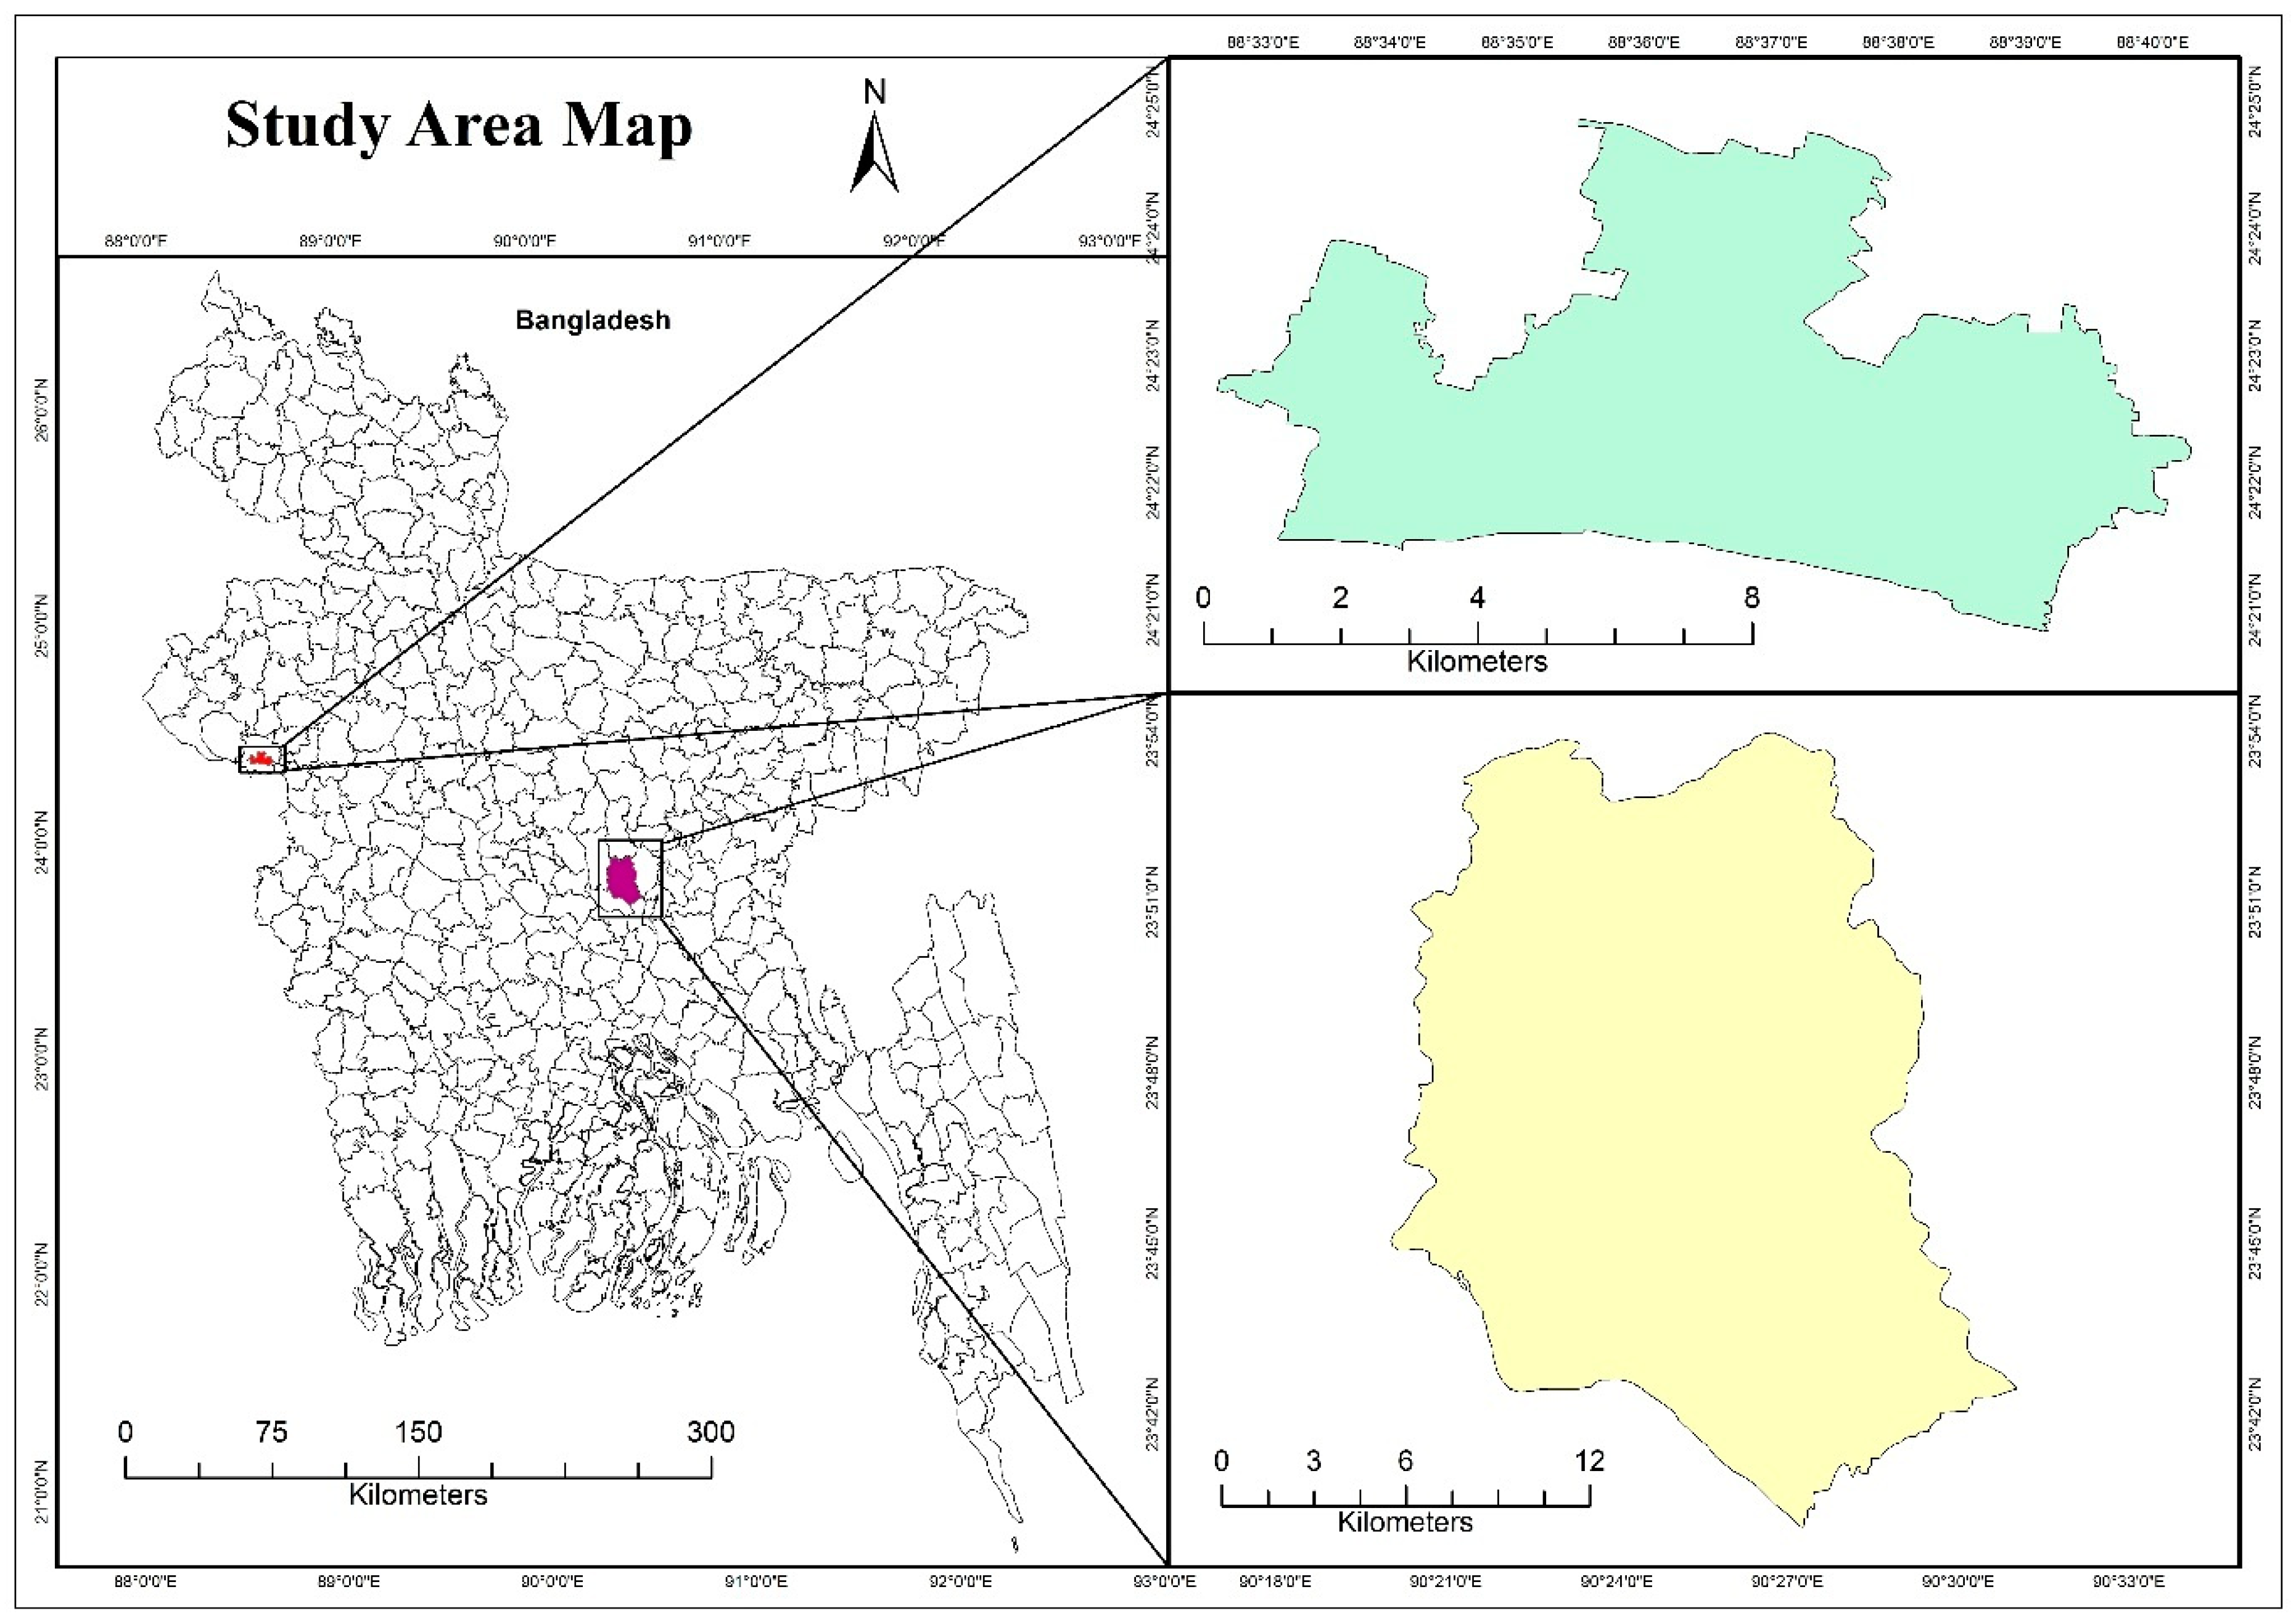
Dhaka City Corporation: Dhaka is one of the fastest growing mega cities of Bangladesh. Situated between 23°41'N to 23°55'N latitude and 90°20'E to 90°30'E longitude, DCC is the most populated city in the country. The city consists of two administrative divisions—Dhaka North City Corporation (DNCC) and Dhaka South City Corporation (DSCC). DNCC comprises 54 wards covering areas such as Mirpur, Gulshan, and Uttara, while DSCC consists of 75 wards covering regions including Paltan, Motijheel, and Dhanmondi [23]. Current population of DCC is over 10.2 million with DNCC having 5.98 million and DSCC having 4.3 million residents [24]. The city has witnessed rapid urbanization, and hence, extreme LULC change with builtup expansion encroaching upon vegetation and water bodies [25]. The process has directly impacted LST, driving the UHI effect, which results in higher temperatures, increased energy demand, and less environmental sustainability [26].
Rajshahi City Corporation: Rajshahi City Corporation (RCC), located in the northwestern part of Bangladesh. Geographically, RCC spans between 24°20' and 24°24' north latitudes and 88°32' and 88°40' east longitudes, encompassing an area of 95.56 square kilometers [27]. The city is situated on the north bank of the Padma River, near the Bangladesh-India border, and is surrounded by the satellite towns of Nowhata and Katakhali [28]. Current population of Rajshahi City Corporation is over half a million [24]. Textile industry hub, the "Silk City" of Bangladesh, Rajshahi has experienced unprecedented LULC changes over the recent decades Over the last decades, residential, commercial, and industrial growth has expanded the urban area by transforming agricultural land and open spaces into built-up land [29]. The rapidly evolving LULC has significantly impacted LST, where studies reveal the strong correlation between urban growth and rising temperatures with the consequential thermal discomfort and environmental degradation [30].
Figure 1.
Location of the Study Areas (DCC & RCC).
Our research focuses on DCC and RCC since they are more vulnerable to climate-related concerns. DCC, Bangladesh's capital, has severe floods, heatwaves, and air pollution, which adversely harm public health and infrastructure [31]. Similar to this, RCC is vulnerable to high temperatures and erratic rainfall, which can have an impact on biodiversity, health, and water supplies [32]. Rapid urbanization has increased impermeable surfaces and decreased green spaces in both cities, exacerbating climate concerns [33]. Understanding the climate risk zones in these cities is critical for establishing tailored adaptation and mitigation measures to boost resilience and sustainability.
2.2. Data Description
Satellite Imagery of 2016,2020 and 2024 for conducting LULC and estimating Land LST have been obtained from GEE and USGS Earth Explorer respectively. Cloud cover was less than 15%.

Table 1.
Description of the Images used for LULC.
| Study Area | Satellite Data | Date of Acquisition | Sensor | MGRS | Band no | Central Wavelength (µm) | Spatial Resolution (m) |
|---|---|---|---|---|---|---|---|
| DCC | Sentinel 2A | 17 April 2020 | MSI | 100km/100 km | 2 | 0.490 | 10 |
| 3 | 0.560 | 10 | |||||
| 4 | 0.665 | 10 | |||||
| 8 | 0.833 | 10 | |||||
| 8A | 0.865 | 20 | |||||
| 11 | 1.613 | 20 | |||||
| 12 | 2.190 | 20 | |||||
| Sentinel 2A | 16 April 2024 | MSI | 100km/100 km | 2 | 0.490 | 10 | |
| 3 | 0.560 | 10 | |||||
| 4 | 0.665 | 10 | |||||
| 8 | 0.833 | 10 | |||||
| 8A | 0.865 | 20 | |||||
| 11 | 1.613 | 20 | |||||
| 12 | 2.190 | 20 | |||||
| RCC | Sentinel 2A | 15 April, 2020 | MSI | 100km/100 km | 2 | 0.490 | 10 |
| 3 | 0.560 | 10 | |||||
| 4 | 0.665 | 10 | |||||
| 8 | 0.833 | 10 | |||||
| 8A | 0.865 | 20 | |||||
| 11 | 1.613 | 20 | |||||
| 12 | 2.190 | 20 | |||||
| Sentinel 2A | 4 May, 2024 | MSI | 100km/100 km | 2 | 0.490 | 10 | |
| 3 | 0.560 | 10 | |||||
| 4 | 0.665 | 10 | |||||
| 8 | 0.833 | 10 | |||||
| 8A | 0.865 | 20 | |||||
| 11 | 1.613 | 20 | |||||
| 12 | 2.190 | 20 |
Table 2.
Description of the Images use for Estimating LST.
| Study Area | Satellite Data | Date of Acquisition | Sensor | Path/Row | Band no | Spectral Range (µm) | Spatial Resolution (m) |
|---|---|---|---|---|---|---|---|
| DCC | Landsat 8 | 02 March, 2003 | OLI | 137/44 | 4 | 0.64 - 0.67 | 30 |
| 5 | 0.85 - 0.88 | 30 | |||||
| 10 | 10.6 - 11.19 | 60 | |||||
| Landsat 8 | 24 May 2013 | OLI | 137/44 | 4 | 0.64 - 0.67 | 30 | |
| 5 | 0.85 - 0.88 | 30 | |||||
| 10 | 10.6 - 11.19 | 60 | |||||
| RCC | Landsat 8 | 10 May 2023 | OLI | 137/44 | 4 | 0.64 - 0.67 | 30 |
| 5 | 0.85 - 0.88 | 30 | |||||
| 10 | 10.6 - 11.19 | 60 | |||||
| Landsat 8 | OLI | 137/44 | 4 | 0.64 - 0.67 | 30 | ||
| 5 | 0.85 - 0.88 | 30 | |||||
| 10 | 10.6 - 11.19 | 60 |
2.3. Image Preprocessing
Atmospheric correction of Sentinel 2A images was done using the Google Earth Engine to minimize radiometric distortions. The Sentinel-2 cloud mask (SCL) band was utilized to identify and exclude cloudy pixels from the analysis, ensuring the accuracy of LULC classifications. Temporal and spatial averaging were performed to reduce noise and enhance signal quality in the air pollution data.
2.4. Estimation of Land Surface Temperature (LST)
Land Surface Temperature (LST) was estimated in ArcGIS 10.8 from Landsat 8 imagery using the Mono-Window Algorithm (MWA), which requires several key parameters:
Table 3.
Essential Formulae for Land Surface Temperature (LST) Retrieval from Landsat 8.
| Parameter | Formulae & Description | Reference |
|---|---|---|
| Top-of-Atmosphere (TOA) Radiance (Lλ) | Top-of-Atmosphere (TOA) Radiance (Lλ) Where, ML =0.0003342, QCAL = B10, AL = 0.0010, Oi = 0.29 |
[34] |
| Brightness Temperature (BT): | BT = (K2/ln(K1/Lλ+1))-273.15 Where, K1=774.89W/m2/sr/μm, K2=1321.08K |
[35] |
| Normalized Difference Vegetation Index (NDVI): | NDVI=(NIR-RED/NIR+RED) Where NIR and RED represent the B4 and B5 bands, respectively. |
[36] |
| Proportion of Vegetation (Pv): | Pv = ((NDVI-NDVImin/ (NDVImax-NDVImin ))2 | [37] |
| Land Surface Emissivity (LSE): | LSE = 0.004×Pv+0.986 | [38] |
| Final LST Calculation: | LST = BT/(1+( λ*BT/C2 )*ln(E)) Where, λ is the wavelength of emitted radiance (approximately 10.8 µm for Band 10), C2C_2C2 is the second radiation constant (approximately 14388 µm·K) |
[39] |
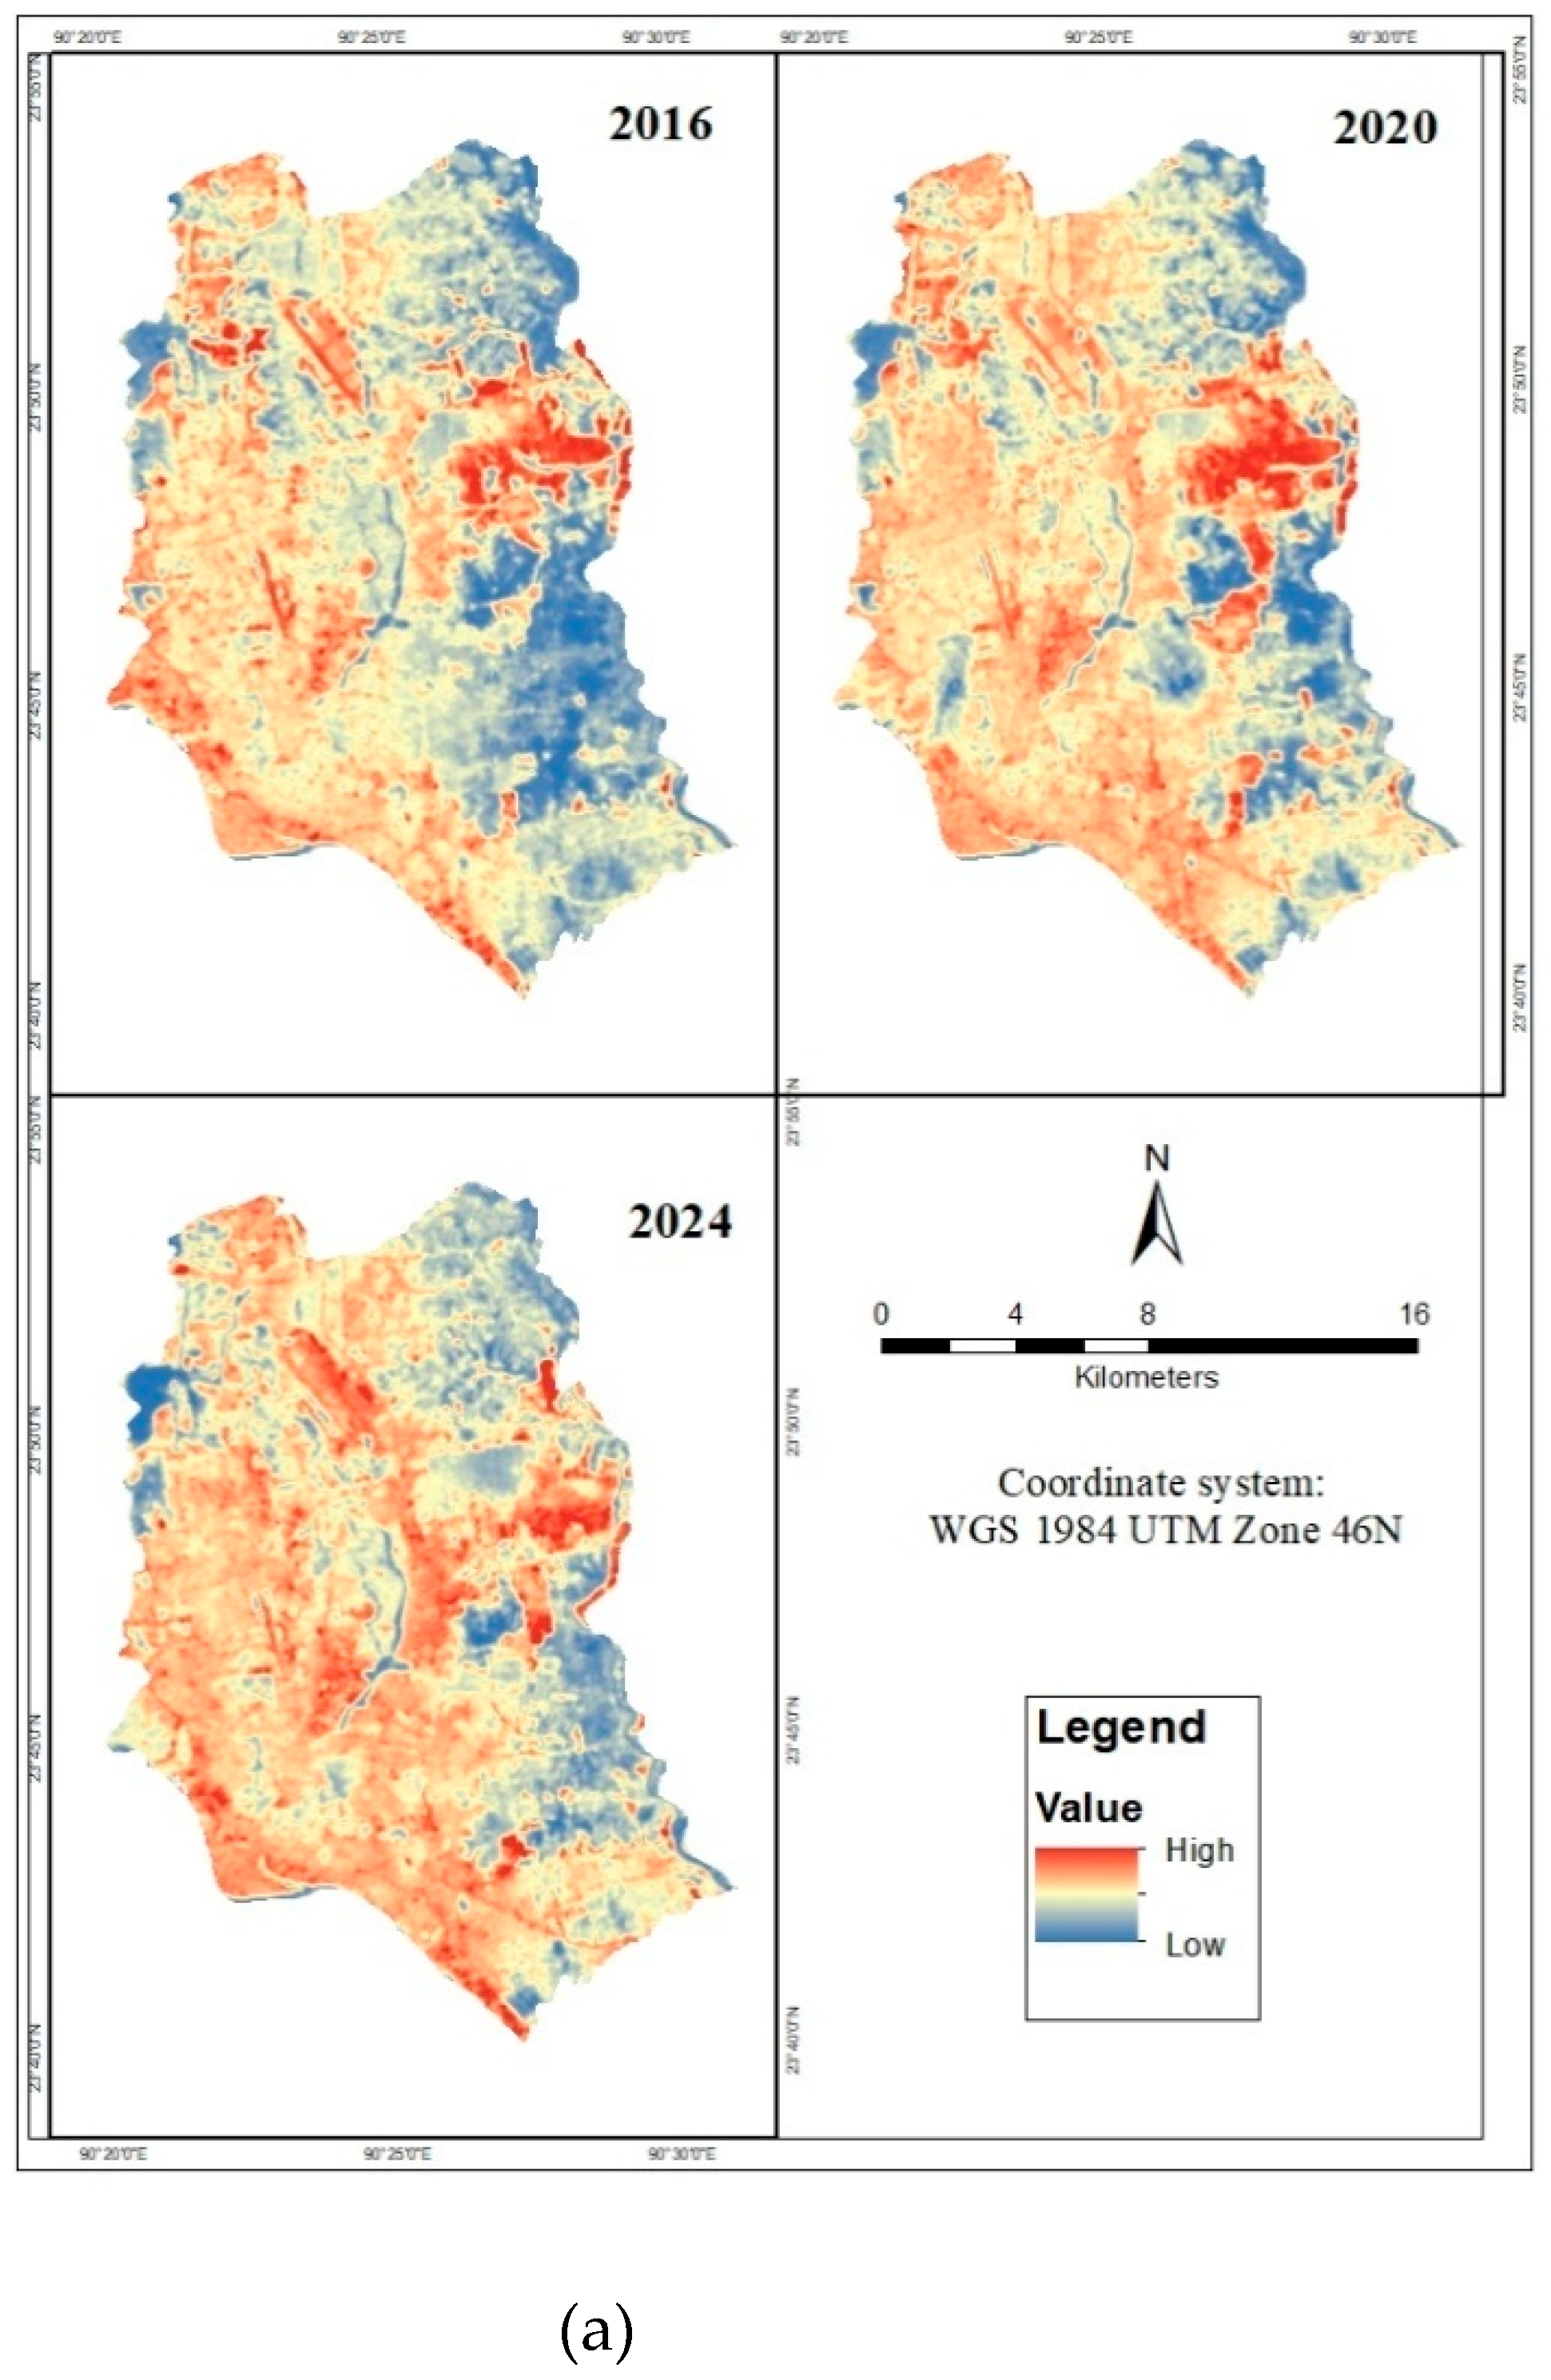
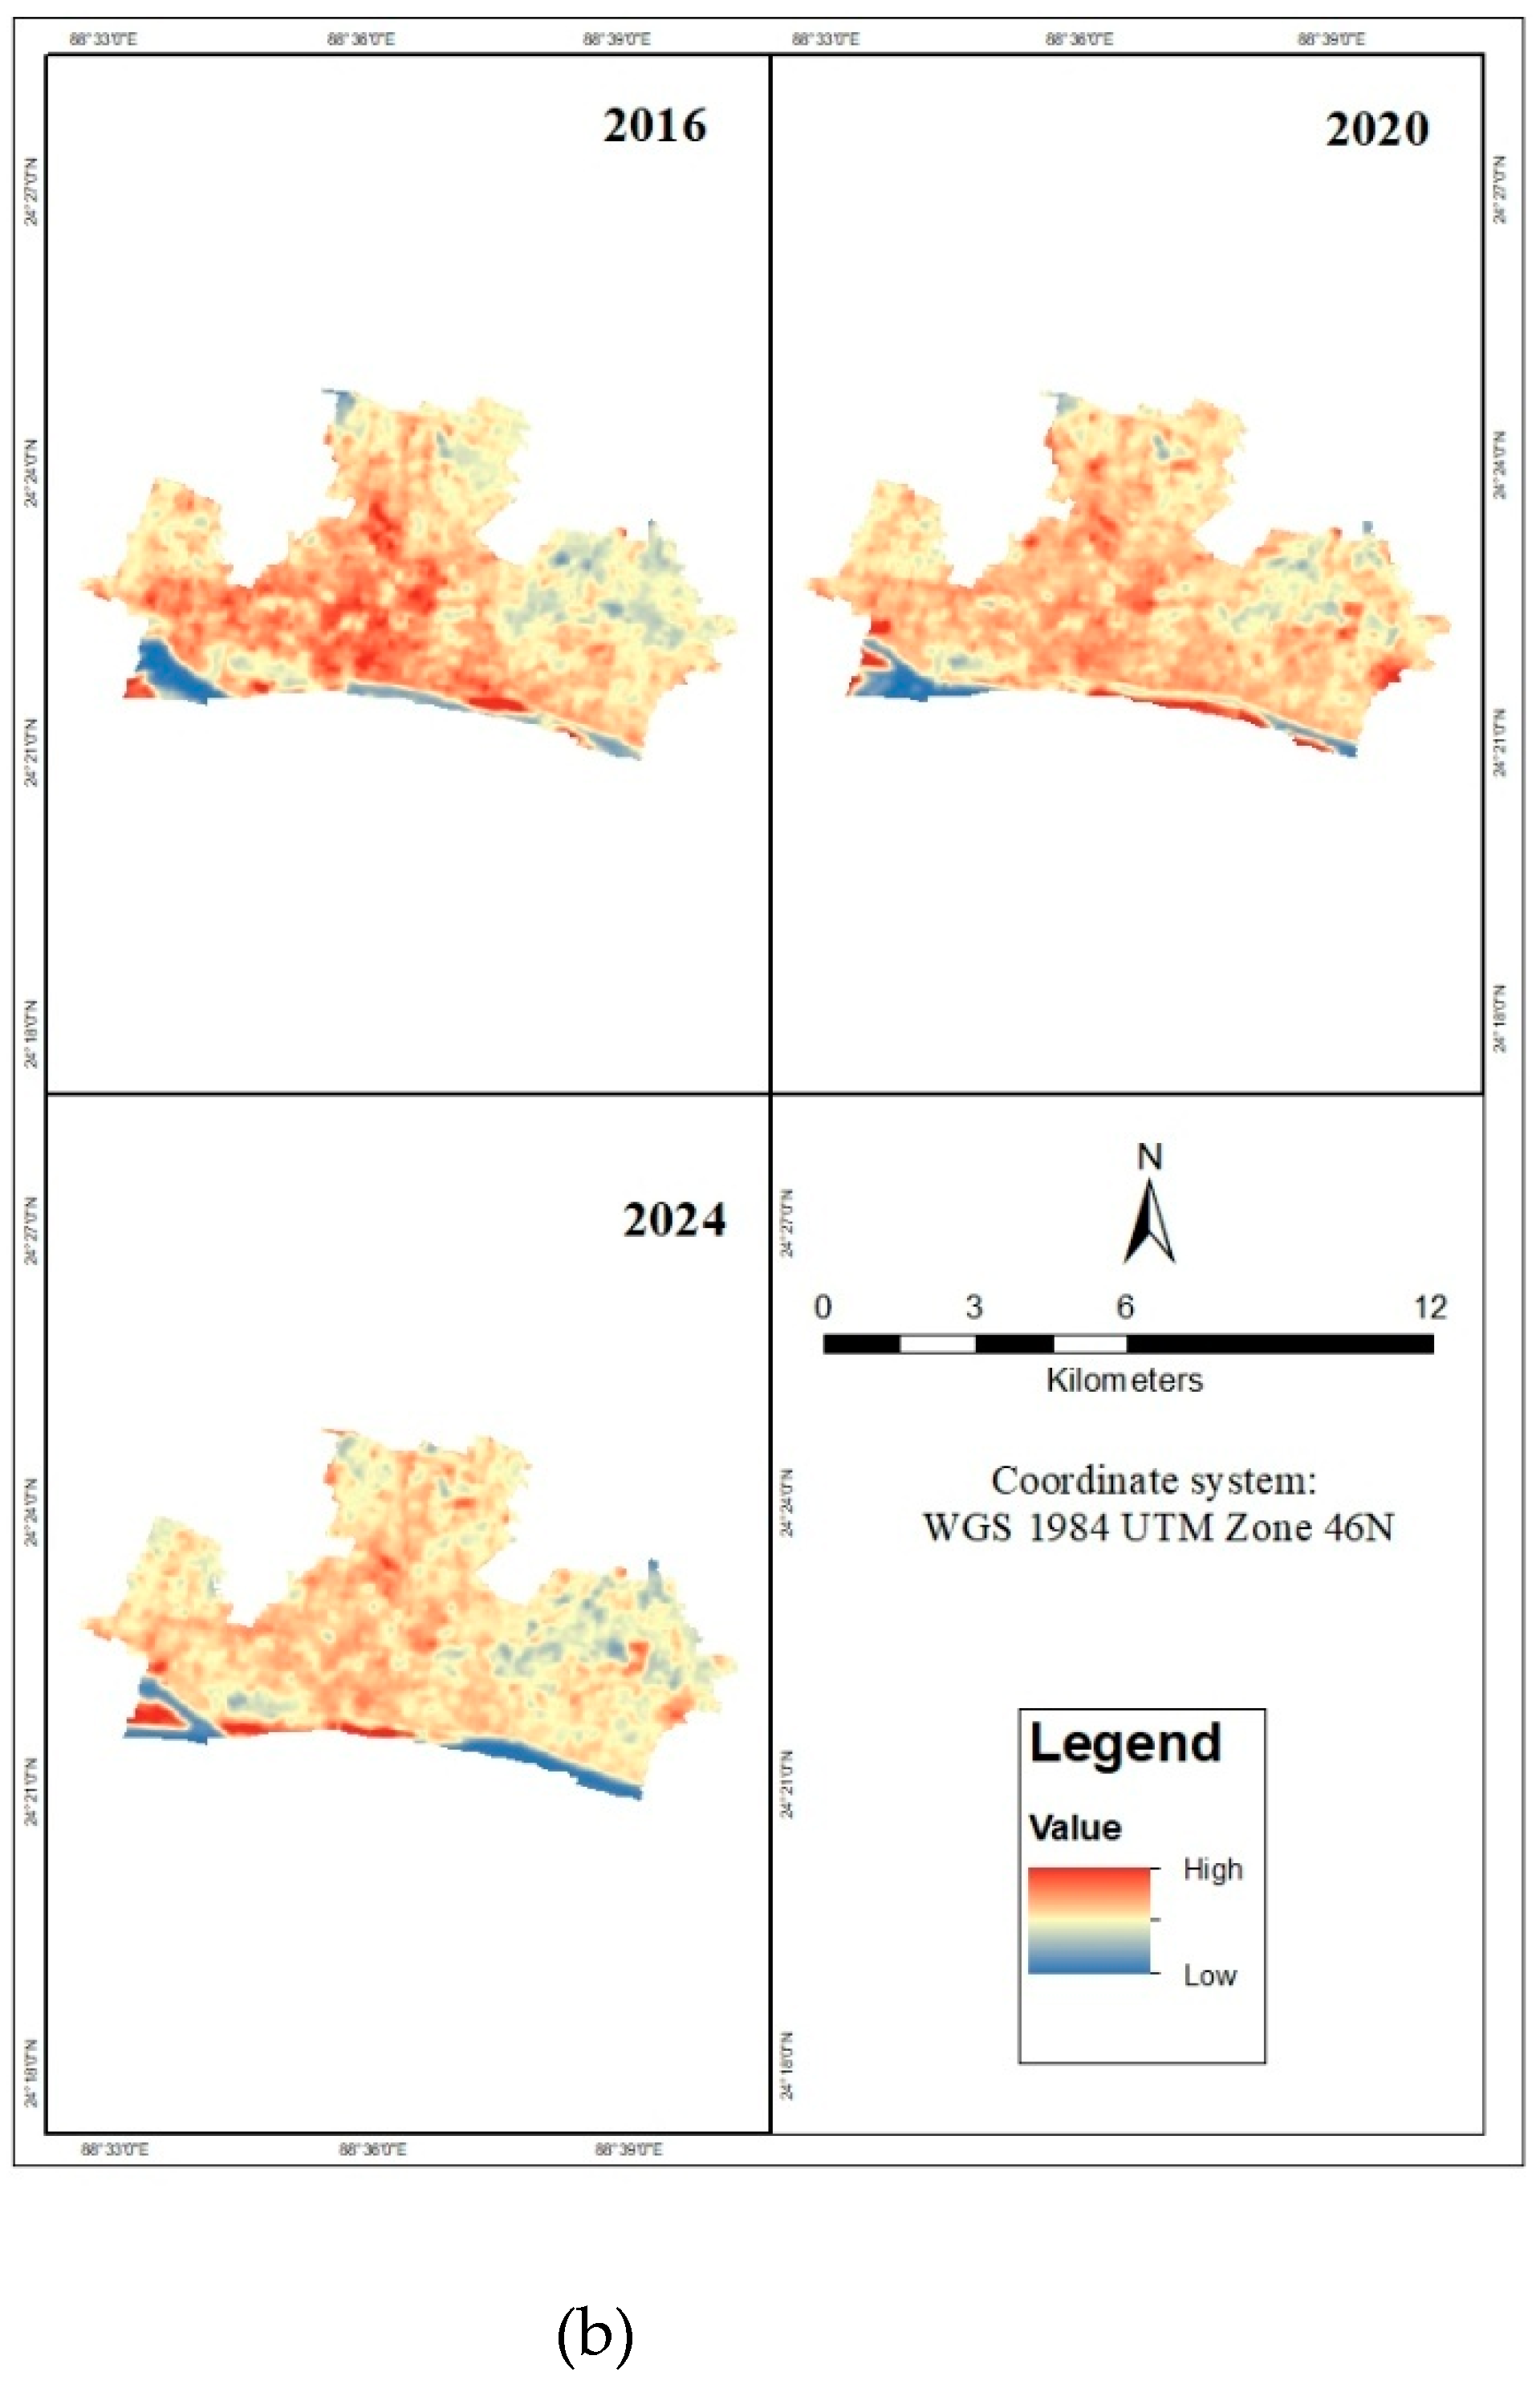
Figure 2.
Temporal variation of LST in DCC (a) & RCC (b).
2.5. LULC Classification
Supervised classification was conducted in Google Earth Engine using the Random Forest (RF) classifier, a machine learning algorithm with high precision in LULC mapping [40]. Training samples were collected for five major land cover classes: Waterbody, Vegetation, Built-up Area, Barren Land, and Agricultural Land. The classifier was trained on labeled samples with an equal number of decision trees to enhance classification accuracy.
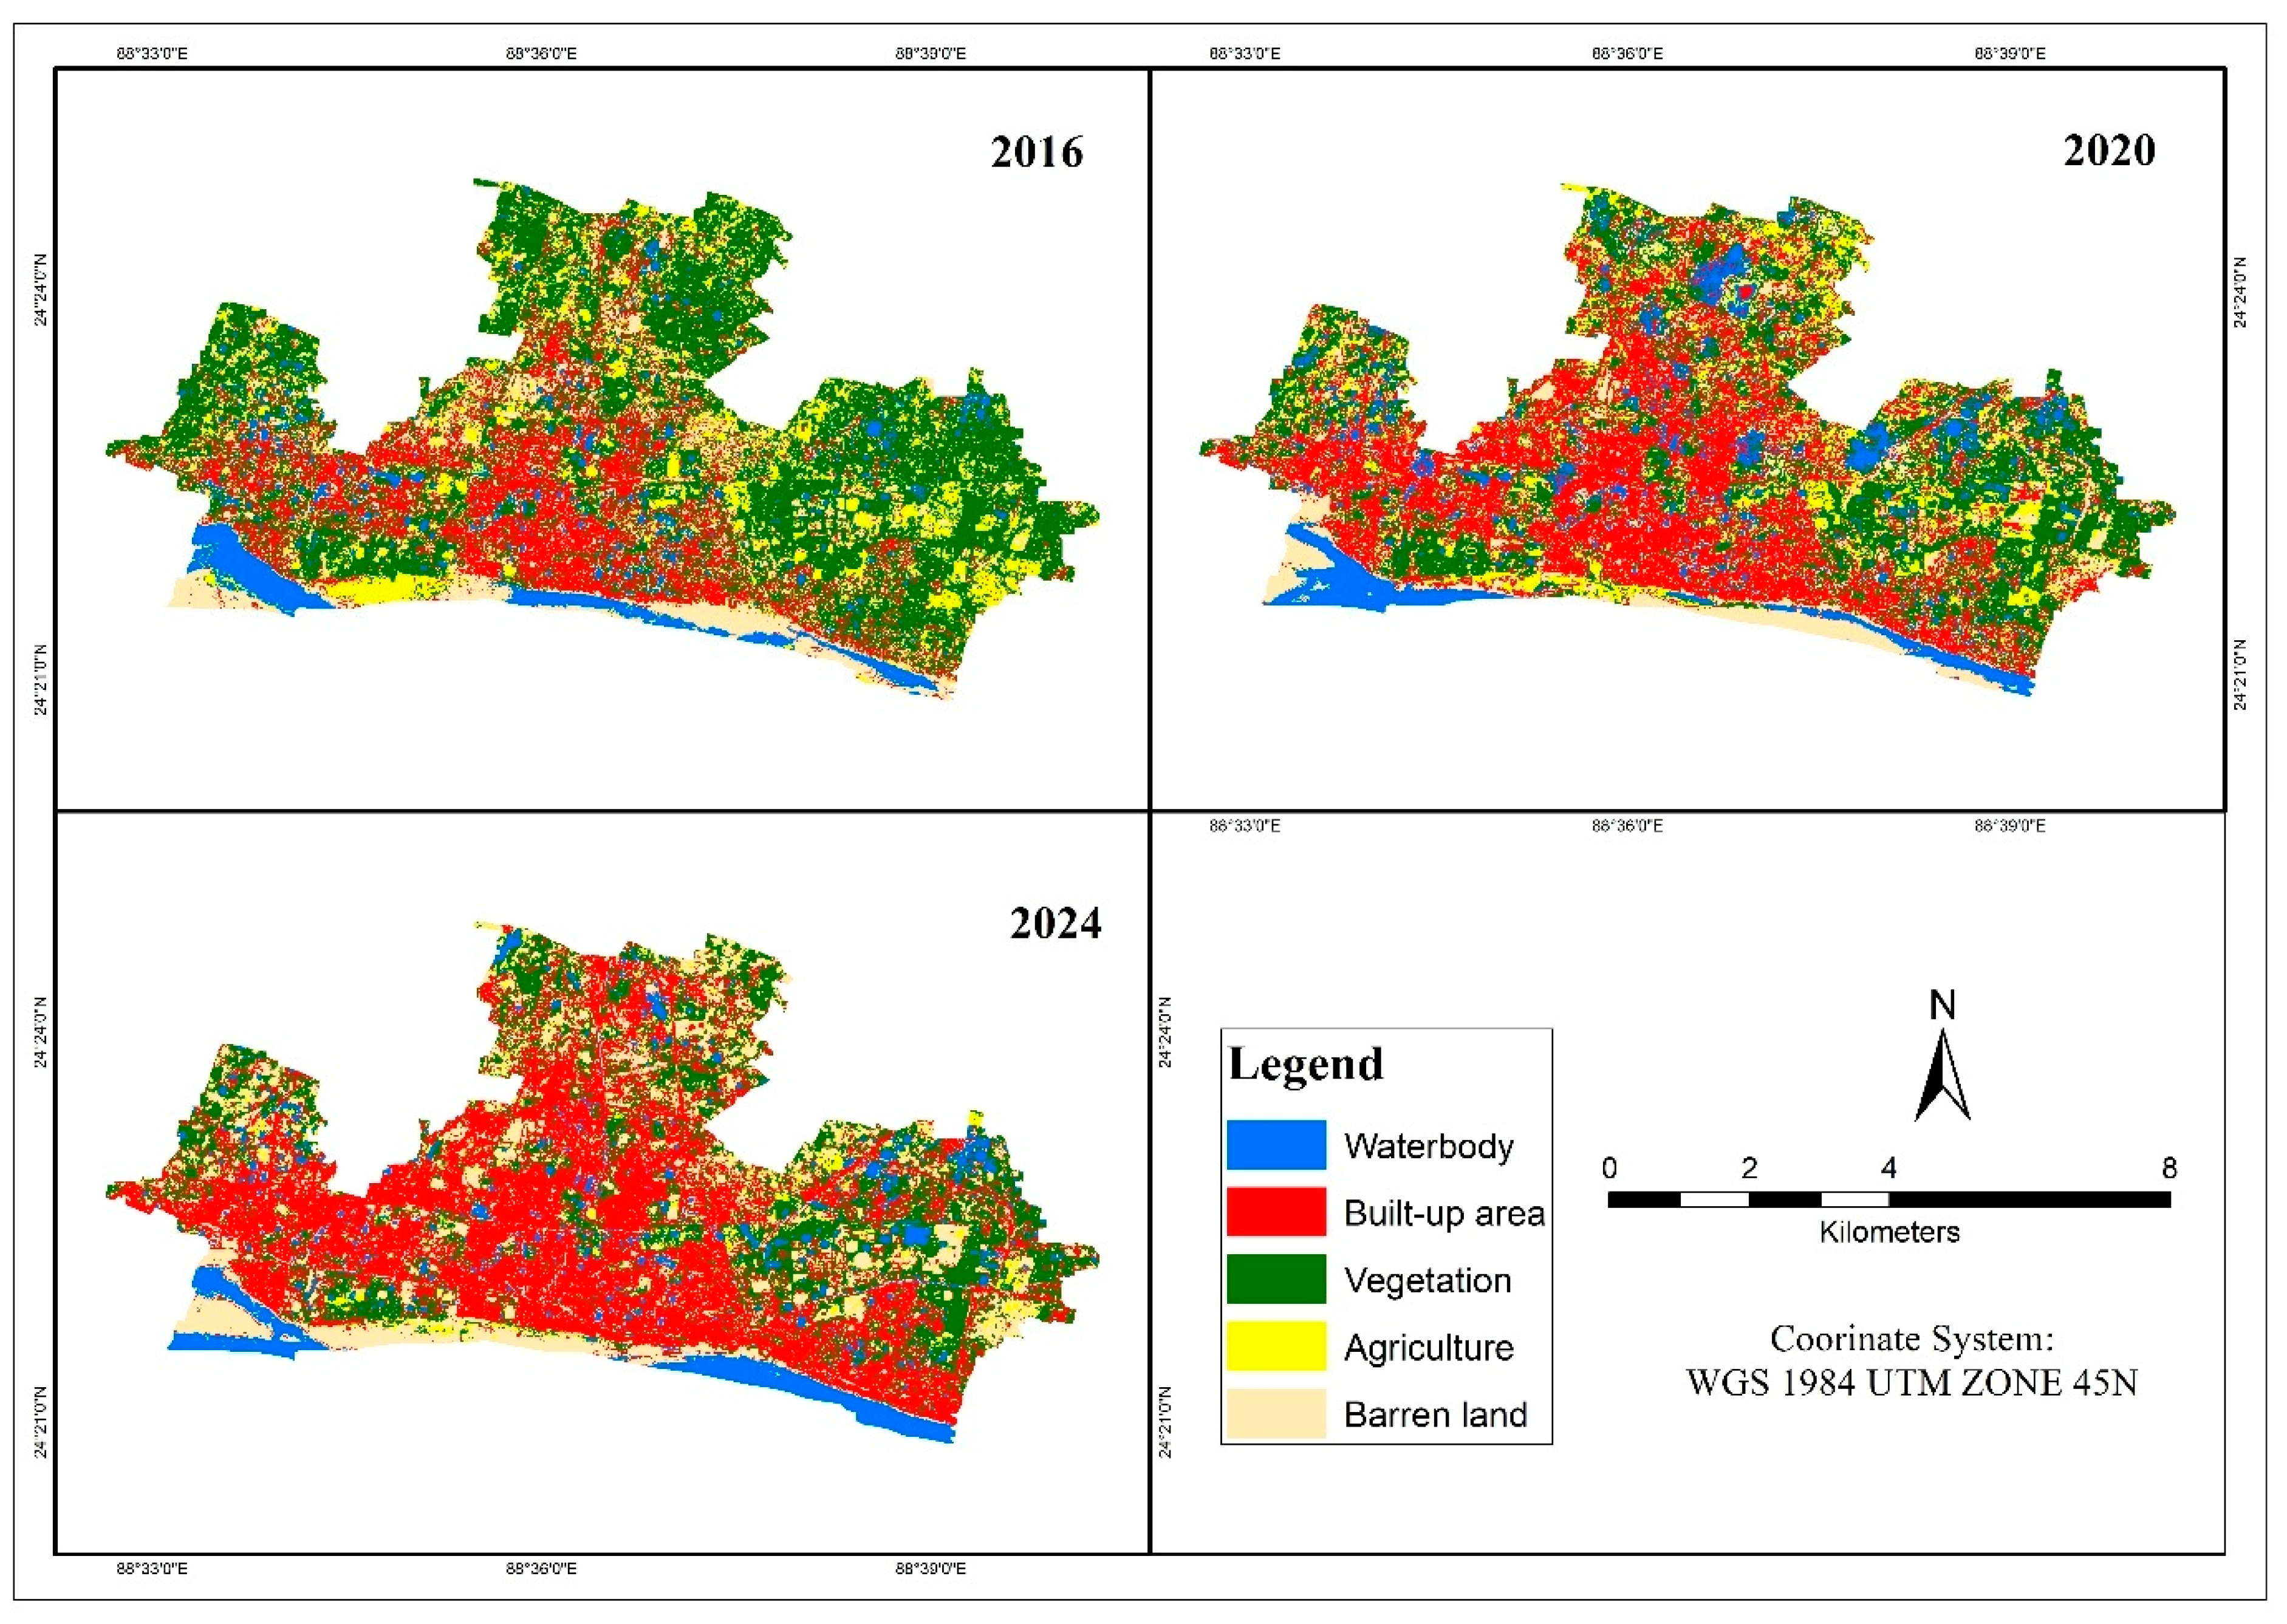
Figure 3.
Land use Changes in DCC.
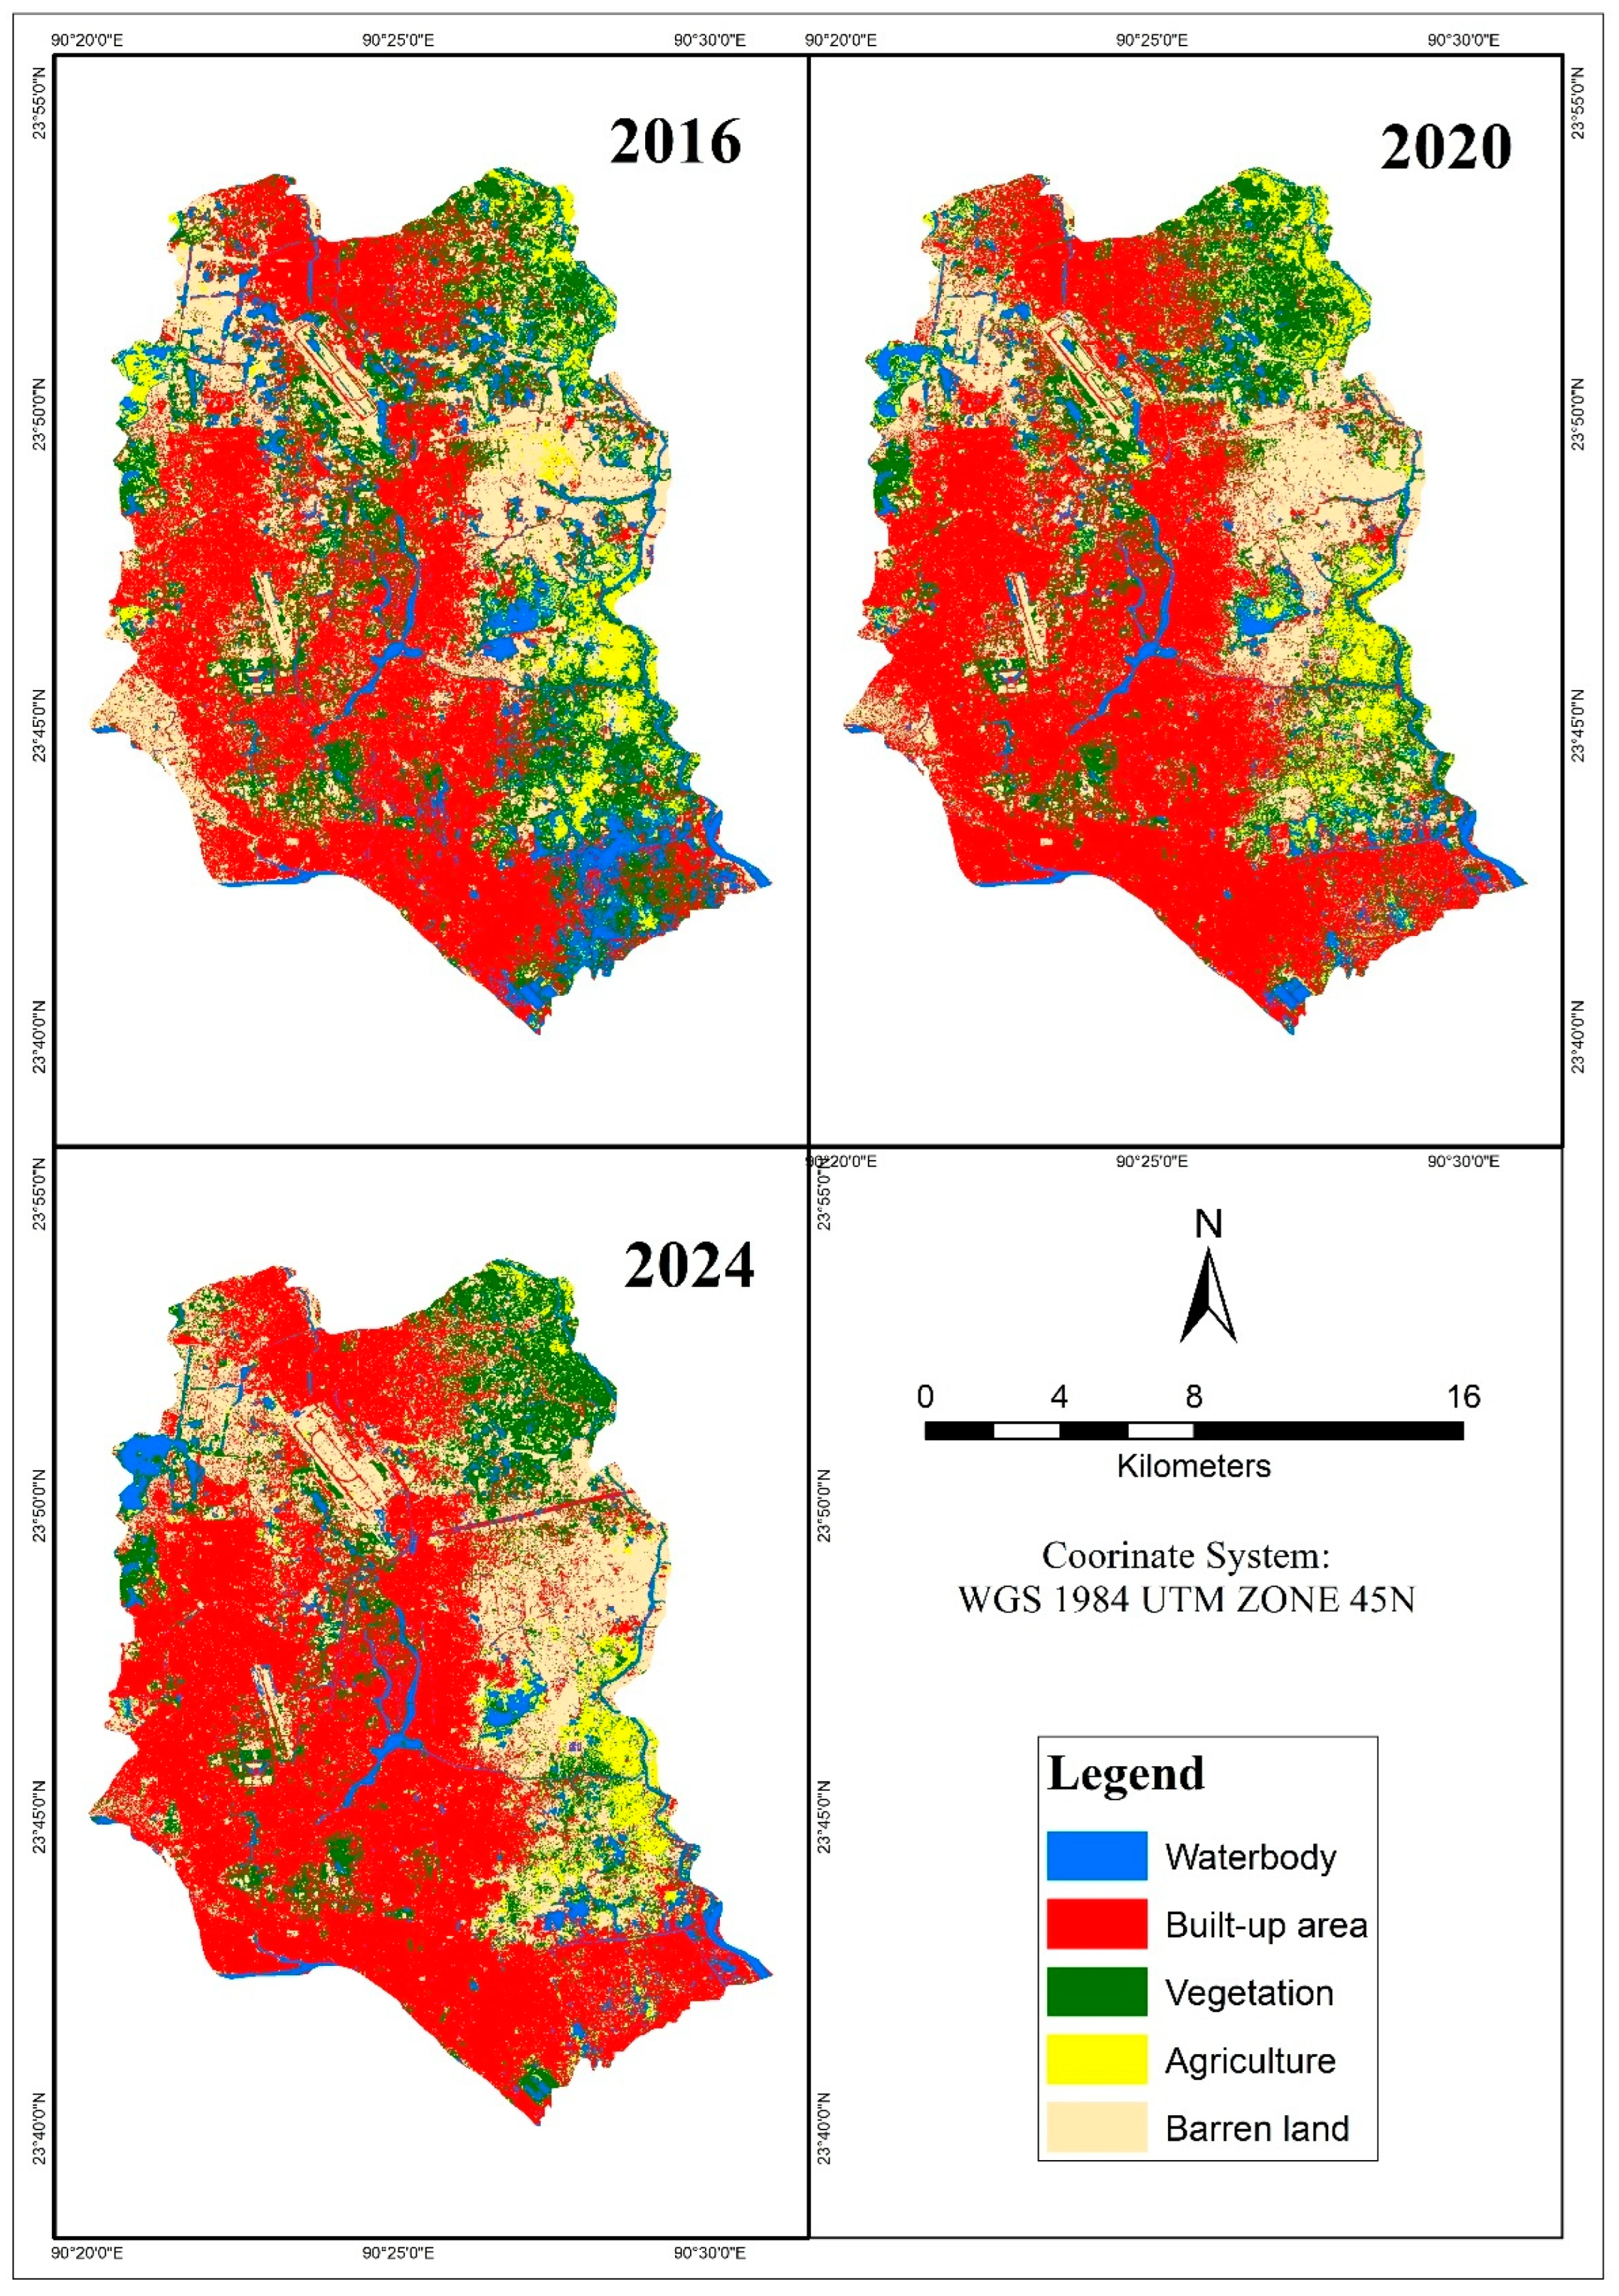
Figure 4.
Land use changes in RCC.
2.6. Accuracy Assessment
An error matrix was produced and such important parameters as Overall Accuracy (OA) and Kappa Coefficient were derived for the accuracy assessment [41]. Independent validation points were randomly chosen from high-resolution images and cross-checked with classified raster.
2.7. Change Detection
Post-classification comparison was performed to assess LULC change between 2016, 2020, and 2024. Classified maps were superimposed, and area statistics were computed to quantify land cover class changes over time. Temporal trends were analyzed to detect urban expansion in DCC and RCC.
2.8. Air Pollution Analysis
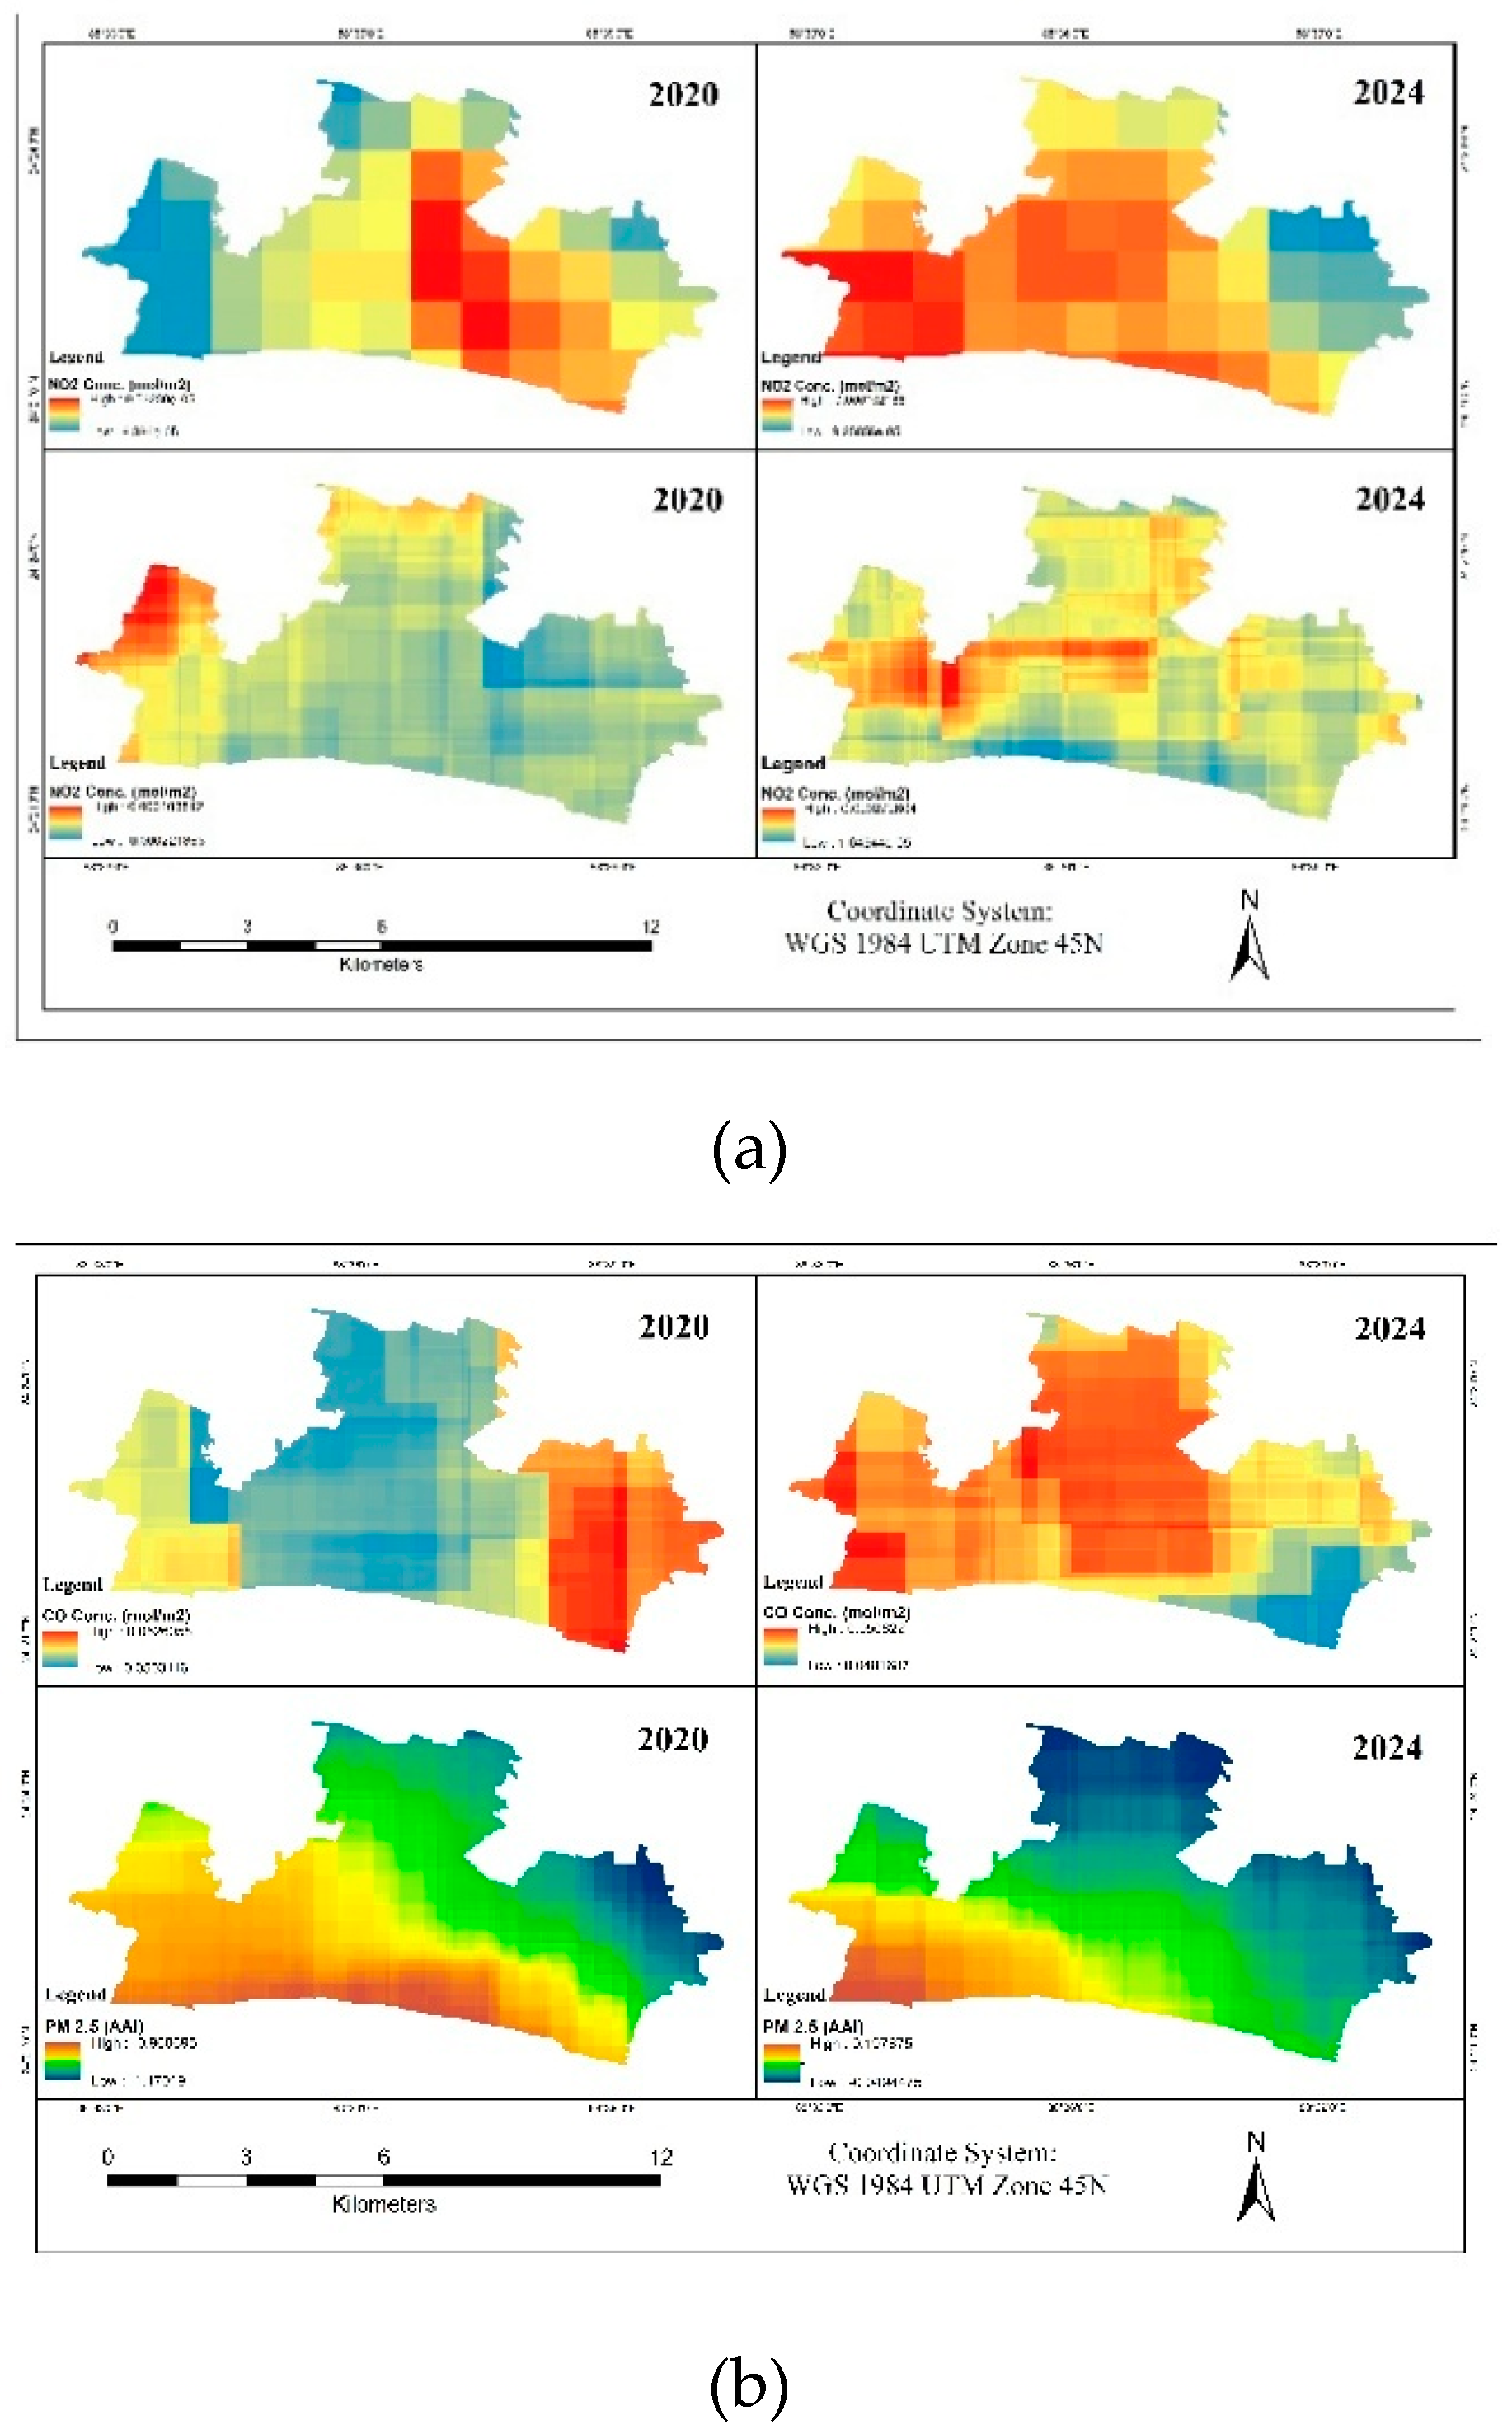
Level 3 (L3) data products for NO₂, SO₂, CO, and PM₂.₅ were acquired from the Copernicus Open Access Hub. These products offer vertical column densities (VCDs) in molecules per square centimeter for NO₂, SO₂, and CO, and PM₂.₅ concentrations in Aerosol Absorbing Index (AAI).
Figure 5.
Concentration of NO2, SO2 (a), CO & PM (b) in DCC.
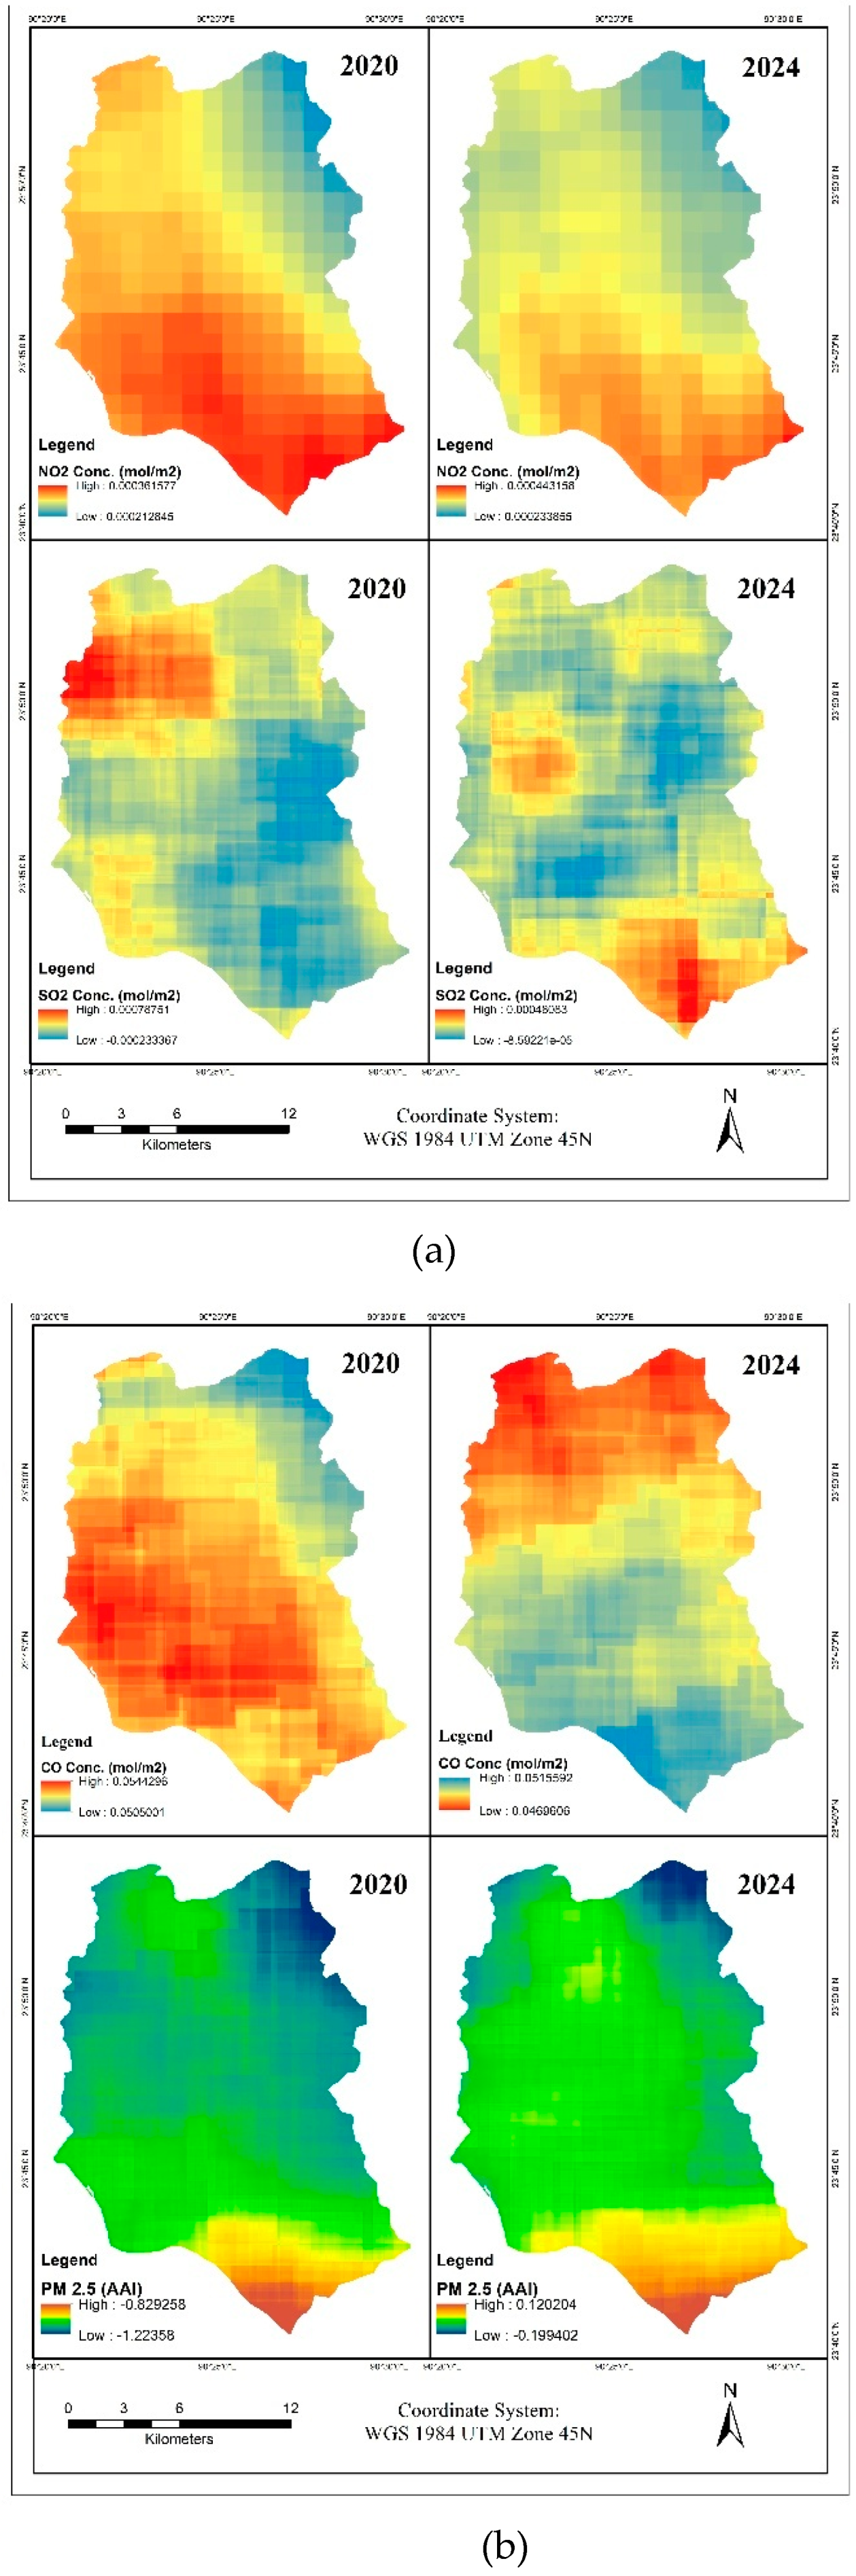
Figure 6.
Concentration of NO2, SO2 (a), CO & PM (b) in RCC.
2.9. Climate Risk Zone Mapping
A weighted overlay technique was used to merge the LULC, LST and air pollution layers, to identify climatic risk zones. This technique integrates different geographical datasets to identify locations that are most vulnerable to climate-related risks.
Figure 7.
Climate risk zone identification of DCC & RCC.
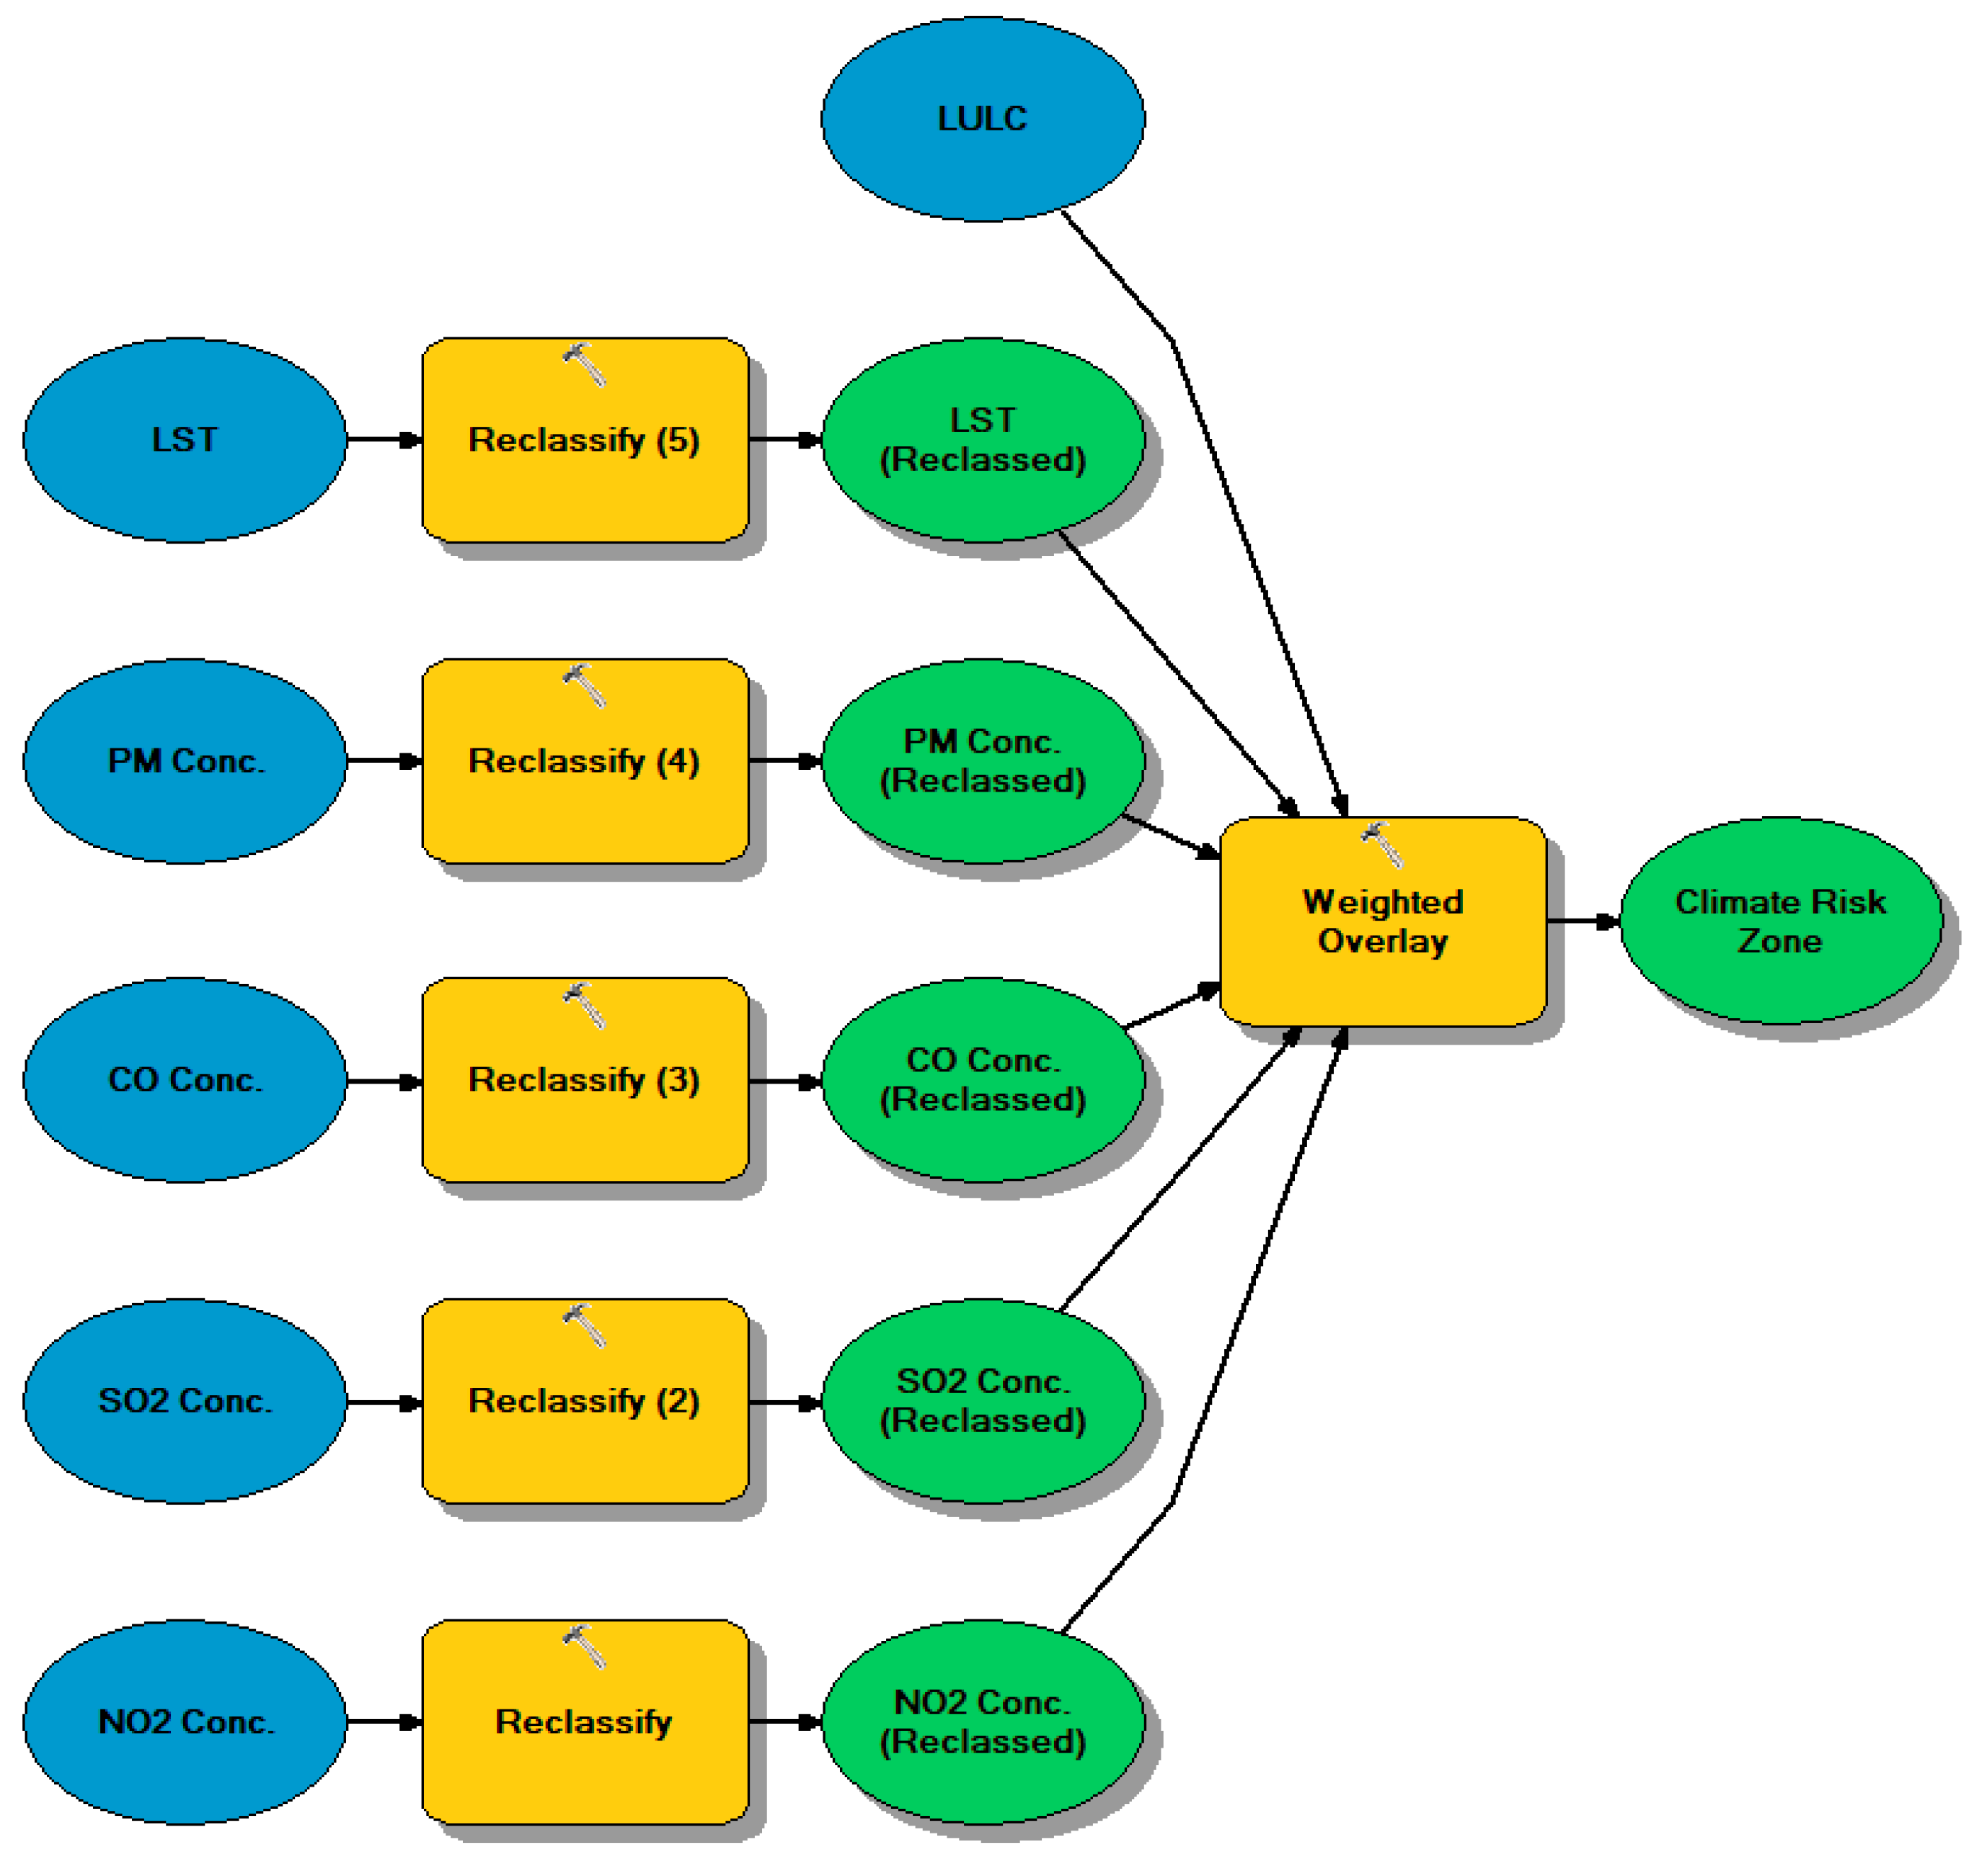
Reclassification: Each geographic layer was categorized into risk categories using established thresholds.
Table 4.
Risk Categorization of LULC.
| LULC | Risk category |
|---|---|
| Waterbody | 1 |
| Built-up area | 5 |
| Vegetation | 2 |
| Agriculture | 3 |
| Barren land | 4 |
Other layers were categorized as higher LST & pollution level = high risk category
Weight Assignment:
Each layer and its categories were weighted based on their respective contribution to climate risk.
Table 5.
Weights Assigned per Parameters.
| Parameter | Weight | Rationale |
|---|---|---|
| LULC | 20 | Urban areas contribute to heat island effects. |
| LST | 25 | High LST correlates with climate risks. |
| NO2 | 15 | Major pollutant affecting air quality. |
| SO2 | 10 | Contributes to acid rain, affecting climate. |
| CO | 10 | Indicator of incomplete combustion, linked to urban pollution. |
| PM2.5 | 10 | Significant health and environmental hazard. |
3. Result
3.1. Urban Expansion Pattern
The findings show that built-up areas increased significantly throughout the research period, whereas vegetation, waterbody and agricultural land decreased.
Table 6.
Changes in LULC of DCC & RCC.
| DCC | RCC | |||||
|---|---|---|---|---|---|---|
| LULC | Area in 2020 (%) | Area in 2024 (%) | Changes (%) | Area in 2020 (%) | Area in 2024 (%) | Changes (%) |
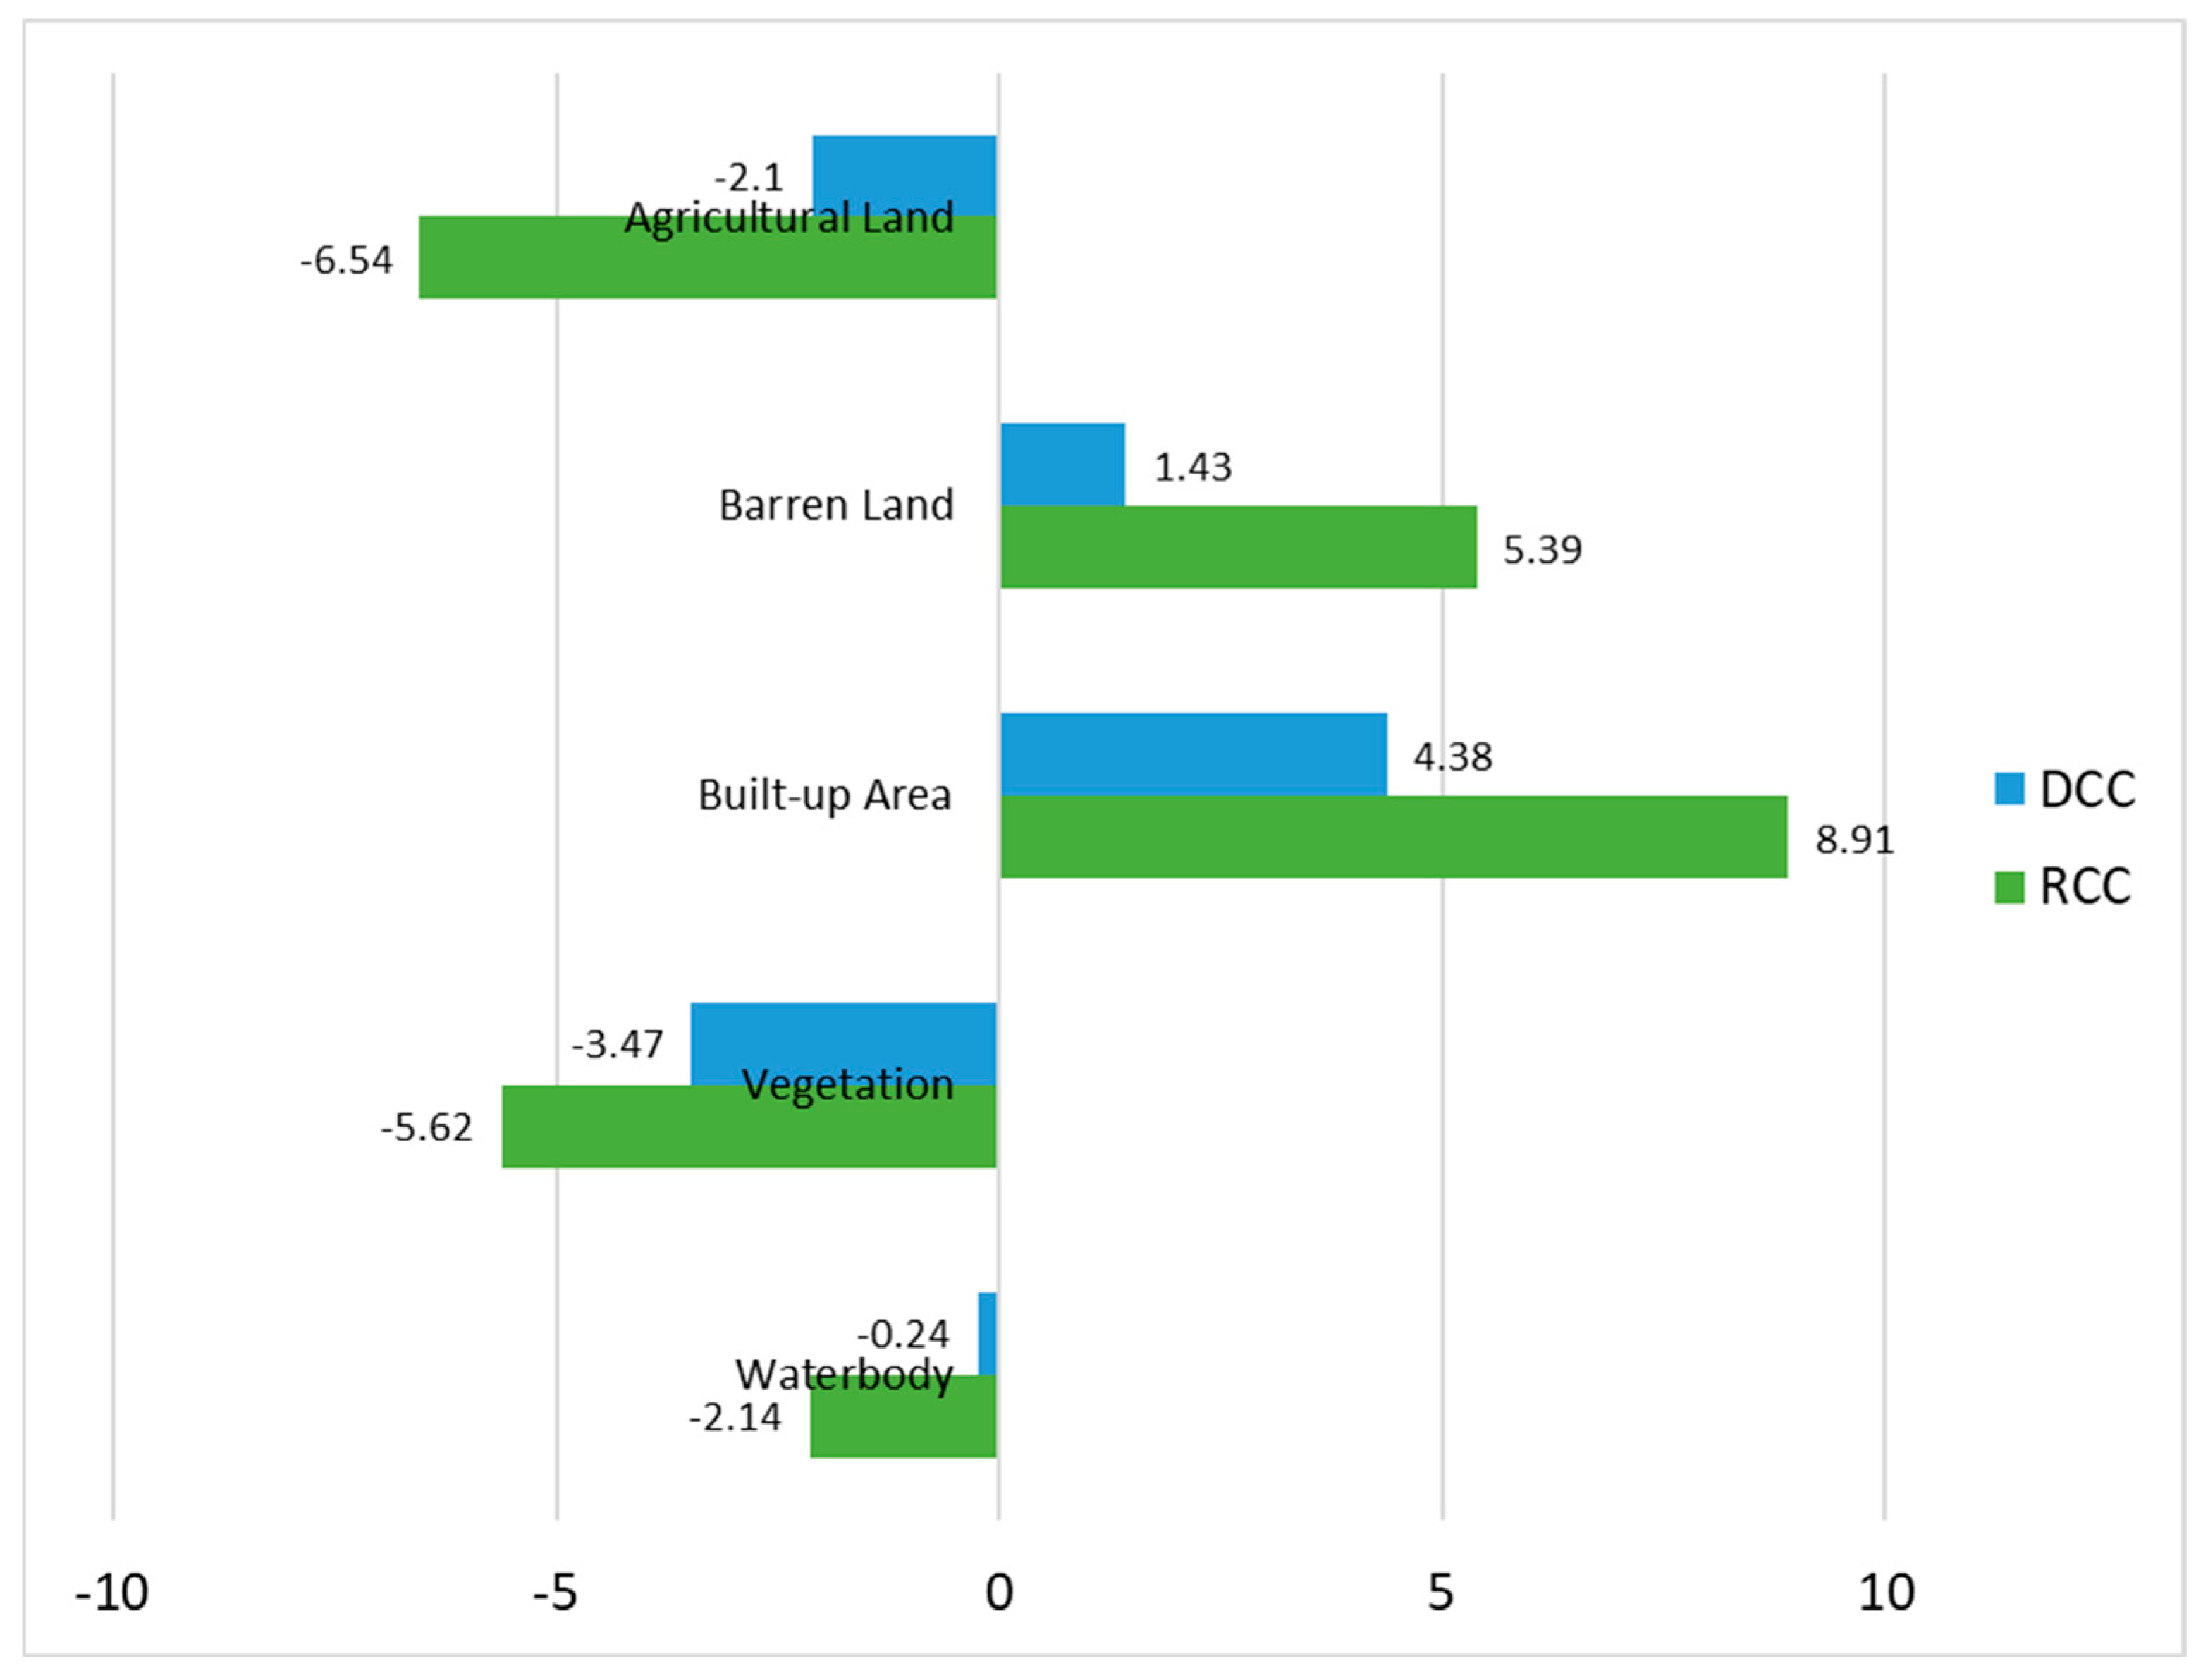
| Waterbody | 6.78 | 6.54 | -0.24 | 11.29 | 9.15 | -2.14 |
| Vegetation | 19.98 | 16.51 | -3.47 | 30.4 | 24.78 | -5.62 |
| Built-up Area | 47.17 | 51.55 | 4.38 | 31.78 | 40.69 | 8.91 |
| Barren Land | 20.01 | 21.44 | 1.43 | 15.48 | 20.87 | 5.39 |
| Agricultural Land | 6.06 | 3.96 | -2.1 | 11.05 | 4.51 | -6.54 |
The categorization results demonstrate that urban expansion has been more prominent in DCC than RCC. In DCC, the built-up area has grown dramatically, displacing green spaces and wetlands. In comparison, RCC shows a more gradual shift, with agricultural land conversion serving as the principal engine of urban expansion. The statistical study reveals a greater yearly urban expansion rate in DCC.
Figure 8.
Comparison of LULC changes between DCC & RCC
3.2. LST Variability.
The temporal analysis shows an increase in LST from 2016 to 2024. The highest recorded LST values in both cities occurred in 2024, illustrating the influence of urbanization and land cover changes. A comparative analysis of LST with land use and land cover (LULC) categories demonstrates that built-up areas consistently exhibit substantially greater temperatures than vegetation and water bodies.
3.3. Climate Risk Zone Identification
The climatic risk zones were divided into five categories: very low, low, moderate, high, and extremely high risk.
The spatial distribution and proportion of regions falling into each category in Dhaka City Corporation (DCC) and Rajshahi City Corporation (RCC) were examined for the years 2020 and 2024.
Table 7.
Changes in Climate Risk Zones of DCC & RCC.
| DCC | RCC | |||
|---|---|---|---|---|
| Risk Zone | Area in 2020 (%) | Area in 2024 (%) | Area in 2020 (%) | Area in 2024 (%) |
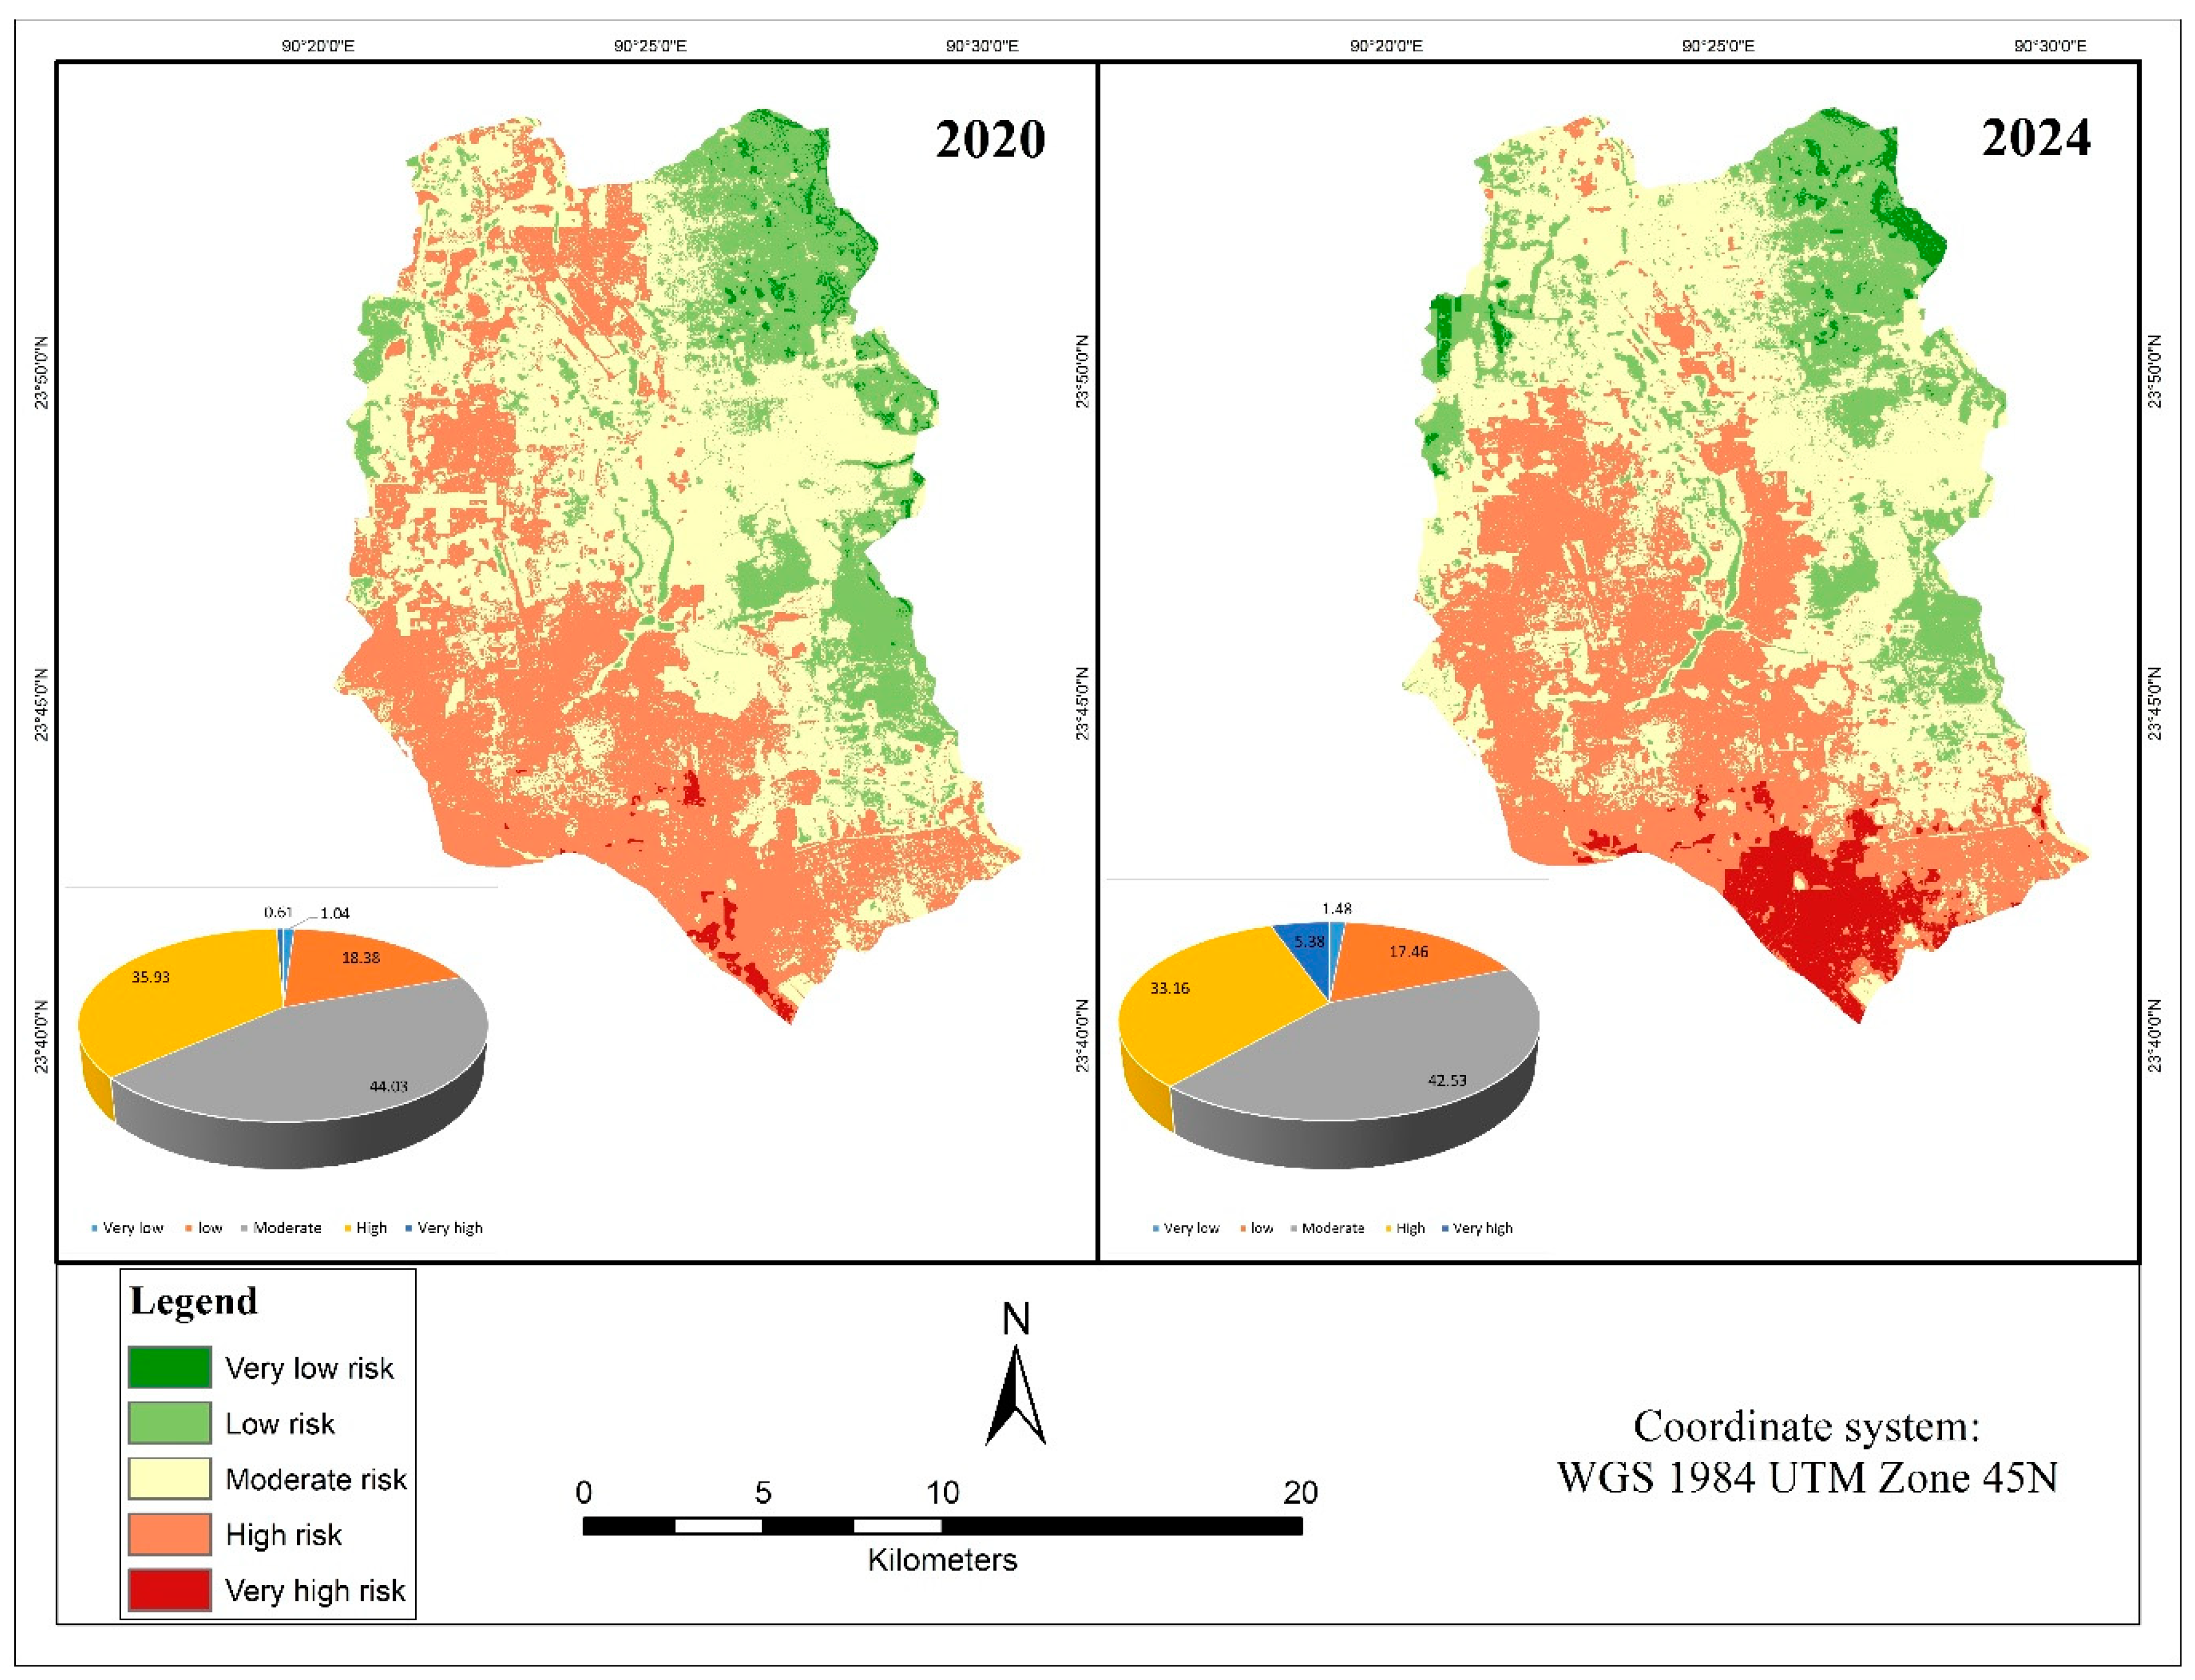
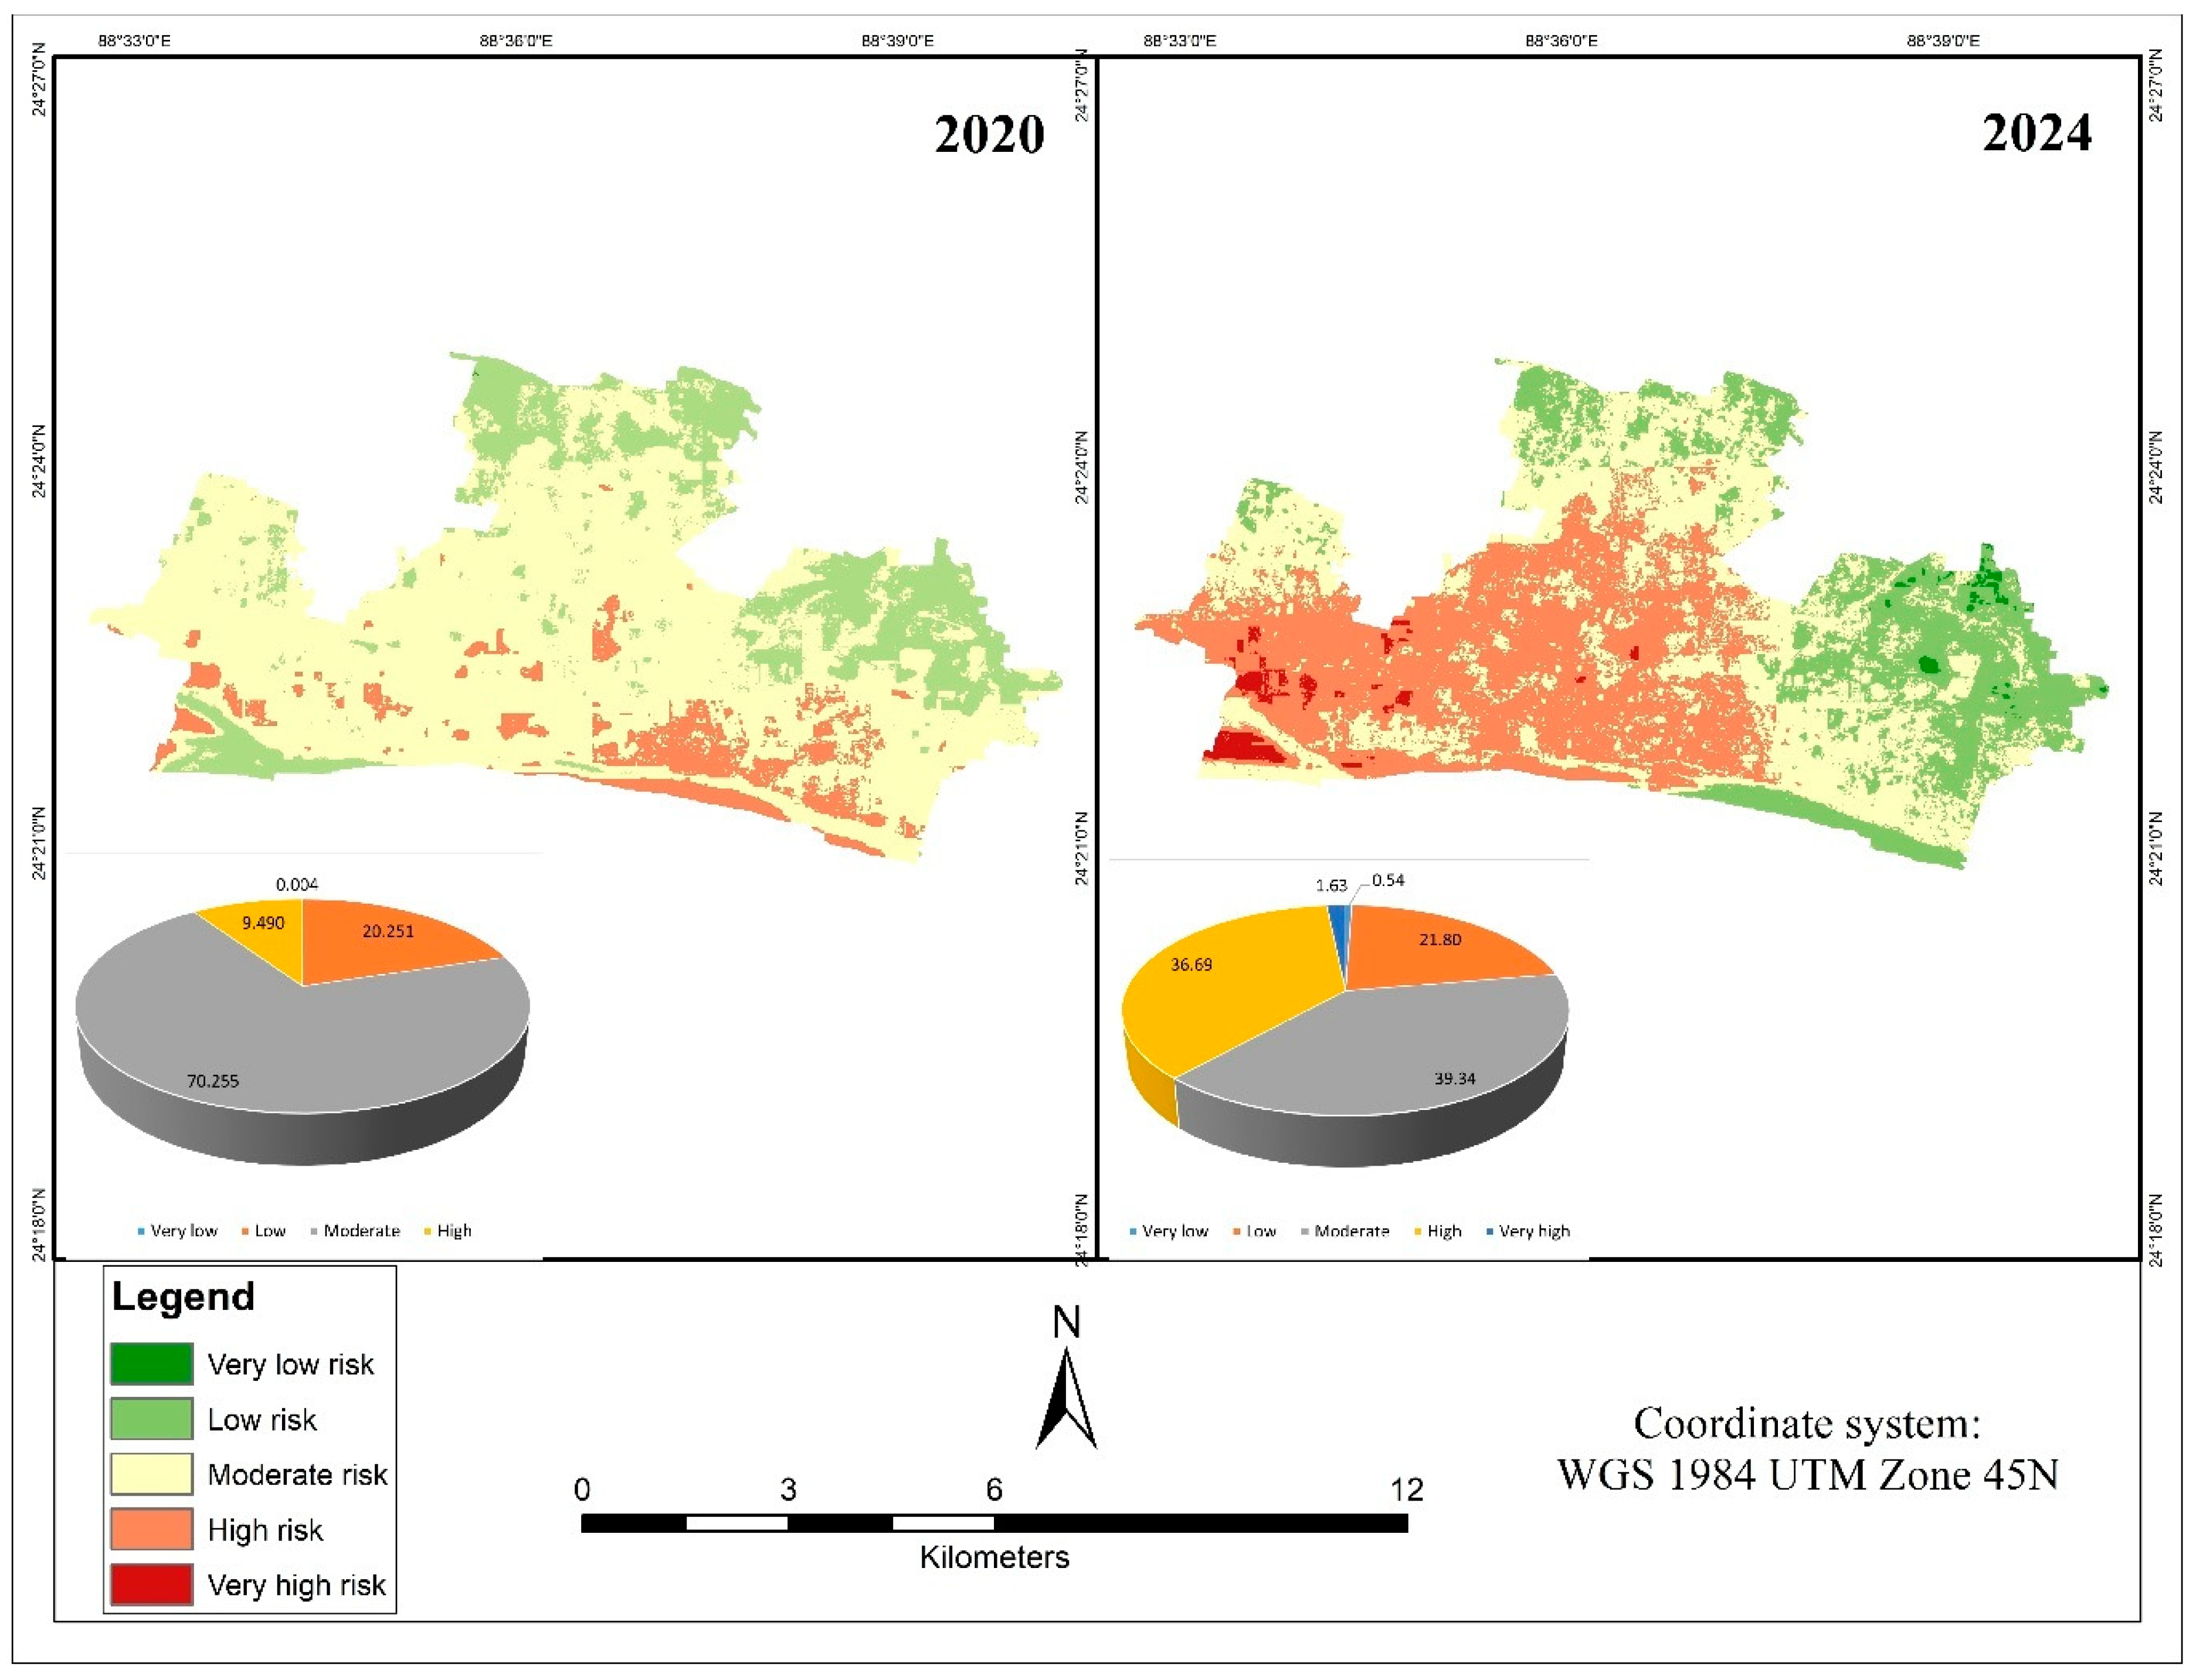
| Very low | 1.04 | 1.48 | 0.004 | 0.54 |
| low | 18.38 | 17.46 | 20.251 | 21.80 |
| Moderate | 44.03 | 42.53 | 70.255 | 39.34 |
| High | 35.93 | 33.16 | 9.490 | 36.69 |
| Very high | 0.61 | 5.38 | 1.63 | |
The moderate-risk zone remained dominant in DCC throughout the research, though its extent dropped slightly as additional places moved into higher-risk categories. The high-risk zone, while still encompassing a substantial portion of the city, was also on the decline. However, the most alarming trend was seen in the very high-risk category, which increased considerably in 2024 compared to 2020, implying a rise in severe urban area and air pollution levels. Meanwhile, the very low and low-risk zones showed slight variations, indicating localized improvements in environmental circumstances in some places.
Figure 9.
Climate Risk Zone for DCC.
In RCC, the most striking development was the significant decline in the moderate-risk zone, which once encompassed a large area of the city but had shrunk significantly by 2024. This transition was followed by a significant rise in high-risk locations, indicating increased environmental stress. Furthermore, the appearance of a previously undetected very high-risk zone highlights the city's rising climatic vulnerability in certain areas.
Figure 10.
Climate Risk Zone for RCC.
3.4. Nexus Between Urban Area and Climate Risk Zones
The investigation of urban growth and climate risk zones in DCC and RCC shows a substantial link between rapid urbanization and increased climate vulnerability. The geographical overlay of changes in land use and land cover (LULC) with climatic risk zones shows that built-up areas have increased at the expense of vegetative cover and water bodies, resulting in higher LST and poorer air quality.
In DCC, intensively urbanized regions correspond to high and extremely high-risk zones. The loss of green areas and wetlands has increased surface heat absorption, aggravating the urban heat island (UHI) impact.
A comparable pattern, but with a somewhat lesser intensity, is seen in RCC. High-risk areas have increased as a result of the city's urban growth, especially along commercial and transit routes.
3.5. Comparison Between DCC & RCC
3.5.1. Urban Expansion
Compared to RCC, DCC showed a far greater magnitude of urban growth. The capital city's usual rapid urbanization and population expansion was reflected in the substantially larger increase in built-up areas in DCC. Approximately 18% more land was covered by built-up regions, which replaced formerly vegetated and agricultural land.
In contrast, RCC had a very moderate growth in built-up areas, increasing by around 10% throughout the same time period. This suggests a slower rate of urbanization than DCC, most likely as a result of slower population increase and other socioeconomic variables.
3.5.2. LST & Pollution
Due to its fast urbanization, DCC saw a significant rise in LST, with urban heat islands becoming more noticeable in 2024. This indicates that DCC is more susceptible to climatic threats, especially in densely populated places, especially when paired with greater levels of air pollution (NO₂, SO₂, CO, and PM2.5).
RCC also showed an increase in LST over the same period, but the growth was less pronounced, and air pollution levels were relatively lower compared to DCC. The distribution of low to moderate risk zones in RCC indicates a relatively better environmental condition despite urban expansion
3.5.3. Climate Risk Zones
Due to the rising urban heat island effect and the densification of built-up regions, DCC experienced a larger percentage of high and extremely high-risk zones, especially in 2024. The DCC's moderate-risk zones somewhat shrank, indicating that the recently urbanized regions are more susceptible to the effects of climate change, including increased pollution and heat.
With a higher percentage of low- and moderate-risk locations, RCC had a more evenly distributed risk zone distribution. But in 2024, there was a notable rise in high-risk areas, mostly as a result of land cover changes and urbanization.
4. Discussion
The findings of the investigation demonstrate a direct correlation between urban growth and the escalation of climatic risk areas in both cities. While urban expansion continues, it is accompanied by increasing climate risks in both cities. In contrast to RCC, which had a 3.91% rise in built-up area between 2020 and 2024, DCC saw a faster pace of urban expansion, with the built-up area growing by 4.38%. Higher LST values were linked to built-up areas in DCC, and this was correlated with a rise in high and extremely high-risk zones, especially in regions with less green cover. RCC, on the other hand, saw more gradual urbanization, with the majority of the land being transformed from agricultural to built-up areas. This slower rate of growth in RCC compared to DCC resulted in a milder increase in extremely high-risk zones, but it remains a source of worry as the city's sensitivity to climate change and air pollution increases.
The majority of DCC fell into the moderate and high-risk categories, indicating the prevalence of heat and air pollution in densely populated regions. However, the growth in the extremely high-risk zone in 2024, particularly in densely populated areas, suggests that the climate in these places is deteriorating. RCC's drop in moderate-risk regions and the growth of high-risk and extremely high-risk zones indicate that the city is becoming more vulnerable to climatic extremes, notwithstanding its progressive expansion.
DCC, the capital and largest city in Bangladesh, has experienced rapid urban growth, leading to land use changes and increased climate vulnerability. This has resulted in a sharp increase in high-risk and very high-risk zones, emphasizing the need for effective urban planning and climate adaptation strategies. RCC, on the other hand, has experienced moderate growth in built-up areas but also faces rising LST and increased air pollution. The emergence of new high-risk zones in RCC underscores the need for better urban planning and environmental protection policies.
The comparative investigation of DCC and RCC reveals the various urbanization trajectories and their implications for climate risk. Dhaka, Bangladesh's capital and largest city, has witnessed fast and frequently unplanned urban expansion, resulting in substantial land use changes and increasing climatic vulnerability. DCC's built-up regions have grown at an especially rapid pace, displacing agricultural and vegetated land and worsening urban heat island effects. This has led in a significant increase in the number of regions designated as high-risk and extremely high-risk zones, emphasizing the importance of implementing more effective urban planning and climate adaptation policies. In contrast, RCC's slower rate of urbanization has resulted in more moderate expansion in built-up areas, but it is still confronting increasing LST and increased air pollution. The creation of new high-risk zones in RCC highlights the need for improved urban planning and environmental protection measures as the city expands.
Rapid urbanization, if not adequately managed, may greatly increase cities' vulnerability to climate-related dangers, particularly when temperatures rise and air quality degrades. The growth in high-risk and extremely high-risk zones in both cities emphasizes the need of incorporating climate risk assessments into urban design. To counteract the UHI impact and lower surface temperatures, cities should emphasize green infrastructure such as parks, green roofs, and urban trees [42]. Furthermore, stronger rules on industrial emissions, transportation, and waste management will be critical for improving urban air quality and health.
Future research might build on this study by investigating the socioeconomic consequences of urban growth for disadvantaged groups in DCC and RCC. In addition, using more comprehensive climate models and downscaling forecasts might offer a more accurate picture of future climate threats. The inclusion of other variables such as water availability, infrastructure quality, and socioeconomic vulnerability has the potential to improve climate risk zone mapping and adaptation techniques. Further research into the effectiveness of green infrastructure and air pollution mitigation techniques in decreasing climate risks would be useful in guiding policy and planning decisions.
5. Conclusion
This study presents a detailed spatiotemporal evaluation of urban development, land surface temperature (LST) fluctuation, and air pollution levels in Dhaka City Corporation (DCC) and Rajshahi City Corporation (RCC), with a focus on their influence on climatic risk zones. Using GIS and remote sensing techniques, the findings show a substantial link between growing urbanization and the amplification of climate risk, stressing the critical need for sustainable urban planning and climate adaption solutions.
The expansion of built-up regions has increased exposure to high heat, air pollution, and environmental degradation, making cities more vulnerable to climate-related health and infrastructure issues. The findings underscore the need of incorporating climate risk assessments into urban planning frameworks in order to prevent negative consequences and increase urban resilience.
To address these issues, legislators and urban planners should prioritize sustainable land-use policies, green infrastructure development, and better air quality control. Implementing nature-based solutions, such as urban trees, green roofs, and water conservation measures, can assist to attenuate the UHI effect and alleviate environmental stress. Furthermore, strong adherence to emission control legislation, promotion of public transportation, and the use of sustainable energy sources may considerably enhance air quality and overall urban livability. In inference, this study emphasizes the critical necessity for proactive urban planning and environmental management in fast urbanizing cities such as Dhaka and Rajshahi. GIS and remote sensing technology can help city administrators and politicians establish better informed, climate-resilient policies for ensuring long-term urban expansion while protecting public health and environmental stability.
Author Contributions
Conceptualization, T.S. and M.I.T.; methodology, T.S., M.I.T and M.A; software, T.S., M.I.T and M.A.; validation, T.S.; formal analysis, T.S; investigation, T.S.; resources, T.S., M.I.T, M.A.; data curation, T.S., M.I.T and M.A; writing—original draft preparation, T.S.; writing—review and editing, T.S., M.I.T and M.A.; visualization, T.S.; supervision, T.S; project administration, T.S.; funding acquisition, T.S. All authors have read and agreed to the published version of the manuscript.
Funding
This research received no external funding.
Data Availability Statement
The data presented in this study are available at https://drive.google.com/drive/folders/1iJ8fhztXsSFWZ6ncXDy4k3v5NODeST8k?usp=drive_link
Acknowledgments
The authors have nothing but praise for the Almighty for making it possible to complete this research. We would especially want to thank individuals for helping with the data collecting and analysis. We sincerely thank the reviewers for their insightful criticism and recommendations on how to make this job better.
Conflicts of Interest
The authors declare no conflicts of interest.
Abbreviations
The following abbreviations are used in this manuscript:
| DCC | Dhaka City Corporation |
| RCC | Rajshahi City Corporation |
| LST | Land Surface Temperature |
| UHI | Urban Heat Island |
| LULC | Land use & Land Cover |
| MRIO | Multiregional Input-Output |
| PMF | Positive Matrix Factorization |
| GIS | Geographic Information System |
| GEE | Google Earth Engine |
| NDVI | Normalized Difference Vegetation Index |
| NDWI | Normalized Difference Water Index |
| SAVI | Soil Adjusted Vegetation Index |
| IPVI | Infrared Percentage Vegetation Index |
| USGS | United States Geological Survey |
| OLI | Optical Land Imager |
| MSI | Multispectral Imager |
| MGRS | Military Grid Reference System |
| TOA | Top of Atmosphere |
| MWA | Mono Window Algorithm |
| BT | Brightness Temperature |
| NIR | Near Infrared |
| PV | Proportion of Vegetation |
| LSE | Land Surface Emissivity |
| RF | Random Forest |
| PM | Particulate Matter |
| VCD | Vertical Column Density |
| AAI | Aerosol Absorbing Index |
References
- Belal, A. A. Detecting Urban Growth Using Remote Sensing and GIS Techniques in Al Gharbiya Governorate, Egypt. Egypt. J. Remote Sens. Space Sci. 2011, 14, 73–79. [Google Scholar] [CrossRef]
- Filho, W. L.; Balogun, A.; Olayide, O. E.; Azeiteiro, U. M.; Ayal, D. Y.; Munoz, P. D. C.; Nagy, G. J.; Bynoe, P.; Oguge, O.; Toamukum, N. Y.; Saroar, M.; Li, C. Assessing the Impacts of Climate Change in Cities and Their Adaptive Capacity: Towards Transformative Approaches to Climate Change Adaptation and Poverty Reduction in Urban Areas in a Set of Developing Countries. Sci. Total Environ. 2019, 692, 1175–1190. [Google Scholar] [CrossRef] [PubMed]
- Ameen, R. F. M.; Morshed, M. Urban Environmental Challenges in Developing Countries—A Stakeholder Perspective. Habitat Int. 2017, 64, 1–10. [Google Scholar] [CrossRef]
- Hamdy, O.; Zhao, S.; Salheen, A. M.; Eid, Y. Y. Identifying the Risk Areas and Urban Growth by ArcGIS-Tools. Geosci. 2016, 6(4), 47. [Google Scholar] [CrossRef]
- Deng, C.; Wu, C. Examining the Impacts of Urban Biophysical Compositions on Surface Urban Heat Island: A Spectral Unmixing and Thermal Mixing Approach. Remote Sens. Environ. 2013, 131, 262–274. [Google Scholar] [CrossRef]
- Li, X.; Zhou, Y.; Asrar, G. R.; Imhoff, M.; Li, X. The Surface Urban Heat Island Response to Urban Expansion: A Panel Analysis for the Conterminous United States. Sci. Total Environ. 2017, 605–606, 426–435. [Google Scholar] [CrossRef]
- Xiong, Y.; Huang, S.; Chen, F.; Ye, H.; Wang, C.; Zhu, C. The Impacts of Rapid Urbanization on the Thermal Environment: A Remote Sensing Study of Guangzhou, South China. Remote Sens. 2012, 4, 2033–2056. [Google Scholar] [CrossRef]
- Roberts, D. A.; Dennison, P. E.; Roth, K. L.; Dudley, K.; Hulley, G. Relationships between Dominant Plant Species, Fractional Cover and Land Surface Temperature in a Mediterranean Ecosystem. Remote Sens. Environ. 2015 (no volume provided).
- He, B. J.; Zhu, J.; Zhao, D. X.; Gou, Z. H.; Qi, J. D.; Wang, J. S. Co-Benefits Approach: Opportunities for Implementing Sponge City and Urban Heat Island Mitigation. Land Use Policy 2019, 86, 147–157. [Google Scholar] [CrossRef]
- Qiao, Z.; Liu, L.; Qin, Y.; Xu, X.; Wang, B.; Liu, Z. The Impact of Urban Renewal on Land Surface Temperature Changes: A Case Study in the Main City of Guangzhou, China. Remote Sens. 2020, 12(5), 794. [Google Scholar] [CrossRef]
- Esfandeh, S.; Danehkar, A.; Salmanmahiny, A.; Sadeghi, S. M. M.; Marcu, M. V. Climate Change Risk of Urban Growth and Land Use/Land Cover Conversion: An In-Depth Review of the Recent Research in Iran. Sustainability 2021, 14(1), 338. [Google Scholar] [CrossRef]
- United Nations. Available online: https://www.un.org/en/ (accessed on 17 December 2020).
- Abulibdeh, A.; Pirasteh, S.; Mafi-Gholami, D.; Kucukvar, M.; Onat, N. C.; Zaidan, E. Unveiling the Nexus Between Land Use, Land Surface Temperature, and Carbon Footprint: A Multi-Scale Analysis of Building Energy Consumption in Arid Urban Areas. Earth Syst. Environ. 2024, 1–39. [Google Scholar] [CrossRef]
- Ahmed, B.; Kamruzzaman, M. D.; Zhu, X.; Rahman, M. S.; Choi, K. Simulating Land Cover Changes and Their Impacts on Land Surface Temperature in Dhaka, Bangladesh. Remote Sens. 2013, 5(11), 5969–5998. [Google Scholar] [CrossRef]
- Zarin, T.; Esraz-Ul-Zannat, M. Assessing the Potential Impacts of LULC Change on Urban Air Quality in Dhaka City. Ecol. Indic. 2023, 154, 110746. [Google Scholar] [CrossRef]
- Biswas, S. K.; Begum, B. A.; Tarafdar, S. A.; Islam, A. Characterization of Air Pollution at Urban Sites at Dhaka and Rajshahi in Bangladesh. Atomic Energy Centre, Dhaka. Available online: http://s3.amazonaws.com/zanran_storage/www.rca.iaea.org/ContentPages/2482069, 518.
- Rahnuma, M.; Chowdhury, M. M. H.; Ferdousi, T. R.; Ahmed, A.; Ahmed, N. The Land Use and Land Cover Relation with Air Pollutants of Rajshahi City: A Remote Sensing Approach.
- Aakash, A. K. S.; Puja, S. N. Assessing the Impacts of Land Use and Land Cover Changes on Land Surface Temperature in Rapidly Urbanizing Environments: A Case Study of Rajshahi City, Bangladesh.
- Maharjan, M.; Aryal, A.; Man Shakya, B.; Talchabhadel, R.; Thapa, B. R.; Kumar, S. Evaluation of Urban Heat Island (UHI) Using Satellite Images in Densely Populated Cities of South Asia. Earth 2021, 2(1), 86–110. [Google Scholar] [CrossRef]
- Yang, Y.; Cao, C.; Pan, X.; Li, X.; Zhu, X. Downscaling Land Surface Temperature in an Arid Area by Using Multiple Remote Sensing Indices with Random Forest Regression. Remote Sens. 2017, 9(8), 789. [Google Scholar] [CrossRef]
- Souza Jr, C. M.; Shimbo, Z.; Rosa, M. R.; Parente, L. L.; Alencar, A.; Rudorff, B. F.; Hasenack, H.; Matsumoto, M.; Ferreira, L. G.; Souza-Filho, P. W.; Azevedo, T. Reconstructing Three Decades of Land Use and Land Cover Changes in Brazilian Biomes with Landsat Archive and Earth Engine. Remote Sens. 2020, 12(17), 2735. [Google Scholar] [CrossRef]
- Hossain, M. I.; Islam, J. Impact of Urbanization on Urban Heat Island Intensity in Mymensingh, Bangladesh: A Study Using Landsat-8 Images on Google Earth Engine.
- Rahman, M. M.; Islam, M. S.; Sarker, M. H. Towards Green and Climate-Resilient Urbanization in Rajshahi City: Urban Growth Meets Climate Action in Northern Bangladesh. Urban Climate 2023, 45, 101365. [Google Scholar]
- Bangladesh Bureau of Statistics (BBS). Population and Housing Census 2022 Report; Ministry of Planning, Government of Bangladesh. Retrieved from https://sid.portal.gov.bd, 2022.
- Islam, N.; Chowdhury, T.; Karim, A. Spatiotemporal Urban Expansion and Its Impact on Land Surface Temperature in Dhaka Metropolitan Area: A GIS-Based Assessment. Remote Sens. Lett. 2021, 12(3), 398–412. [Google Scholar]
- Ahmed, S.; Hasan, M. Urban Heat Island Effects and Land Surface Temperature Variation in Dhaka, Bangladesh: A Remote Sensing Analysis. Environ. Sci. Policy 2022, 128, 64–76. [Google Scholar]
- Hossain, M.; Rahman, A.; Alam, S. Land Use and Land Cover Changes in Rajshahi City: Impacts on Local Climate and Environment. J. Urban Stud. 2020, 18(4), 229–244. [Google Scholar]
- Rahman, S.; Alam, M.; Saha, B. Land Use Transformation and Urban Heat Island Effect in Rajshahi: A Case Study Using Landsat Data. Environ. Monit. Assess. 2021, 193, 472. [Google Scholar]
- Khatun, R.; Mahmud, M. Analyzing the Relationship between Urban Growth and Temperature Rise in Rajshahi Using Remote Sensing Techniques. J. Geospatial Sci. 2023, 30(2), 147–165. [Google Scholar]
- Sultana, T.; Hossain, J.; Chowdhury, F. Impact of Land Use Changes on Land Surface Temperature: A Comparative Study of Dhaka and Rajshahi Cities. Climate Res. 2022, 78(2), 210–225. [Google Scholar]
- Khan, M. S. A. Water Management in Dhaka. Water Resour. Dev. 2008, 24(3), 433–448. [Google Scholar]
- Khan, M. S. A.; Rahman, M. M.; Sarker, M. H. Estimating Impacts of Micro-Scale Land Use/Land Cover Change on Urban Heat Island Effect in Rajshahi, Bangladesh. Sci. Prog. 2022, 105(1), 1–15. [Google Scholar]
- Rahman, M.; Siddique, R. Administrative Divisions and Population Dynamics of Dhaka City Corporation. Bangladesh J. Popul. Stud. 2023, 45(1), 75–89. [Google Scholar]
- Chander, G.; Markham, B. L.; Helder, D. L. Summary of Current Radiometric Calibration Coefficients for Landsat MSS, TM, ETM+, and EO-1 ALI Sensors. Remote Sens. Environ. 2009, 113(5), 893–903. [Google Scholar] [CrossRef]
- Markham, B. L.; Barker, J. L. Landsat MSS and TM Post-Calibration Dynamic Ranges, Exoatmospheric Reflectances and At-Satellite Temperatures. Landsat Tech. Notes 1986, 1(3), 3–8. [Google Scholar]
- Rouse, J. W.; Haas, R. H.; Schell, J. A.; Deering, D. W. Monitoring Vegetation Systems in the Great Plains with ERTS. NASA Spec. Publ. 1974, 351, 309. [Google Scholar]
- Carlson, T. N.; Ripley, D. A. On the Relation between NDVI, Fractional Vegetation Cover, and Leaf Area Index. Remote Sens. Environ. 1997, 62(3), 241–252. [Google Scholar] [CrossRef]
- Sobrino, J. A.; Jiménez-Muñoz, J. C.; Paolini, L. Land Surface Temperature Retrieval from Landsat TM 5. Remote Sens. Environ. 2004, 90(4), 434–440. [Google Scholar] [CrossRef]
- Jiménez-Muñoz, J. C.; Sobrino, J. A. A Generalized Single-Channel Method for Retrieving Land Surface Temperature from Remote Sensing Data. J. Geophys. Res.: Atmospheres 2003, 108(D22), 4688. [Google Scholar] [CrossRef]
- Belgiu, M.; Drăguţ, L. Random Forest in Remote Sensing: A Review of Applications and Future Directions. ISPRS J. Photogramm. Remote Sens. 2016, 114, 24–31. [Google Scholar] [CrossRef]
- Congalton, R. G. A Review of Assessing the Accuracy of Classifications of Remotely Sensed Data. Remote Sens. Environ. 1991, 37(1), 35–46. [Google Scholar] [CrossRef]
- Gill, S. E.; Handley, J. F.; Ennos, A. R.; Pauleit, S. Adapting Cities for Climate Change: The Role of the Green Infrastructure. Built Environ. 2007, 33(1), 115–133. [Google Scholar] [CrossRef]
Disclaimer/Publisher’s Note: The statements, opinions and data contained in all publications are solely those of the individual author(s) and contributor(s) and not of MDPI and/or the editor(s). MDPI and/or the editor(s) disclaim responsibility for any injury to people or property resulting from any ideas, methods, instructions or products referred to in the content. |
© 2025 by the authors. Licensee MDPI, Basel, Switzerland. This article is an open access article distributed under the terms and conditions of the Creative Commons Attribution (CC BY) license (http://creativecommons.org/licenses/by/4.0/).
Copyright: This open access article is published under a Creative Commons CC BY 4.0 license, which permit the free download, distribution, and reuse, provided that the author and preprint are cited in any reuse.


