
Submitted:
30 September 2024
Posted:
02 October 2024
You are already at the latest version
Abstract
Urban public space comfort is vital for enhancing the quality of life and perceptions of livability, especially as climate change increasingly impacts outdoor thermal environments. This study investigates the use of ENVI-met, a 3D microclimate simulation tool, to assess thermal comfort concerning demographic factors like age and gender. While ENVI-met is often used to analyze urban microclimates, there is limited research on its application for simulating heat emission variations across different demographic groups. The findings highlight significant disparities in thermal stress vulnerability: elderly individuals are at higher risk due to elevated maximum PET values, while children experience broader ranges of thermal stress and higher baseline values. Despite cooling effects in the evening, children continue to face greater stress. The study emphasizes the need for tailored management strategies, as morning PET values are consistent but afternoon data reveals children’s ongoing vulnerability. Overall, the research calls for further investigation to enhance urban planning, thermal comfort strategies, and public health interventions amid rising temperatures. It advocates for expanding ENVI-met's capabilities to include diverse demographic factors, promoting a more comprehensive approach to urban resilience and well-being.
Keywords:
thermal stress
; heatwaves
; Mediterranean
; PET
; UTCI
; ENVI-met
; outdoor spaces
1. Introduction
Comfort in urban public spaces is a key indicator of the overall quality of life in cities and serves as a critical factor in assessing the effectiveness and appeal of public spaces [1,2]. High levels of comfort directly reflect the success of urban design, influencing how people engage with and experience their environment. Consequently, it plays a dominant role in the evaluation of public space quality, shaping perceptions of urban livability and community well-being [3]. Urban well-being and health are closely linked to outdoor activity, which provides significant social and economic benefits to cities [4,5]. To promote outdoor activities, public spaces should be attractively designed, with thermal comfort being a key factor in ensuring their usability[6]. The degree of comfort that people feel in public areas impacts their usage patterns and their perception of the quality of urban spaces [7,8]. Concerning climate change, a variety of biometeorology studies have explored how urban climates vary spatially, with a primary focus on thermal comfort. Recent years have seen a marked surge in interest within this research domain, as reflected by a substantial increase in related scholarly publications [9]. Thermal comfort is typically assessed through thermal indices, though not all of the 165 proposed indices are suitable for outdoor environments, as some overlook essential factors like solar radiation and wind speed [6].
In addition to environmental factors, human-related aspects such as activity levels and clothing insulation—which influences resistance to heat exchange—also contribute to thermal comfort. Together, these six factors are known as the "six basic parameters" that shape an individual's thermal environment [10,11]. Thermal sensation, or how a person feels in a particular thermal setting, is largely psychological and cannot be directly measured through physical or physiological terms alone [12]. A commonly used method for evaluating thermal environments is the application of thermal indices, although the term "thermal index" is rarely explicitly defined in academic literature [6,13,14,15,16]. The heat index and analogous metrics have been criticized for their restricted generalizability. These indices often depend on "ideal" conditions and overlook contextual variables, as well as disregarding the psychological and behavioral factors that influence individual comfort. Thermal stress, on the other hand, quantifies the effect of the six basic parameters on the human body by assessing the thermal strain experienced [9]. This process is also influenced by physiological factors such as gender, age, and acclimatization. Studies show however that especially age plays a significant role in thermal comfort variations [17,18].
Studies centered on age differences substantiate the notion that older adults are notably more vulnerable to heat-related stress. This is largely due to age-related declines in thermoregulatory capabilities, such as reduced sweat response and compromised vasodilation [19,20]. The research further highlights that older individuals correctly perceive their heightened risk of heat but often face barriers to adaptive action [21]. Children, contrastingly, showed no marked differences in subjective thermal perception compared to adults, even though their physiological susceptibility to extreme temperatures is acknowledged [22]. Overall, the data conforms to the consensus that age is a critical factor in determining thermal comfort and physiological resilience, especially under heatwave conditions [17].
The studies focusing on gender differences in thermal sensations and comfort generally found minimal significant differences between men and women. The variations observed in some contexts were attributed more to physiological responses rather than a distinct difference in perceived comfort [23]. Another important finding was that while older women showed slightly higher vulnerability to heat stress, direct thermal perception differences were not substantiated extensively [24]. Overall, the research challenges traditional assumptions about gender-based thermal comfort, indicating that perceived comfort is more closely aligned with individual and circumstantial factors than gender [19].
Outdoor thermal environments, in comparison to controlled indoor settings, show greater variability in environmental conditions [25]. Dynamic and non-uniform microclimatic conditions in public spaces can lead to an imbalance in the heat exchange between the human body and its environment [9,26]. The most common urban activities in outdoor spaces—such as standing and walking—are important considerations when assessing outdoor thermal comfort [27]. Additionally, clothing behavior varies with the seasons, depending on the climate zone of each city. Notably, even in hot climates, individuals maintain minimum clothing insulation of 0.2 clo (with 1.0 clo representing a short-sleeve shirt and shorts, according to de Freitas, 1987). Another important concept in evaluating outdoor thermal comfort is the "thermal history" of an individual [28]. For example, whether someone has recently exited an air-conditioned building significantly influences their thermal experience. However, gathering such information is difficult, and the computational simulations required for such analysis are often resource-intensive [6].
Among the tools used to assess thermal stress, the PET (Physiologically Equivalent Temperature) and UTCI (Universal Thermal Climate Index) are widely recognized [29,30]. Both measure the body’s strain responses to calculate the equivalent thermal effect in both reference and actual environments and are acknowledged as reliable indices for evaluating thermal comfort and discomfort in outdoor settings. For analyzing data related to thermal comfort in various spatial configurations, ENVI-met is an exceptionally valuable tool. It provides detailed insights into how different environmental factors influence comfort levels, making it highly effective for evaluating urban design and optimizing spaces for better microclimate performance [31,32,33]. A substantial body of literature employs ENVI-met to explore the effects of urban greenery on microclimatic conditions during Mediterranean heat waves. Studies like those by Magliocco and Perini and Salvalai et alutilize ENVI-met simulations to demonstrate how different configurations and densities of urban vegetation can reduce air temperatures and alleviate the urban heat island effect. These studies provide foundational insights into how strategic use of greenery, such as green roofs and facades, can effectively cool urban environments during heat waves, revealing significant temperature reductions and improvements in thermal comfort indices like the Universal Thermal Climate Index (UTCI) [34,35].
Furthermore, studies by Tousi et al. and Tseliou et al. delve into comparative analyses of varying greening scenarios, investigating how changes in vegetation type and albedo affect microclimatic conditions. These simulations show that increasing tree cover or integrating green facades can significantly lower air temperatures and enhance pedestrian thermal comfort [33,36].
The current body of literature reveals a notable gap in studies that specifically utilize ENVI-met to analyze how different demographic factors, such as gender and age, influence human heat emission through simulation, as opposed to on-site empirical measurements. While ENVI-met is widely recognized as a powerful 3D microclimate simulation tool, it is more commonly applied to assess urban environmental conditions. Researchers frequently use it to explore the impact of urban design elements, such as the presence of vegetation, the configuration of buildings, and materials used in urban settings, on the microclimate. These studies often focus on factors like heat islands, thermal comfort, and energy consumption in urban spaces, but the potential of ENVI-met to simulate human heat dissipation concerning demographic variations remains underexplored.
A study on the thermal comfort of the elderly in Sao Paulo uses ENVI-met but lacks a comprehensive approach covering a variety of demographic factors [37]. It is one of the few that begins to explore demographic differences. This indicates that while ENVI-met is widely used for evaluating thermal comfort improvements through urban interventions, existing literature does not sufficiently address how different demographic factors such as age and gender affect thermal comfort perceptions. This remains an underexplored area warranting further research, especially in regions beyond the Mediterranean Sea.
This lack of focused research underscores an opportunity for further investigation, particularly in urban health studies where understanding how various groups experience and cope with heat could improve city planning, thermal comfort strategies, and public health interventions. Furthermore, advancing the application of ENVI-met in this direction could help bridge the knowledge gap in how age and gender-specific physiological differences manifest in microclimate interactions. This would be particularly useful in the context of rising temperatures and the increasing focus on urban resilience in response to climate change.
2. Materials and Methods
The research is structured into three distinct phases, as outlined in Figure 1. The first phase involves pre-fieldwork analysis, which includes a comprehensive literature review with a particular emphasis on thermal stress analysis during heatwaves in the Mediterranean region. This review focuses specifically on studies examining gender and age differences in thermal comfort during such extreme weather events. The first phase concludes with the formulation of four key research questions.
RQ1:Are there any notable differences in PET and UTCI values between 35-year-old adult males and females during Mediterranean heatwaves in ENVI-met simulations?
RQ2: Are there any significant differences in PET and UTCI values during Mediterranean heatwaves between 35-year-old adult males and females, and 80-year-old elderly individuals in ENVI-met simulations?
RQ3:Are there any significant differences in PET and UTCI values during Mediterranean heatwaves between 35-year-old adult males and females, and 8-year-old children in ENVI-met simulations?
RQ4: Based on ENVI-met simulations, which demographic group—35-year-old males, 35-year-old females, 80-year-old elderly, or 8-year-old children—is the most vulnerable to heat stress during Mediterranean heat waves?
Stage 2 places a strong emphasis on data collection through fieldwork. Specifically, the authors have gathered key information pertinent to the analysis of urban geometry and the characteristics of both the built and natural environments within the study area. This includes data on flora species, construction materials, and the volumes and heights of buildings, culminating in the development of 2D and 3D models of the selected city blocks.
Stage 3 focuses on post-fieldwork analysis, during which ENVI-met simulations were conducted. The authors selected the hottest day in July 2023, specifically the 23rd of July, to examine thermal stress variations across different demographic groups. On that day, the maximum air temperature was recorded at 41.7°C at 3 p.m., while the minimum air temperature was documented as 30.9°C at 6 a.m. Relative humidity reached a maximum of 54% at 6 a.m. and dropped to a minimum of 23% at 3 p.m. The average wind speed was measured at 4.6 km/h (1.27 m/s), with a wind direction of 180°. The total simulation time spanned 48 hours. Mean radiant temperature and potential air temperature were evaluated for three specific times of the day: 10 a.m., 3 p.m., and 8 p.m. In ENVI-met simulations, Mean Radiant Temperature (MRT) represents the combined effect of all surrounding surface temperatures and radiation (both direct solar and reflected). It quantifies the heat exchange between an individual and the environment, offering a key measure of thermal exposure and human comfort in outdoor spaces. Additionally, the ENVI-met Bio-met tool was employed to assess heat stress levels among various demographic groups, including 35-year-old males (summer clothing, 0.5 clo, preferred speed of 1.34 m/s), 35-year-old females (same settings), an 80-year-old male (0.5 clo, preferred speed of 0.9 m/s), and an 8-year-old male child (summer clothing, 0.5 clo, preferred speed of 1.10 m/s). It is important to note that these demographic settings are based on Bio-met’s default parameters. The authors evaluated PET (Physiological Equivalent Temperature) and UTCI (Universal Thermal Climate Index) values for the three selected times of the day to address the four research questions outlined earlier. For the analysis of PET and UTCI results the Mediterranean scale has been employed as in similar studies in the Mediterranean Region (Table 1)[38].
The spatial analysis of the study area, encompassing three city blocks, is illustrated in Figure 2. This area, located in the Greater Athens Region, is a post-refugee urban settlement designed according to the principles of the Hippodamian grid during the interwar period. Characterized by high building and population density, it is home to vulnerable households [33]. The layout includes a communal open space in the interior of each block, with a mixture of typical blocks of flats and refugee housing organized along the perimeter.
3. Results
3.1. Potential Air Temperature in the Area of Study at 10am, 3pm and 8pm
As shown in Figure 3, the potential air temperature in the study area at 10 a.m. ranges from 28.9°C to 40.5°C. The highest temperatures were observed on the eastern sides of the blocks, while cooler areas were identified on the western sides and in the center of each block. However, hot air tends to flow through the alleyways, with wider alleyways leading to larger hot zones in the middle of the blocks.
At 3 p.m., air temperatures in the study area range from 36.87°C to 48.89°C (Figure 4). Hotter zones are concentrated on the western sides of each block, with the highest temperature recorded in the center of the middle block (Figure 4). The large building volumes create cooler sheltered areas in the center of the first block; however, air temperatures in these areas remain elevated, around 42°C (Figure 4).
At 8 p.m., air temperatures range from 34.23°C to 39.60°C. Hot linear zones have been observed along roads and alleyways, while cooler islets are found in the center of each block (Figure 5). The size of these cooler areas varies depending on the shadows cast by nearby buildings and the presence of trees, influenced by factors such as foliage shape, tree type, and height.
3.2. Mean Radiant Temperature in the Area of Study at 10 am, 3 pm, and 8 pm
At 10 a.m., the mean radiant temperature in the study area ranges from 25.19°C to 83.26°C, with the coolest areas located in shaded zones near buildings on the northwestern side of each block. Central areas of the blocks exhibit lower mean radiant temperatures where tree cover is dense, while areas without trees experience higher mean radiant temperatures (Figure 6). Tree cover significantly reduces mean radiant temperature by offering protection from direct sunlight.
At 3 p.m., the mean radiant temperature in the study area ranges from 32.42°C to 87.71°C (Figure 7). Cooler areas are located along the eastern sides of each block and in the central regions where dense tree cover is present.
At 8 p.m., the study area exhibits a projected decline in mean radiant temperature, ranging from 31.09°C to 42.46°C. Cooler zones are predominantly observed along the perimeters of buildings along the outer side of each block, while higher temperatures are concentrated between structures, suggesting the retention of heat in the central areas of the blocks and alleyways, as depicted in Figure 8.
3.3. PET Analysis of Different Demographics
3.3.1. PET Analysis at 10 a.m.
As shown in Figure 9, PET values at 10 a.m. on the hottest day of the heatwave range from 30.54°C (Slight heat stress) to 60.69°C (Extreme heat stress) for 35-year-old males, with the prevailing PET estimations throughout the study area to range from 51.0°C to 55.1°C. Comparable values, ranging from 30.51°C (Slight heat stress) to 61.26°C (Extreme heat stress), are observed for females of the same age, as illustrated in Figure 10. In the case of females, however, the prevailing PET values throughout the examined area, are slightly higher than that of males varying from 55.4°C to 57.5 °C.
On the hottest day of the heatwave, an 80-year-old male wearing summer clothing (0.50 clo) and walking at a preferred speed of 0.90 m/s experiences PET values ranging from 30.85°C (Slight heat stress) to 61.71°C (Extreme heat stress) at 10 a.m (Figure 11), with the prevailing PET estimations to range between 53.8 °C and 57.9 °C (Extreme heat stress). In contrast, an 8-year-old male child, also in summer clothing (0.50 clo) but with a preferred walking speed of 1.10 m/s, faces PET values ranging from 32.98°C (Moderate heat stress) to 58.63°C (Extreme heat stress) with the prevailing PET estimations to range between 53.8 °C and 57.9 °C, at the same time (Figure 12). When comparing the four demographic groups on the hottest day of July 2023 at 10 a.m., children exhibit a minimum PET value approximately 2°C higher than the other three groups. However, the same demographic also experiences a maximum PET value that is about 2.6°C lower than the other groups. The prevailing PET estimations throughout the examined area, however, indicate that both the children and the elderly population may experience similar extreme heat stress conditions. This contrast highlights both elevated baseline thermal stress and a more moderate peak PET for children. It is important to note that, although, there are no striking differences among males and females of the same age, the prevailing PET values thoughout the study area are, approximately, 2 oC higher than those of males . The PET analysis across the four selected demographic groups, during morning hours (10 a.m.) reveals only minor variations in values, with the spatial distribution of heat exhibiting similar patterns across all examined categories. This suggests consistent thermal stress distribution regardless of demographic differences.Cooler enclaves of moderate heat stress (less than 35oC) are found along buildings of the western side of the blocks and under dense tree covered areas of the central open space.In all other areas of the block, the PET values indicate a range from strong heat stress to extreme heat stress for all demographic groups, according to the Mediterranean scale for PET.
3.3.2. PET Analysis at 3 p.m.
The analysis of PET values during the afternoon hours, specifically at 3 p.m., reveals distinct differences across the four demographic groups. For 35-year-old males, PET values range from 37.84°C (Moderate heat stress) to 61.58°C (Extreme heat stress) (Figure 13). This range is slightly narrower compared to their female counterparts, who experience PET values between 37.80°C (Moderate heat stress) and 61.98°C (Extreme heat stress) (Figure 14). Similarly, the prevailing PET estimations throughout the study area are slightly higher in females (56.0oC to 58.2 oC) compared to males (55.8 oC to 57.9 oC), but narrowed compared to those obtained at 10 a.m. This indicates that as the PET values increase, the heat stress variations between the two genders decrease. . Eventhough, both genders are subjected to comparable levels of thermal stress, females tend to experience marginally higher stress in the upper range.In contrast, elderly individuals aged 80 years exhibit a broader range of PET values, from 38.14°C to 62.39°C (Figure 15), while the prevailing PET values are above 56.9 oC. This broader range suggests that older adults encounter a wider spectrum of thermal stress, with both the prevailing and the upper limits of their PET values extending beyond those of the 35-year-olds, reflecting a higher susceptibility to extreme heat.Children aged 8 years show a distinct pattern, with PET values ranging from 40.20°C to 59.34°C, with the prevailing PET estimations to range between 54.2 oC and 55.7 oC (Figure 16). The minimum PET values for children are notably higher than those for adults, indicating a greater baseline of thermal stress. However, their prevailing and maximum PET values are lower than those observed in the other examined categories but remain significant, highlighting considerable heat exposure for this age group. In summary, while all demographic groups face substantial thermal stress, the extent and variability of this stress differ by age. The elderly are most vulnerable to extreme heat, as evidenced by their higher maximum PET values, while children experience a higher baseline of thermal stress compared to adults.It is important to emphasize that the spatial distribution of PET values exhibits consistent patterns across the four demographic groups (see Figures 13, 14, 15, and 16). Specifically, cooler zones are observed along building peripheries where shadows are cast, as well as beneath dense tree canopy in the central areas of the block.
3.3.3. PET Analysis at 8 p.m.
The PET values obtained during the evening hours, as depicted in Figure 17, Figure 18, Figure 19 and Figure 20, reveal significant differences among the four demographic groups, in the context of the Mediterranean PET scale. The data indicate a general reduction in PET values with the onset of evening, aligning with the expected cooling effect. For 35-year-old males and females, PET values range from 36.06°C to 45.52°C and from 36.01°C to 45.45°C for males and females, respectively. According to the Mediterranean PET scale, these values correspond to moderate to extreme heat stress. Elderly males, aged 80, present PET values from 36.35°C to 45.79°C. This range reflects moderate to extreme heat stress, slightly higher than that observed in 35-year-old males and females. The prevailing PET values throughout the study area are similar for males, females, and the elderly population and vary from, approximately, 40°C to 42°C. Children, aged 8 years, have PET values ranging from 38.47°C to 54.12°C. Their values, while indicating moderate to extreme heat stress, show a higher minimum and a quite higher maximum value compared to the elderly, whereas the prevailing PET estimations range between 42.0 and 44°C. This suggests that children face notable thermal stress, with both their baseline and peak exposure higher than that of the elderly. In summary, the evening PET values reveal a varied experience of thermal stress across the demographic groups according to the Mediterranean PET scale. Children exhibit broader ranges of PET values, indicating higher variability in thermal stress, showing higher minimum values, and experiencing significant stress. In contrast, elderly individuals and 35-year-old males and females experience more moderate and consistent thermal stress levels. Overall, while the cooling effect of the evening reduces thermal stress for all groups, children are exposed to more pronounced stress compared to elderly individuals males and females.
3.4. UTCI Analysis of Different Demographics
3.4.1. UTCI Analysis at 10 a.m.
The Universal Thermal Climate Index (UTCI) is an essential tool for assessing thermal comfort and stress in various environmental conditions. This analysis uses the UTCI Mediterranean scale as a reference point to understand how these values affect different groups. At 10 a.m., the UTCI values for four distinct demographic groups—35-year-old males, 35-year-old females, 80-year-old males, and 8-year-old children—range between 28.94°C (No thermal stress) and 51.36°C (extreme heat stress) (Figure 21), whereas the prevailing UTCI estimations range between 43°C and 47°C (Extreme heat stress).For 35-year-old males and females, the UTCI values span from 28.94°C to 51.36°C. This age group generally manages moderate to high heat stress better than older adults or children due to greater physiological resilience and robustness. Nonetheless, UTCI values above 34°C indicate significant heat stress, which may necessitate adaptation measures to prevent discomfort or health issues. In contrast, for 80-year-old males, the UTCI values also range from 28.94°C to 51.36°C. However, older adults are more vulnerable to heat stress because of decreased physiological resilience and potential underlying health conditions. Although the range is the same as for younger groups, the impact of values exceeding 34°C is more pronounced for older adults, making it crucial to implement more immediate and effective heat stress management strategies. Similarly, for 8-year-old children, the UTCI values fall between 28.94°C and 51.36°C. Children are particularly susceptible to heat stress due to their smaller body size and higher surface-area-to-volume ratio. This means that the same UTCI range poses a significant risk of thermal discomfort and stress for children, especially at the higher end of the scale. Thus, protective measures for this group should be especially stringent to ensure their safety and comfort. While the UTCI values for all four demographic groups fall within the same range, the implications of these values vary significantly. For 35-year-olds, high UTCI values may result in less severe effects compared to older adults and children. Older adults face increased risks of heat stress, while children are highly sensitive to high UTCI values. Understanding these differences is essential for developing age-appropriate strategies to manage heat stress and ensure thermal comfort across diverse demographic groups. By considering these variations alongside the UTCI Mediterranean scale, we can better address the specific needs of each group and improve overall thermal comfort and health outcomes.
3.4.2. UTCI Analysis at 3 p.m.
On July 23, 2023, at 3 p.m., the Universal Thermal Climate Index (UTCI) values for four demographic groups—35-year-old males, 35-year-old females, 80-year-old individuals, and 8-year-old children—ranged from 35.60°C (Moderate heat stress) to 57.21°C (Extreme heat stress), as shown in Figure 22. Given this, UTCI values range from moderate heat stress to extreme heat stress. For 35-year-old males and females, the UTCI values ranging from 35.60°C to 57.21°C suggest exposure to extreme heat stress. While this age group typically exhibits a higher level of physiological resilience compared to older adults and children, such elevated UTCI values still pose significant challenges. The extreme conditions likely result in considerable discomfort and require substantial adaptive measures to manage heat stress effectively. In contrast, the same range of UTCI values—35.60°C to 57.21°C—presents a more pronounced risk for 80-year-old individuals. Older adults are generally more susceptible to the adverse effects of extreme heat due to diminished physiological resilience and the potential presence of underlying health conditions. Consequently, the extreme heat stress indicated by these UTCI values could lead to severe health consequences, necessitating immediate and comprehensive interventions to mitigate risks associated with high temperatures. For 8-year-old children, the UTCI values ranging from 35.60°C to 57.21°C also signify exposure to extreme thermal stress. Children, due to their higher surface-area-to-volume ratio and limited physiological capacity to regulate body temperature, are particularly vulnerable to the effects of high temperatures. The extreme conditions experienced by this demographic group at the upper end of the UTCI range necessitate urgent protective measures to ensure their health and well-being. In conclusion, the UTCI values recorded on July 23, 2023, at 3 p.m., highlight a period of extreme heat stress for all evaluated demographic groups. Although 35-year-olds may experience significant discomfort, the severity of the impact is markedly greater for older adults and children. This analysis underscores the necessity for tailored heat stress management strategies that address the specific vulnerabilities of each age group, ensuring adequate protection and mitigating health risks associated with extreme heat.
3.4.3. UTCI Analyis at 8 p.m.
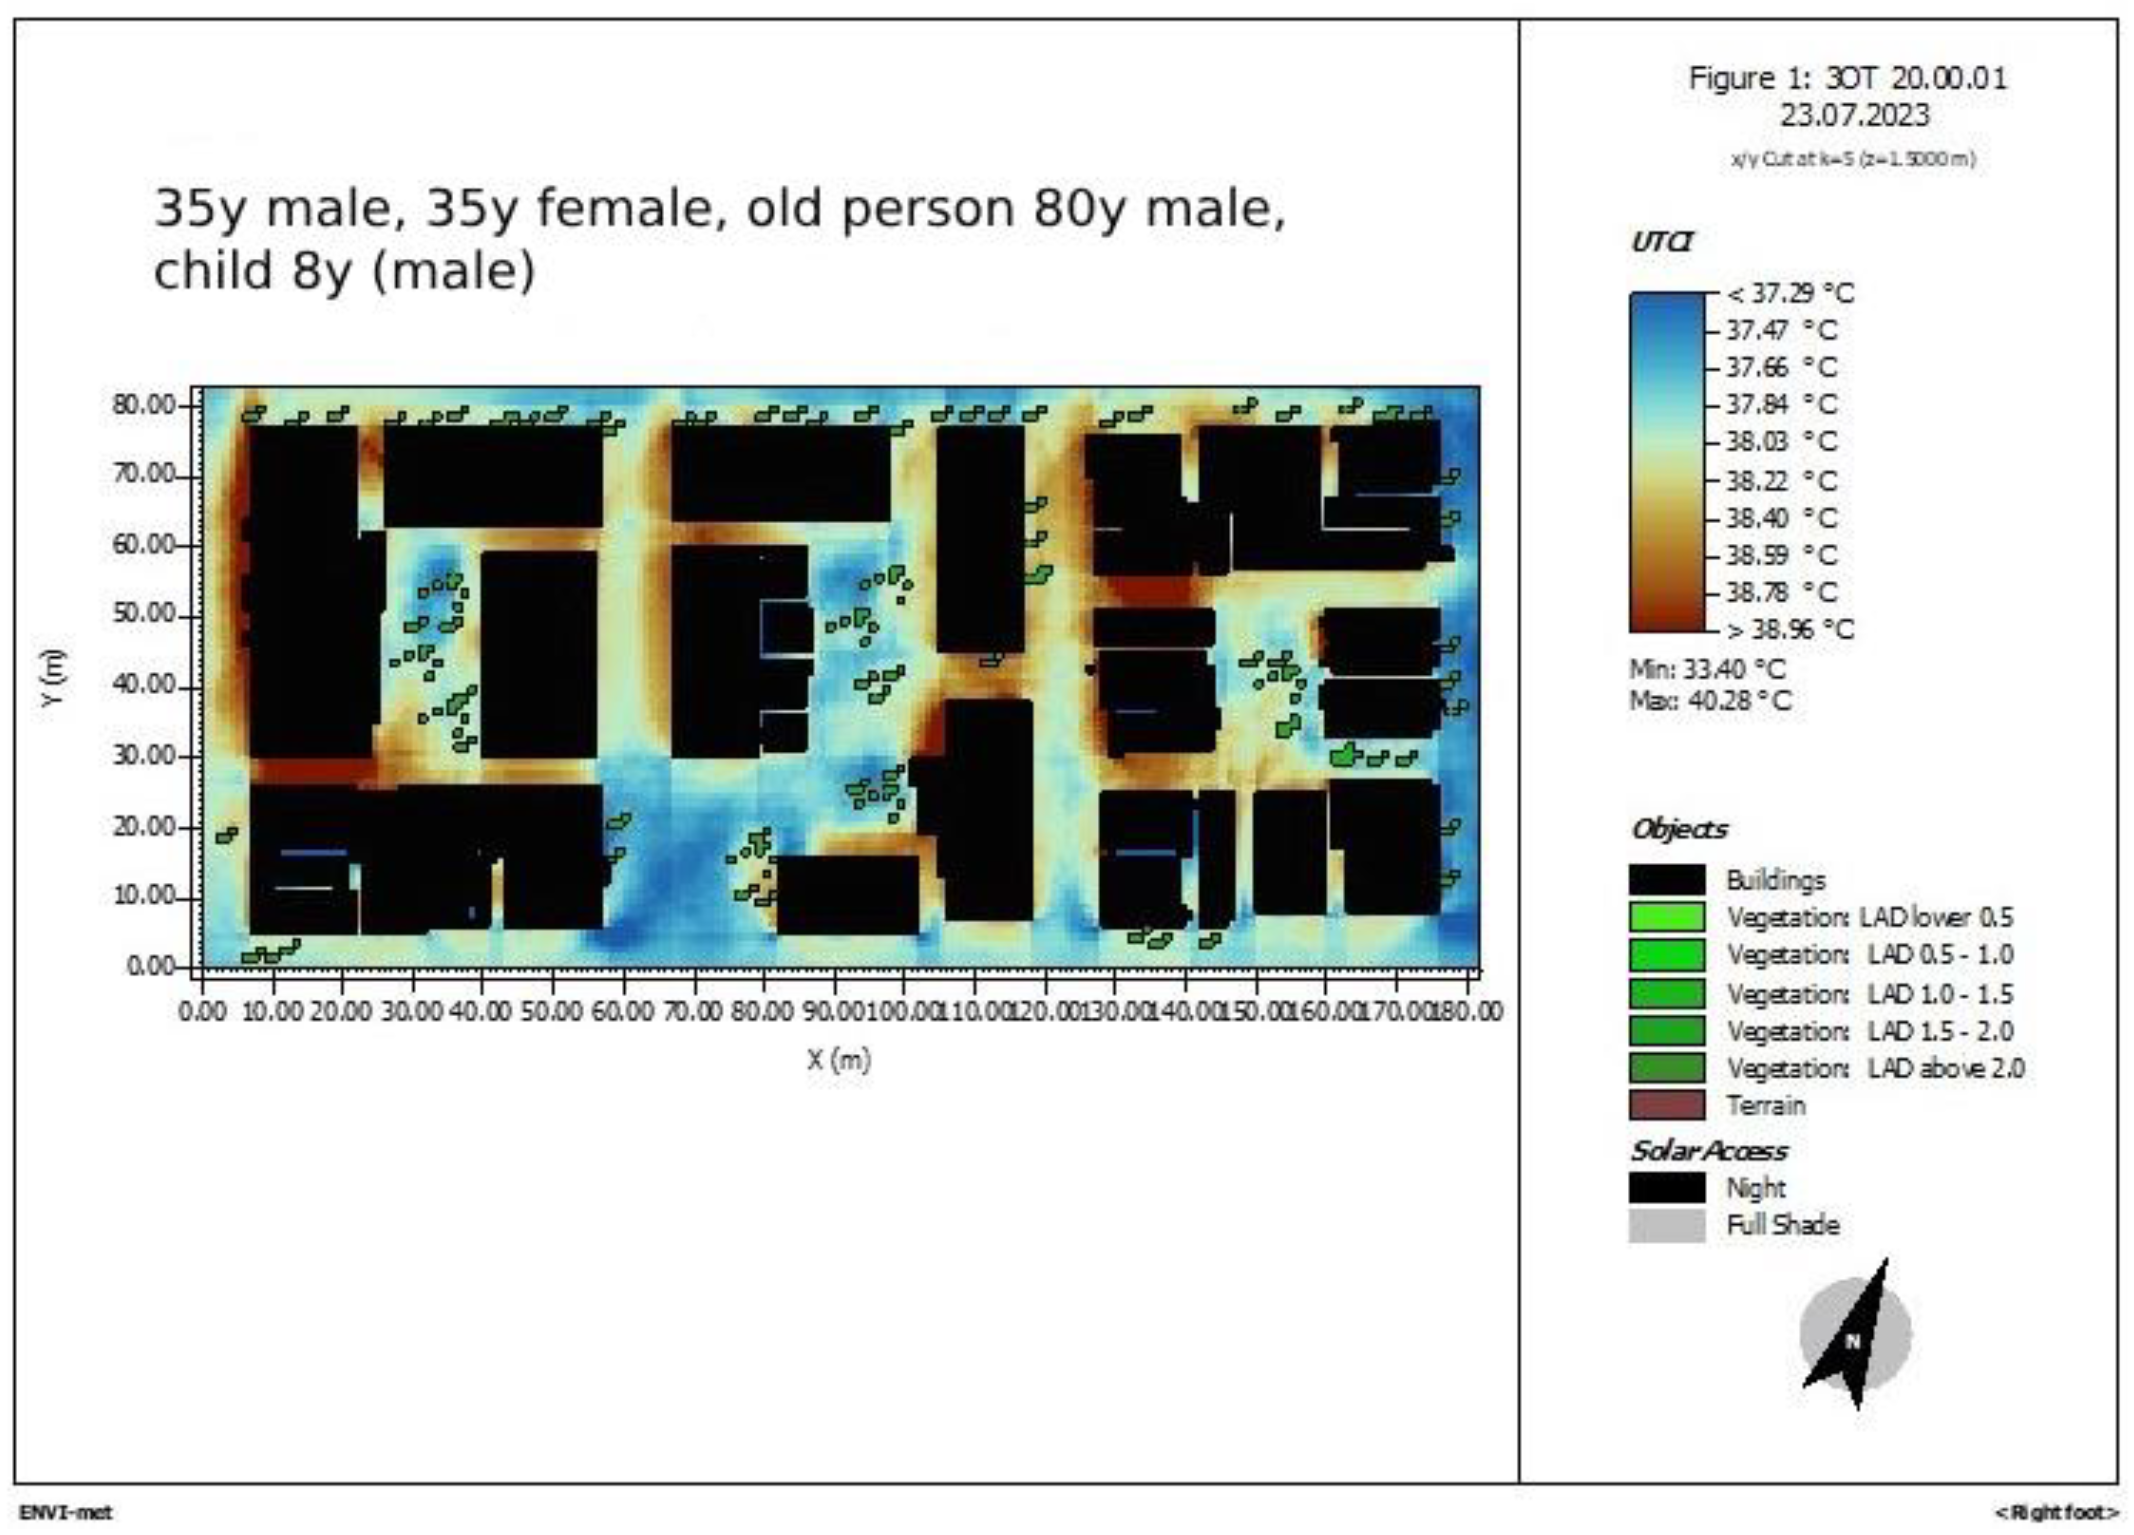
On July 23, 2023, the hottest day of the month, UTCI values in the study area ranged from 33.40°C (No thermal stress) to 40.28°C (Extreme heat stress) for 35-year-old males, 35-year-old females, 80-year-old individuals, and 8-year-old children (Figure 23). For 35-year-olds, the UTCI range of 33.40°C to 40.28°C indicates significant thermal stress. Although this age group generally has better physiological resilience, the extreme temperatures on this day likely resulted in considerable discomfort and necessitated effective heat management strategies. For 80-year-old individuals, these UTCI values pose a critical risk due to their reduced physiological adaptability and potential health conditions. Similarly, 8-year-old children, with their less effective thermoregulation, are particularly vulnerable. The extreme heat conditions present a significant risk, necessitating stringent protective measures. In summary, the UTCI values on July 23, 2023, even during evening hours at 8 p.m., indicate a period of very high to extreme heat stress for all demographic groups.
4. Discussion
Based on research findings, the elderly population is more vulnerable to heat waves compared to the younger population. This finding aligns with previous research, which has shown that the elderly population is especially vulnerable to high temperatures, particularly during heat waves. [39,40,41]. It is important to note though that children experience significant thermal stress, with both their baseline and peak exposure levels exceeding those of elderly individuals. Children display a wider range of PET values, reflecting greater variability in their thermal stress levels, characterized by higher minimum values and substantial stress. In contrast, elderly individuals, as well as 35-year-old males and females, experience more moderate and stable levels of thermal stress. Overall, while the cooling effect of the evening mitigates thermal stress for all groups, children remain subject to more pronounced stress compared to elderly individuals, males, and females. To be more specific, the PET analysis across the four selected demographic groups at 10 a.m. demonstrates only slight variations in thermal values, with the spatial distribution of heat exhibiting comparable patterns across all examined categories. This suggests a uniform distribution of thermal stress during morning hours, irrespective of demographic distinctions. PET analysis at 3 p.m. however, shows that minimum PET values for children are significantly higher than those for adults, indicating a heightened baseline level of thermal stress. Their mean and maximum PET values are lower than those observed in other demographic groups, although still considerable, underscoring notable heat exposure in this age group. In summary, while all demographic groups experience substantial thermal stress, its magnitude and variability differ according to age. The elderly are particularly vulnerable to extreme heat, as reflected by their higher maximum PET values, whereas children face a greater baseline thermal stress in comparison to adults. The evening PET values demonstrate varying levels of thermal stress across different demographic groups, as measured by the Mediterranean PET scale. Children exhibit a wider range of PET values, indicating greater variability in thermal stress, with higher minimum values and significant levels of exposure. In contrast, elderly individuals, along with 35-year-old males and females, experience more moderate and consistent thermal stress levels. Overall, although the cooling effect of the evening mitigates thermal stress for all groups, children are subject to more pronounced stress compared to elderly individuals, males, and females.
In addition, research findings showed that females are more vulnerable to heat compared to males. This finding is consistent with numerous studies showing that women are at a higher risk of thermal stress and heat-related mortality. However, a smaller body of research suggests that men may be more vulnerable than women in some cases [41,42,43,44,45]. It is important to mention that, while the UTCI values for all four demographic groups fall within a similar range (morning, afternoon, and evening hours), the implications of these values vary significantly. For 35-year-olds, elevated UTCI values tend to result in less severe effects compared to older adults and children. Older adults are at greater risk of heat stress, whereas children exhibit heightened sensitivity to high UTCI values. Recognizing these differences is critical for the development of age-specific strategies aimed at managing heat stress and ensuring thermal comfort across various demographic groups. By considering these variations alongside the UTCI Mediterranean scale, more effective measures can be implemented to address the distinct needs of each group, ultimately improving overall thermal comfort and health outcomes.
5. Conclusions
The analysis of thermal stress across demographic groups highlights significant differences in vulnerability to heat exposure. Consistent with existing literature, elderly individuals exhibit heightened susceptibility to heat waves and extreme temperatures, reflected in their higher maximum PET values. However, children experience broader and more variable ranges of thermal stress, with significantly higher baseline PET values compared to the elderly, indicating substantial continuous exposure to heat stress. Although the cooling effects in the evening reduce thermal stress for all groups, children remain more exposed to pronounced stress than elderly individuals and adults. The demographic analysis of PET and UTCI values reveals the need for differentiated management strategies. Morning PET values are relatively uniform, but afternoon data shows children facing higher minimum PET values, highlighting their persistent vulnerability. In summary, while all demographic groups are affected by heat stress, the extent varies by age and gender. The elderly are at greater risk of extreme conditions, children face higher baseline stress, and females show increased vulnerability. These findings emphasize the importance of developing targeted, age- and gender-specific strategies to manage heat stress effectively. By addressing the unique needs of each group alongside tools like the UTCI Mediterranean scale, overall thermal comfort and health outcomes can be improved, especially as climate change leads to more frequent and intense heat waves.
Author Contributions
Conceptualization, E.T.. .; methodology, E.T.; software, E.T. and A.T..; validation, A.T.., E.T. and A.M.. .; formal analysis, E.T., A.T., A.M..; investigation, E.T..; resources, E.T., A.M., A.T..; data curation E.T., A.T..; writing—original draft preparation, E.T..; writing—review and editing, A.M. and A.T.; visualization, E.T..; supervision, A.T.; project administration, A.M..; All authors have read and agreed to the published version of the manuscript.
Funding
This research received no external funding.
Acknowledgments
Special thanks to Prof. Chloupis, Department of Survey Engineering, University of West Attica for providing the ENVI-met software licence so as to be used for the purposes of this research.
Conflicts of Interest
The authors declare no conflict of interest.
References
- Vukmirovic, M.; Gavrilovic, S.; Stojanovic, D. The improvement of the comfort of public spaces as a local initiative in coping with climate change. Sustain 2019, 11, 1–20. [Google Scholar] [CrossRef]
- Mela, A.; Vryzidis, I.; Varelidis, G.; Tsotsolas, N. Urban Space Quality Evaluation Using Multi-Criteria Decision Analysis-Based Framework. Mult Criteria Decis Mak 2023; Part F1272:59–84. [CrossRef]
- Bao, Y.; Gao, M.; Luo, D.; Zhou, X. Urban Parks—A Catalyst for Activities! The Effect of the Perceived Characteristics of the Urban Park Environment on Children’s Physical Activity Levels. Forests 2023, 14, 1–14. [Google Scholar] [CrossRef]
- Anderson, J.; Ruggeri, K.; Steemers, K.; Huppert, F. Lively Social Space, Well-Being Activity, and Urban Design: Findings From a Low-Cost Community-Led Public Space Intervention. Environ Behav 2017, 49, 685–716. [Google Scholar] [CrossRef]
- Jackson, L.E. The relationship of urban design to human health and condition. Landsc Urban Plan 2003, 64, 191–200. [Google Scholar] [CrossRef]
- Fischereit, J.; Schlünzen, K.H. Evaluation of thermal indices for their applicability in obstacle-resolving meteorology models. Int J Biometeorol 2018, 62, 1887–1900. [Google Scholar] [CrossRef]
- Bartesaghi Koc, C.; Osmond, P.; Peters, A. Evaluating the cooling effects of green infrastructure: A systematic review of methods, indicators and data sources. Sol Energy 2018, 166, 486–508. [Google Scholar] [CrossRef]
- Mela, A.; Varelidis, G. Effects of the COVID-19 Pandemic on the Use and Attitudes Towards Urban Public Spaces. J Sustain Archit Civ Eng 2022, 31, 85–95. [Google Scholar] [CrossRef]
- Peng, Y.; Feng, T.; Timmermans, H.J.P. Expanded comfort assessment in outdoor urban public spaces using Box-Cox transformation. Landsc Urban Plan 2019, 190, 103594. [Google Scholar] [CrossRef]
- Shooshtarian, S.; Ridley, I. The effect of individual and social environments on the users thermal perceptions of educational urban precincts. Sustain Cities Soc 2016, 26, 119–133. [Google Scholar] [CrossRef]
- Ma, X.; Tian, Y.; Du, M.; Hong, B.; Lin, B. How to design comfortable open spaces for the elderly? Implications of their thermal perceptions in an urban park. Sci Total Environ 2021, 768, 144985. [Google Scholar] [CrossRef]
- De Castro Fontes, M.S.G.; Aljawabra, F.; Nikolopoulou, M. Open urban spaces quality: A study in a historical square in Bath - UK. PLEA, 2008; - Towar Zero Energy Build 25th PLEA Int Conf Passiv Low Energy Archit Conf Proc 2008. [Google Scholar]
- Wang, X.; Meng, Q.; Zhang, L.; Hu, D. Evaluation of urban green space in terms of thermal environmental benefits using geographical detector analysis. Int J Appl Earth Obs Geoinf 2021, 105, 102610. [Google Scholar] [CrossRef]
- Ruiz, M.A.; Correa, E.N. Adaptive model for outdoor thermal comfort assessment in an Oasis city of arid climate. Build Environ 2015, 85, 40–51. [Google Scholar] [CrossRef]
- Tseliou, A.; Melas, E.; Mela, A.; Tsiros, I.; Zervas, E. The Effect of Green Roofs and Green Façades in the Pedestrian Thermal Comfort of a Mediterranean Urban Residential Area. Atmosphere (Basel) 2023, 14, 1–24. [Google Scholar] [CrossRef]
- Tousi, E.; Mela, A.; Tseliou, A.; Theofili, E.; Varelidis, G. Elements of urban design to ameliorate urban heat island. The Case of. Int. Conf. Chang. Cities VI Spat. Des. Landscape, Herit. Socio-economic Dimens., 2024, p. 5765.
- Stapleton, J.M.; Larose, J.; Simpson, C.; Flouris, A.D.; Sigal, R.J.; Kenny, G.P. Do older adults experience greater thermal strain during heat waves? Appl Physiol Nutr Metab 2014, 39, 292–298. [Google Scholar] [CrossRef]
- Bills, R. Cold comfort: thermal sensation in people over 65 and the consequences for an ageing population. 9th Int. Wind. Conf. 2016 Mak. Comf. Relev., 2018, p. 156–67.
- Atkins, W.C.; McKenna, Z.J.; Jarrard, C.P.; Foster, J.; Crandall, C.G. Thermoregulatory Responses to Very Hot and Dry Heat Exposure: Interactions Between Age and Sex. Physiology 2024. [CrossRef]
- McKenna ZJ, Foster J, Atkins WC, Belval LN, Watso JC, Jarrard CP, et al. Age alters the thermoregulatory responses to extreme heat exposure with accompanying activities of daily living. J Appl Physiol 2023, 135, 445–455. [Google Scholar] [CrossRef]
- Eady, A.; Dreyer, B.; Hey, B.; Riemer, M.; Wilson, A. Reducing the risks of extreme heat for seniors: Communicating risks and building resilience. Heal Promot Chronic Dis Prev Canada 2020, 40, 215–224. [Google Scholar] [CrossRef]
- Ravanelli N, Morris N, Morrison SA. 24-H Movement Behaviour, Thermal Perception, Thirst, and Heat Management Strategies of Children and Adults During Heat Alerts: a Pilot Study. Front Physiol 2023, 14, 1–9. [Google Scholar] [CrossRef]
- Kwak, J.; Chun, C.; Park, J.S.; Kim, S.; Seo, S. The gender and age differences in the passengers’ thermal comfort during cooling and heating conditions in vehicles. PLoS One 2023, 18, 1–23. [Google Scholar] [CrossRef]
- Leach, O.K.; Cottle, R.M.; Fisher, K.G.; Wolf, S.T.; Kenney, W.L. Sex differences in heat stress vulnerability among middle-aged and older adults (PSU HEAT project). Am J Physiol Integr Comp Physiol 2024. [CrossRef]
- Aghamolaei, R.; Azizi, M.M.; Aminzadeh, B.; O’Donnell, J. A comprehensive review of outdoor thermal comfort in urban areas: Effective parameters and approaches. Energy Environ 2023, 34, 2204–2227. [Google Scholar] [CrossRef]
- Matzarakis, A.; Nastos, P. Heat Waves in Athens. 8th Conf Meteorol Phys 2006:153–60.
- Kántor, N.; Lin, T.P.; Matzarakis, A. Daytime relapse of the mean radiant temperature based on the six-directional method under unobstructed solar radiation. Int J Biometeorol 2014, 58, 1615–1625. [Google Scholar] [CrossRef] [PubMed]
- Rupp, R.F.; Kim, J.; de Dear, R.; Ghisi, E. Associations of occupant demographics, thermal history and obesity variables with their thermal comfort in air-conditioned and mixed-mode ventilation office buildings. Build Environ 2018, 135, 1–9. [Google Scholar] [CrossRef]
- Tseliou, A.; Melas, E.; Mela, A.; Tsiros, I. Environmental Impact of Urban Design Elements in a Mediterranean City. Environ Sci Proc 2023;16. [CrossRef]
- Koletsis I, Tseliou A, Lykoudis S, Tsiros I, Lagouvardos K, Psiloglou B, et al. Validation of ENVI-met microscale model with in-situ measurements in warm thermal conditions across Athens area. Proc 17th Int Conf Environ Sci Technol 2022, 17, 1–4. [CrossRef]
- Mohajer, H.R.H.; Ding, L.; Santamouris, M. Developing Heat Mitigation Strategies in the Urban Environment of Sydney, Australia. Buildings 2022;12. [CrossRef]
- Skoufali, I.; Battisti, A. Microclimate of Urban Canopy Layer and Outdoor Thermal Comfort: A Case Study in Pavlou Mela, Thessaloniki. Urban Sci 2019;3. [CrossRef]
- Tousi, E.; Tseliou, A.; Mela, A.; Sinou, M.; Kanetaki, Z. Exploring Thermal Discomfort during Mediterranean Heatwaves through Softscape and Hardscape ENVI-Met Simulation Scenarios. Sustainability 2024;16. [CrossRef]
- Magliocco, A. La vegetazione in ambiente urbano : comfort e riduzione del fenomeno isola di calore 2014, 155–162.
- Salvalai, G.; Blanco Cadena, J.D.; Quagliarini, E. Greenery as a mitigation strategy to urban heat and air pollution: a comparative simulation-based study in a densely built environment. Riv Tema 2023;09. [CrossRef]
- Tseliou, A.; Melas, E.; Mela, A.; Tsiros, I. Evaluating the effects of green roofs and green façade as an urban heat island adaptation strategy. ICED2023, vol. 0 1018, 2023, p. 0–4. [Google Scholar] [CrossRef]
- Dardin, Alessandro Monteiro, L. Impact of extreme weather events on the thermal comfort of vulnerable populations in the city of Sao Paulo Conf. Comf. Extrem. 2023, 2023. [CrossRef]
- Tseliou, A.; Tsiros, I.X. Modeling urban microclimate to ameliorate thermal sensation conditions in outdoor areas in Athens (Greece). Build Simul 2016, 9, 251–267. [Google Scholar] [CrossRef]
- Wichmann, J. Heat effects of ambient apparent temperature on all-cause mortality in Cape Town, Durban and Johannesburg, South Africa: 2006–2010. Sci Total Environ 2017;587–588:266–72. [CrossRef]
- Wang D, Lau KKL, Ren C, Goggins WB, Shi Y, Ho HC, et al. The impact of extremely hot weather events on all-cause mortality in a highly urbanized and densely populated subtropical city: A 10-year time-series study (2006–2015). Sci Total Environ 2019, 690, 923–931. [Google Scholar] [CrossRef]
- Yatim ANM, Latif MT, Sofwan NM, Ahamad F, Khan MF, Mahiyuddin WRW, et al. The association between temperature and cause-specific mortality in the Klang Valley, Malaysia. Environ Sci Pollut Res 2021, 28, 60209–60220. [Google Scholar] [CrossRef]
- Wan, K.; Feng, Z.; Hajat, S.; Doherty, R.M. Temperature-related mortality and associated vulnerabilities: evidence from Scotland using extended time-series datasets. Environ Heal A Glob Access Sci Source 2022, 21, 1–15. [Google Scholar] [CrossRef]
- Saucy A, Ragettli MS, Vienneau D, de Hoogh K, Tangermann L, Schäffer B, et al. The role of extreme temperature in cause-specific acute cardiovascular mortality in Switzerland: A case-crossover study. Sci Total Environ 2021, 790, 147958. [Google Scholar] [CrossRef] [PubMed]
- Ingole, V.; Sheridan, S.C.; Juvekar, S.; Achebak, H.; Moraga, P. Mortality risk attributable to high and low ambient temperature in Pune city, India: A time series analysis from 2004 to 2012. Environ Res 2022, 204, 112304. [Google Scholar] [CrossRef] [PubMed]
- Alahmad B, Shakarchi AF, Khraishah H, Alseaidan M, Gasana J, Al-Hemoud A, et al. Extreme temperatures and mortality in Kuwait: Who is vulnerable? Sci Total Environ 2020, 732, 139289. [CrossRef]
Figure 1.
Methodology scheme.
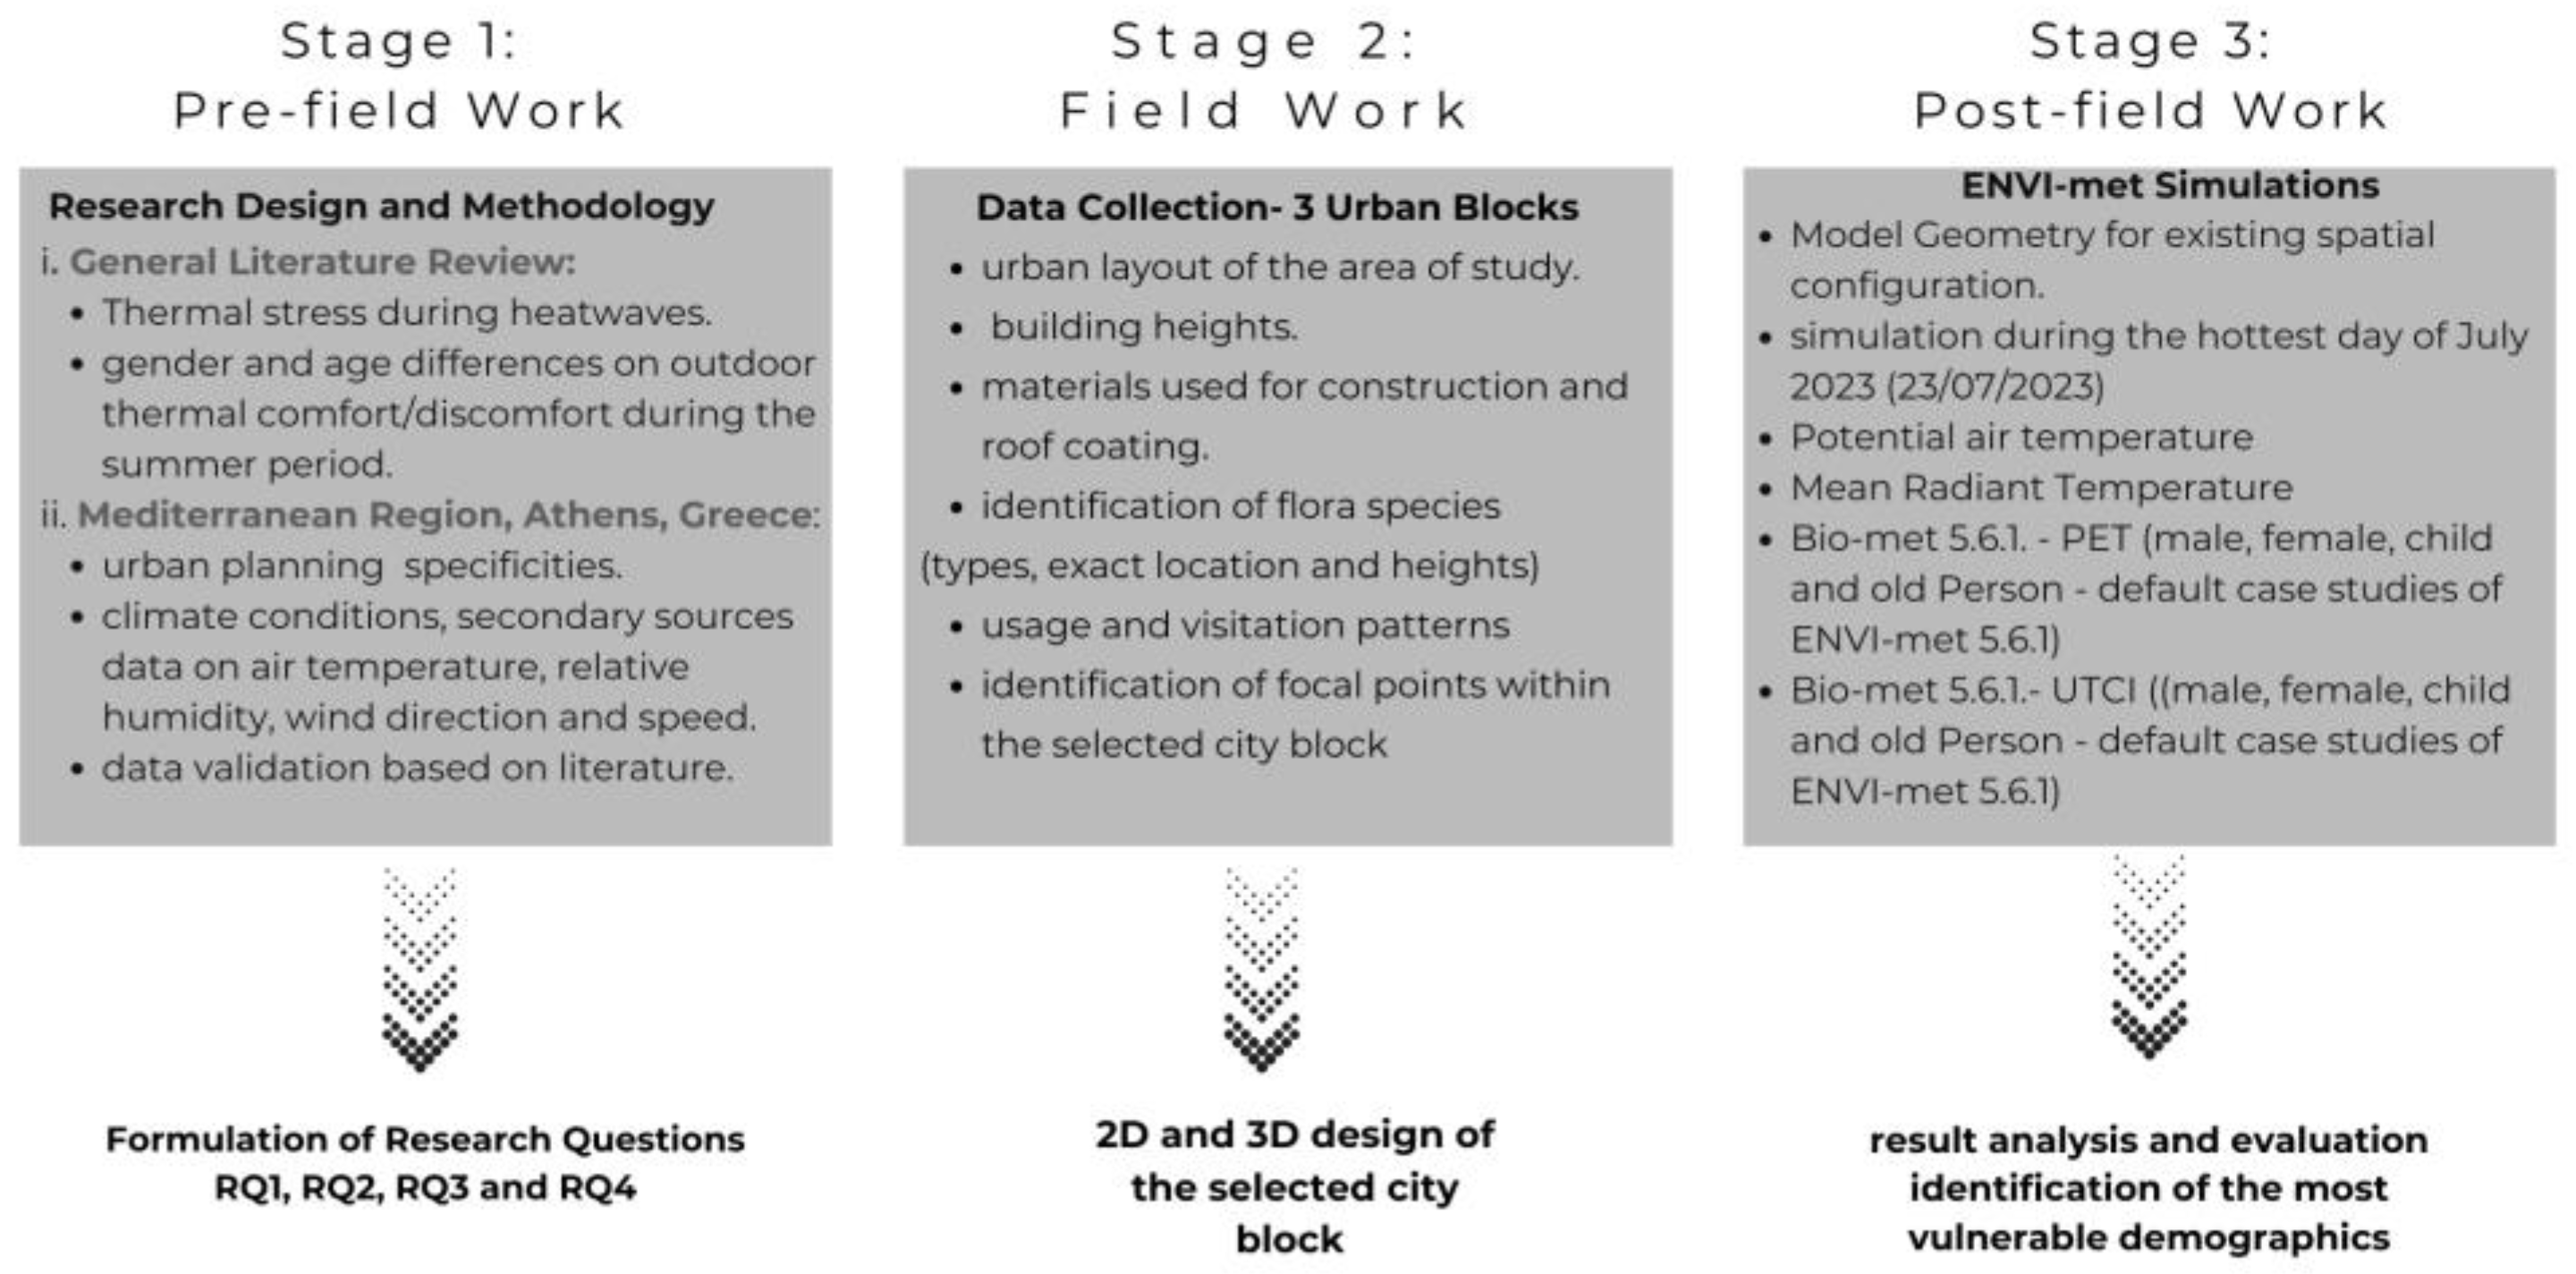
Figure 2.
Spatial layout of the area of study, 2D and 3D models.
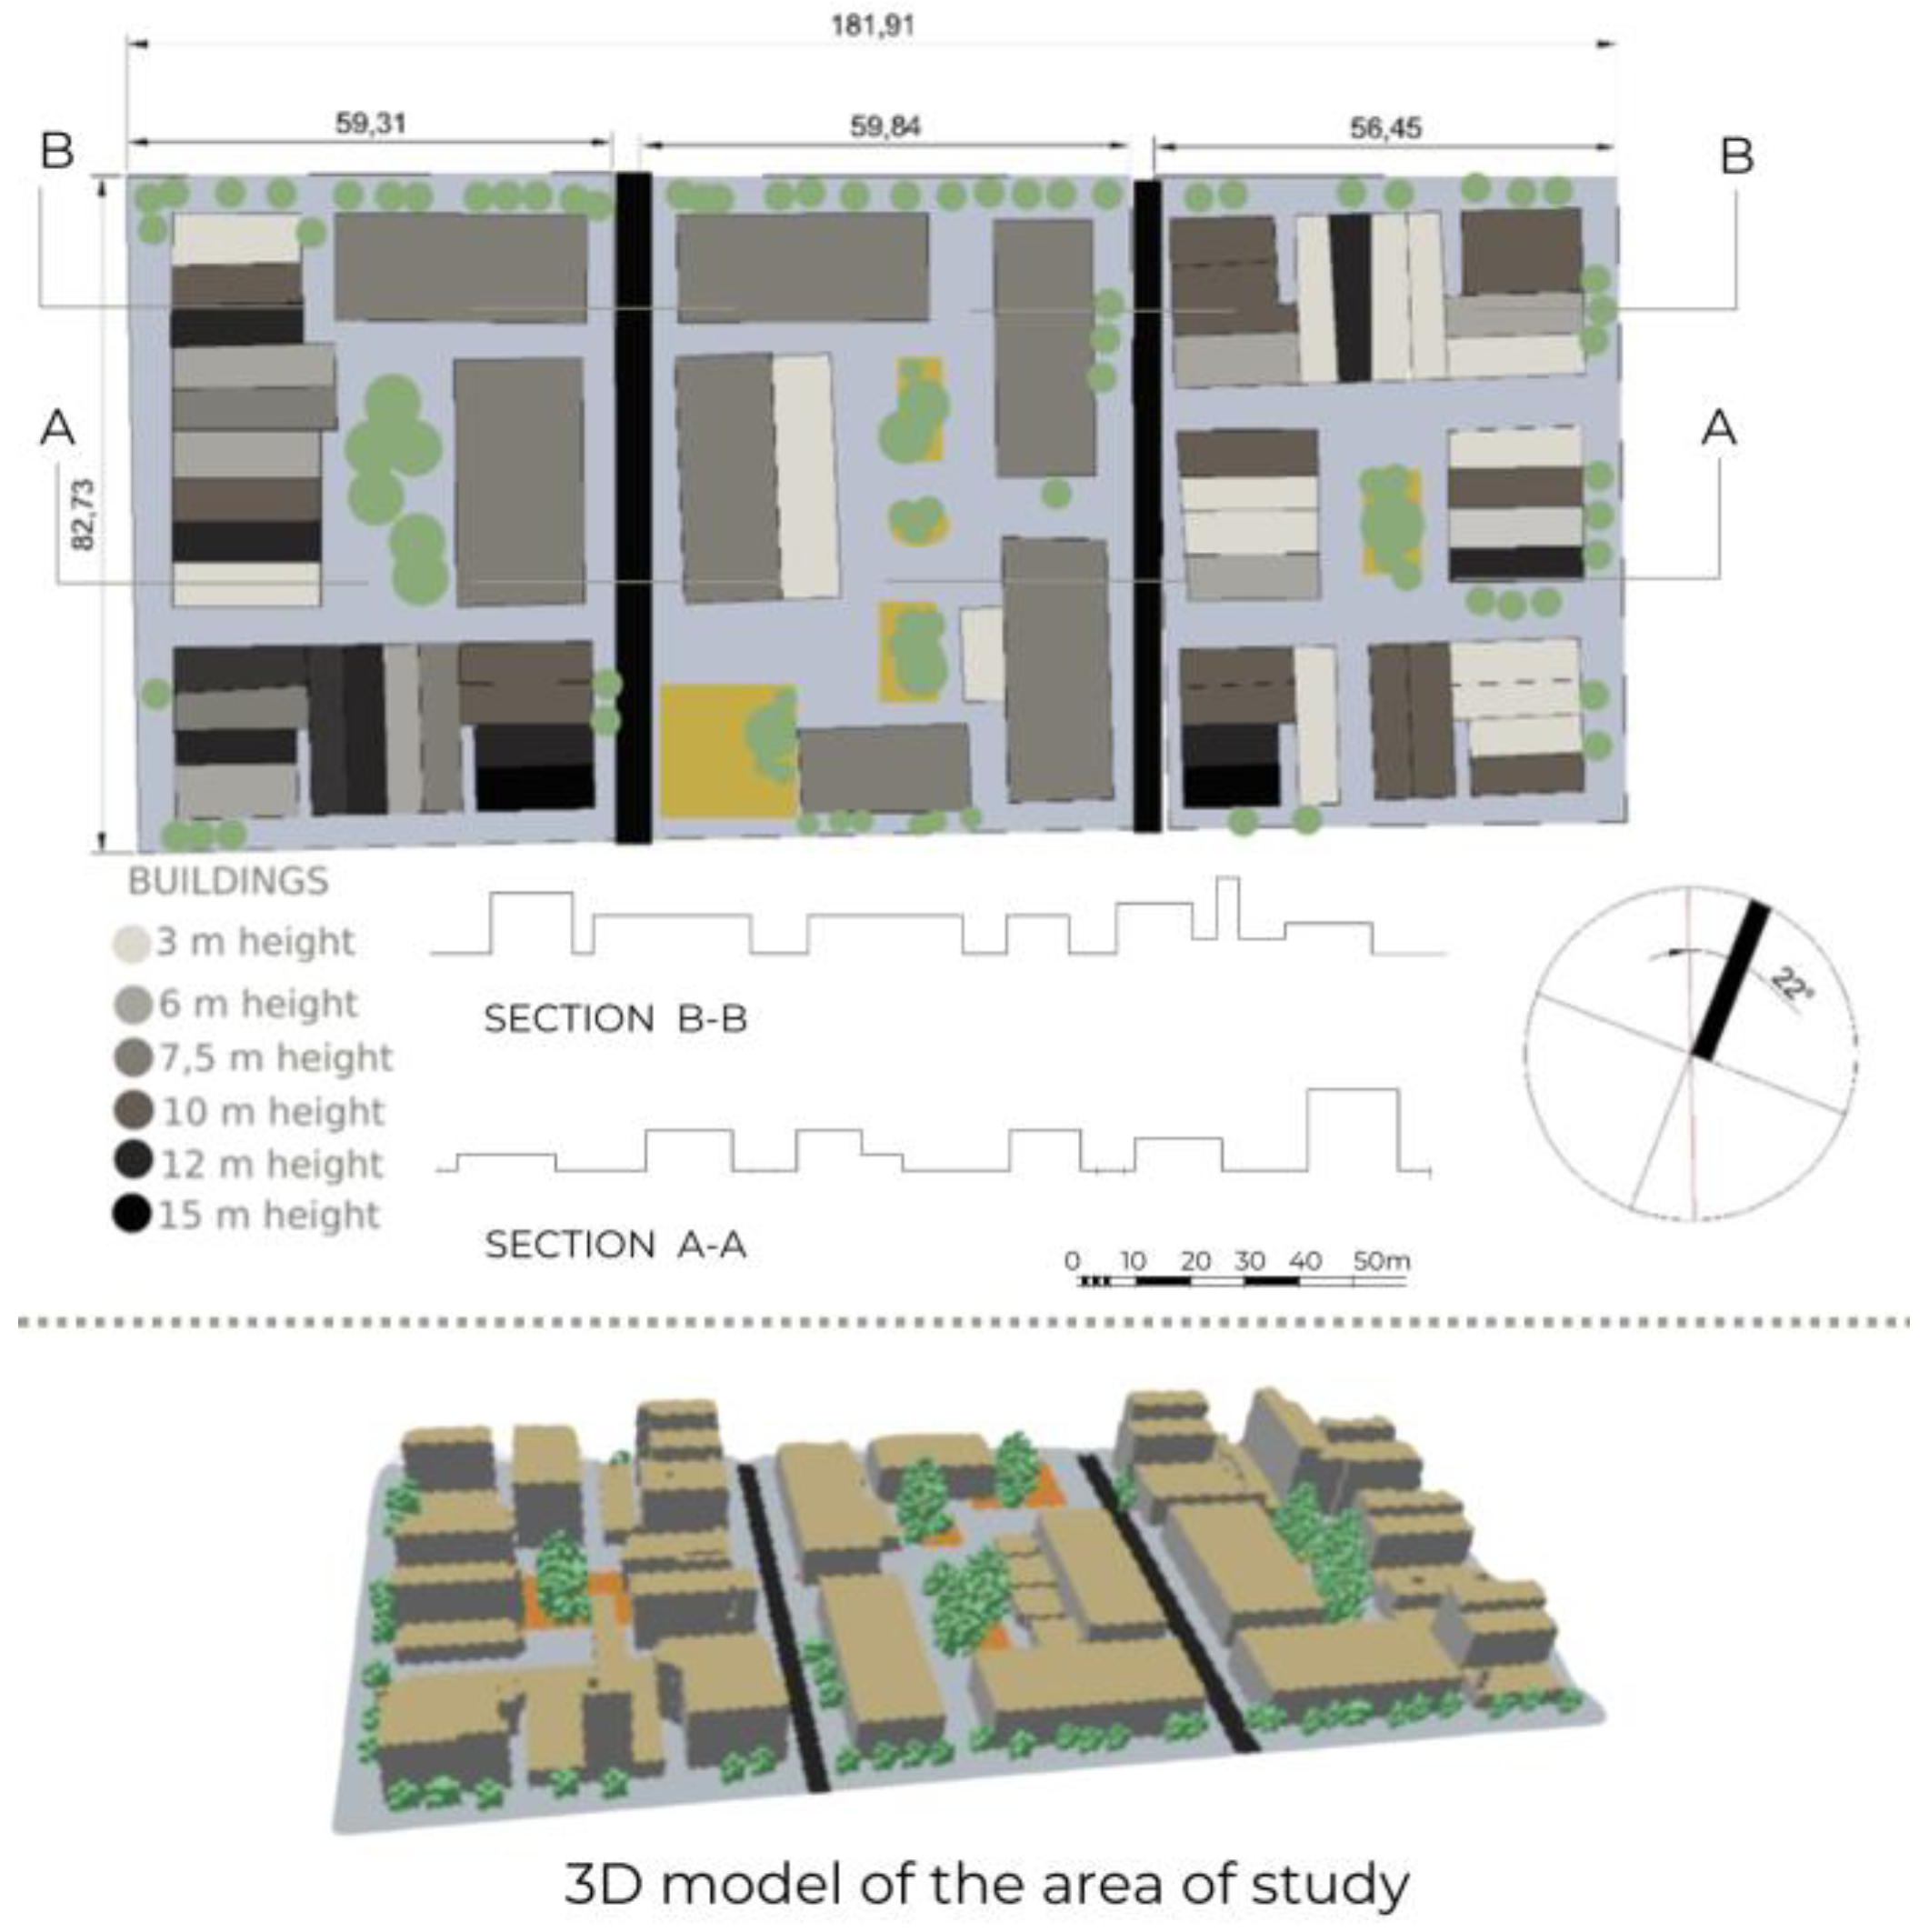
Figure 3.
ENVI-met simulation of the area of study, Potential air temperature at 10 a.m.
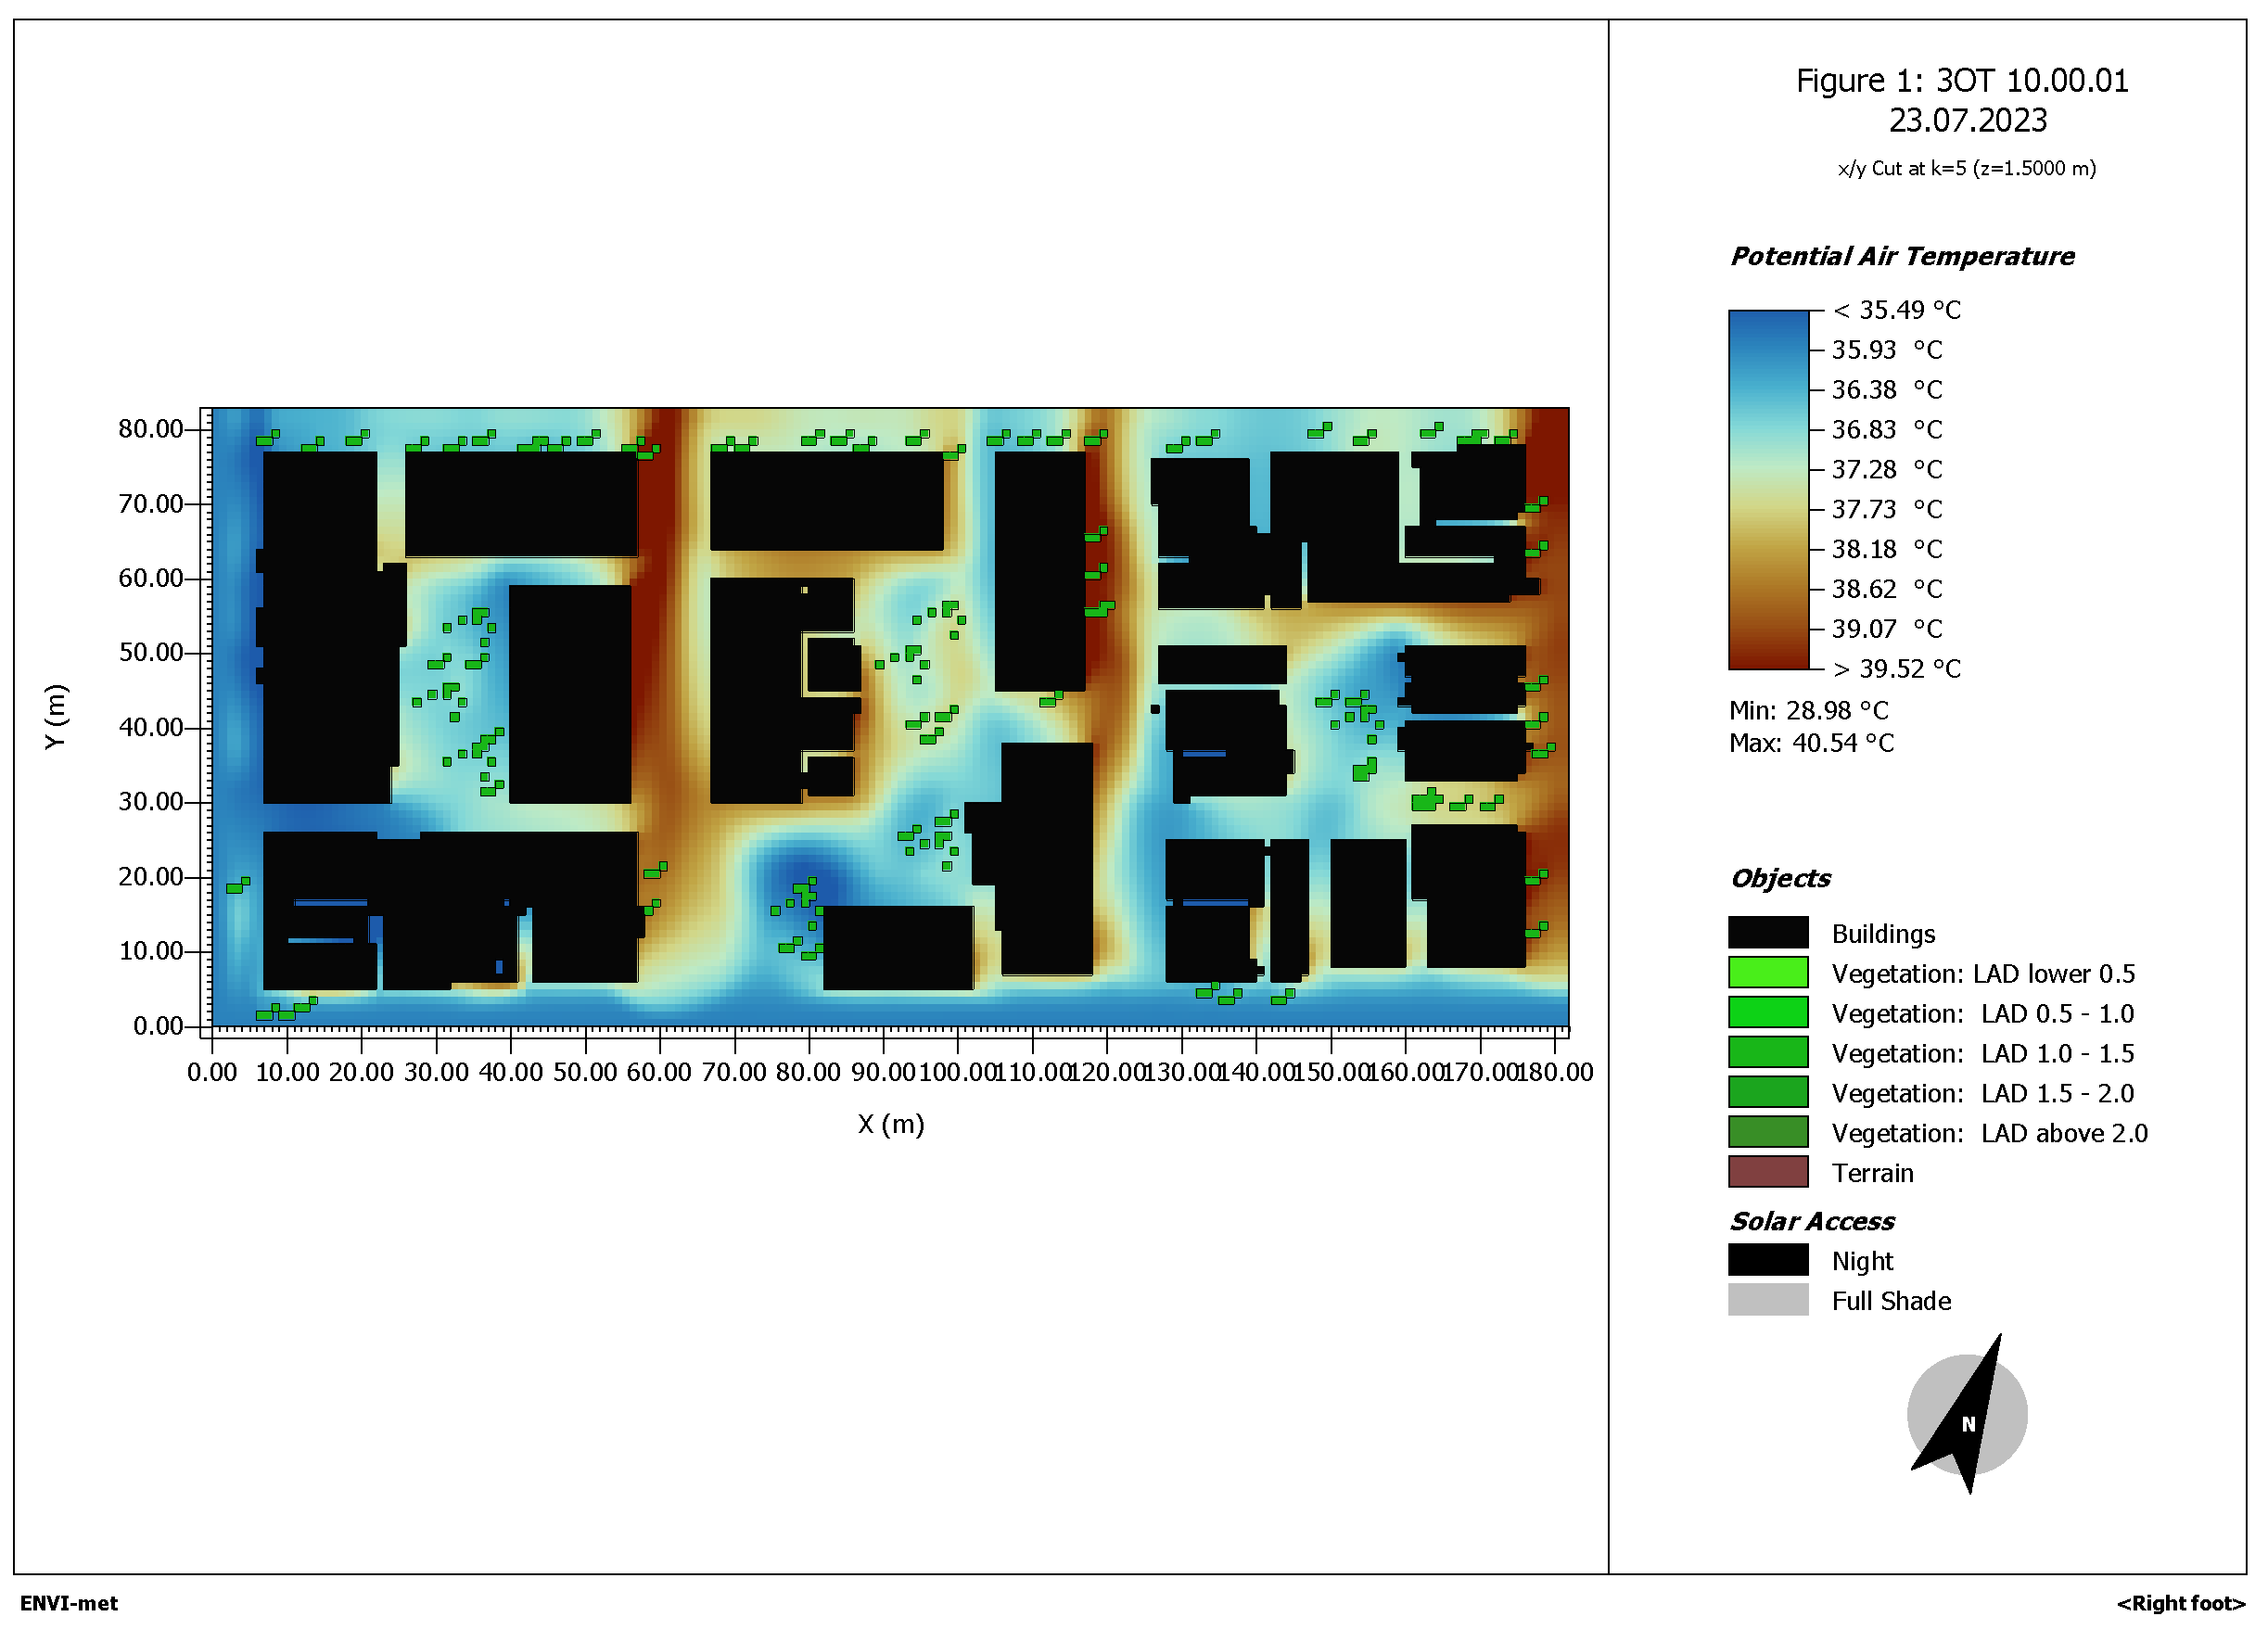
Figure 4.
ENVI-met simulation of the area of study, Potential air temperature at 10 a.m.
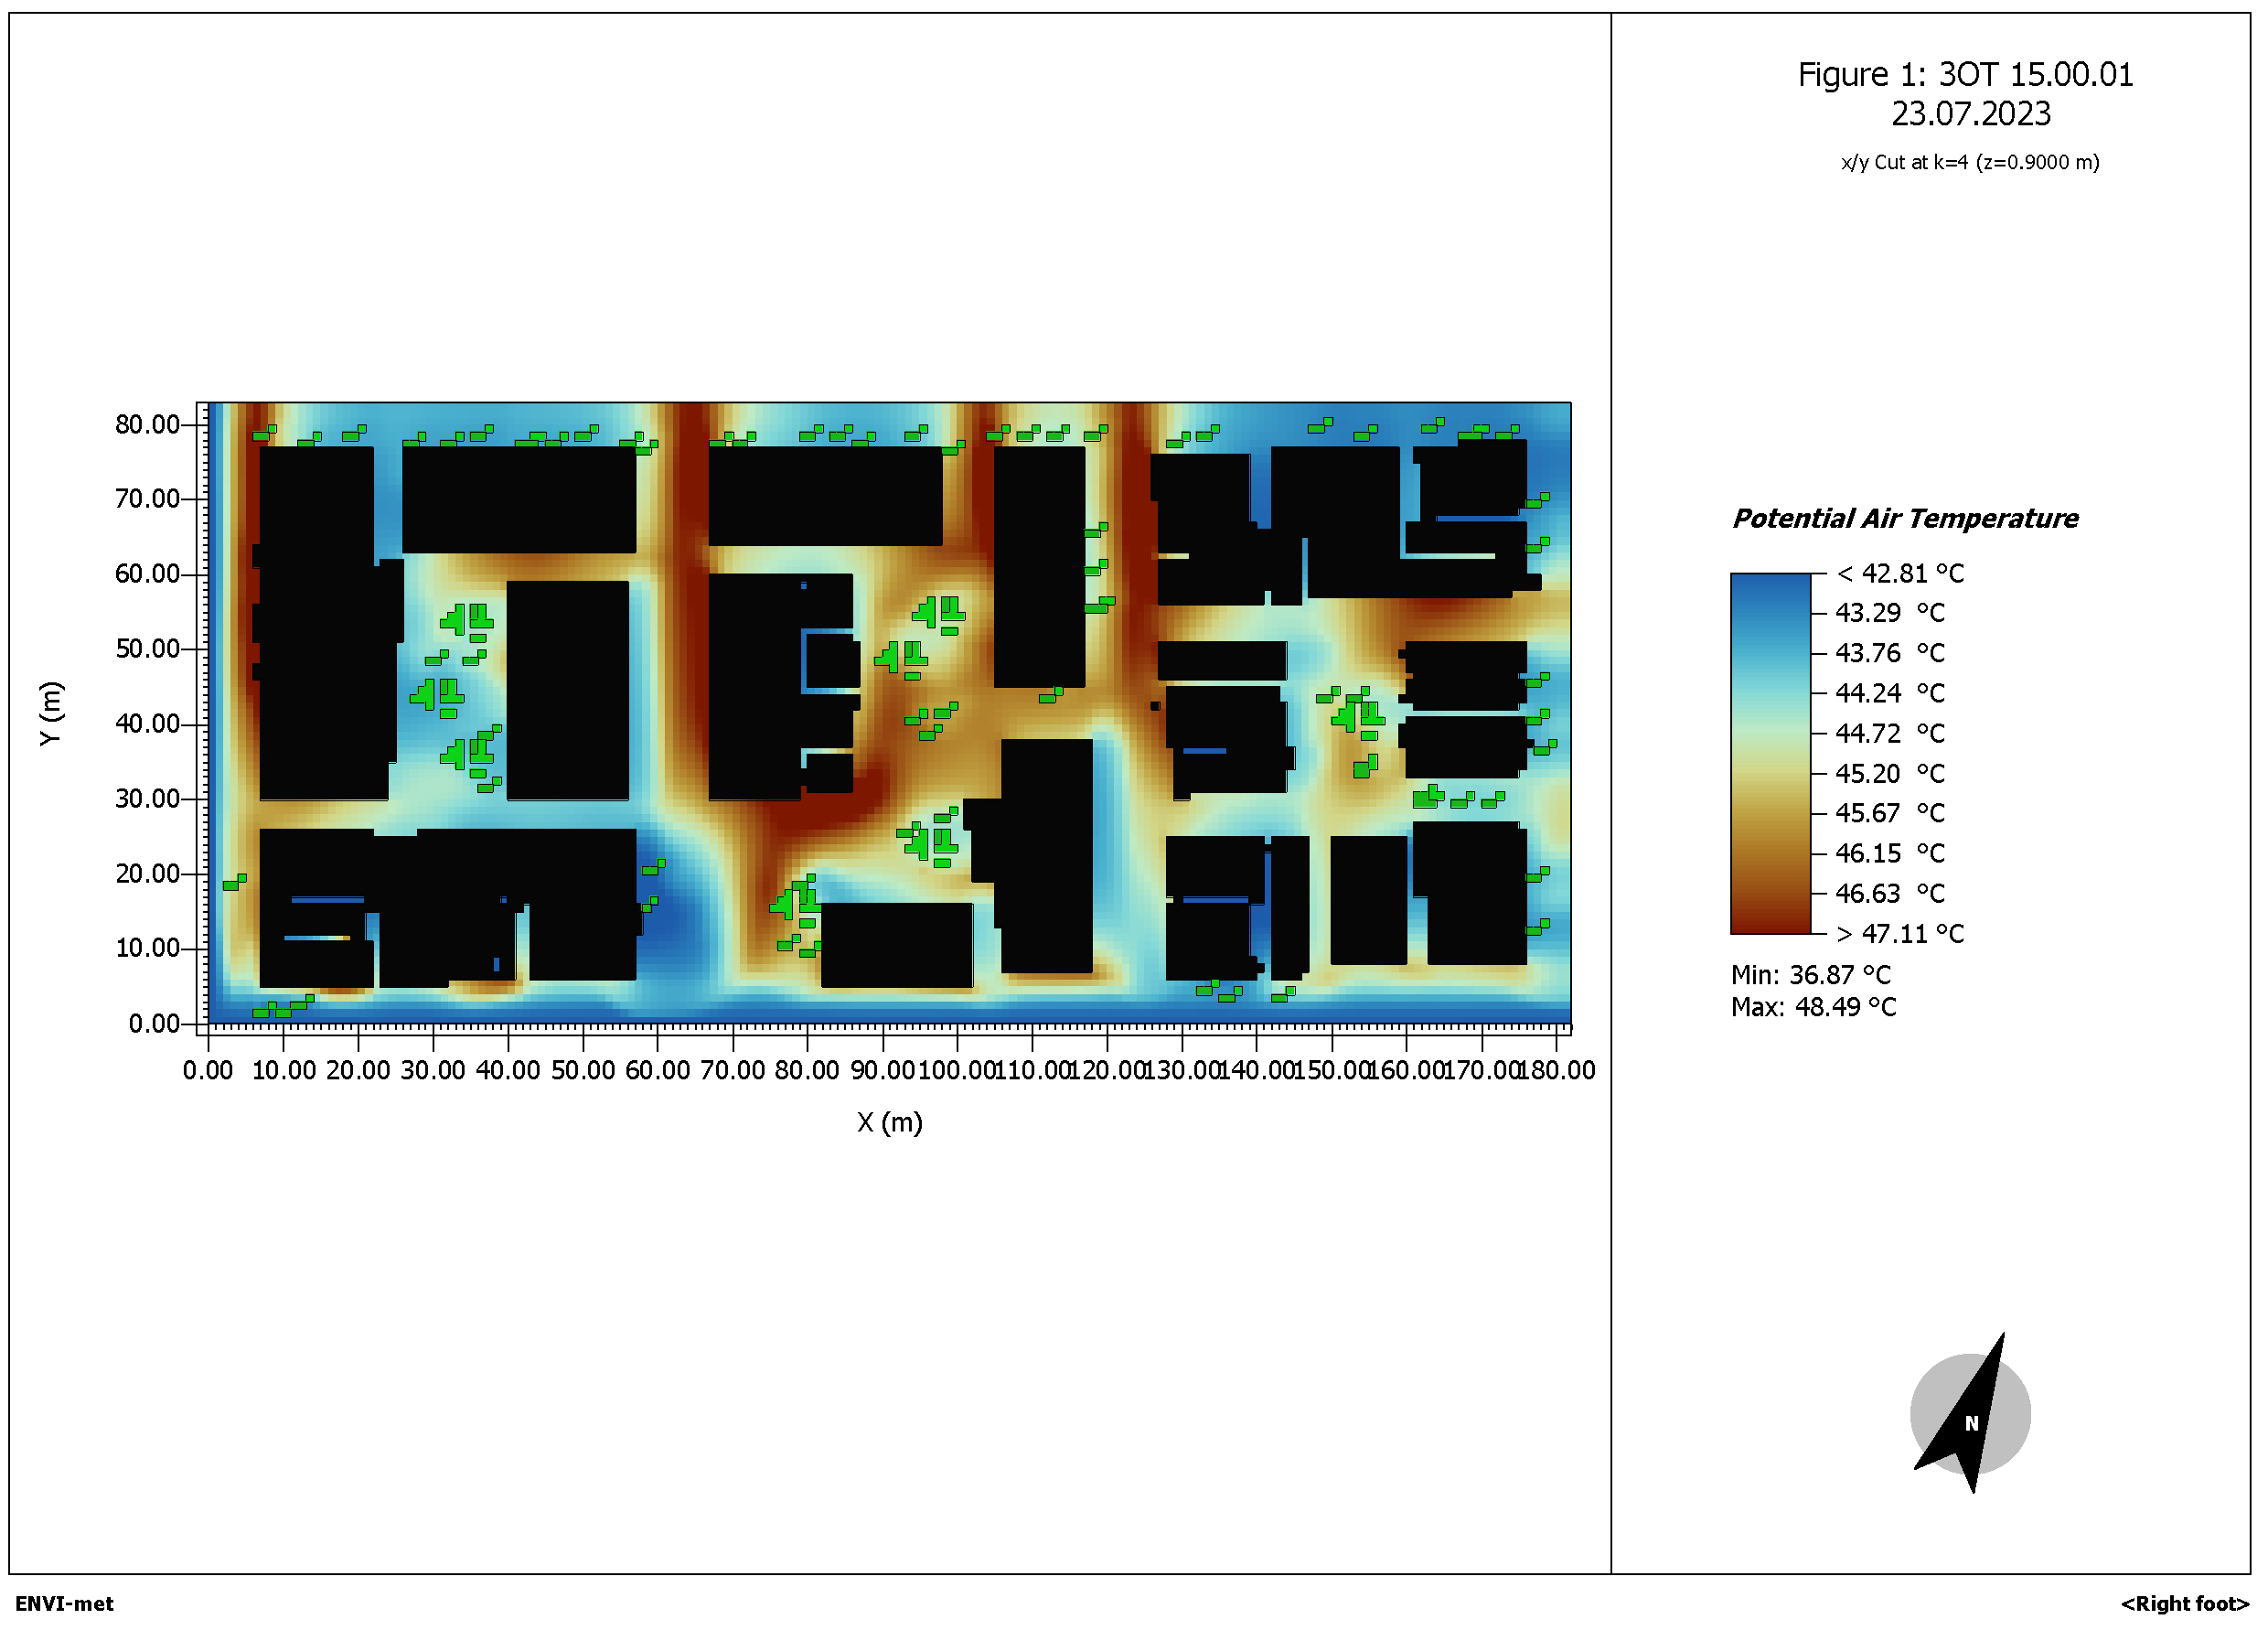
Figure 5.
ENVI-met simulation of the area of study, Potential air temperature at 8 p.m.
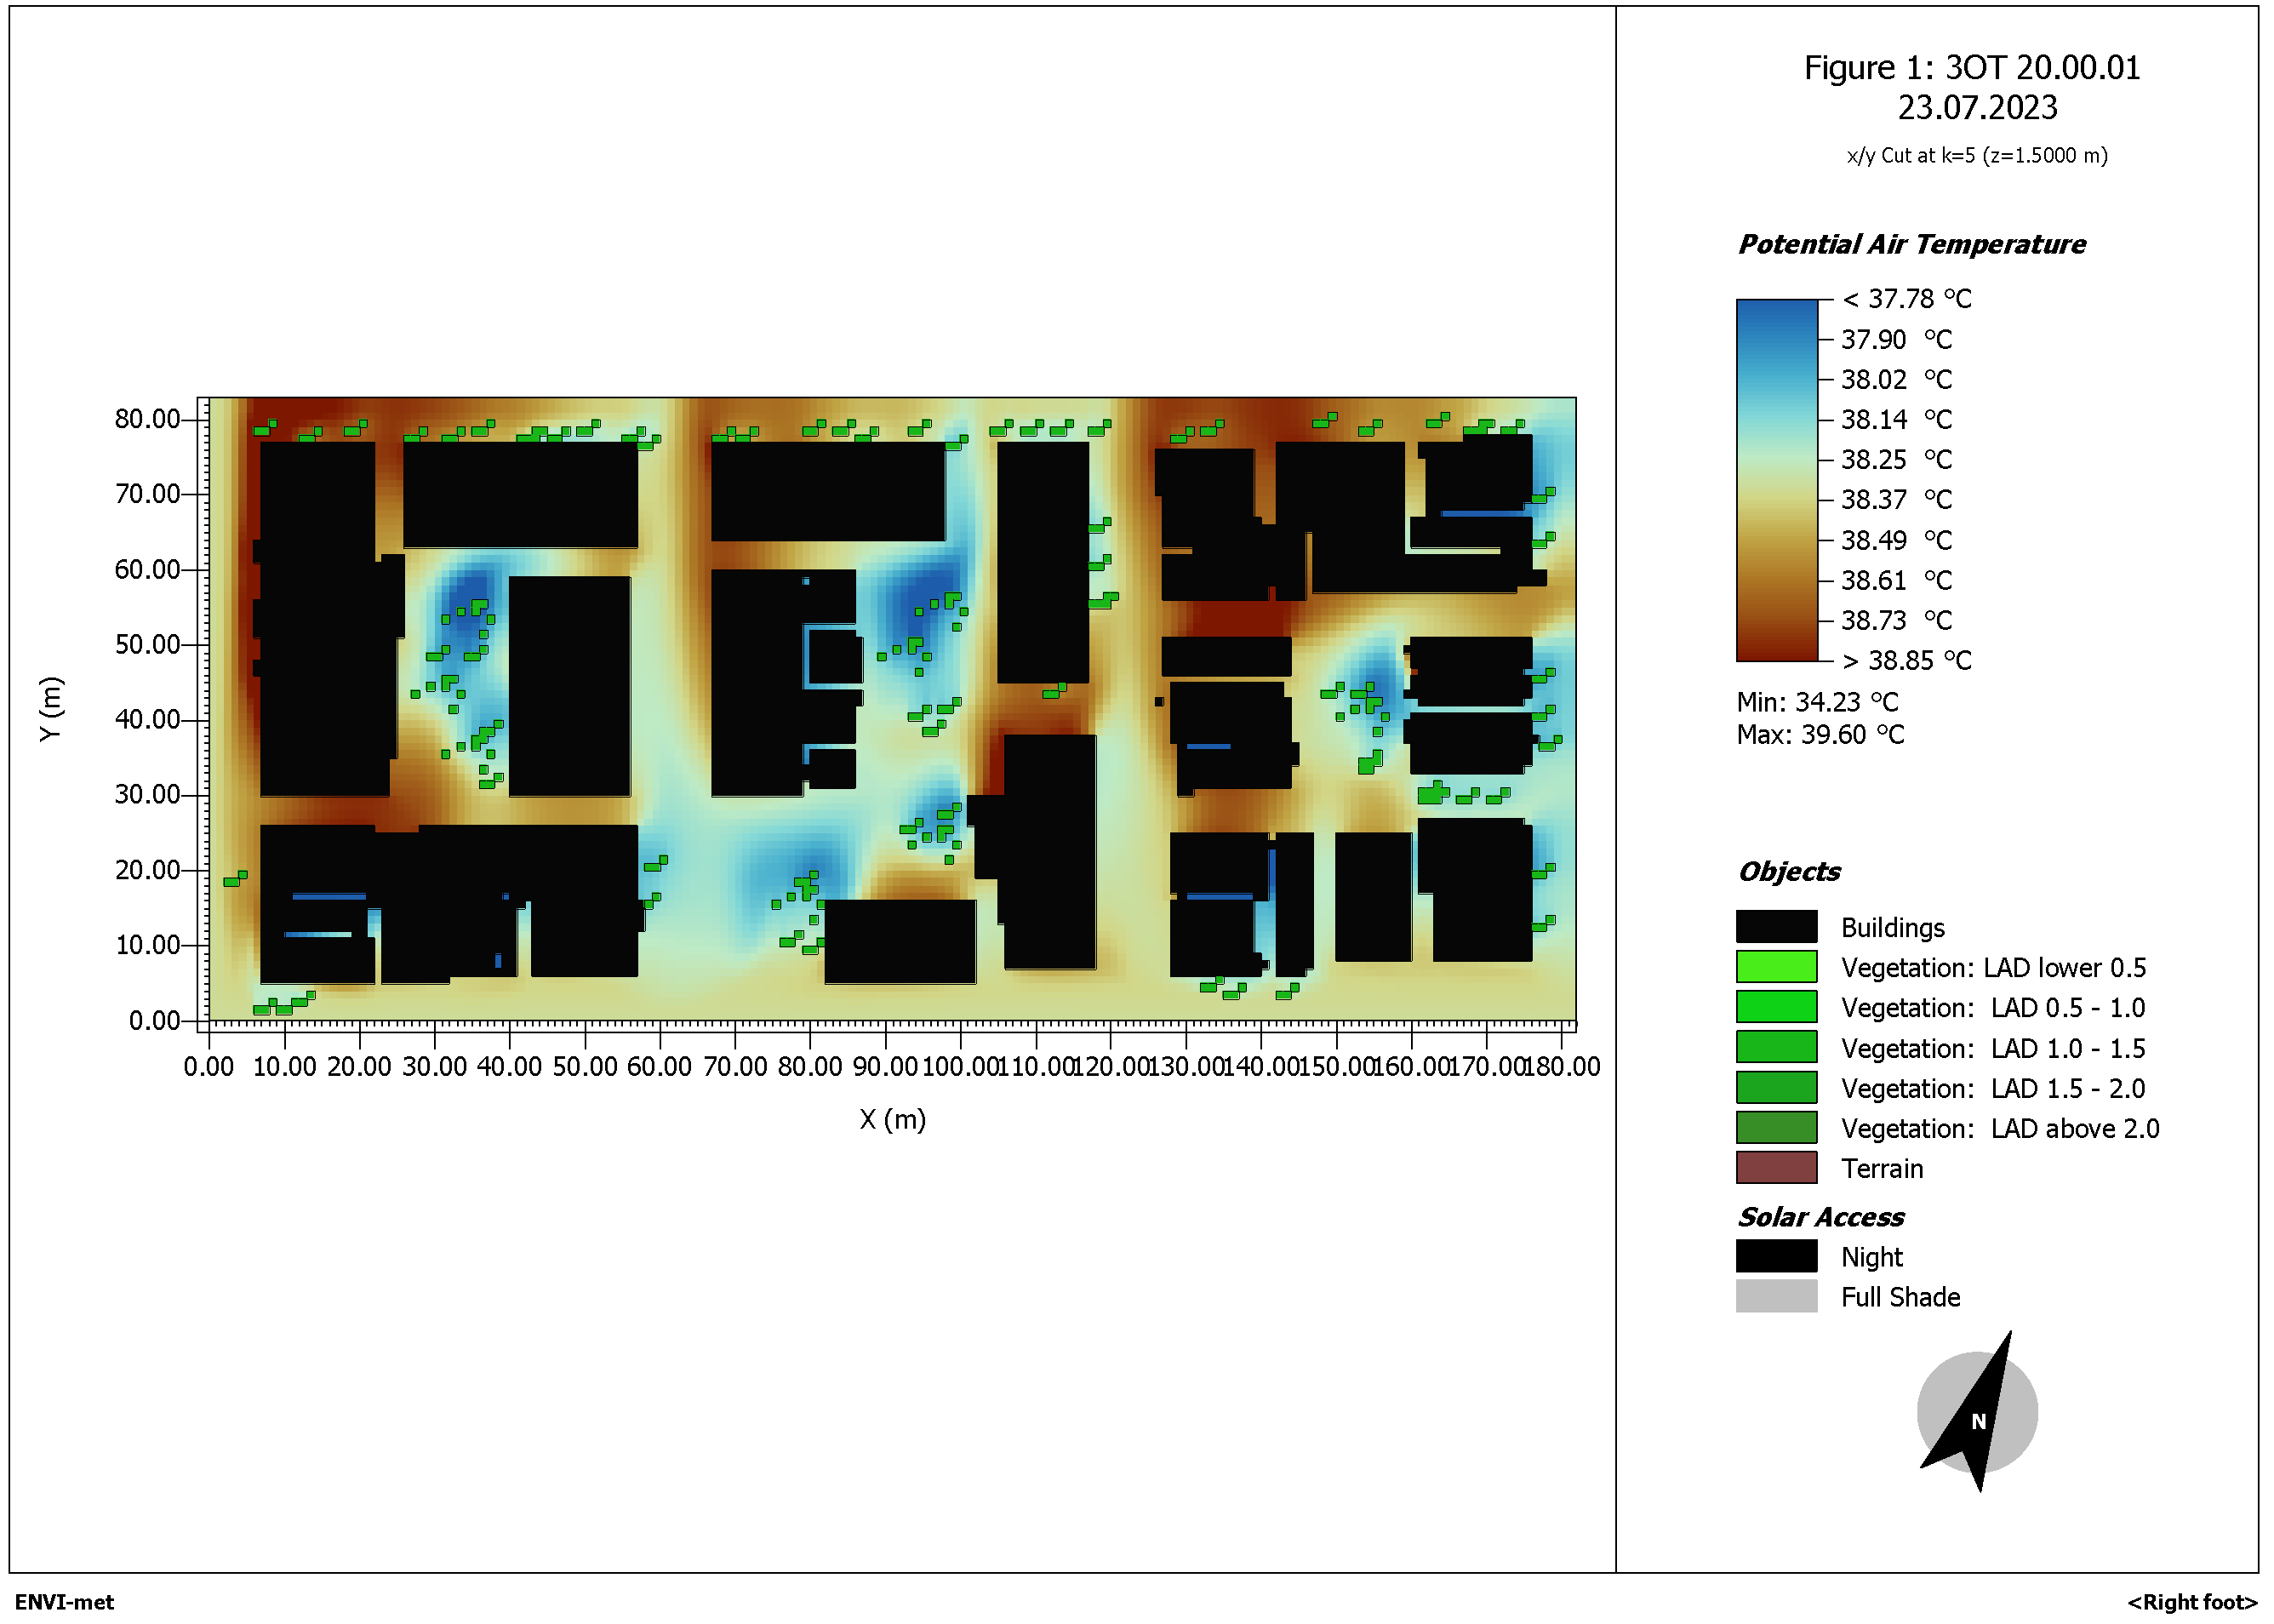
Figure 6.
ENVI-met simulation of the area of study, Mean Radiant temperature at 10 a.m.
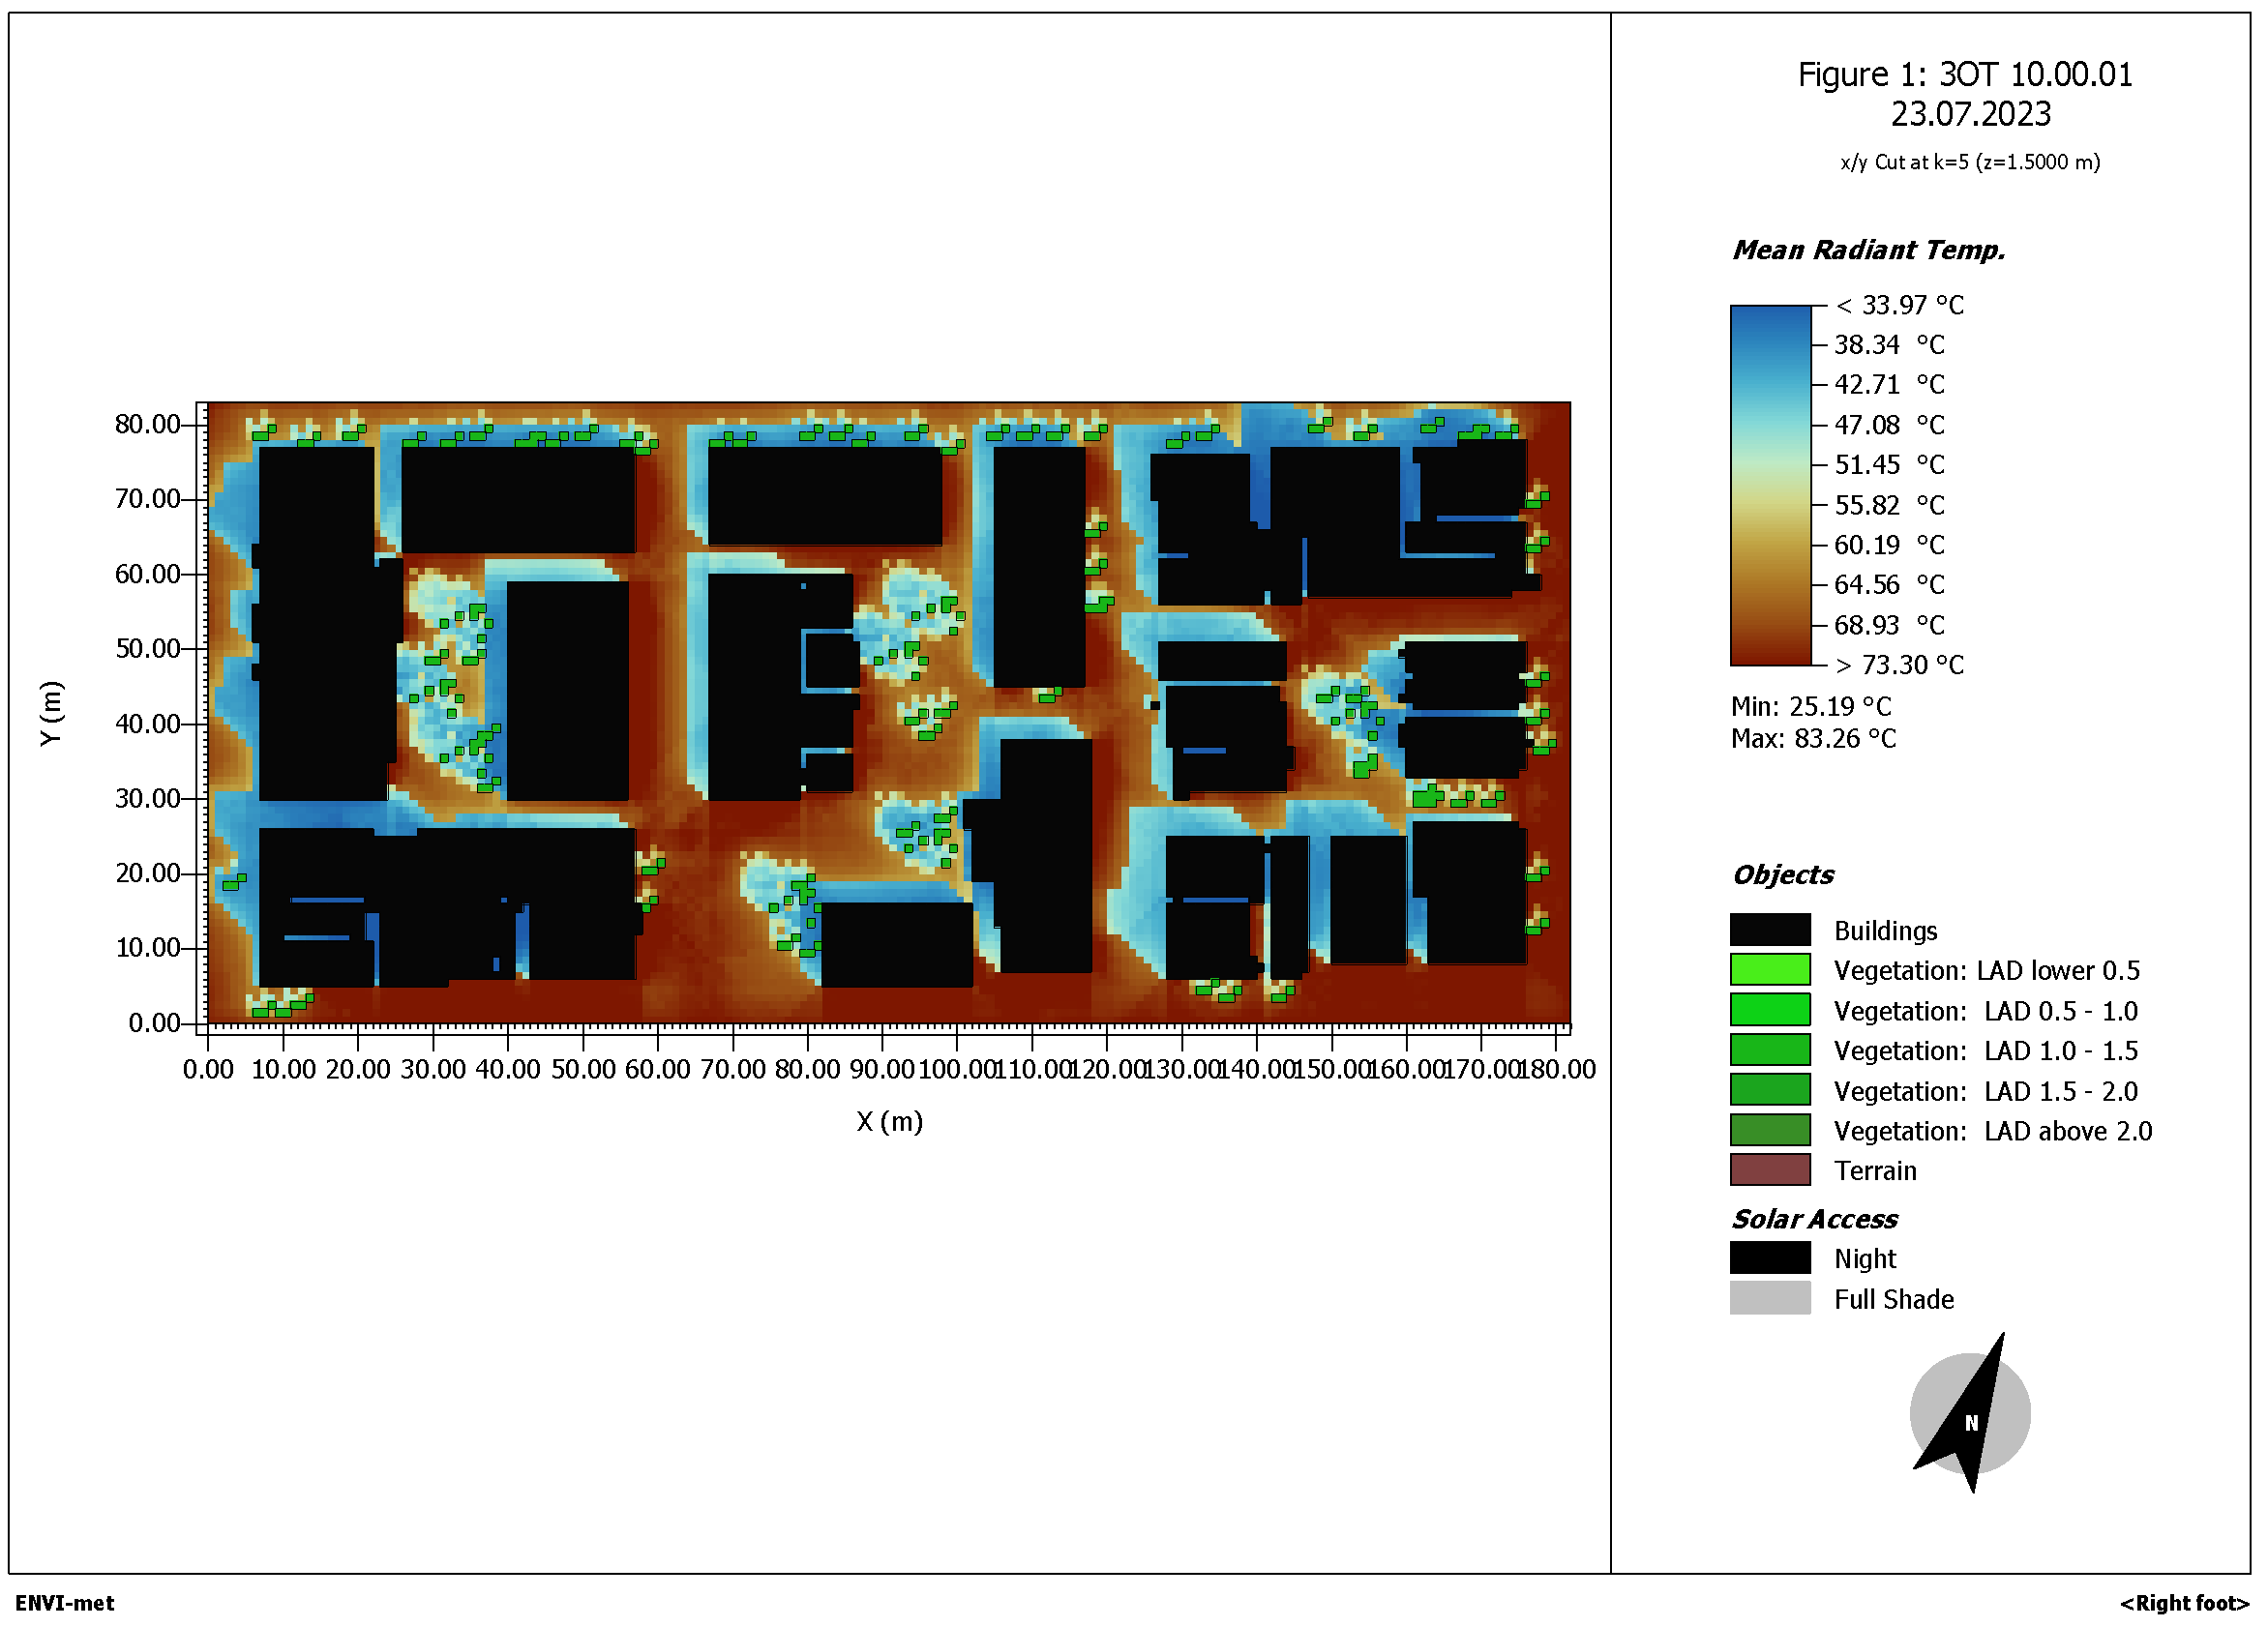
Figure 7.
ENVI-met simulation of the area of study, Mean Radiant temperature at 3 p.m.
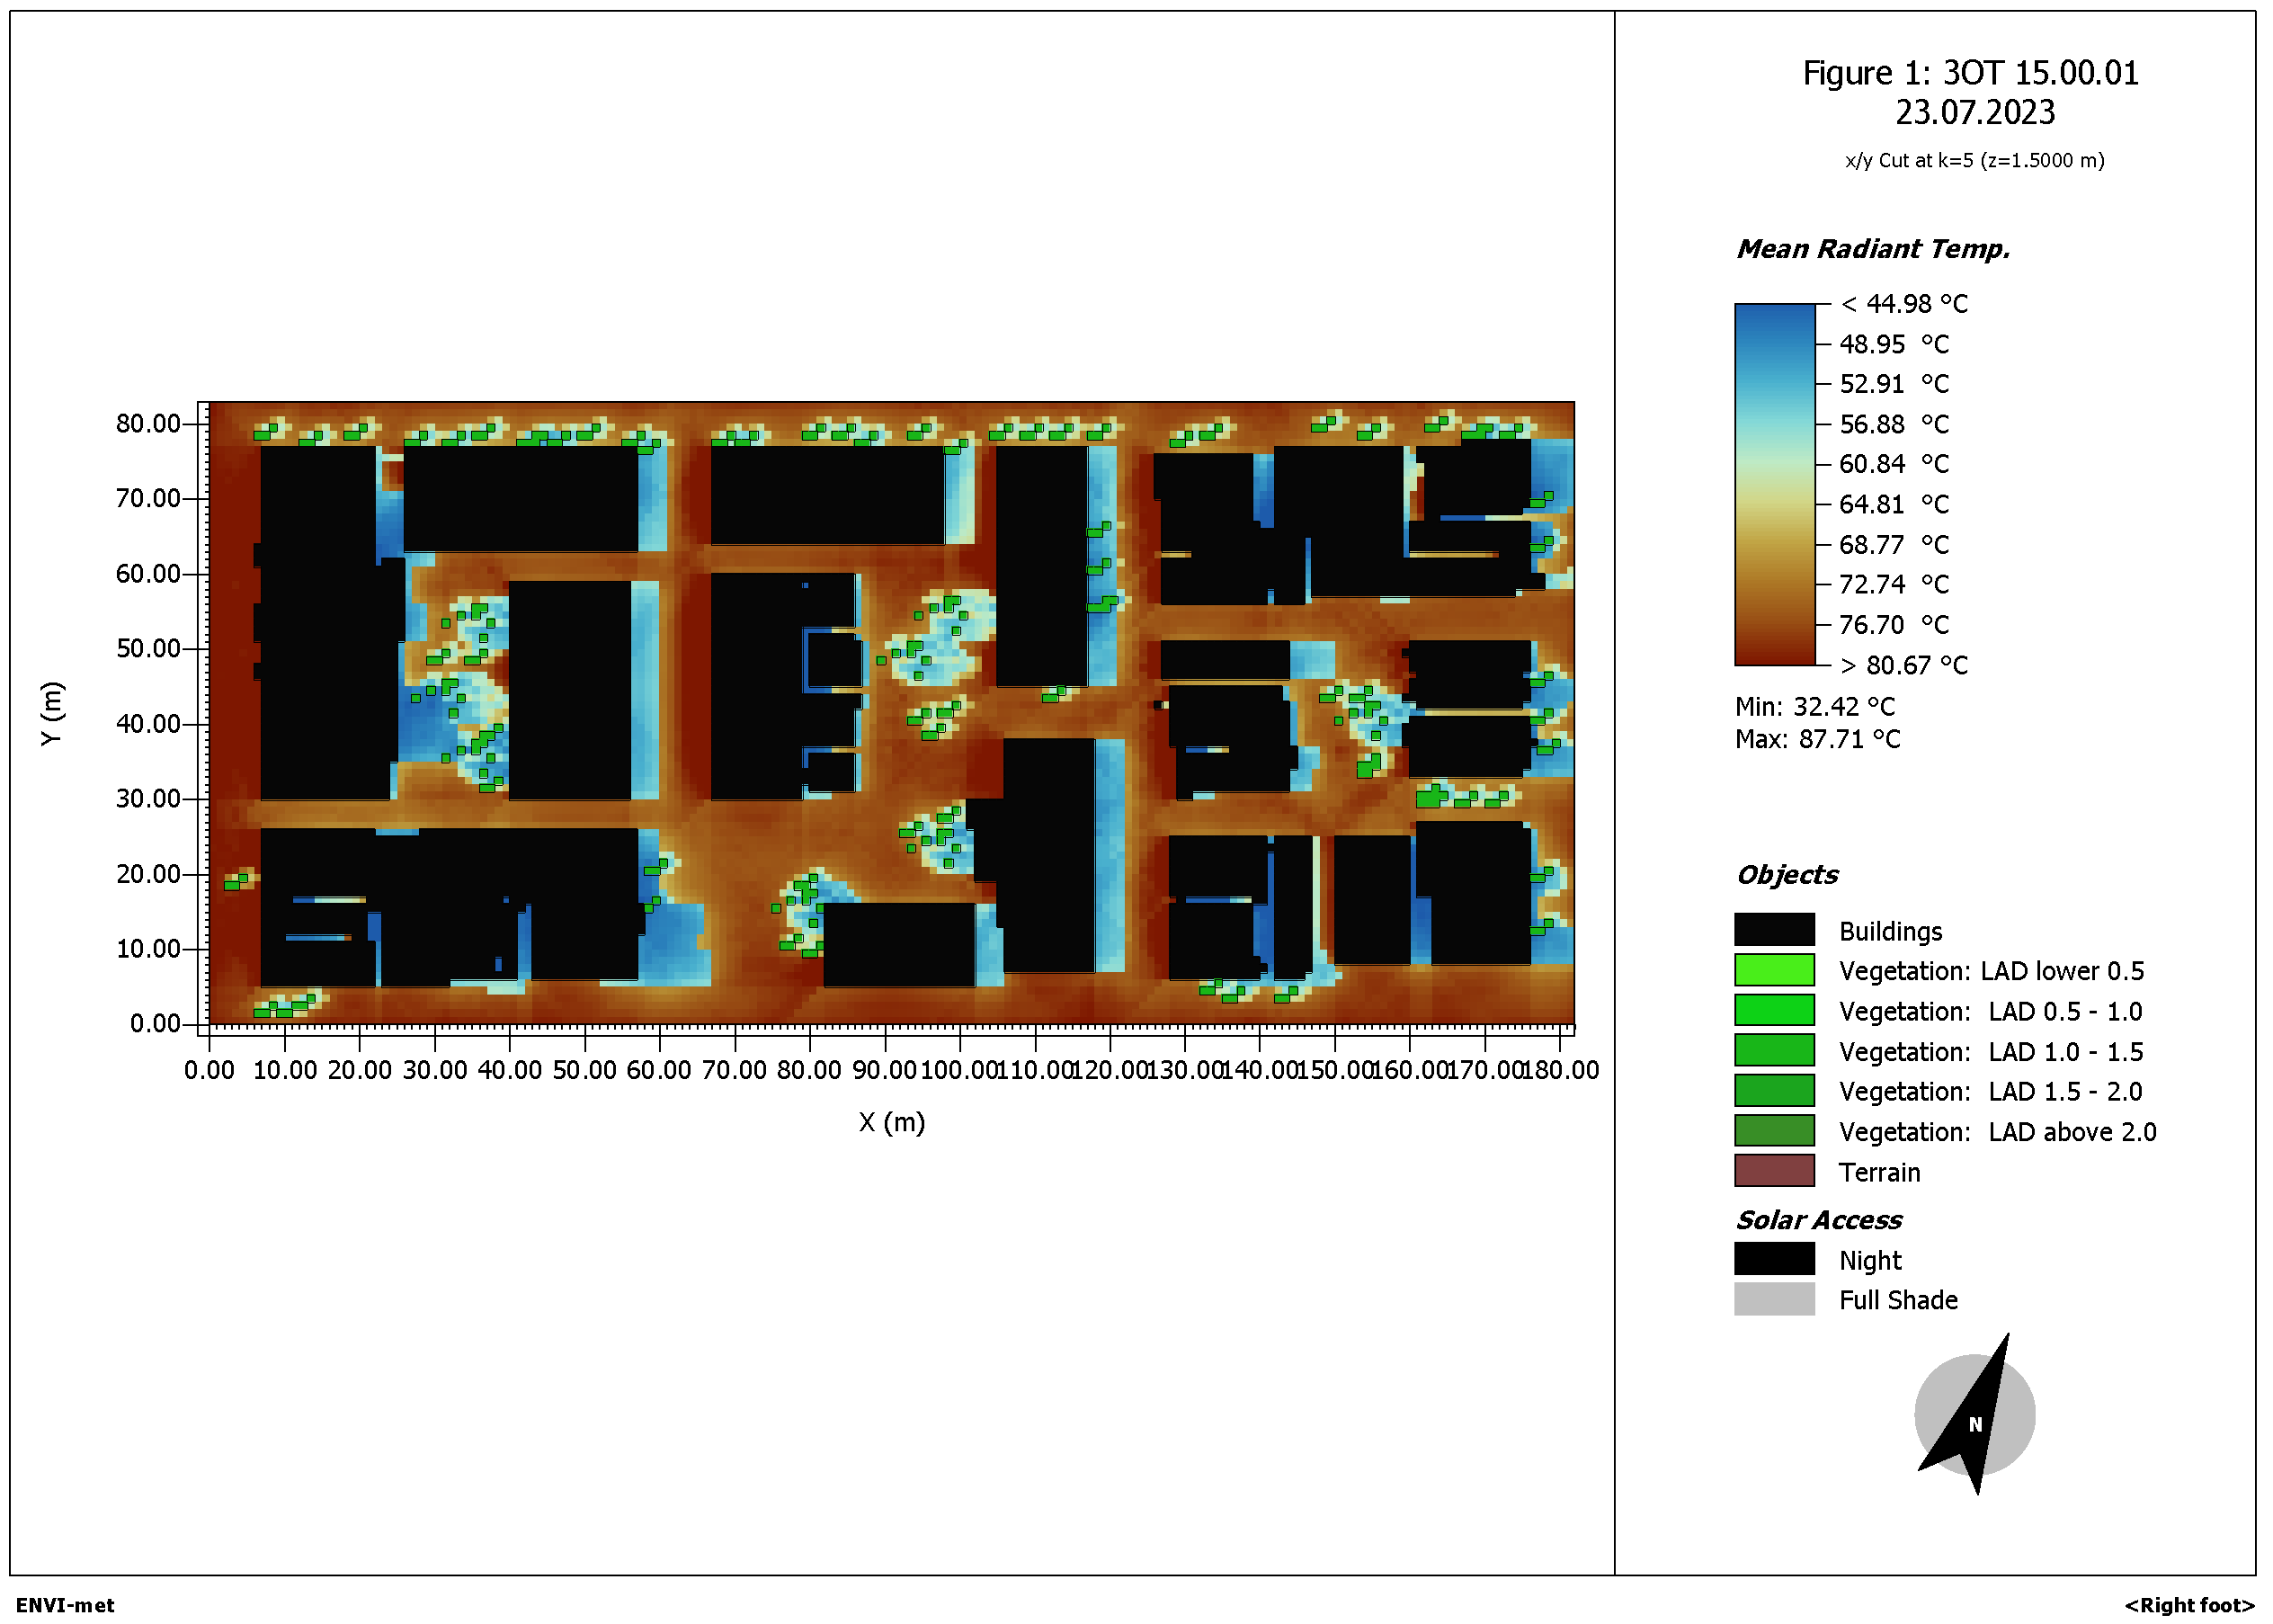
Figure 8.
ENVI-met simulation of the area of study, Mean Radiant temperature at 8 p.m.
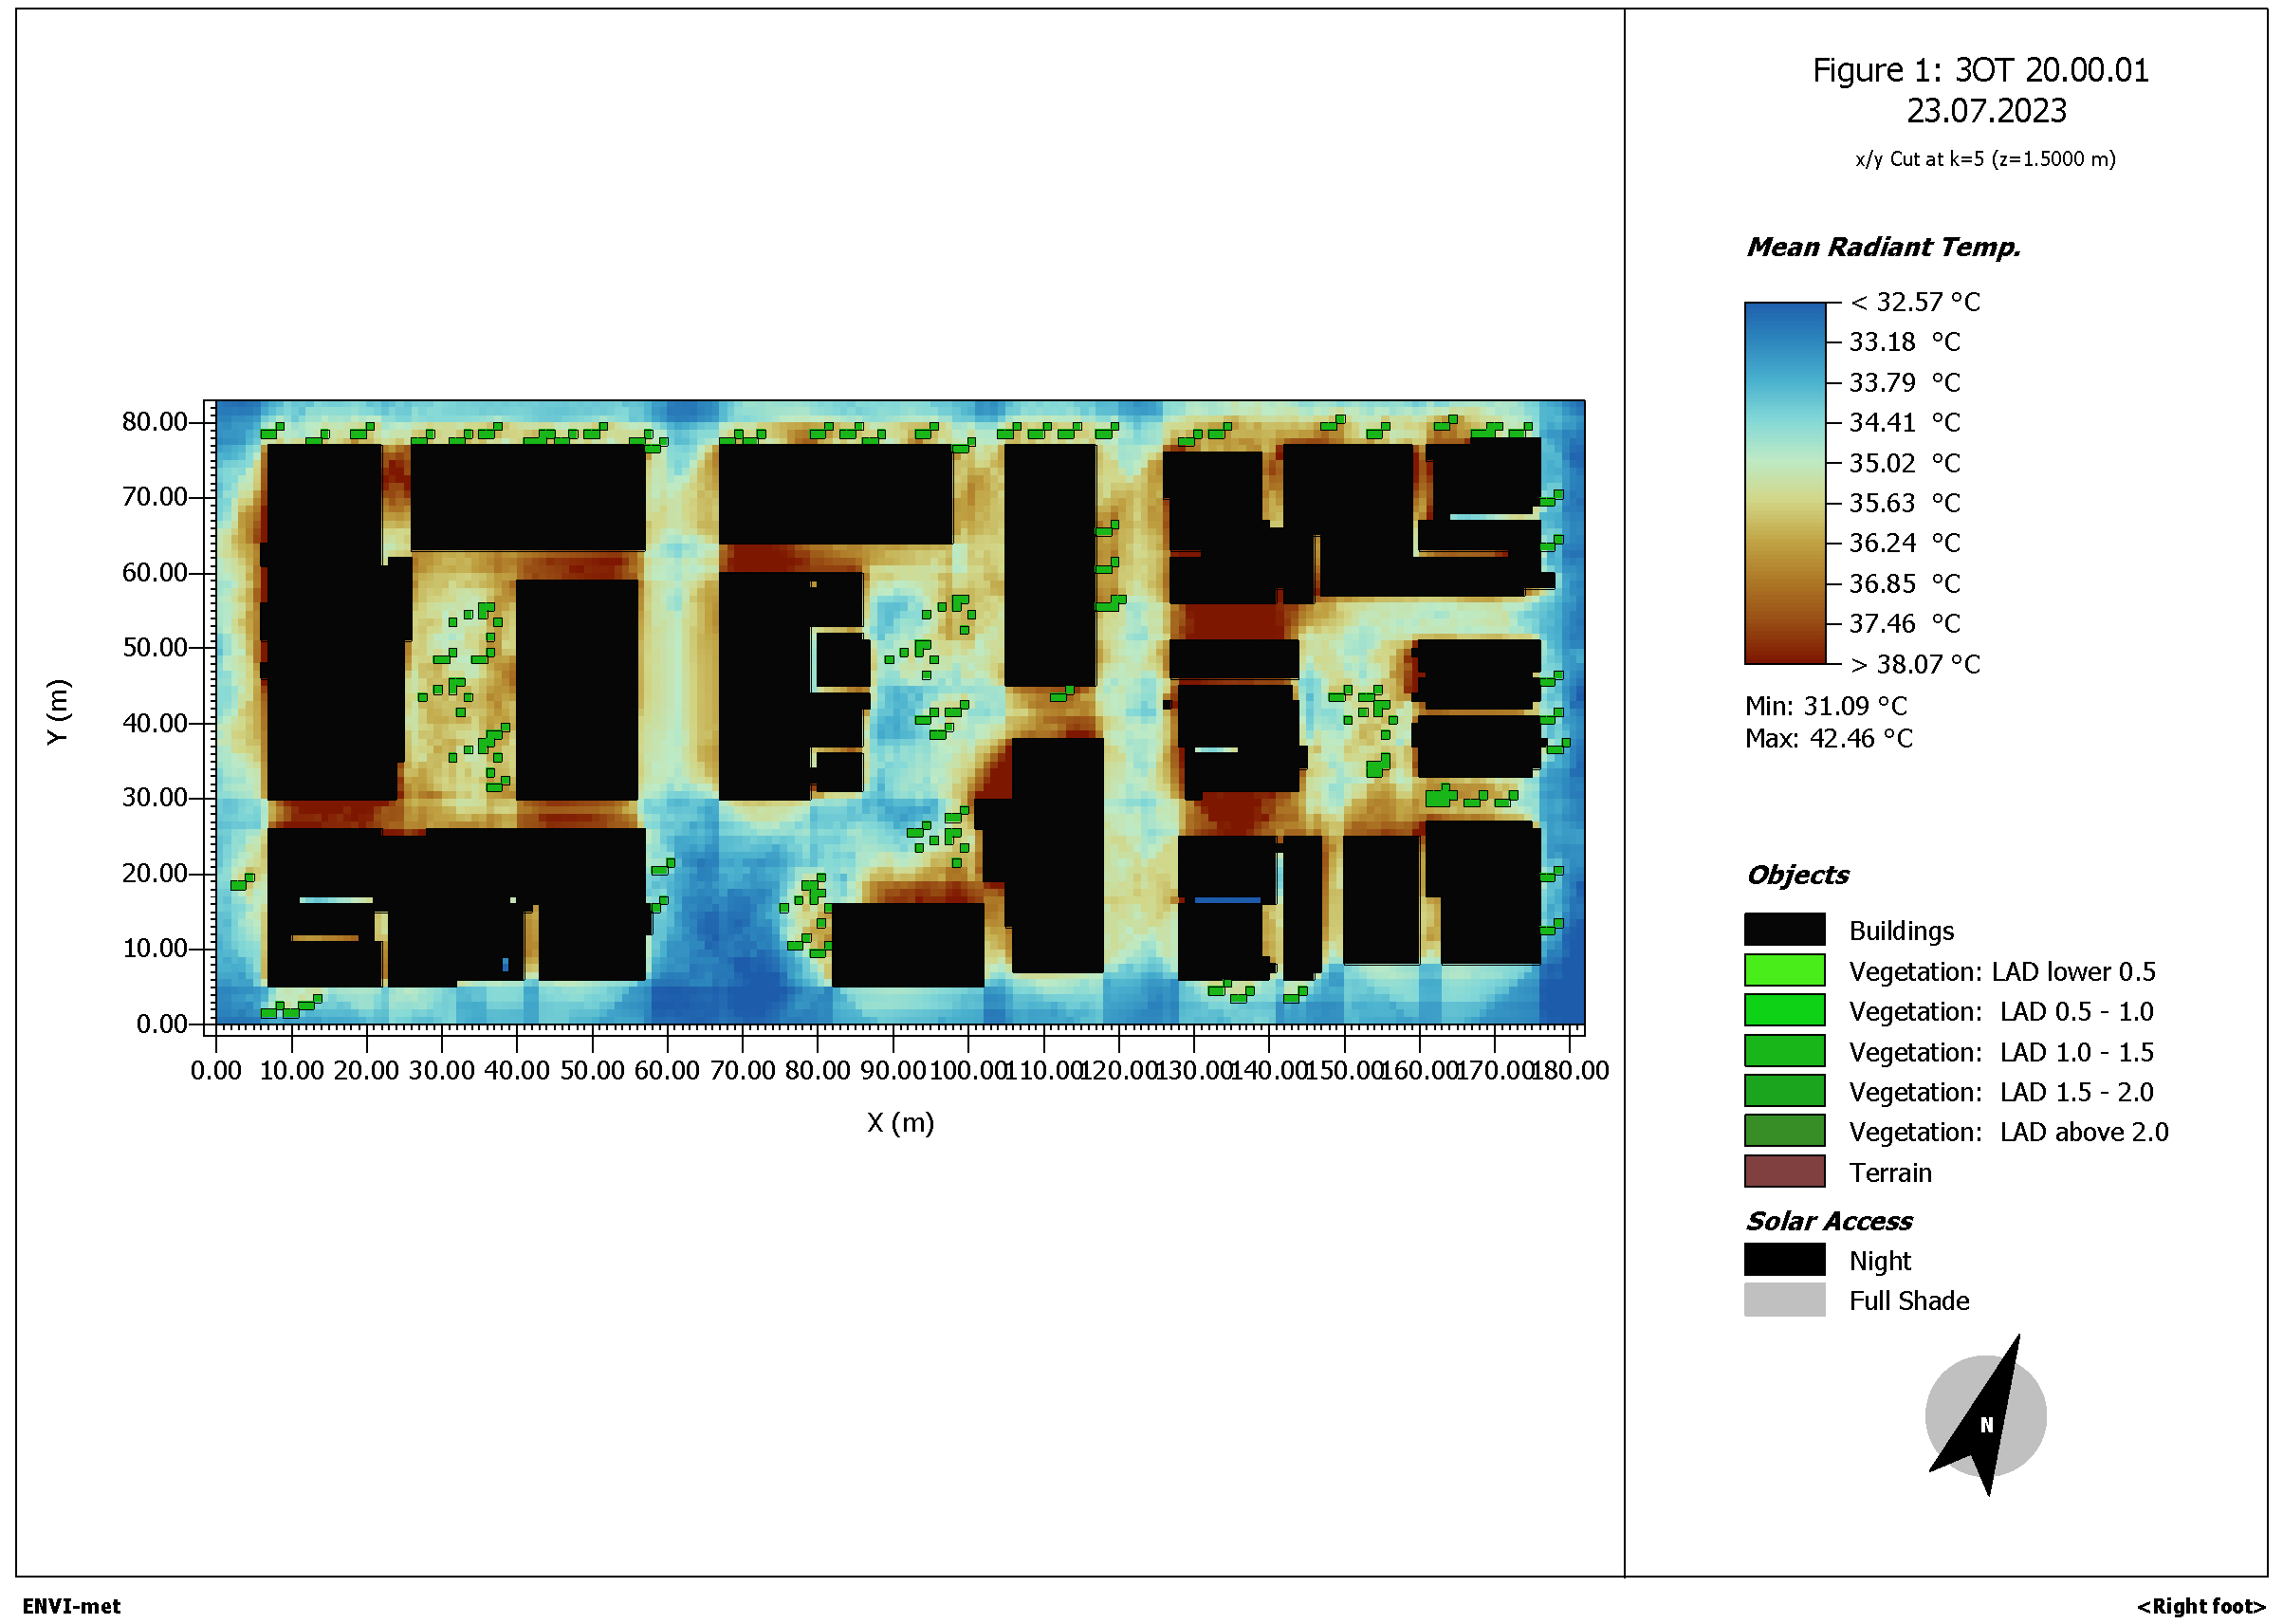
Figure 9.
ENVI-met simulation of the area of study, PET 10 a.m., male 35 years old, summer clothing, 0.5 clo, pref.speed 1,34m/s.
Figure 9.
ENVI-met simulation of the area of study, PET 10 a.m., male 35 years old, summer clothing, 0.5 clo, pref.speed 1,34m/s.
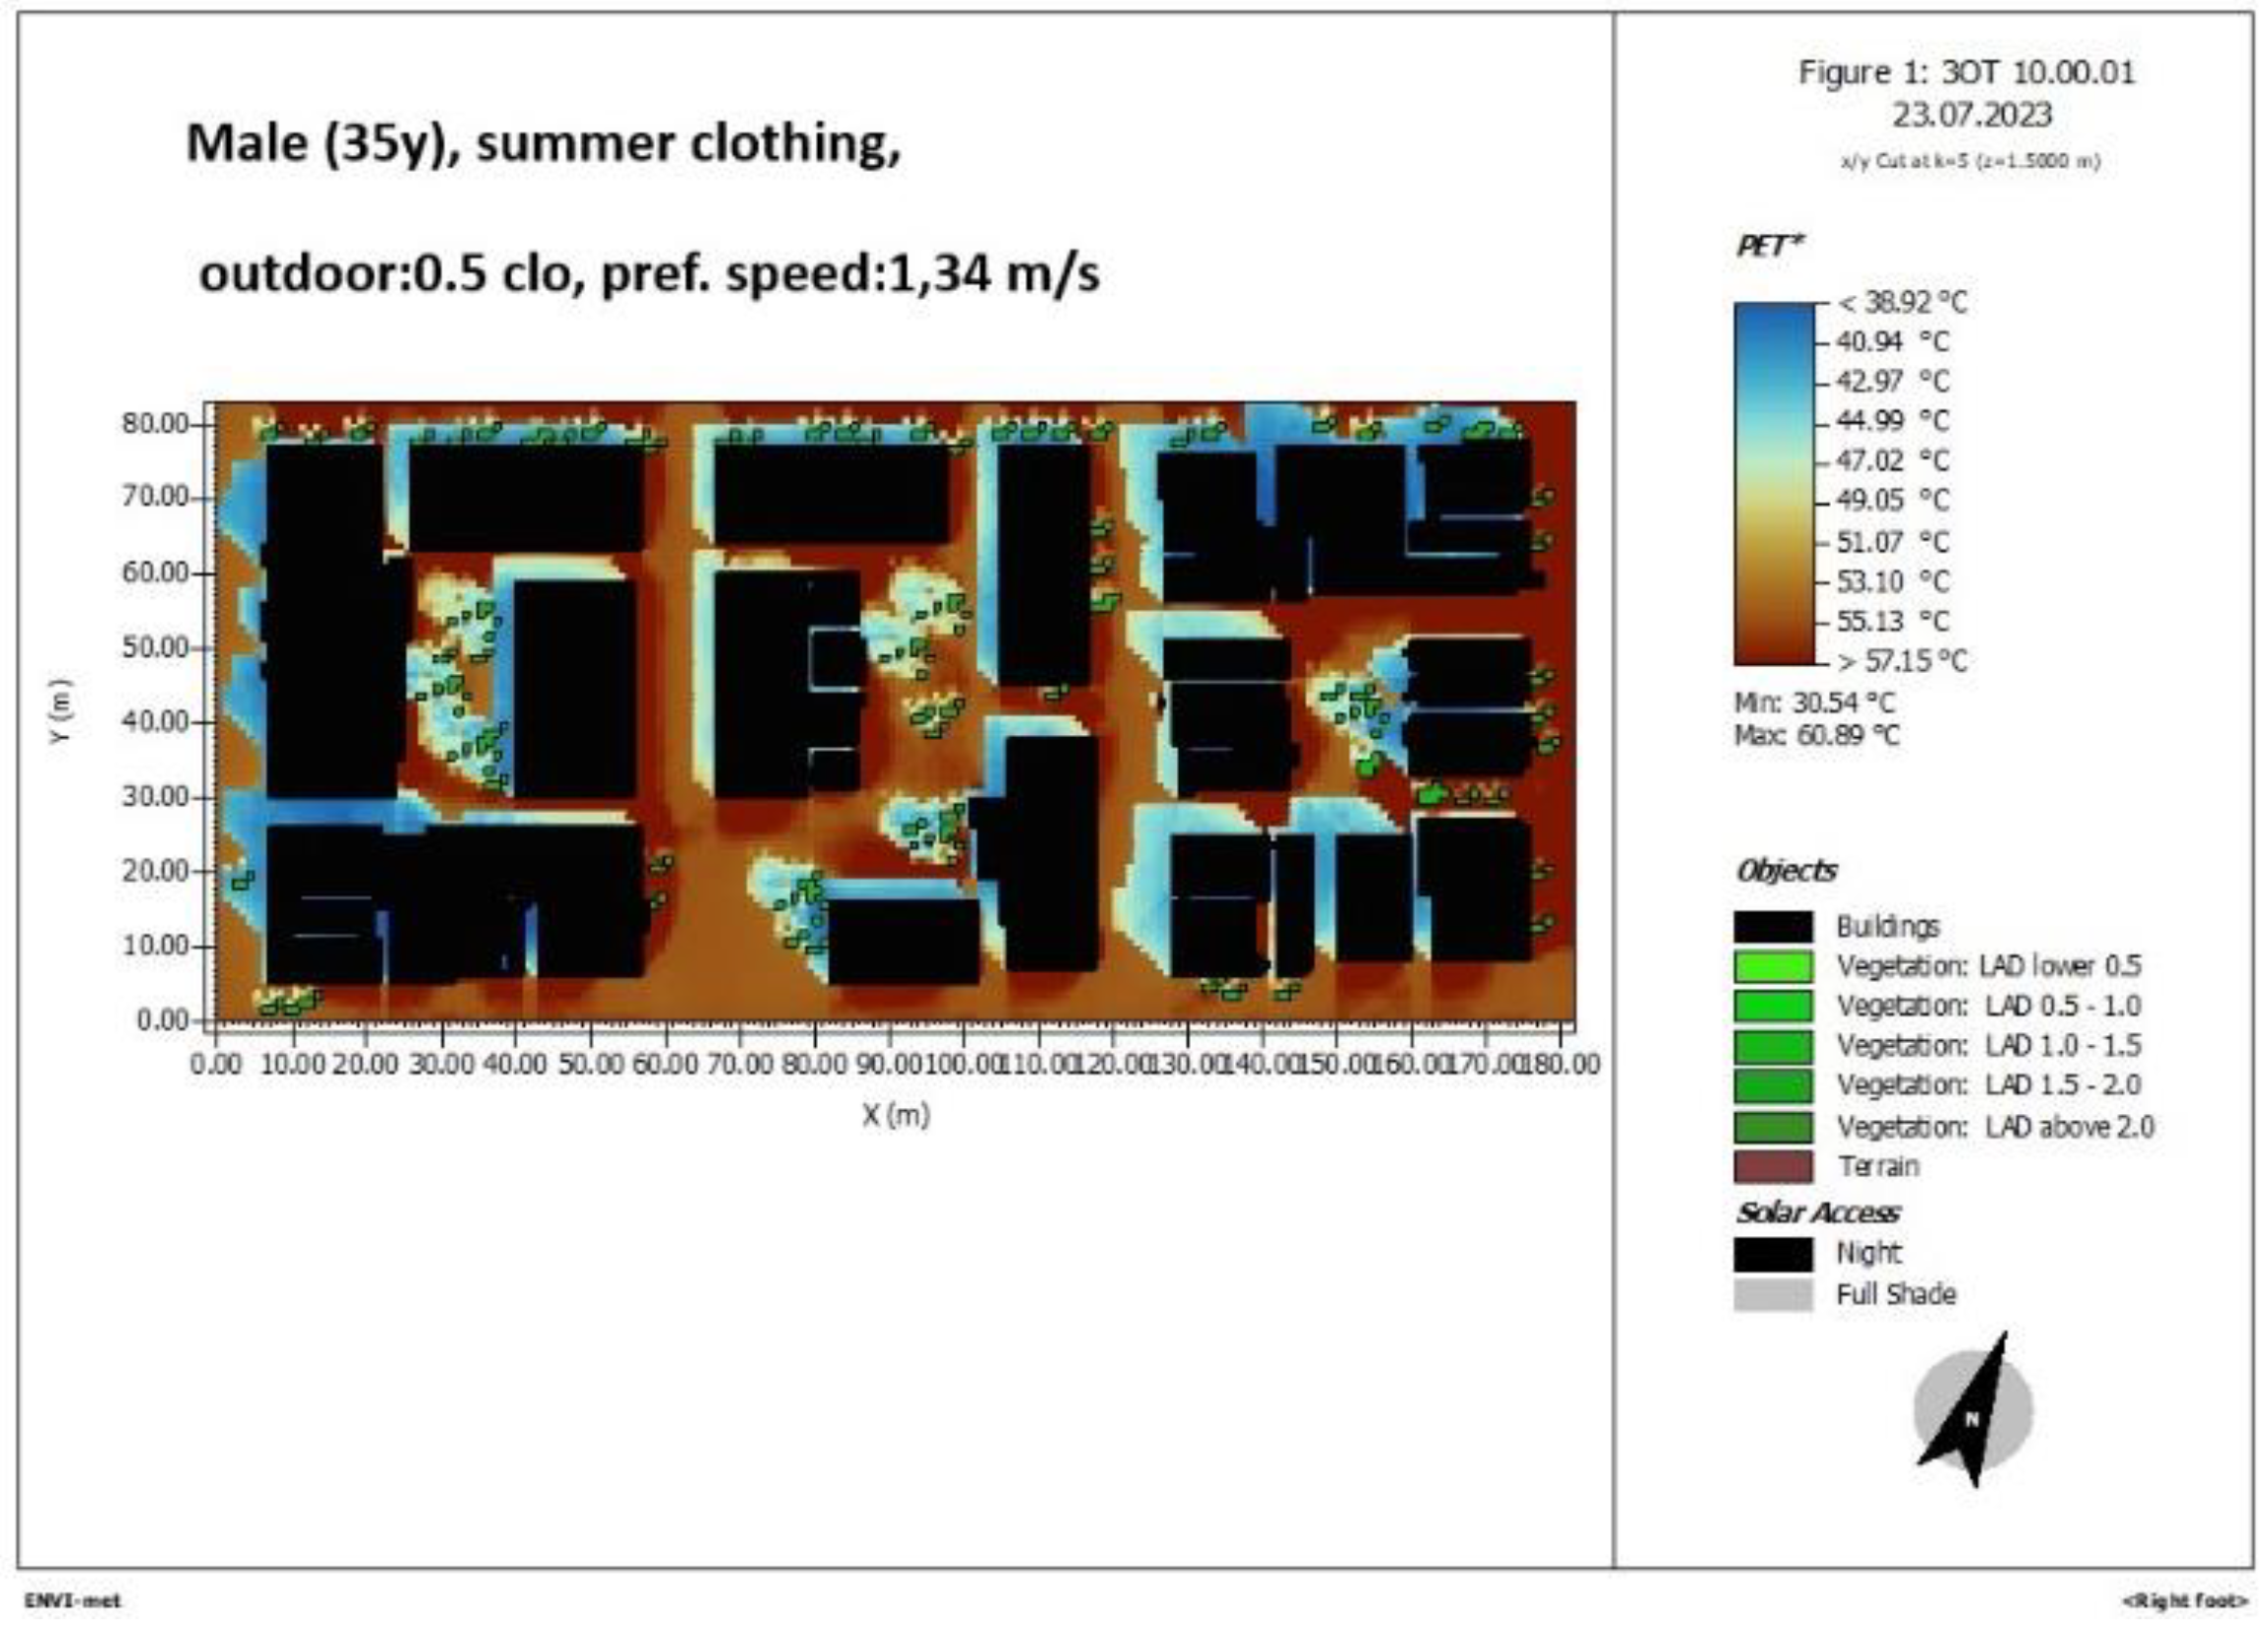
Figure 10.
ENVI-met simulation of the area of study, PET 10 a.m., female 35 years old, summer clothing, 0.5 clo, pref.speed 1,34m/s.
Figure 10.
ENVI-met simulation of the area of study, PET 10 a.m., female 35 years old, summer clothing, 0.5 clo, pref.speed 1,34m/s.
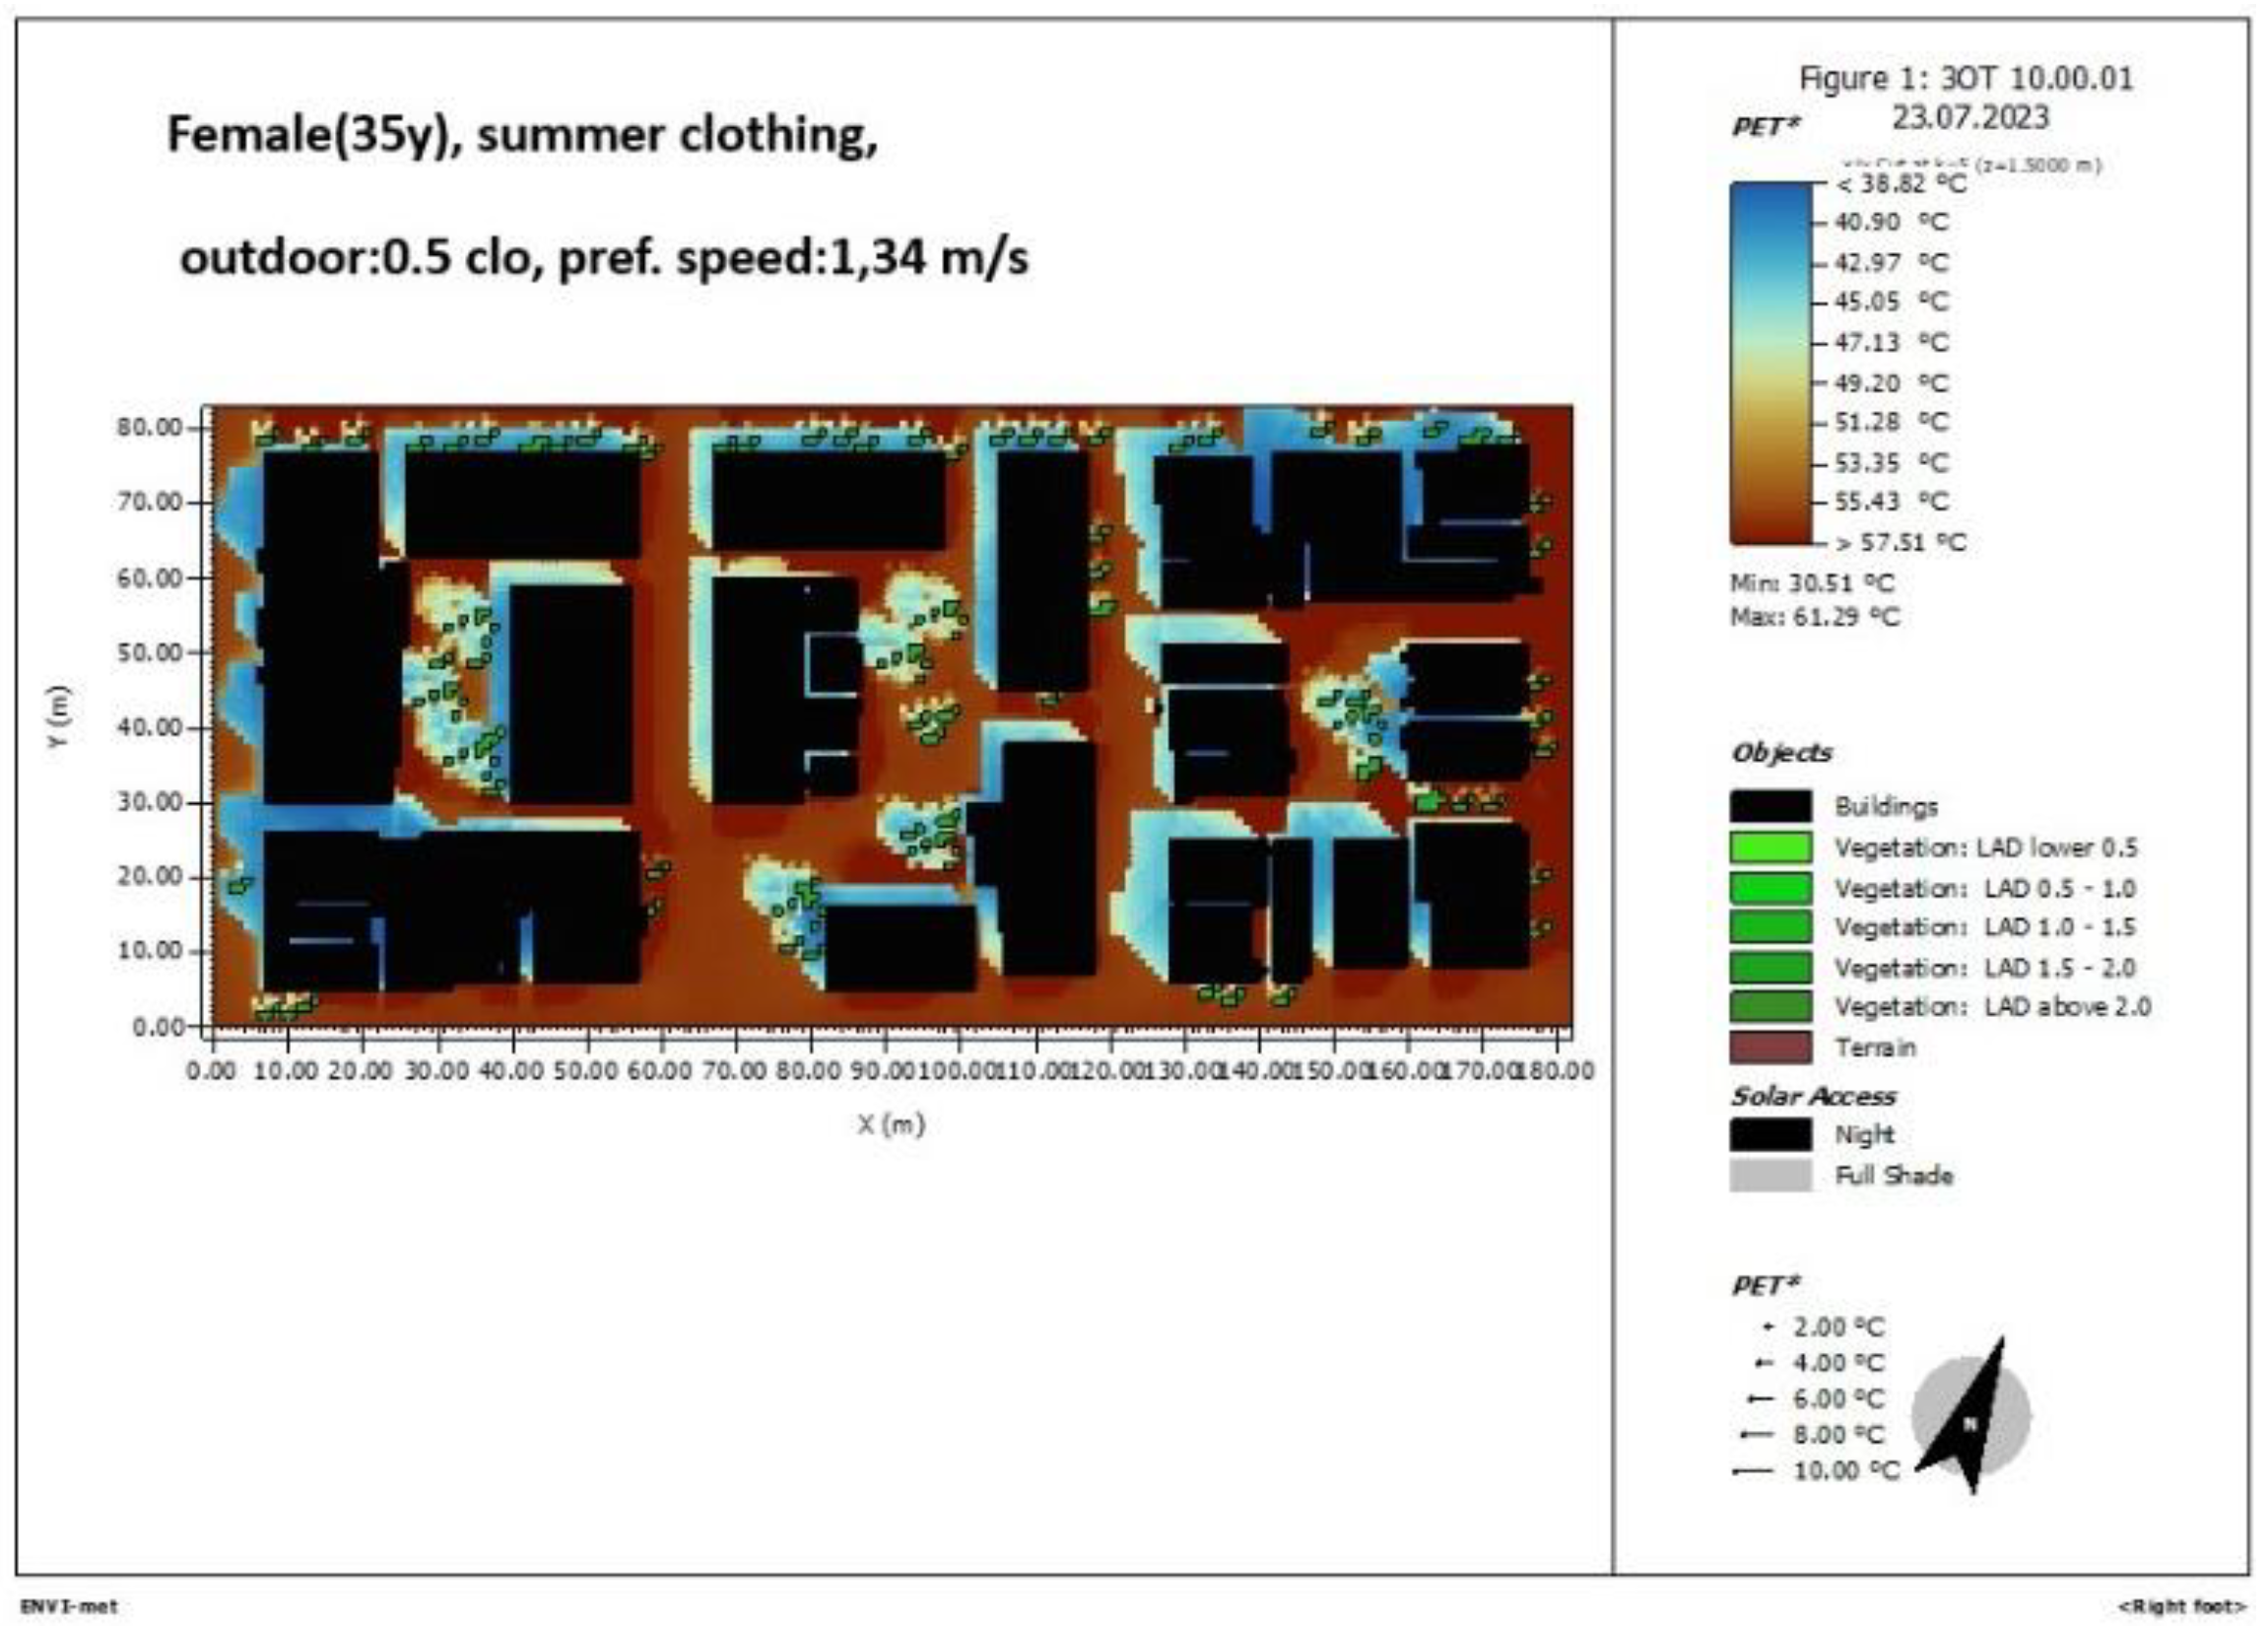
Figure 11.
ENVI-met simulation of the area of study, PET 10 a.m., old person 80y male, summer clothing, 0.5 clo, pref.speed 0.90 m/s.
Figure 11.
ENVI-met simulation of the area of study, PET 10 a.m., old person 80y male, summer clothing, 0.5 clo, pref.speed 0.90 m/s.
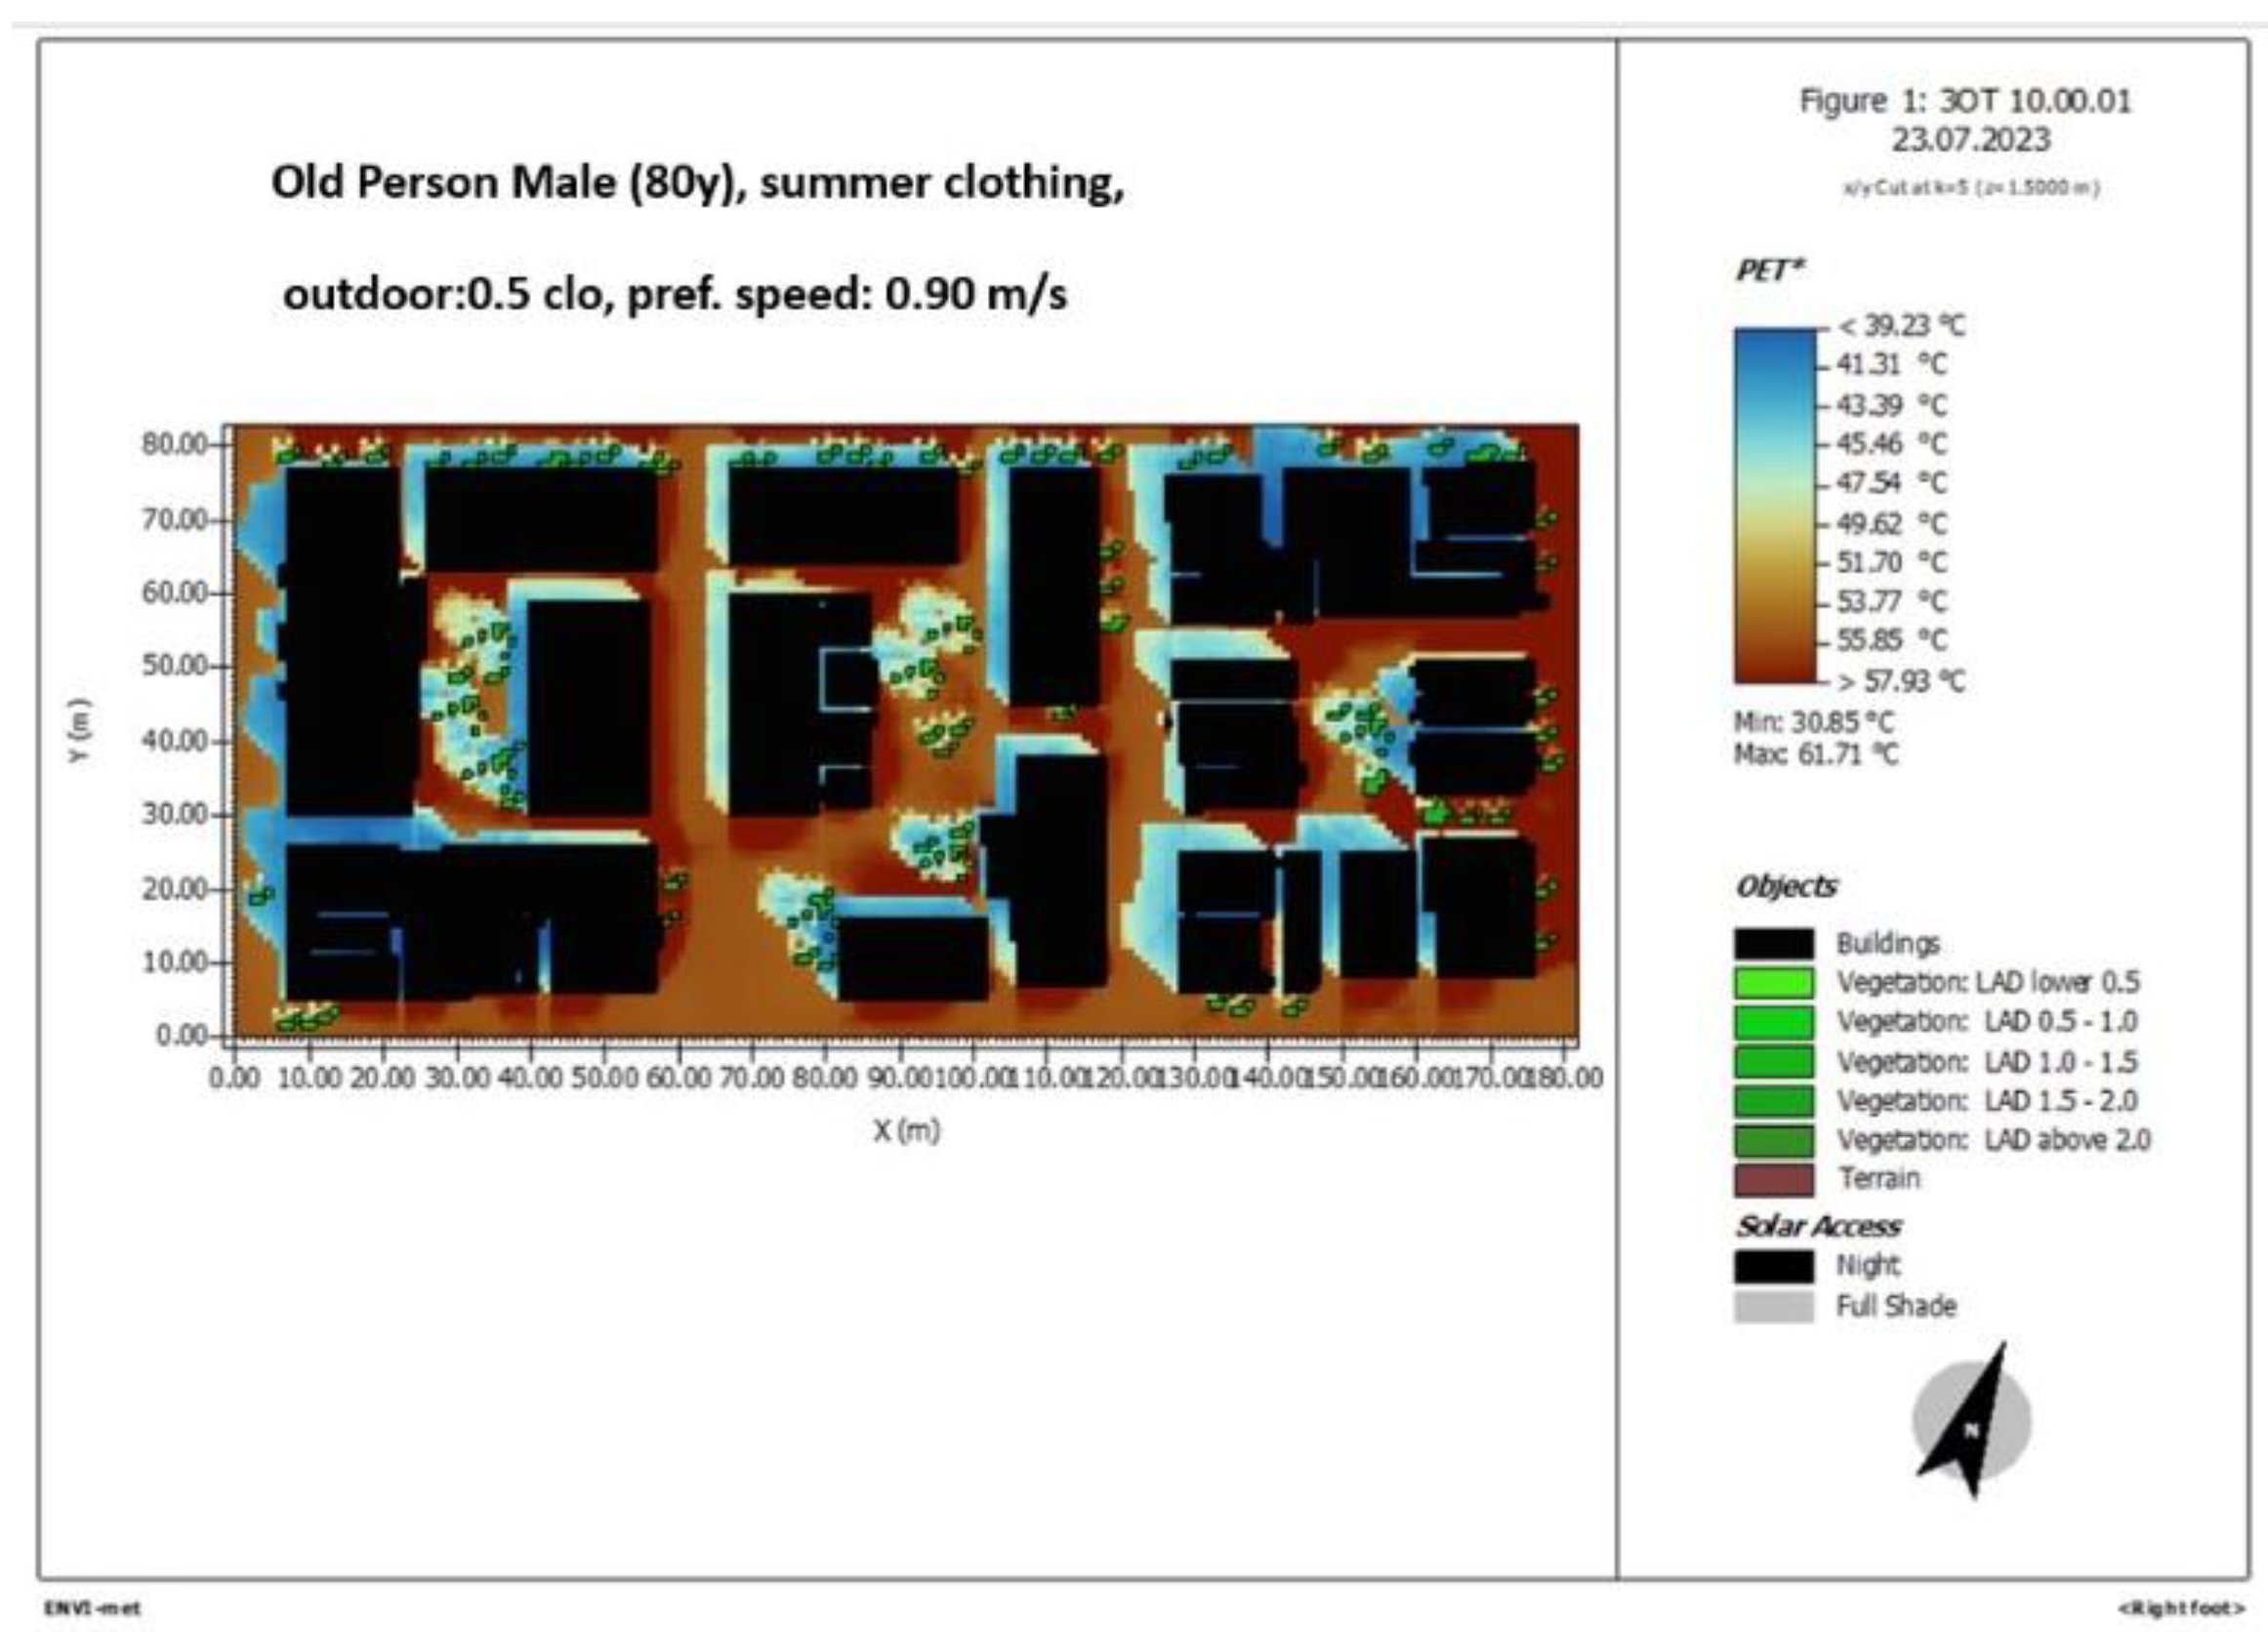
Figure 12.
ENVI-met simulation of the area of study, PET 10 a.m., child male 8y, summer clothing, 0.5 clo, pref.speed 1.10 m/s.
Figure 12.
ENVI-met simulation of the area of study, PET 10 a.m., child male 8y, summer clothing, 0.5 clo, pref.speed 1.10 m/s.
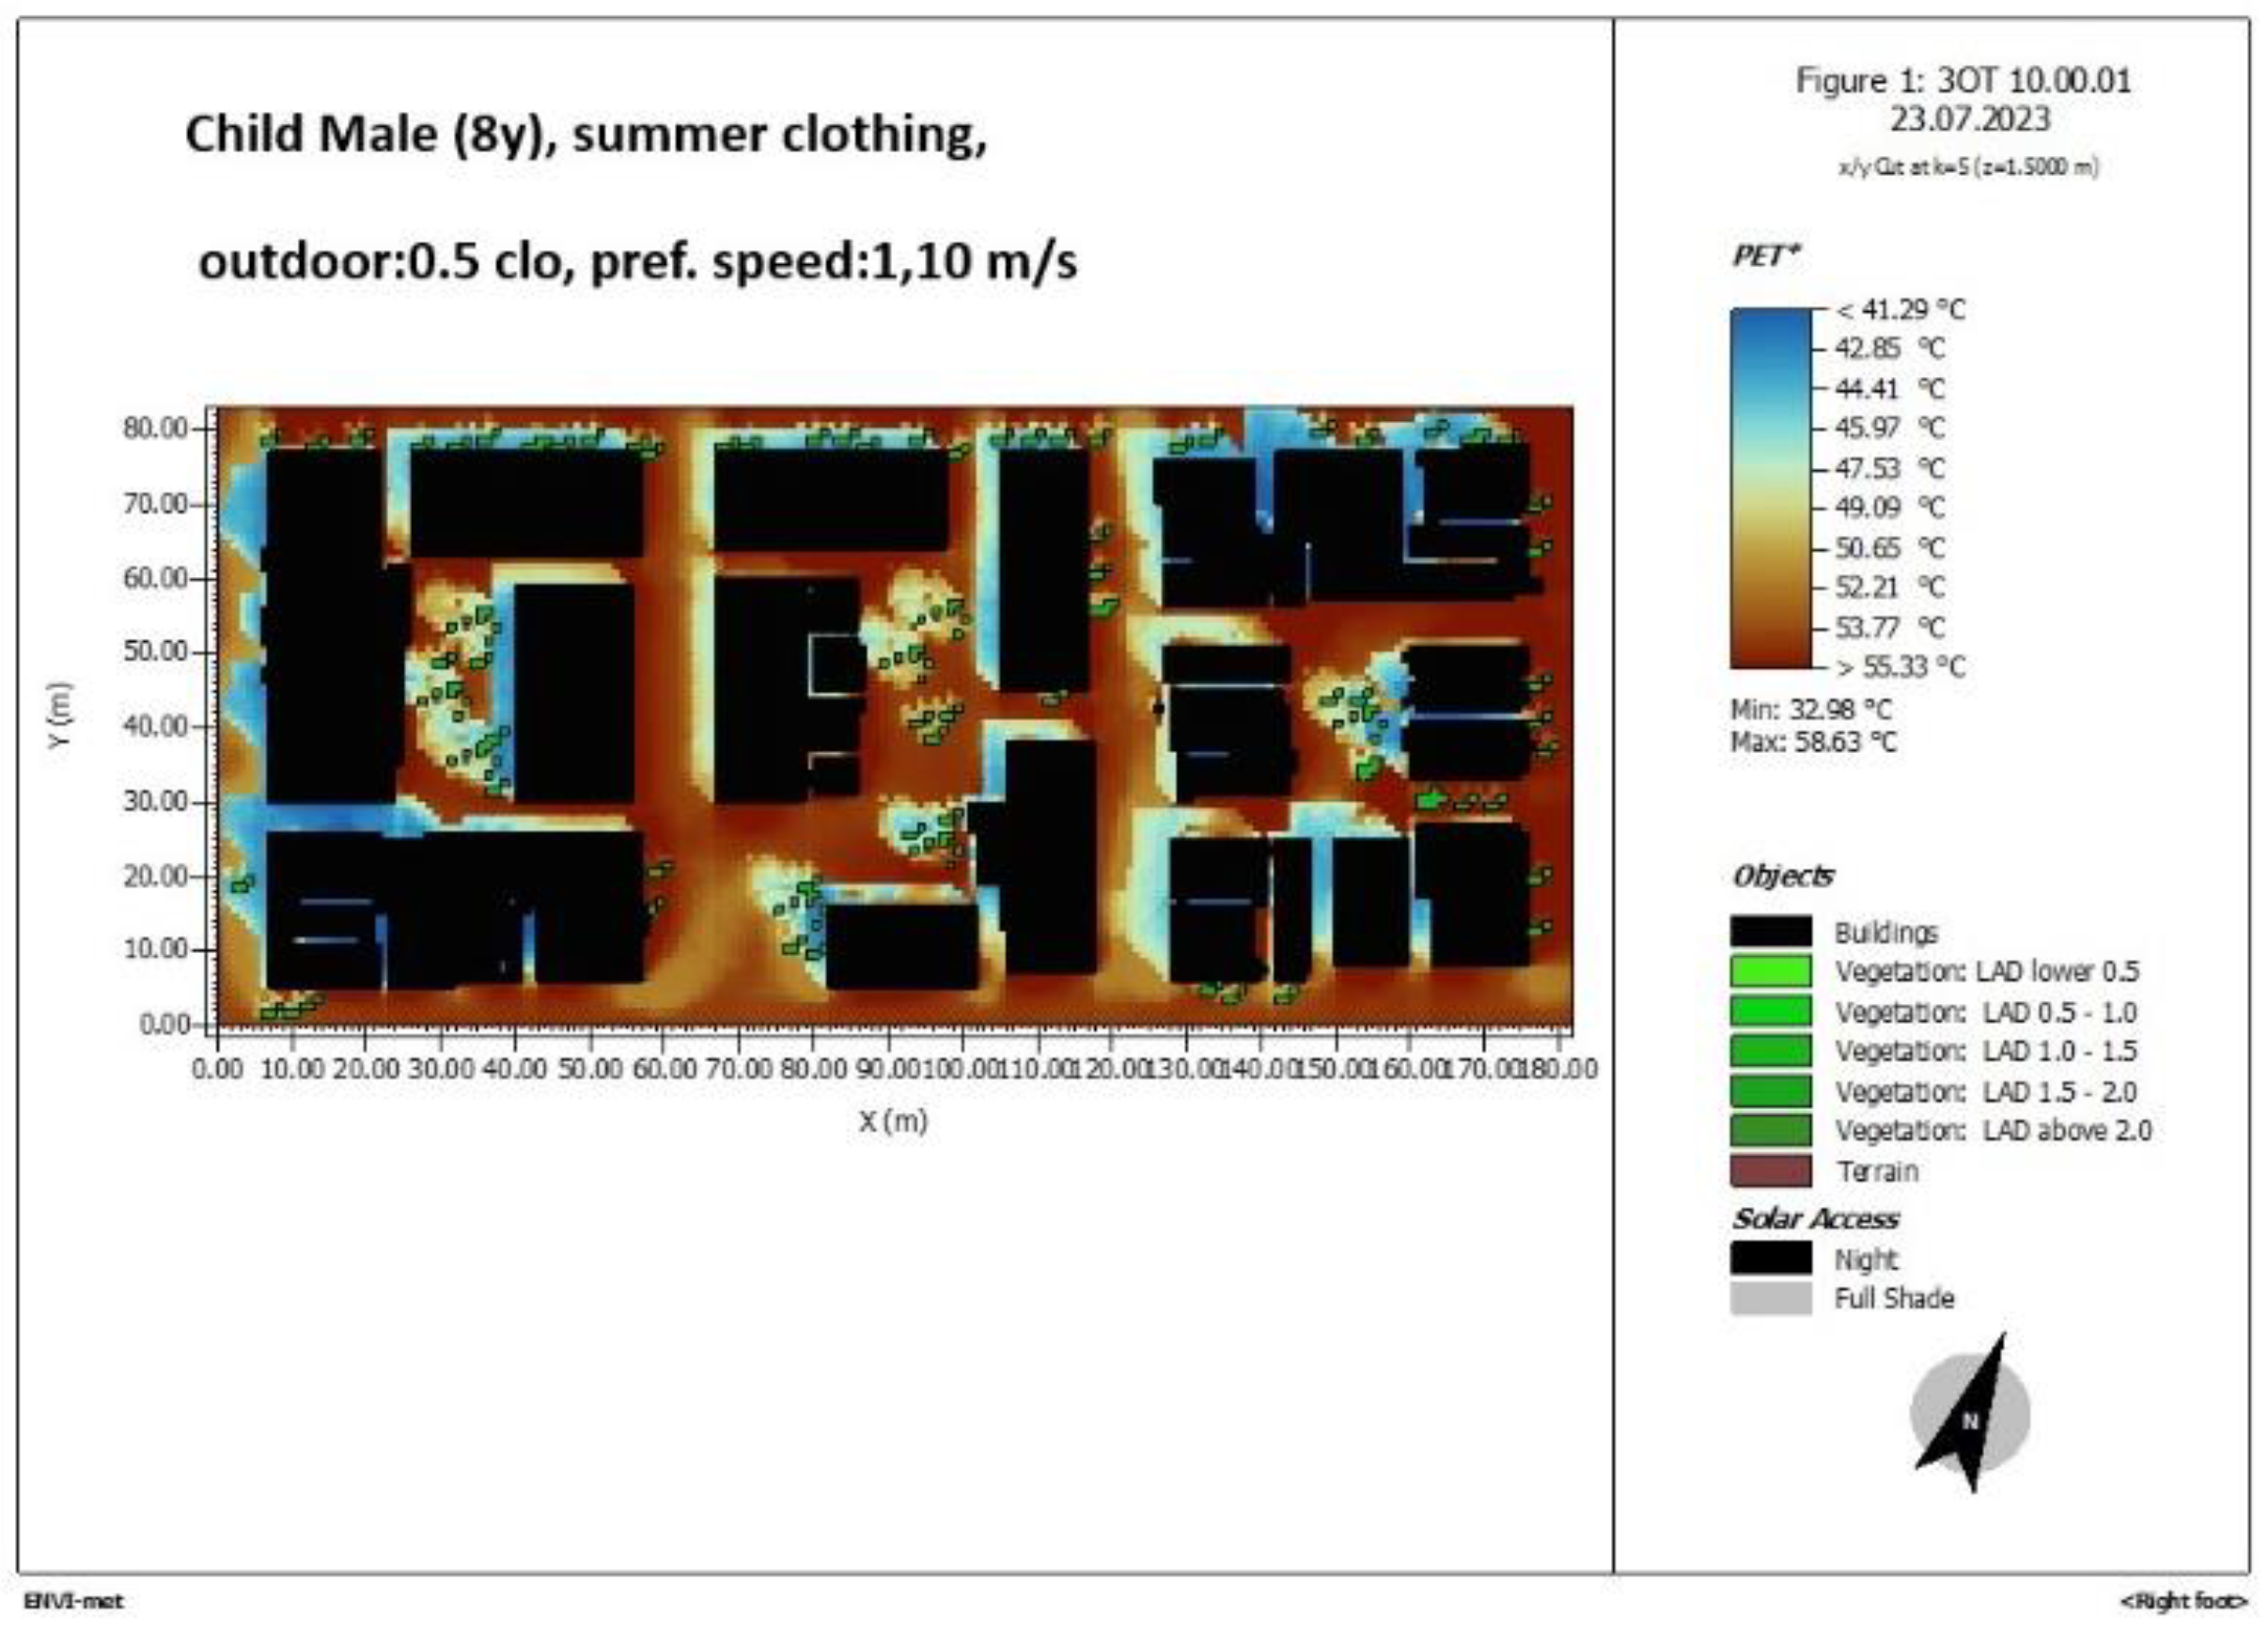
Figure 13.
ENVI-met simulation of the area of study, PET 3 p.m., male 35y, summer clothing, 0.5 clo, pref.speed 1.34 m/s .
Figure 13.
ENVI-met simulation of the area of study, PET 3 p.m., male 35y, summer clothing, 0.5 clo, pref.speed 1.34 m/s .
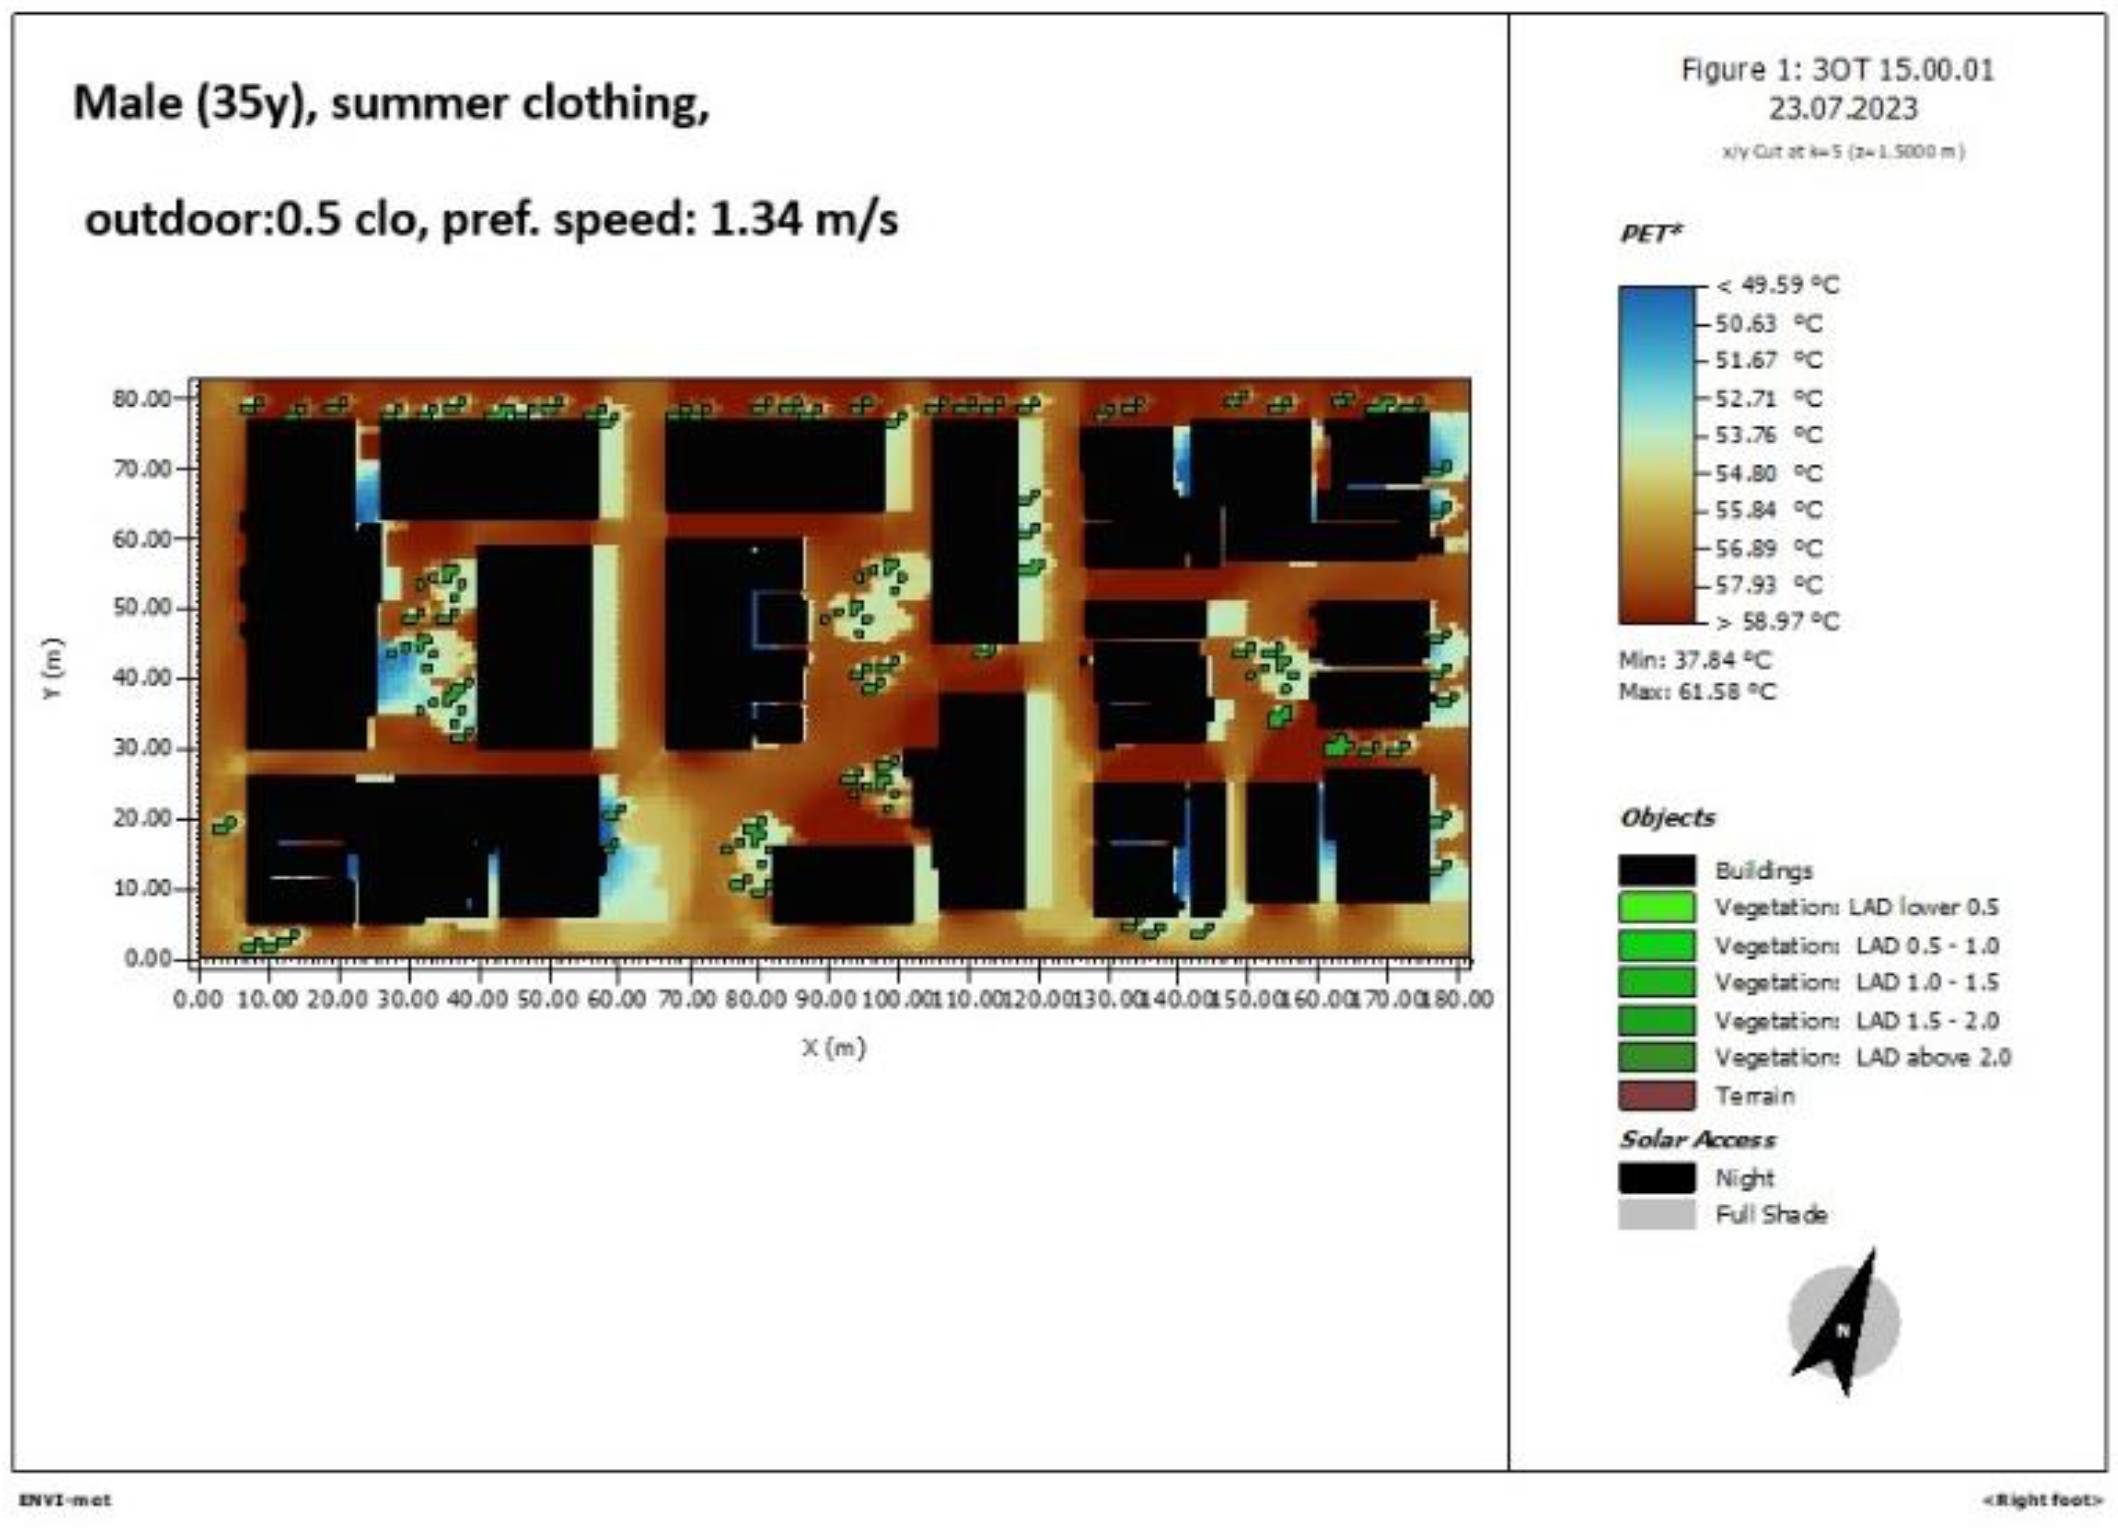
Figure 14.
ENVI-met simulation of the area of study, PET 3 p.m., female 35y, summer clothing, 0.5 clo, pref.speed 1.34 m/s .
Figure 14.
ENVI-met simulation of the area of study, PET 3 p.m., female 35y, summer clothing, 0.5 clo, pref.speed 1.34 m/s .
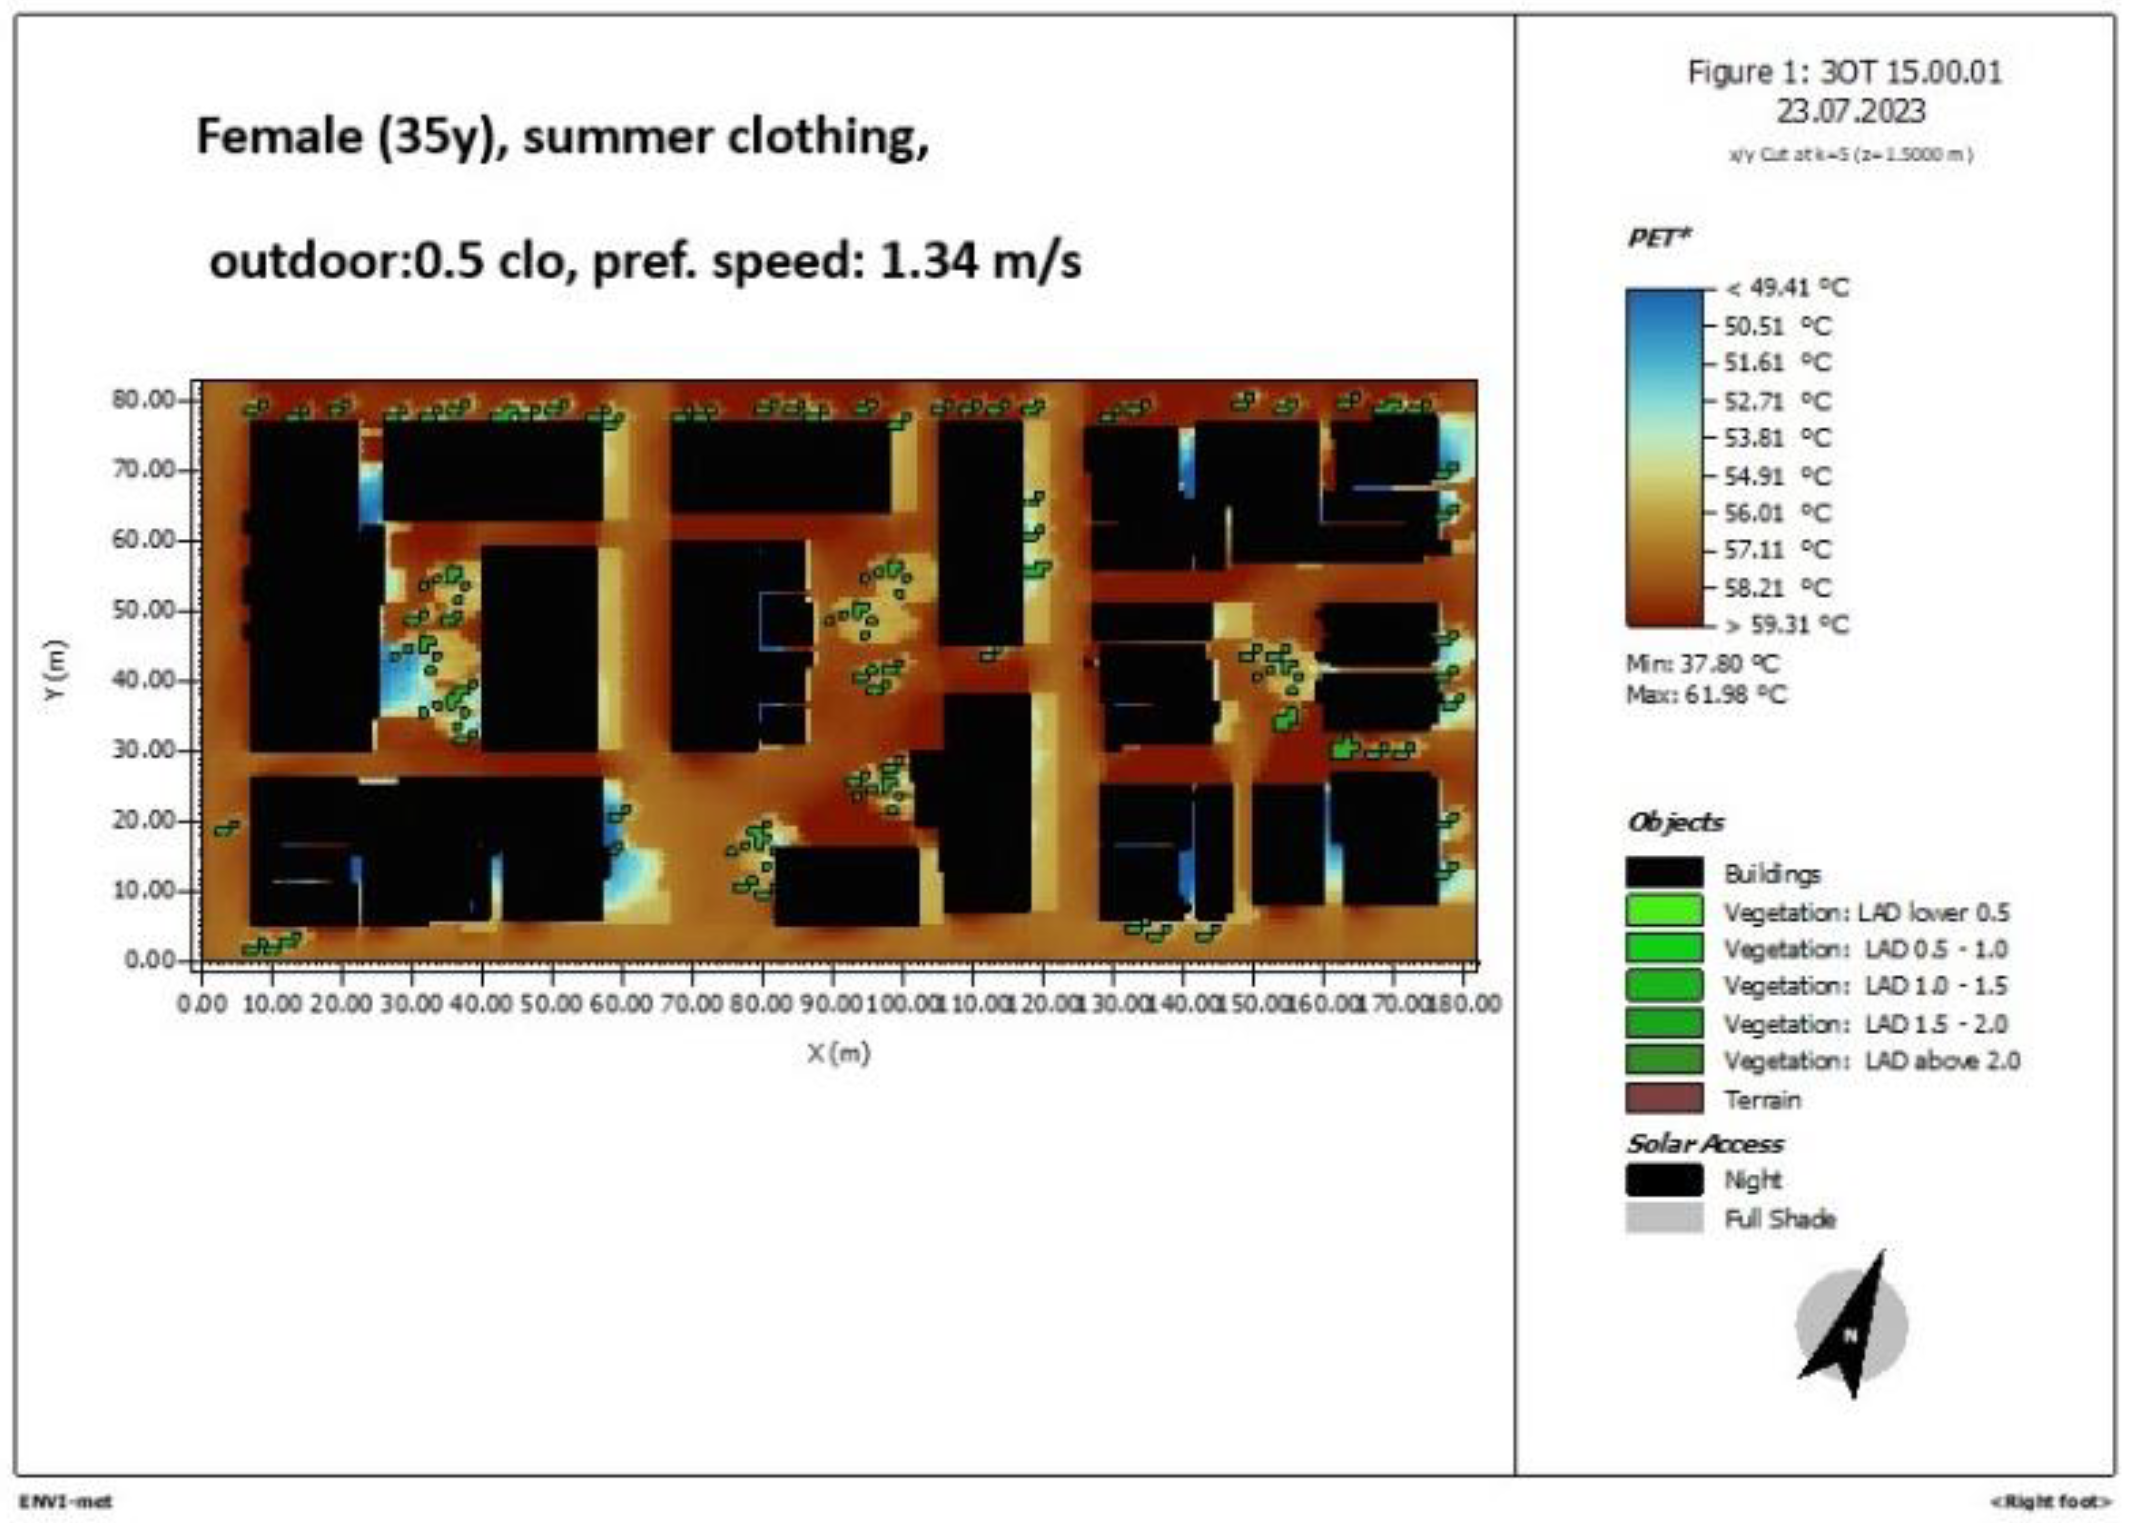
Figure 15.
ENVI-met simulation of the area of study, PET 3 p.m., old person male 80y, summer clothing, 0.5 clo, pref.speed 0.90 m/s.
Figure 15.
ENVI-met simulation of the area of study, PET 3 p.m., old person male 80y, summer clothing, 0.5 clo, pref.speed 0.90 m/s.
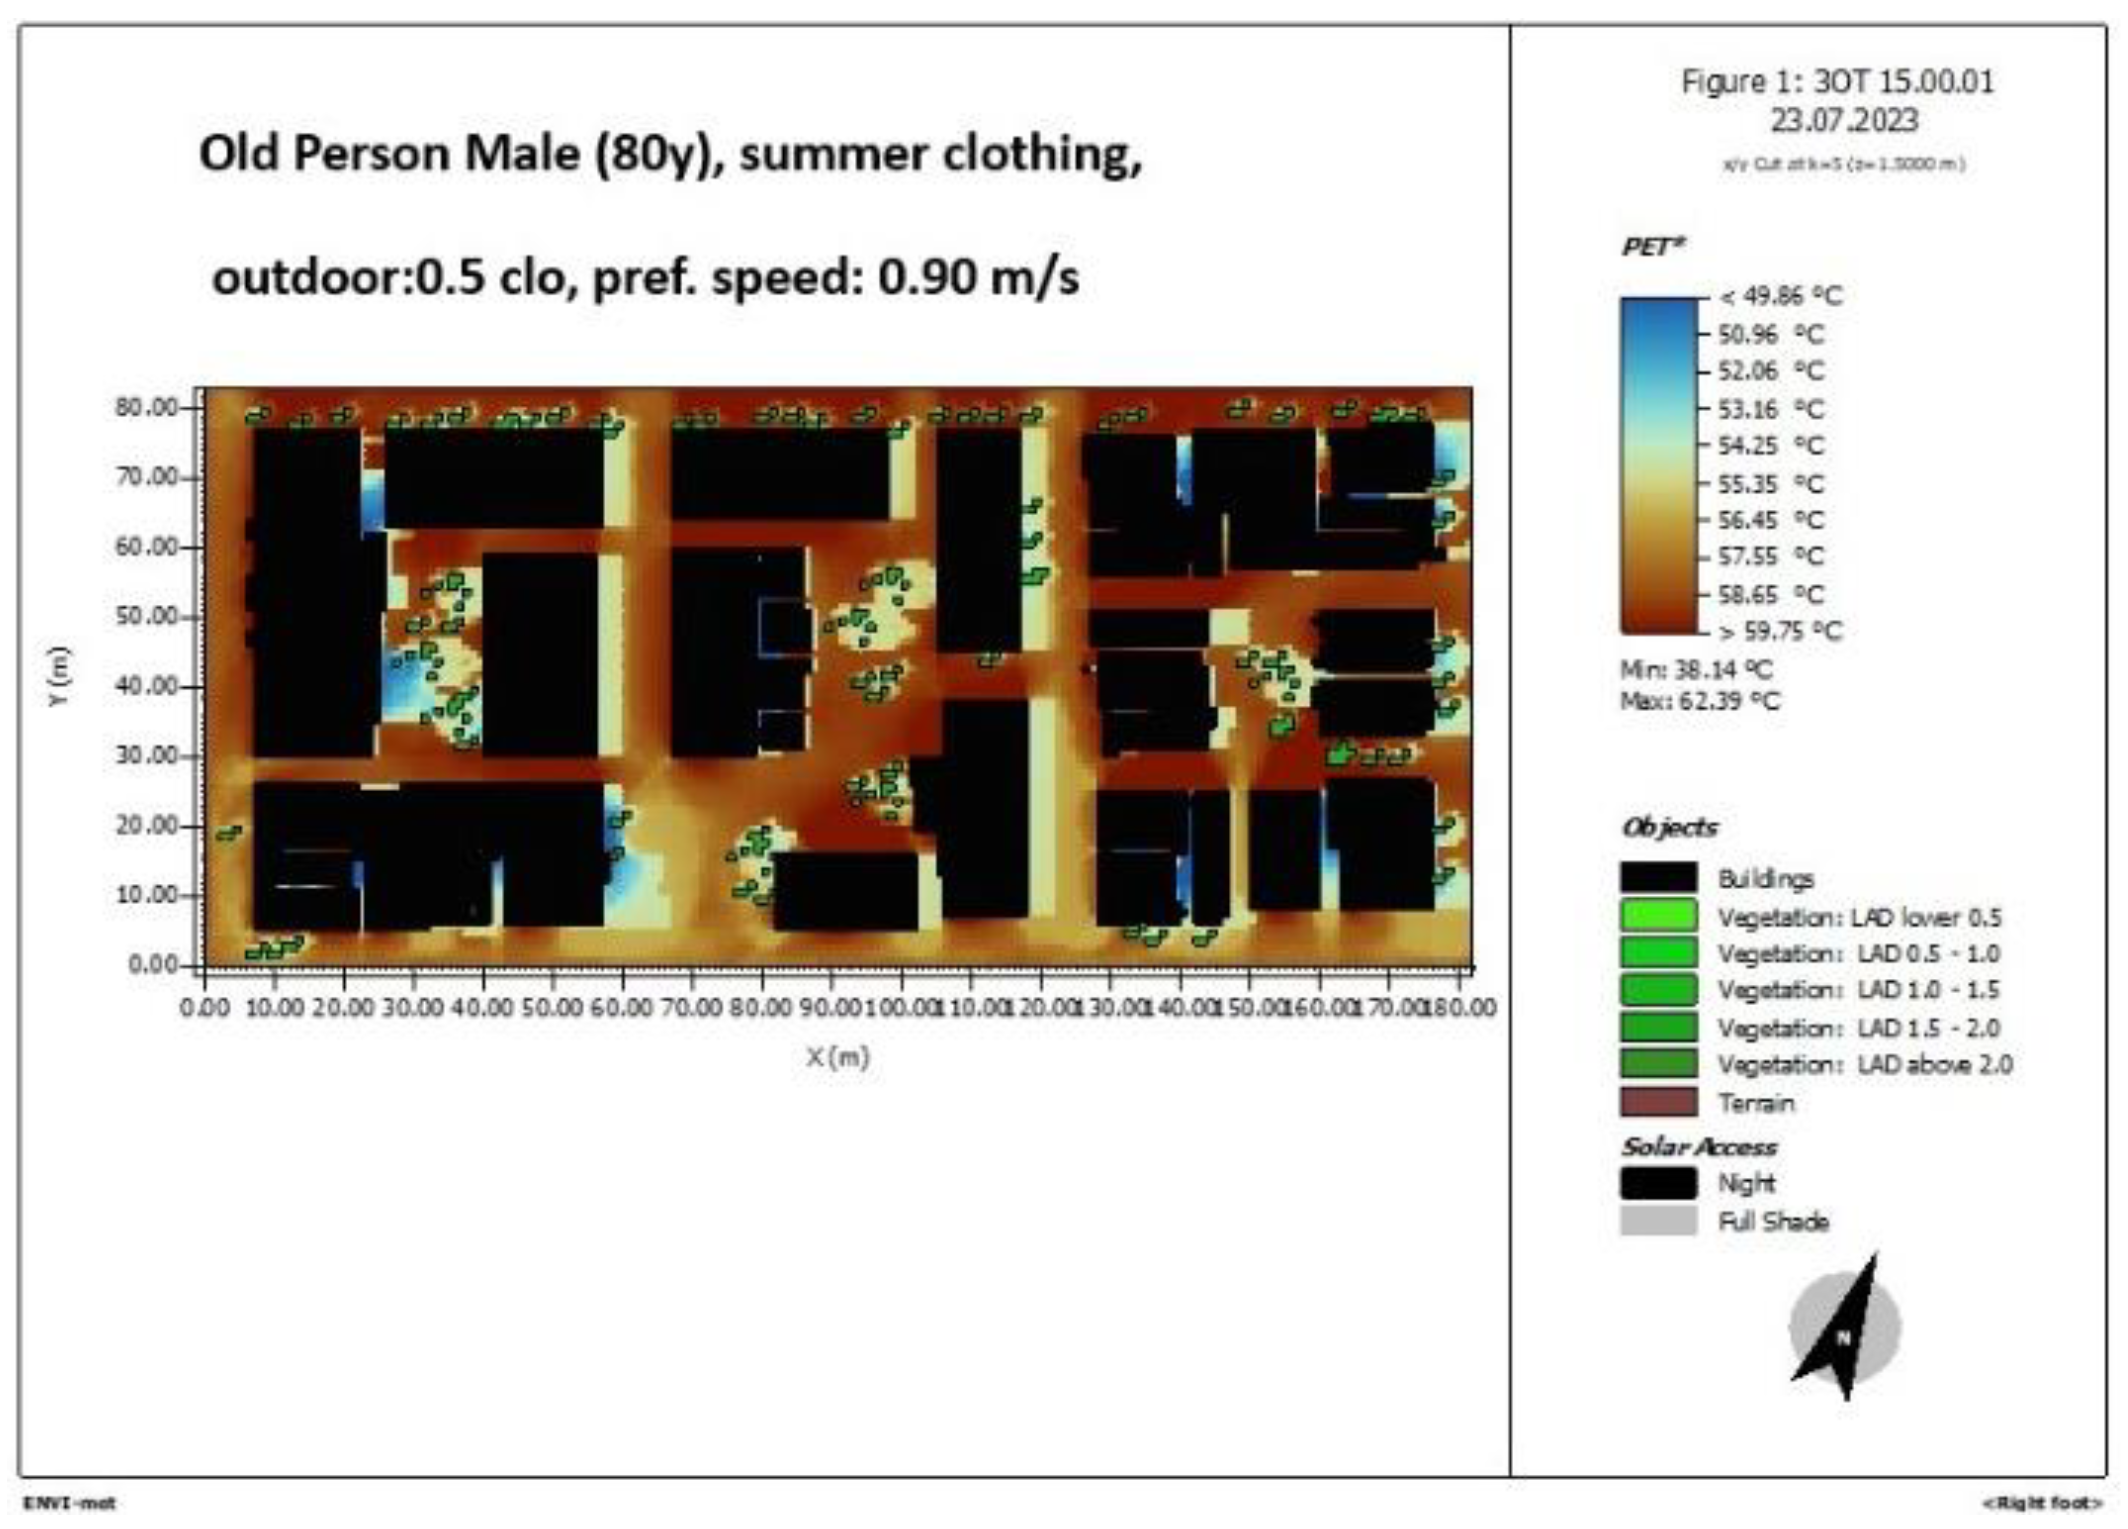
Figure 16.
ENVI-met simulation of the area of study, PET 3 p.m., child male 8 y, summer clothing, 0.5 clo, pref.speed 1.10 m/s.
Figure 16.
ENVI-met simulation of the area of study, PET 3 p.m., child male 8 y, summer clothing, 0.5 clo, pref.speed 1.10 m/s.
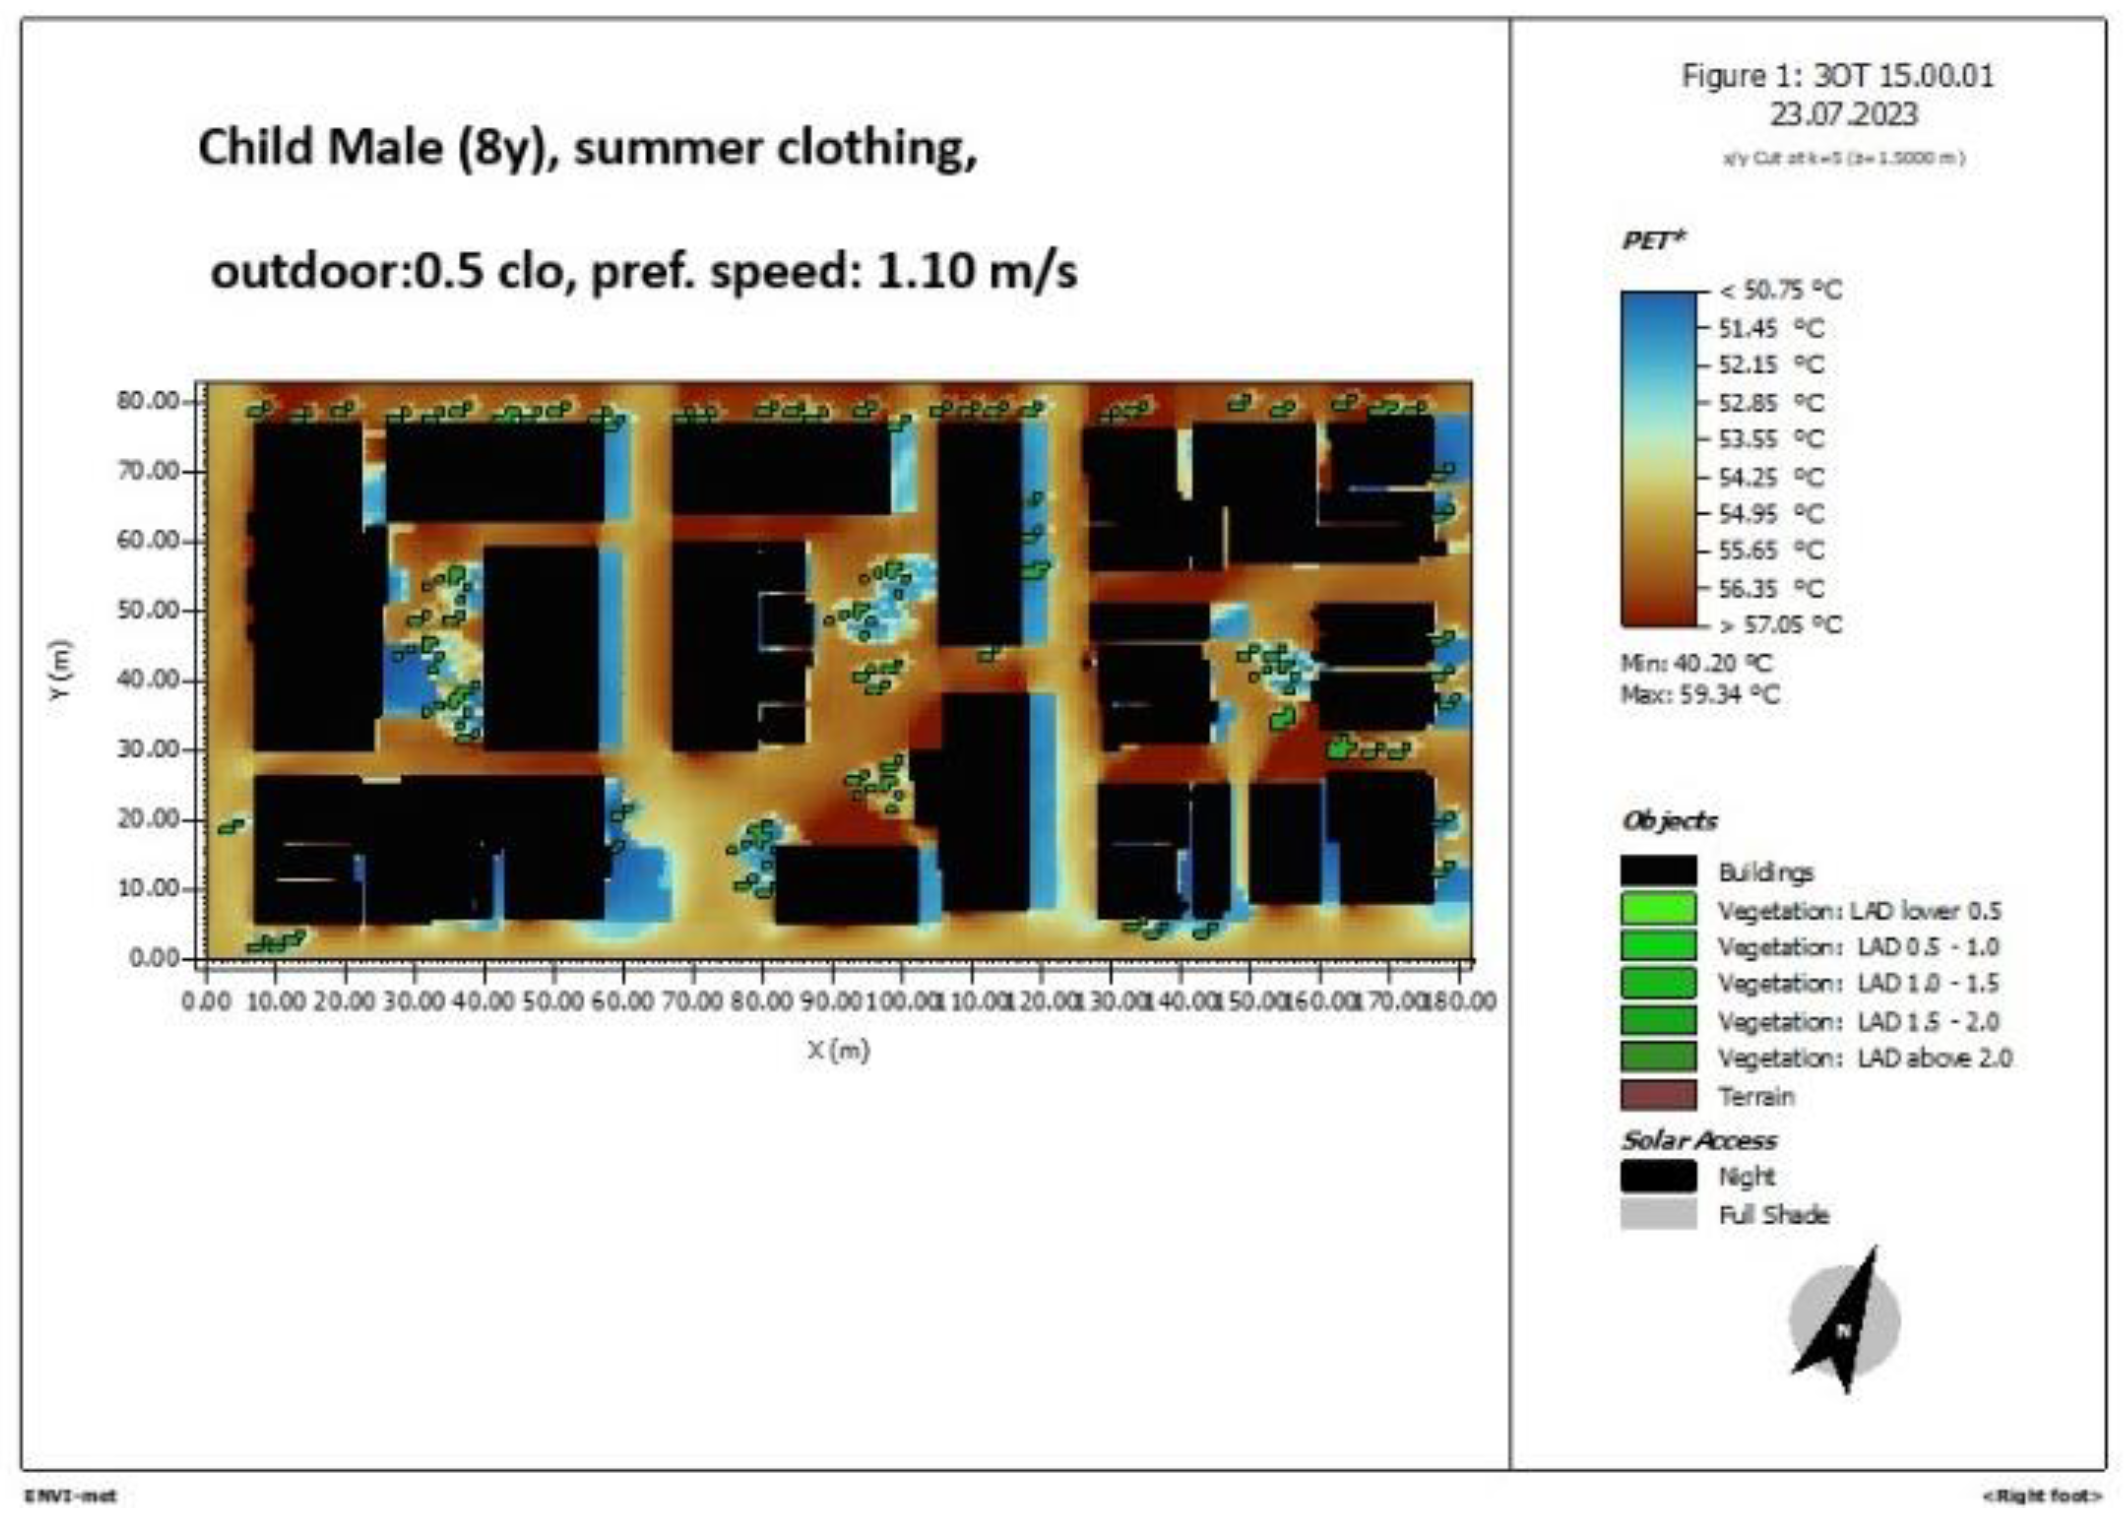
Figure 17.
ENVI-met simulation of the area of study, PET 8 p.m., male 35 y, summer clothing, 0.5 clo, pref.speed 1.34 m/s.
Figure 17.
ENVI-met simulation of the area of study, PET 8 p.m., male 35 y, summer clothing, 0.5 clo, pref.speed 1.34 m/s.
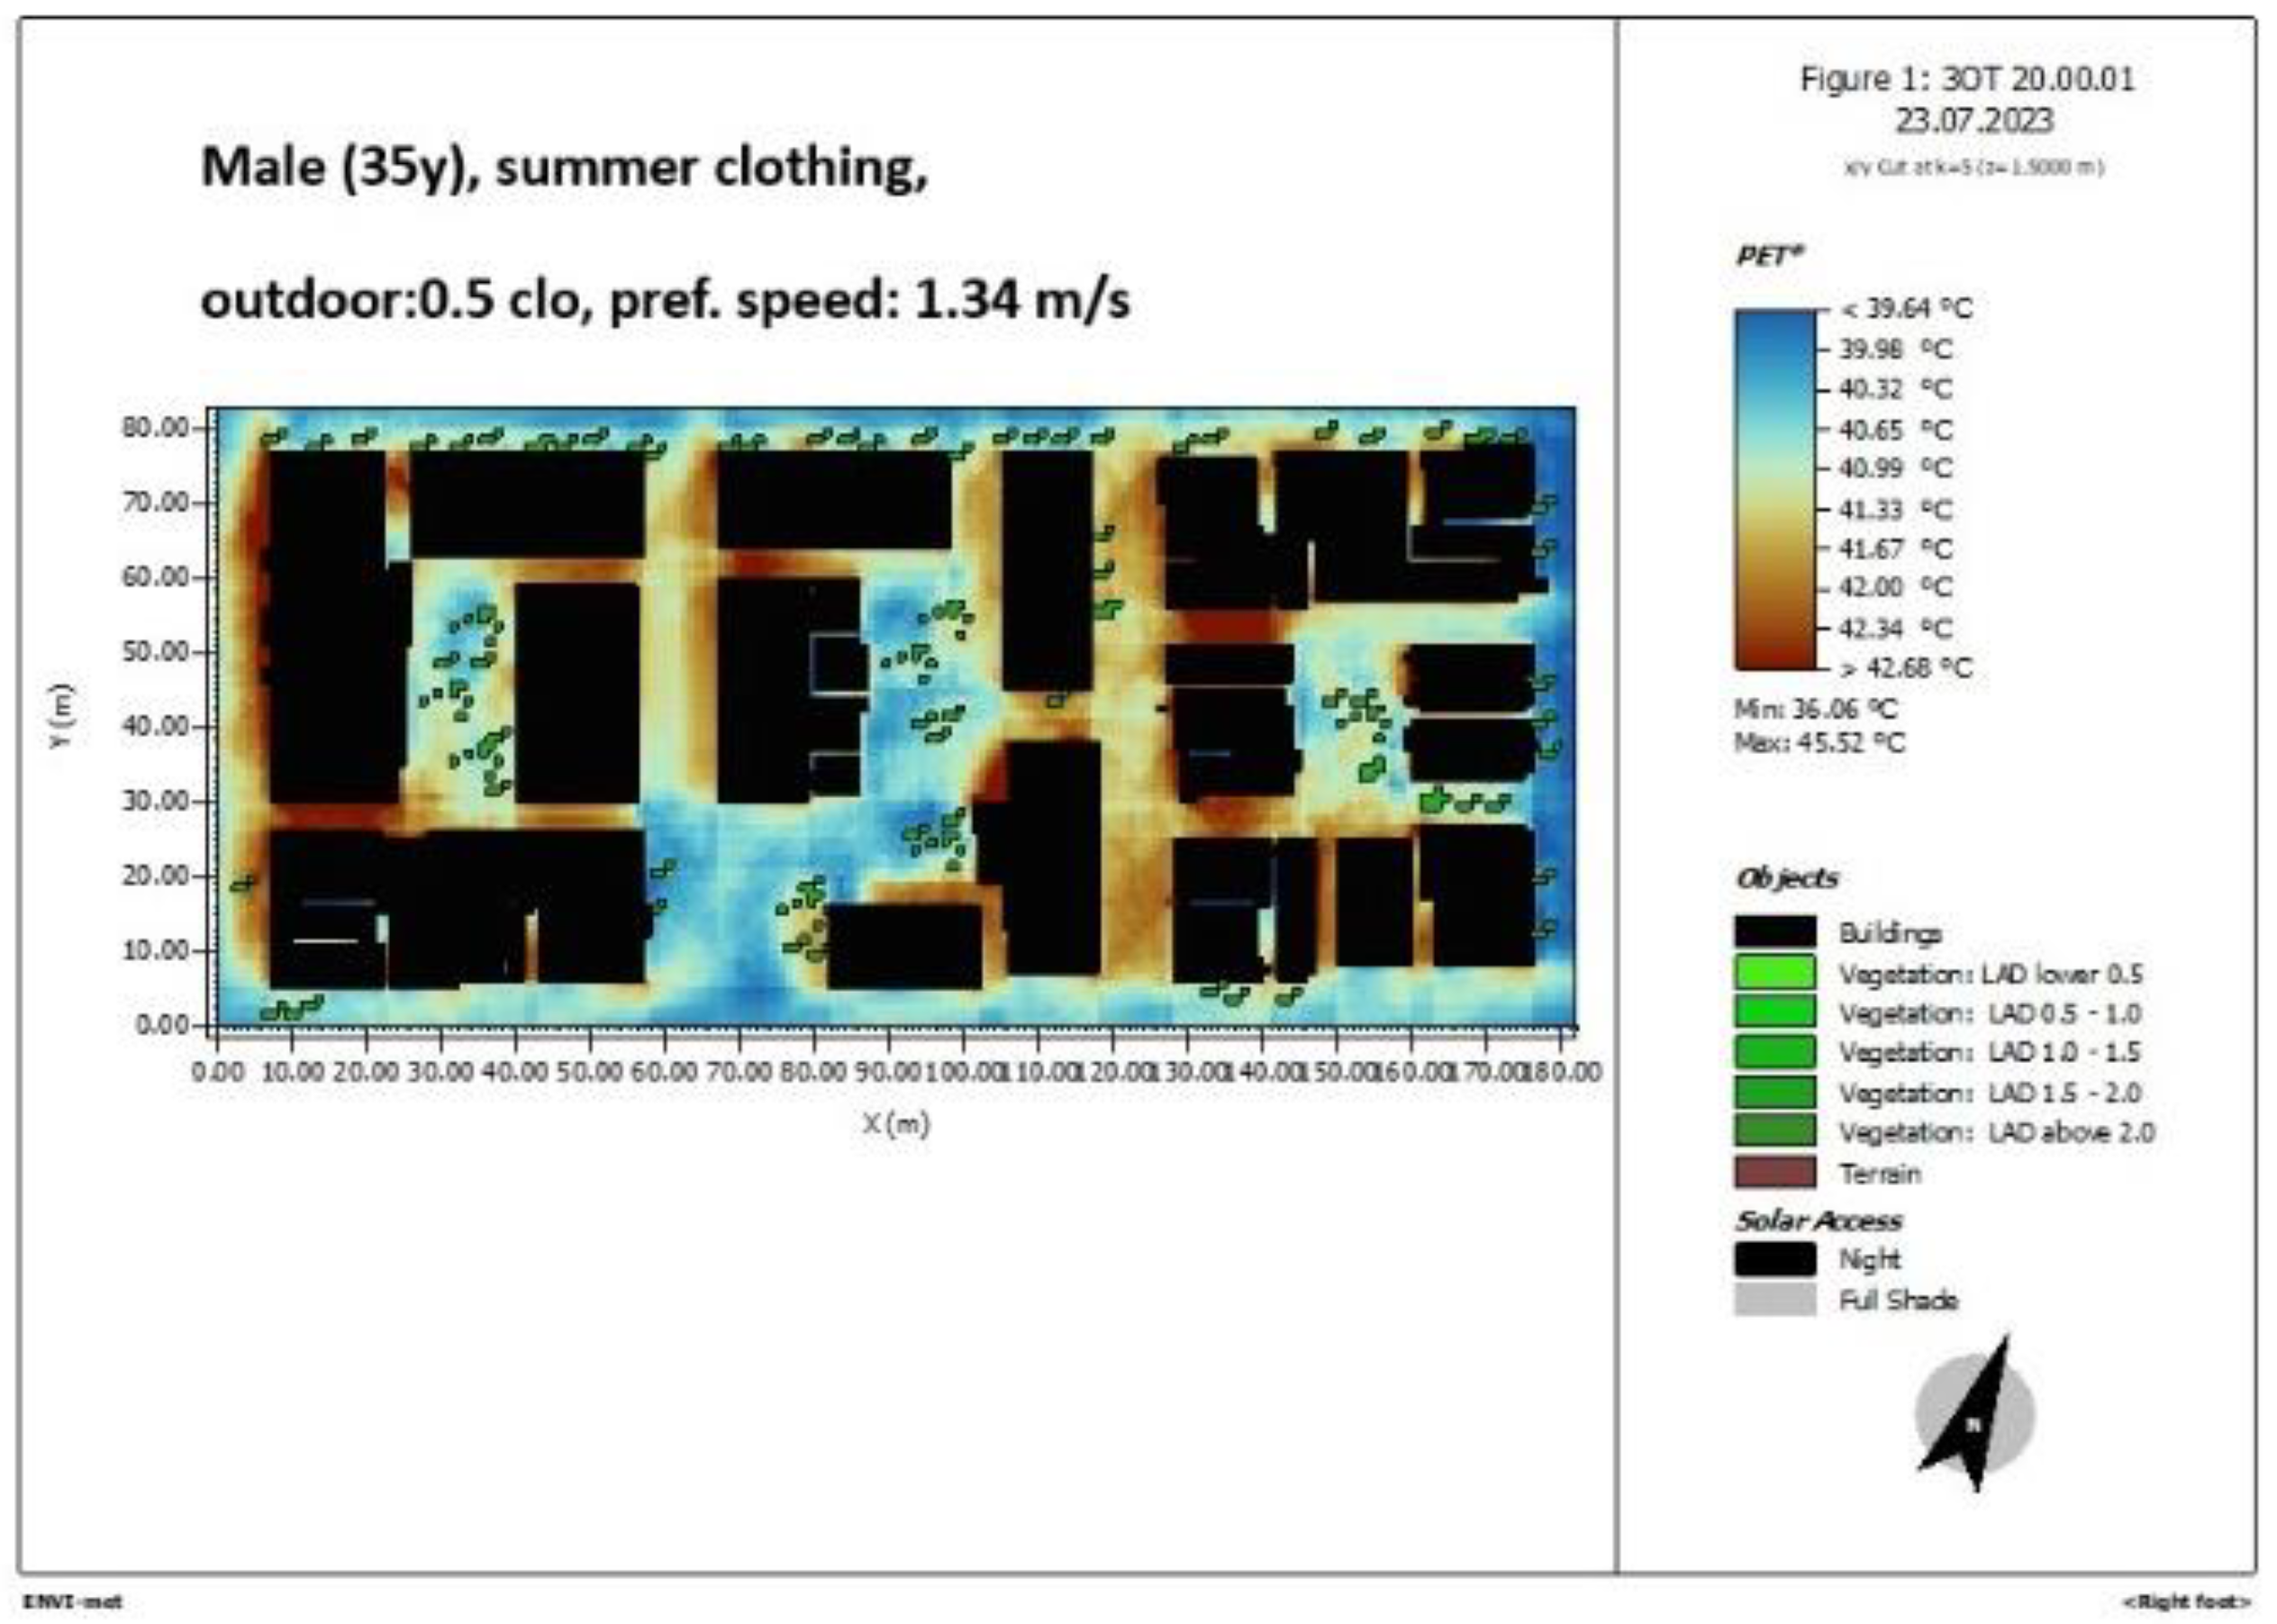
Figure 18.
ENVI-met simulation of the area of study, PET 8 p.m., female 35 y, summer clothing, 0.5 clo, pref.speed 1.34 m/s.
Figure 18.
ENVI-met simulation of the area of study, PET 8 p.m., female 35 y, summer clothing, 0.5 clo, pref.speed 1.34 m/s.
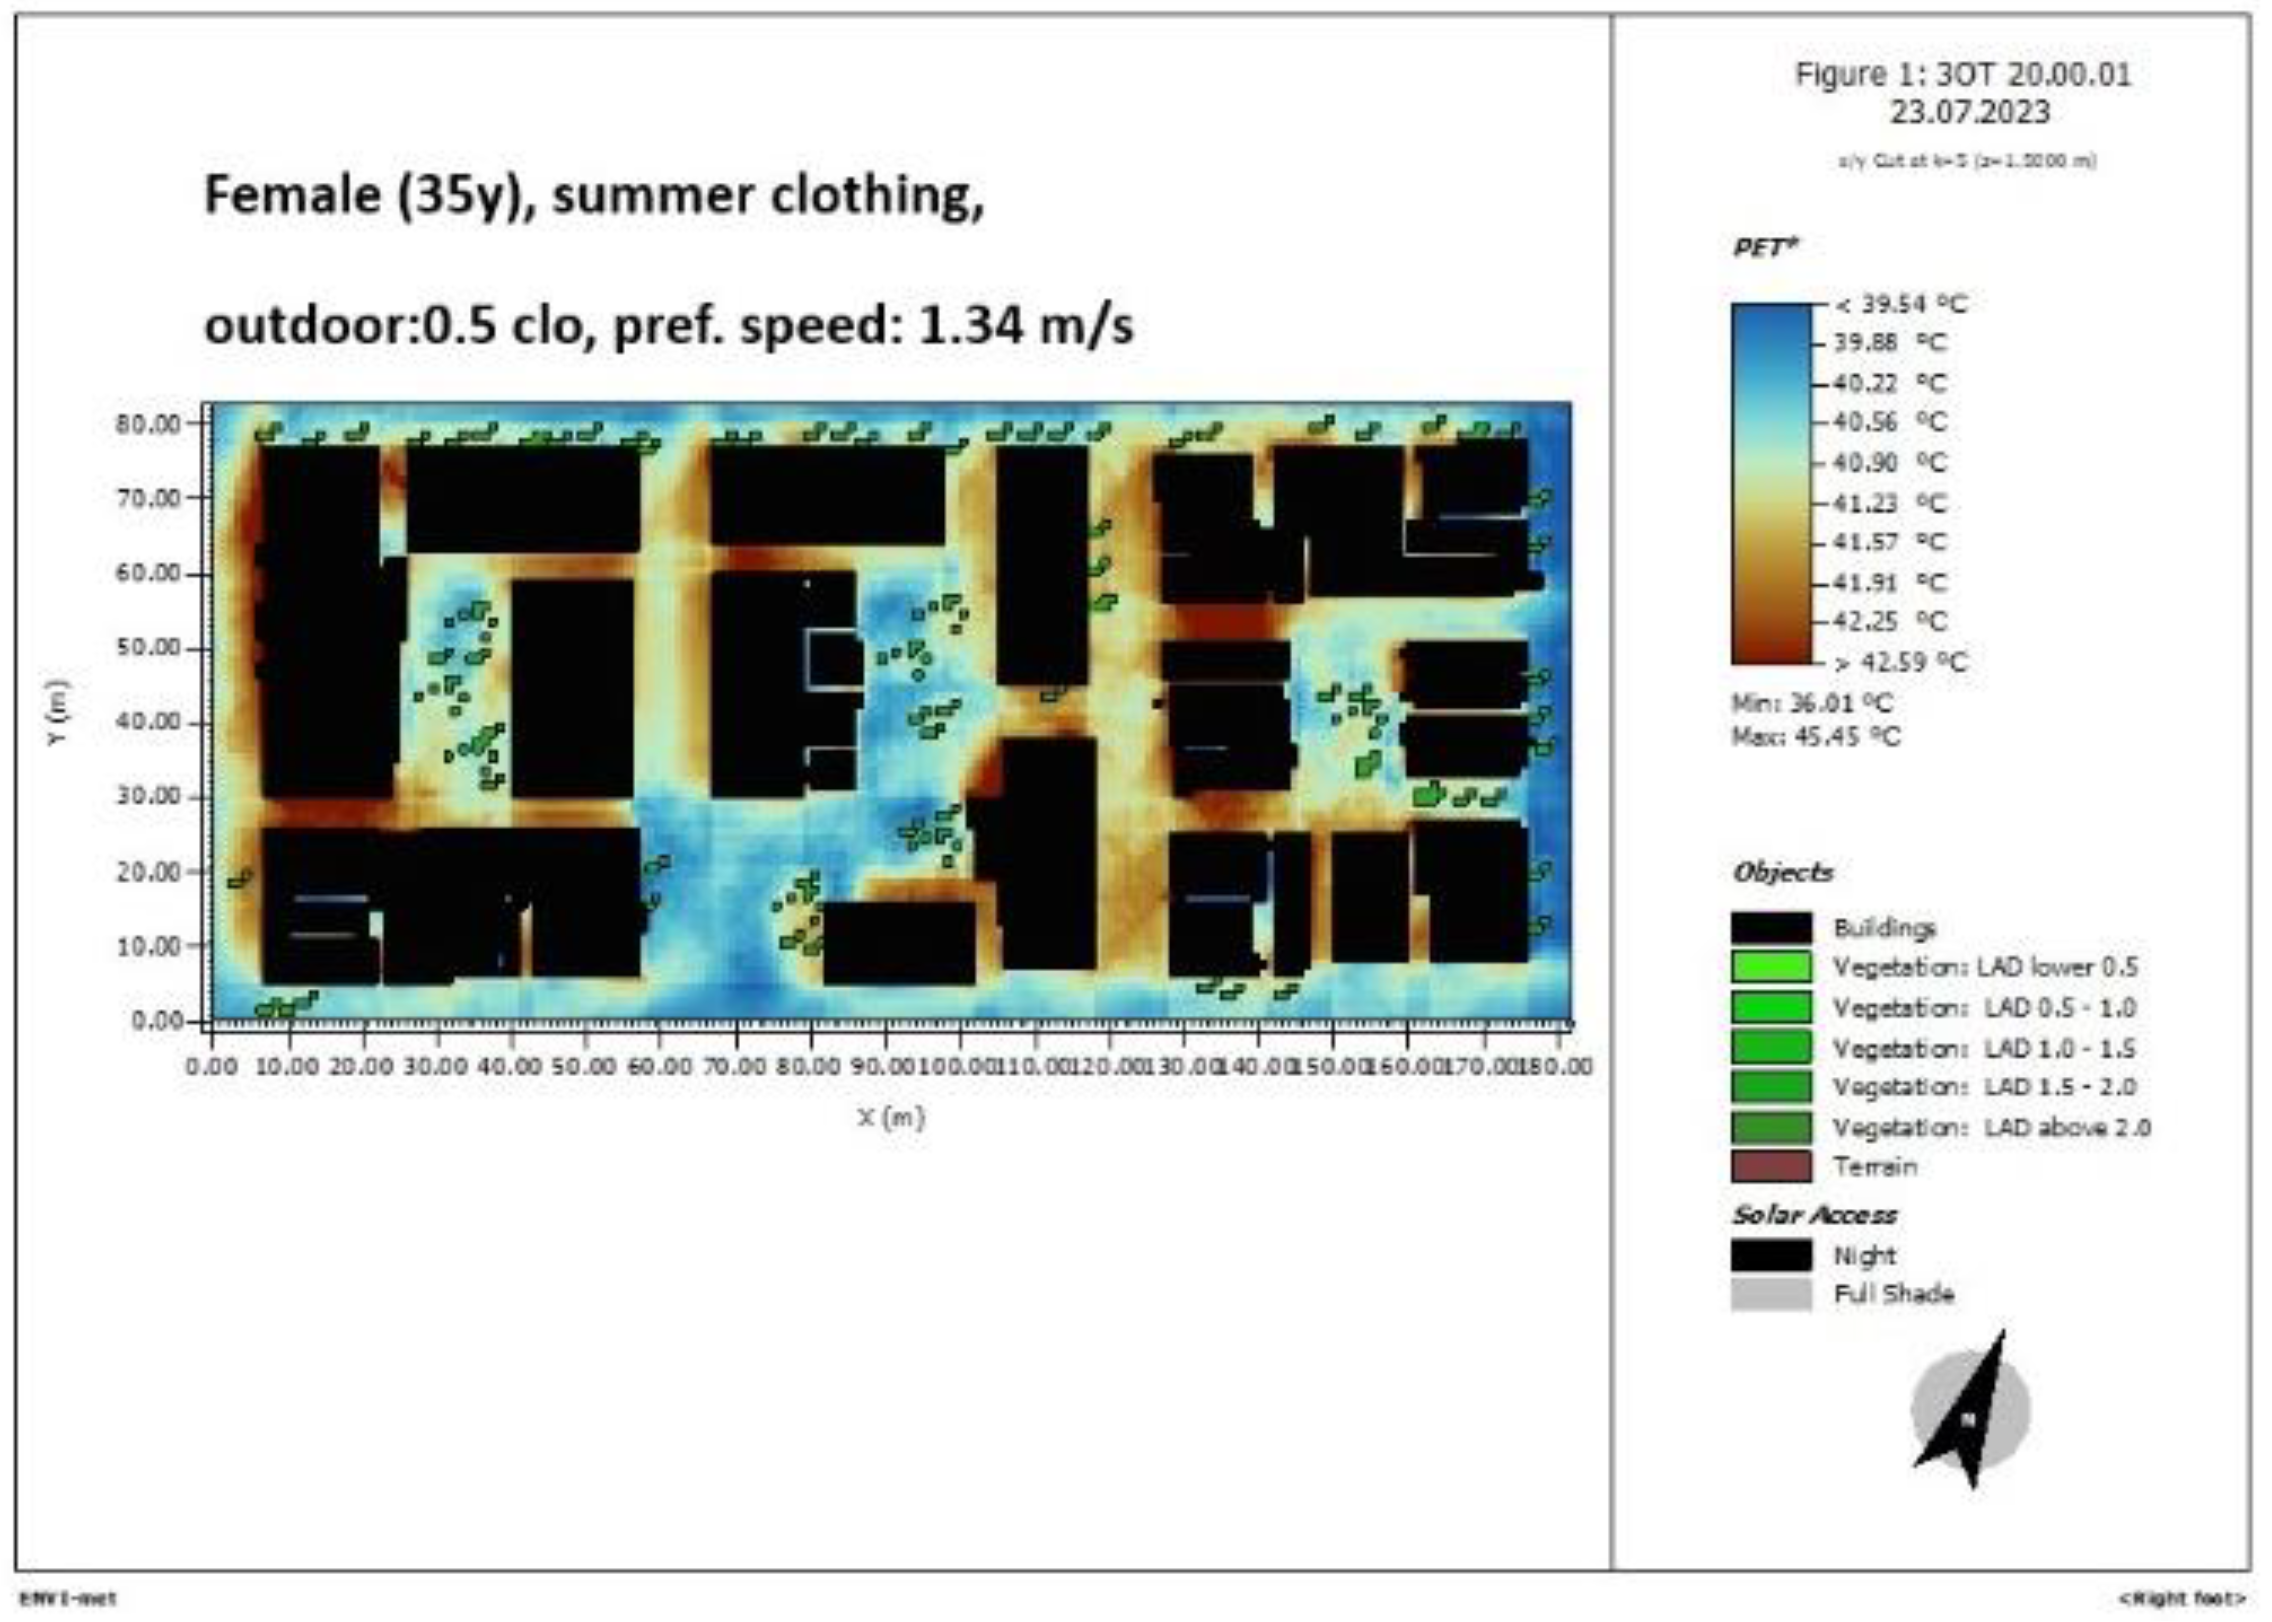
Figure 19.
ENVI-met simulation of the area of study, PET 8 p.m., old person male 80 y, summer clothing, 0.5 clo, pref.speed 0.90 m/s.
Figure 19.
ENVI-met simulation of the area of study, PET 8 p.m., old person male 80 y, summer clothing, 0.5 clo, pref.speed 0.90 m/s.
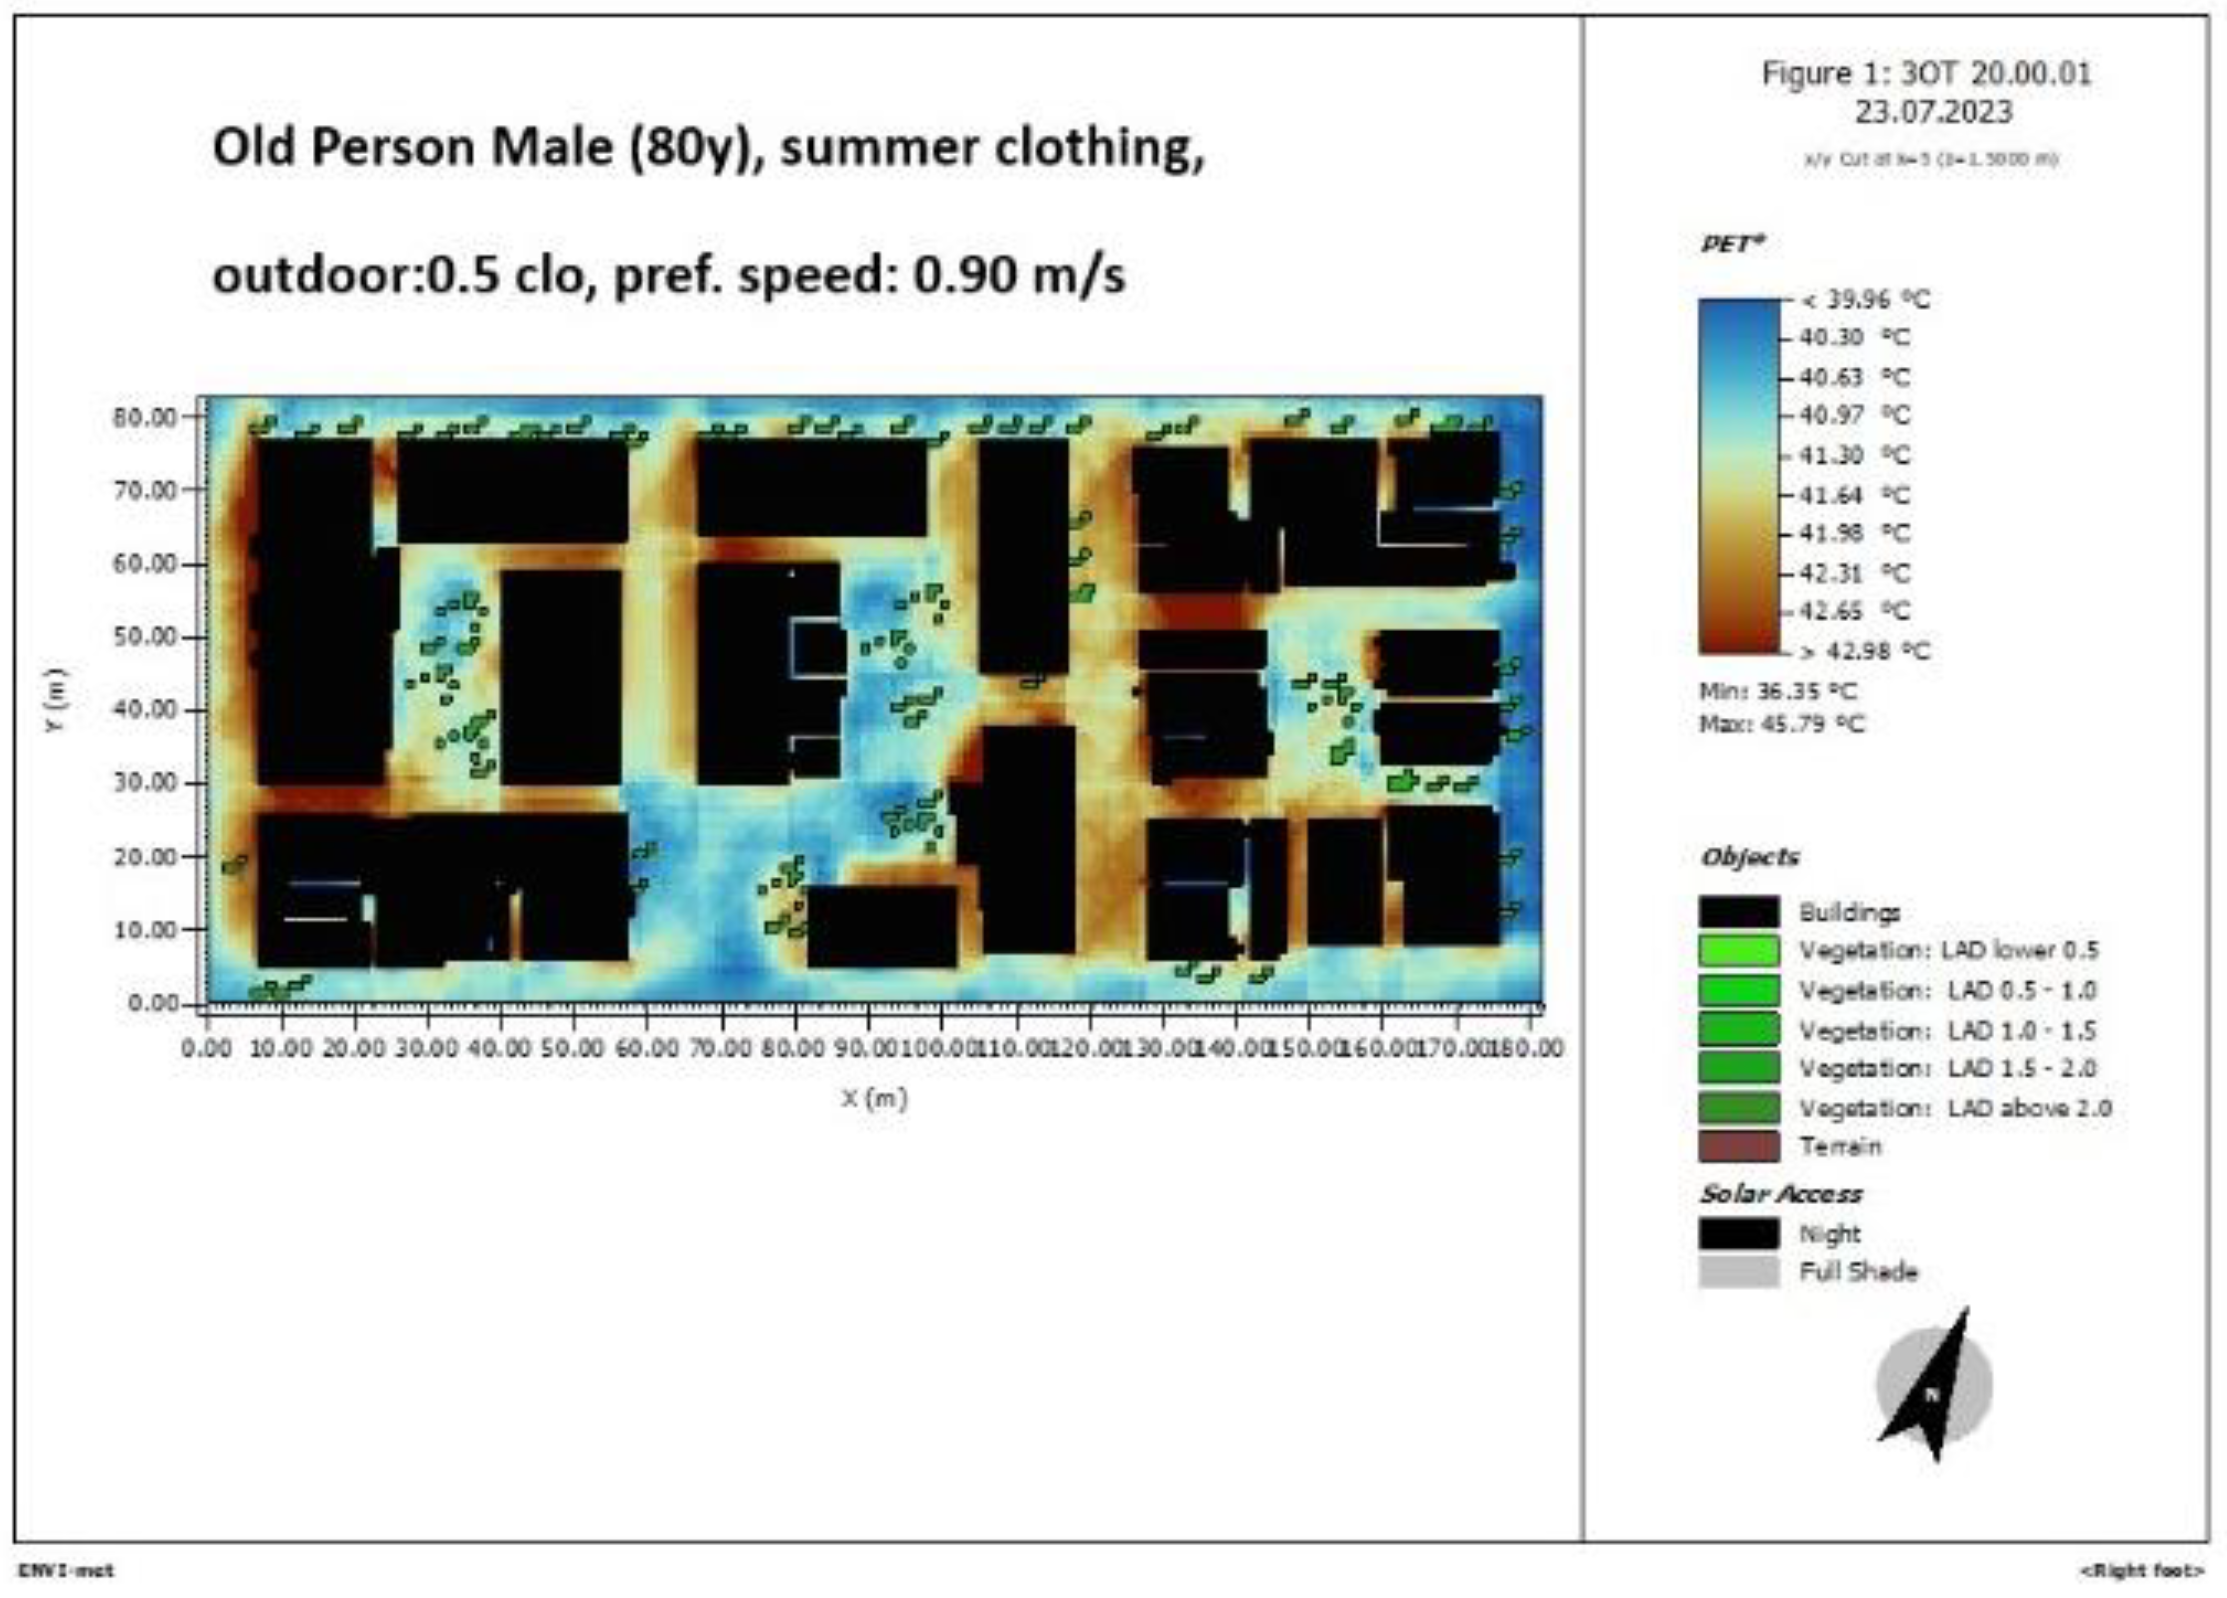
Figure 20.
ENVI-met simulation of the area of study, PET 8 p.m., child male 8 y, summer clothing, 0.5 clo, pref.speed 1.10 m/s.
Figure 20.
ENVI-met simulation of the area of study, PET 8 p.m., child male 8 y, summer clothing, 0.5 clo, pref.speed 1.10 m/s.
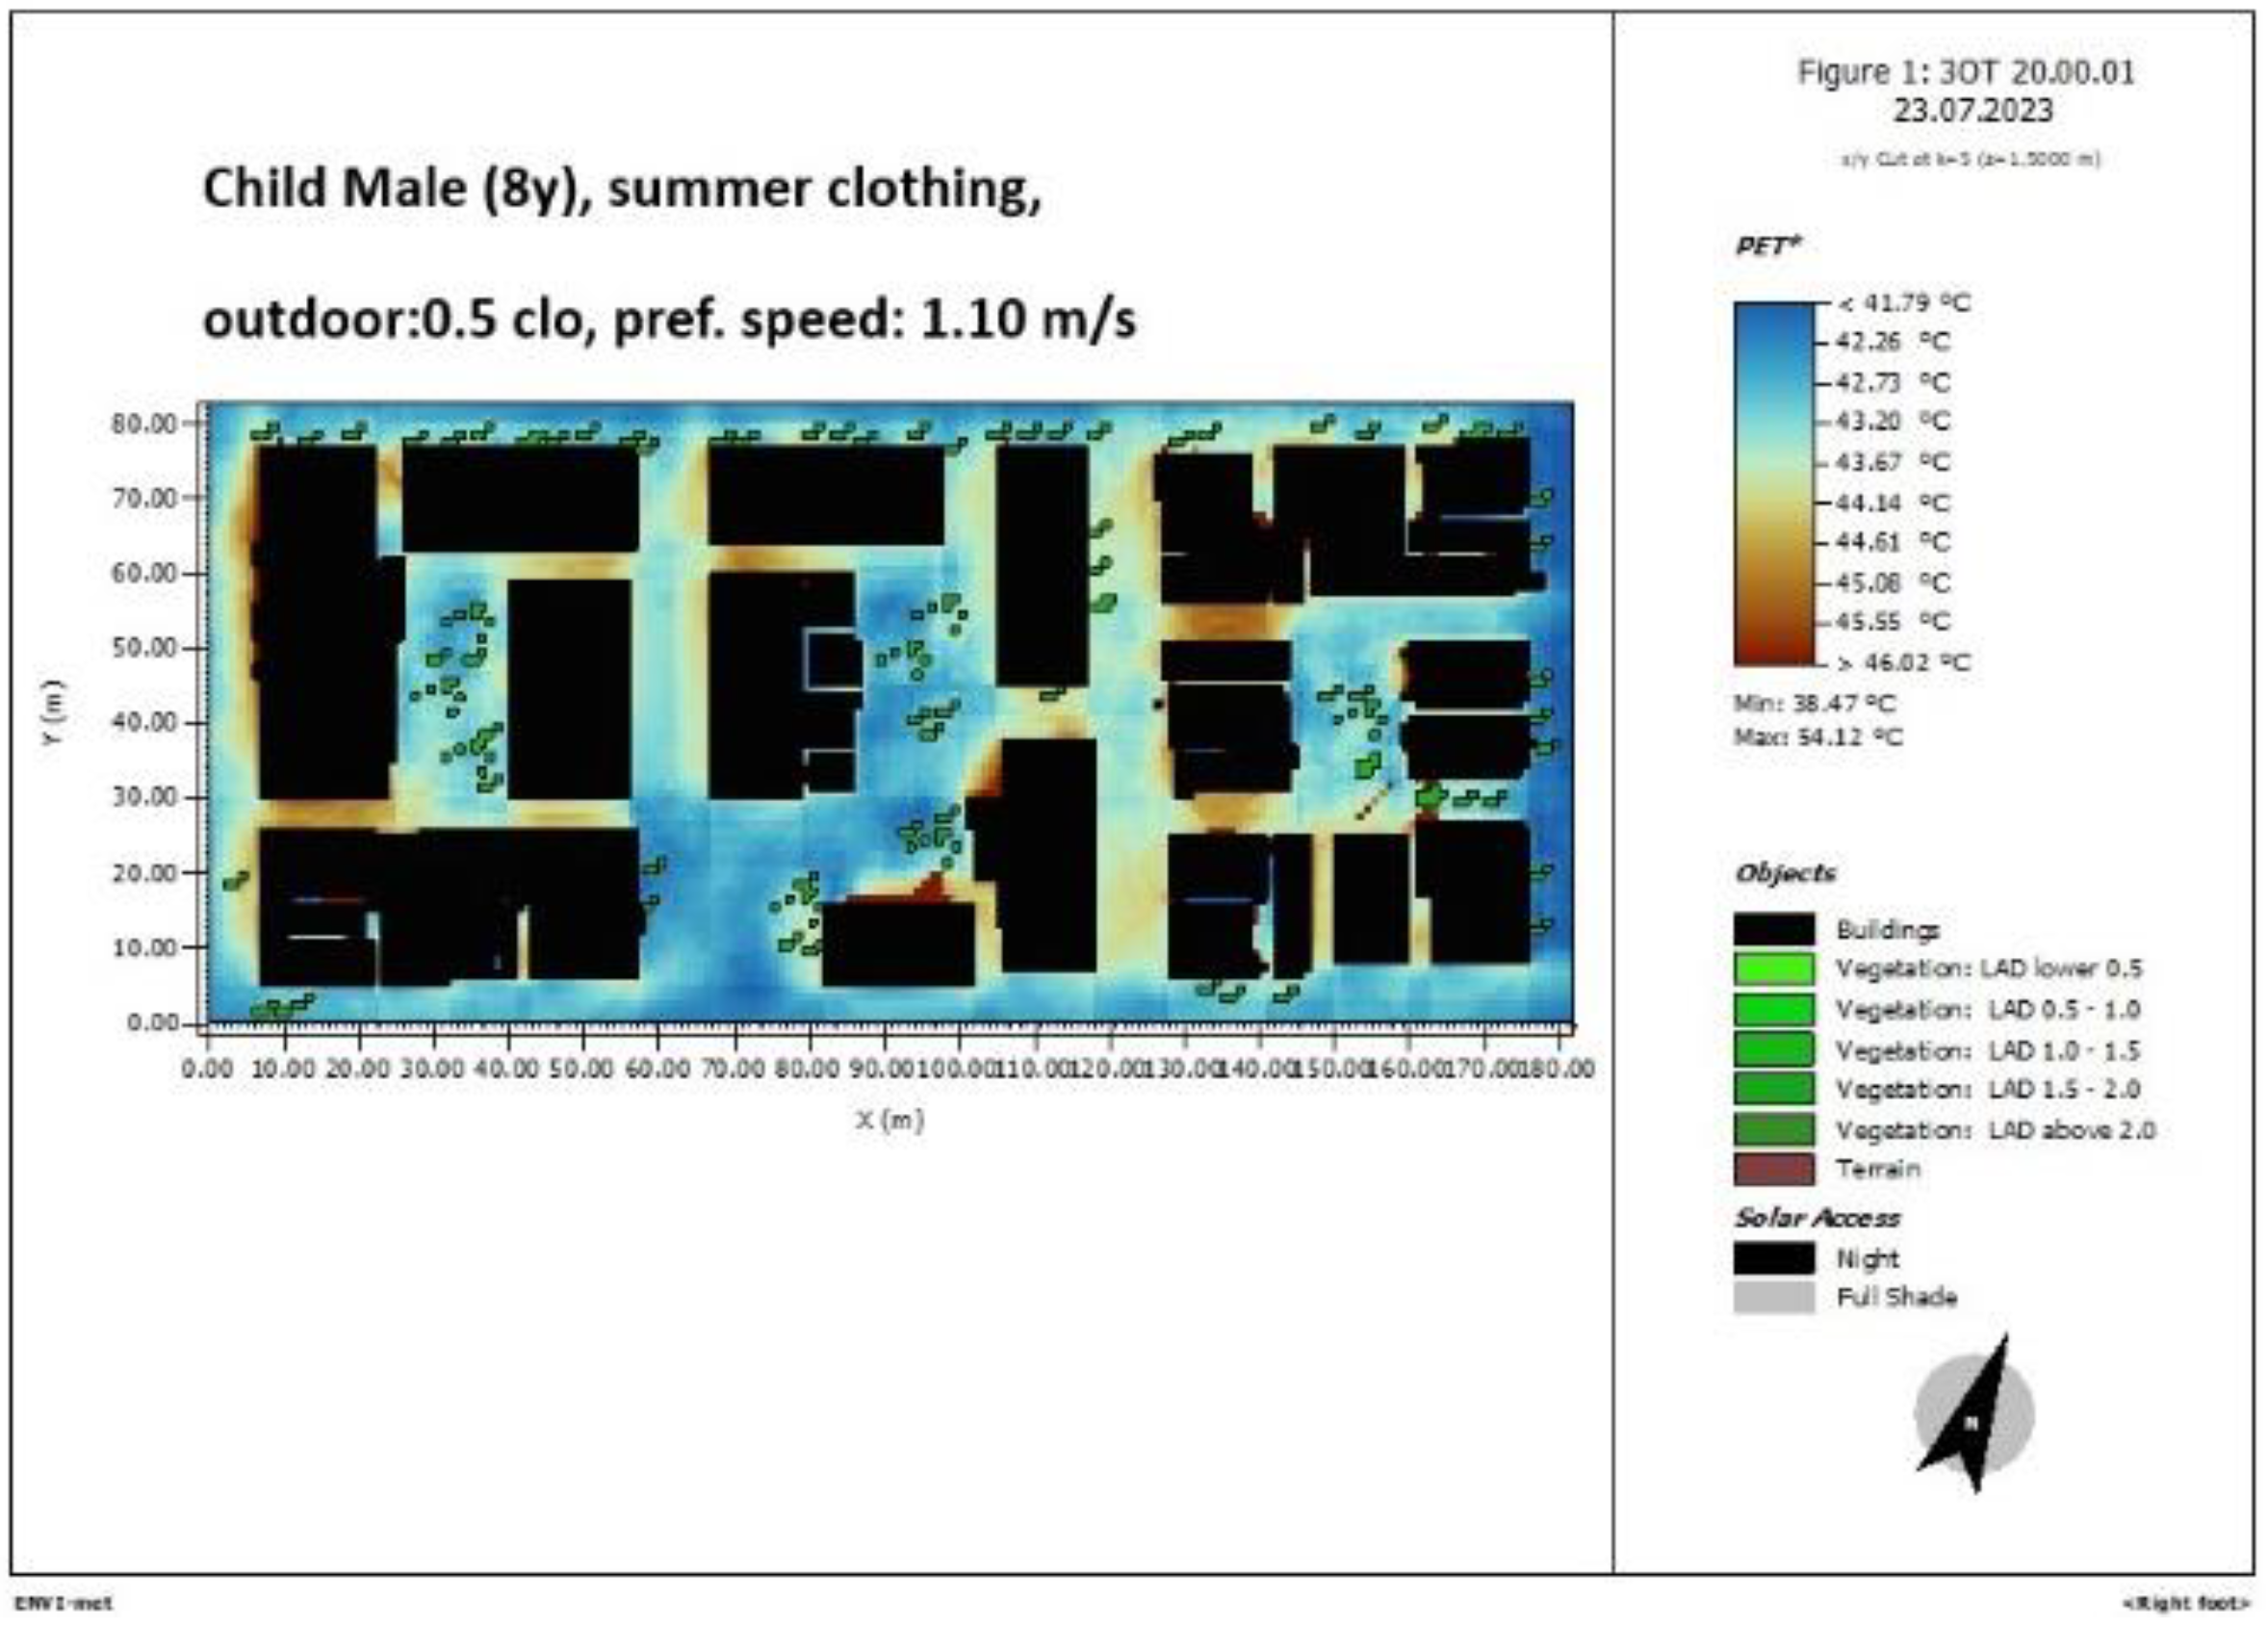
Figure 21.
ENVI-met simulation of the area of study, UTCI 10 a.m., male 35y, female 35y, old person male 80y and child male 8y.
Figure 21.
ENVI-met simulation of the area of study, UTCI 10 a.m., male 35y, female 35y, old person male 80y and child male 8y.
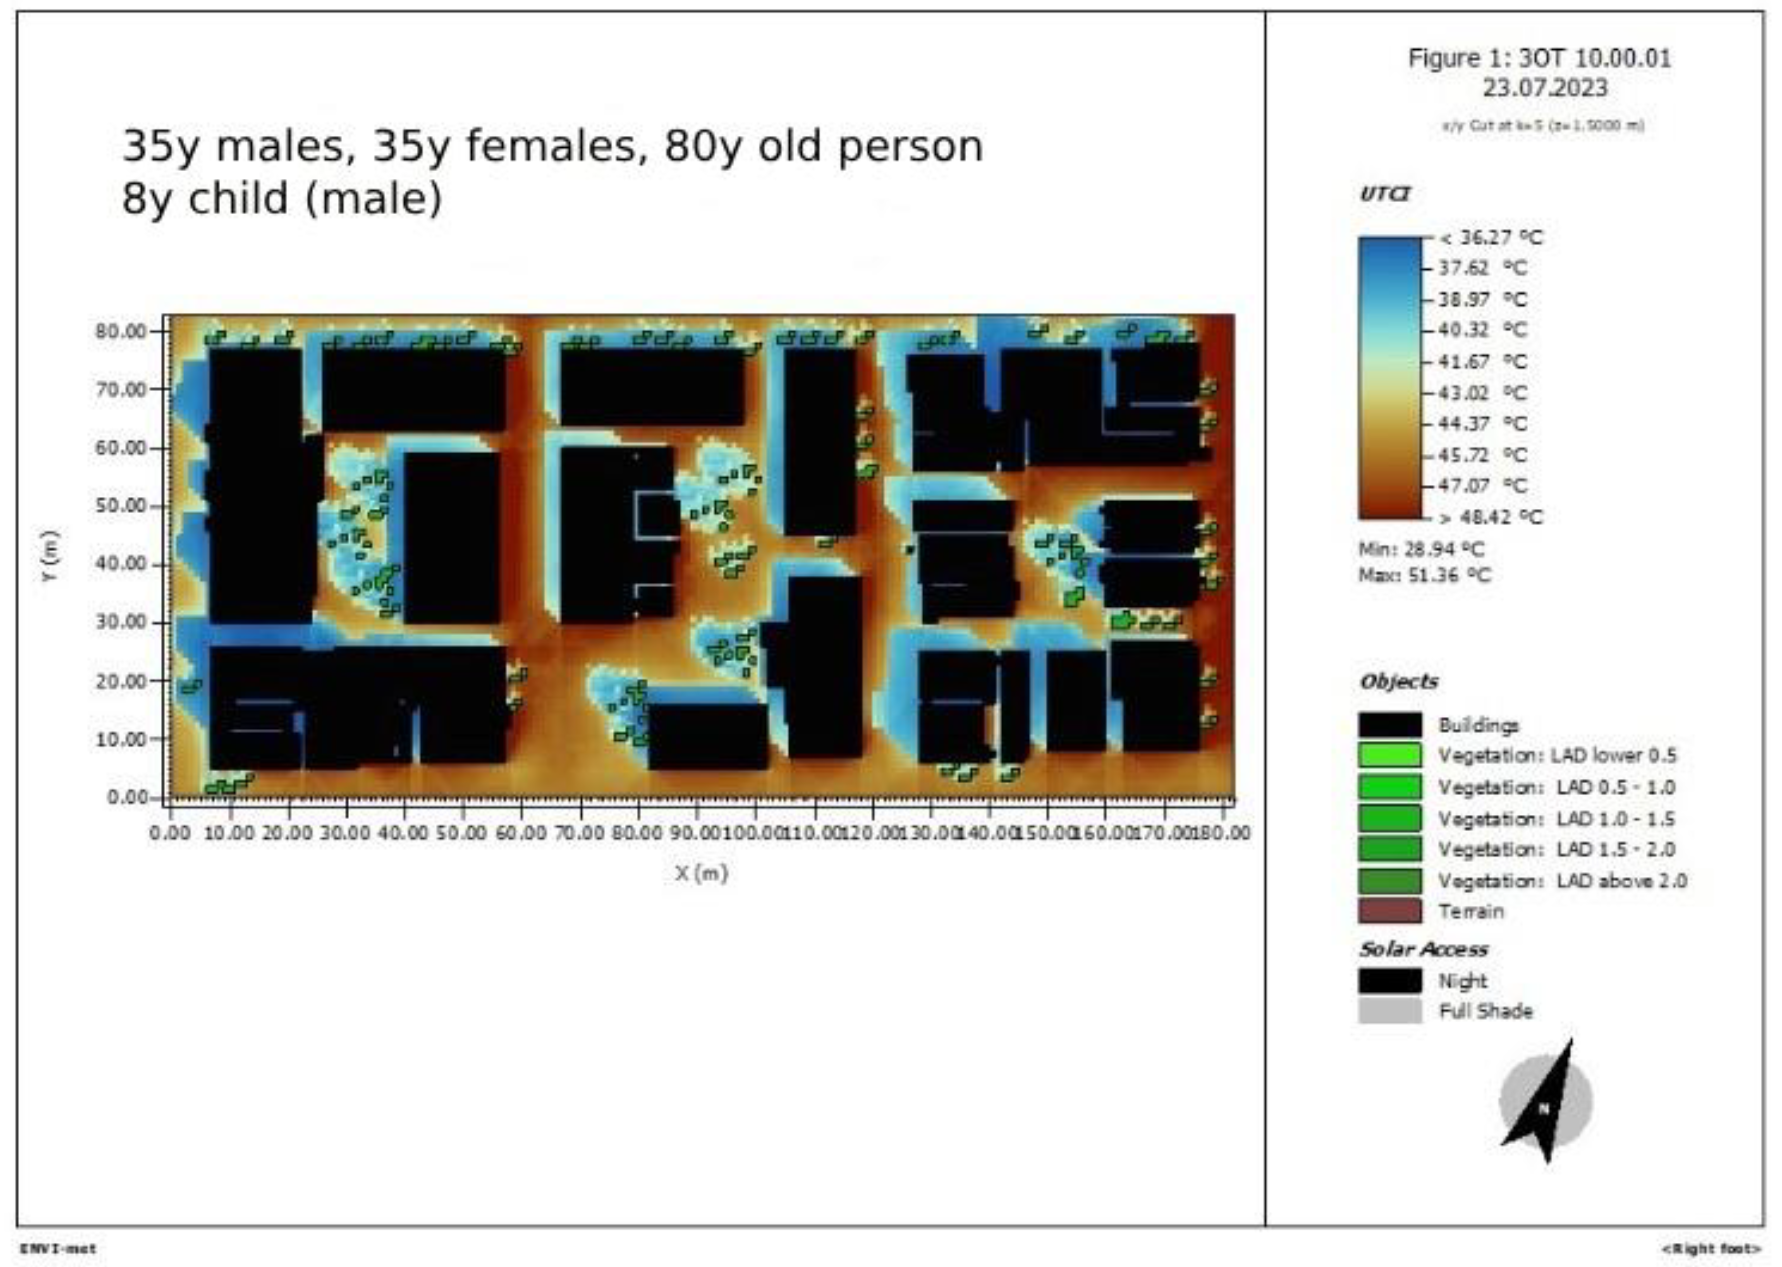
Figure 22.
ENVI-met simulation of the area of study, UTCI 3 p.m., male 35y, female 35y, old person male 80y and child male 8y.
Figure 22.
ENVI-met simulation of the area of study, UTCI 3 p.m., male 35y, female 35y, old person male 80y and child male 8y.
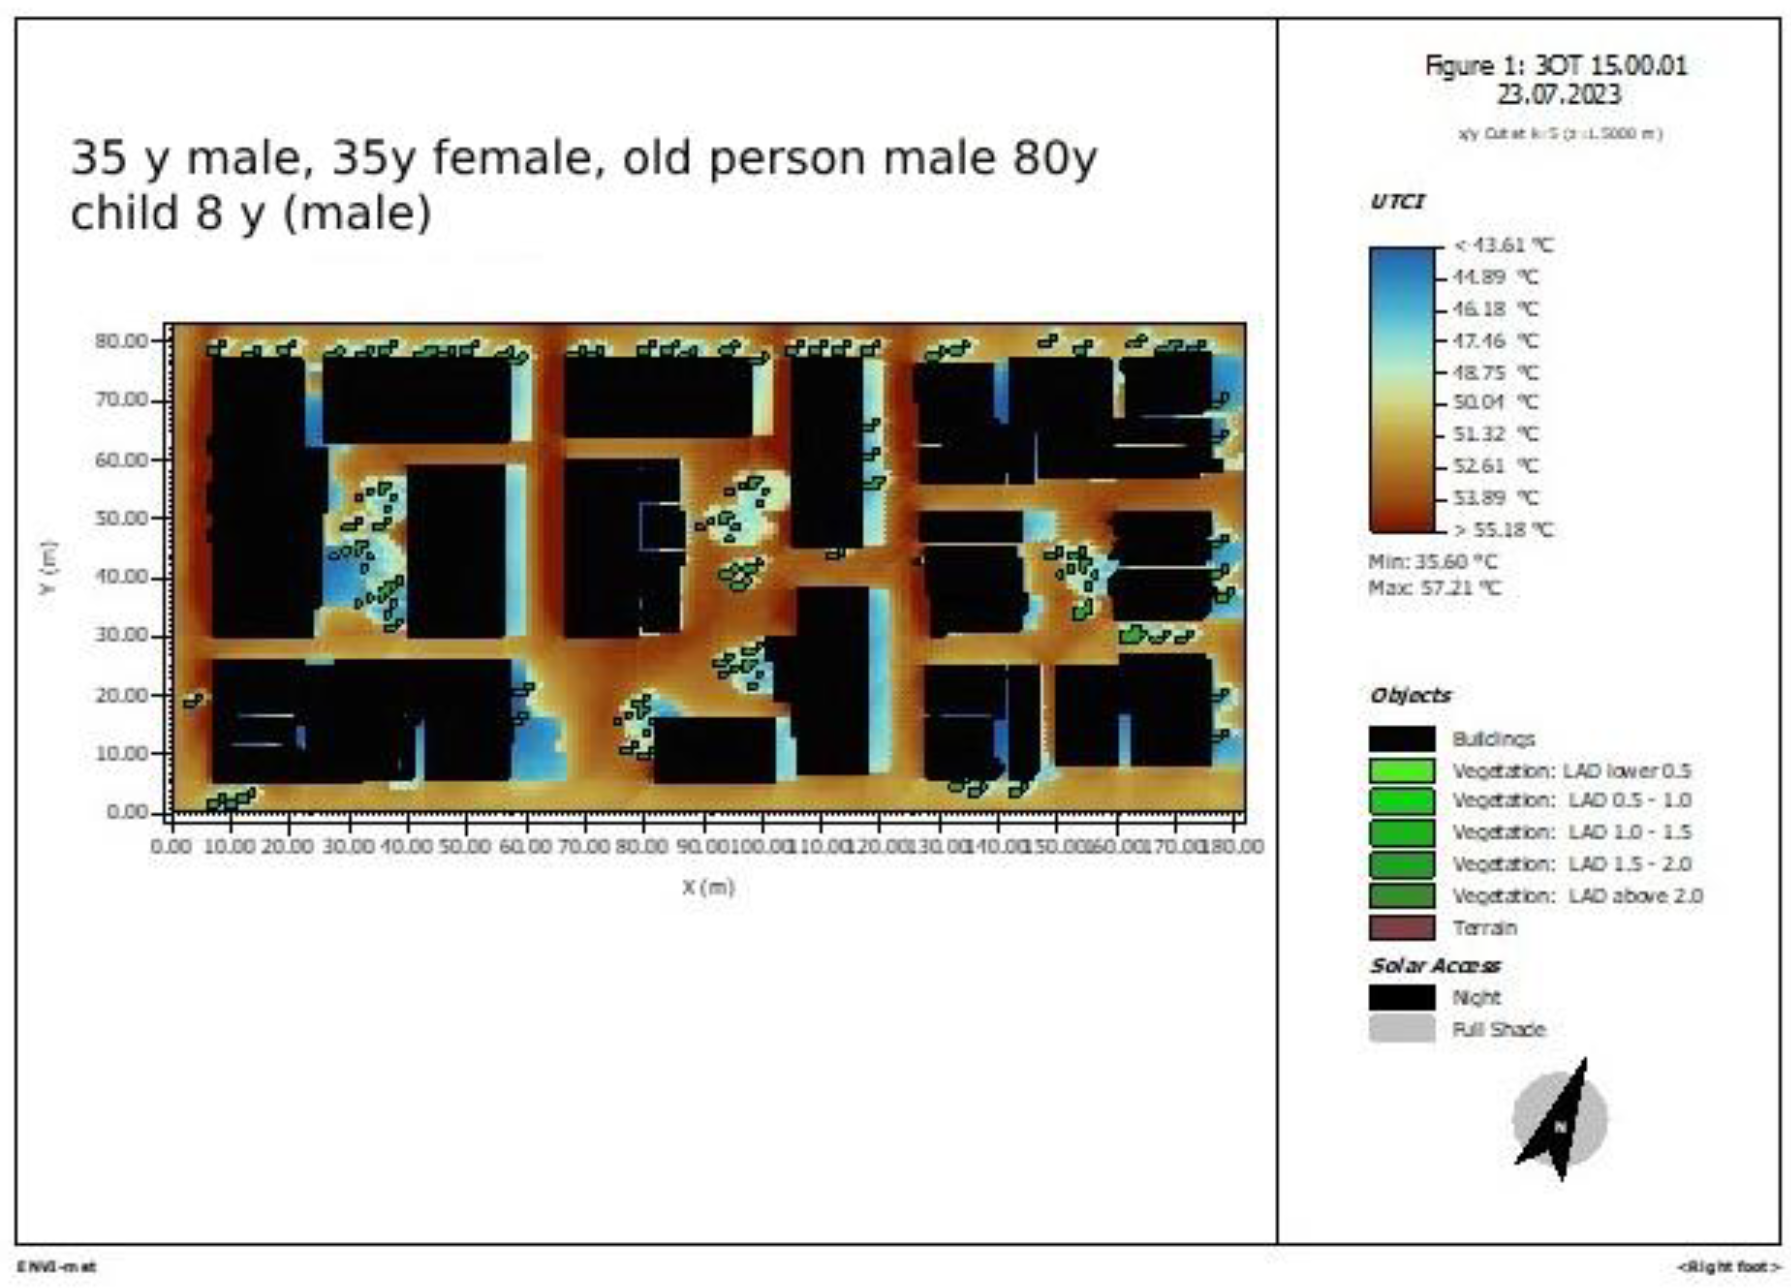
Figure 23.
ENVI-met simulation of the area of study, UTCI 8 p.m., male 35y, female 35y, old person male 80y and child male 8y.
Figure 23.
ENVI-met simulation of the area of study, UTCI 8 p.m., male 35y, female 35y, old person male 80y and child male 8y.
Disclaimer/Publisher’s Note: The statements, opinions and data contained in all publications are solely those of the individual author(s) and contributor(s) and not of MDPI and/or the editor(s). MDPI and/or the editor(s) disclaim responsibility for any injury to people or property resulting from any ideas, methods, instructions or products referred to in the content. |
© 2024 by the authors. Licensee MDPI, Basel, Switzerland. This article is an open access article distributed under the terms and conditions of the Creative Commons Attribution (CC BY) license (http://creativecommons.org/licenses/by/4.0/).
Copyright: This open access article is published under a Creative Commons CC BY 4.0 license, which permit the free download, distribution, and reuse, provided that the author and preprint are cited in any reuse.


