Submitted:
01 October 2025
Posted:
06 October 2025
You are already at the latest version
Abstract
Analysis of historical and future land use/land cover (LULC) dynamics using spatiotemporal data is crucial for better management of natural resources and environmental monitoring. This study investigated LULC transformations for the period of 60 years (1984-2044) in the Giba basin, northern Ethiopia. An ArcGIS and the Cellular Automata and Artificial Neural Network (CA-ANN) model were used to develop the past (1984, 2004, 2014, and 2024) and future (2034 and 2044) LULC maps of the basin, respectively. The results show that LULC categories experienced shifts from one class to other classes by 35%, 33%, and 40%, in 2004-2014, 2014-2024, and 2004-2024, respectively. During the 1984-2024 period, the smallest and largest percentage of positive changes were observed in settlement (7700%) and shrubs and bushes (25%), which increased from negligible to 78 km2 and from 1668 km2 to 2082 km2, respectively. Whereas barren land and forestland showed the largest (-80%) and smallest (-37%) decreasing rate during the same period. Results of the CA-ANN model showed that majority of the LULC categories (including water body, forest, bushes and shrubs, grassland, and barren land) will decrease except a slight increase of cropland (+6%) and settlements (+16%) in the future two decades during 2024-2044. In general, the Giba basin has undergone significant changes during the study period. High population increase, changes in government policies, and armed conflicts were found to be the most influential driving factors of changes in the basin.
Keywords:
LULC
; change
; increasing
; decreasing
; Giba basin
1. Introduction
Land use land cover (LULC) change is one of the major global environmental problems that alter the earth’s terrestrial surface [1,2]. The main factors for LULC change include rapid population growth, policy and institutional factors, and varying economic conditions [1]. Similarly, recurrent drought occurrences [3], agricultural land expansion and wood extraction for charcoal production [4], low-income and the agriculture-based economy [5] are the main drivers of LULC change in northern Ethiopia.
The Giba basin in northern Ethiopia is one of the most water-stressed and unsustainable ecosystems as land and water resources are excessively utilized to support millions of populations through rain fed and irrigated agriculture [6]. Climate change and environmental and socioeconomic challenges continue to threaten the sustainability of ecosystem services in the basin [7,8]. Very few previous studies in the basin have reported inconsistent results about the historical LULC dynamics before 2014. For instance, Gebremicael et al. (2017) [4] reported that agricultural land has increased by nearly 40% in 2014 compared to the 1970s, and shrubs covered 27% of the study area in 2014. However, a similar study by Guyassa et al. (2018) [9] reported 37% of shrubs coverage in 2014 and nearly the same fraction of agricultural land (42%) in 2014 compared to the 1930s. These disparities may indicate the need for additional studies that emphasize the recent developments in the basin and future projections attributed to various socioeconomic processes [8].
Detailed information on LULC dynamics is crucial to understand land and water management practices [10] by identifying the driving factors at a local level [11]. This can be easily accomplished by using remote sensing techniques, which have provided the opportunity to investigate long-term LULC dynamics [12,13] that ultimately help to evaluate land use policy and decision-making processes [14].
LULC change models consider a number of change drivers, among others, e.g., historical LULC change trends, elevation, slope, population density, and distance to rivers and roads, to detect change based on a probabilistic prediction. These models have many applications that are helpful in identifying LULC change in different dimensions [15]. The Markov chain model is one of the most commonly used techniques for the future prediction of LULC change [16]. It operates stochastically and considers the basis of a state at a previous time to predict a certain state of the system for the future. The model is suitable for short-term LULC prediction [17]. The Markovian approach is useful to prepare a transition probability matrix for the projection of future LULC changes by using Modules of Land Use Change Evaluation (MOLUSCE). The MOLUSCE is a plugin of QGIS, which was recently introduced for LULC change projection [18]. The module consists of four different models, namely, artificial neural networks (ANN), weights of evidence (WoE), multi-criteria evaluation (MCE), and logistic regression (LR) to establish transition potential and train a simulation model. Then, the LULC map is generated based on the Monte Carlo cellular automata (CA) model approach [19]. The CA is crucial for predicting the spatiotemporal dynamics of LULC change as it considers the spatial nature and the direction of the data [20], and the state of changes of the neighboring cells in addition to the state of the cell in question [21].
Several studies have employed the coupled CA-ANN Model and Markov-CA models for LULC change projection in various catchments in Ethiopia and reported the applicability of the methods for environmental change, land and water resources management studies, and land use planning [22,23,24,25,26]. However, the literature shows that no research has been conducted to forecast future LULC change of the whole Giba basin, and very little is known about the alterations of LULC since 2014 and also after the devastating war (2020-2022) in the region. Hence, the present study attempts to fill the knowledge gap about the LULC dynamics in the Giba basin over the course of 60 years. The specific objectives of this study are to (1) investigate the historical (1984-2024) LULC change, and (2) to project the future (2024-2044) LULC dynamics in the basin.
2. Materials and Methods
2.1. Study Area Description
The Giba basin (5135 km2 area) is geographically located between longitudes of 38◦40′ and 39◦50′ east and latitudes of 13◦20′ and 14◦20′ north in Tigray region, northern Ethiopia (Figure 1).
The basin drains the headwaters of the Tekeze-Atbara basin, which joins the Blue Nile River in Sudan. It is characterized by undulating topography with distinct elevation ranges (929 -3300 m), steep volcanic mountains, undulating metamorphic terrain, and deep gorges Mesozoic sedimentary terrain dominates in the northern and southwest of the central parts, southwestern and northeastern, and central parts of the basin, respectively [27].
The climate of the basin is semi-arid, with spatiotemporally varied rainfall and temperature records. Mean annual rainfall ranges from 550 mm in the northern and eastern parts, to 600 mm in the middle part, and 1050 mm in the western parts. The area gets 69-85% and 11-25% of the mean annual rainfall in the rainy (mid-June till mid-September) and the spring (mid-march till mid-June) seasons, respectively. Long-term average maximum temperature ranges from 27.4 to 29.8 oC in the lowlands and 22.3 to 24.1 oC in the highland areas. Similarly, the long-term average minimum temperature varies from 11.3 to 13.7 oC and 10.3 to 11.1 oC in the lowland and highland areas, respectively [7].
2.2. Data and Methods
2.2.1. Historical LULC Classification
For the historical LULC analysis, Landsat satellite images for the years 1984, 2004, 2014, and 2024 were acquired from the US Geological Survey (USGS) Centre for Earth Resources Observation and Science (EROS) found at https://earthexplorer.usgs.gov. Description of the collected Landsat images including satellite, sensors, path/row, resolution, and acquisition date of each image is summarized in Table 1. The availability of satellite images, government policy changes, and the prevalence of armed conflicts were the basis for the selection of the years for analysis.
All images were selected from September (i.e., instantly after the rainy season) to December in all years in order to obtain image data with the lowest cloud cover and to minimize the effect of the seasonal variabilities on the LULC classification results [32]. Reference data, mainly on the LULC types and topographic variables was collected from the literature, aerial photographs, and field data including interviews, observations, and ground truth points (GTPs). The GTPs that are used for the LULC classification and accuracy assessment for the 2024 image were mainly collected from Google Earth Pro, and during a field survey from 12 September 2024 to 10 December 2024 by using a hand-held Geographical Positioning System (GPS). In addition, existing LULC maps for the 1984 [33] and 2014 [4], and available aerial photographs (1986) were used to derive the GTPs. Additional information on the historical images was also collected by interviewing 40 local elderly persons in the study area.
Image pre-processing for all the acquired Landsat images including, atmospheric and geometric corrections was done by using the Environment for Visualizing Images (ENVI) software and the coordinate system named WGS_1984_UTM_Zone_37N (in ArcGIS 10.6), respectively.
The maximum likelihood classification algorithm of supervised classification was carried out (in ArcGIS) by using 2124 GTPs, of which 1284 points were used for the classification, and the remaining 840 points were used for the accuracy assessment of each image. A stratified random sampling approach, which is the most commonly used method to improve accuracy of the classification [34] was used to sample the GTPs. The prior knowledge of the researchers about the LULC of the study area and literature have been pivotal for the classification process. Accordingly, seven LULC types, namely, water body, forest area, settlements, grassland, barren land, cropland, and shrubs and bushes have been classified for the 2004, 2014, and 2024 images. However, only five classes (i.e., excluding water body and settlements) were identified for the 1984 image. It was difficult to accurately identify the reflectance signature of settlements in the 1984 Landsat image attributed to the insignificant expansion of urbanization in that period. Similarly, as the development of surface water reservoirs is a recent practice in the Tigray region [35] and the region was affected by successive drought events during the 1980s [30], water bodies are hardly available in the 1984 image. In alignment to this, Gebremicael et al. (2017) [4] reported that the spatial coverage of water body in the Giba basin during 1989 was 0.25 km2 only. Table 2 describes the details of the LULC classes in the study area.
Different accuracy assessment methods including available local LULC datasets, GTPs, and expertise observation, were carried out to check the accuracy of the classified images for all years. Given the self-acquaintance of all the authors to the study area, expertise observation was helpful to improve the accuracy of classification.
An error matrix, which compares the classified images with the GTPs, was computed for evaluating the accuracy of classification. The error matrix includes well-known accuracy assessment coefficients, namely, user accuracy, producer accuracy, overall accuracy, and the Kappa coefficient.
2.2.2. Future LULC Prediction
The classified LULC maps for the years 2004, 2014, and 2024, physical and socio-economic factors including elevation, slope, population density, distance to roads, and distance to rivers were used as an input variable for the future LULC perdition of the Giba basin until 2044. All these maps were prepared by using the ArcGIS (10.6.1) software.
The MOLUSCE module of QGIS 3.42.1 was used for the simulation of the LULC change for 2034 and 2044. The 2004 and 2014 LULC classified maps were used to generate area change and transition probability matrixes within 10 years interval. The MOLUSCE has a validation plugin that helps to assess the model’s accuracy for future LULC projection. Accordingly, the 2024 LULC was simulated by using 2004 and 2014 as baseline data, then compared with the classified 2024 map. Quality of the projection was evaluated by using accuracy indicators, such as percent of correctness, kappa (overall), kappa (histogram) and kappa (location). The overall methodology followed in this study is presented in Figure 2.
3. Results and Discussion
3.1. LULC Classification and Change Detection
The LULC change analysis results demonstrate the historical LULC changes and dynamics of the change in all land cover classes. The LULC classification results for the years 1984, 2004, 2014, and 2024 are shown in Figure 3. The overall accuracy and Kappa coefficient of the 2024 LULC map were 85.3% and 82%, respectively. Similarly, an overall accuracy (and Kappa coefficient) of 84.7% (81.3%), 87% (83.9%), and 83.3% (78.4%) were obtained for the LULC maps of 2014, 2004, and 1984, respectively.
Confusion matrices for all the classified maps are presented as annexes (Table S1). Accuracy assessment of all maps showed relatively good (User and Producer) accuracies of more than 80% for the majority of LULC classes. However, lower individual (Producer) accuracy was obtained for the barren land class (~65%) for the 2004, 2014, and 2024 years. This may be associated with the similarity of reflectance with cropland and settlement classes. The authors observed some similarities between the reflectance of barren lands and croplands, which are unseeded during the crop-growing season. In general, the obtained accuracy indicators showed that the classified LULC maps are adequately accurate [10] and suitable for further LULC dynamics analysis.
Figure 3 and Figure 4a present the classified LULC maps and the estimated area of each LULC class, respectively.
The results showed that cropland, shrubs and bushes, and barren land were the dominant LULC classes at the beginning of the study period, which constitute a decreasing order of 36%, 32%, and 19%, respectively. During 1984-2004, cropland and shrubs and bushes showed a significant increase by 24% and 17%, respectively. However, a significant decline in barren land (-48%) and grassland (-46%) was observed during the same period. The increasing rate in shrub and bush cover is associated with the efforts of the regional government to rehabilitate degrading lands through the implementation of soil and water conservation activities, which started in the 1990s [4]. This is directly related to the largest decreasing rate in barren land, which reduced from 956 km2 in 1984 to 497 km2 in 2004. Albeit the government’s efforts in the restoration activities, forest cover showed a dwindling trend from its already low coverage of 164 km2 (3%) in 1984 to 117 km2 (2%) in 2004 (Figure 4a). These results are aligned with other studies in the region, e.g., Munro et al. (2008) [36] reported continued deforestation of remnant natural forest in northern Ethiopia. The significant decline of grassland in the same period is likely associated with the expansion of agriculture, i.e., in search of fertile soils for crop development [9]. Settlement and water body classes started to emerge in the 1990s, which increased from insignificant coverage in 1984 to 35 km2 and 1.4 km2 in 2004, respectively. The relatively low increase in water body during 2004 is associated with the government’s intervention towards ensuring food security through the construction of small and medium surface water reservoirs after the drought and famine of 1984-85 [35].
During the 2004-2014 period, dominant categories of shrubs and bushes and cropland continue to increase from 38-42% and 44-48%, respectively. During this period, LULC classes of water body, settlement, shrubs and bushes, and cropland showed a relatively low rate of increase ranging from 7% to 11% (Figure 4b). The relative increment of shrubs and bushes (+11%) and croplands (+9%) in 2004-2014 is likely associated with large decline of barren land (-48%) and grassland (-46%) in the same period. This shift is most likely because of the increased efforts of the government in the restoration of the degraded catchments in the basin [37]. In line to this, previous studies noted the unavailability of suitable lands for agriculture has resulted in the continued conversion of barren land to croplands in the highland areas of northern Ethiopia [9].
During the 2014-2024 period, cropland continued to slightly increase (+4%) albeit at the lowest rate compared to the previous two periods. Similarly, the continuously declining trend of barren land in the preceding two periods showed an inverse direction (+18% increment) during 2014-2024. Similarly, the settlement class increased at a significant rate (+105%) from 38 km2 in 2014 to 78 km2 in 2024. This difference comes from the massive housing development programs that have been implemented since 2017 in all cities and towns in the Tigray region. It is also associated with industrial development and high population growth around urban areas [4]. Contrary to this, grassland showed a high decline (-47%) compared to the 2004-2014 period, which was -24%. Shrubs and bushes slightly declined (-3%) in this period, which is in a reverse direction compared to the previous time periods. Similarly, a slight decrease (-7%) in forest was also noticed at the end of the study period.
The slight decline of forest, shrubs and bushes, associated with the increase in barren land during the end of the study period is likely related to the impact of the devastating armed conflict (2020-2022) in the region. Regarding to this, Hishe et al. (2024) [38] assessed spatiotemporal changes in vegetation cover in a 50 km radius zone centered on Mekelle City, which covered the majority areas of our study area excluding the northern and western parts. The study reported a decrease in vegetation cover by 405 km2 during the war period (2020-2022) compared to before 2020. Similarly, Meaza et al. (2024) [31] assessed the impact of the war on natural resource degradation and conservation measures in the same area, which only excluded the northeastern and eastern parts of our study area. Accordingly, they reported the degradation of forest areas in the region as farmers were forced to cut trees to generate basic income for their survival during the war and siege periods. Hence, the postwar LULC change analysis results suggest that armed conflicts in northern Ethiopia have impacted the LULC dynamics of the region.
Overall, the last 40 years witnessed considerable LULC dynamics in the Giba basin. Cropland, water body, and settlement showed a continuously increasing trend throughout the study period, but grassland exhibited a continuous decreasing trend. Other LULC classes showed different patterns of change in the different periods (Figure 4a). The smallest and largest percentage of positive changes were observed in settlement (7700%) and shrubs and bushes (25%), which increased from negligible to 78 km2 and from 1668 km2 to 2082 km2, respectively. Whereas, barren land and forest showed the largest (-80%) and smallest (-37%) decreasing percentage for the whole study period.
The LULC change transition matrix, which shows the sources and direction of change (Table S4–S6), indicates that the Giba basin experienced shifts from one LULC class to other classes by 35%, 33%, and 40%, in 2004-2014, 2014-2024, and 2004-2024, respectively. The transition matrix is very useful in identifying the swap changes, that show simultaneous loss and gain of a given LULC class during a certain period. For instance, compared to the 2004 period, only 22% of the barren land class remained unchanged in 2024 whilst 51% and 17% of it was changed into agriculture and bushland classes, respectively (Table S4). The remaining 10% was transformed in to settlement and grassland categories. Similarly, nearly 62% of the shrubs and bushes category remained unchanged in the same period. However, it lost to cropland (32%) and forest (3%), and gained from grassland (43%), barren land (17%) and cropland (26%), among others. In general, higher swap changes were observed in cropland, shrubs and bushes, and barren land during the entire study period which indicates these LULC categories were the most dynamic classes that have exchanged among each other.
Field observation that was carried out during the study period showed validation of the classified LULC maps. Elderly people and inhabitants in different villages, e.g., Agoro, Korir, Agbe, Guya, Abrha Atsbha, Negash, Abyi Adi, Hagereselam, and Togoga were asked for their opinions on the trends of historical LULC change and the impact of the 2020–2022-armed conflict on vegetation cover in their respective neighborhoods. Accordingly, they noticed historical barren land-vegetation, vegetation-cropland, barren land-cropland, grassland-cropland, and vegetation-barren land shifts during the last four decades. For instance, the hillslopes which were sparsely vegetated during 2004-2014 were transformed into croplands (Figure 5) and other categories (Figures S2–S5) in the 2020’s.
The main deriving factors were the increase of population particularly the demand of the youth for agricultural land, urbanization, and the recent armed conflict in the region. In line to this, Gebremicael et al. (2017) [4] reported a positive correlation (r = 0.76) of population and cropland expansion, and a negative correlation (r = -0.63) with forest coverage during 1972-2014 in the same region.
According to the people who were interviewed during the field visit, the armed conflict in the region has resulted breaching of community bylaws on the protection of forests and area closures. Consequently, massive deforestation was observed in the remote areas of the study area, in which farmers cut trees to feed their cattle during the dry season (Figure 7). Similarly, indiscriminate cutting of trees for firewood and charcoal fuel purposes was observed in communal lands near to the Guya town (Figure 6).
Previous studies in and around our study area have documented slightly different results about the dominant LULC classes in the basin, mainly the cropland category. For instance, Guyassa et al. (2018) reported that the fraction of cropland area in the Giba basin slightly increased from 39% in the 1930s to 42% in 2014. In the same study area, Gebremicael et al. (2017) [4] reported a significant increase in the class from nearly 29% in 1972 to 40% in 2014. In addition, the study by Abraha (2009) [39] in the same area reported 46.4% of cropland coverage in 2000, which is slightly higher compared to 42% in 2001 [4]. These differences are even wider in other studies that covered some parts of our study area. In this regard, a study by Ashenafi (2014) [40] that included 46% of our study area excluding the western part, reported a high increase in cropland ranging from 14% in 1972 to 60% in 2003. Another study in the Suluh catchment (967 km2) that covers about 18% of our study area, reported 51.2% of the cropland category [41]. The differences in image classification results are often attributed to the lower classification accuracy, variations in defining the number of classes, and similarities in the reflectance signature of various classes, among others. In this regard, the similarity of the reflectance signature of barren land and cropland for images captured during the dry season was identified as a challenging task during the image classification. This confusion often leads to the underestimation of croplands and overestimation of barren lands as reported by Gebremicael et al. (2017) [42] and Guyassa et al. (2018) [9]. In general, it can be arguably noted that our results on the classification of LULC categories for the historical images (i.e., before 2014) look slightly different compared to the results of the previous studies. The differences are manifested in either a slight underestimation of barren land or an overestimation of cropland compared to the other studies. But on average, our results are in line with the previous studies.
3.2. Future LULC Projection
Future LULC changes until 2044 were predicted by using the CA-ANN model (Figure 8). The modeling approach is based on the transition potential modeling of 2004-2014 LULC change data (Figure S1) and resulted in a validation kappa value of 0.95. An overall accuracy of 89% and kappa (overall) of 0.81 were obtained by comparing the actual (classified) and simulated LULC maps for 2024.
The LULC projection results showed slightly decreasing trend in majority of the categories except a small increase in settlement (+17%) and cropland (+6%) during the 2024-2044 period (Figure 9b). During this period, the highest and lowest decline is observed in forest (-31%) and shrubs and bushes (-6%), which reduced from 103 km2 to 71 km2 and from 2082 km2 to 1955 km2, respectively. In the 2034-2044 period, the majority of the classes slightly increased with the exception of cropland which slimly decreased by -0.6%.
The slight decline of cropland is likely associated with the increment of the settlement category that increased from 78 km2 in 2024 to 91 km2 in 2044 (Figure 9a). In this period, maximum (3.4%) and minimum (0.6%) increase was observed in settlement and barren land classes, respectively. Therefore, it can be noted that LULC change during the 2034-2044 period showed insignificant change except in the settlement category.
Referring to the transition matrix (Table S7), forest areas will continue to experience considerable changes in the near future. The swap change analysis shows about 70% of the forest areas in 2024 will remain unchanged in 2044. Accordingly, nearly 19% and 10% of the forest areas will be changed into shrubs and bushes and cropland classes, respectively. In general, only 5.3% of the study area will experience LULC changes from one category to another category. In other words, about 95% of the Giba basin will remain unchanged in the next two decades (2024-2044).
4. Conclusions
An in-depth analysis of LULC dynamics in semiarid regions plays a pivotal role in the sustainable development and management of land and water resources and environmental monitoring. In this regard, this study has investigated the historical trends and future LULC change dynamics of the Giba basin (in the semiarid region of northern Ethiopia) over the course of 60 years (1984-2044). For the historical period (1984-2024), an overall increasing trend in cropland, shrubs and bushes, settlement, and water body categories was observed, whilst a decreasing trend in forest, barren land, and grassland classes. The cropland category showed a highly increasing trend from 36% in 1984 to 50% in 2024, which depicts that high population growth has resulted in expansion of agriculture mainly through the clearance of vegetated areas. Similarly, the continuous declining trend in barren land associated with an increase in shrubs and bushes is linked to the catchment rehabilitation programs that have been intensively implemented following the government change at the beginning of the 1990s. Similarly, the 2020–2022-armed conflict in northern Ethiopia has also resulted in a decline in forest resource as farmers were forced to cut trees to generate basic income for their survival and to feed their livestock during the dry seasons.
More than 40% of the total landscape of the Giba basin has experienced a shift from one class to other classes during the 2004-2024 period. However, about 95% of the landscape will remain unchanged in the next two decades (2024-2044). The slightly declining trend (-0.6%) of the cropland during 2034-2044 has largely influenced the stability of the LULC dynamics in this period. This is because the relatively high increment in the settlement category was mainly at the expense of the small decline in cropland.
Overall, it can be noted that the CA-ANN model that utilizes remote sensing and socioeconomic data can be considered a promising tool to predict future LULC dynamics in data-limited areas like the Giba basin in northern Ethiopia. This study provided adequate information on the historical and future LULC dynamics of the study area, which can be used as input for robust planning of land and water resources. The study recommends another research on the investigation of the impacts of LULC dynamics on groundwater resources in the basin. This may provide significant information on the interactions between river basin characteristics and hydrological processes that control the availability of groundwater resources, which is becoming the main supply for domestic and irrigation water needs and ecosystem setrvices in the basin, particularly since the last two decades.
Supplementary Materials
The following supporting information can be downloaded at the website of this paper posted on Preprints.org.
Author Contributions
Conceptualization, A.B.G.; methodology, A.B.G.; software, A.B.G.; validation, A.B.G., T. G.; formal analysis, A.B.G., T. G.; writing—original draft preparation, A.B.G.; writing—review and editing, T. G., G. H. K.; supervision, T. G., G. H. K. All authors have read and agreed to the published version of the manuscript.
Funding
This research received no external funding.
Institutional Review Board Statement
Not applicable.
Informed Consent Statement
Not applicable.
Data Availability Statement
The original contributions presented in this study are included in the article/Supplementary Material. Further inquiries can be directed to the corresponding author.
Acknowledgments
The authors acknowledge Mekelle University for providing equipment for data collection activities and the USGS for providing satellite images, which are freely available to the public.
Conflicts of Interest
The authors declare no conflicts of interest.
References
- Lambin, E.F.; Turner, B.L.; Geist, H.J.; Agbola, S.B.; Angelsen, A.; Bruce, J.W.; Coomes, O.T.; Dirzo, R.; Folke, C.; Bruce, J.W.; et al. The causes of land-use and land-cover change : moving beyond the myths. Glob. Environ. Chang. 2001, 11, 261–269. [Google Scholar] [CrossRef]
- Mahmood, R.; Pielke Sr, R.A.; Hubbard, K.G.; Niyogi, D.; Bonan, G.; Lawrence, P.; Mcnider, R.; Mcalpine, C.; Etter, A.; Gameda, S.; et al. Impacts of Land Use/Land Cover Change on Climate and Future Research Priorities. Am. Meteorol. Soc. 2010, 37–46. [Google Scholar] [CrossRef]
- Frankl, A.; Poesen, J.; Haile, M.; Deckers, J.; Nyssen, J. Geomorphology Quantifying long-term changes in gully networks and volumes in dryland environments : The case of Northern Ethiopia. Geomorphology 2013, 201, 254–263. [Google Scholar] [CrossRef]
- Gebremicael, T.G.; Mohamed, Y.A.; Zaag, P. Van Der; Hagos, E.Y. Quantifying longitudinal land use change from land degradation to rehabilitation in the headwaters of Tekeze-Atbara Basin, Ethiopia. Sci. Total Environ. 2017. [Google Scholar] [CrossRef] [PubMed]
- Nyssen, J.; Poesen, J.; Moeyersons, J.; Deckers, J.; Haile, M.; Lang, A. Human impact on the environment in the Ethiopian and Eritrean highlands — a state of the art. Earth-Science Rev. 2004, 64, 273–320. [Google Scholar] [CrossRef]
- Gebreyohannes, T.; Smedt, F. De; Walraevens, K.; Gebresilassie, S.; Hussien, A.; Hagos, M.; Amare, K.; Deckers, J.; Gebrehiwot, K. Application of a spatially distributed water balance model for assessing surface water and groundwater resources in the Geba basin, Tigray, Ethiopia. J. Hydrol. 2013, 499, 110–123. [Google Scholar] [CrossRef]
- Gebru, A.B.; Gebreyohannes, T.; Kahsay, G.H. Modelling climate change and aridity for climate impact studies in semi-arid regions: The case of Giba basin, northern Ethiopia. Heliyon 2025, 11. [Google Scholar] [CrossRef]
- Habtie, T.T.; Teferi, E.; Guta, F. Multi-level determinants of land use land cover change in Tigray, Ethiopia : A mixed- effects approach using socioeconomic panel and satellite data. PLoS One 2024, 1–23. [Google Scholar] [CrossRef]
- Guyassa, E.; Frankl, A.; Lanckriet, S.; Demissie, B.; Zenebe, G.; Zenebe, A. Changes in land use / cover mapped over 80 years- in the Highlands of Northern Ethiopia. 2018, 28, 1538–1559.
- Kiptala, J.K.; Mohamed, Y.; Mul, M.L.; Cheema, M.J.M.; Van der Zaag, P. Land use and land cover classification using phenological variability from MODIS vegetation in the Upper Pangani River Basin, Eastern Africa. Phys. Chem. Earth 2013, 66, 112–122. [Google Scholar] [CrossRef]
- Betru, T.; Tolera, M.; Sahle, K.; Kassa, H. Trends and drivers of land use / land cover change in Western Ethiopia. Appl. Geogr. 2019, 104, 83–93. [Google Scholar] [CrossRef]
- Turner, B.L.; Lambin, E.F.; Reenberg, A. The emergence of land change science for global environmental change and sustainability. PNAS 2007, 105, 20690–20695. [Google Scholar] [CrossRef]
- Mallupattu, P.K.; Reddy, J.R.S. Analysis of Land Use / Land Cover Changes Using Remote Sensing Data and GIS at an Urban Area, Tirupati, India. Sci. J. 2013, 1–7. [Google Scholar] [CrossRef]
- Verburg, P.H.; Schot, P.P.; Dijst, M.J.; Veldkamp, A. Land use change modelling : current practice and research priorities. GeoJournal 2004, 61, 309–324. [Google Scholar] [CrossRef]
- Halmy, M.W.A.; Gessler, P.E.; Hicke, J.A.; Salem, B.B. Land use / land cover change detection and prediction in the north-western coastal desert of Egypt using Markov-CA. Appl. Geogr. 2015, 63, 101–112. [Google Scholar] [CrossRef]
- Agarwal, C.; Green, G.M.; Grove, J.M.; Evans, T.P.; Schweik, C.M. A Review and Assessment of Land-Use Change Models: Dynamics of Space, Time, and Human Choice; General Technical Report; U.S. Department of Agriculture, Forest Service, Northeastern Research Station: Newton Square, PA, USA; 2002. [Google Scholar]
- Weng, Q. Land use change analysis in the Zhujiang Delta of China using satellite remote sensing, GIS and stochastic modelling. J. Environ. Manage. 2002, 64, 273–284. [Google Scholar] [CrossRef] [PubMed]
- Kamaraj, M.; Rangarajan, S. Predicting the future land use and land cover changes for Bhavani basin, Tamil Nadu, India, using QGIS MOLUSCE plugin. Environ. Sci. Pollut. Res. 2022, 29. [Google Scholar] [CrossRef]
- Li, T.; Li, W. Multiple land use change simulation with Monte Carlo approach and CA-ANN model, a case study in Shenzhen, China. Environ. Syst. Res. 2015, 4, 1–10. [Google Scholar] [CrossRef]
- Koko, A.F.; Yue, W.; Abubakar, G.A.; Hamed, R.; Alabsi, A.A.N. Monitoring and Predicting Spatio-Temporal Land Use / Land Cover Changes in Zaria City, Nigeria, through an Integrated Cellular Automata and Markov Chain Model (CA-Markov). Sustainability 2020, 12. [Google Scholar] [CrossRef]
- Clarke, K.C.; Gaydos, L.J. Loose-coupling a cellular automaton model and GIS : long-term urban growth prediction for San Francisco and Washington / Baltimore. Int. J. Geogr. Inf. Sci. 1998, 12, 699–714. [Google Scholar] [CrossRef]
- Gidey, E.; Dikinya, O.; Sebego, R.; Segosebe, E.; Zenebe, A. Cellular automata and Markov Chain ( CA _ Markov ) model-based predictions of future land use and land cover scenarios ( 2015 – 2033 ) in Raya, northern Ethiopia. Model. Earth Syst. Environ. 2017, 0, 0. [Google Scholar] [CrossRef]
- Tadese, S.; Soromessa, T.; Bekele, T. Analysis of the Current and Future Prediction of Land Use/Land Cover Change Using Remote Sensing and the CA-Markov Model in Majang Forest Biosphere Reserves of Gambella, Southwestern Ethiopia. Sci. World J. 2021, 2021. [Google Scholar] [CrossRef]
- Entahabu, H.H.; Minale, A.S.; Birhane, E. Modeling and Predicting Land Use/Land Cover Change Using the Land Change Modeler in the Suluh River Basin, Northern Highlands of Ethiopia. Sustainability 2023, 15, 21–25. [Google Scholar] [CrossRef]
- Eshetie, A.A.; Wubneh, M.A.; Kifelew, M.S.; Alemu, M.G. Application of artificial neural network ( ANN ) for investigation of the impact of past and future land use – land cover change on streamflow in the Upper Gilgel Abay watershed, Abay Basin, Appl. Water Sci. 2023, 13, 1–22. [Google Scholar] [CrossRef]
- Lukas, P.; Melesse, A.M.; Kenea, T.T. Prediction of Future Land Use / Land Cover Changes Using a Coupled CA-ANN Model in the Upper Omo – Gibe River. Remote Sens. 2023. [Google Scholar] [CrossRef]
- Tesfagiorgis, K.; Gebreyohannes, T.; De Smedt, F.; Moeyersons, J.; Hagos, M.; Nyssen, J.; Deckers, J. Evaluation of groundwater resources in the Geba basin, Ethiopia. Bull. Eng. Geol. Environ. 2010, 70, 461–466. [Google Scholar] [CrossRef]
- Godif, G.; Manjunatha, B.R. Prioritizing sub-watersheds for soil and water conservation via morphometric analysis and the weighted sum approach : A case study of the Geba river basin in Tigray, Ethiopia. Heliyon 2022, 8. [Google Scholar] [CrossRef]
- Nyssen, J.; Frankl, A.; Haile, M.; Hurni, H.; Descheemaeker, K.; Crummey, D.; Ritler, A.; Portner, B.; Nievergelt, B.; Moeyersons, J.; et al. Environmental conditions and human drivers for changes to north Ethiopian mountain landscapes over 145 years. Sci. Total Environ. 2014, 164–179. [Google Scholar] [CrossRef]
- Lanckriet, S.; Derudder, B.; Naudts, J.; Bauer, H.; Deckers, J.; Haile, M.; Nyssen, J. A Political Ecology Perspective of Land Degradation in the North Ethiopian Highlands. L. Degrad. Dev. 2015, 26, 521–530. [Google Scholar] [CrossRef]
- Meaza, H.; Ghebreyohannes, T.; Tesfamariam, Z.; Gebresamuel, G.; Demissie, B.; Gebregziabher, D.; Nyssen, J. The effects of armed conflict on natural resources and conservation measures in Tigray, Northern Ethiopia. Int. Soil Water Conserv. Res. 2024. [Google Scholar] [CrossRef]
- Wondie, M.; Schneider, W.; Melesse, A.M.; Teketay, D. Spatial and Temporal Land Cover Changes in the Simen Mountains National Park, a World Heritage Site in Northwestern Ethiopia. Remote Sens. 2011, 3, 752–766. [Google Scholar] [CrossRef]
- Meire, E.; Frankl, A.; Wulf, A. De; Haile, M.; Deckers, J.; Nyssen, J. Land use and cover dynamics in Africa since the nineteenth century : warped terrestrial photographs of North Ethiopia. 2013, 717–737. [CrossRef]
- Congalton, R.G. Accuracy assessment and validation of remotely sensed and other spatial information. Int. J. Wildl. Fire 2001, 10, 321–328. [Google Scholar] [CrossRef]
- Haregeweyn, N.; Poesen, J.; Nyssen, J.; Wit, J. De; Haile, M.; Govers, G.; Deckers, S. Reservoirs in Tigray (Northern Ethiopia): Characteristics and Sediment Deposition Problems. L. Degrad. Dev. 2006, 17, 211–230. [Google Scholar] [CrossRef]
- Munro, R.N.; Deckers, J.; Haile, M.; Grove, A.T.; Poesen, J.; Nyssen, J. Soil landscapes, land cover change and erosion features of the Central Plateau region of Tigrai, Ethiopia : Photo-monitoring with an interval of 30 years. Catena 2008, 75, 55–64. [Google Scholar] [CrossRef]
- Nyssen, J.; Clymans, W.; Descheemaeker, K.; Poesen, J.; Vandecasteele, I.; Vanmaercke, M.; Zenebe, A.; Camp, M. Van; Haile, M.; Haregeweyn, N.; et al. Impact of soil and water conservation measures on catchment hydrological response — a case in north Ethiopia. Hydrol. Process. 2010, 24, 1880–1895. [Google Scholar] [CrossRef]
- Hishe, S.; Gidey, E.; Zenebe, A.; Bewket, W.; Lyimo, J.; Knight, J.; Gebretekle, T. The impacts of armed con fl ict on vegetation cover degradation in. Int. Soil Water Conserv. Res. 2024, 12, 635–649. [Google Scholar] [CrossRef]
- Abraha, A.Z. Assessment of spatial and temporal variability of river discharge , sediment yield and sediment-fixed nutrient export in Geba River catchment, northern Ethiopia. PhD Thesis, Katholieke Universiteit Leuven., 2009.
- Ashenafi, A.A. Modeling Hydrological Responses to Changes in Land Cover and Climate in Geba River Basin , Northern Ethiopia. 2014.
- Abebe, B.A. Modeling the Effect of Climate and Land Use Change on the Water Resources in Northern Ethiopia: the Case of Suluh River Basin. PhD Thesis, Freie Universität Berlin., 2014.
- Gebremicael, T.G.; Mohamed, Y.A.; van der Zaag, P.; Hagos, E.Y. Quantifying longitudinal land use change from land degradation to rehabilitation in the headwaters of Tekeze-Atbara Basin, Ethiopia. Sci. Total Environ. 2017. [Google Scholar] [CrossRef] [PubMed]
Figure 1.
Geographical location of the study area.
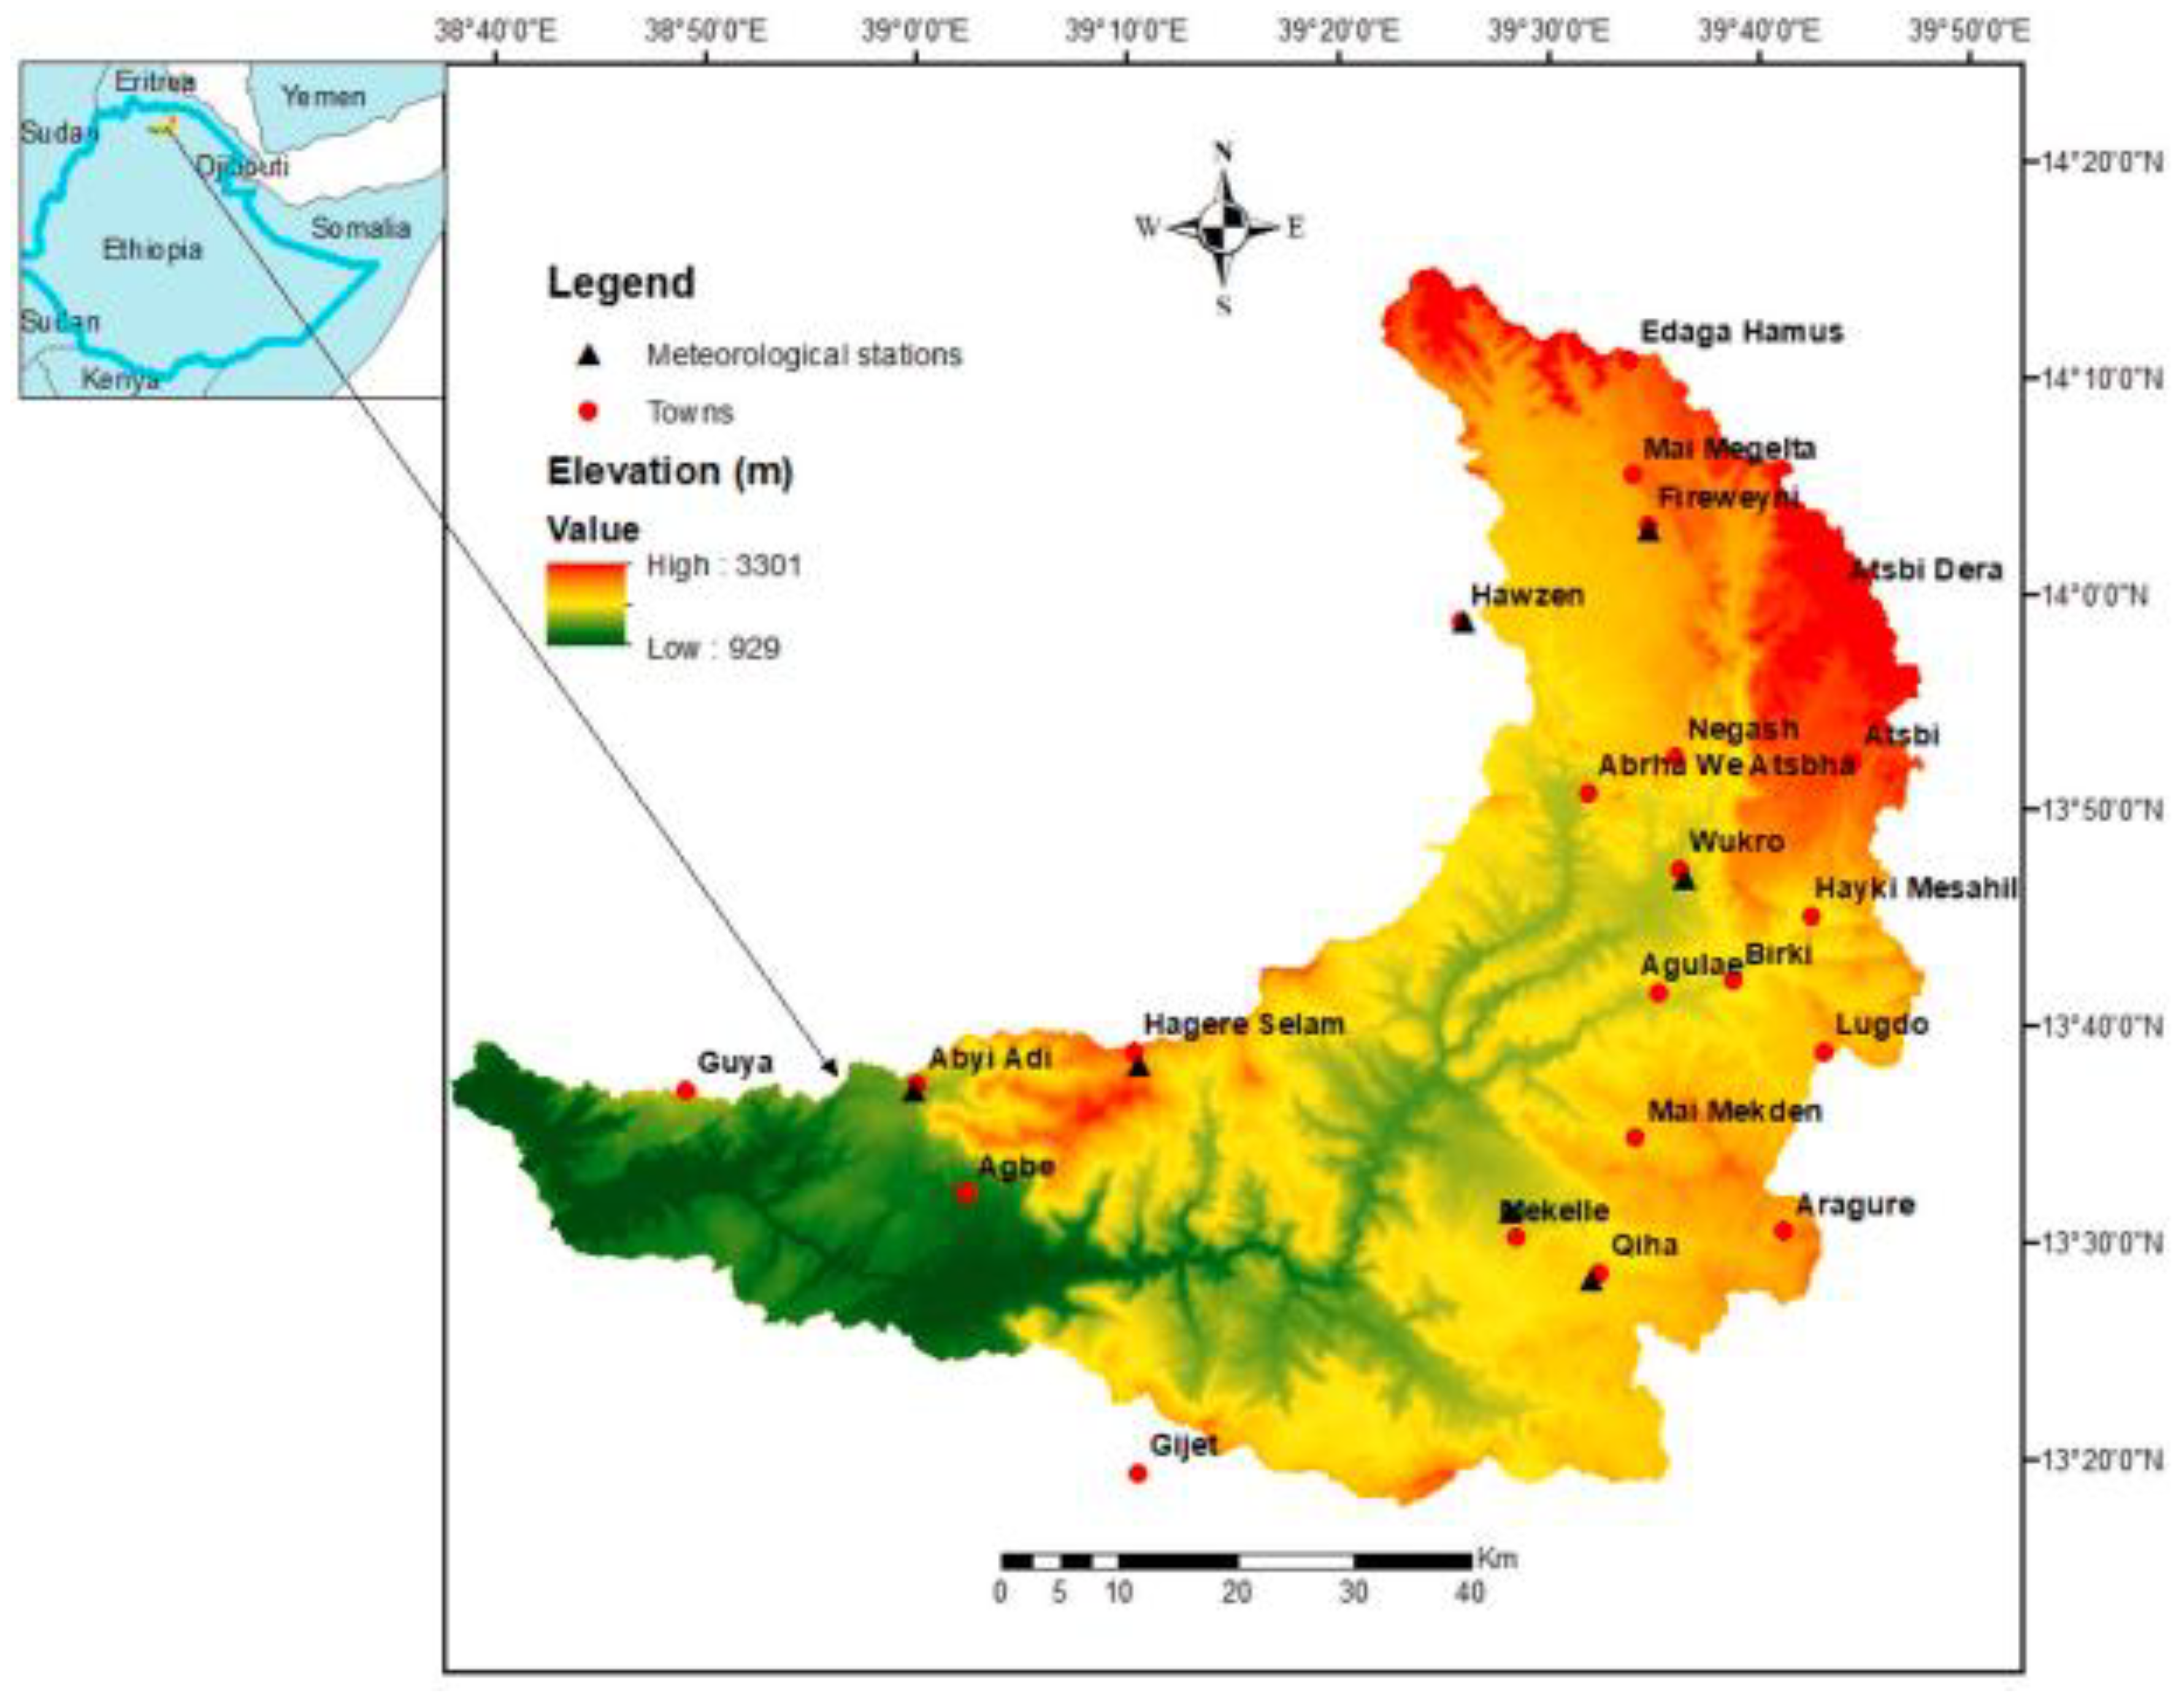
Figure 2.
Methodological flowchart showing historical LULC classification and future prediction, adopted from Lukas et al. (2023) [26].
Figure 2.
Methodological flowchart showing historical LULC classification and future prediction, adopted from Lukas et al. (2023) [26].
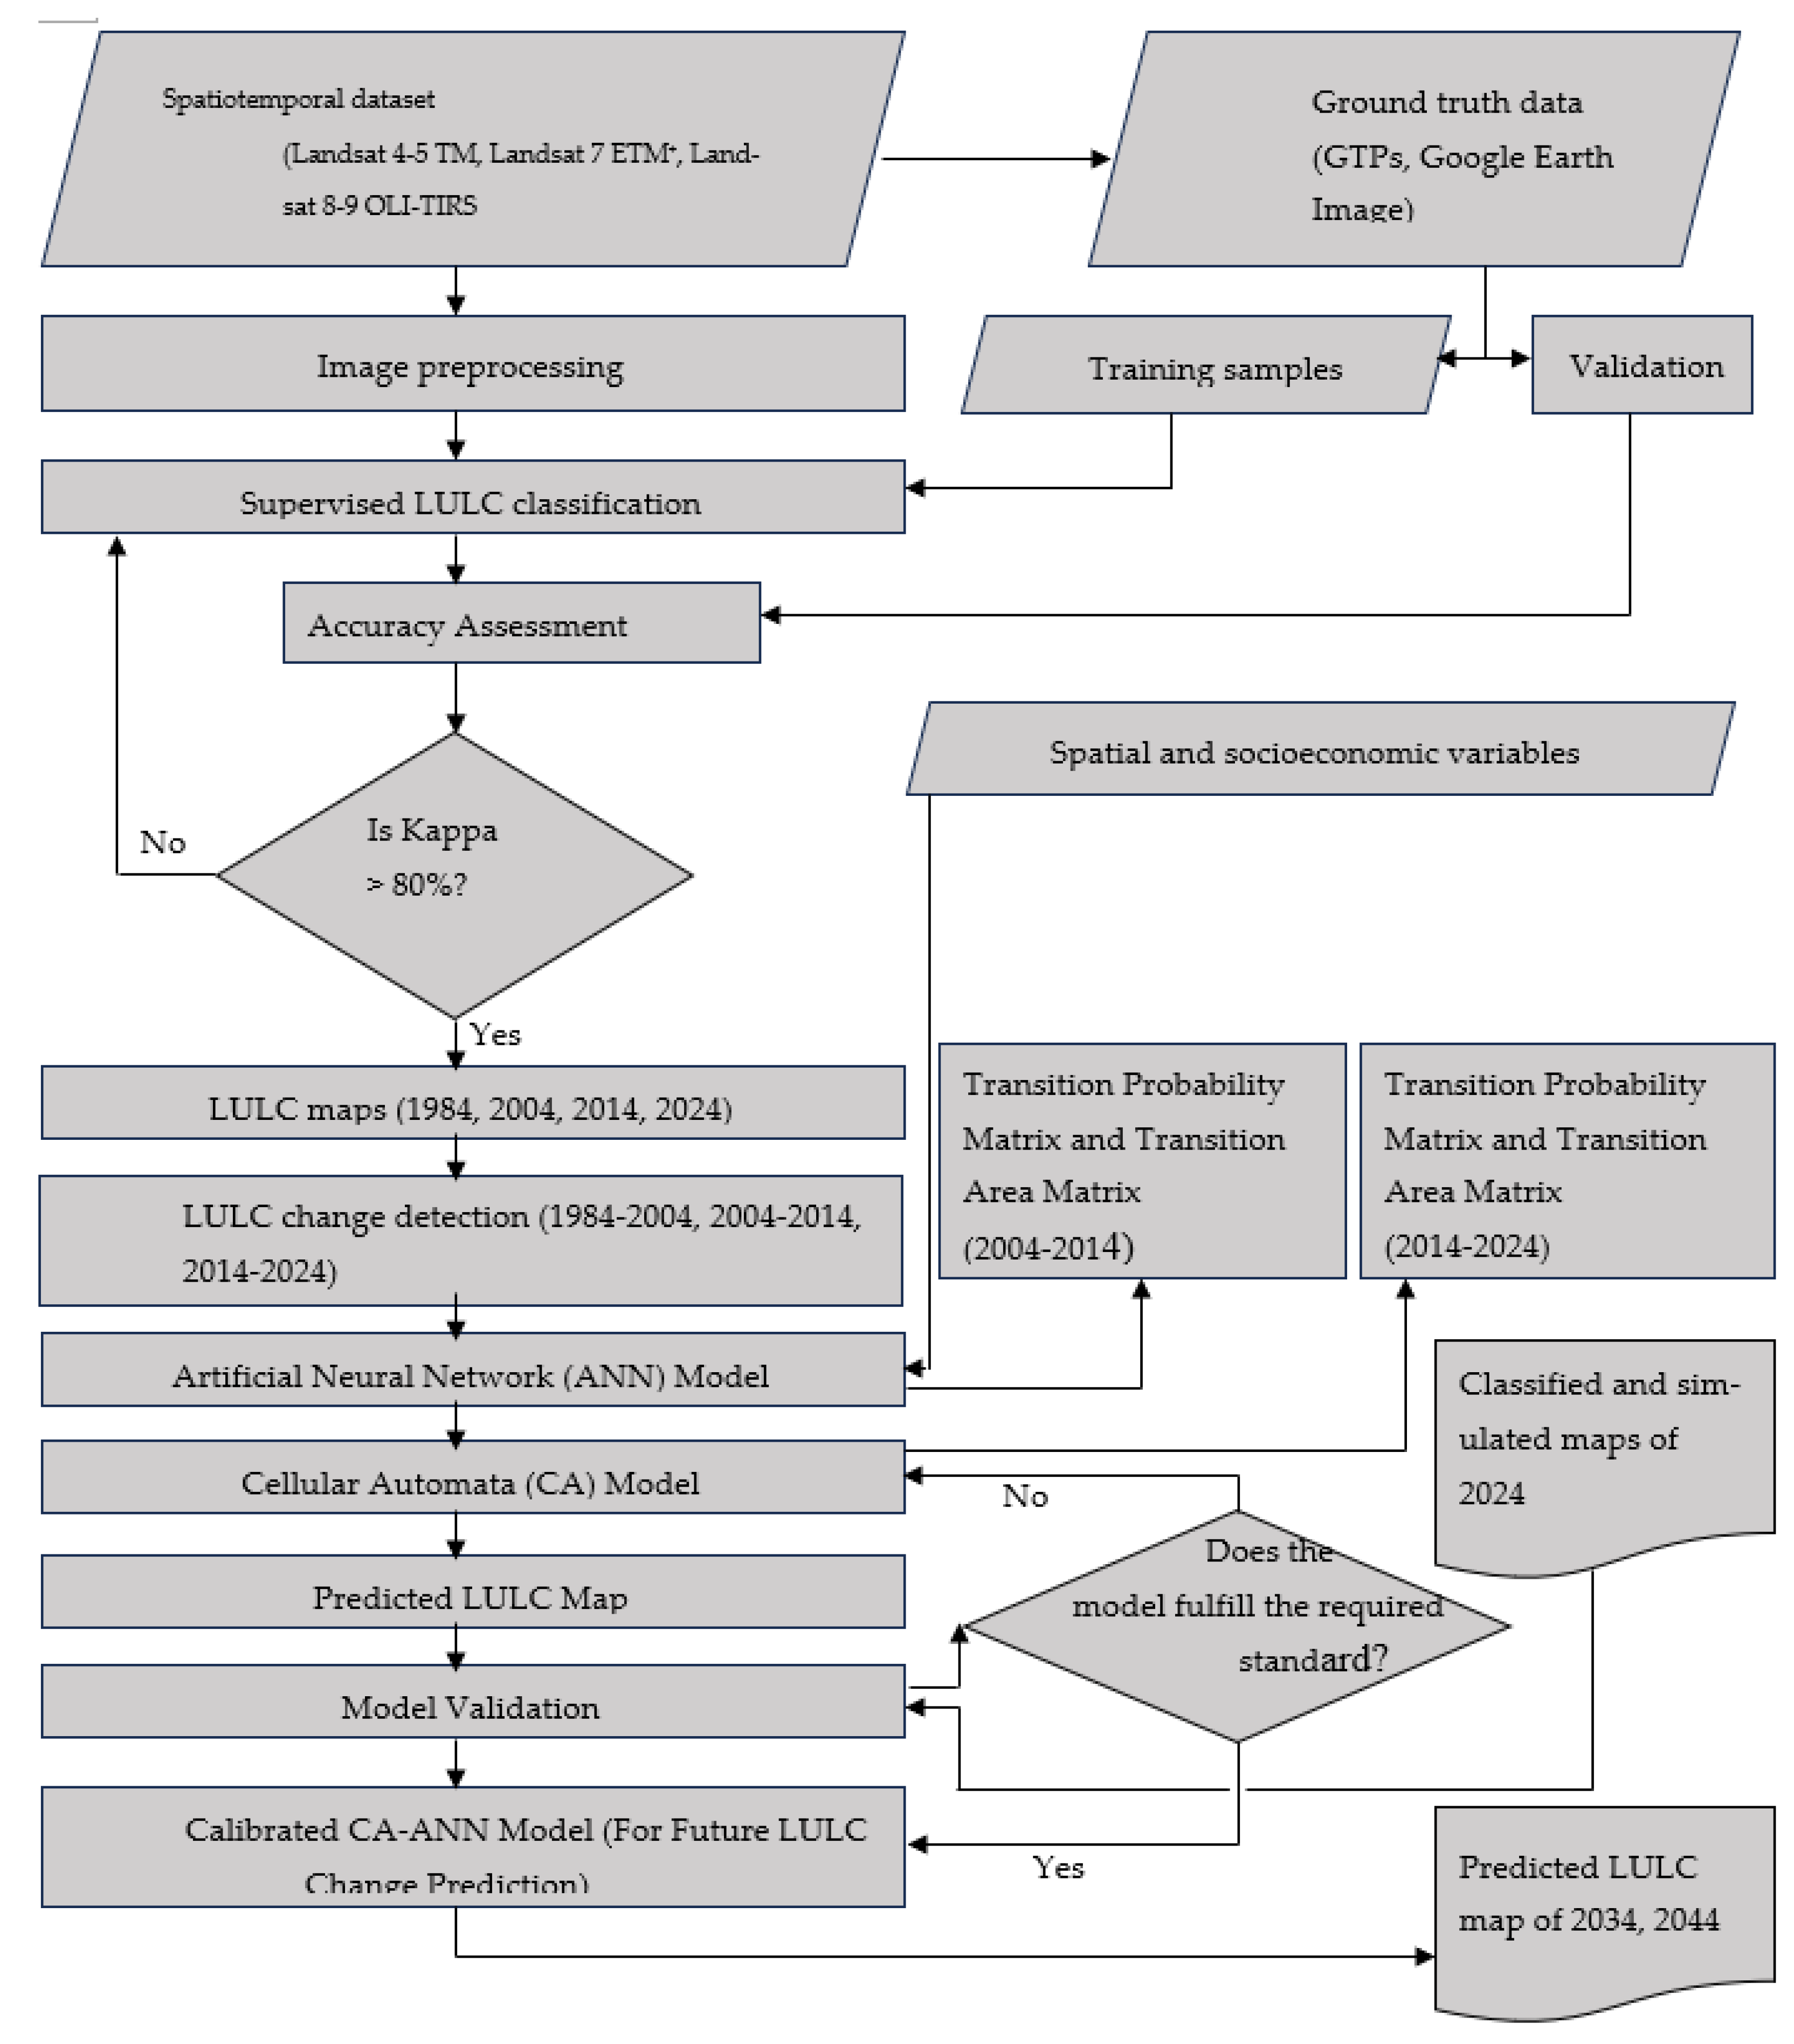
Figure 3.
LULC maps of the Giba basin in 1984, 2004, 2014, and 2024.
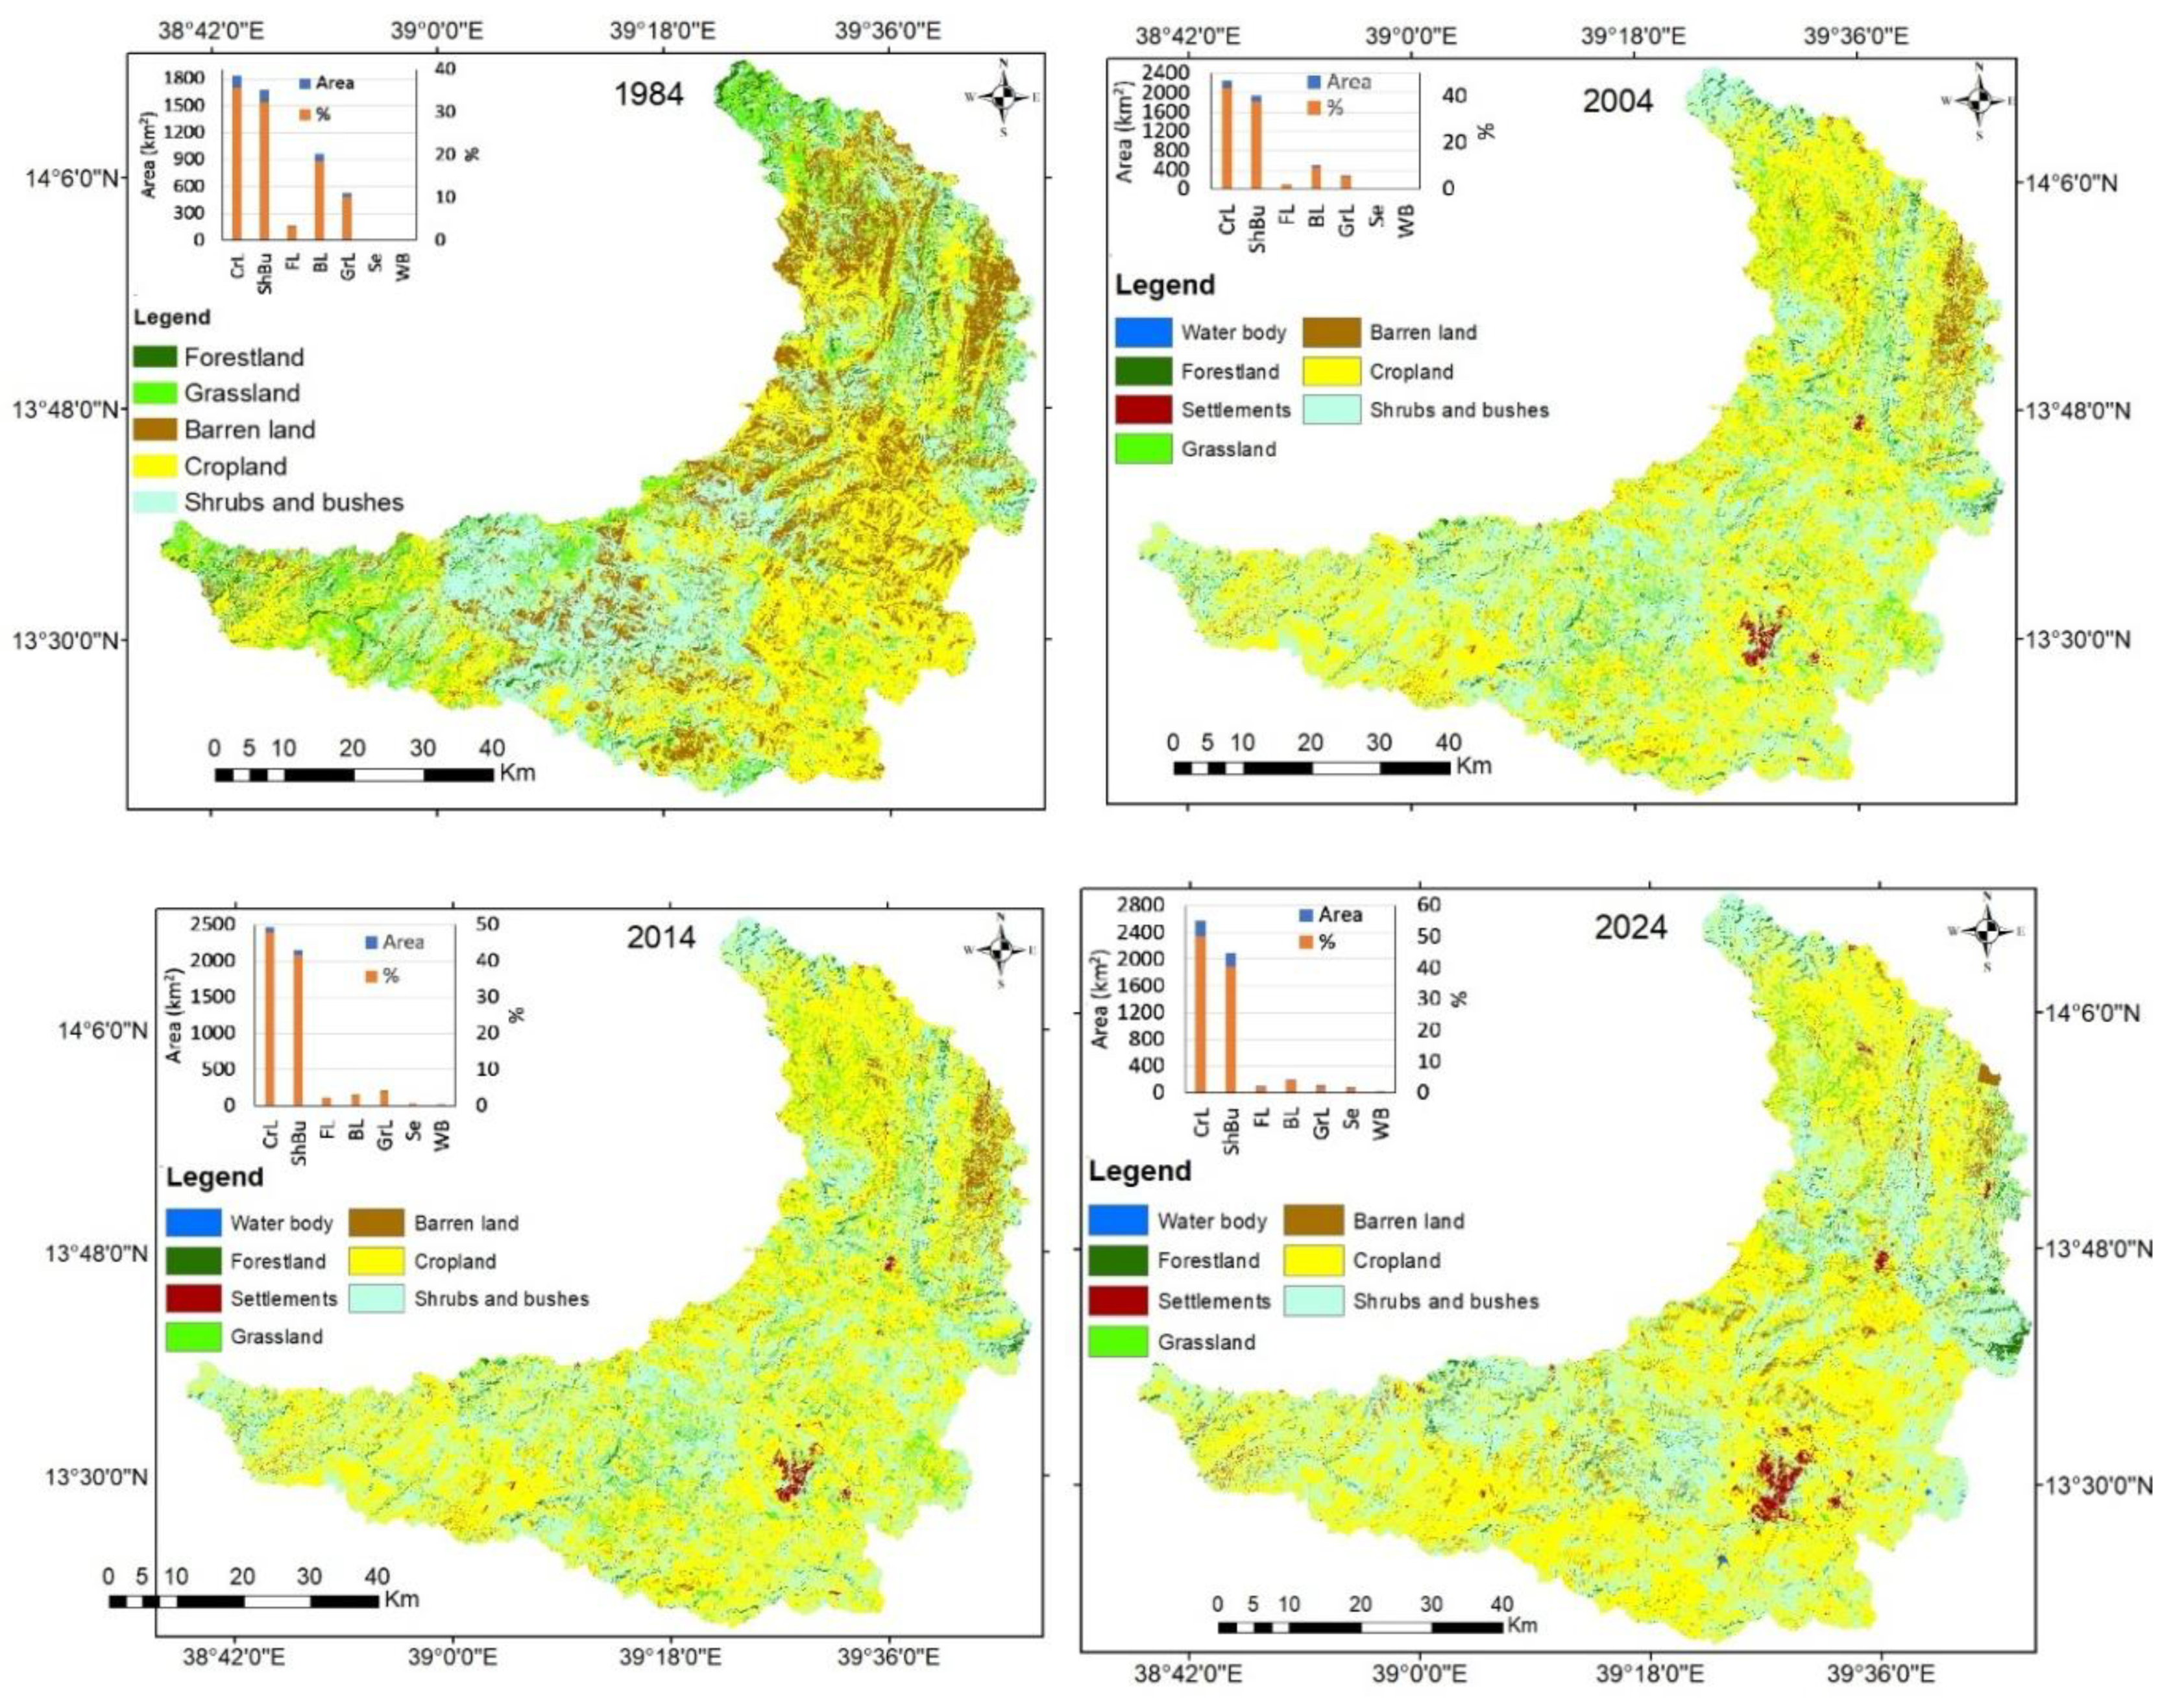
Figure 4.
Absolute area of each LULC type for the four periods (a) and change in areas between each time periods (b) in the Giba basin.
Figure 4.
Absolute area of each LULC type for the four periods (a) and change in areas between each time periods (b) in the Giba basin.
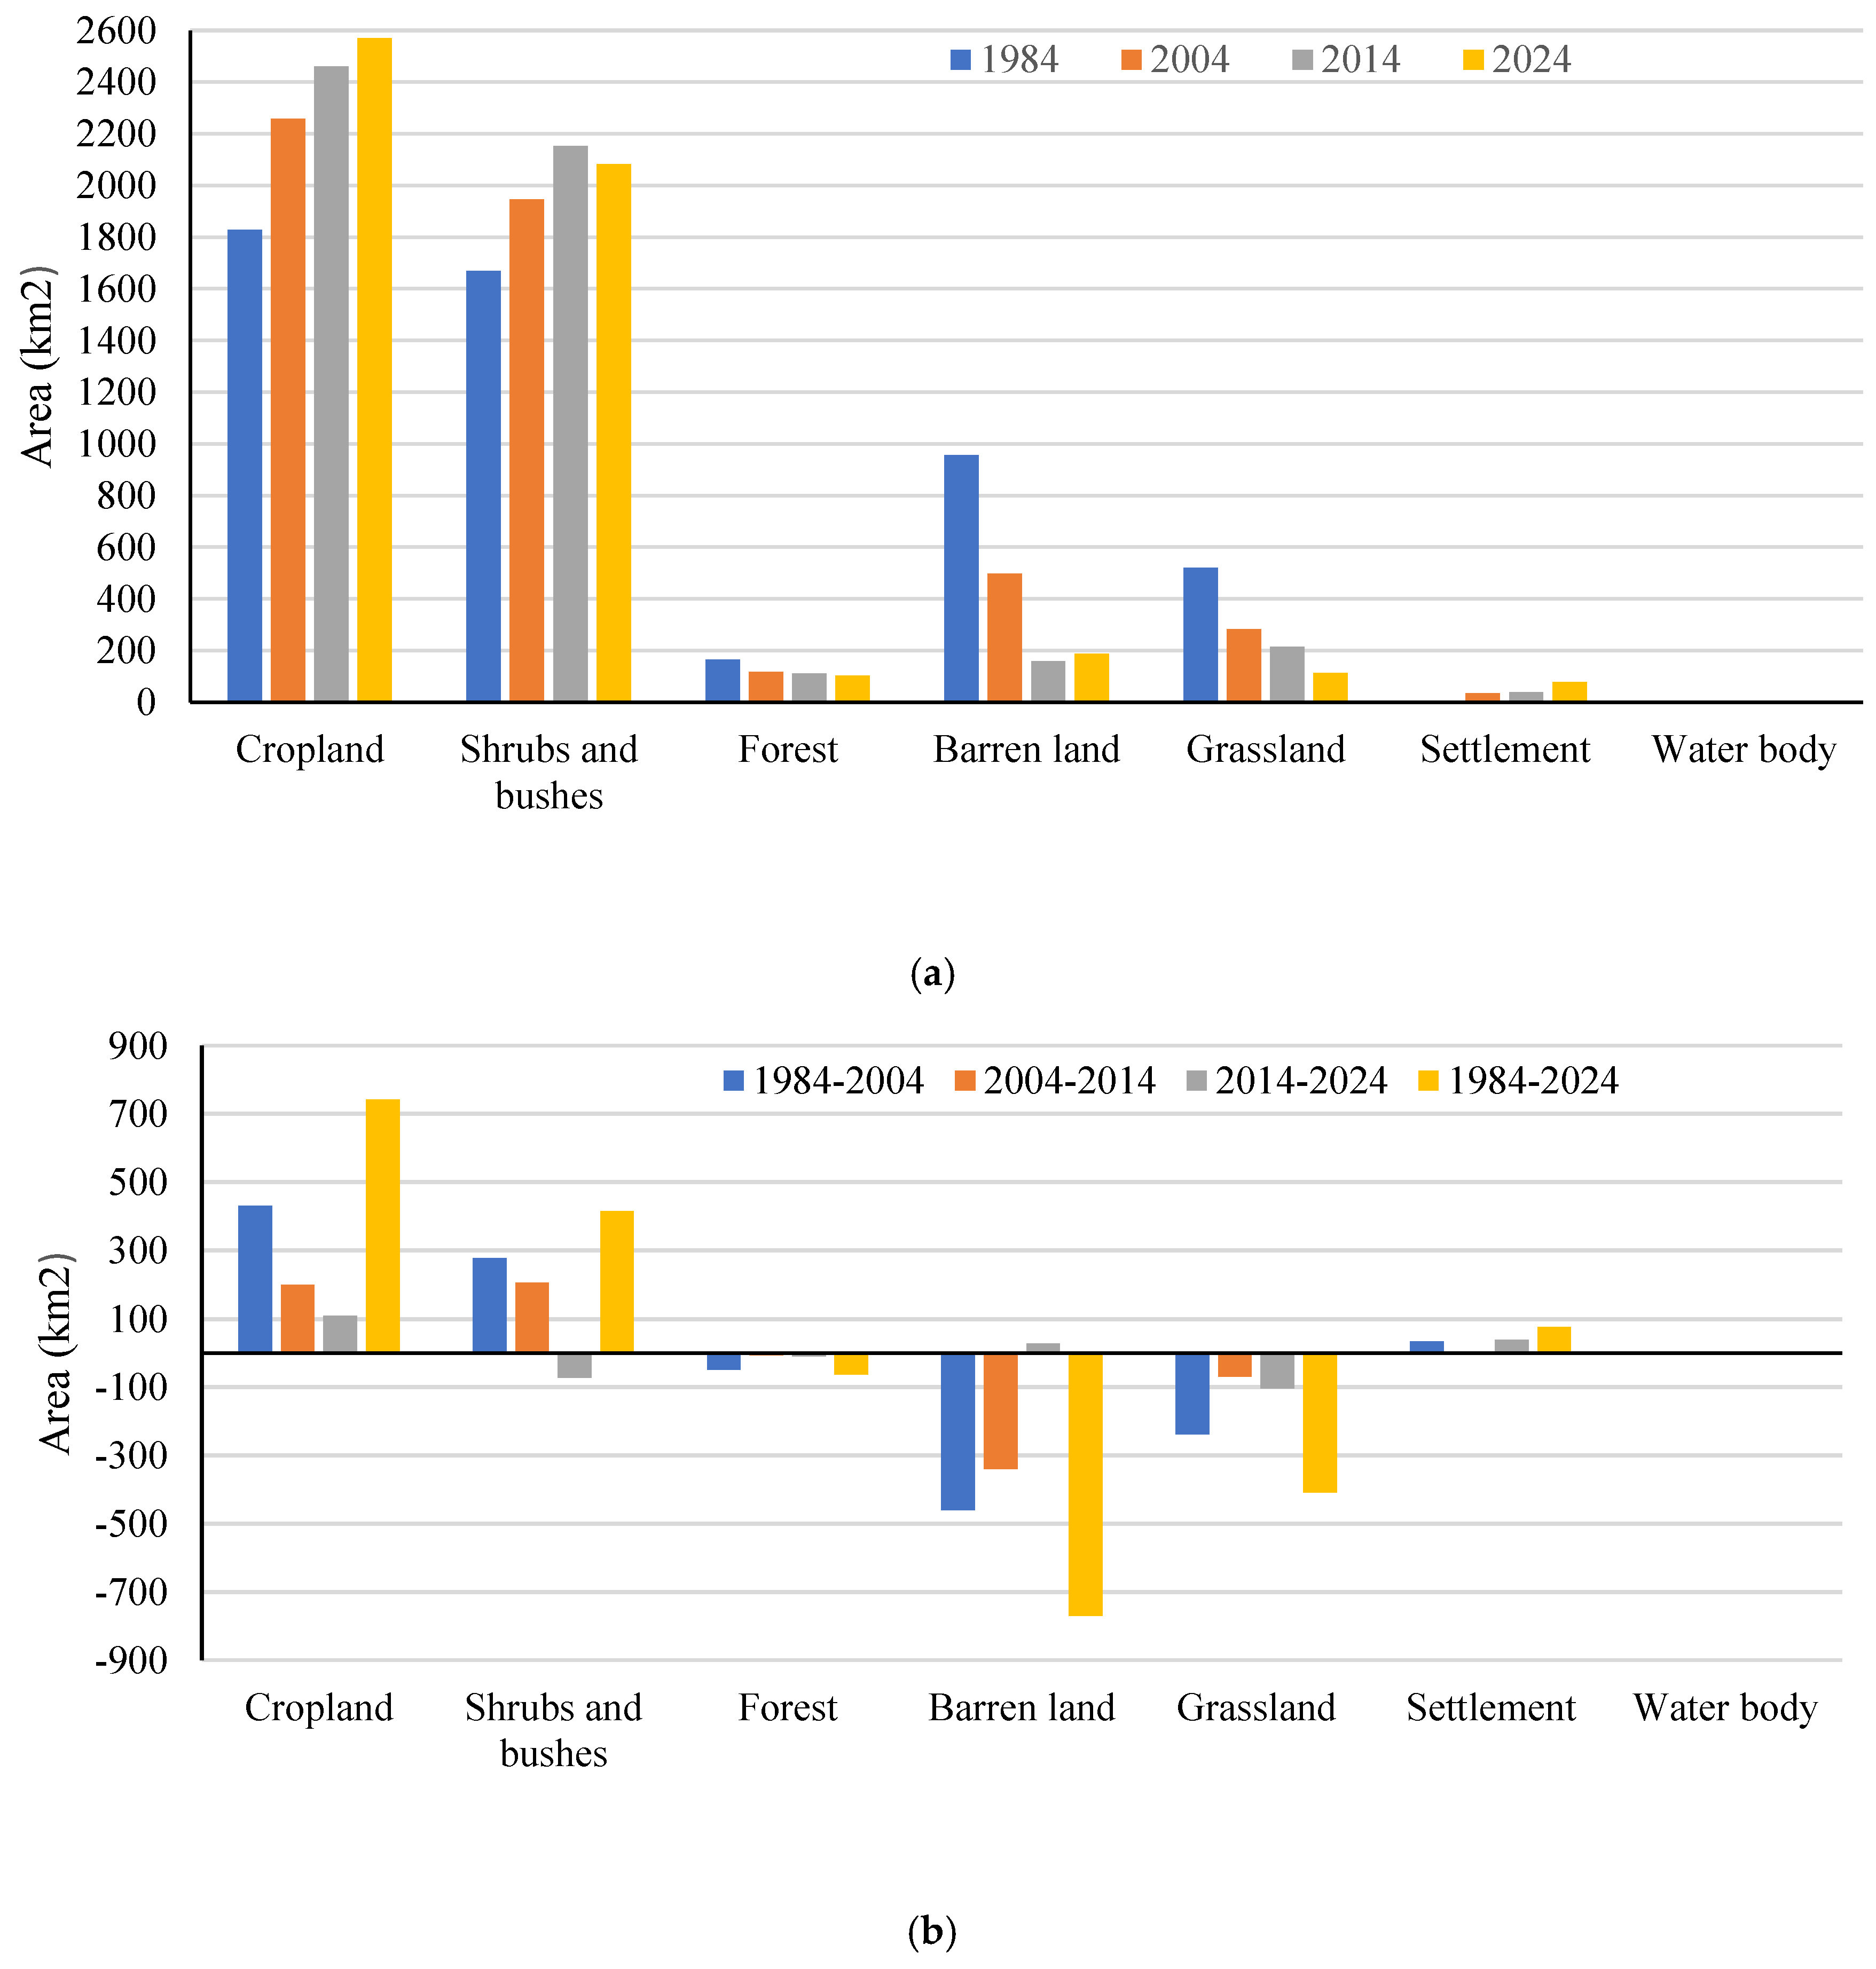
Figure 5.
LULC change from sparsely vegetated classes in 2014 (left) to croplands in 2024 (right) in the hillslopes of northeastern of Giba basin (UTM: 572537 m E and 1556606 m N), (Source: Google Earth).
Figure 5.
LULC change from sparsely vegetated classes in 2014 (left) to croplands in 2024 (right) in the hillslopes of northeastern of Giba basin (UTM: 572537 m E and 1556606 m N), (Source: Google Earth).
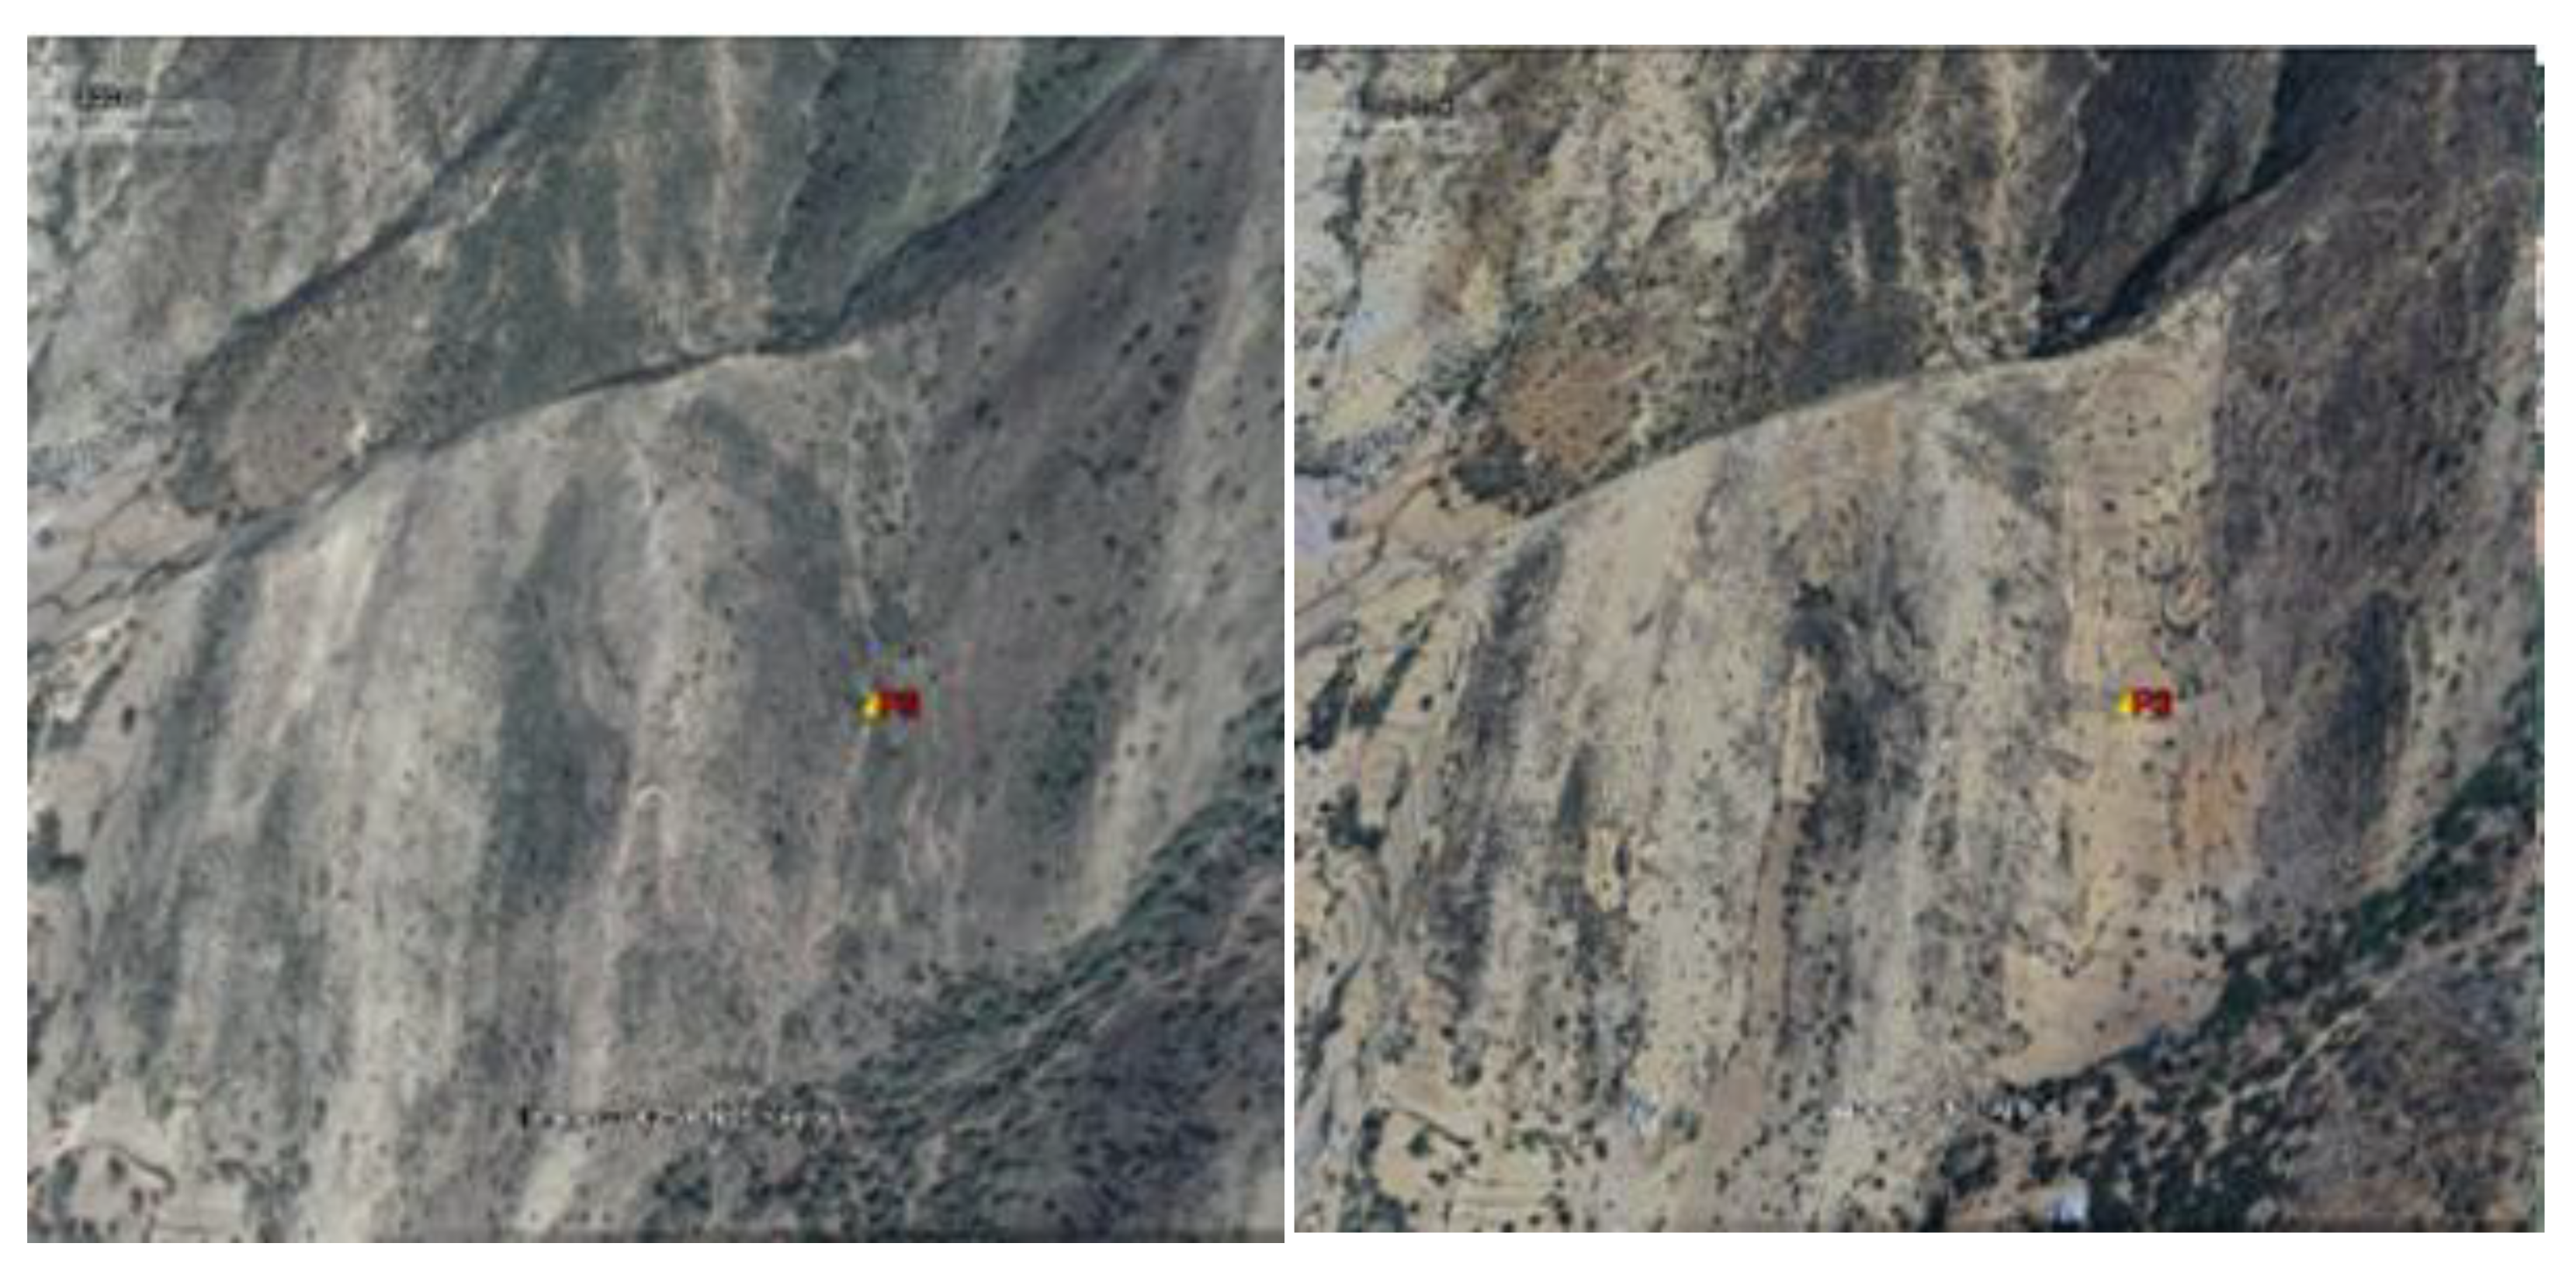
Figure 6.
Comparison of abundant tress around the bottom of the mountain in 2019 (left) and after deforestation during the 2020–2022-armed conflict (right) near the outlet of the Giba basin (UTM: 481063 m E and 1505009 m N), (Source: Google Earth).
Figure 6.
Comparison of abundant tress around the bottom of the mountain in 2019 (left) and after deforestation during the 2020–2022-armed conflict (right) near the outlet of the Giba basin (UTM: 481063 m E and 1505009 m N), (Source: Google Earth).
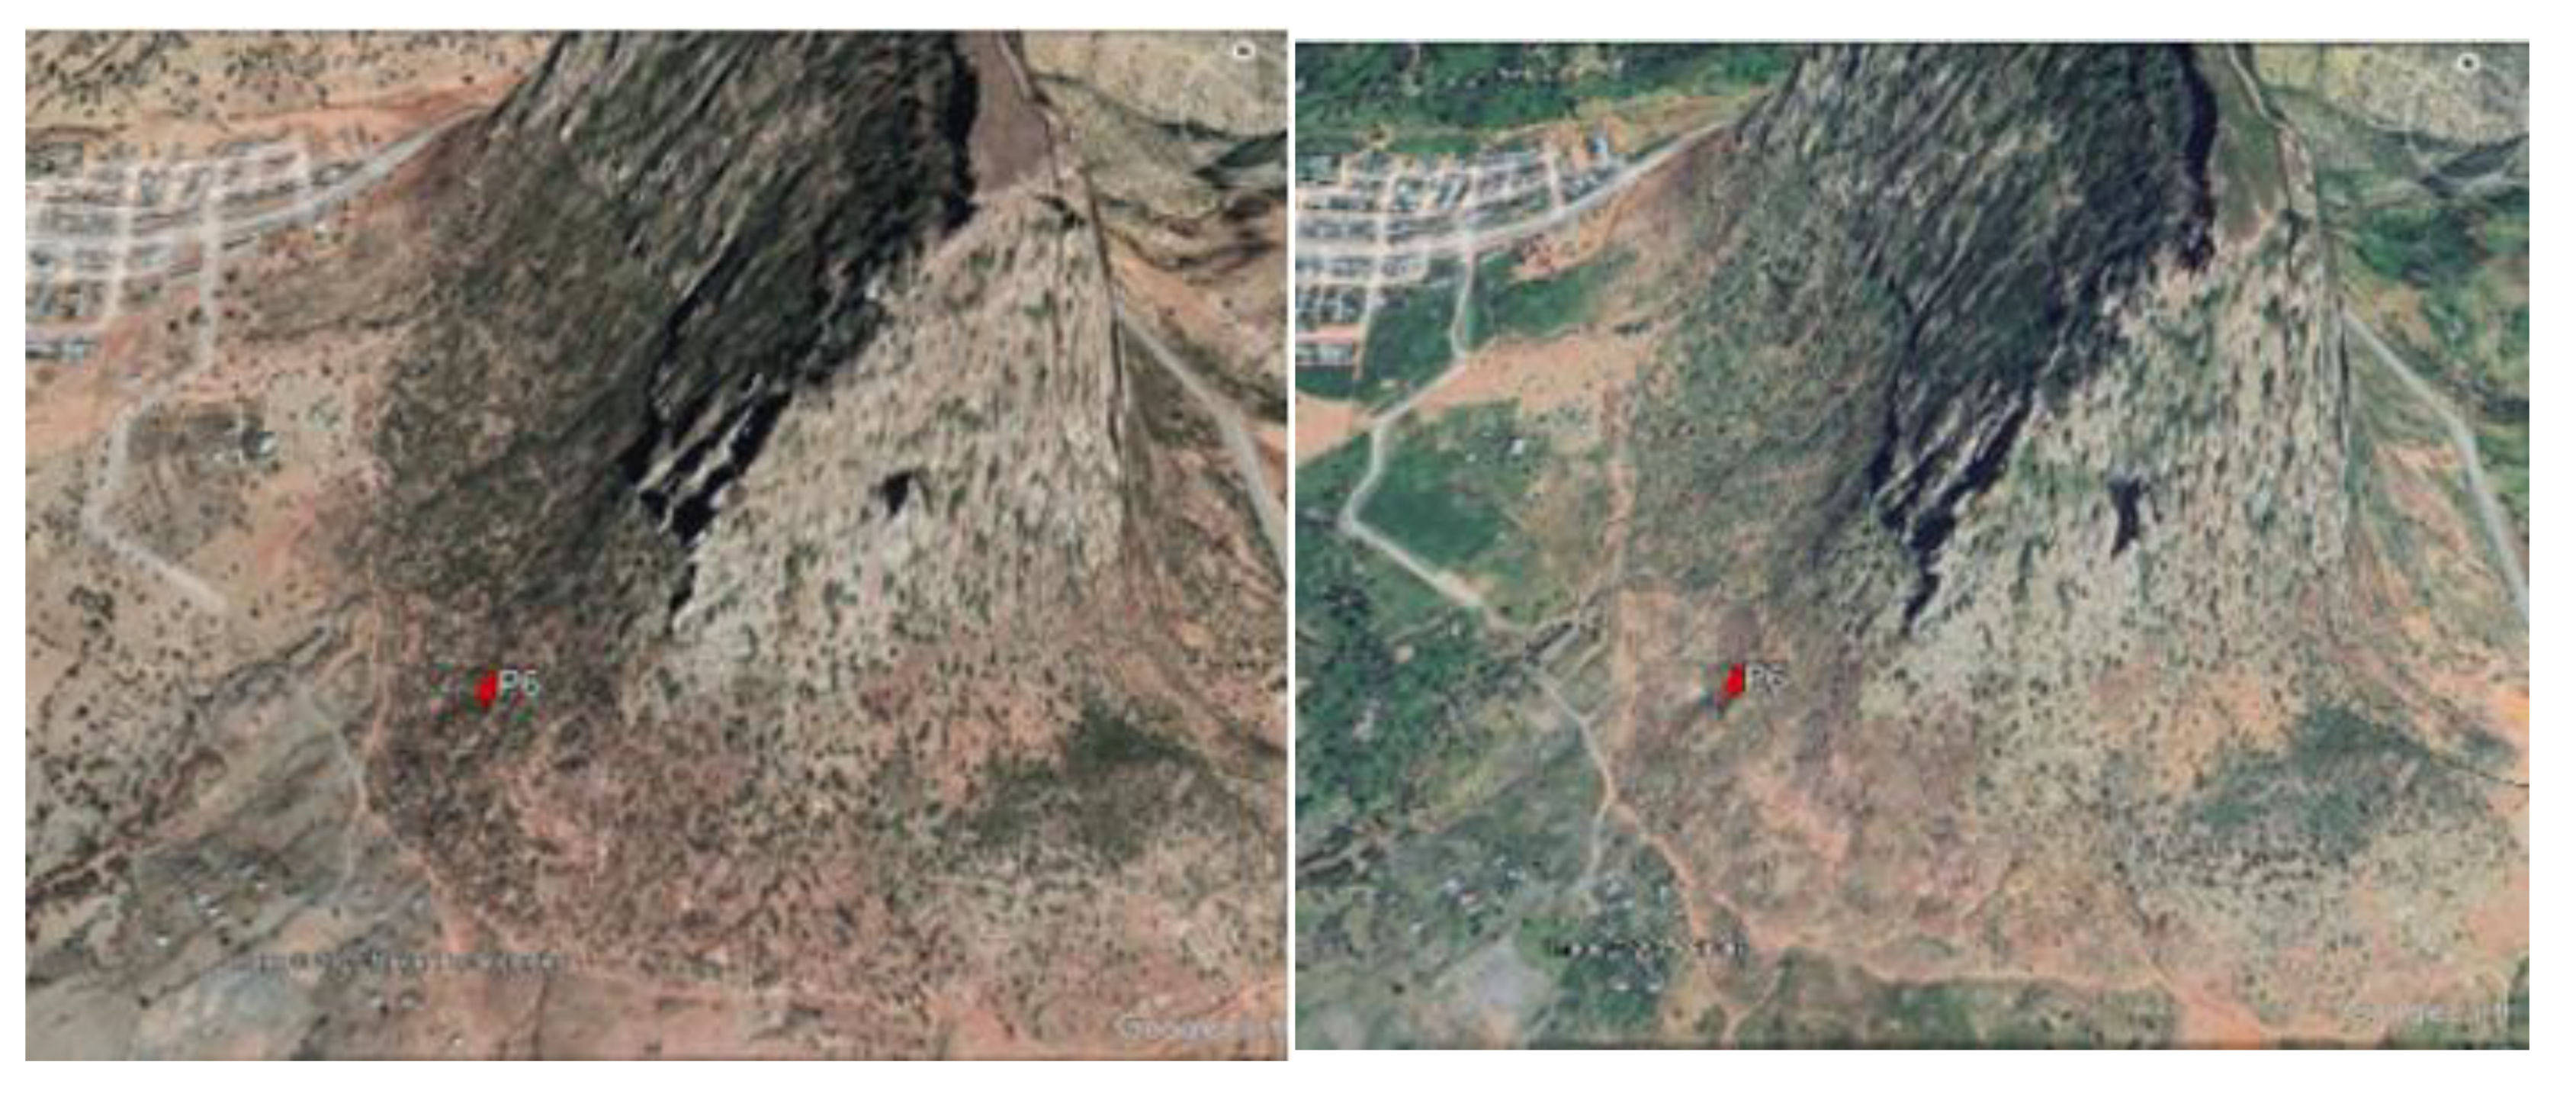
Figure 7.
Indiscriminate cutting of trees for animal fodder during the dry period near the outlet of the Giba basin (Photo was taken on May 30, 2025).
Figure 7.
Indiscriminate cutting of trees for animal fodder during the dry period near the outlet of the Giba basin (Photo was taken on May 30, 2025).
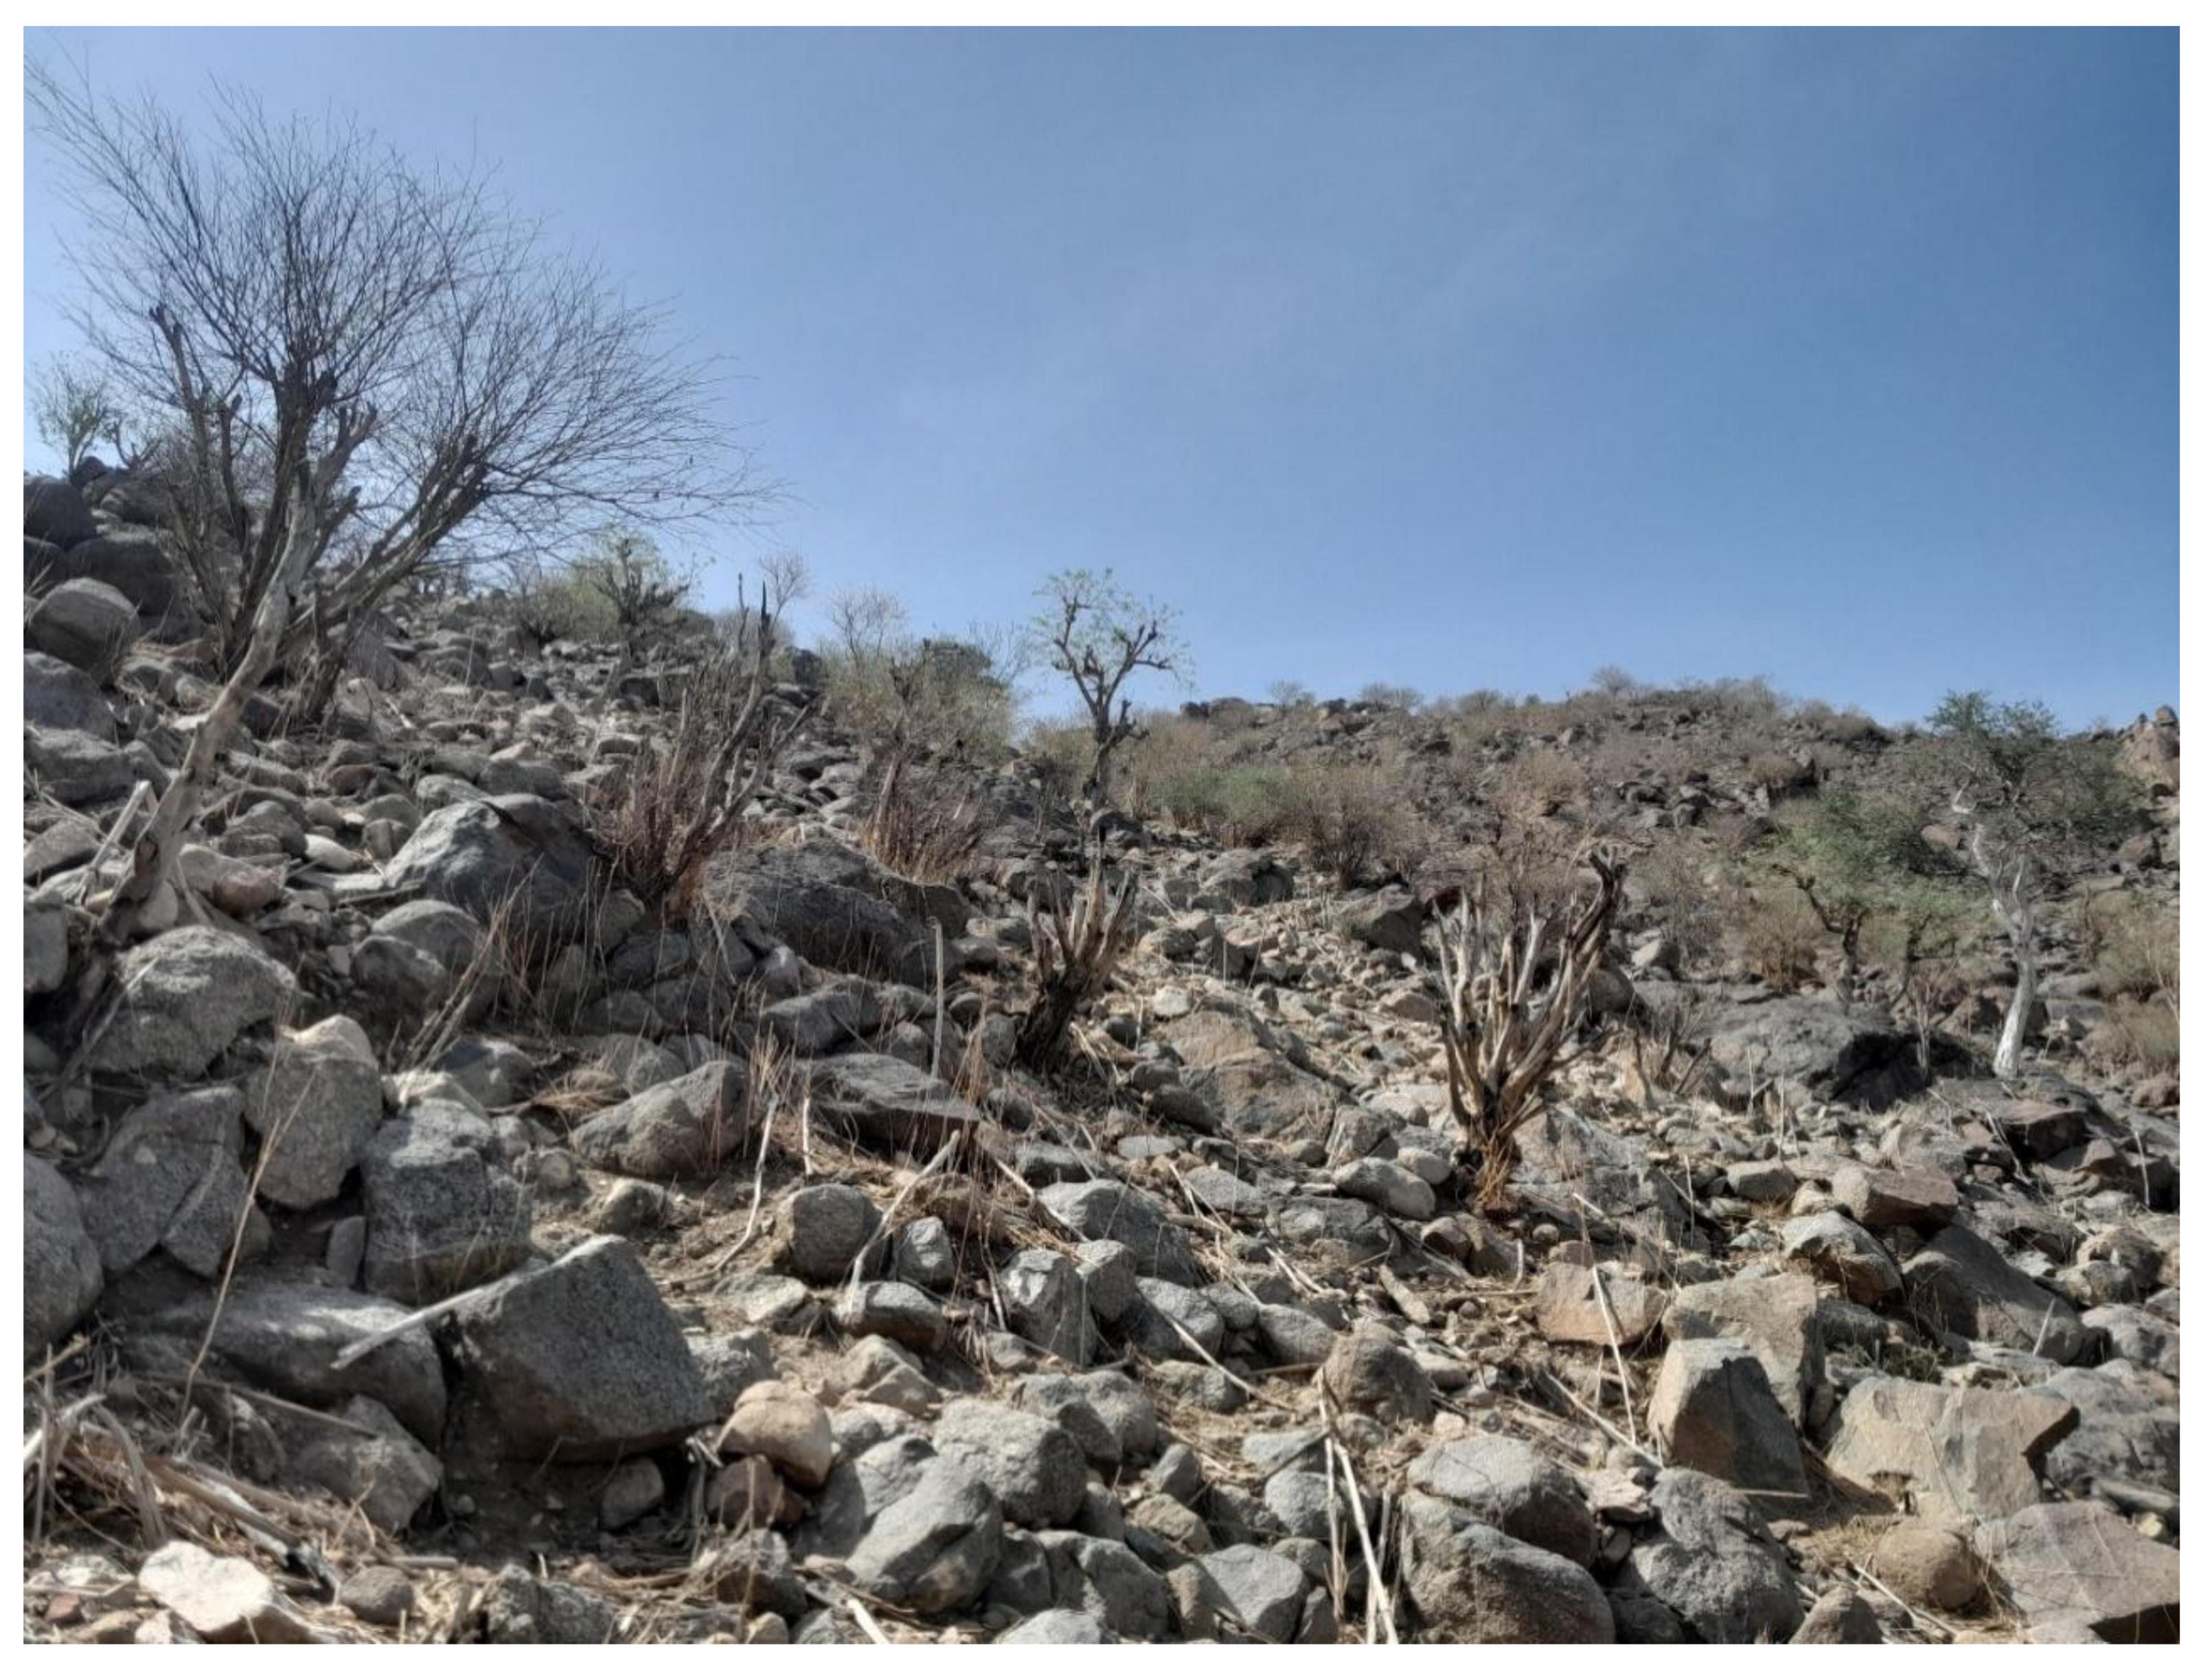
Figure 8.
Future LULC projection of the Giba basin for 2034 (a) and 2044 (b).
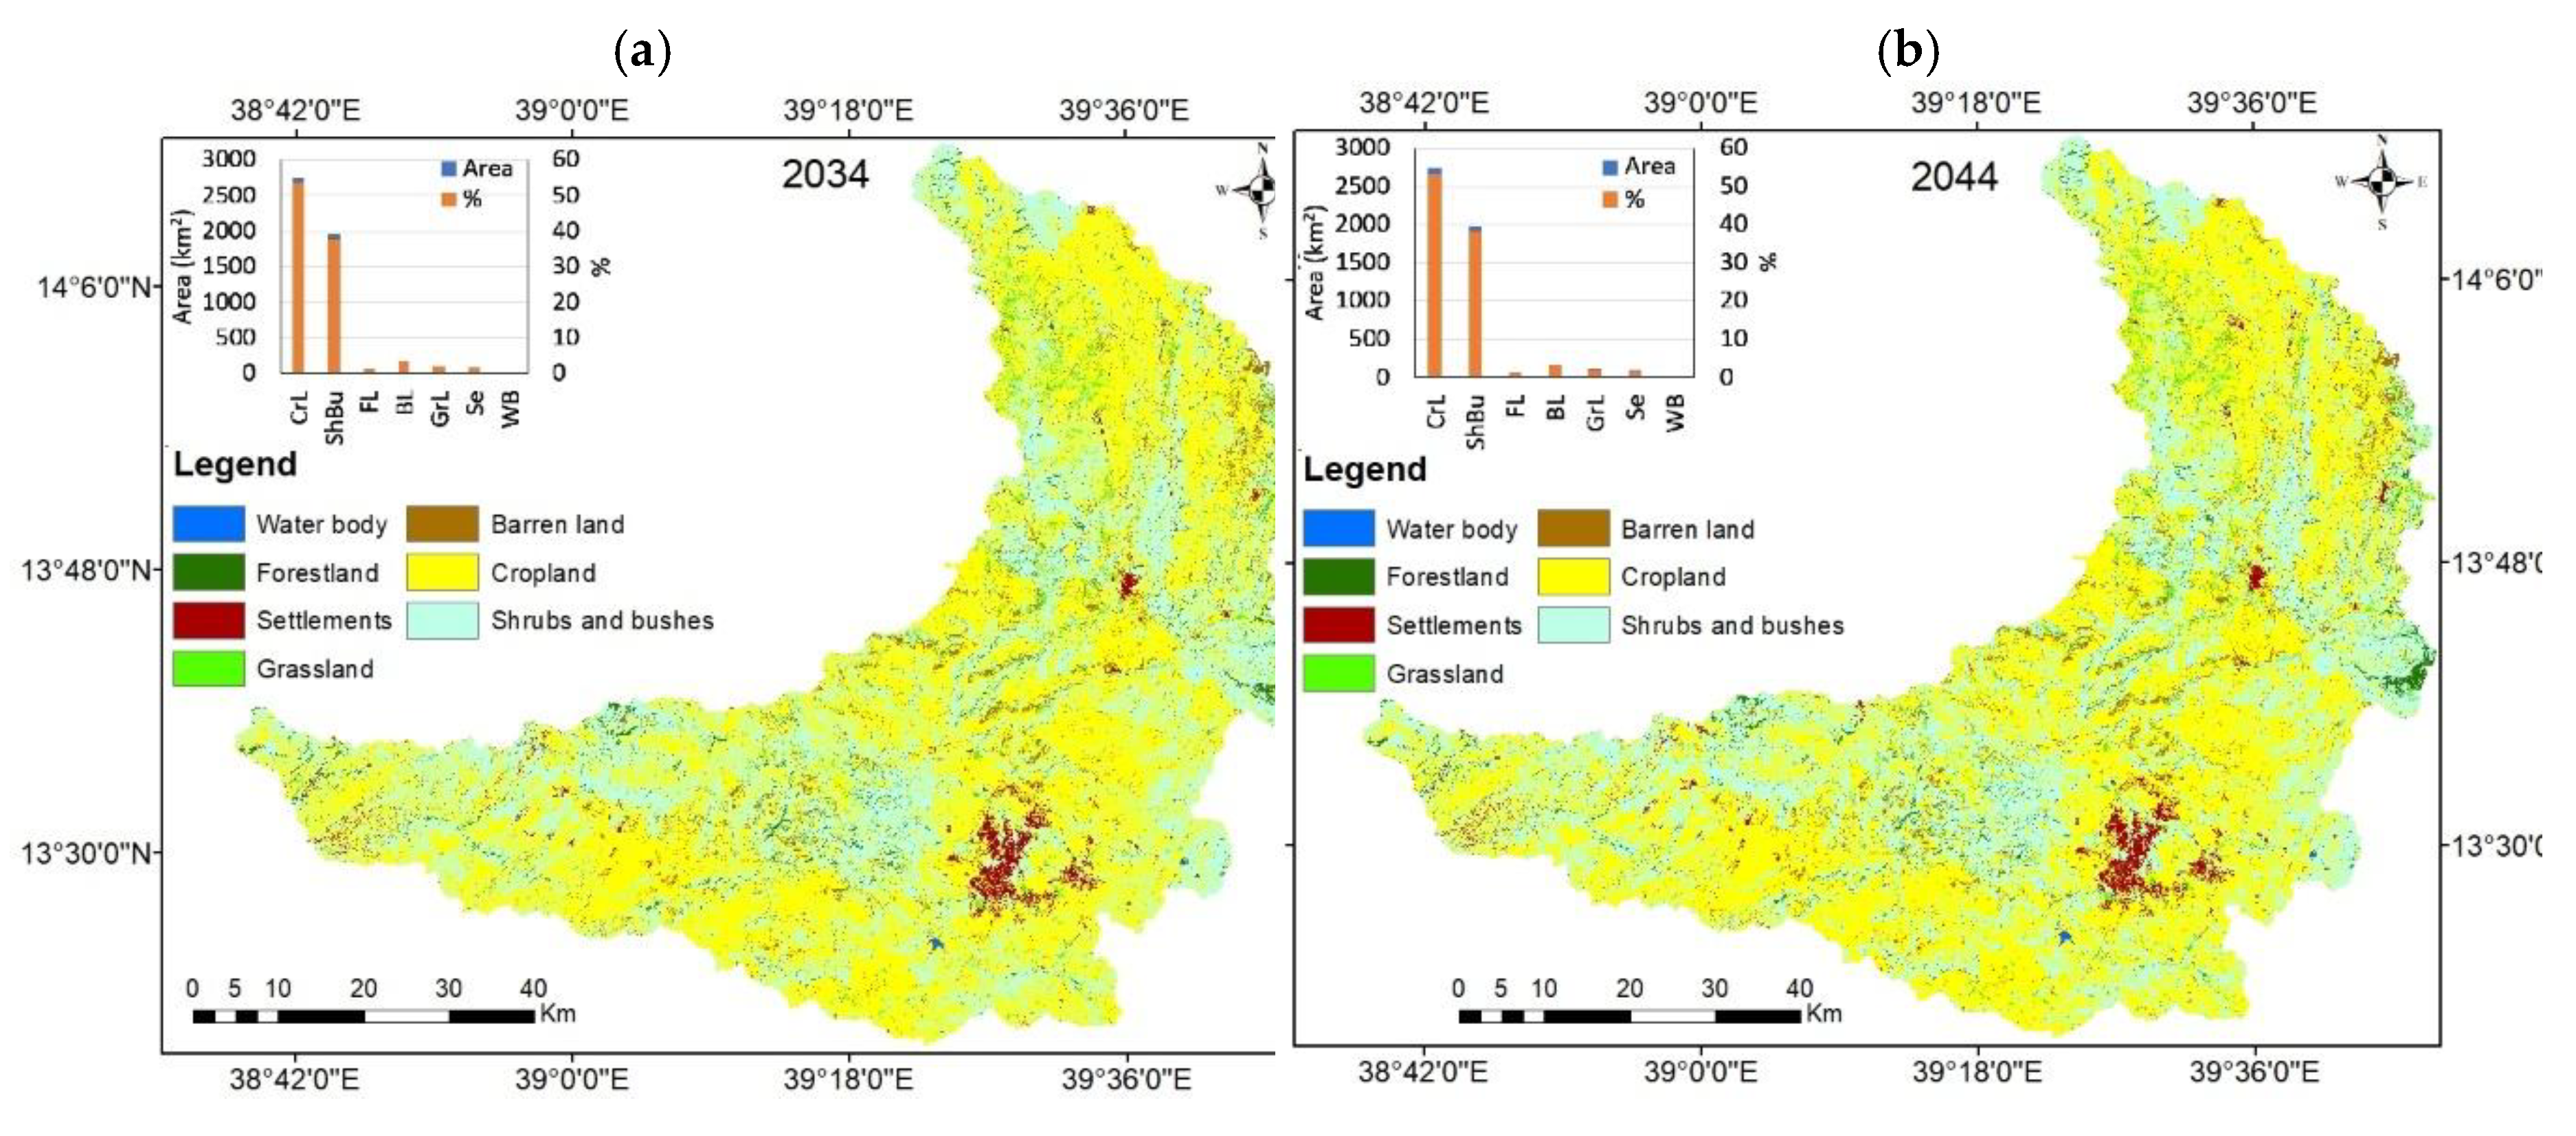
Figure 9.
Absolute area of each LULC type for the three periods (a) and change in areas between each time period (b) in the Giba basin.
Figure 9.
Absolute area of each LULC type for the three periods (a) and change in areas between each time period (b) in the Giba basin.
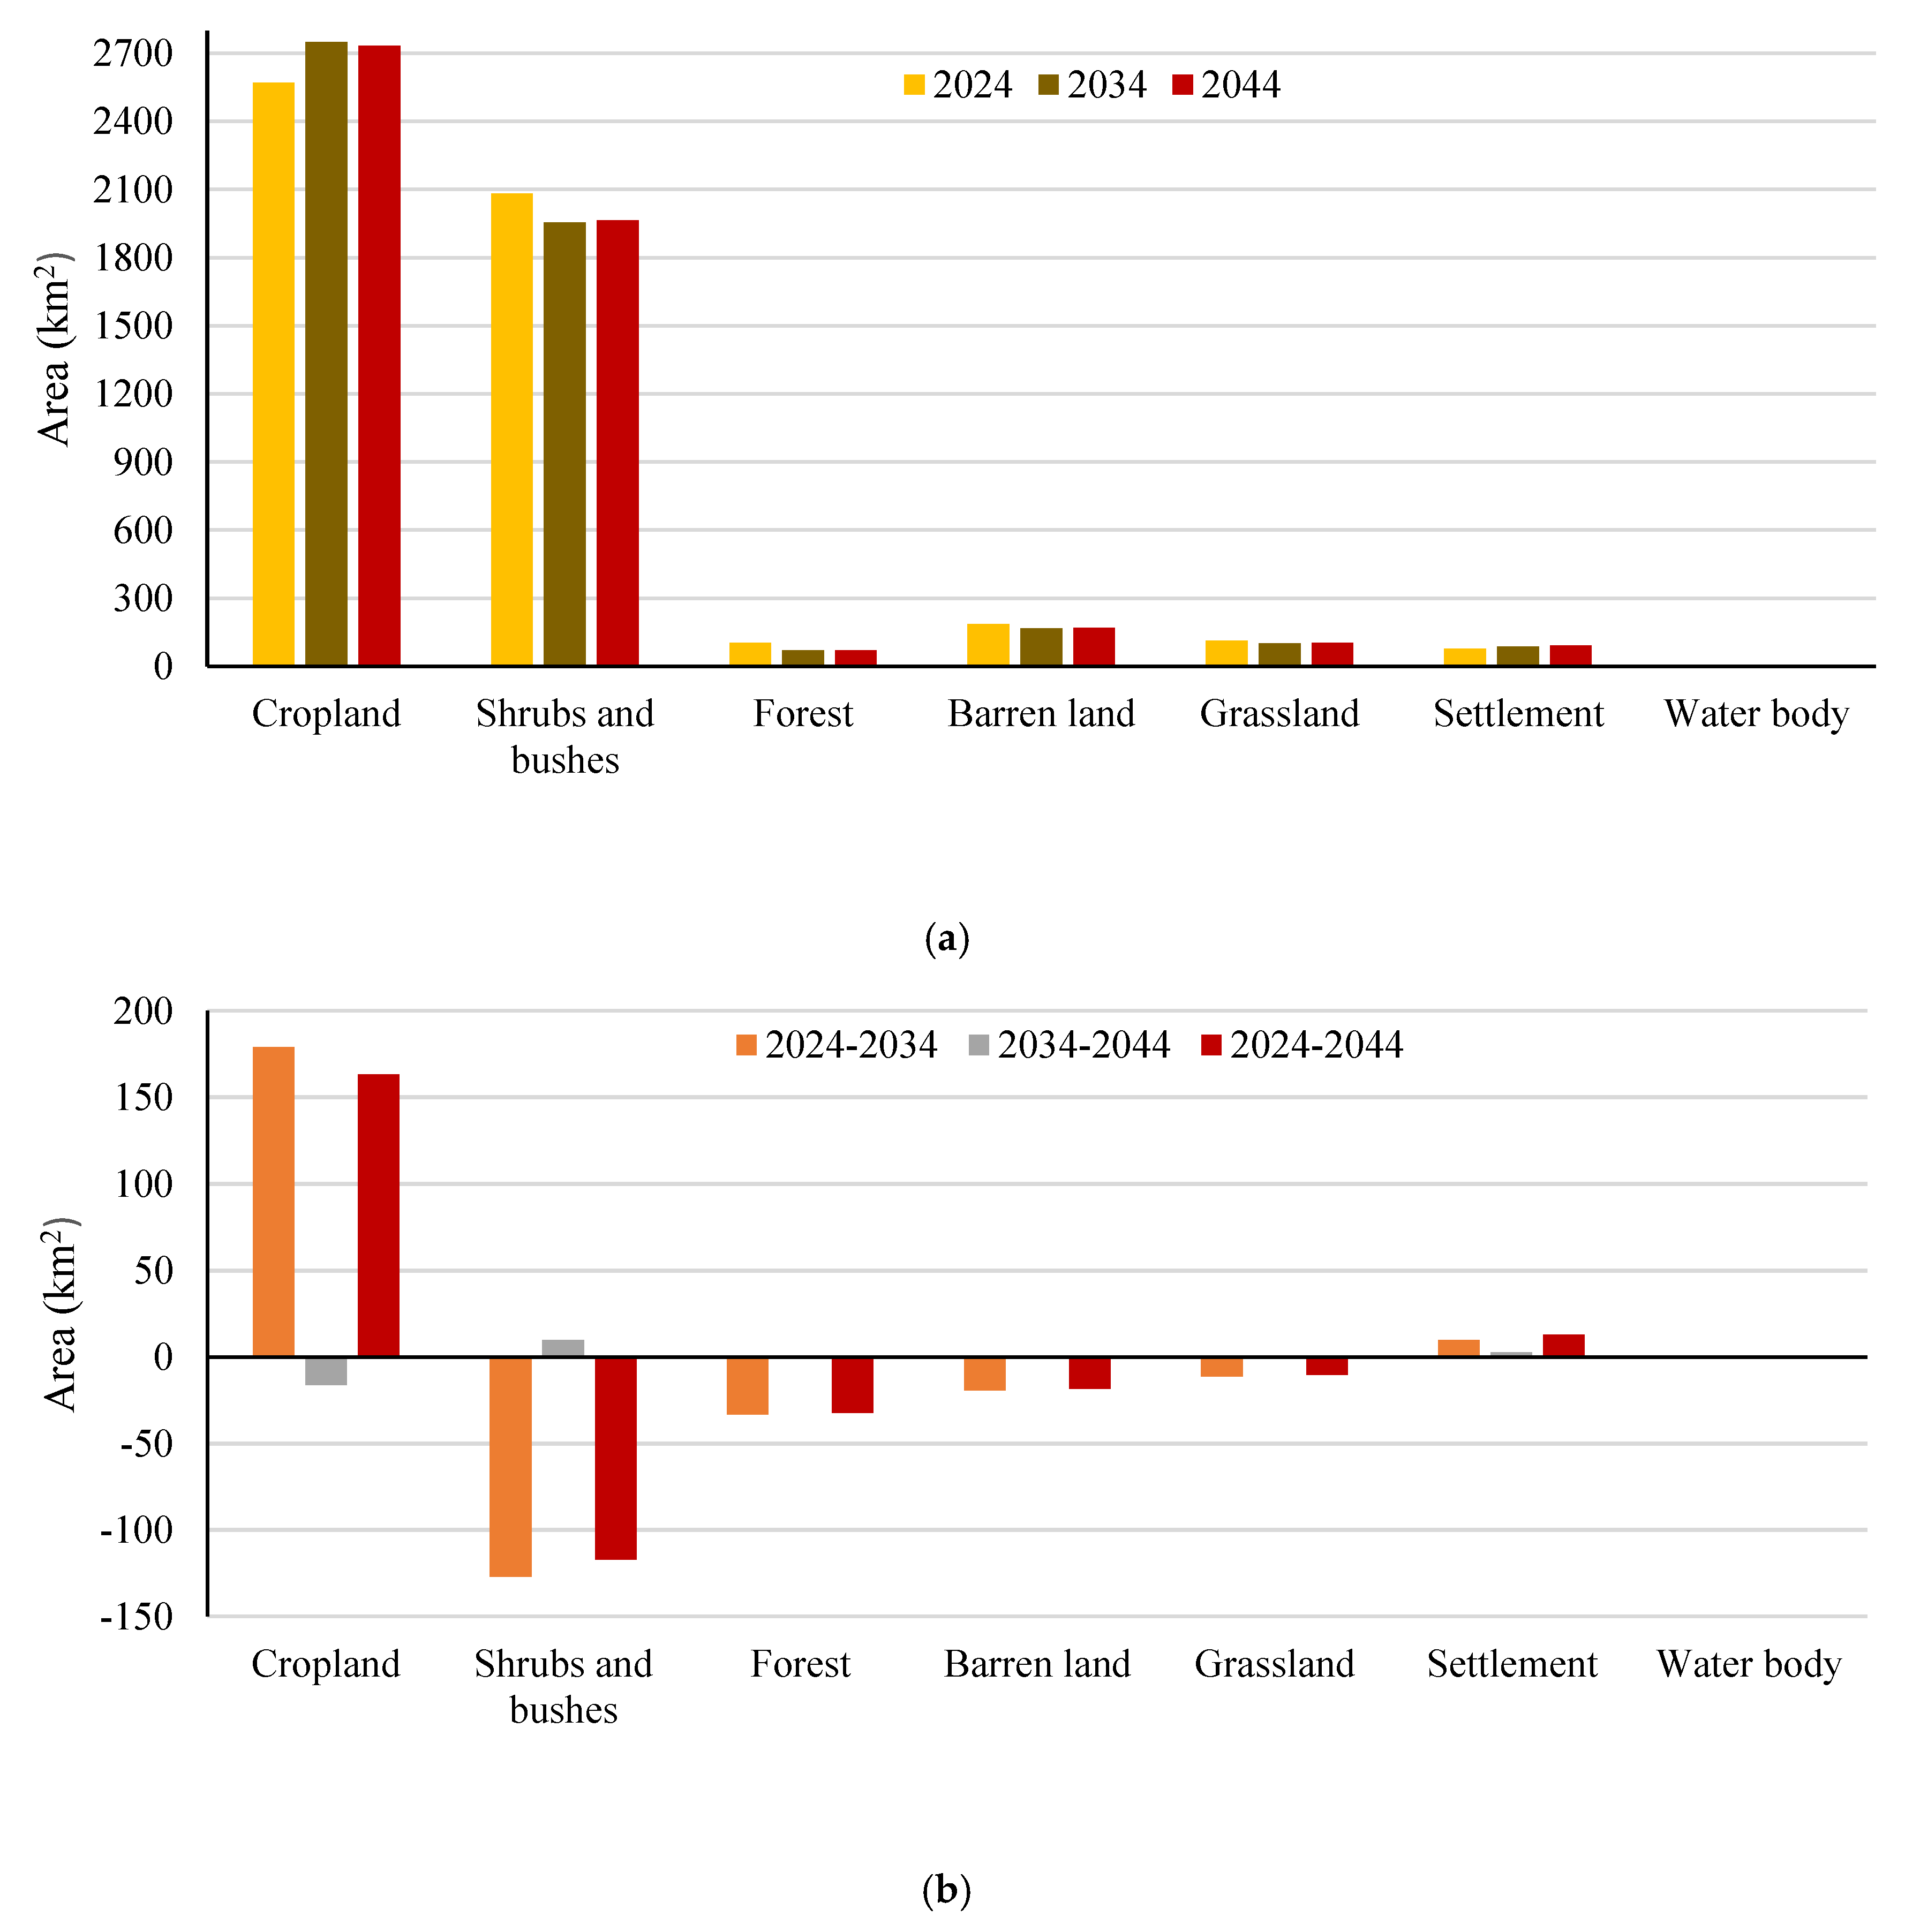

Table 1.
Specifications of Landsat images used for this study.
| Satellite | Sensor | Path/row | Resolution (m) | Acquisition date |
| Landsat 4-5 | TM Multispectral | 168/50 168/51 169/50 169/51 |
30 | 03/09/1984 30/10/1984 |
| Landsat 7 | ETM+ Multispectral | 30 | 05/11/2004 14/11/2004 |
|
| Landsat 8 | OLI-TIRS | 30 | 17/10/2014 24/10/2014 |
|
| Landsat 9 | OLI-TIRS | 30 | 18/09/2024 25/09/2024 |
Table 2.
Description of LULC types in the Giba basin.
| LULC class | Code | Description |
| Water body (WB) | 0 | All types of surface water, mainly small man-made lakes |
| Forestland (FL) | 1 | Forests that are tall and dense, and mainly located in churches and closed areas |
| Settlements (Se) | 2 | Bult up areas including villages, towns, and cities |
| Grassland (GrL) | 3 | Areas covered with grasses, e.g., grazing lands |
| Barren land (BL) | 4 | Open spaces with no vegetation, e.g., degraded lands and rock outcrops |
| Cropland (CrL) | 5 | Areas covered with all types of crops in the whole year |
| Shrubs and bushes (ShBu) | 6 | Areas covered by low-woody and less-dense vegetation |
Disclaimer/Publisher’s Note: The statements, opinions and data contained in all publications are solely those of the individual author(s) and contributor(s) and not of MDPI and/or the editor(s). MDPI and/or the editor(s) disclaim responsibility for any injury to people or property resulting from any ideas, methods, instructions or products referred to in the content. |
© 2025 by the authors. Licensee MDPI, Basel, Switzerland. This article is an open access article distributed under the terms and conditions of the Creative Commons Attribution (CC BY) license (http://creativecommons.org/licenses/by/4.0/).
Copyright: This open access article is published under a Creative Commons CC BY 4.0 license, which permit the free download, distribution, and reuse, provided that the author and preprint are cited in any reuse.


