
Submitted:
25 July 2025
Posted:
25 July 2025
You are already at the latest version
Abstract
Urbanization has emerged as one of the most significant global challenges and opportunities of the 21st century, driven by a complex interplay of dynamic processes. In Ethiopia, cities have undergone rapid expansion in recent decades, largely due to state-led economic reforms and infrastructure development. This study aims to investigate the spatiotemporal dynamics, driving forces, and future projections of urban expansion along the Ethio-Djibouti trade corridor, with a focus on Dire Dawa City in eastern Ethiopia. Landsat imagery from 1993, 2003, 2013, and 2023 was utilized to detect land use and land cover (LULC) changes and analyze urban growth patterns. Additionally, maps illustrating the city’s demographic, economic, and topographic characteristics were developed to identify the key driving factors behind land conversion and urban expansion. The spatial matrix and landscape expansion index were employed to examine the spatial patterns of urban growth. Furthermore, the study applied the Multi-Layer Perceptron–Markov Chain (MLP-MC) model to simulate future LULC changes and urban expansion. The results indicate that the built-up area in Dire Dawa has increased significantly over the past three decades, growing from 6.21 km² in 1993 to 21.54 km² in 2023. This urban growth is predominantly characterized by edge expansion, reflecting a pattern of unidirectional, unsustainable development that has consumed large areas of agricultural land. The analysis shows that socioeconomic development and population growth have had a greater influence on LULC conversion and urban expansion than physical factors. Based on these identified drivers, the study projected land conversion and simulated urban expansion for the years 2043 and 2064. The findings underscore the urgent need for localized urban growth strategies that are aligned with national urban development policies and the Sustainable Development Goals (SDGs).
Keywords:
Dire Dawa
; Ethio-Djibouti Corridor
; driving force
; urban expansion
; MLP-MC model
1. Introduction
Urbanization is one of the most transformative and complex global processes of the 21st century, driven by a dynamic interplay of demographic, economic, technological, and environmental factors [1,2]. Today, urban areas accommodate more than half of the world’s population and are projected to host nearly 70% by 2050 [3] and United Nations, 2018. While urbanization brings opportunities for economic development, innovation, and improved living standards [4], its unregulated expansion especially in developing countries poses significant challenges due to its profound effects on land use patterns, infrastructure, environmental sustainability, and social dynamics [5,6,7]. In this context, spatially explicit evidence is crucial for understanding urban landscape transformations and designing sustainable urban planning strategies at both regional and local scales.
Urban expansion is a near-universal phenomenon that presents both opportunities and constraints. Numerous studies have investigated the extent of urban expansion and its spatiotemporal patterns across varying spatial scales [8,9,10,11]. For example, urban land in China expanded by 513%, from 7,438 km² in 1981 to 45,566 km² in 2012, reflecting dramatic demographic and economic shifts [12]. In most developing countries, urban growth tends to be predominantly horizontal and uncontrolled, often at the expense of fertile agricultural land and natural ecosystems [13,14,15,16]. In recent years, significant land consumption has been observed in Ethiopian cities such as Addis Ababa [17,18,19], Hawassa [20,21] and Bahir Dar [22,23,24]. These studies generally suggest that the rate and magnitude of urban expansion vary across cities, influenced by socio-economic contexts and local conditions. However, most of the existing research provides limited spatially explicit information on drivers of urban expansion, often relying on qualitative descriptions.
Globally, urban expansion results from a combination of human and physical factors, manifesting differently across regional and local contexts [25,26]. Human drivers such as population growth, economic development, and state policy reforms have intensified in recent decades [27,28,29,30] Geographic Information Systems (GIS) and remote sensing, are increasingly used to address urban challenges due to their potential capability to generate spatial explicit information on drivers of urban expansion and integrate them in a single system[31,32]. More importantly, the combination of geospatial tools with statistical and simulation models has significantly advanced urban studies and improved the ability to solve complex urban issues. Several modeling approaches such as logistic regression [33], multiple regression artificial neural networks (ANN) [34,35], Cellular Automata-Markov models [36,37], and the Markov Chain Model [38] have been widely employed to examine the driving forces behind urban expansion and to predict future scenarios. This study applies the Multi-layer Perception Markov Chain model to predict urban expansion due to its ability to model land use transitions based on historical data and estimate future land cover changes [39,40]. Its strength lies in its simplicity, efficiency, and suitability for integration with other geospatial and simulation tools, making it a robust method for forecasting long-term urban growth patterns [41].
In the Ethiopian context, state-led economic reforms and infrastructural investments such as industrial park developments and the expansion of trade corridors have played a central role in driving urban growth. These dynamics are further intensified by high natural population growth and internal migration [24]. A prime example is the Ethio-Djibouti trade corridor, where urban centers have rapidly expanded due to enhanced commercial activity and improved connectivity. Dire Dawa, strategically located along this corridor, has experienced significant spatial growth influenced by infrastructure development, population pressure, and regional economic integration. This urban expansion has reshaped the city’s physical structure while also generating socio-economic and environmental challenges, including land use conflicts, the loss of agricultural land, and the proliferation of informal settlements [42,43].
Despite the city's strategic location and rapid transformation, there is a noticeable gap in comprehensive, spatially detailed studies that analyze the patterns, drivers, and future trajectories of urban expansion in Dire Dawa. This study aims to fill that gap by investigating the spatiotemporal dynamics of urban growth in the city from past decades to the present, identifying the key forces driving this change, and simulating future urban development scenarios for the years 2043 and 2063. The findings are expected to provide evidence-based insights that can inform sustainable urban planning and land management in Dire Dawa and similar rapidly growing urban areas.
2. Materials and Methods
2.1. Description of the Study Area
This study was conducted in Dire Dawa Metropolitan City which situated in Eastern part of Ethiopia along Ethio-Djibouti trade corridor. Geographically, it lies between 9°33′30″ and 9°39′00″N latitude, and 41°45′30″ to 41°53′30″E longitude (Figure 1), covering an estimated area of 76.464 KM2. The city’s elevation ranges from 1,069 to 1,461 meters above sea level. Based on agroclimatic zonal classifications, the area is described as semi-arid climate and characterized by bimodal rainfall type [44]. According to the long-term climate data registered by Ethiopia National Meteorological Institution (ENMI, 2024), at Dire Dawa Starion, the average annual rainfall was 612 mm, while the mean monthly maximum and minimum temperatures were 31.8°C and 17.9°C, respectively.
Dire Dawa is the second federal city of next to Addis Ababa and shares administrative boundary with to Somali Regional state in the north and East; Oromia regional State in South and West. The city was officially founded in 1902 during the reign of Emperor Menelik II, primarily due to the construction of the Addis Ababa–Djibouti Railway [45]. Dire Dawa has experienced significant population growth in recent decades. As reported by the Central Statistical Agency (CSA, 2019), the population was around 493,000 in 2019 and is projected to reach approximately 507,101. The key livelihoods of the population in Dire Dawa City and its peri-urban areas include commerce and trade, which dominate the urban economy due to the city's strategic location. In the peri-urban zones, livestock rearing and small-scale farming remain vital sources of household income. Currently, it provides significant contributions both to national and regional economy due to its strategic location and served as the hallmark of economic activity including major trade corridor to access sea port, industries, dry port, free trade Zone, commercial trade, and unique cultural heritage and historical sites. These development activities have changed not only the demography and increase the number of populations dwelling in urban centers but also to the size of the area occupied by urban settlements.
2.2. Data Source and Processing
This study employed a diverse dataset comprising remote sensing imagery, Digital Elevation Model (DEM) data, topographic information, and socio-economic data obtained from various sources (Table 1). To analyze urban expansion in Dire Dawa, Landsat images from four different years; Landsat 5 TM (1993), Landsat 7 ETM+ (2003), Landsat 8 OLI (2013), and Landsat 9 OLI (2023) were utilized. These years were selected based on data availability and key historical and state policy shifts.
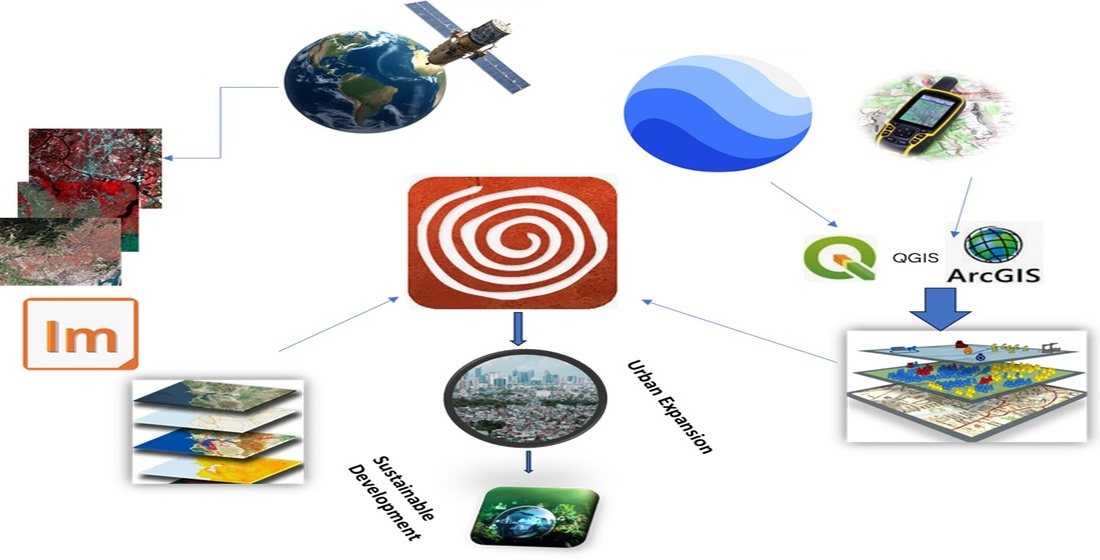
Preprocessing of the satellite imagery was performed using ERDAS IMAGINE 2022 which involves layer stacking, false color composite, sub-setting, mosaicking, enhancement, and radiometric correction [46,47]. Ground control points (GCPs) and aerial photographs were used for classification of images taken at different time. Accordingly, a total of 150 GCPs were collected using stratified random sampling of which 70% was used for calibration and the remaining 30% for validation [42,48]. A supervised classification using the Maximum Likelihood Classification (MLC) algorithm was applied to generate LULC maps of Dire Dawa City [49]
Based on East African vegetation classification by [50,51,52], four primary LULC classes were identified: agriculture, bare land, built-up area, and vegetation (The study used overall accuracy and Kappa coefficients to validate the accuracy of classified map based on the formula used by [53,54] as indicated in Equation (1) and (2).
where OAC is over all accuracy K is kappa coefficient Xii is the number of correctly classified samples for class i (diagonal element in the confusion matrix), Xi+ is the total number of reference samples (ground truth) for class i (i.e., sum of row i), X+i is total number of classified samples as class i (i.e., sum of column i), N is total number of samples and r is Number of classes.
Table 2).
The study used overall accuracy and Kappa coefficients to validate the accuracy of classified map based on the formula used by [53,54] as indicated in Equation (1) and (2).
where OAC is over all accuracy K is kappa coefficient Xii is the number of correctly classified samples for class i (diagonal element in the confusion matrix), Xi+ is the total number of reference samples (ground truth) for class i (i.e., sum of row i), X+i is total number of classified samples as class i (i.e., sum of column i), N is total number of samples and r is Number of classes.
Accordingly, the result of accuracy assessments showed overall accuracies of 88.72%, 90.08%, 89.23%, and 87.30% for 1993, 2003, 2013, and 2023, respectively; with corresponding Kappa coefficients of 0.8206, 0.8315, 0.8079, and 0.8068, meeting recommended standards.
On the other hand, previous studies highlighted both natural and anthropogenic drivers of urban expansion [55,56,57] at different spatial scale.
In this study, nine key variables namely roads, industries, railway lines, institutions, the airport, elevation, slope, and the 2023 built-up area were systematically developed and integrated as drivers of urban expansion through spatial and thematic analysis. Proximity-based layers such as distance to roads, railways, industries, institutions, and the airport were generated using Euclidean distance tools, reflecting accessibility and attraction potential for urban growth. Elevation and slope data were derived from a Digital Elevation Model (DEM) to account for the physical constraints of the landscape. The 2023 built-up area was extracted from classified satellite imagery to represent the existing urban footprint, serving as a baseline for analyzing expansion trends. These factors were standardized, reclassified, converted to raster format with spatial resolution of 30 m (Figure 2).
This study employed different geospatial software’s such as ERDAS IMAGINE 2022, QGIS 3.40.1, ArcGIS 10.8 and TerrSet’s to process and analyze the data used in the study
2.3. Drivers of Urban Expansion and Hypothesis
Urban expansion is significantly shaped by proximity to key infrastructural and socio-economic elements. These variables serve as critical constraints in urban growth modeling, as areas with higher elevation or steeper slopes tend to be less suitable for development due to construction difficulties and increased cost [58].
Areas near roads and railways tend to grow faster due to enhanced accessibility [59], while flatter slopes are preferred for development because of lower construction costs [60]. Industrial zones and the location of factories stimulate nearby growth by creating job opportunities, drawing both residential and commercial developments [61]. Similarly, public institutions such as schools and hospitals attract settlements and services around them [62]. Expansion is also more likely near existing built-up areas, as development typically radiates outward for continuity of infrastructure [63]. Additionally, proximity to airports fosters growth by boosting economic activity and attracting diverse land uses [64]. These factors collectively guide the direction and intensity of urban sprawl. Accordingly, (Figure 3) indicates the spatial distribution of drivers of urban expansion used in the study area.
3. Method of Data Analysis for Urban Expansion and Simulation
3.1. Rate of Urban Expansion
In this study, classified satellite images were utilized to quantify both the magnitude and rate of LULC changes across different time periods. To analyses the rate of urban expansion during the study period, the study used Equation (3), recommended by [65]
where P is rate of change (in %), and A1 and A2 represent the area of the LU/LC classes at times T1 and T2, respectively.
To analyze the LULC conversion to built-up area and assess the losses, gains and the net change between two successive period, the study applied the formula used by [66,67] as indicated in Equation (4) and (5).
Where L is losses, G is gains, Ai→j is area converted from class i to class j, Aj→i area converted from class j to class i
3.2. Landscape Expansion Index
This study calculated Landscape Expansion Index (LEI) to show the urban grow pattern in the study area. Accordingly, 200-meter buffer size was generated from the center of the city. The value of the index was calculated in Equation (6) as mentioned in [19,68,69]. Based on the value of Landscape Expansion Index urban growth was classified in to infilling, edge expansion and outlying where LEI > 50–100, (LEI > 0–50) and (LEI = 0) respectively.
where LEI is landscape expansion index A0 is the area where the buffer around a new urban patch overlaps with pre-existing urban zones and Av is the area where the buffer intersects with nonurban or undeveloped land.
3.3. Urban Expansion Direction
The study also analyzed the spatio-temporal patterns of urban expansion in terms of distance and equal-sector analysis [17,19,57]. Built-up areas from 1993, 2003, 2013, and 2023 were analyzed to capture expansion trends across directions and distances Equation (7) and (8). Thus, the city was divided into 16 directional quadrants at 22.5° intervals and six concentric buffer zones, each with a 2-km radius from the core center of the city (Addis Ketema), what is known as central business district (CBD).
where DUEI is directional urban expansion index; Ai is Built-up area change in direction sector i; At is total built-up area change in all direction; UED is urban expansion direction; di is distance from the urban center to built-up pixel i; ai is Area or weight of built-up pixel i
3.4. Simulation of Urban Expansion
Urban expansion is driven by interplay of biophysical, socio-economic, infrastructural, institutional factors and used as an input in urban growth model [70]. In this study, Markov chain model was used to predict the urban expansion for 2043 and 2063. The model predicts Land Use/Land Cover change by analyzing past transition probabilities between land cover classes over time. This study incorporates nine driving forces to identify the likelihood of future changes. The Markov probability matrix was used to quantify the likelihood of transitions between different land cover classes over a specified period based on the following Equation (9) suggested by [71,72].
where P is the Markov probability matrix, and Pij stands for the probability of converting from current state i to another state j in next time period. Low transition will have a probability near (0) and high transition probability near (1).
Finaly the study used Kappa coefficient to validate the accuracy of predicted urban expansion using Equation (10).
where K is kappa coefficient P0 is the probability that the predicted result is consistent with the actual result (overall accuracy); Pe is the probability that the predicted results are consistent with the real ones by accident.
4. Results
4.1. LULC Map of the Study Area
From 1993 to 2023, Dire Dawa City underwent significant land use and land cover (LULC) changes characterized by a substantial increase in built-up areas and a marked decline in agricultural land. In 1993, agriculture dominated the landscape, covering 54.02% of the area, while built-up land accounted for only 8.06%. Over the next three decades, built-up areas expanded rapidly, reaching 27.96% by 2023 more than tripling their original extent. This urban growth came largely at the expense of agricultural land, which shrank to 38.07% by 2023. Bare land, after an initial decline from 19.72% in 1993 to 5.90% in 2003, rose again to 14.92% in 2023, likely due to land degradation and development activities. These changes reflect the city's ongoing urbanization, driven by population growth, infrastructure expansion, and economic development, transforming Dire Dawa from a predominantly agrarian area into a rapidly urbanizing center. (Table 1 & Figure 4).

Table 3.
Area cover of LULC in Dire Dawa city over three decades (1993–2023).
| LULC Class | 1993 | 2003 | 2013 | 2023 | ||||
| Area (KM2) | % | Area (KM2) | % | Area (KM2) | % | Area (KM2) | % | |
| Agriculture | 41.62 | 54.02 | 40.28 | 52.23 | 43.50 | 56.46 | 29.33 | 38.07 |
| Bare land | 15.20 | 19.72 | 4.55 | 5.90 | 6.14 | 7.97 | 11.49 | 14.92 |
| Built-up | 6.21 | 8.06 | 12.55 | 16.27 | 13.76 | 17.86 | 21.54 | 27.96 |
| Vegetation | 14.02 | 18.20 | 19.75 | 25.60 | 13.64 | 17.70 | 14.68 | 19.06 |
4.2. Accuracy Assessment for the Classified Map
Table 4 summarizes the accuracy of LULC classifications for 1993, 2003, 2013, and 2023 using producer’s accuracy, user’s accuracy, overall accuracy, and the Kappa coefficient. Agriculture consistently achieved high accuracy, peaking in 2003 and slightly decreasing by 2023. Bare land accuracy varied, with a notable drop in 2003 but recovery by 2023. Built-up areas improved in user’s accuracy over time, while vegetation showed the most fluctuation, especially a decline in 2023. Despite some variation, overall accuracy stayed strong, ranging from 87.30% to 90.08%, with Kappa values above 0.80, reflecting reliable classification amid increasing land use complexity.
4.3. Rate of Urban Expansion from 1993 – 2023
The analysis of rate of change in LULC of the study area from 1993 and 2023, were underwent notable transformations in land use and land cover, characterized primarily by the rapid expansion of built-up areas, which grew at an annual rate of 24.69%, indicating intense urban growth and infrastructure development. This urban sprawl came at the cost of agricultural land, which declined by 2.95% per year, suggesting significant conversion of farmland to urban uses. Bare land exhibited inconsistent changes initially decreasing, then increasing sharply leading to an overall annual decline of 2.44%, possibly reflecting both land degradation and redevelopment (Figure 6). Vegetation cover showed only a slight net increase of 0.47%, with alternating periods of gain and loss.
Between 1993 and 2023, the land use and land cover (LULC) of the study area underwent notable changes marked by dynamic gains and losses. Agricultural land, despite consistent losses totaling 17.36 km², experienced gains of 20.48 km2, resulting in a net positive change of 3.11 km2 likely due to land recovery or expansion. Bare land showed the most significant decline, particularly in the first decade with a 9.66 km2 loss, and remained relatively unchanged thereafter, resulting in a total net loss of 9.66 km2. Built-up areas expanded steadily with a 9.71 km2 gain and a net increase of 6.1 km² over the period, primarily at the expense of agricultural and bare lands. Vegetation cover initially increased but later declined sharply, especially after 2003, leading to a net loss of 5.63 km². The transition to built-up land was mainly driven by agriculture and bare land, especially in the first decade, while their contributions stabilized in later years. Over the entire period, the contributions to built-up areas were 0.19 km2 from agriculture, 0.41 km2 from bare land, and 0.51 km2 from vegetation, indicating a gradual yet sustained urban growth fueled by modest land conversions. These patterns reflect the influence of urban expansion, land reclamation, and environmental shifts (Error! Reference source not found. and Figure 7).
Figure 5.
Gains and losses, net change and contributors of built-up area rom1993 – 2023 ((a) gain and loss of 1993-2003; (b) net change between 1993 – 2003; (c) contributors to net of change in built-up from 1993 - 2013; (d) gain and loss of 2003-2013; (e) net c net change between 2003 – 2013; (f) contributors to net of change in built-up from 2003-2013; (g) gain and loss of 2013-2023; (h) net change between 2013 – 2023; (i) contributors to net of change in built-up from 2013-2023; (j) gain and loss of 1993-2023; (k) net change between 1993 – 2023; (l) contributors to net of change in built-up from 1993-2023;.
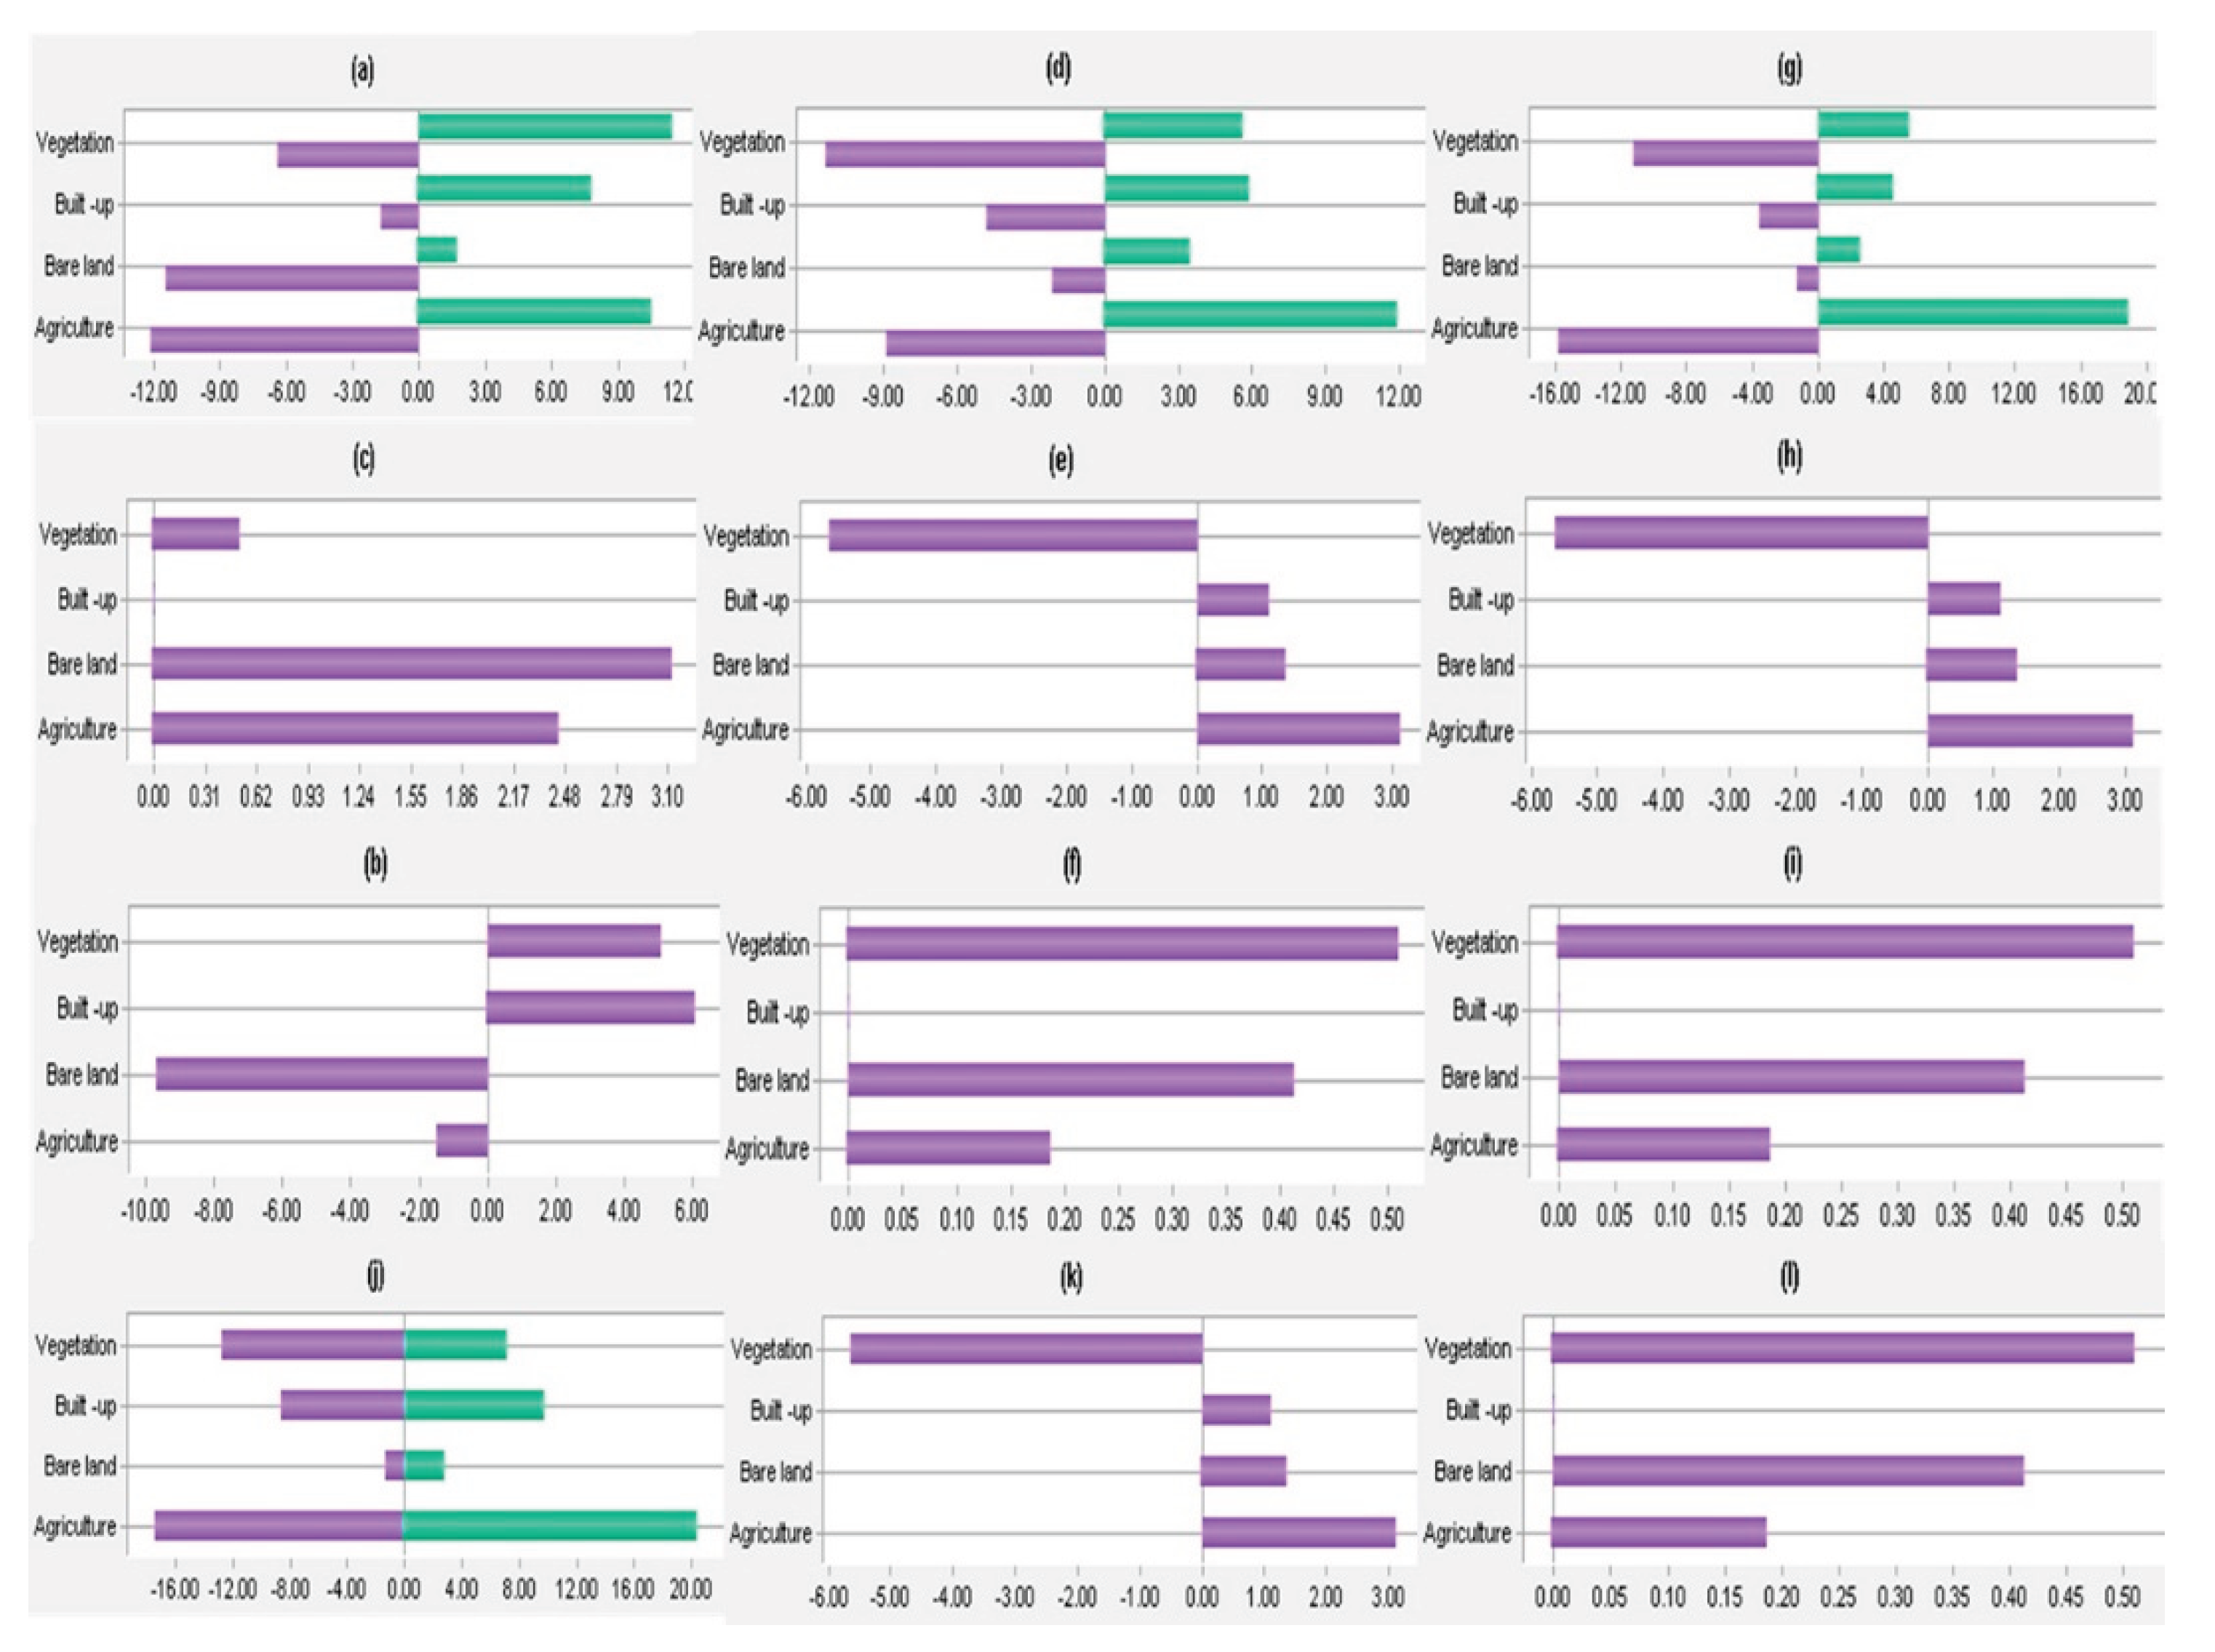
Figure 6.
Trend of LULC change of Dire Dawa from 1993 – 2023.
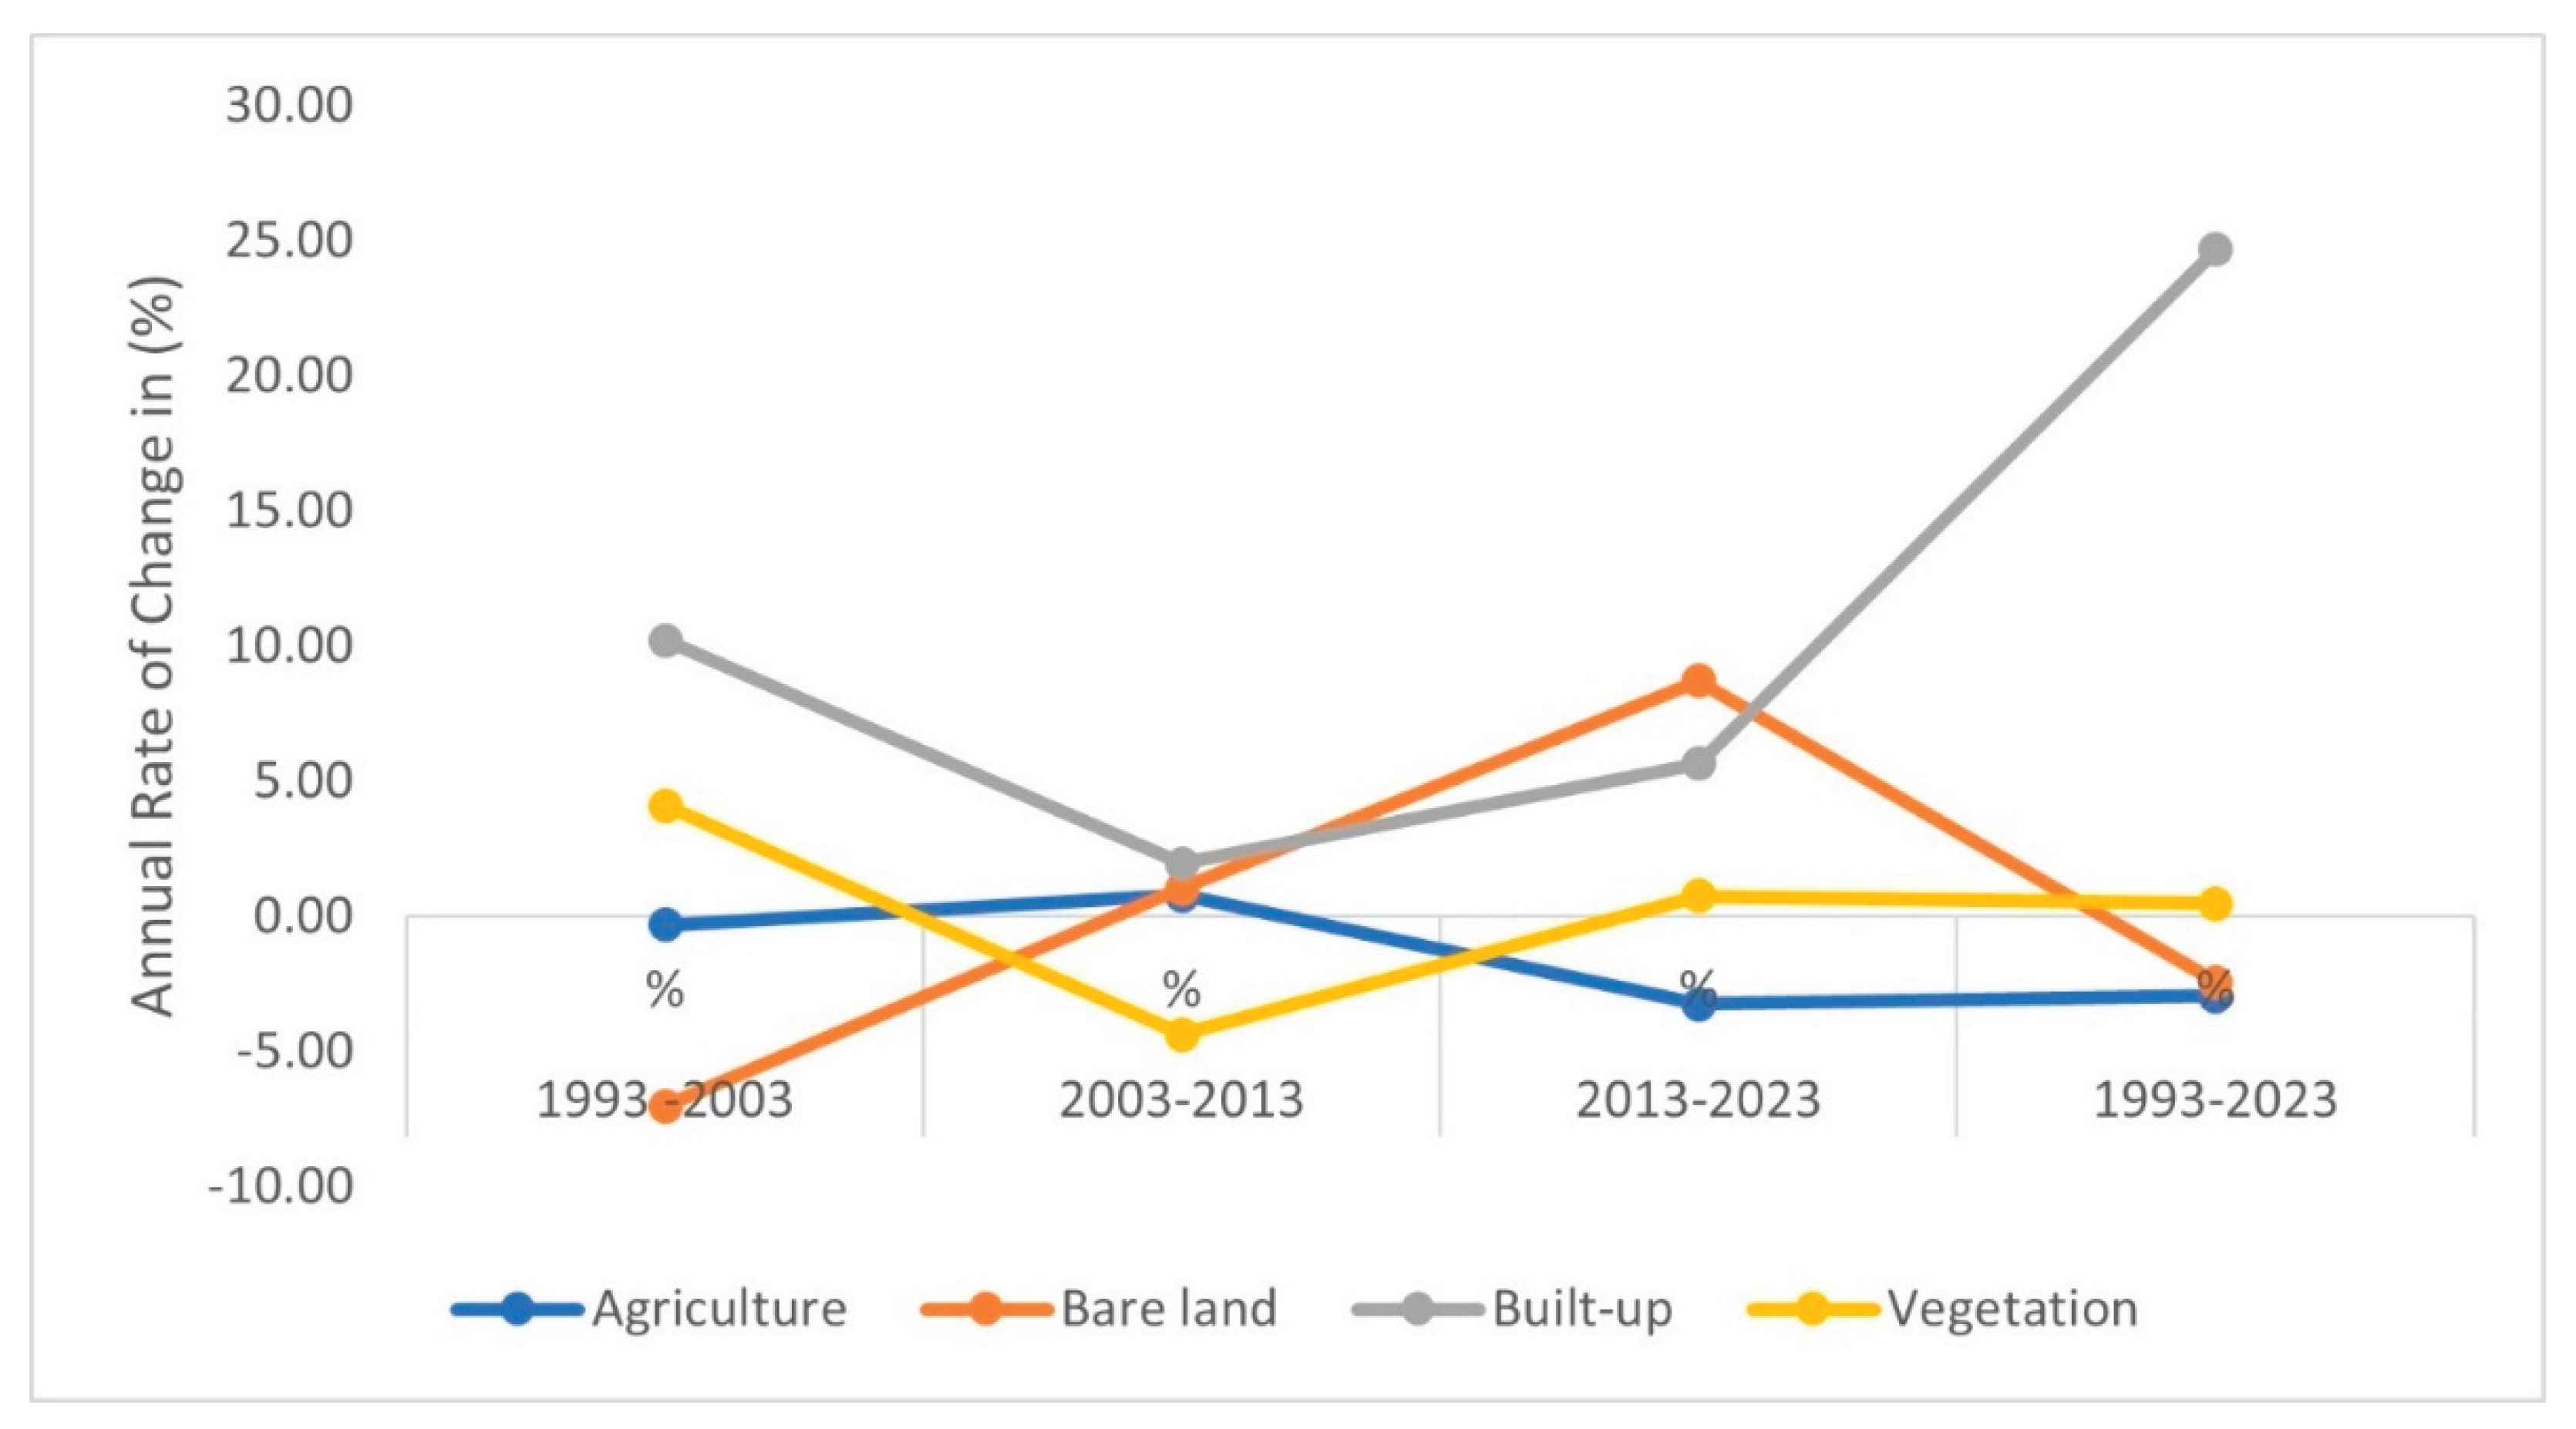
Figure 7.
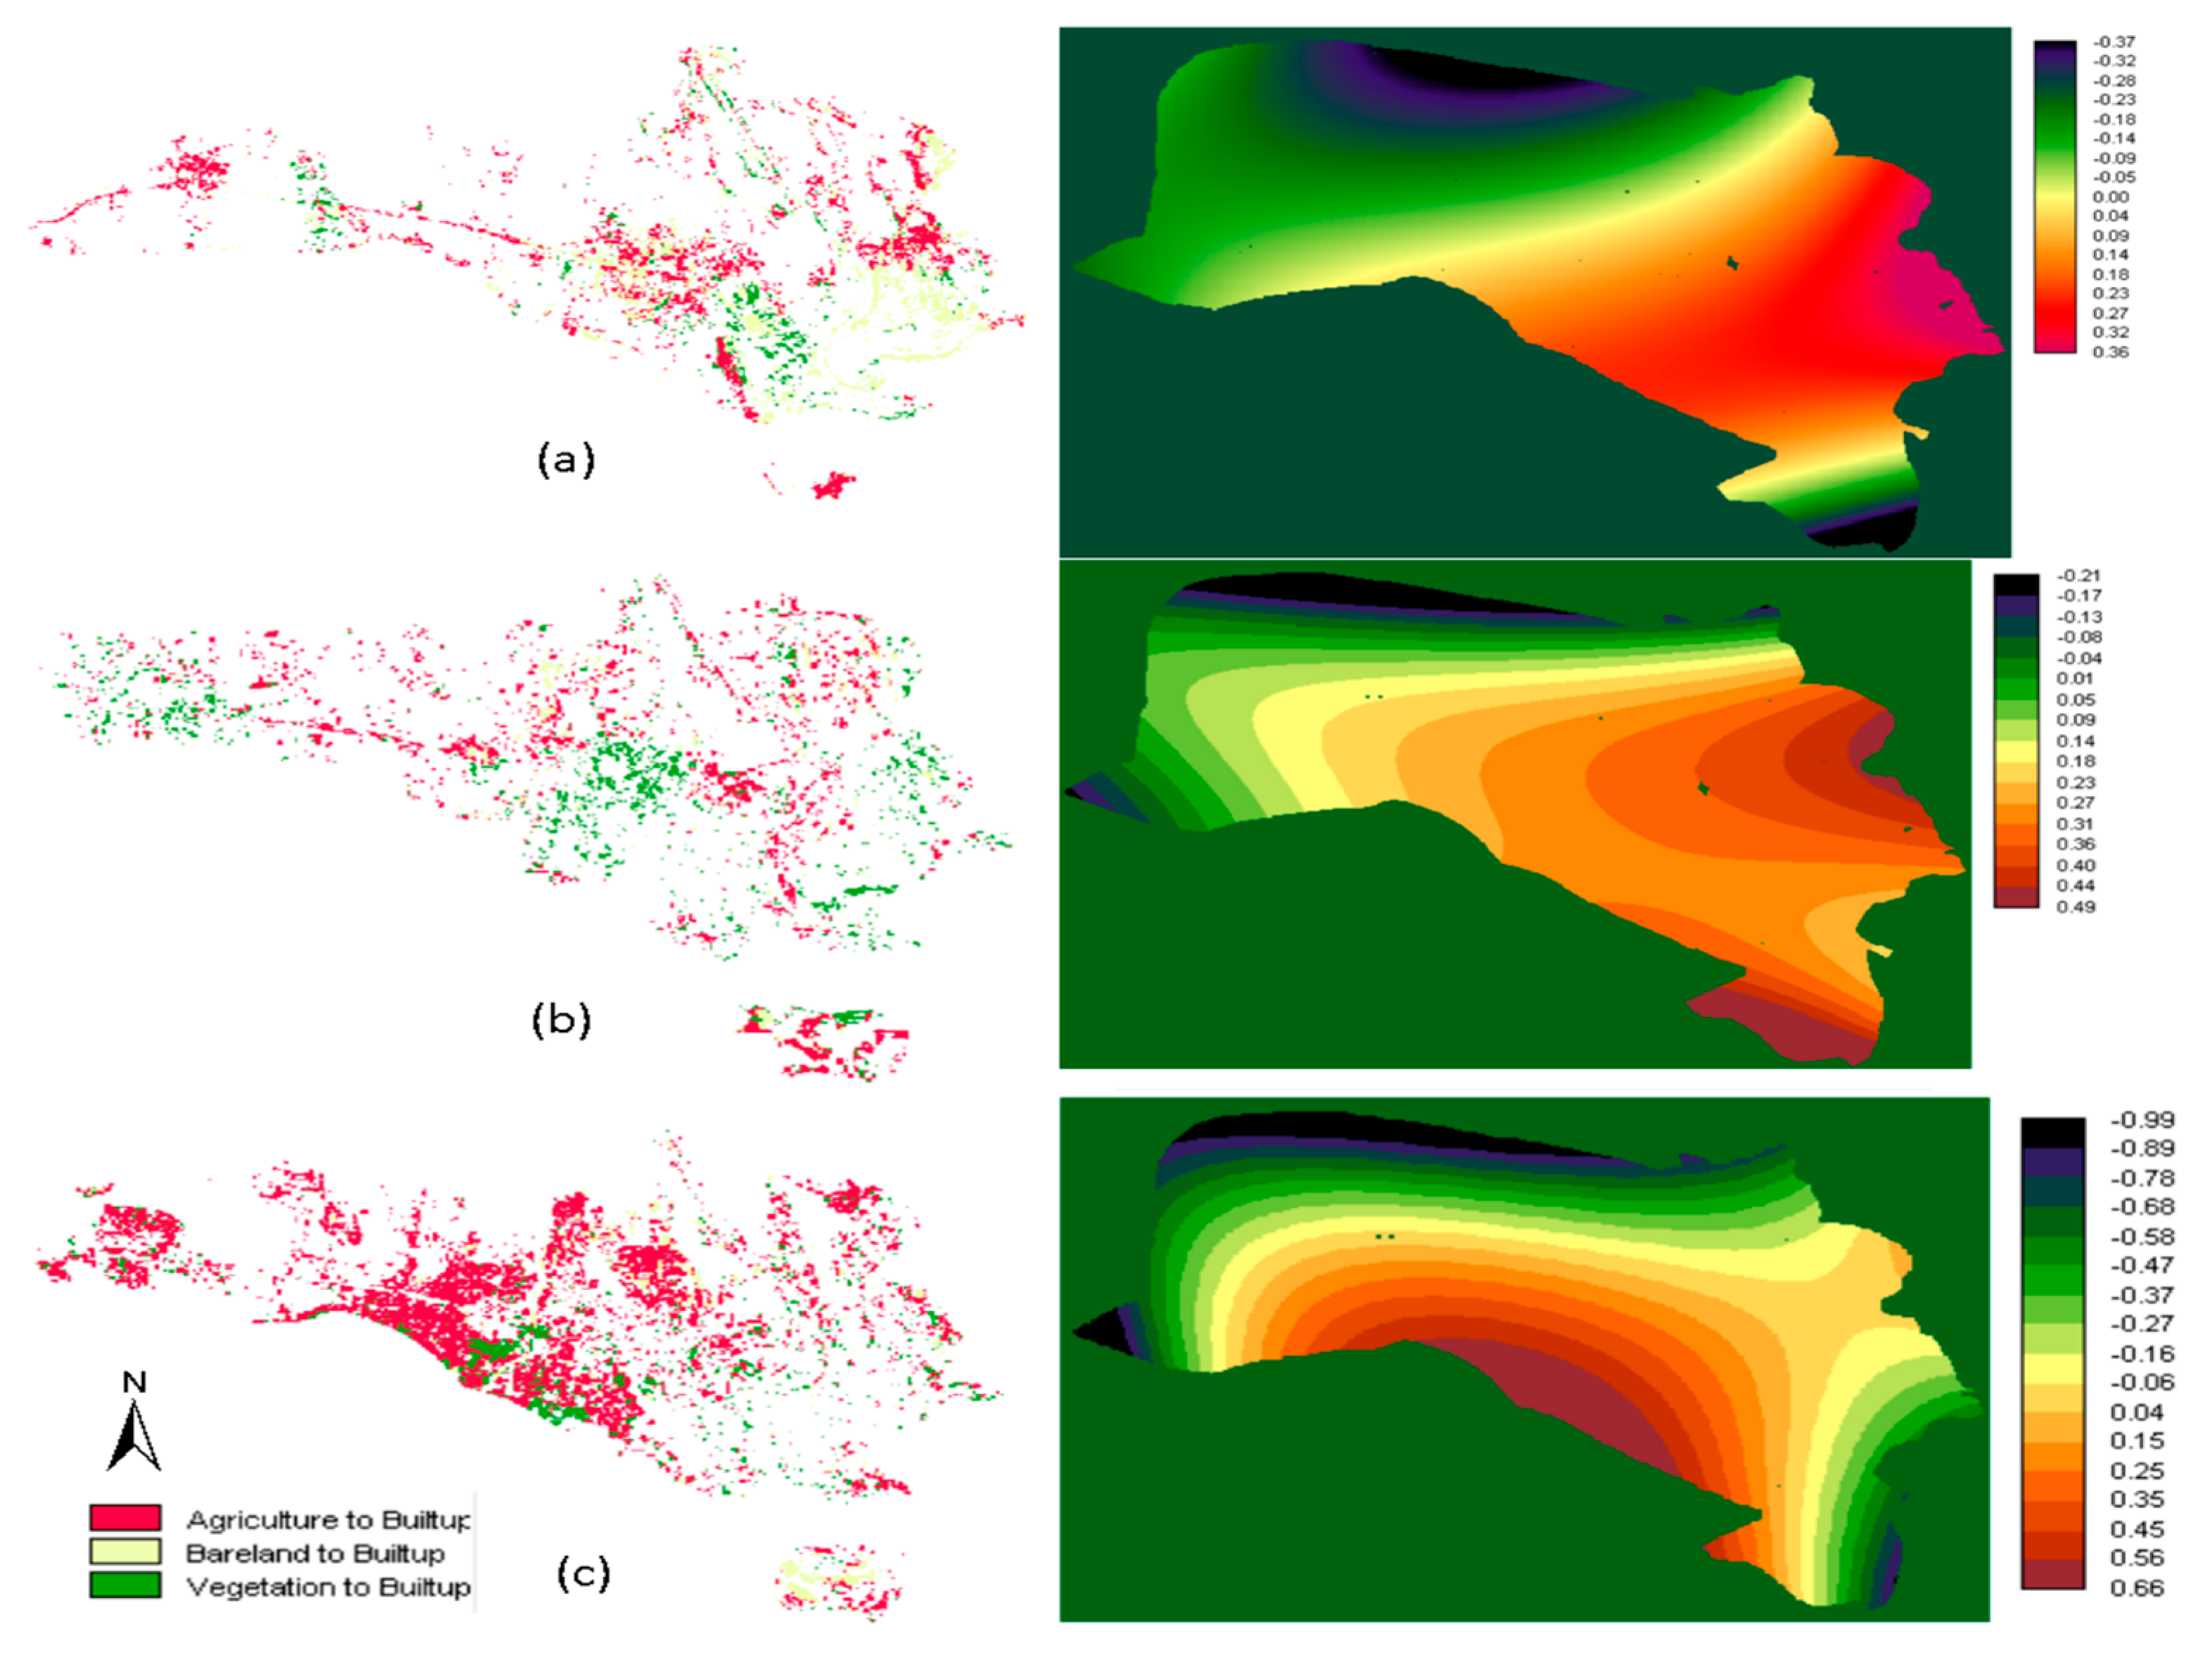
Transition of all LULC class to built-up area (Left) and intensity of transition (right) from a) 1993 - 2003; b) 2003 - 2013 and c) 2013 – 2023.
Figure 7.
Transition of all LULC class to built-up area (Left) and intensity of transition (right) from a) 1993 - 2003; b) 2003 - 2013 and c) 2013 – 2023.
4.4. Directional Concentration of Urban Expansion
Between 1993 and 2023, Dire Dawa experienced significant and directionally biased urban expansion, predominantly toward the east, southeast, and south-southeast.
In 1993, the built-up area was compact and concentrated within a 2 km radius of the city center, totaling around 3.34 km². Growth was notably higher in the eastern (0.5803 km²), southeastern (0.4827 km²), and southern (0.3591 km²) directions, while expansion in northern and western areas was minimal. As distance increased beyond 2 km, the extent of built-up land diminished significantly, indicating a tightly clustered urban core (Figure 8i and Figure 9a).
By 2003, the city expanded to 12.54 km², with intensified development in the east (2.3439 km²), southeast (1.5070 km²), and especially the south-southeast (3.2677 km²). Urban growth radiated primarily along the E, ESE, SE, and SSE axes, with significant buildup within 4 km and tapering off beyond 6 km except in the SSE and S directions, where linear expansion extended up to 13 km. This directional growth pattern suggests the influence of infrastructure and transportation corridors, as western and northwestern sectors remained largely undeveloped (Figure 8ii and Figure 9b).
In 2013, the built-up area grew further to 13.59 km², maintaining the strong east-southeast to southward expansion. The E (2.5630 km²), SE (2.0533 km²), and SSE (3.2008 km²) directions remained dominant. Development within 2–4 km continued to intensify, while growth beyond 6 km persisted, especially along roads and favorable terrains. Conversely, the western, northwestern, and southwestern areas again showed limited development, indicating sustained spatial imbalance (Figure 8iii and Figure 9c).
By 2023, Dire Dawa's built-up area reached 20.57 km², with the SSE corridor emerging as the most heavily urbanized (7.4983 km²), followed by SE and E. Expansion was notable even beyond 6–8 km, showing a ribbon-like growth pattern extending outward, possibly influenced by transportation infrastructure. Although moderate growth was recorded within the 2 km core in nearly all directions, peripheral spread was concentrated toward the southeast and south. Western and northwestern sectors like WSW (0.0107 km²) and NW (0.2499 km²) remained minimally developed, reinforcing a long-standing trend of asymmetrical urban sprawl. Overall, the city’s growth trajectory over three decades illustrates a consistent expansion along the east-southeast to south-southeast axis, driven by geographic, infrastructural, and socio-economic factors (Figure 8iv and Figure 9d).
4.5. Urban Growth Pattern
Between 1993 - 2023, the urban landscape expansion of the study area exhibited dynamic changes in spatial growth patterns which is characterized by outlying growth, edge expansion, and infilling. From 1993 to 2003, urban expansion was predominantly driven by edge expansion, which accounted for 89.58% (11.11 km²) of the total growth, indicating a compact and contiguous development pattern. Outlying growth contributed 10.03% (1.24 km²), while infilling was minimal at only 0.39% (0.05 km²) Figure 10a.
In the subsequent period (2003–2013), the trend remained similar, with edge expansion still dominant at 80.44% (10.98 km²). However, there was a noticeable rise in infilling, which increased to 9.21% (1.26 km²), and a slight increase in outlying growth at 10.36% (1.41 km²), suggesting gradual densification and outward sprawl (Figure 10b). From 2013 to 2023, edge expansion intensified dramatically, comprising 97.86% (21.07 km²) of the total growth, while outlying growth sharply declined to just 0.57% (0.12 km²), and infilling slightly rose to 1.57% (0.34 km²) (Figure 10c). This pattern highlights a significant increase in lateral urban expansion with minimal leapfrog development and moderate internal densification over the 30-years period.
4.6. Prediction of Urban Expansion for Dire Dawa City
The Land Change Modeler, trained with 1,194 samples per class over 10,000 iterations, achieved overall accuracy of 59.54% and a skill measure of 0.1545, reflecting good predictive power for land cover transitions. The model performed strongly in forecasting changes into built-up areas, with negative skill values for key transitions like agriculture to built-up (-0.2000) and vegetation to built-up (-0.0472), while bare land to built-up showed only a minimal positive skill (0.0147). However, the model was more effective in predicting persistence, especially for agriculture (0.7745), with moderate to low skill for vegetation (0.3405) and bare land (0.0412). Sensitivity analysis revealed that proximity to industries, roads, and factories significantly influenced model performance, whereas distance from public institutions had negligible effect. Notably, using only distance from the airport and industries improved model skill (0.1717), suggesting that fewer, more relevant variables may enhance accuracy. While the model struggled with transition prediction, it offered valuable insights into spatial drivers of land change. A comparison between actual and predicted 2023 built-up area 21.5409 KM2 and 21.5658 KM2 respectively showed high accuracy, indicating the model's potential when using appropriate historical data and variables (Figure 11a,b).
The transition probability matrix for 1993–2003 quantifies the likelihood of land use/land cover (LULC) changes among Agriculture, Bare land, Built-up, and Vegetation classes, serving as a foundation for future projections using the Markov Chain model (Table 5). This model assumes that future land cover states depend solely on the current state and transition probabilities. Agriculture shows a 37.85% chance of persistence but is highly likely to transition into Built-up areas (45.53%), indicating strong urban pressure. Bare land is the least stable (5.56% persistence), with notable transitions into Agriculture (42.62%), Built-up (26.06%), and Vegetation (25.76%), reflecting processes like reclamation or urbanization. Built-up areas are the most stable (95.39%), with minimal transitions suggesting limited urban abandonment. Vegetation maintains moderate stability (49.76%) but is vulnerable to conversion into Agriculture (26.58%) and Built-up (20.00%) due to development pressures. By applying these probabilities iteratively in a Markov Chain model, one can project LULC distribution for 2023 based on the 2003 state, assuming consistent trends.
Following the validation and acceptance of the model, the Markov chain model is used to predict the LU/LC for 2023, 2043 and 2063 years using the same reclass and filter file assumptions.
The Markov model was applied to determine the transition area and potential matrices for 2023–2043; 2043- 2063. According to the transition probability matrix, classes such as agriculture, vegetation and bare land are transitory categories that are subject to more changes over time; primarily shifted to built-up areas. The suitability file for 2023 was then created to train the model and to understand the changes from 1993, 2003 and 2013. Finally, the Markov Chain model was run with 2023 LU/LC as the base image and forecast 20 and 40 years (Figure 12 and Figure 13).
The predicted LULC changes in Dire Dawa City from 2023 to 2063 indicate significant urban expansion. In 2023, agriculture is the dominant land use, followed by built-up areas, vegetation, and bare land. By 2043, agricultural and vegetative lands decline while built-up areas increase moderately. By 2063, built-up areas nearly double, reaching 38.98.44 KM2, primarily at the expense of agriculture and vegetation. Bare land remains relatively stable throughout the period (Error! Not a valid bookmark self-reference.).
Table 6.
Areal Extent of Simulated LULC Scenarios for Dire Dawa in 2023, 2043, and 2063.
| LULC Class | Predicted for 2023 (KM2) |
Predicted for 2043 (KM2) |
Predicted for 2063 (KM2) |
| Agriculture | 32.9328 | 30.6153 | 21.2031 |
| Bare Land | 3.1437 | 3.1716 | 3.2013 |
| Buit-up | 21.5640 | 25.0389 | 38.9844 |
| Vegetation | 15.8985 | 14.7267 | 10.1637 |
5. Discussion
This study reveals that the expansion of Dire Dawa City along the Ethio-Djibouti corridor has significantly intensified over the period from 1993 to 2023. During this time, the built-up area increased from 6.21 km² in 1993 to 21.54 km² in 2023, while agricultural land declined from 41.62 km² to 29.33 km². The observed trends and patterns are consistent with urbanization processes across many parts of sub-Saharan Africa, including Ethiopia, underscoring the urgency of addressing the challenges associated with such expansion [73,75,76,77]. The conversion of agricultural land into built-up areas has serious implications for local ecosystems, livelihoods, and food security in surrounding communities.
The findings are in line with previous studies in other Ethiopian cities. For instance, [19] reported a 320% increase in Addis Ababa’s built-up area alongside an 82.1% reduction in agricultural land between 1990 and 2023. Similarly, the built-up areas of Hawassa and Bahir Dar increased by 284% and 148%, respectively, between 2000 and 2015.
In contrast to some prior studies, this research found minimal change in the extent of urban green spaces or vegetation cover in Dire Dawa during the study period. Earlier studies have shown that urban expansion can negatively affect vegetation through land conversion [78,79]). However, it can also have positive effects by improving green space management through activities such as irrigation and fertilization [55,57]. Notably, [19] reported a 60% reduction in urban green space in Addis Ababa over three decades (1990–2024), largely due to extensive construction in peripheral areas.
The spatial growth pattern of Dire Dawa is predominantly characterized by edge expansion, accounting for approximately 95% of urban growth during the study period. This pattern, which involves the outward growth of built-up areas along the edges of existing urban patches, signifies low-density sprawl and unsustainable development. Such growth patterns are also observed in other Ethiopian cities like Addis Ababa, Adama, and Hawassa [19,80]. This form of uncontrolled expansion, while driven by economic growth, poses significant threats to peri-urban environments and communities due to its strong association with the loss of agricultural land and vegetation [81,82]). During the study period, edge expansion consumed a total of 43.08 km², with 72.5% (31.56 km²) of this land previously used for agriculture and essential to local livelihoods.
The study further highlights the directional and spatial heterogeneity of the city’s expansion. Sector and concentric circle analyses reveal that the city has mainly expanded southward and southeastward. This unidirectional urban growth presents major challenges for effective resource allocation, infrastructure development, service provision, and social equity. These results align with previous studies in Ethiopia. For example, [19] identified southeast, south, and south-southwest as the main expansion directions in Addis Ababa, often accompanied by increasing irregularity. Similarly, [83] noted varying sprawl rates in Addis Ababa, with the most significant expansion occurring along the Mojo (south) and Jimma (southwest) corridors, leading to unequal service access. [80] also reported that Hawassa has expanded predominantly toward the northeast, east, and southeast, exerting pressure on local resources and service systems.
The study further reveals that rapid urban expansion in Dire Dawa is primarily driven by human factors, particularly economic development and population growth, rather than physical constraints. Due to its strategic location along the Ethio-Djibouti trade corridor, Dire Dawa has become a national hub for development projects, including the establishment of manufacturing industries, highways, and railway infrastructure. This has made the city a focal point for internal migration and has intensified population growth. Previous studies have also shown that state-led economic initiatives often act as a catalyst for urban expansion by triggering other proximate causes [84,85,86].
The spatial pattern of urban growth observed in this study closely follows major transportation infrastructures such as highways and railways, as well as the locations of key public institutions and industrial facilities like the Dire Dawa Cement Factory. On the contrary, physical factors such as topography appear to play a minimal role in shaping the direction of urban expansion. Interestingly, despite the presence of steep slopes and highlands in the southern and southwestern parts of the city, these areas still experienced substantial urban growth. This finding contrasts with studies from other Ethiopian cities where topography significantly influenced urban development. For instance, [80] highlighted that the Entoto Mountains in northern Addis Ababa constrained the city’s growth in that direction. Likewise, Hawassa’s expansion was limited to the northeast, east, and southeast due to the presence of Lake Hawassa and hilly terrain in the west and south, respectively.
6. Conclusions
The spatiotemporal analysis of urban expansion in Dire Dawa City from 1993 to 2023 reveals significant and rapid urban growth, largely driven by the city’s strategic location along the Ethio-Djibouti trade corridor. Over the past three decades, the built-up area increased more than fivefold from 6.46 km² to 31.47 km² primarily at the expense of agricultural and vegetated lands. This expansion has been directionally concentrated in the eastern and southeastern sectors, closely associated with the city's proximity to major roads, railways, and industrial infrastructure. Using multi-temporal Landsat imagery, GIS tools, and modeling approaches such as the Markov Chain and Land Change Modeler, the study effectively mapped and projected urban growth patterns. The Landscape Expansion Index (LEI) analysis revealed that edge expansion was the predominant growth typology, especially between 2013 and 2023. However, this urban expansion has resulted in a significant decline in agricultural land from 55.5% to 36.05% and a reduction in vegetation cover, raising serious concerns regarding food security and environmental sustainability. While the modeling tools proved effective in detecting general spatial trends, they showed limitations in accurately predicting specific land use transitions. Overall, the findings highlight the urgent need for integrated urban planning that prioritizes densification, strict zoning enforcement, and the development of green infrastructure to ensure a more sustainable and resilient urban future for Dire Dawa.
Author Contributions
Conceptualization, Abduselam Ibrahim; Formal analysis, Abduselam Ibrahim; Methodology, Abduselam Ibrahim, Abenezer Kitila and Solomon Beza; Software, Abduselam Ibrahim; Supervision, Abenezer Kitila, Tegegne Emiru and Solomon Beza; Writing – original draft, Abduselam Ibrahim; Writing – review & editing, Abenezer Kitila, Tegegne Emiru and Solomon Beza.
Funding
There is no external funding received for this research.
Institutional Review Board Statement
Not applicable.
Informed Consent Statement
Not applicable.
Data Availability Statement
The data presented in this study are available on request from the corresponding author.
Conflicts of Interest
The authors declare no conflicts of interest.
References
- Avtar, R.; Tripathi, S.; Aggarwal, A.K.; Kumar, P. Population–Urbanization–Energy Nexus: A Review. Resources 2019, 8. [Google Scholar] [CrossRef]
- Gu, C. Urbanization: Processes and Driving Forces. Sci. China Earth Sci. 2019, 62, 1351–1360. [Google Scholar] [CrossRef]
- Güneralp, B.; Zhou, Y.; Ürge-Vorsatz, D.; Gupta, M.; Yu, S.; Patel, P.L.; Fragkias, M.; Li, X.; Seto, K.C. Global Scenarios of Urban Density and Its Impacts on Building Energy Use through 2050. Proc. Natl. Acad. Sci. 2017, 114, 8945–8950. [Google Scholar] [CrossRef] [PubMed]
- Sukanya, R.; Tantia, V. Urbanization and the Impact on Economic Development. In New perspectives and possibilities in strategic management in the 21st century: Between tradition and modernity; IGI Global, 2023; pp. 369–408.
- Anees, M.; Yan, W. An Overview about the Challenges of Urban Expansion on Environmental Health in Pakistan. J. Energy Environ. Policy Options 2019, 2, 64–71. [Google Scholar]
- Arfanuzzaman, M.; Dahiya, B. Sustainable Urbanization in Southeast Asia and beyond: Challenges of Population Growth, Land Use Change, and Environmental Health. Growth Change 2019, 50, 725–744. [Google Scholar] [CrossRef]
- Awuah, K.G.B.; Abdulai, R.T. Urban Land and Development Management in a Challenged Developing World: An Overview of New Reflections. Land 2022, 11. [Google Scholar] [CrossRef]
- Rifat, S.A.A.; Liu, W. Quantifying Spatiotemporal Patterns and Major Explanatory Factors of Urban Expansion in Miami Metropolitan Area During 1992–2016. Remote Sens. 2019, 11. [Google Scholar] [CrossRef]
- Wang, R.; Feng, Y.; Tong, X.; Zhao, J.; Zhai, S. Impacts of Spatial Scale on the Delineation of Spatiotemporal Urban Expansion. Ecol. Indic. 2021, 129, 107896. [Google Scholar] [CrossRef]
- Wu, R.; Li, Z.; Wang, S. The Varying Driving Forces of Urban Land Expansion in China: Insights from a Spatial-Temporal Analysis. Sci. Total Environ. 2021, 766, 142591. [Google Scholar] [CrossRef]
- Zhang, Y.; Wang, H.; Xie, P.; Rao, Y.; He, Q. Revisiting Spatiotemporal Changes in Global Urban Expansion during 1995 to 2015. Complexity 2020, 2020, 6139158. [Google Scholar] [CrossRef]
- Zhang, H.; Li, X.; Liu, X.; Chen, Y.; Ou, J.; Niu, N.; Jin, Y.; Shi, H. Will the Development of a High-Speed Railway Have Impacts on Land Use Patterns in China? Ann. Am. Assoc. Geogr. 2019, 109, 979–1005. [Google Scholar] [CrossRef] [PubMed]
- Mekuriaw, T.; Gokcekus, H. The Impact of Urban Expansion on Physical Environment in Debre Markos Town, Ethiopia. Civ Env. Res 2019, 11, 16–26. [Google Scholar]
- Mohamed, A.; Worku, H.; Lika, T. Urban and Regional Planning Approaches for Sustainable Governance: The Case of Addis Ababa and the Surrounding Area Changing Landscape. City Environ. Interact. 2020, 8, 100050. [Google Scholar] [CrossRef]
- Muchelo, R.O.; Bishop, T.F.A.; Ugbaje, S.U.; Akpa, S.I.C. Patterns of Urban Sprawl and Agricultural Land Loss in Sub-Saharan Africa: The Cases of the Ugandan Cities of Kampala and Mbarara. Land 2024, 13. [Google Scholar] [CrossRef]
- Tilahun, D.; Gashu, K.; Shiferaw, G.T. Effects of Agricultural Land and Urban Expansion on Peri-Urban Forest Degradation and Implications on Sustainable Environmental Management in Southern Ethiopia. Sustainability 2022, 14. [Google Scholar] [CrossRef]
- Alemu, G.M.; Kombe, W. Sprawling Cities, Shrinking Farmland: Urban Expansion and Smallholder Farmers in Sub-Saharan Africa. Int. J. Urban Sustain. Dev. 2025, 17, 154–178. [Google Scholar] [CrossRef]
- Koroso, N.H.; Zevenbergen, J.A.; Lengoiboni, M. Urban Land Use Efficiency in Ethiopia: An Assessment of Urban Land Use Sustainability in Addis Ababa. Land Use Policy 2020, 99, 105081. [Google Scholar] [CrossRef]
- Yasin, K.H.; Iguala, A.D.; Gelete, T.B. Spatiotemporal Analysis of Urban Expansion and Its Impact on Farmlands in the Central Ethiopia Metropolitan Area. Discov. Sustain. 2025, 6, 36. [Google Scholar] [CrossRef]
- Tessema, M.W.; Abebe, B.G.; Bantider, A. Physical and Socioeconomic Driving Forces of Land Use and Land Cover Changes: The Case of Hawassa City, Ethiopia. Front. Environ. Sci. 2024, 12, 1203529. [Google Scholar] [CrossRef]
- Tessema, M.W.; Abebe, B.G. Quantification of Land Use/Land Cover Dynamics and Urban Growth in Rapidly Urbanized Countries: The Case Hawassa City, Ethiopia. Urban Plan. Transp. Res. 2023, 11, 2281989. [Google Scholar] [CrossRef]
- Adigeh, D.T.; Abebe, B.G. The Practice of Peri-Urban Land Acquisition by Expropriation for Housing Purposes and the Implications: The Case of Bahir Dar, Ethiopia. Urban Sci. 2023, 7. [Google Scholar] [CrossRef]
- Fitawok, M.B.; Derudder, B.; Minale, A.S.; Van Passel, S.; Adgo, E.; Nyssen, J. Modeling the Impact of Urbanization on Land-Use Change in Bahir Dar City, Ethiopia: An Integrated Cellular Automata–Markov Chain Approach. Land 2020, 9. [Google Scholar] [CrossRef]
- Wubie, A.M.; de Vries, W.T.; Alemie, B.K. A Socio-Spatial Analysis of Land Use Dynamics and Process of Land Intervention in the Peri-Urban Areas of Bahir Dar City. Land 2020, 9. [Google Scholar] [CrossRef]
- Wan, W.; Tian, Y.; Tian, J.; Yuan, C.; Cao, Y.; Liu, K. Research Progress in Spatiotemporal Dynamic Simulation of LUCC. Sustainability 2024, 16. [Google Scholar] [CrossRef]
- Watson, V. The Return of the City-Region in the New Urban Agenda: Is This Relevant in the Global South? In Planning Regional Futures; Routledge, 2021; pp. 34–52.
- Broadberry, S.; Wallis, J.J. Growing, Shrinking, and Long-Run Economic Performance: Historical Perspectives on Economic Development. J. Econ. Hist. 2025, 85, 505–540. [Google Scholar] [CrossRef]
- Liu, Y.; Fan, P.; Yue, W.; Song, Y. Impacts of Land Finance on Urban Sprawl in China: The Case of Chongqing. Land Use Policy 2018, 72, 420–432. [Google Scholar] [CrossRef]
- McMillan, M.; Rodrik, D.; Verduzco-Gallo, Í. Globalization, Structural Change, and Productivity Growth, with an Update on Africa. Econ. Transform. Afr. 2014, 63, 11–32. [Google Scholar] [CrossRef]
- Seto, K.C.; Fragkias, M.; Güneralp, B.; Reilly, M.K. A Meta-Analysis of Global Urban Land Expansion. PLOS ONE 2011, 6, e23777. [Google Scholar] [CrossRef]
- Dritsas, E.; Trigka, M. Remote Sensing and Geospatial Analysis in the Big Data Era: A Survey. Remote Sens. 2025, 17. [Google Scholar] [CrossRef]
- Kovacs-Györi, A.; Ristea, A.; Havas, C.; Mehaffy, M.; Hochmair, H.H.; Resch, B.; Juhasz, L.; Lehner, A.; Ramasubramanian, L.; Blaschke, T. Opportunities and Challenges of Geospatial Analysis for Promoting Urban Livability in the Era of Big Data and Machine Learning. ISPRS Int. J. Geo-Inf. 2020, 9. [Google Scholar] [CrossRef]
- Adzandeh, E.A.; Alaigba, D.; Nkemasong, C.N. Application of Geospatial Techniques and Logistic Regression Model for Urban Growth Analysis in Limbe, Cameroon. Niger J Env. Sci TechnolNIJEST 2020, 4, 138–151. [Google Scholar] [CrossRef]
- Wang, Y.; Tian, Y.; Huang, X.; Ma, Y.; Li, Z. Parametric Design of Ecological Park Landscape with DLA-GIS and GANs-GIS Based on Remote Sensing Data. In Proceedings of the Fifth International Conference on Telecommunications, Optics, and Computer Science (TOCS 2024); Pedrycz, W., Agaian, S.S., Eds.; SPIE, 2025; Vol. 13629, p. 1362902.
- Yang, X.; Wang, Y.; Lu, K.; Wu, Y.; Zhao, D. Artificial Neural Network Modelling in GIS Spatial Analysis. Acad. J. Comput. Inf. Sci. 2024, 7, 1809–1827. [Google Scholar] [CrossRef]
- Asadi, M.; Oshnooei-Nooshabadi, A.; Saleh, S.-S.; Habibnezhad, F.; Sarafraz-Asbagh, S.; Van Genderen, J.L. Urban Sprawl Simulation Mapping of Urmia (Iran) by Comparison of Cellular Automata–Markov Chain and Artificial Neural Network (ANN) Modeling Approach. Sustainability 2022, 14. [Google Scholar] [CrossRef]
- Mirzakhani, A.; Behzadfar, M.; Azizi Habashi, S. Simulating Urban Expansion Dynamics in Tehran through Satellite Imagery and Cellular Automata Markov Chain Modelling. Model. Earth Syst. Environ. 2025, 11, 145. [Google Scholar] [CrossRef]
- Dey, N.N.; Al Rakib, A.; Kafy, A.-A.; Raikwar, V. Geospatial Modelling of Changes in Land Use/Land Cover Dynamics Using Multi-Layer Perceptron Markov Chain Model in Rajshahi City, Bangladesh. Environ. Chall. 2021, 4, 100148. [Google Scholar] [CrossRef]
- Al-Hameedi, W.M.M.; Chen, J.; Faichia, C.; Al-Shaibah, B.; Nath, B.; Kafy, A.-A.; Hu, G.; Al-Aizari, A. Remote Sensing-Based Urban Sprawl Modeling Using Multilayer Perceptron Neural Network Markov Chain in Baghdad, Iraq. Remote Sens. 2021, 13. [Google Scholar] [CrossRef]
- Shivappa Masalvad, S.; Patil, C.; Pravalika, A.; Katageri, B.; Bekal, P.; Patil, P.; Hegde, N.; Sahoo, U.K.; Sakare, P.K. Application of Geospatial Technology for the Land Use/Land Cover Change Assessment and Future Change Predictions Using CA Markov Chain Model. Environ. Dev. Sustain. 2024, 26, 24817–24842. [Google Scholar] [CrossRef]
- Mansour, S.; Ghoneim, E.; El-Kersh, A.; Said, S.; Abdelnaby, S. Spatiotemporal Monitoring of Urban Sprawl in a Coastal City Using GIS-Based Markov Chain and Artificial Neural Network (ANN). Remote Sens. 2023, 15. [Google Scholar] [CrossRef]
- Tesfaye, W.; Elias, E.; Warkineh, B.; Tekalign, M.; Abebe, G. Modeling of Land Use and Land Cover Changes Using Google Earth Engine and Machine Learning Approach: Implications for Landscape Management. Environ. Syst. Res. 2024, 13, 31. [Google Scholar] [CrossRef]
- Gabisa, M.; Kabite, G.; Mammo, S. Land Use and Land Cover Change Trends, Drivers and Its Impacts on Ecosystem Services in Burayu Sub City, Ethiopia. Front. Environ. Sci. 2025, 13, 1557000. [Google Scholar] [CrossRef]
- Araya, A.; Keesstra, S.D.; Stroosnijder, L. A New Agro-Climatic Classification for Crop Suitability Zoning in Northern Semi-Arid Ethiopia. Agric. For. Meteorol. 2010, 150, 1057–1064. [Google Scholar] [CrossRef]
- Kebede, M. Heritage-Tourism Resources of the Franco-Ethiopian Railway in Dire Dawa, Ethiopia. Afr J Hosp Tour Leis 2018, 7. [Google Scholar]
- Sun, S.; Dustdar, S.; Ranjan, R.; Morgan, G.; Dong, Y.; Wang, L. Remote Sensing Image Interpretation With Semantic Graph-Based Methods: A Survey. IEEE J. Sel. Top. Appl. Earth Obs. Remote Sens. 2022, 15, 4544–4558. [Google Scholar] [CrossRef]
- Sun, X.; Wang, B.; Wang, Z.; Li, H.; Li, H.; Fu, K. Research Progress on Few-Shot Learning for Remote Sensing Image Interpretation. IEEE J. Sel. Top. Appl. Earth Obs. Remote Sens. 2021, 14, 2387–2402. [Google Scholar] [CrossRef]
- Osman, M.A.; Abdel-Rahman, E.M.; Onono, J.O.; Olaka, L.A.; Elhag, M.M.; Adan, M.; Tonnang, H.E. Mapping, Intensities and Future Prediction of Land Use/Land Cover Dynamics Using Google Earth Engine and CA-Artificial Neural Network Model. PLoS One 2023, 18, e0288694. [Google Scholar] [CrossRef]
- Aroonsri, I. Comparative Analysis of Land Use Classification Accuracy Using Maximum Likelihood Classification (MLC) and Spectral Angle Mapping (SAM) Methods. Int. J. Adv. Res. Comput. Sci. 2025, 16. [Google Scholar] [CrossRef]
- Mengist, W. An Overview of the Major Vegetation Classification in Africa and the New Vegetation Classification in Ethiopia. Am. J. Zool. 2019, 2, 51–62. [Google Scholar]
- Mfitumukiza, D.; Kayendeke, E.; Mwanjalolo, J.G.M. Classification and Mapping of Rangeland Vegetation Physiognomic Composition Using Landsat Enhanced Thematic Mapper and IKONOS Imagery. South Afr. J. Geomat. 2014, 3, 259–271. [Google Scholar] [CrossRef]
- Van Breugel, P.; Kindt, R.; Lillesø, J.P.B.; Bingham, M.; Dudley, C.; Friis, I.; Gachathi, F.; Kalema, J.; Mbago, F.; Minani, V. Potential Natural Vegetation of Eastern Africa (Ethiopia, Kenya, Ma; Forest & Landscape Denmark University of Copenhagen 23 Rolighedsvej DK-1958 …, 2011; ISBN 87-7903-562-0.
- Sharma, R.; Garg, P.K.; Dwivedi, R.K. Analysis of Uncertainty Ratio in Classified Imagery Using Independent Indicator Entropy. Egypt. J. Remote Sens. Space Sci. 2020, 23, 49–55. [Google Scholar] [CrossRef]
- Chughtai, A.H.; Abbasi, H.; Karas, I.R. A Review on Change Detection Method and Accuracy Assessment for Land Use Land Cover. Remote Sens. Appl. Soc. Environ. 2021, 22, 100482. [Google Scholar] [CrossRef]
- Huang, C.; Zhuang, Q.; Meng, X.; Guo, H.; Han, J. An Improved Nightlight Threshold Method for Revealing the Spatiotemporal Dynamics and Driving Forces of Urban Expansion in China. J. Environ. Manage. 2021, 289, 112574. [Google Scholar] [CrossRef]
- Wang, L.; Jia, Y.; Li, X.; Gong, P. Analysing the Driving Forces and Environmental Effects of Urban Expansion by Mapping the Speed and Acceleration of Built-Up Areas in China between 1978 and 2017. Remote Sens. 2020, 12. [Google Scholar] [CrossRef]
- Wu, S.; Sumari, N.S.; Dong, T.; Xu, G.; Liu, Y. Characterizing Urban Expansion Combining Concentric-Ring and Grid-Based Analysis for Latin American Cities. Land 2021, 10. [Google Scholar] [CrossRef]
- Li, Q.; Chen, W.; Li, M.; Yu, Q.; Wang, Y. Identifying the Effects of Industrial Land Expansion on PM2.5 Concentrations: A Spatiotemporal Analysis in China. Ecol. Indic. 2022, 141, 109069. [Google Scholar] [CrossRef]
- Yi, Y.; He, F.; Si, Y. Spatial Effects of Railway Network Construction on Urban Sprawl and Its Mechanisms: Evidence from Yangtze River Delta Urban Agglomeration, China. Land 2024, 13. [Google Scholar] [CrossRef]
- Mou, J.; Chen, Z.; Huang, J. Predicting Urban Expansion to Assess the Change of Landscape Character Types and Its Driving Factors in the Mountain City. Land 2023, 12. [Google Scholar] [CrossRef]
- Li, Q.; Chen, W.; Li, M.; Yu, Q.; Wang, Y. Identifying the Effects of Industrial Land Expansion on PM2.5 Concentrations: A Spatiotemporal Analysis in China. Ecol. Indic. 2022, 141, 109069. [Google Scholar] [CrossRef]
- Angel, S. Urban Expansion: Theory, Evidence and Practice. Build. Cities 2023, 4. [Google Scholar] [CrossRef]
- Gomes, E.; Banos, A.; Abrantes, P.; Rocha, J. Assessing the Effect of Spatial Proximity on Urban Growth. Sustainability 2018, 10. [Google Scholar] [CrossRef]
- Bejrananda, C. From Runway to Cityscape: Challenges of Airport-Driven Urban Growth. Int. J. Build. Urban Inter. Landsc. Technol. BUILT 2024, 22, 256538–256538. [Google Scholar] [CrossRef]
- Getaneh, Z.A.; Demissew, S.; Woldu, Z. Spatiotemporal Dynamics of Land Use Land Cover Change and Its Drivers in the Western Part of Lake Abaya, Ethiopia. PeerJ 2024, 12, e17892. [Google Scholar] [CrossRef] [PubMed]
- Khoshnood Motlagh, S.; Sadoddin, A.; Haghnegahdar, A.; Razavi, S.; Salmanmahiny, A.; Ghorbani, K. Analysis and Prediction of Land Cover Changes Using the Land Change Modeler (LCM) in a Semiarid River Basin, Iran. Land Degrad. Dev. 2021, 32, 3092–3105. [Google Scholar] [CrossRef]
- Salarin, F.; TATIAN, M.; Ghanghermeh, A.; Tamartash, R. Modeling Land Cover Changes in Golestan Province Using Land Change Modeler (LCM). 2022.
- Tian, Y.; Shuai, Y.; Ma, X.; Shao, C.; Liu, T.; Tuerhanjiang, L. Improved Landscape Expansion Index and Its Application to Urban Growth in Urumqi. Remote Sens. 2022, 14. [Google Scholar] [CrossRef]
- Woldesemayat, E.M.; Genovese, P.V. Monitoring Urban Expansion and Urban Green Spaces Change in Addis Ababa: Directional and Zonal Analysis Integrated with Landscape Expansion Index. Forests 2021, 12. [Google Scholar] [CrossRef]
- Yang, J.; Tang, W.; Gong, J.; Shi, R.; Zheng, M.; Dai, Y. Simulating Urban Expansion Using Cellular Automata Model with Spatiotemporally Explicit Representation of Urban Demand. Landsc. Urban Plan. 2023, 231, 104640. [Google Scholar] [CrossRef]
- Baqa, M.F.; Chen, F.; Lu, L.; Qureshi, S.; Tariq, A.; Wang, S.; Jing, L.; Hamza, S.; Li, Q. Monitoring and Modeling the Patterns and Trends of Urban Growth Using Urban Sprawl Matrix and CA-Markov Model: A Case Study of Karachi, Pakistan. Land 2021, 10. [Google Scholar] [CrossRef]
- Wang, S.W.; Gebru, B.M.; Lamchin, M.; Kayastha, R.B.; Lee, W.-K. Land Use and Land Cover Change Detection and Prediction in the Kathmandu District of Nepal Using Remote Sensing and GIS. Sustainability 2020, 12. [Google Scholar] [CrossRef]
- Talukdar, S.; Singha, P.; Mahato, S.; Shahfahad; Pal, S.; Liou, Y.-A.; Rahman, A. Land-Use Land-Cover Classification by Machine Learning Classifiers for Satellite Observations—A Review. Remote Sens. 2020, 12. [Google Scholar] [CrossRef]
- Verma, P.; Raghubanshi, A.; Srivastava, P.K.; Raghubanshi, A.S. Appraisal of Kappa-Based Metrics and Disagreement Indices of Accuracy Assessment for Parametric and Nonparametric Techniques Used in LULC Classification and Change Detection. Model. Earth Syst. Environ. 2020, 6, 1045–1059. [Google Scholar] [CrossRef]
- Ayeni, A.O.; Aborisade, A.G.; Aiyegbajeje, F.O.; Soneye, A.S.O. The Dynamics of Peri-Urban Expansion in Sub-Saharan Africa: Implications for Sustainable Development in Nigeria and Ghana. Discov. Sustain. 2025, 6, 290. [Google Scholar] [CrossRef]
- Daba, M.H.; You, S. Quantitatively Assessing the Future Land-Use/Land-Cover Changes and Their Driving Factors in the Upper Stream of the Awash River Based on the CA–Markov Model and Their Implications for Water Resources Management. Sustainability 2022, 14. [Google Scholar] [CrossRef]
- Fitawok, M.B.; Derudder, B.; Minale, A.S.; Van Passel, S.; Adgo, E.; Nyssen, J. Analyzing the Impact of Land Expropriation Program on Farmers’ Livelihood in Urban Fringes of Bahir Dar, Ethiopia. Habitat Int. 2022, 129, 102674. [Google Scholar] [CrossRef]
- Han, Y.; Jia, H. Simulating the Spatial Dynamics of Urban Growth with an Integrated Modeling Approach: A Case Study of Foshan, China. Spec. Issue China-Korea Jt. Semin. Multi-Discip. Multi-Method Approaches Sustain. Hum. Nat. Interact. 2017, 353, 107–116. [Google Scholar] [CrossRef]
- Vani, M.; Prasad, P.R.C. Modelling Urban Expansion of a South-East Asian City, India: Comparison between SLEUTH and a Hybrid CA Model. Model. Earth Syst. Environ. 2022, 8, 1419–1431. [Google Scholar] [CrossRef]
- Terfa, B.K.; Chen, N.; Liu, D.; Zhang, X.; Niyogi, D. Urban Expansion in Ethiopia from 1987 to 2017: Characteristics, Spatial Patterns, and Driving Forces. Sustainability 2019, 11. [Google Scholar] [CrossRef]
- Shahfahad; Talukdar, S.; Naikoo, M.W.; Rahman, A. Urban Expansion and Vegetation Dynamics: The Role of Protected Areas in Preventing Vegetation Loss in a Growing Mega City. Habitat Int. 2024, 150, 103129. [Google Scholar] [CrossRef]
- Yang, K.; Sun, W.; Luo, Y.; Zhao, L. Impact of Urban Expansion on Vegetation: The Case of China (2000–2018). J. Environ. Manage. 2021, 291, 112598. [Google Scholar] [CrossRef] [PubMed]
- Mohamed, A.; Worku, H. Simulating Urban Land Use and Cover Dynamics Using Cellular Automata and Markov Chain Approach in Addis Ababa and the Surrounding. Urban Clim. 2020, 31, 100545. [Google Scholar] [CrossRef]
- Kang, L.; Ma, L.; Liu, Y. Comparing the Driving Mechanisms of Different Types of Urban Construction Land Expansion: A Case Study of the Beijing-Tianjin-Hebei Region. J. Geogr. Sci. 2024, 34, 722–744. [Google Scholar] [CrossRef]
- Rimal, B.; Zhang, L.; Stork, N.; Sloan, S.; Rijal, S. Urban Expansion Occurred at the Expense of Agricultural Lands in the Tarai Region of Nepal from 1989 to 2016. Sustainability 2018, 10. [Google Scholar] [CrossRef]
- Zhang, X.; Zou, Y.; Xia, C.; Lu, Y. Unraveling the Mystery of Urban Expansion in the Guangdong-Hong Kong-Macao Greater Bay Area: Exploring the Crucial Role of Regional Cooperation. Environ. Plan. B Urban Anal. City Sci. 2025, 52, 707–724. [Google Scholar] [CrossRef]
Figure 1.
Geographical location the study area.
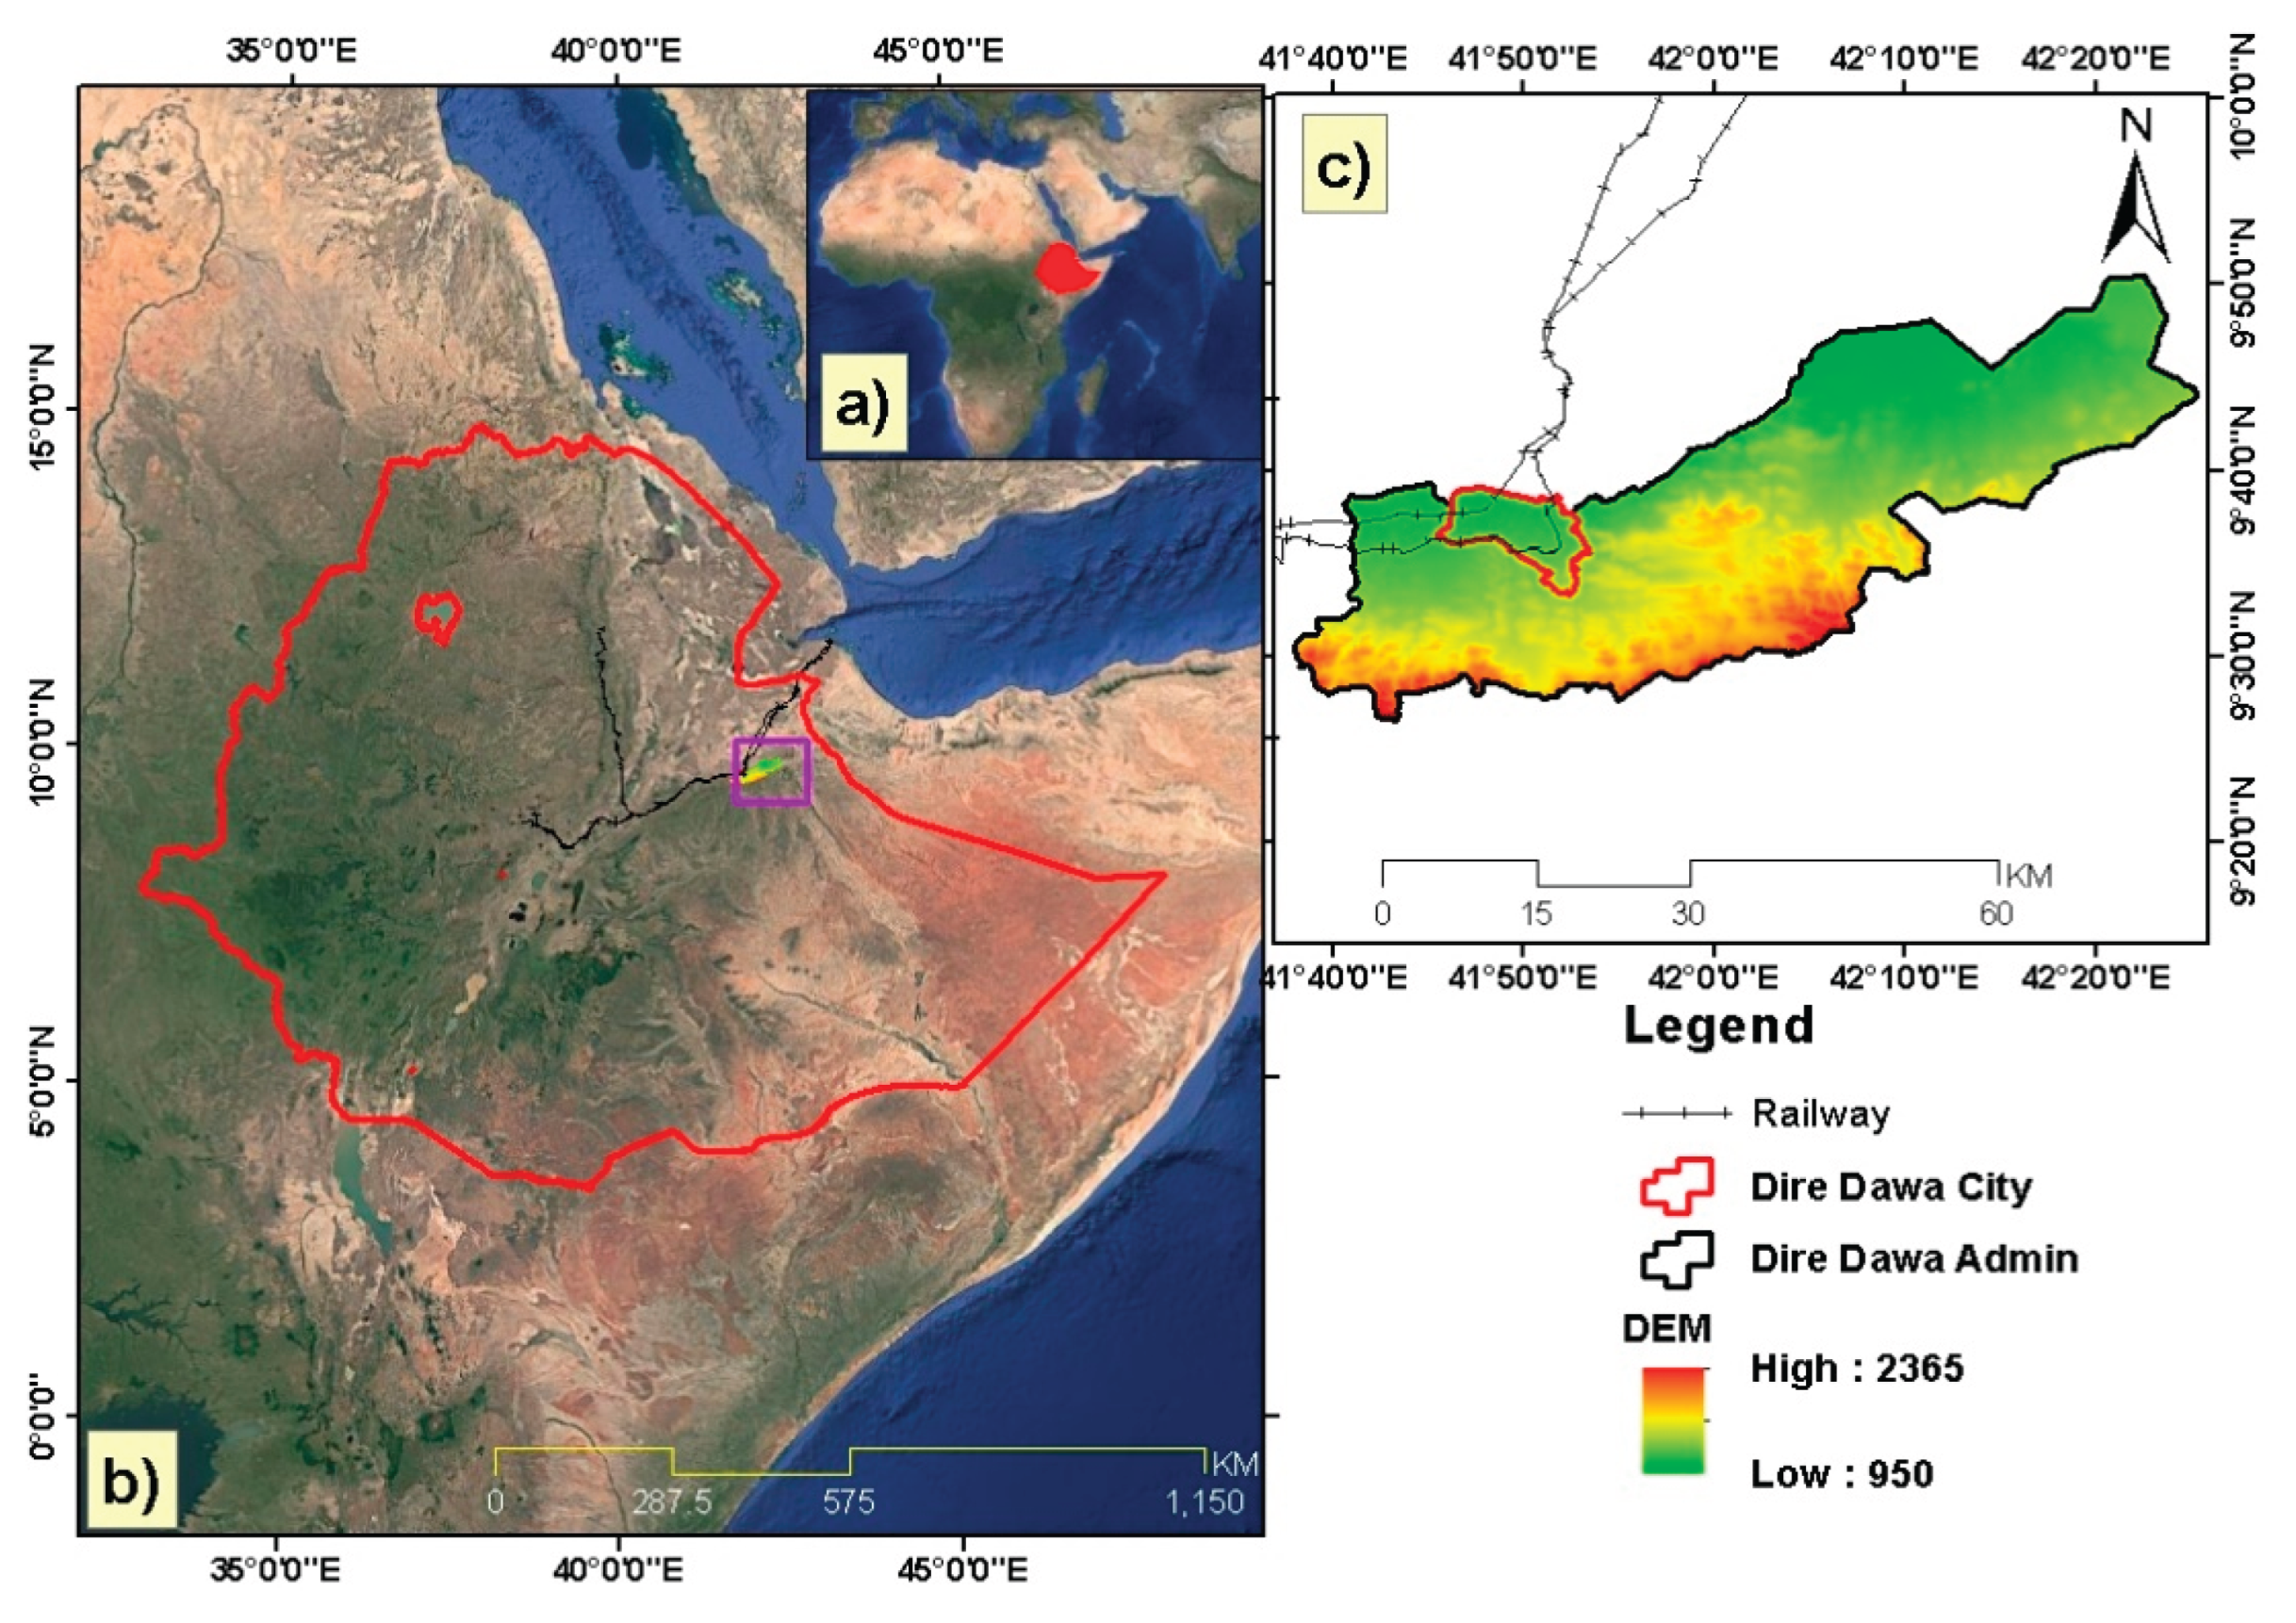
Figure 2.
Methodological Flow Chart to Simulate Urban Expansion.
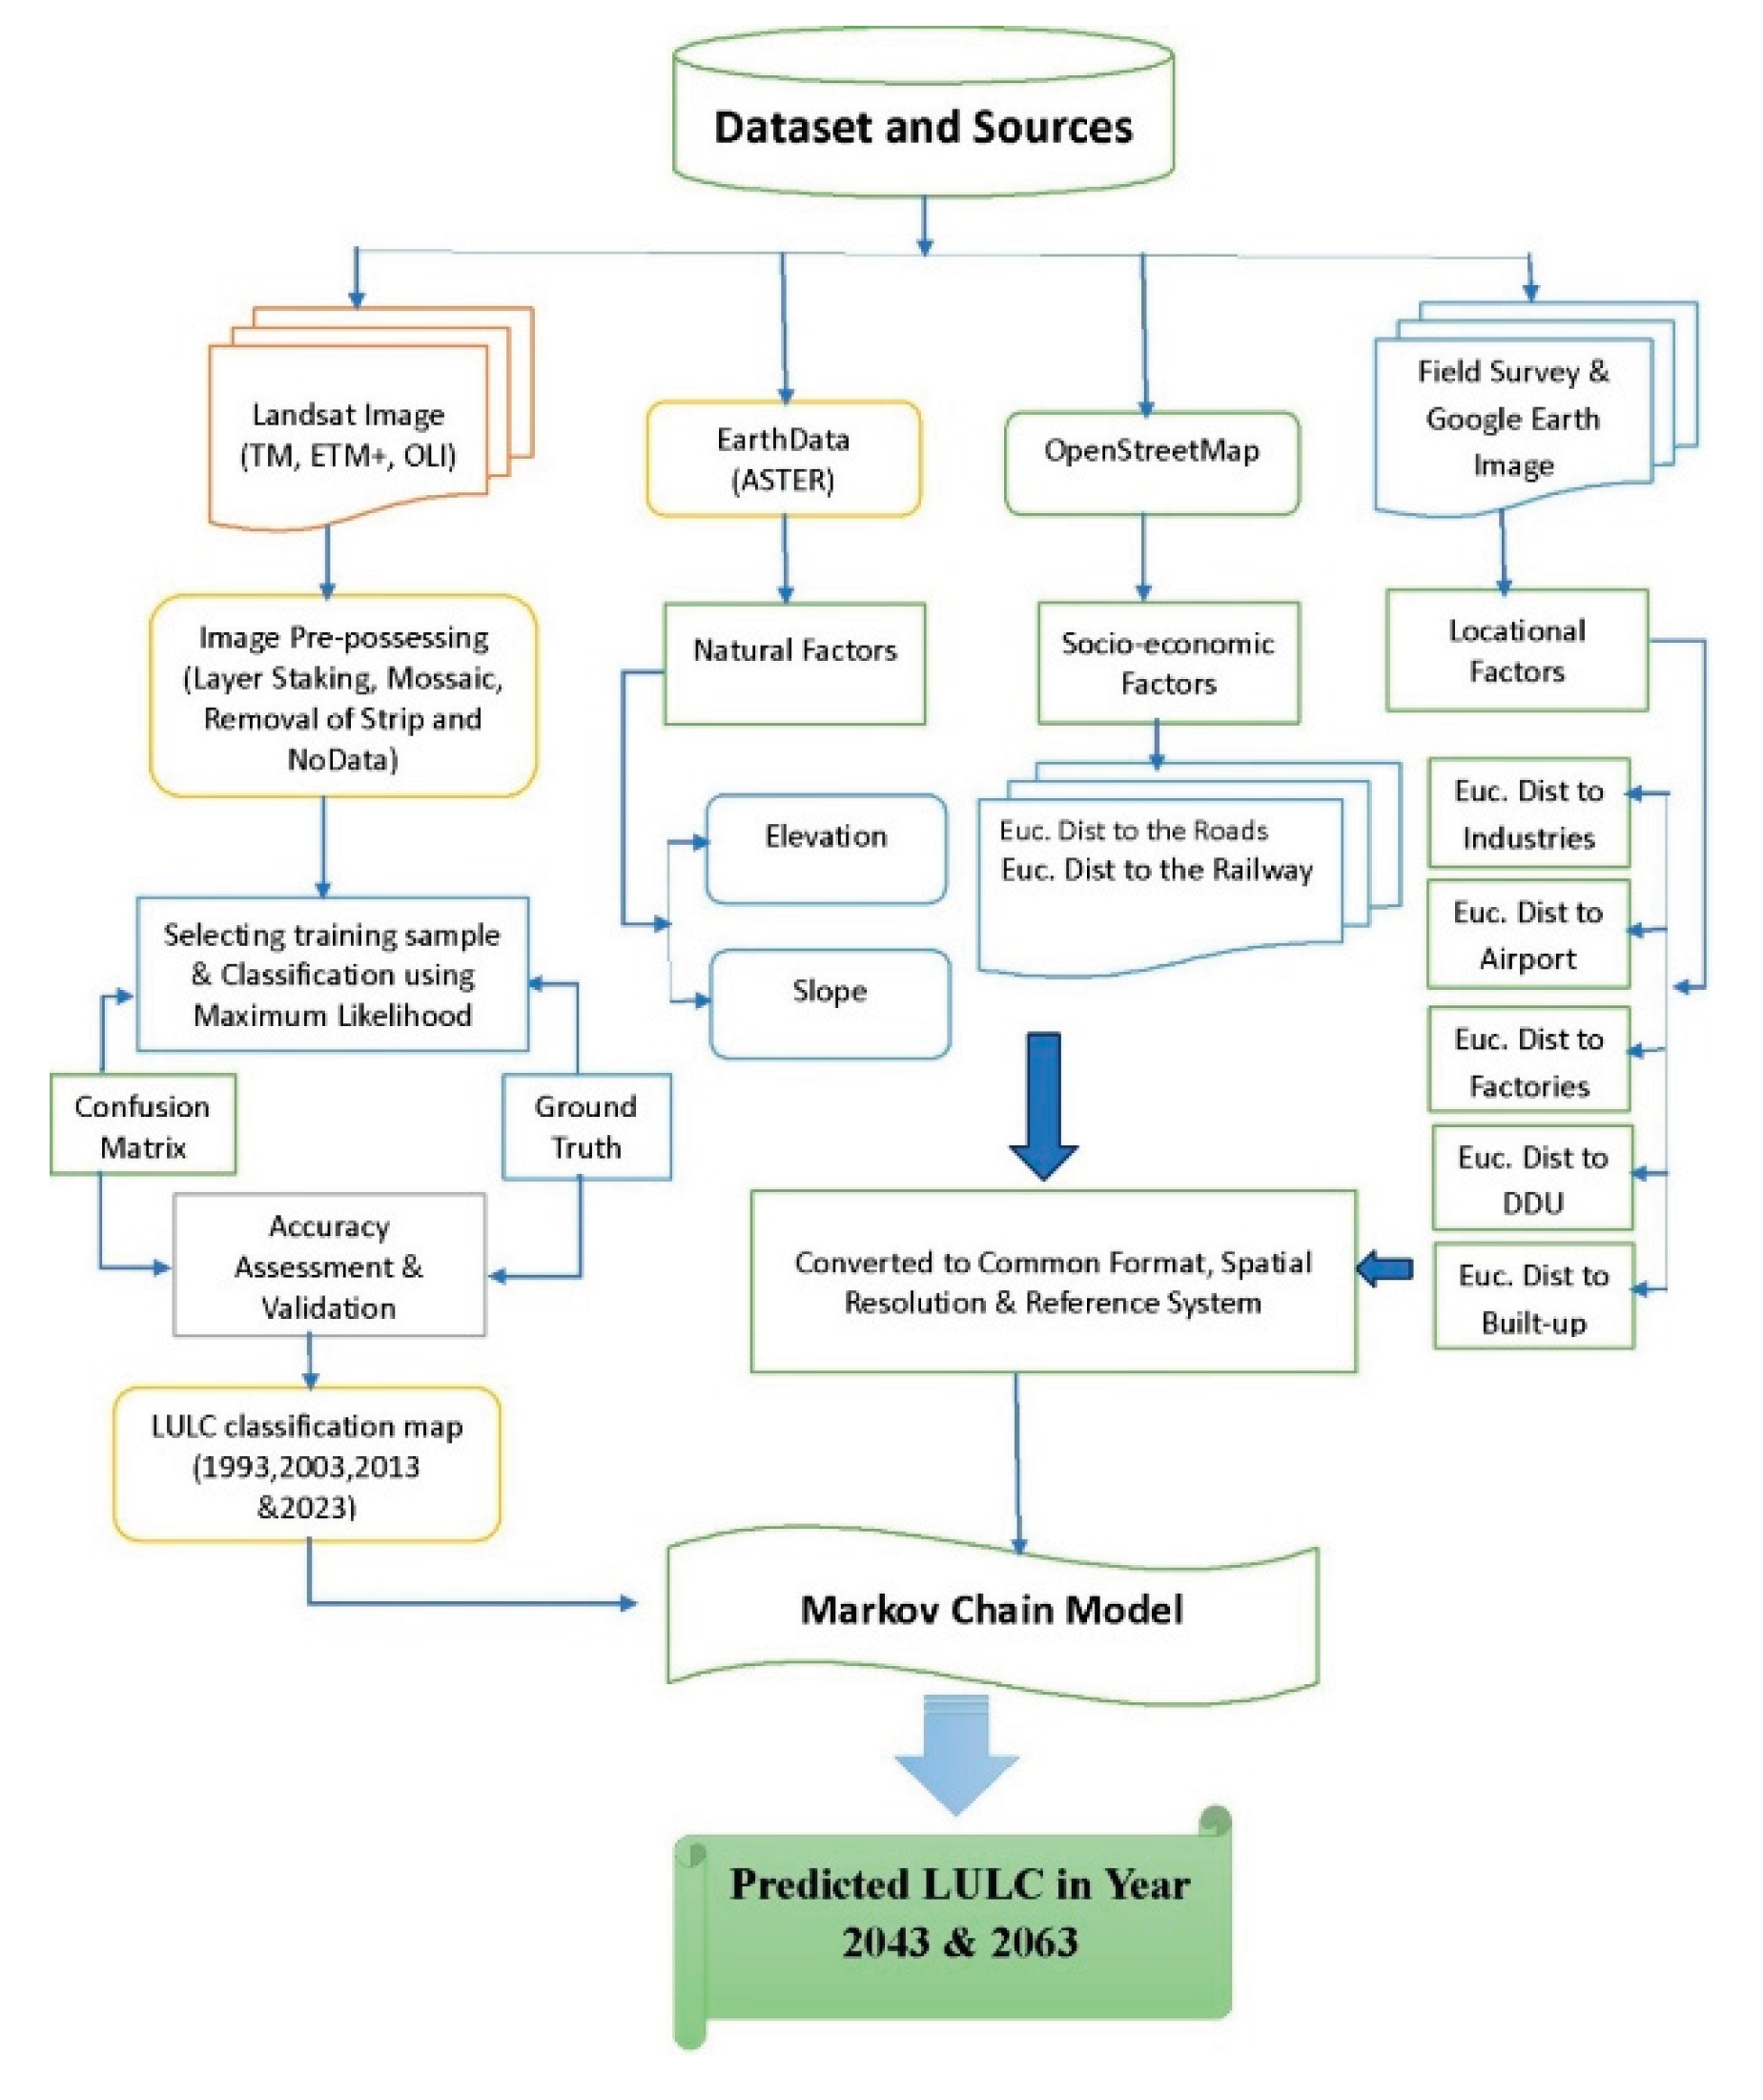
Figure 3.
Driving Factors for Urban Expansion in the Dire Dawa City.
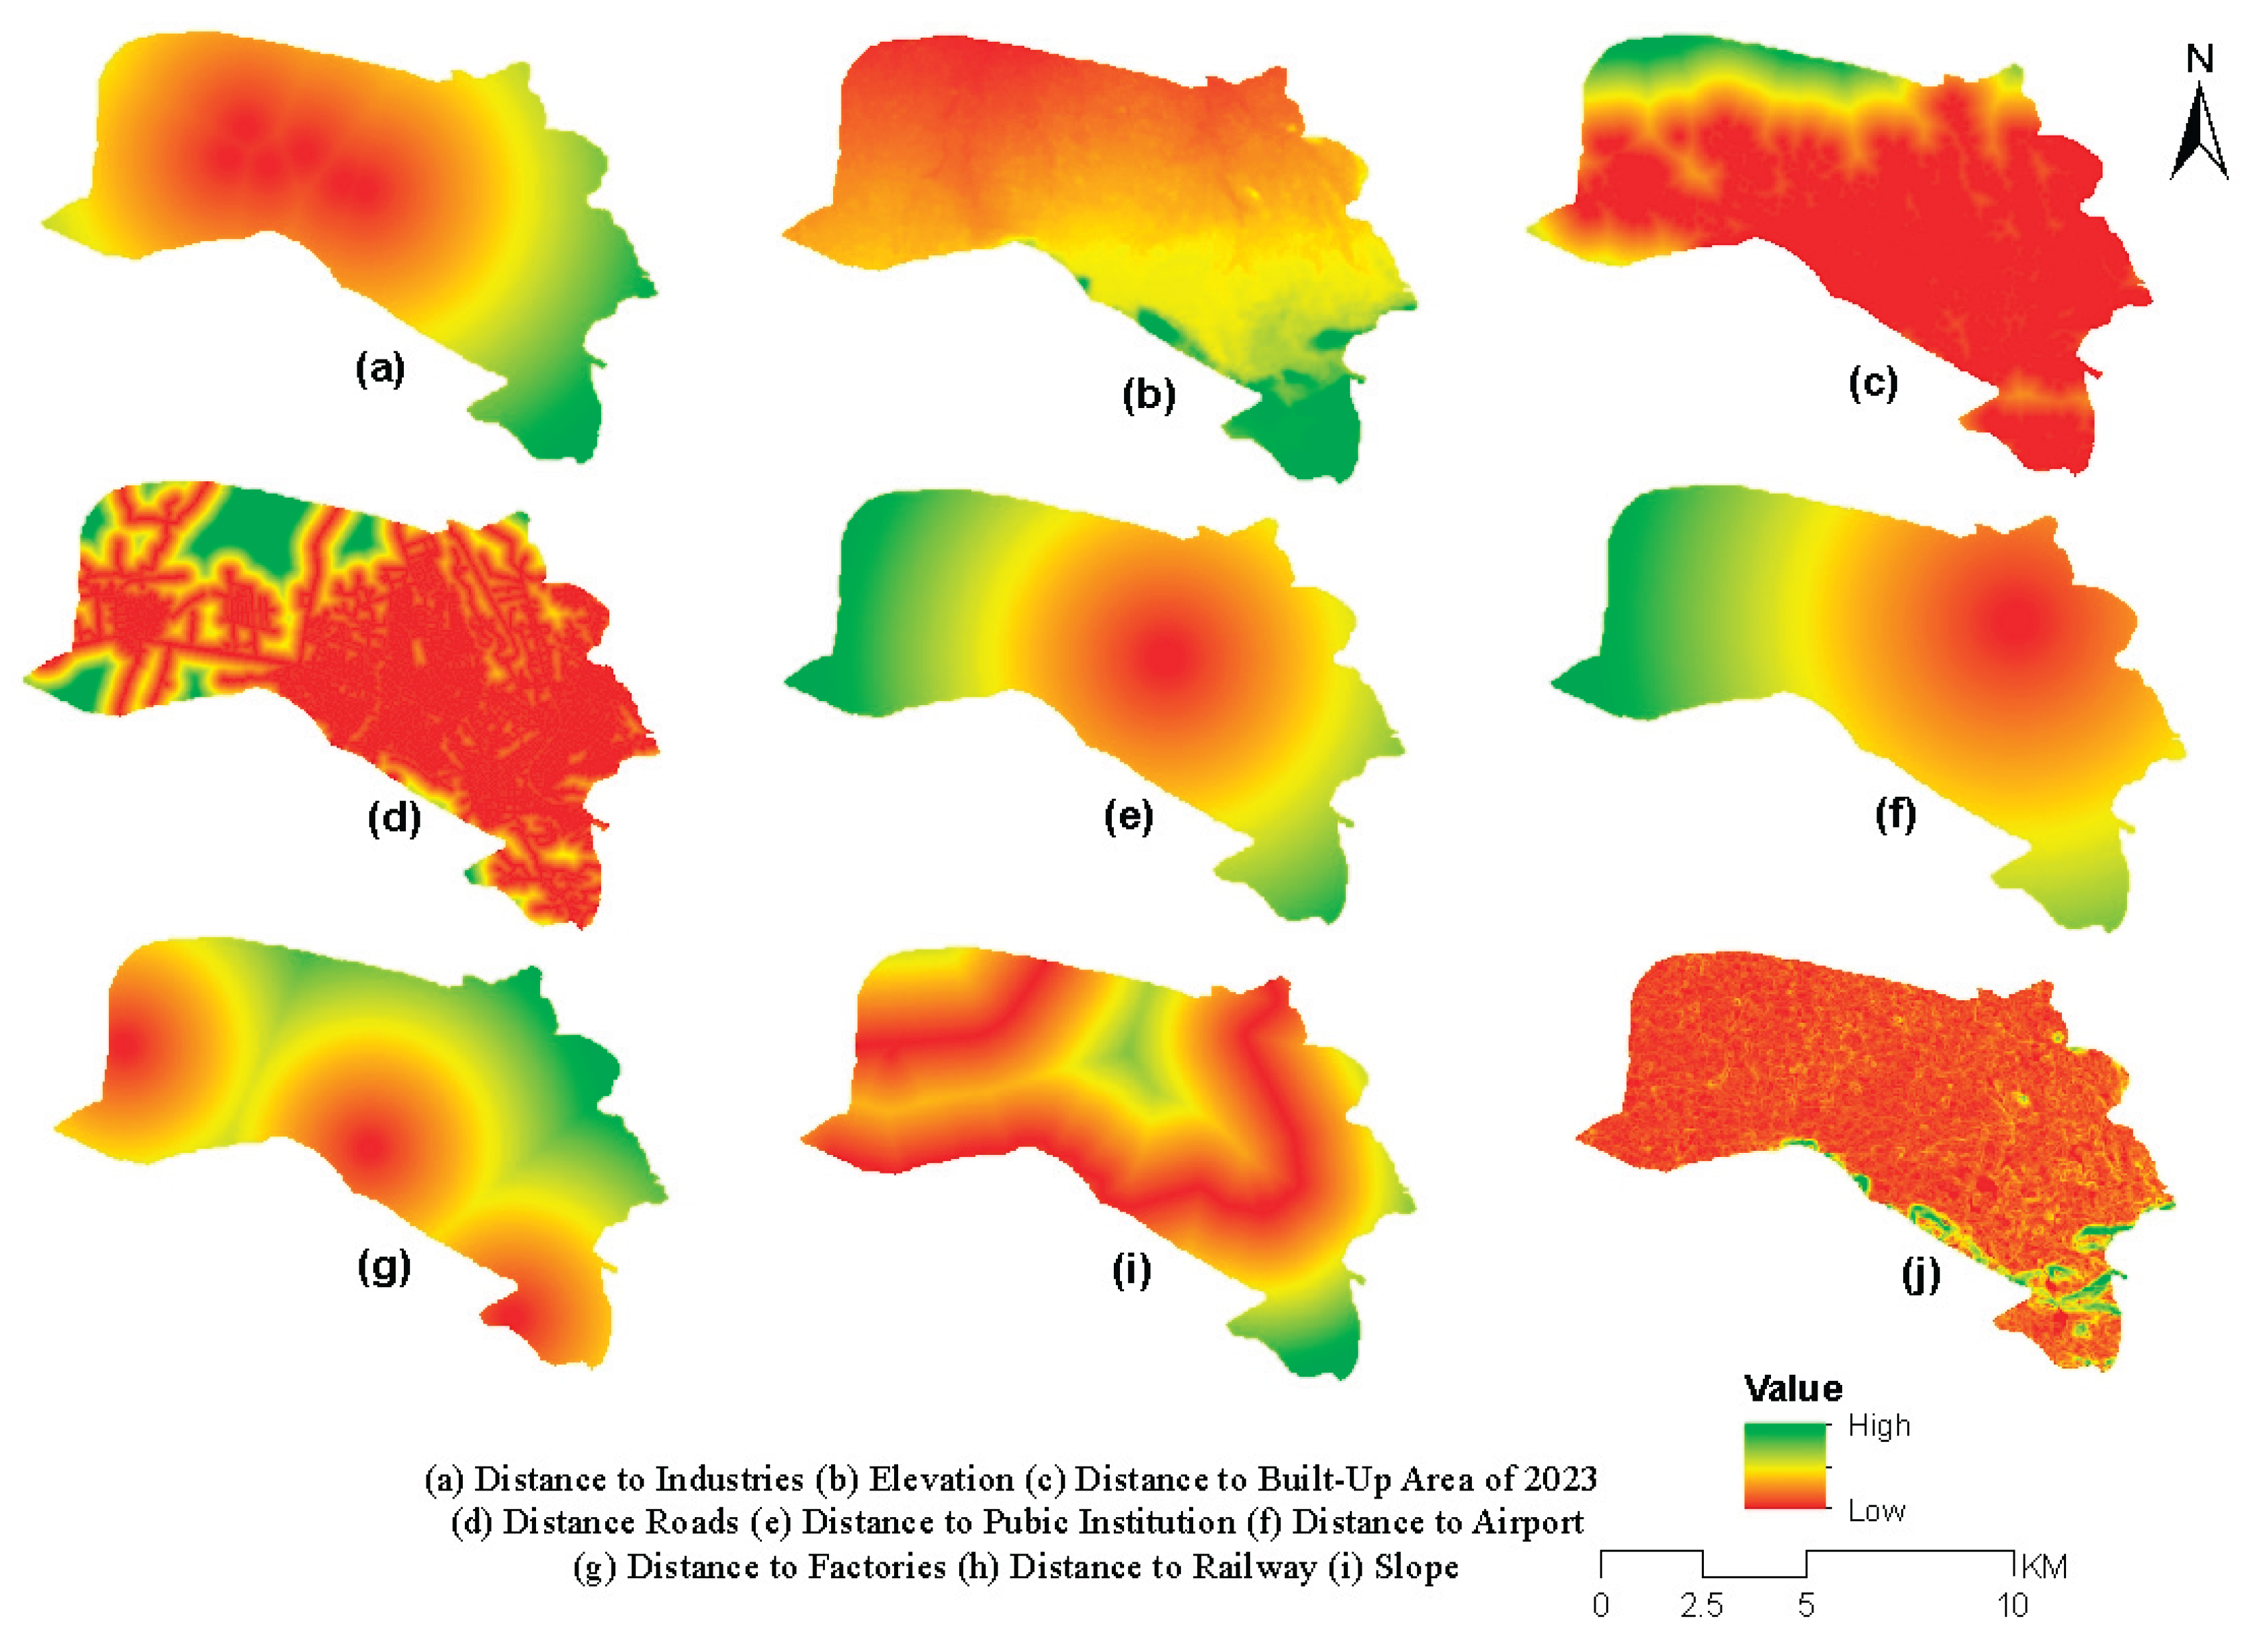
Figure 4.
Land Use/Land Cover Maps of Dire Dawa City (993-2023).
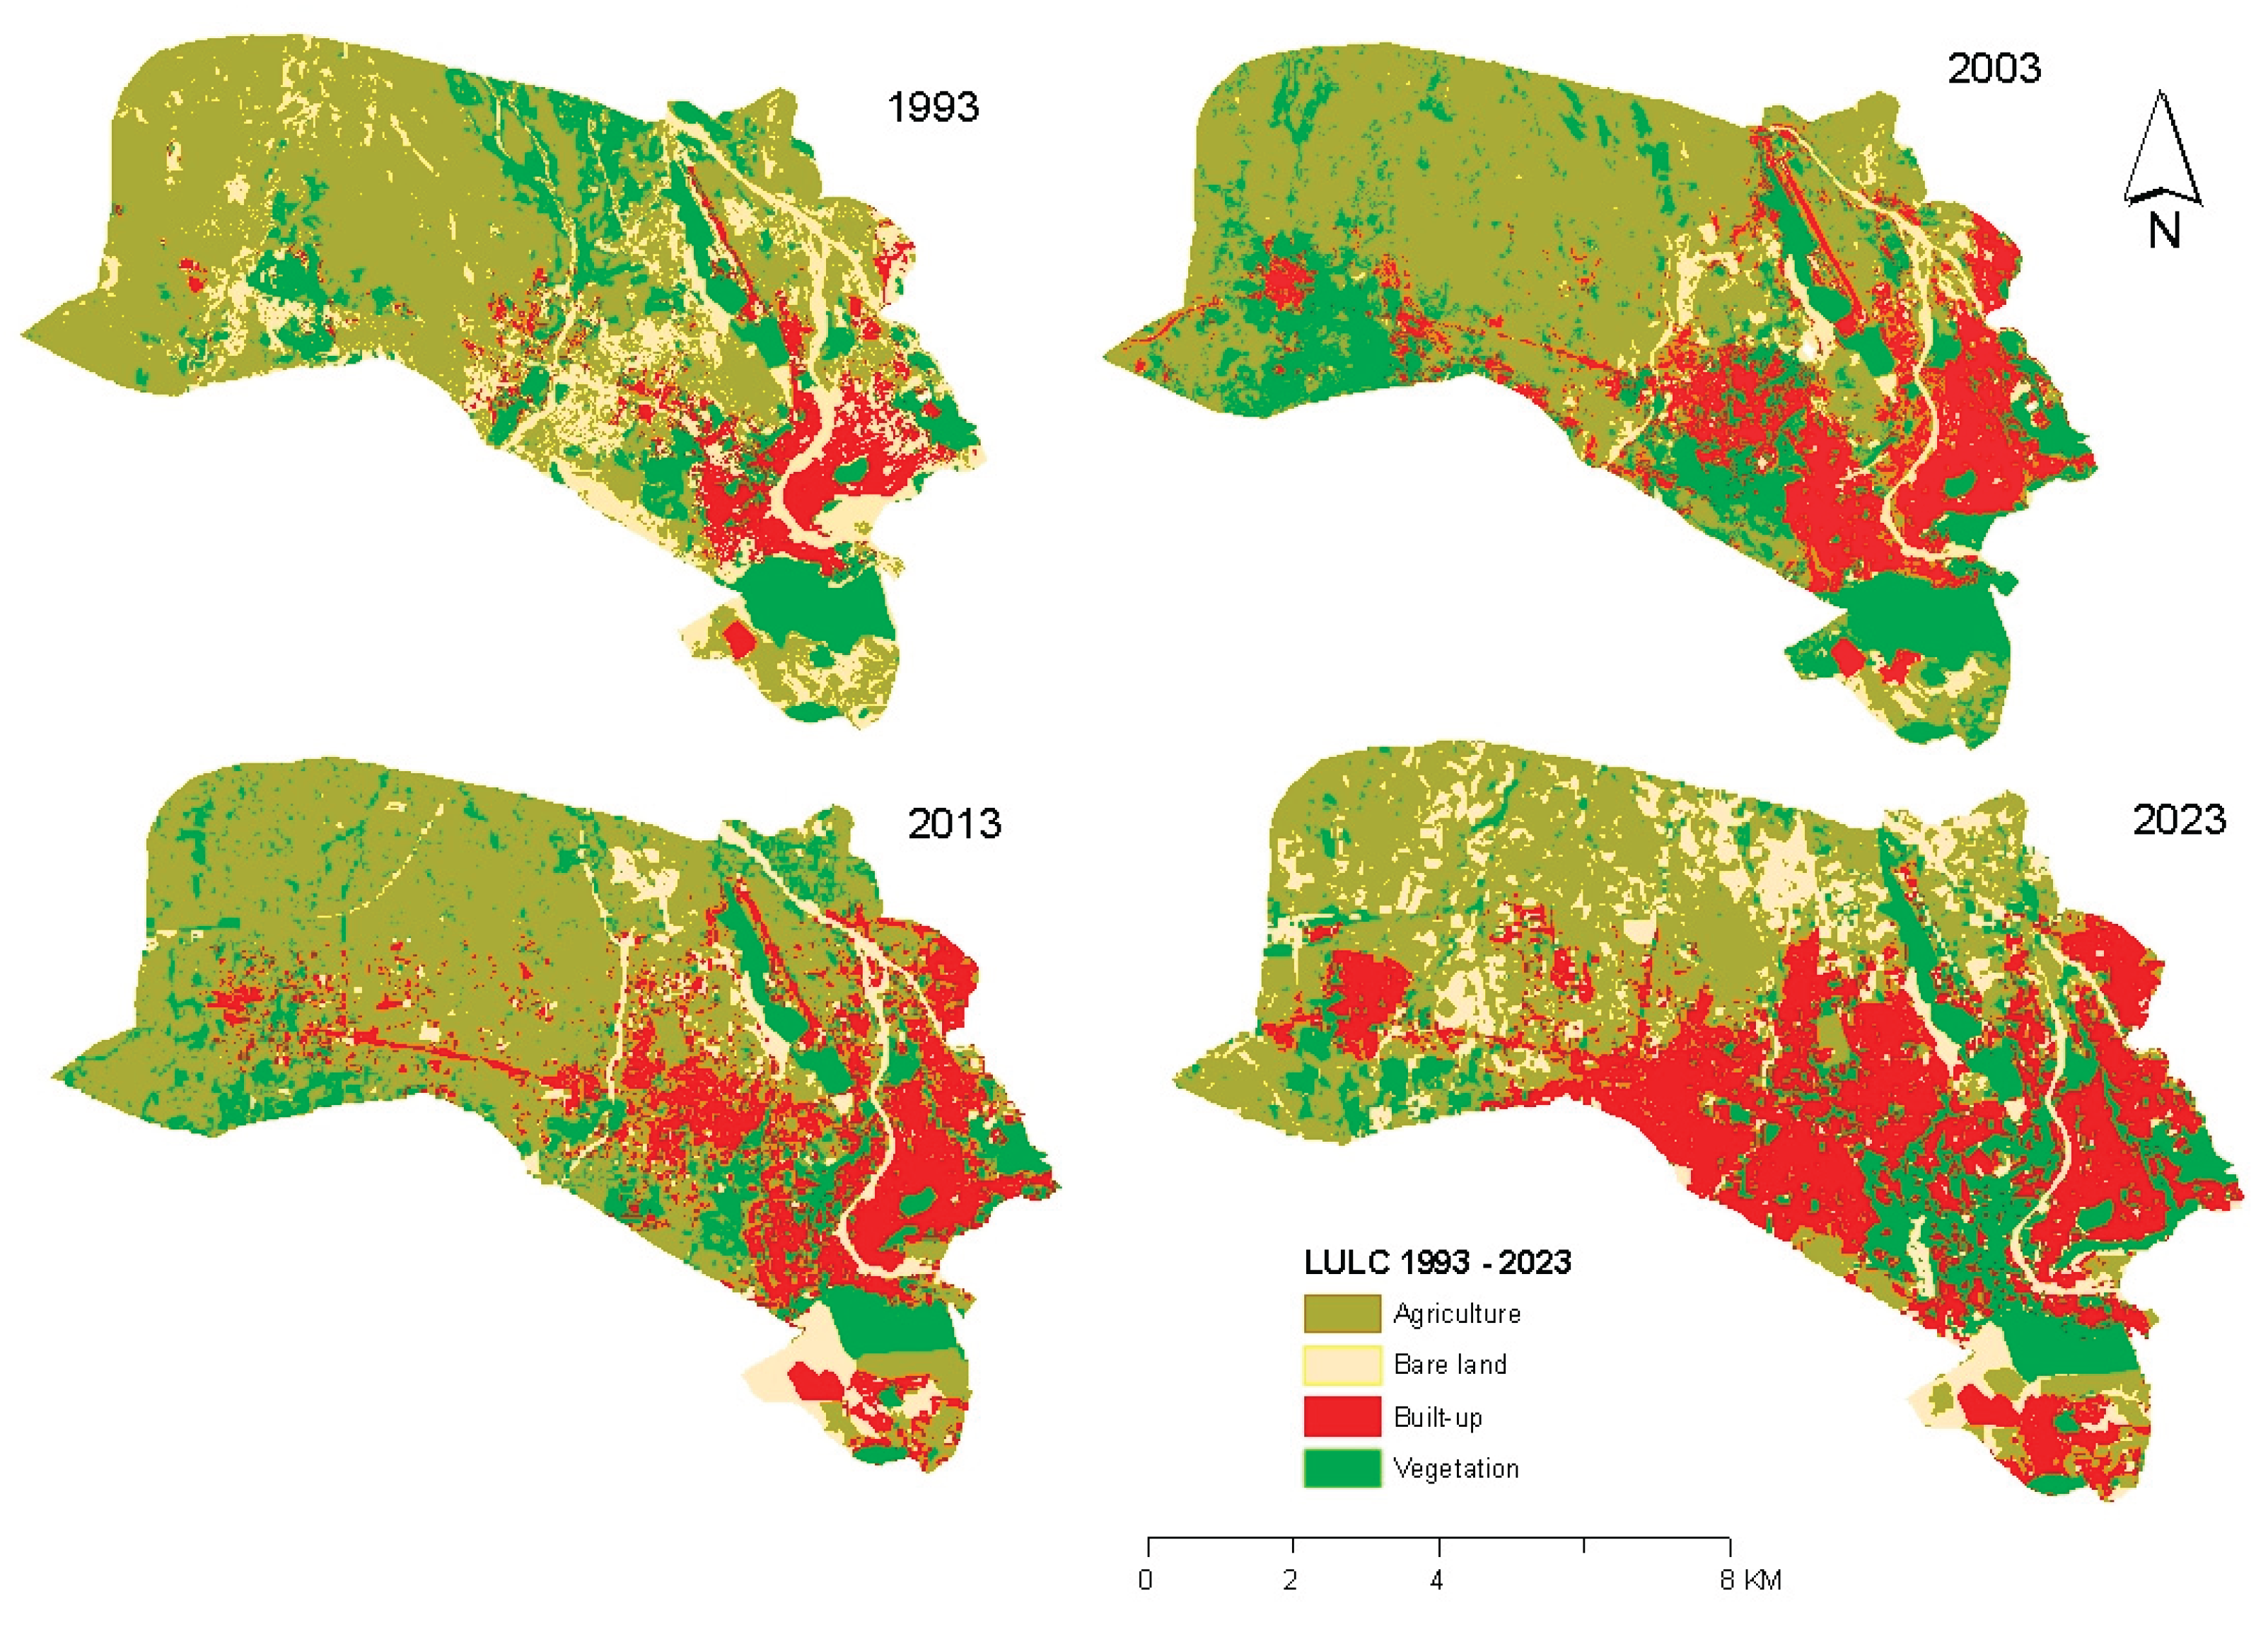
Figure 8.
Concentrations of built-up areas in different directions and distances from the CBD: i) 1993, ii) 2003, iii) 2013, and iv) 2023.
Figure 8.
Concentrations of built-up areas in different directions and distances from the CBD: i) 1993, ii) 2003, iii) 2013, and iv) 2023.
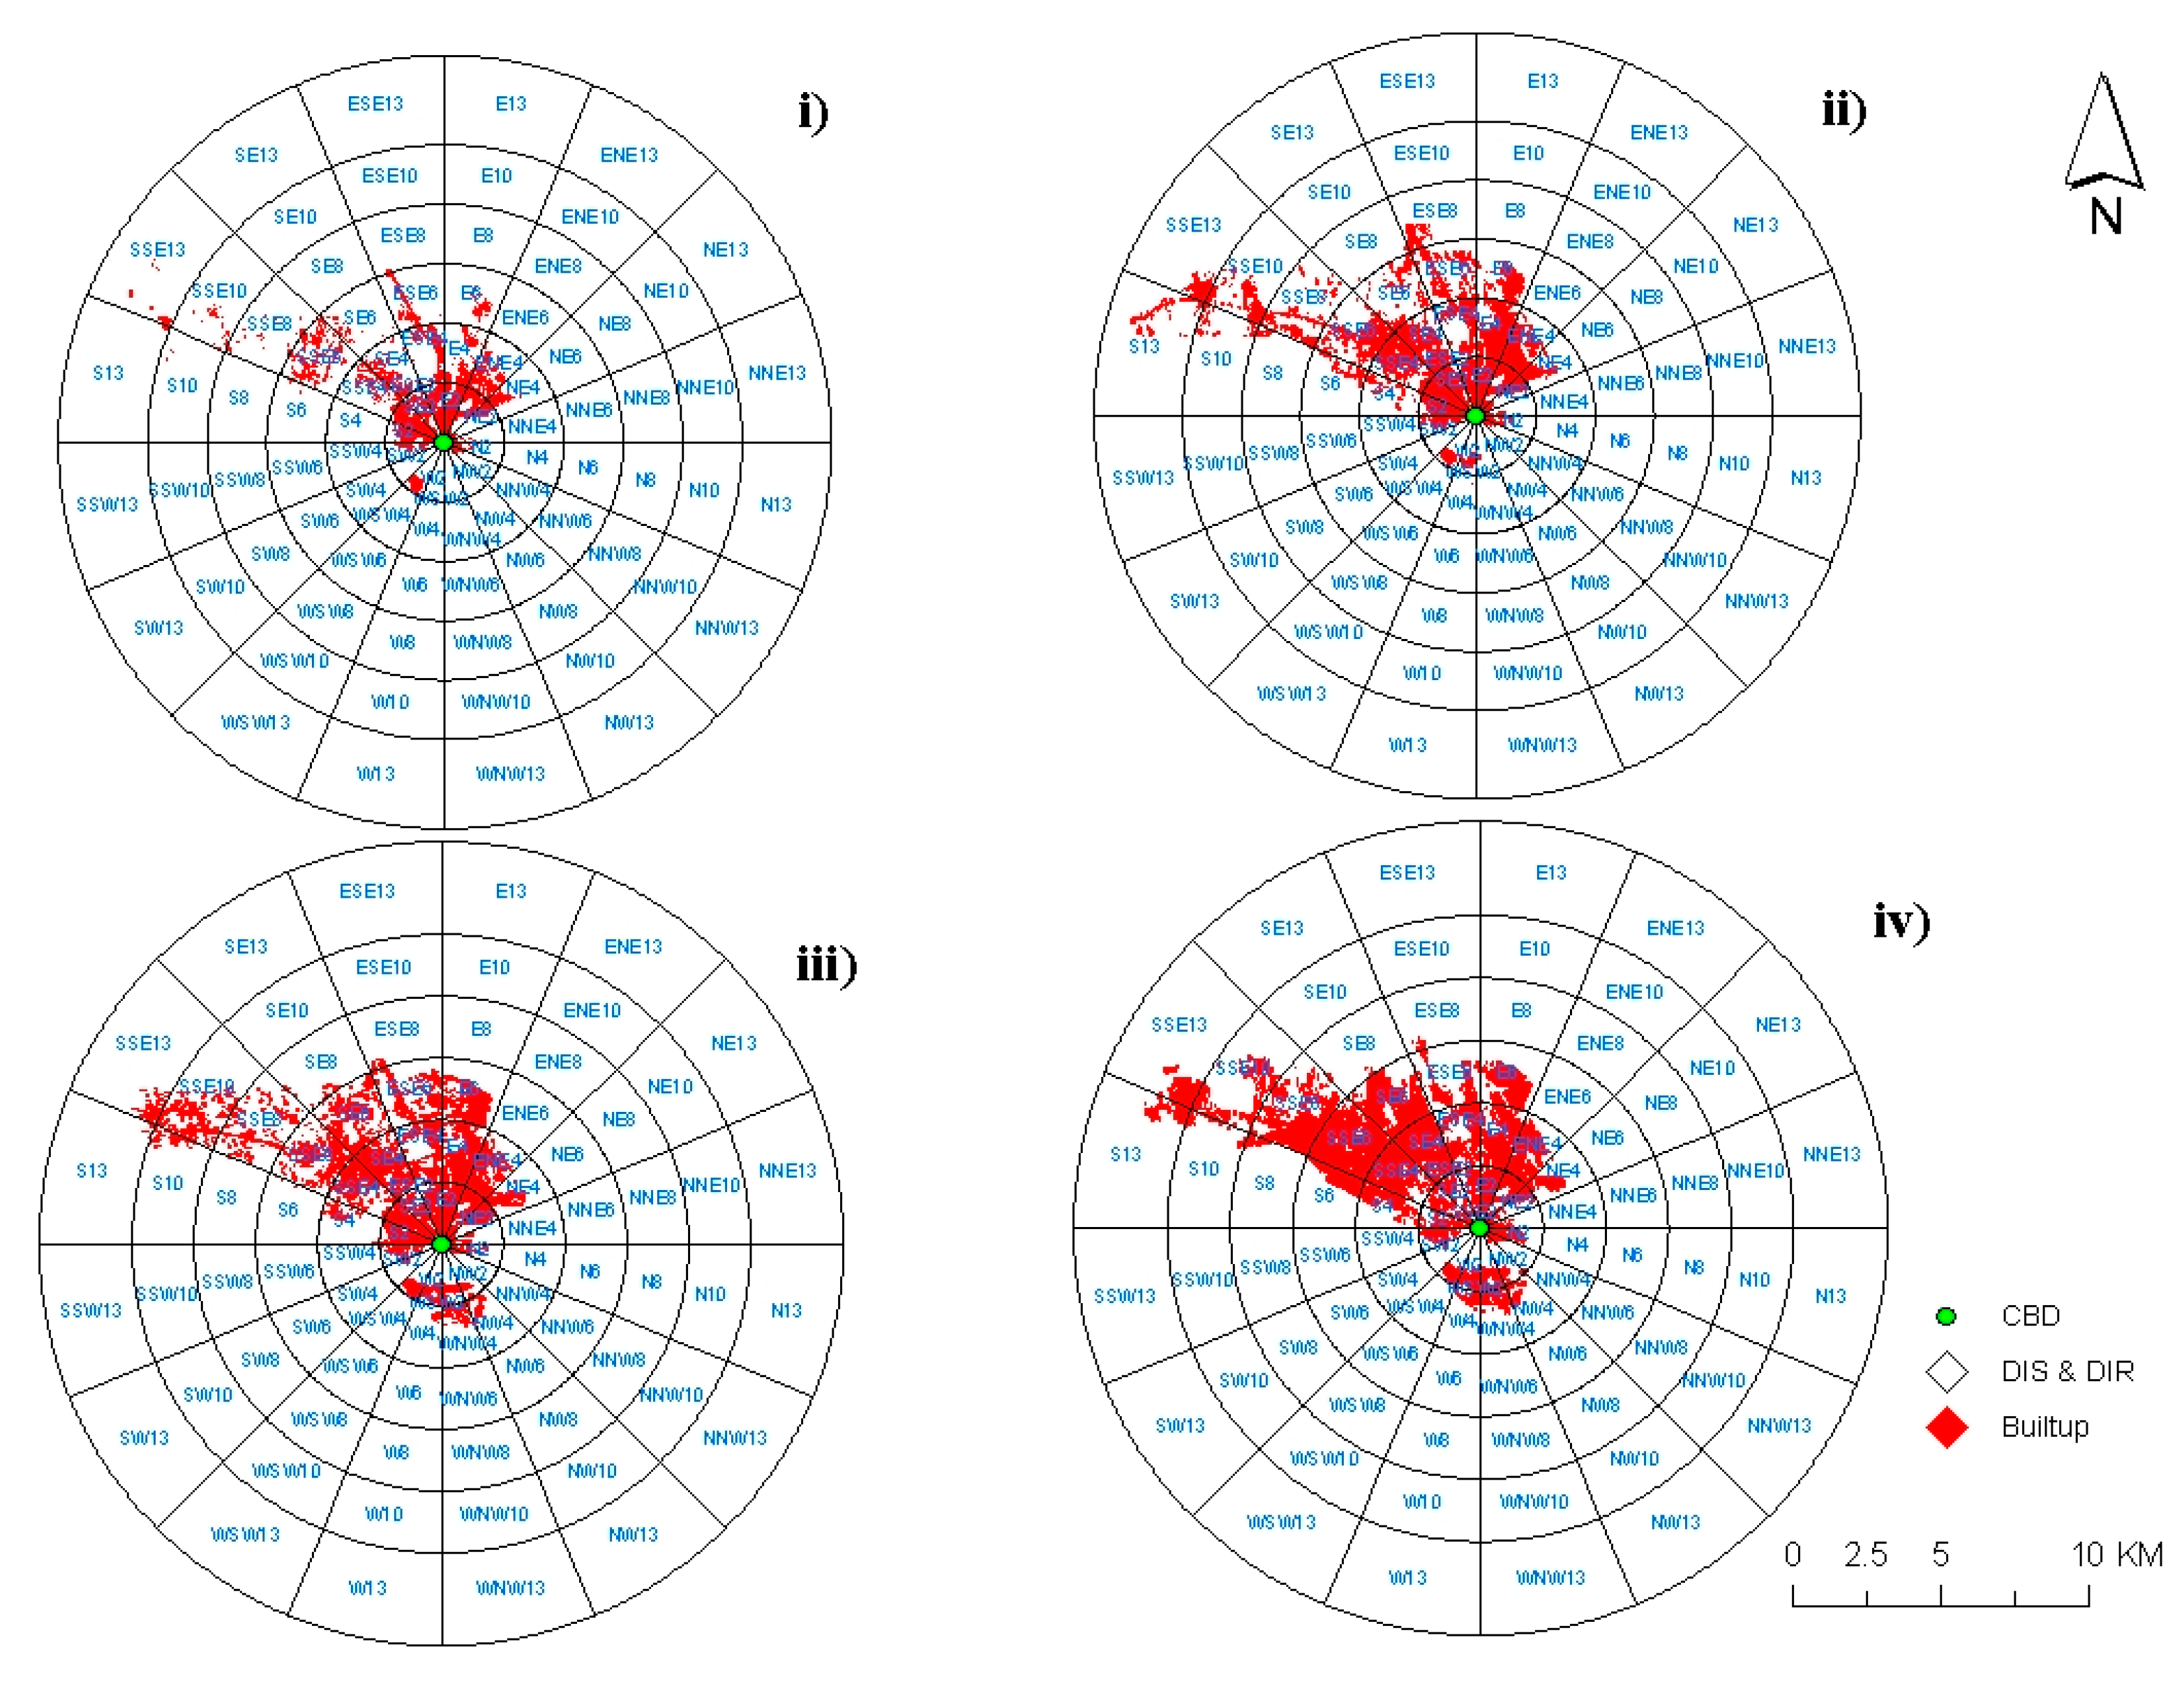
Figure 9.
Radial urban expansions of Dire Dawa City at different direction a)1993; b)2003; c)2013 and d)2023.
Figure 9.
Radial urban expansions of Dire Dawa City at different direction a)1993; b)2003; c)2013 and d)2023.
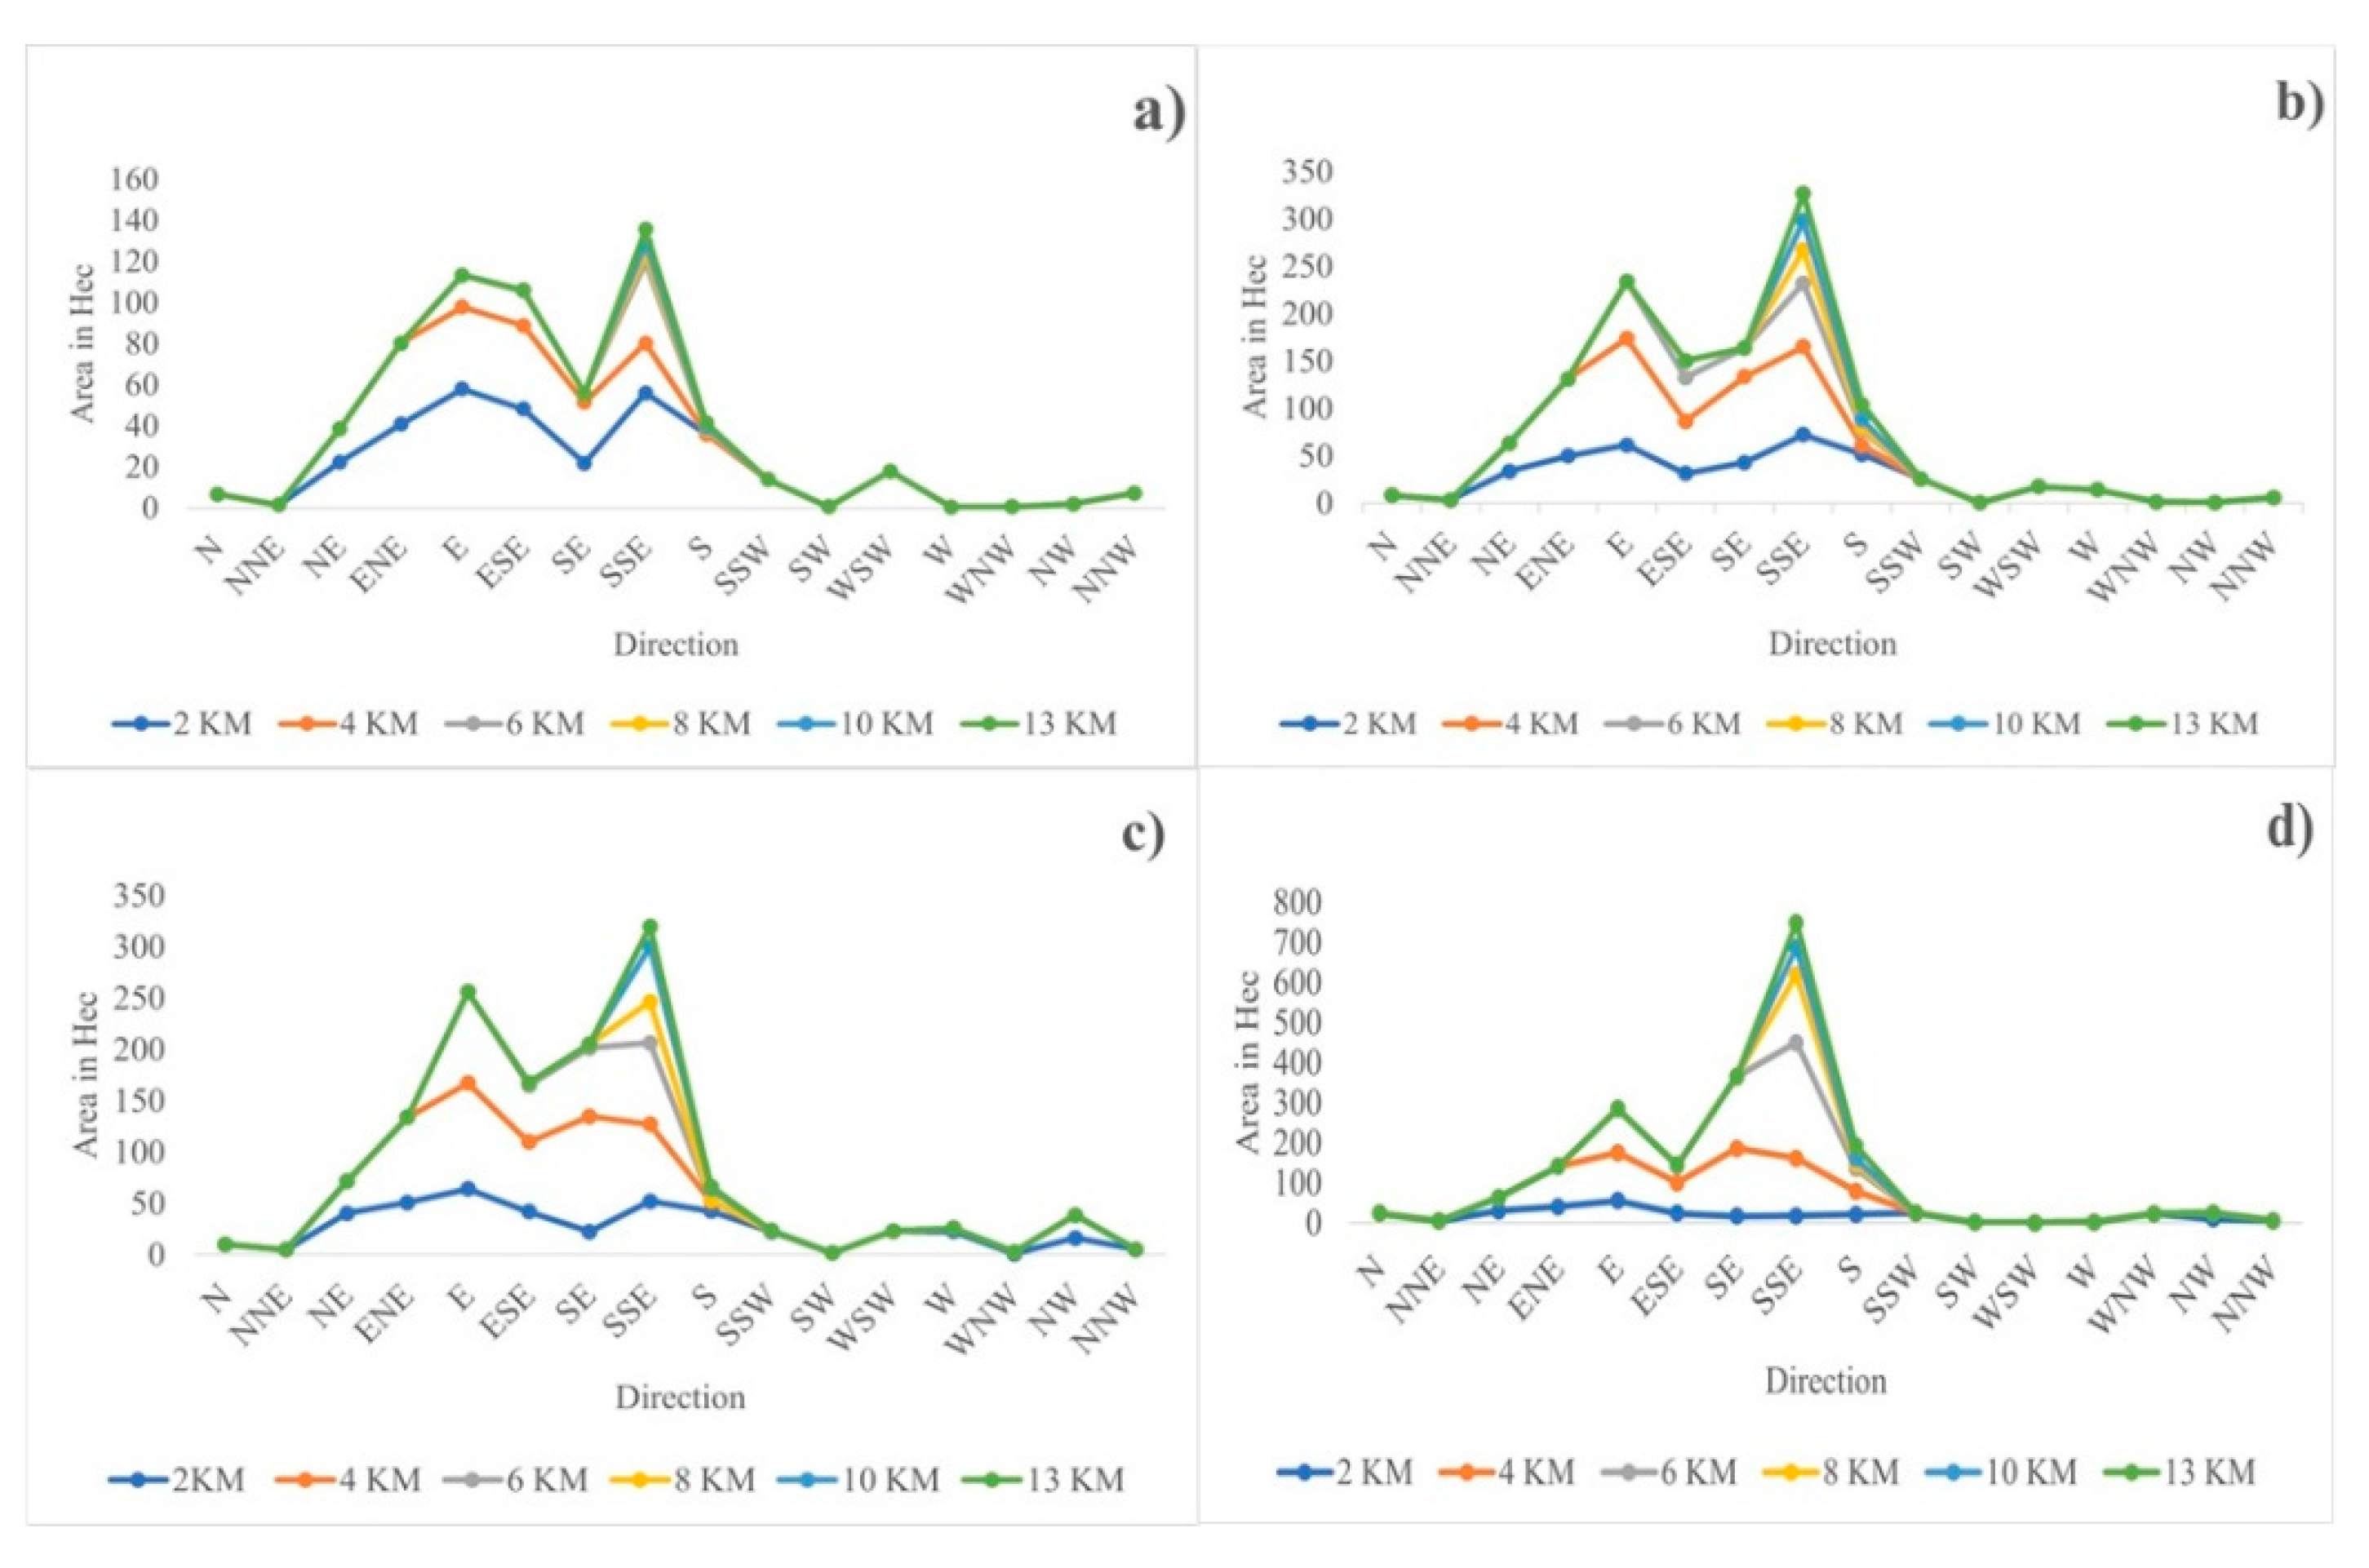
Figure 10.
Spatial distributions of three urban growth types in Dire Dawa City: a) 1993–2003, b) 2003–2013, c) 2013– 2023.
Figure 10.
Spatial distributions of three urban growth types in Dire Dawa City: a) 1993–2003, b) 2003–2013, c) 2013– 2023.
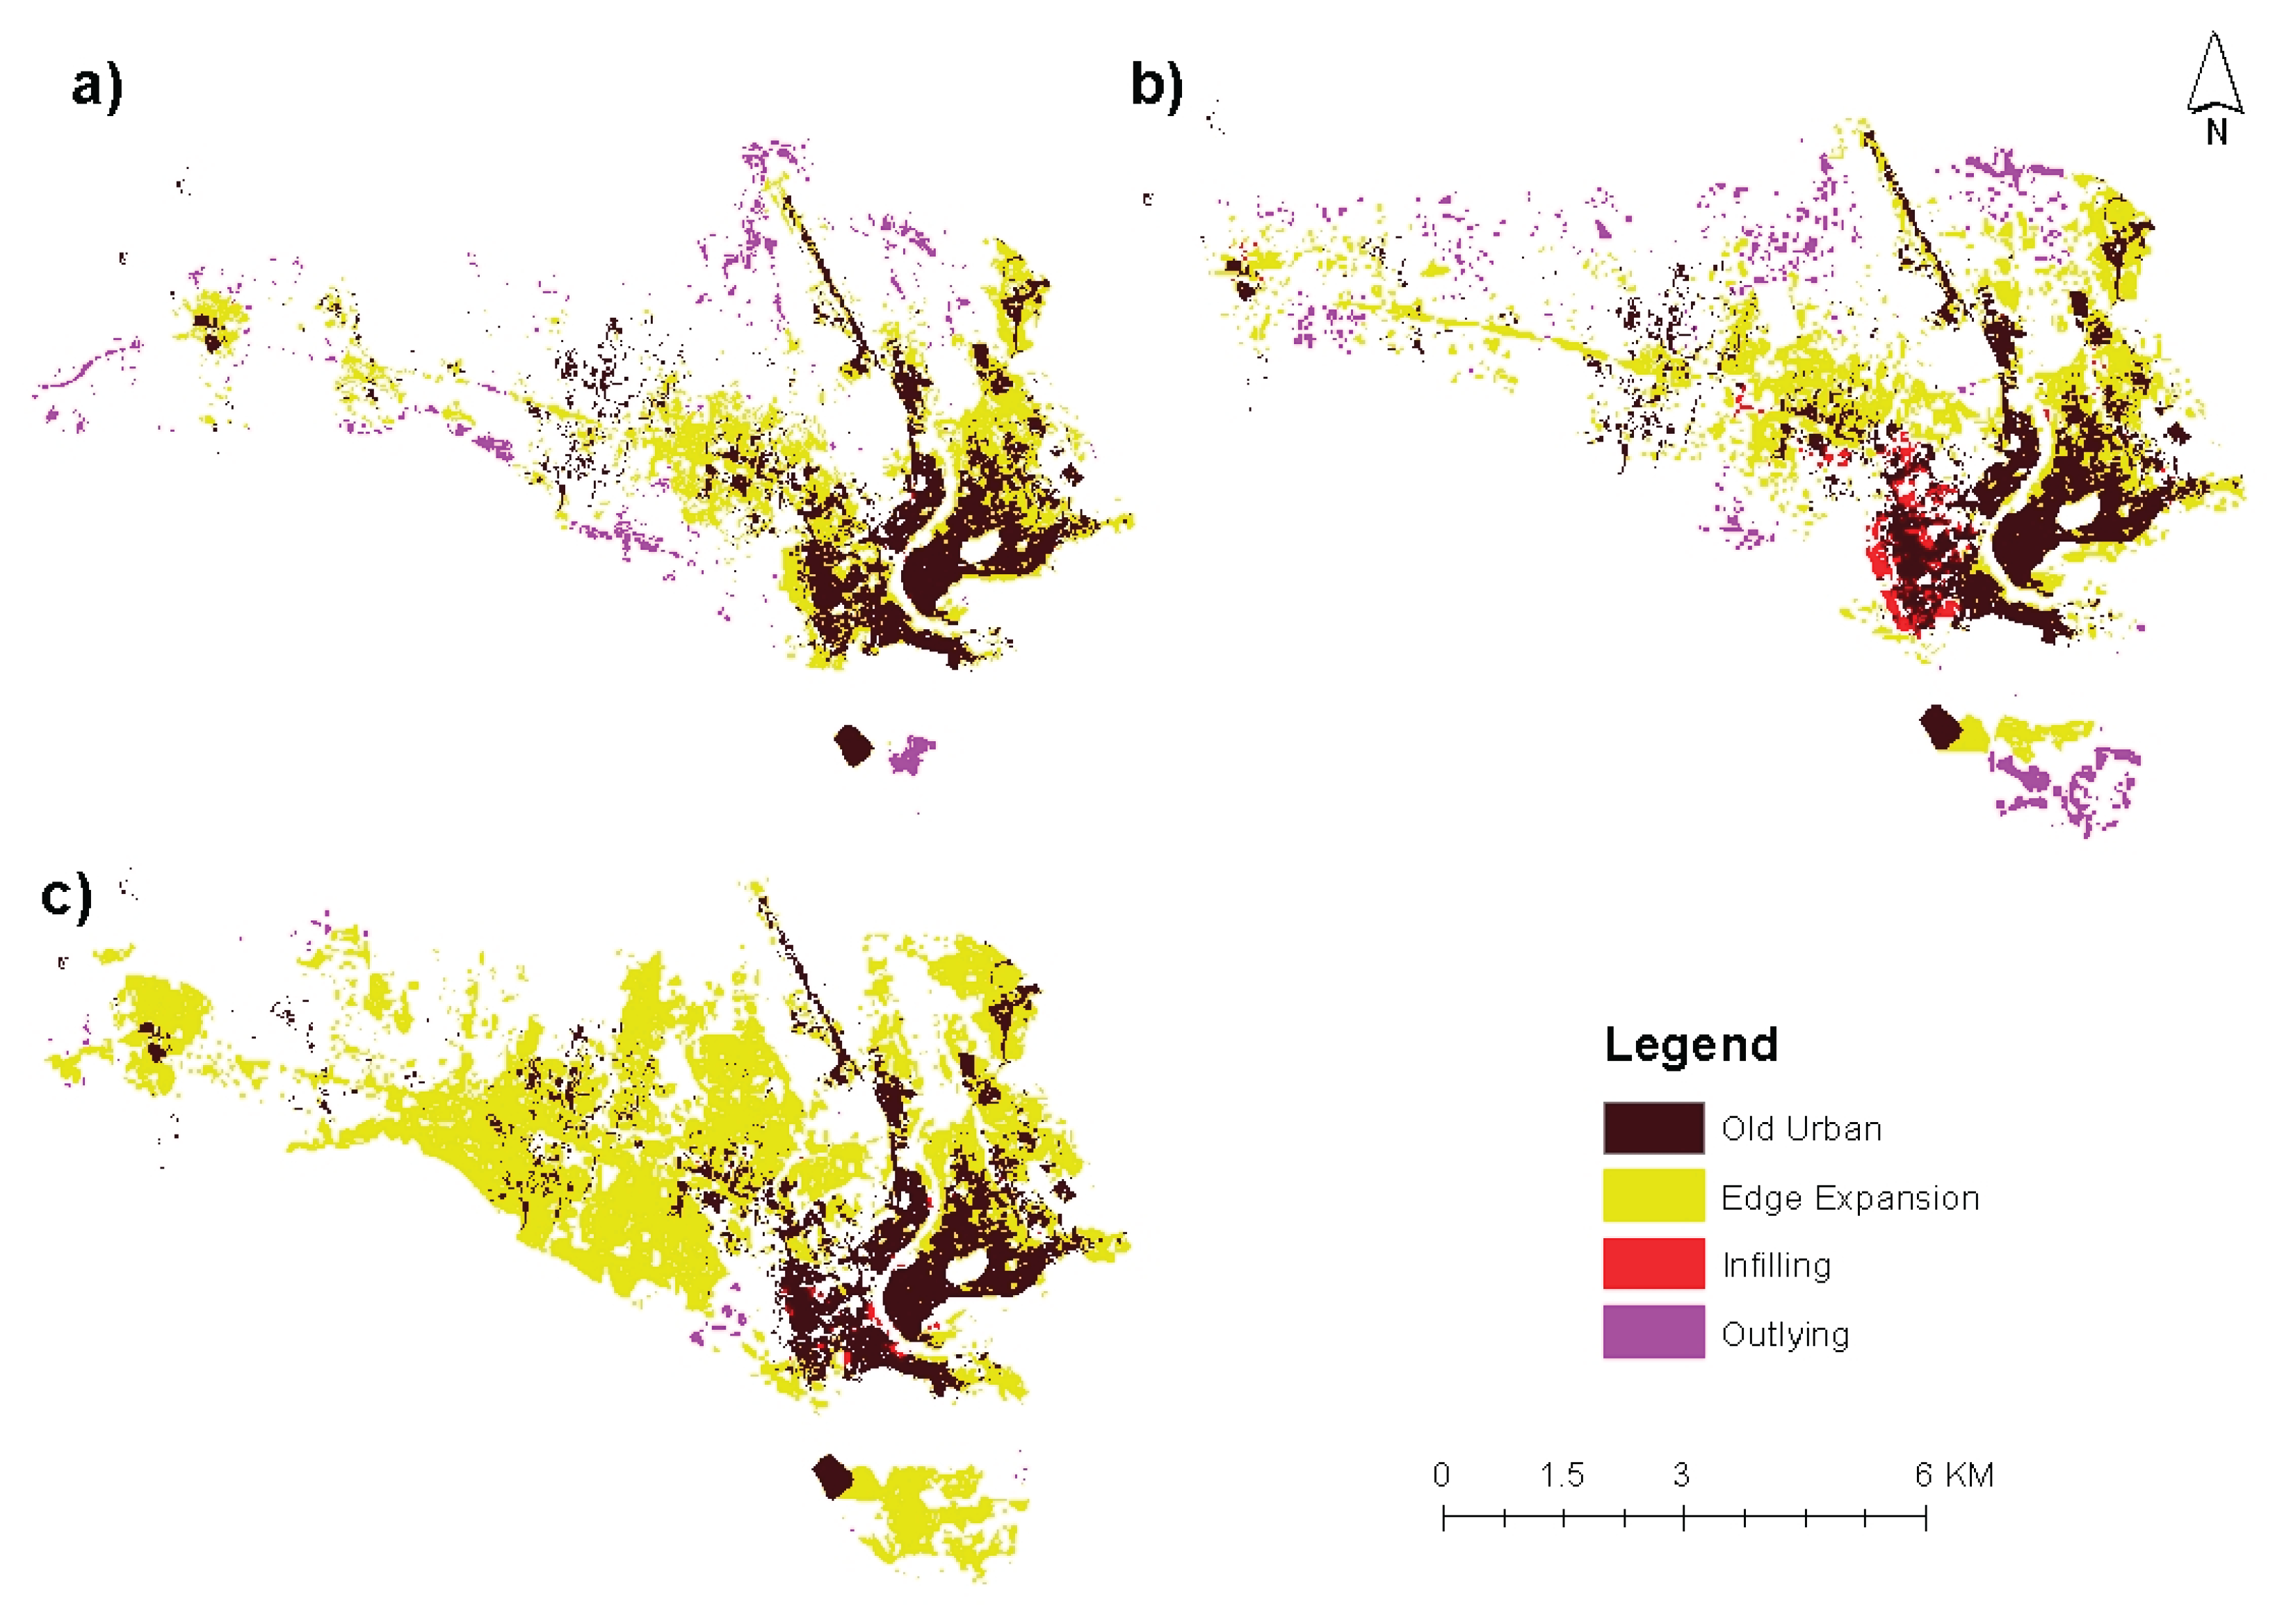
Figure 11.
Comparison LULC map of 2023 year; (a) predicted using Markov Chain Model and (b) previously classified map.
Figure 11.
Comparison LULC map of 2023 year; (a) predicted using Markov Chain Model and (b) previously classified map.
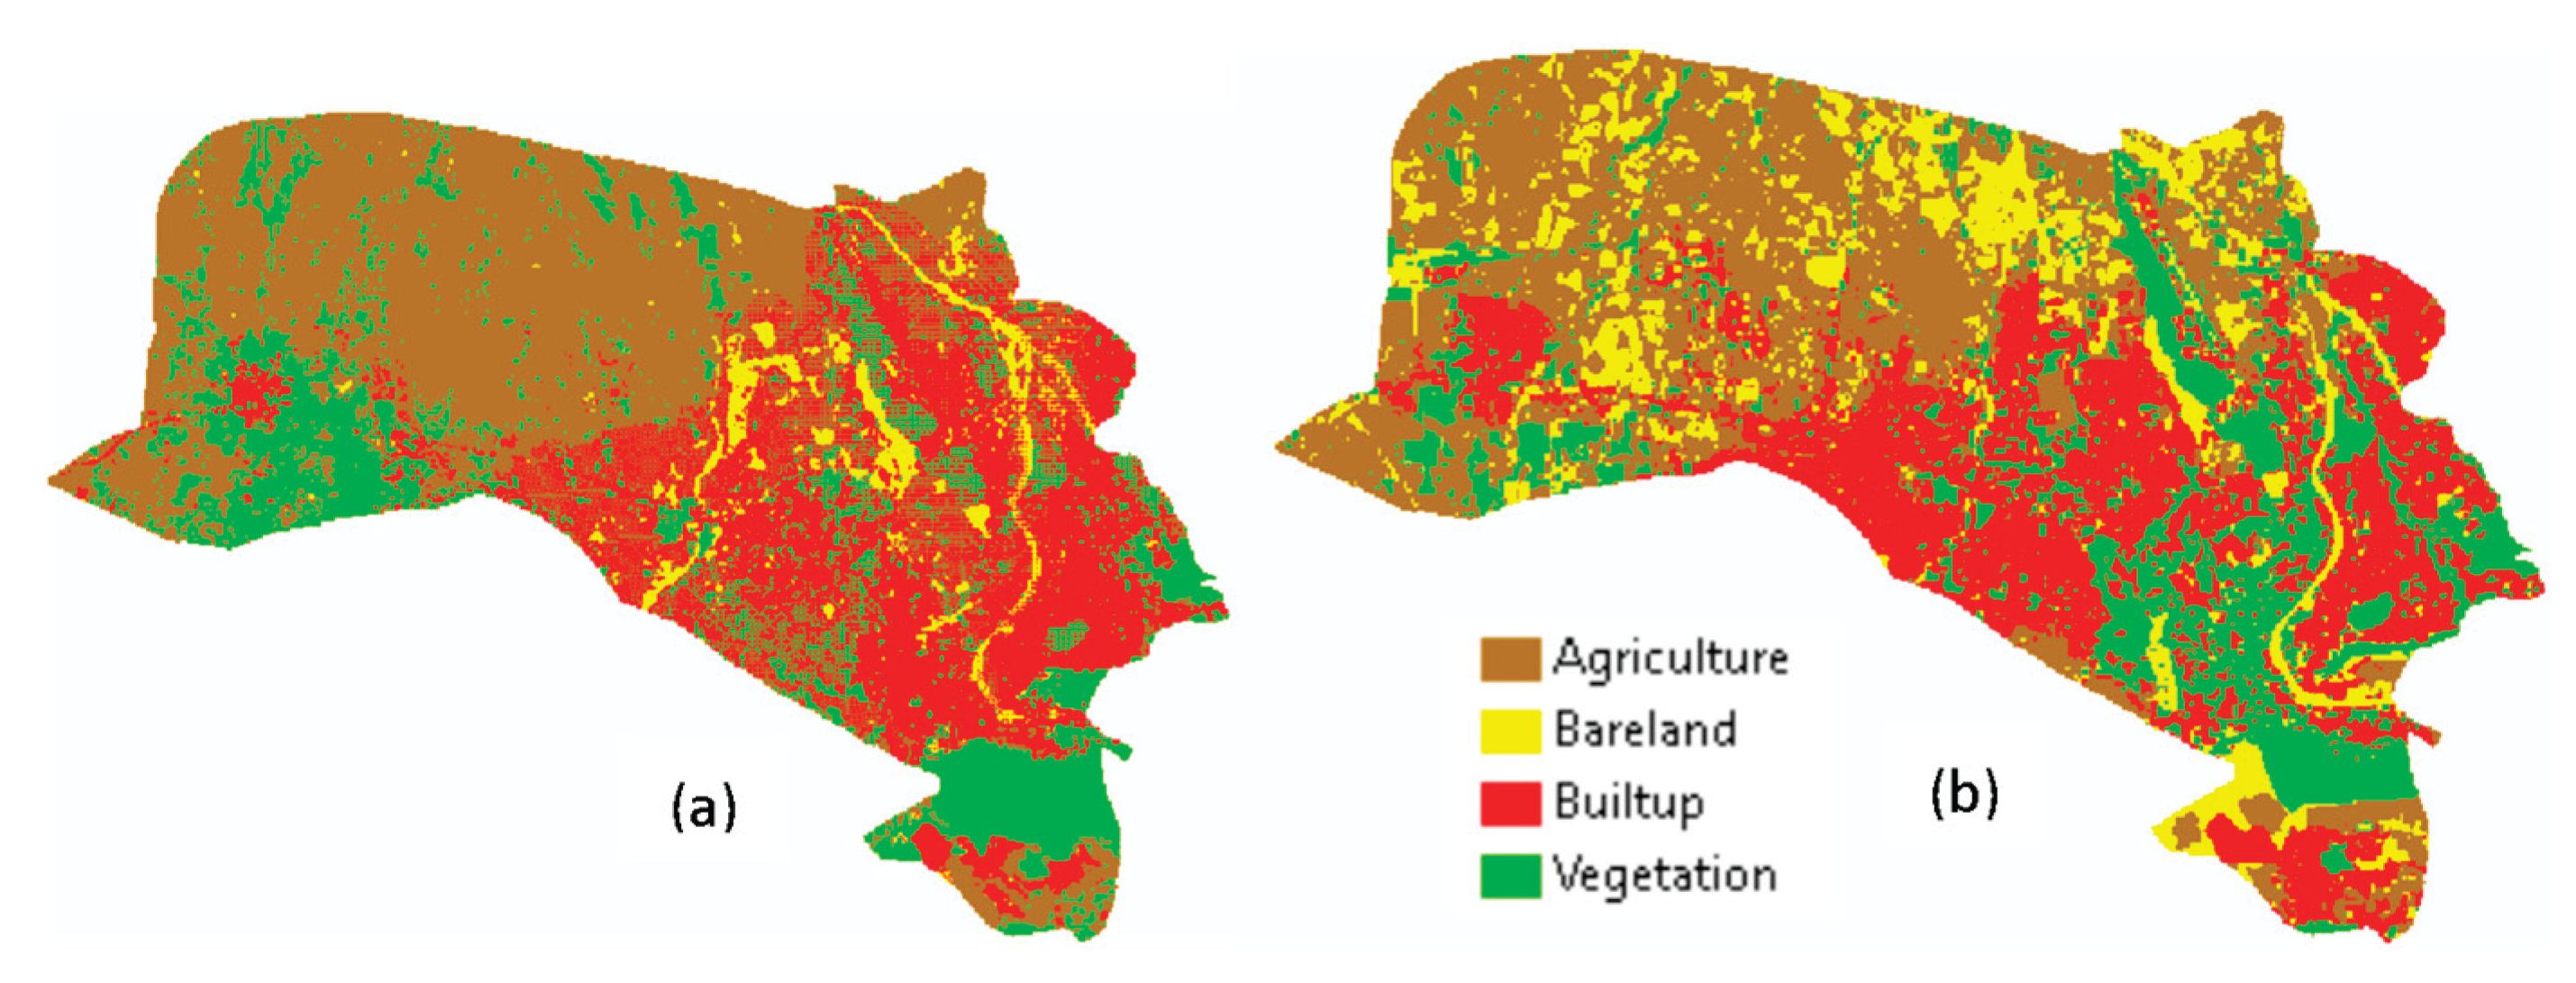
Figure 12.
Predicted Buit-up area for the years (a) 2023, (b) 2043 and (c) 2063.
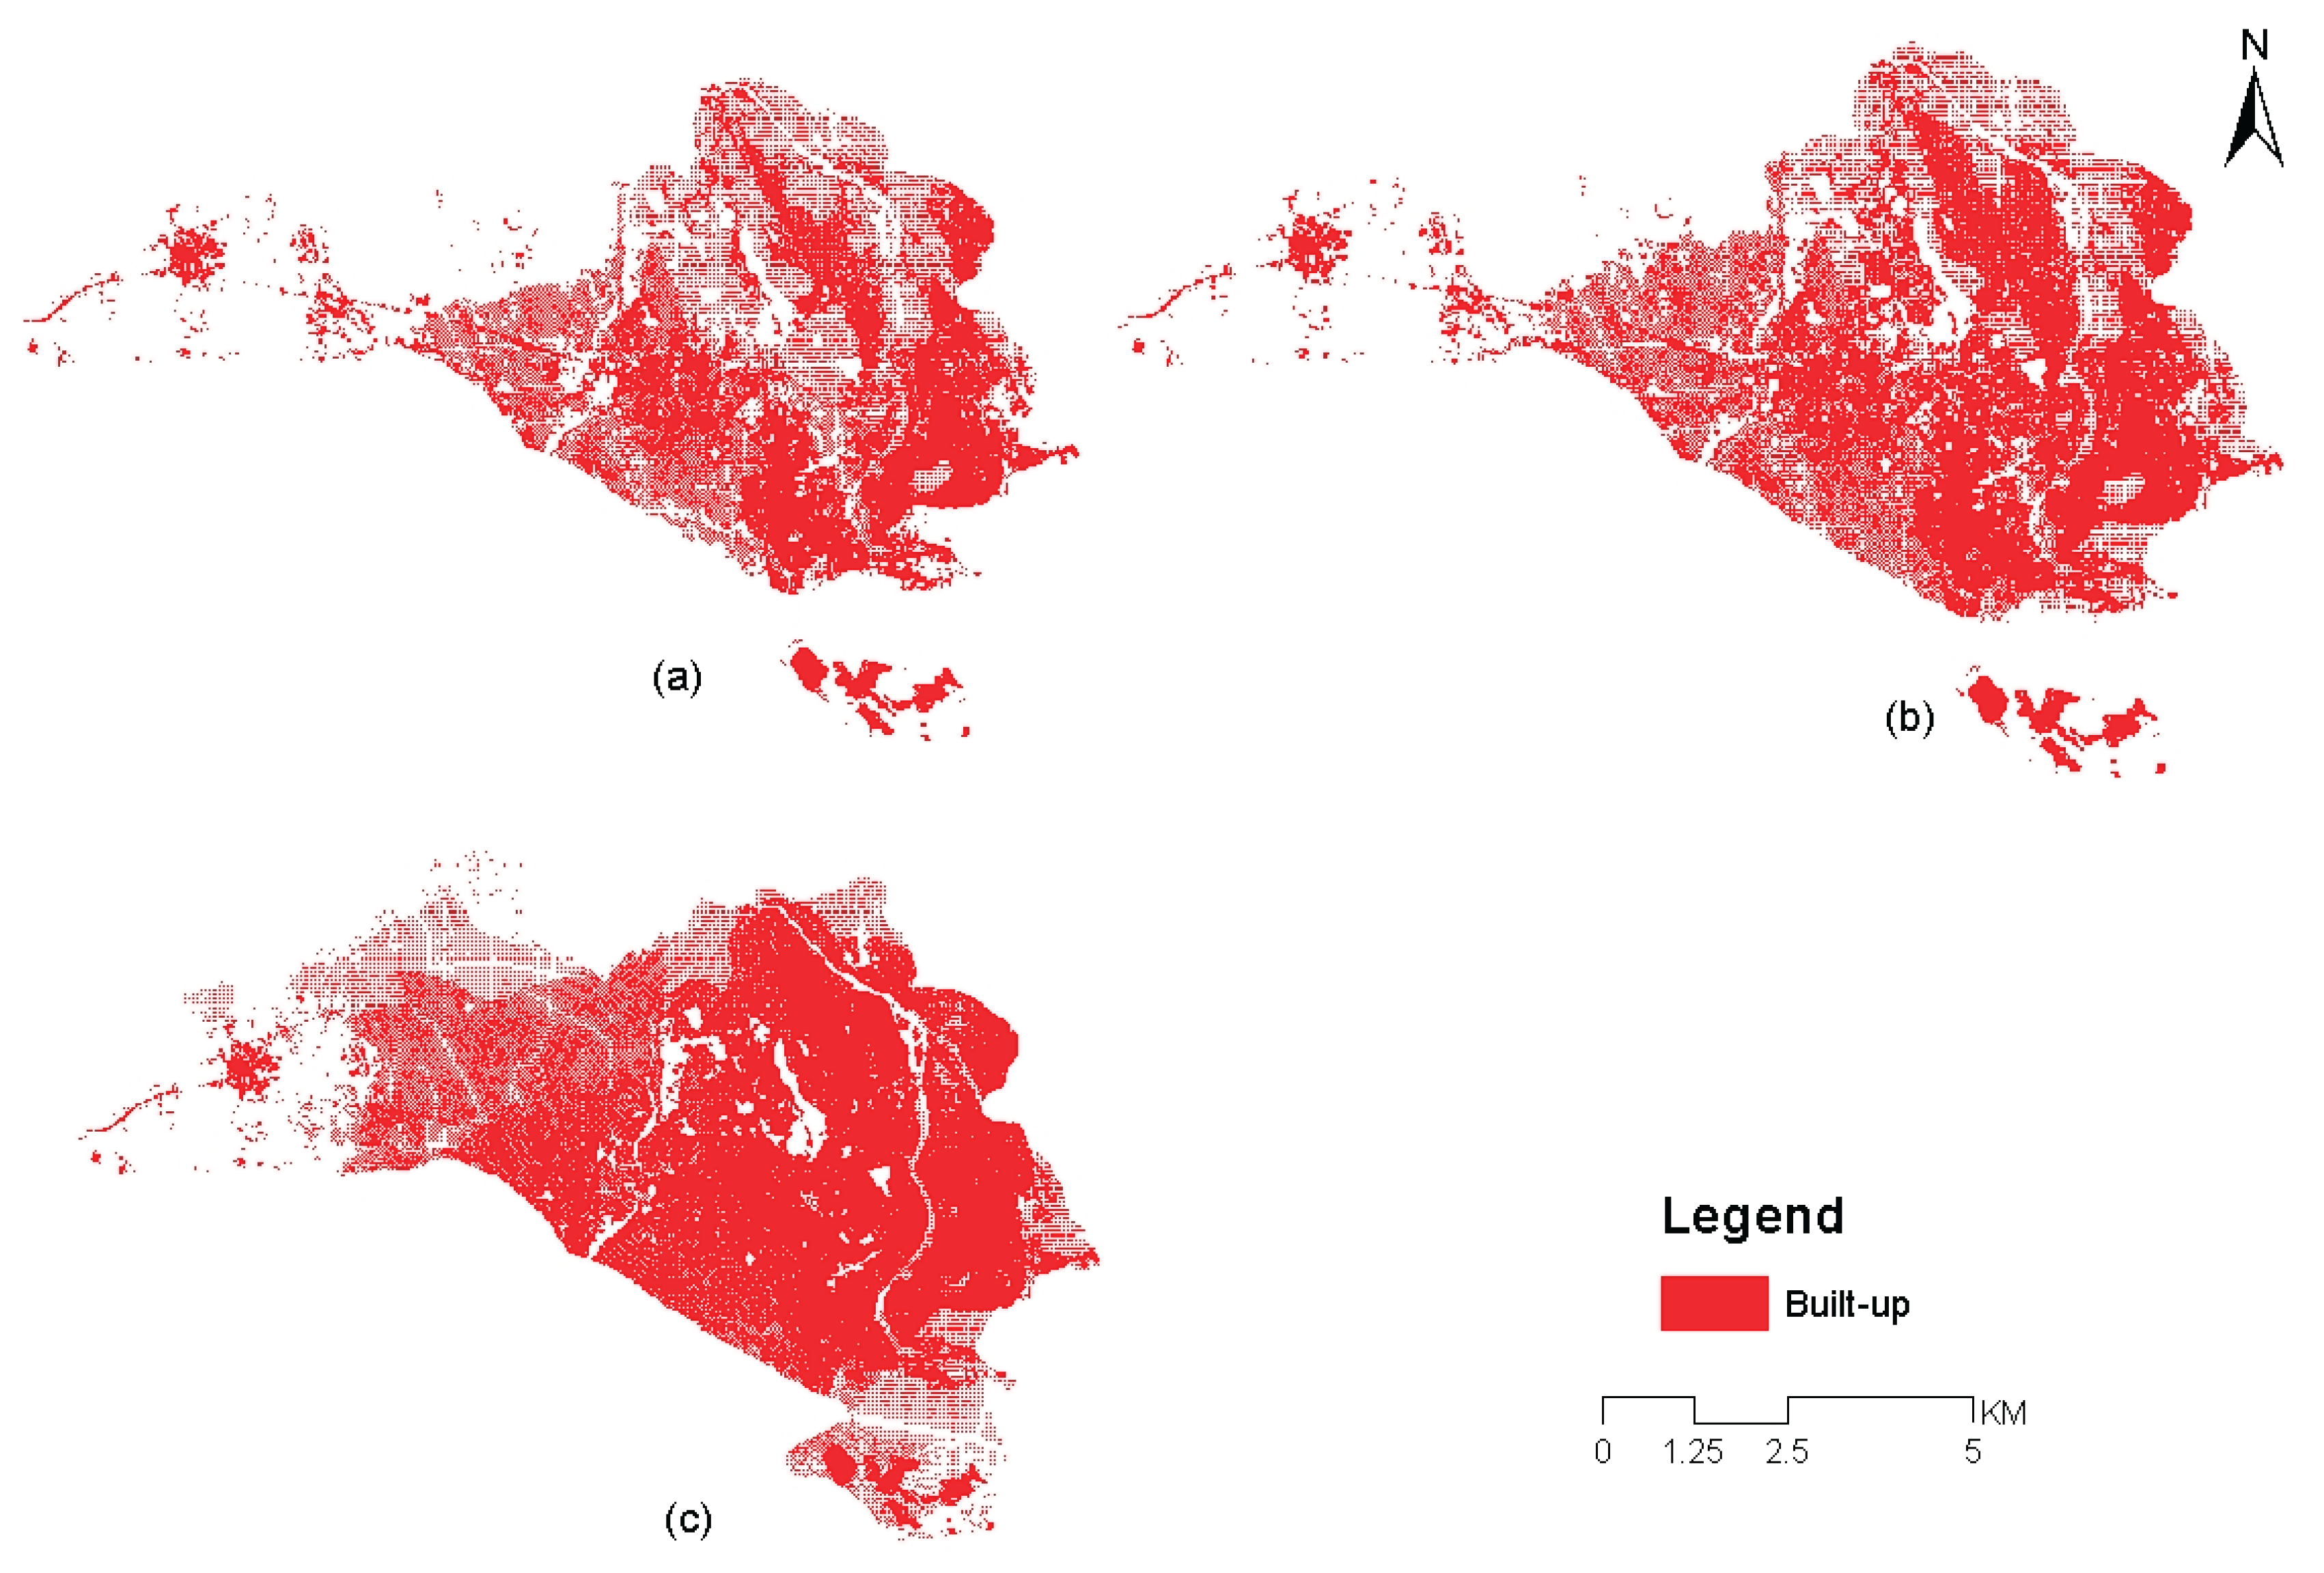
Figure 13.
Predicted LULC of Dire Dawa City for the years (a) 2023, (b) 2043 and (c) 2063.
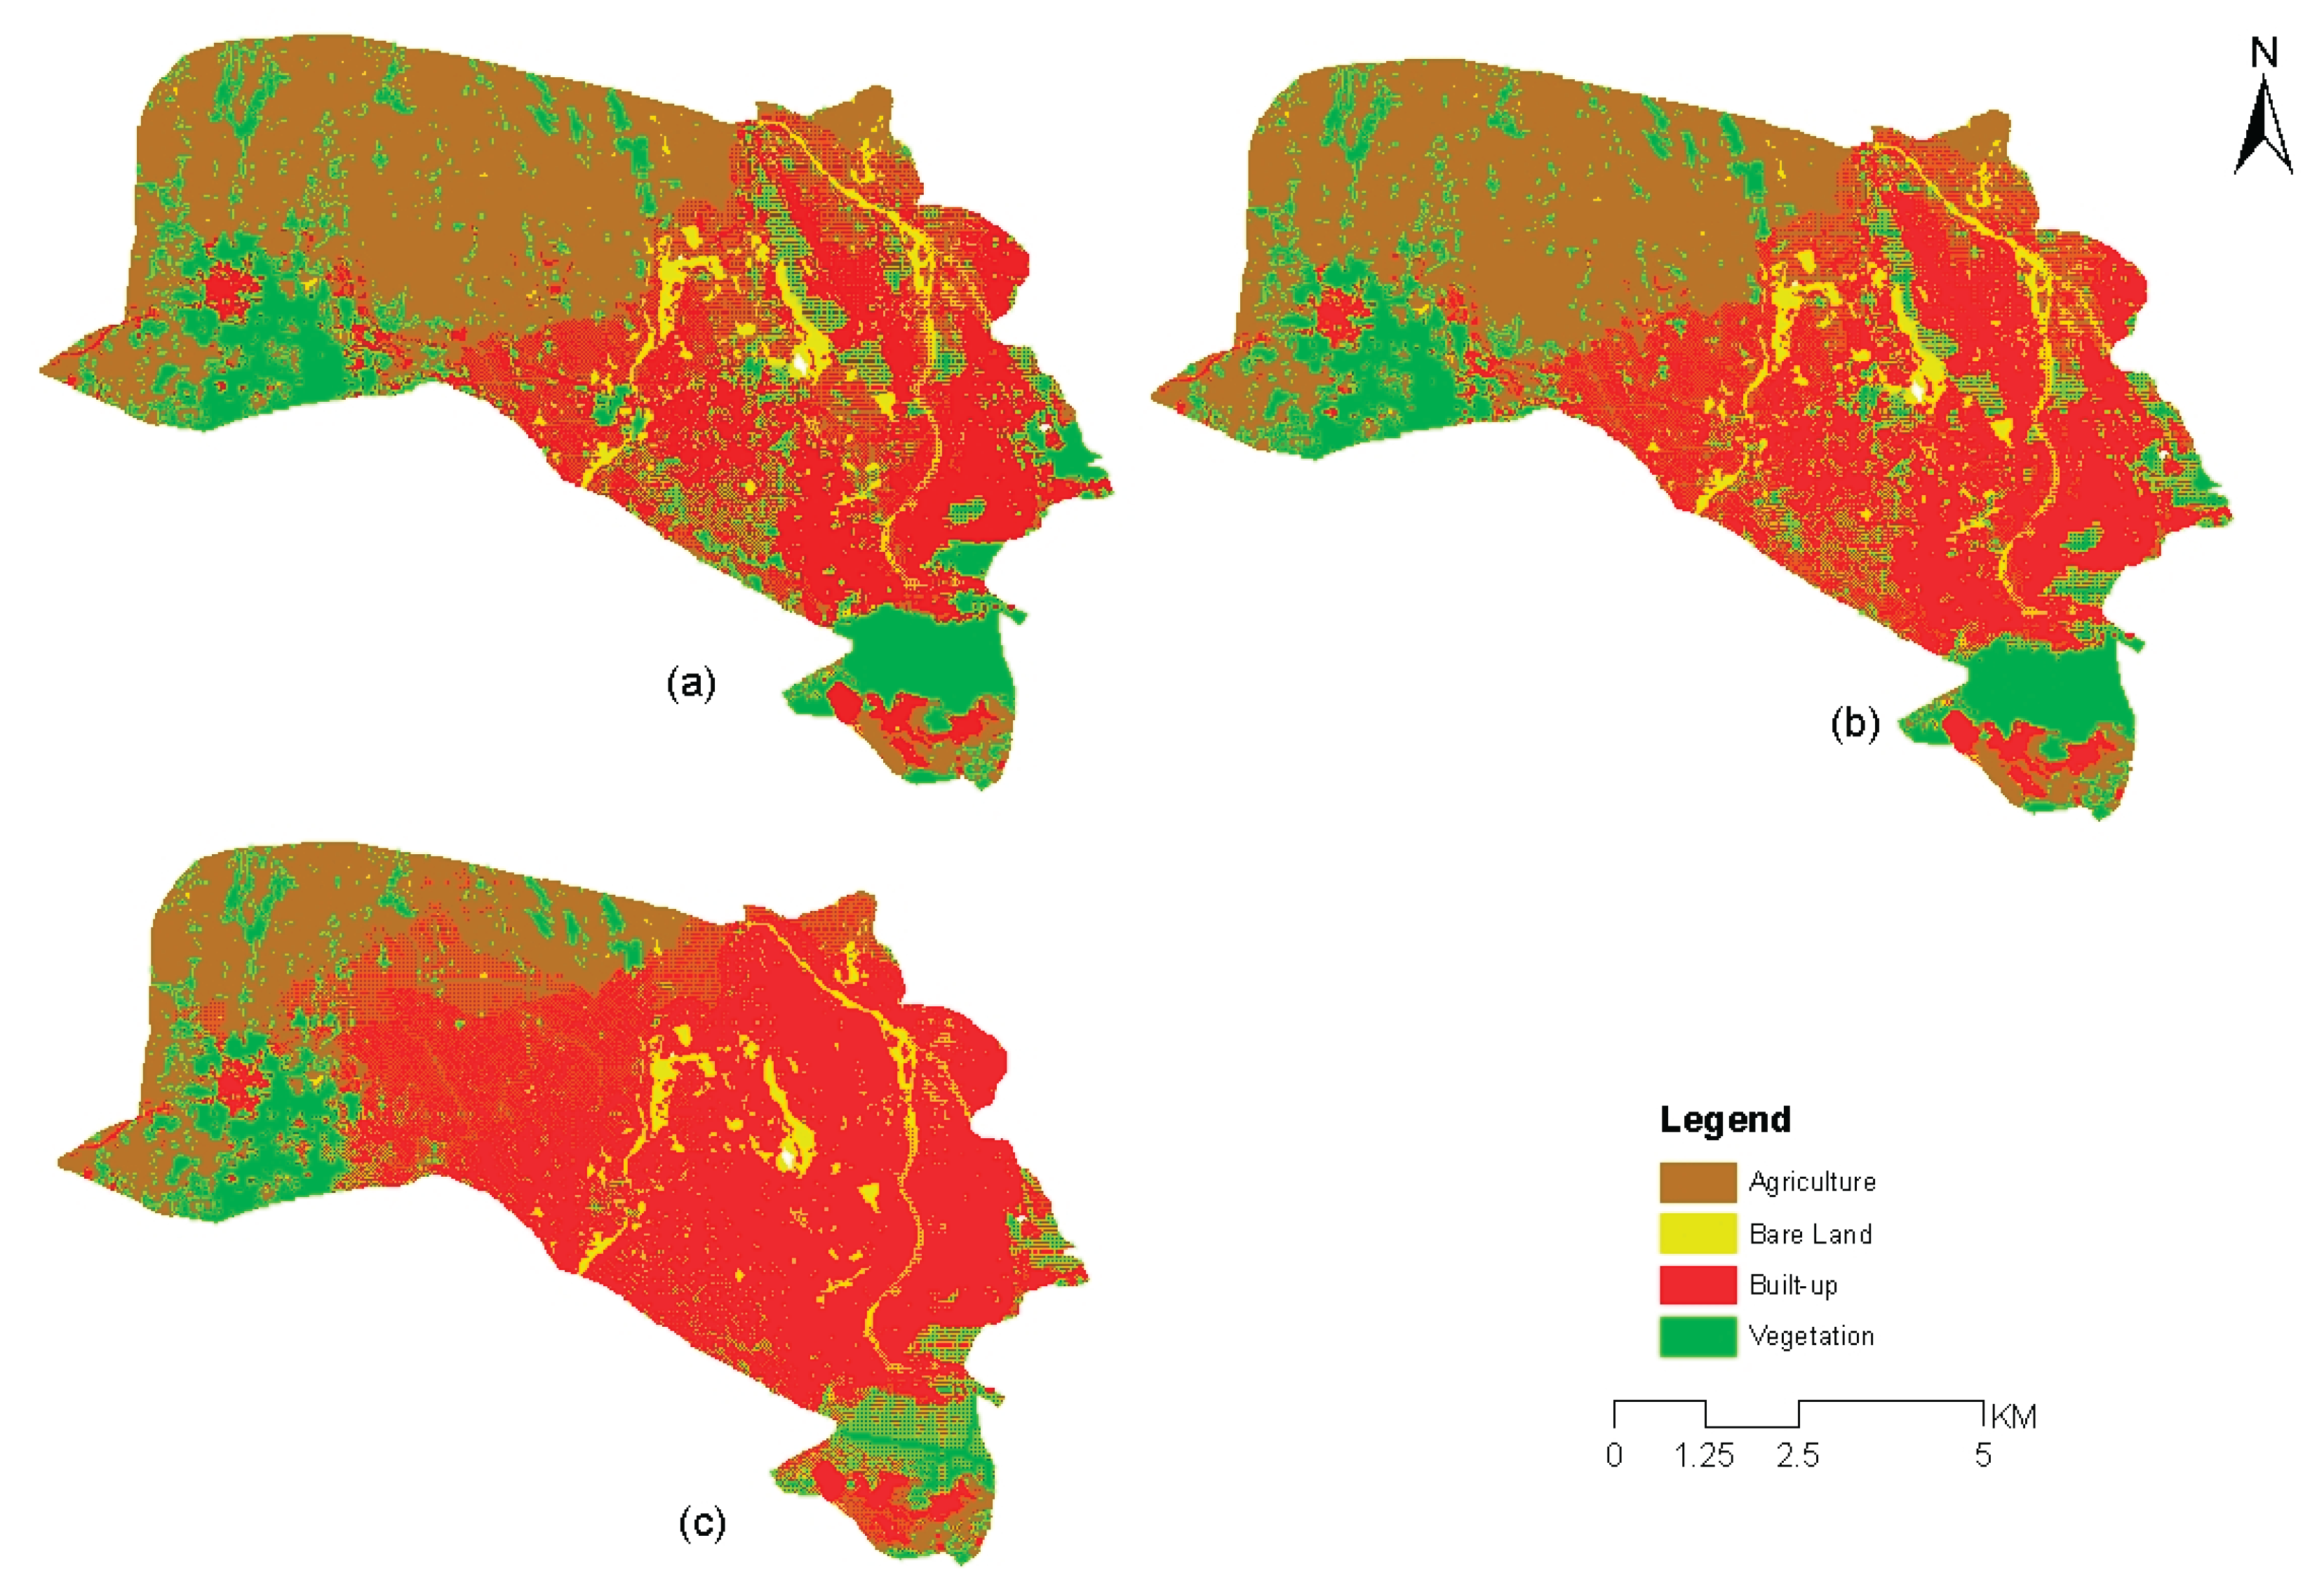
Table 1.
Data types and sources use in this study.
| Dataset | Source | Purpose |
|---|---|---|
| Landsat 5 (TM), 1993 | USGS Earth Explorer | Preparation of LULC maps for the study area for 1993, 2003, 2013 and 2023 |
| Landsat 7 (ETM+), 2003 | USGS Earth Explorer | |
| Landsat 8 OLI, (2013) | USGS Earth Explorer | |
| Landsat 9 OLI, (2023) | USGS Earth Explorer | |
| Aerial photograph (1993,2003,2013) and Google Earth | Ethiopian Geospatial Information Institute (EGII) | For validation of classified LULC |
| ASTER (DEM) | Earthdata | Preparation of Elevation and Slope maps |
| Road | OpenStreetMap | Preparation of Road maps |
| Railway | OpenStreetMap | Preparation of Railway maps |
| Point Location of (Public Institution, industries, Factories and Airport) | Google Earth & Field Survey | Preparation of Euclidean distance maps |
Table 2.
Description of Land Use/Land Cover Categories Used in the Study.
| LULC Class | Description |
| Agriculture | Areas dedicated to agricultural production include cultivated fields, grazing lands, fruit orchards, and livestock confinement facilities. This includes both actively farmed land and fallow fields |
| Bare land | Areas with minimal vegetation primarily contain exposed earth materials such as stone, gravel, sand, silt, and clay. Examples include sandy areas, barely exposed rocks, and quarries and dry-up rivers |
| Built-up | Areas of high-density usage where structures dominate the landscape include urban centers, rural settlements, roadside developments, infrastructure for transportation and utilities, industrial and commercial zones, and institutional facilities |
| Vegetation | Areas characterized by natural or partially natural vegetation, such as urban forests, areas dominated by shrubs, and grasslands |
Table 4.
Accuracy assessment of the LULC maps generated for Dire Dawa City from 1993 – 2023.
| LULC Class | Accuracy (%) | |||||||
| 1993 | 2003 | 2013 | 2023 | |||||
| Producer’s | User’s | Producer’s | User’s | Producer’s | User’s | Producer’s | User’s | |
| Agriculture | 92.96% | 90.41% | 96.05% | 93.59% | 94.94% | 92.59% | 89.06% | 90.48% |
| Bare land | 92.86% | 81.25% | 70.00% | 87.50% | 83.33% | 83.33% | 92.31% | 85.71% |
| Built-up | 78.57% | 91.67% | 84.21% | 88.89% | 80.77% | 84.00% | 83.33% | 92.59% |
| Vegetation | 75.00% | 93.75% | 84.62% | 81.48% | 78.95% | 83.33% | 84.21% | 72.73% |
| Overall Accuracy | 88.72% | 90.08% | 89.23% | 87.30% | ||||
| Kappa Coefficient | 0.8206 | 0.8315 | 0.8079 | 0.8068 | ||||
Table 5.
Transition probability matrix for 1993–2003.
| Given | Probability of Change | |||
| Agriculture | Bare land | Built-up | Vegetation | |
| Agriculture | 0.3785 | 0.0238 | 0.4553 | 0.1424 |
| Bare land | 0.4262 | 0.0556 | 0.2606 | 0.2576 |
| Built-up | 0.0095 | 0.0290 | 0.9539 | 0.0076 |
| Vegetation | 0.2658 | 0.0366 | 0.2000 | 0.4976 |
Disclaimer/Publisher’s Note: The statements, opinions and data contained in all publications are solely those of the individual author(s) and contributor(s) and not of MDPI and/or the editor(s). MDPI and/or the editor(s) disclaim responsibility for any injury to people or property resulting from any ideas, methods, instructions or products referred to in the content. |
© 2025 by the authors. Licensee MDPI, Basel, Switzerland. This article is an open access article distributed under the terms and conditions of the Creative Commons Attribution (CC BY) license (http://creativecommons.org/licenses/by/4.0/).
Copyright: This open access article is published under a Creative Commons CC BY 4.0 license, which permit the free download, distribution, and reuse, provided that the author and preprint are cited in any reuse.


