
Submitted:
31 December 2024
Posted:
31 December 2024
You are already at the latest version
Abstract
Urban sprawl significantly alters the patterns of land use and land cover (LULC) in a city, resulting in various detrimental effects on urban environments. To address these challenges, it is crucial to study the spatiotemporal variability of LULC and urban expansion patterns. The objective of this study is to explore the long-term variation in LULC, urban expansion, and sprawl of Adama City. The study utilized multi-temporal Landsat imagery and Google Earth Engine workspace and employed the Random Forest Algorithm for image classification. The analysis shows significant declines in agricultural and forest areas, coupled with increases in built-up areas and barren land. Between 1995 and 2023, agricultural land decreased from 60.55% to 20.14%, while forest cover dropped from 14.87% to 8.58%. Grassland area increased from 12.89 square kilometers (13%) in 1995 to 19.75 square kilometers (19.7%) in 2023. The urban area was 6.75 km2 (6.99%) in 1995, expanding to 22.41 km2 (22.31%) in 2010, and further to 44.65 km2 (44.05%) in 2023. Over the two transitions, the classified LULC had a net urban expansion of 15.66 and 22.24 km2 with urban expansion intensity index of 1.02 and 1.65 categorized as medium speed and fast speed urban expansion intensity, respectively. The findings indicate that changes in LULC have become increasingly dynamic over the 28-year period from 1995 to 2023 and rapid urban expansion within the city. Integrated land use and urban planning strategies are crucial for addressing current challenges, building environmental resilience, and fostering sustainable urban development.
Keywords:
Adama
; Google Earth Engine
; Remote sensing
; LULC
; Urbanization
Introduction
The urban environment is undergoing a significant and increasingly negative transformation driven by a complex interplay of socioeconomic activities and natural events. The land use patterns of an area are influenced by multiple factors, each playing a role in the overall distribution of land. Numerous studies have demonstrated that changes in land use and land cover (LULC) have several impacts on the environment. Human activities and rapid population growth have led to temporal land pattern changes (Degefu et al., 2022; García, 2022; Halder et al., 2022). Alterations in LULC are among the most visible transformations of natural landscapes, significantly influenced by human activities, especially within rapidly developing countries (Past et al., 2022). LULC change refers to any modification of existing land cover or a partial or complete transformation to a different land cover type (Hussein, 2023). LULC is a complex and dynamic process that can be caused by many interacting processes that range from various natural factors to socioeconomic dynamics (Yesuph & Dagnew, 2019). The effects of LULC change can be significant and wide-ranging, such as land degradation (Alemu, 2015; Negese, 2021), hydrological process (Retureta et al., 2020), livelihood (Fikadu & Olika, 2023), food security (Agidew & Singh, 2017; Okeleye et al., 2023), disaster risk reduction (Su et al., 2021), carbon stock (Aitali et al., 2022; Solomon et al., 2018), and land surface temperature (Ahmed et al., 2013; Ashwini & Sil, 2022).
The extent of global land use change between 1960 and 2019 was substantial, affecting roughly one-third (32%) of the Earth's land surface. This represents a rate considerably greater approximately four times higher than previously estimated by long-term studies of land cover transformation (Winkler et al., 2021). Ethiopia has experienced extensive LULC transformation in recent decades, primarily driven by population growth, agricultural expansion, urbanization, and overgrazing (Daba & You, 2022). Urbanization is a primary driver of LULC transformation in urban areas. (Moisa et al., 2022). Urbanization is defined as the process of population concentration in a small area permanently, forming urban centers (Kabiso et al., 2022). Global urbanization, driven by economic development and industrialization, and characterized by associated social and political shifts, is accelerating at an unprecedented rate (Woldesemayat & Genovese, 2021). The swift expansion of cities has led to substantial negative consequences for the environment and its natural resources (Kanga et al., 2022). This swift expansion at the city's edges is marked by a disorganized and uncontrolled pattern of development, featuring a fragmented and haphazard mix of land uses. This type of uncontrolled growth, commonly referred to as urban sprawl, often lacks coordinated planning and results in inefficient land use, increased infrastructure costs, and environmental degradation (Mithun et al. 2021). In the rapid urbanization process, given the large-scale change and expansion of the pattern of urban land use/land cover change (LUCC), the urban thermal environment has changed significantly (Shu et al., 2022). One of the important parameters in urban climate is the Land Surface Temperature (LST), which directly controls the effect of Urban Heat stress (Mwangi et al., 2018). Urbanization further leads to the creation of UHIs, impacting the energy balance and microclimate of cities (Choudhury et al., 2023).
Changes in urban LULC change can greatly affect the climate of cities, especially in the context of climate change (Ahmed et al., 2020). As urban areas grow and natural environments are substituted with non-porous surfaces such as roads and structures, the capacity for water absorption and natural cooling processes diminishes. These results in changed rainfall patterns, heightened surface runoff, and elevated risks of flooding (McGrane, 2016). Additionally, the loss of green spaces and natural habitats diminishes the city's ability to regulate temperature and manage storm water, making urban areas more vulnerable to extreme weather events such as heavy rainfall, droughts, and temperature fluctuations, which are intensified by climate change. Therefore, assessing the spatiotemporal dynamics of urban LULC is fundamental for sustainable urban development. It provides insights into how cities evolve over time, the challenges they face, and the opportunities for improving quality of life, environmental sustainability, and resilience (Rayhan, 2024). Consistent monitoring and analysis enable cities to effectively manage their growth, fostering healthier, livable, and sustainable urban environments. Therefore, detecting urban LULC patterns, and quantifying urban expansion intensity and sprawl are vital steps in improving sustainable urban development.
Assessing the land cover dynamics, urbanization and its environmental sustainability consequences of urbanization necessitates a thorough spatiotemporal analysis of LULC change and urban growth patterns (Terfa et al., 2019). Recently, Google Earth Engine has attracted interest as a robust cloud-oriented platform for performing geospatial analysis on a global scale. It utilizes Google's vast computational capabilities to allow users to efficiently visualize and examine satellite images. Combining the features of Google Earth Engine with information from remote sensing satellite images greatly enhances the accuracy and effectiveness of mapping and modeling changes in LULC (Chen et al., 2023). This powerful combination allows for a more detailed and comprehensive analysis of Earth's surface transformations over time, providing valuable insights that would be difficult to obtain using traditional methods. Nowadays, several countries are emphasizing utilizing Landsat Thematic Mapper (TM) or Operational Land Imager (OLI) to track and forecast the rapidly occurring urbanization of cities (Sun et al., 2020). Analyzing urban LULC dynamics not only reveals the historical growth and transformation of urban areas but also offers crucial insights for effective future urban planning and management.
Adama City, located in the Oromia regional state of Ethiopia, is recognized as one of the fastest-growing cities in the country (Bulti & Assefa, 2019). The city experiences continuous expansion over time. Carrying out a current and geographically precise analysis of the LULC changes, along with the urban growth of Adama City, is vital for multiple reasons, especially in relation to environmental sustainability. This study analyzes the LULC changes over a period of 28 years, from 1995 to 2023. It illustrates and measures the intensity of urban expansion while also identifying the key implications of the findings. The study employs remote sensing data along with the Google Earth Engine to analyze the LULC dynamics and urban expansion patterns within the city. Through this effort, the study aims to enhance the understanding of urban expansion patterns and land use and land cover (LULC) dynamics in Adama City. The results are anticipated to play a significant role in informing better urban planning practices and promoting sustainable urban development.
Materials and Methods
Study Area
Adama is situated within the Rift Valley, characterized by a flat expanse of land bordered by mountainous and ridged terrain (Gebreselassie & Rao, 2021). Adama's precise geographic coordinates range from 8°26′ North to 8°37′ North latitude and from 39°12′ East to 39°21′ East longitude (Figure 1). Adama city is the second most populous city in Ethiopia (Leta et al., 2024) and functions as an important metropolitan hub in the country. The computed population growth rate of the City from 2004 to 2016 was nearly 9% (Bulti & Assefa, 2019). The area encompasses approximately 100 square kilometers. The elevation of the city runs between 1470 and 1799 m. This city exhibits a distinct topographical pattern: higher elevations dominate the north and south, while the center and east are low and flat. The city receives an average annual rainfall of 722 mm, ranging from 671 mm to a maximum of 973 mm. Adama City is defined by dry and semi-dry conditions. The highest temperatures are recorded in May, while the lowest is seen in December. The city functions as the capital of the Oromia regional state in Ethiopia. This administrative designation is generally regarded as the primary factor behind the city's swift urbanization (Bulti & Abebe, 2020).
Data Used
Satellite imagery provides a highly effective method for obtaining detailed information regarding the Earth's surface, capturing the intricate and diverse range of its geospatial patterns (Regassa et al., 2020). This study primarily utilized multi-temporal Landsat satellite imagery, acquired from the USGS, spanning three distinct years: 1995, 2010, and 2023. These data provided the foundation for the analysis (Table 1). Google Earth Engine was used for conducting image-processing analysis. Google Earth Engine is a cloud-based platform for planetary-scale geospatial analysis. It provides a massive catalog of satellite imagery and geospatial datasets, along with powerful tools for analysis and visualization.
In the present study, LULC, urban expansion, and sprawl were analyzed and quantified using Google Earth Engine in Adama City over 28 years from 1995 to 2023. The methodology of this study is summarized in the accompanying figure, which also serves as a guide to understanding the overall research process (Figure 2).
Land Use Land Cover Change Assessment
LULC Derivation
Google Earth Engine was utilized to generate the LULC maps of Adama City for the years 1995, 2010, and 2023. The cloud-based computing platform Google Earth Engine can help address extensive land cover mapping challenges (Phan et al., 2020). The emergence of these proprietary web-based platforms is drastically reducing the computation times and expanding the potential for analyzing big geospatial data (Calderón et al., 2021; Loukika et al., 2021). Users can examine all accessible remotely sensed photos without having to download the files to their local computers. The Landsat images in this study were classified using a random forest classifier algorithm, whose notable accuracy has been reported in several works of literature (Rodriguez et al., 2012; Tikuye et al., 2023). All of the study's analyses were carried out in the identical season. The images were classified using the "classifier.smileRandomForest" method that in Google Earth Engine. The maps were used to identify the LULC class areas and LULC analysis and change rates were calculated. The analysis of the LULC change was computed based on Eq. (1) (Dibaba, 2023):
Where Af is the final produced LULC area (i.e., LULC at 2023) in km2, and Ap is the previous area of LULC (i.e., LULC at earlier time t) in km2.
The land cover classes in the present study were categorized into five classes described in Table 2.
Accuracy Assessment
The precision of the classified maps was validated via an accuracy assessment. The confusion matrix technique is presently the most commonly utilized method for evaluating the classification quality of remote-sensing images (Congalton & Green, 2008). By applying an irregular stratified selection method, confusion matrices were produced by comparing the classification results of these reference locations at different periods with the results of corresponding field studies and high-resolution remote sensing data. For supervised classification and the validation of classification products, this procedure needs accurate and thorough ground-truth data. For every year, several samples were used to link reference locations with categorized imaging cells. The accuracy of land use classification in this study was evaluated using the Kappa coefficient alongside overall accuracy. Nonparametric tests such as Overall Accuracy (OA) and Kappa Coefficient (KC) can demonstrate the consistency between the labeled and anticipated outcomes (Liu et al., 2020), and are calculated using Eq. (2) and Eq. (3), respectively (Sun et al., 2020):
Where n is the number of columns in the confusion matrix, Kii is the number of pixels in the matrix at the intersection of the ith row and the ith column, Ki+ and K+j are the total numbers of pixels in the ith row, and the ith column, respectively, and T is the total number of pixels used for the accuracy evaluation. Where K is the kappa coefficient and POA is the overall accuracy.
Quantifying the Urban Expansion Pattern
An important aspect of LULC change is extensive urban sprawl and it is an increasing concern in urban research recent studies have focused on methodically examining the governance and measurement of urban development. The rate and intensity of urban expansion can be measured and analyzed using a variety of techniques. The rate, intensity, and patterns of urban expansion in Adama City were measured in the current study using the Urban Expansion Intensity Index (UEII), a major supplementary growth indicator. The UEII quantifies the average yearly growth of urban built-up areas relative to the total area changing (Akubia & Bruns, 2019). UEII can also be used to assess the pace or intensity of changes in urban land use over a specific period and identify the inclinations toward urban expansion (Norouzi, 2023). Eq. (4) is for calculating the UII which is shown below (Fan et al., 2017).
Where Uib represents the urban area at the endpoint, Uia represents the urban region's early period, TLA represents the urban region inside the study region, and T is the study period, specified in years. The UEII is categorized as follows: >1.92 indicates high-speed expansion; 1.92–1.05, fast; 1.05–0.59, medium; 0.59–0.28, low; 0.28–0, slow; and below 0, decreasing intensity. (Alam et al., 2023).
Result and Discussion
Training Data
The training data for image classification are samples of individual classes, which is essential for correctly classifying land areas according to their cover and usage. The quality and quantity of training data do play a major role in the classification accuracy of LULC. The number of input variables, as well as the size and geographic diversity of the mapped area, can all affect how much training data is needed. The numbers of training samples are shown in Table 3.
LULC Classification Accuracy Assessment
LULC classification was conducted using a Random Forest algorithm within the Google Earth Engine platform, and the accuracy of the resulting classification was subsequently assessed. The accuracy assessment of LULC classification is a fundamental step in ensuring the reliability and applicability of the study's findings. Since cloud-free imagery is essential for accurate and precise analysis, the current study uses an algorithm included in Google Earth Engine to extract cloud-free images in the specified period. The study used stratified random sampling to acquire reference locations using Google Earth historical data to the anticipated LULC. The resulting confusion matrices indicate that the LULC classification accuracy in 1995, 2010, and 2023 was excellent and sufficient for further study. Table 4 has a great deal more accuracy indices.
LULC Change Analysis
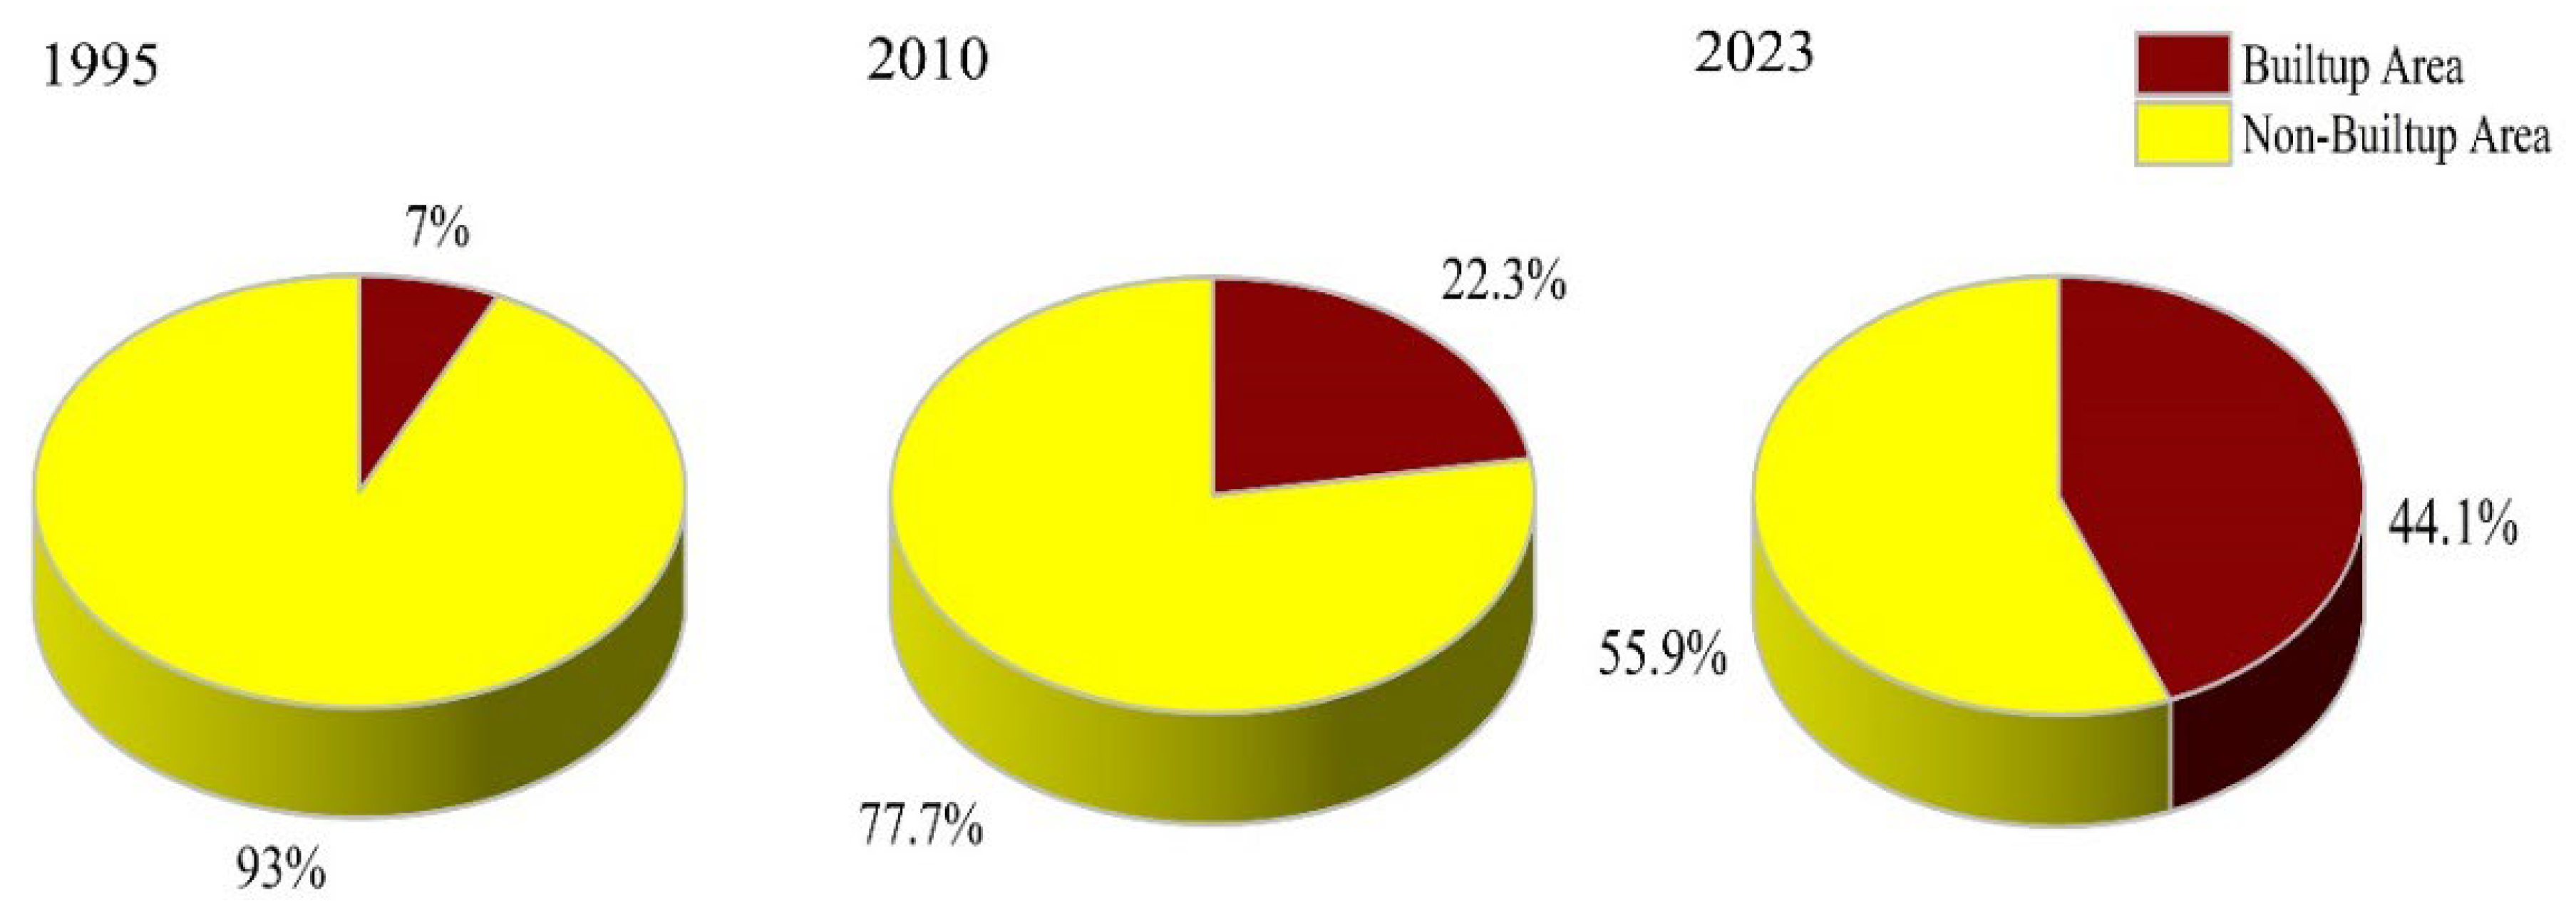
According to Landsat images categorized in 1995, 2010, and 2023, the city of Adama has undergone a significant change in LULC. Analysis of the data clearly indicates that the changes in green space (plants and urban forests) were significant between 1995 and 2023. Between 1995 and 2010, two trends can be identified: (a) the area of buildings increased over the period, and (b) the area of forest gradually declined. In 1995, the built-up area of the city was 6.997% of the total area of Adama. In 2010, the area increased to 22.41 km2, or 22.31 percent of the total area. The total area was 44.65 km2 in 2023, accounting for 44.05393% of the whole of Adama City. The percentages of the entire land showed that the barren areas accounted for the highest proportions, accounting for 7.51 percent in 2023, 6.07 percent in 2010, and 4.51 percent in 1995. During the study period, the total forest area also declined. In 1995, this category accounted for 14.93 percent of the total area, falling from 10.05 percent in 2010 to 9.8789 percent in 2010 to 8.58 percent in 2023. The remaining classes also experienced varying transitions. Barren land within the city has gradually increased over time. It increased from 12.89 square kilometers (13%) in 1995 to 19.75 square kilometers (19.7%) in 2023. Table 5 presents areal extent and percentage of each class.
The built-up area has seen remarkable expansion over the past decades, with its proportion increasing from 6.99% (6.7568 km²) in 1995 to 44.05% (44.6558 km²) by 2023 Figure 6. The data reveals an exceptionally rapid rate of urban expansion in Adama City, occurring in two distinct phases. The first phase, between 1995 and 2010, witnessed a staggering 218.85% growth in the built-up area. The second phase, from 2010 to 2023, while still exhibiting significant growth at 97.44%, shows a slightly slower pace compared to the previous period. This could indicate that either the initial drivers of expansion have lessened in intensity, or that mitigating strategies or natural constraints have begun to exert some influence. However, even the slower rate of growth in the second phase represents a substantial expansion of the built-up area. These trends highlight a sharp acceleration in urbanization, reflecting the city's expanding infrastructure and urban development, which likely has significant implications for land use, environmental sustainability, and climate resilience. Figure 3 shows the LULC map of Adama City for the three times considered in the study, Figure 4 represents the percentage distribution graph and Figure 5 shows respective LULC change gain/loss over periods.
For a better understanding of the LULC transitions from year to year and to identify the gains, losses, and net changes, the LULC matrices were built for the transitions between 1995 and 2010 and 1995 and 2023. This matrix makes it possible to calculate how much each type of LULC class. LULC has changed during the preceding 28 years. According to the survey, cropland was the most affected class, while forestland came second. In 2023, only 20.19 km2 of the entire 100.27 km2 of cropland remained in use for agriculture. Study findings reveal substantial temporal shifts in agricultural land use. Furthermore, in 2010 there was only 31.25843 km2 of cropland left out of 62 km2 of total cropland in 1995.
Figure 6.
Percentage occupation of built-up area and non-built-up area.
The first transitions primarily detect transformations from cropland to grassland and from built-up areas. In the second transition, the most transformed areas are from crop to urban and from grass to urban. This finding underscores the substantial transformation and reduction in the area of agricultural land over the specified period. The detailed numerical transformation is shown in Table 6 and Figure 7. In Table 6, the class remains unchanged throughout the transition and is marked by the numbers written in bold. The chord diagram shows the transitions between different LULC categories, illustrating how one category transforms into another over the specified period.
The concept of azimuth and its relevance to directional expansion provides valuable insights into the spatial expansion of the city. In terms of azimuthal expansion, there is a rapid and intense expansion in the North North West (NNW) and North North East (NNE) directions of the city starting from the city’s gravity Centre. The azimuthal expansion in the North North West (NNW) and North North East (NNE) directions from the city's gravity center indicates a rapid and intense expansion in these specific directions, leading to uneven spatial expansion of the city. Rapid urban expansion in recent decades has consumed nearly all-available land suitable for construction, leaving little space for future urban development. As demonstrated in Figure 8. the spatial expansion of the city is uneven.
Drivers of Rapid Urbanization
The following discussion outlines the potential drivers behind Adama City's significant LULC change and rapid urban expansion. These drivers were identified through an analysis of the city's current and recent characteristics.
- Seat of Regional Administration: Adama's status as the capital of the Oromia region in Ethiopia has led to the establishment of numerous government offices, a variety of businesses, and a large skilled labor force. These factors have all played a direct role in the city's swift expansion and the subsequent pressure on LULC change.
- Economic Growth and Investment: The city's strategically advantageous location and ongoing industrial development initiatives have fueled substantial economic growth, leading to a considerable increase in job opportunities and, consequently, a large influx of people seeking employment and improved living conditions, thus driving both urban expansion and changes in land use.
- Transportation Hub: Adama serves as a crucial transportation hub, linking Addis Ababa to the eastern and southern parts of the country. This strategic position has significantly enhanced regional accessibility, leading to a rise in trade, commerce, and tourism, all of which play a vital role in the city's overall development and the resulting changes in land use.
- Infrastructure Improvements: Substantial government investments in crucial infrastructure projects, including significant improvements to road networks, electricity grids, and water supply systems, have noticeably enhanced Adama's appeal to both residents and businesses, thereby encouraging further development and population growth, placing increasing pressure on land resources and resulting in substantial LULC changes.
- Population Growth: The swift population growth in Adama is attributed to both natural increase and substantial migration from rural regions, as people seek enhanced economic opportunities and improved living conditions in the urban setting. This influx is a major factor driving the observed changes in land use and urbanization in the city.
Result Comparison
Comparing the results of one study with those of others that use similar methodologies is crucial for validating findings. This research on land-use change in Adama City reveals a pattern consistent with broader trends observed across major Ethiopian urban centers. Our findings of significant urban expansion and land conversion strongly corroborate the results of numerous previous studies. Research in Addis Ababa (Moisa & Gemeda, 2021) documented extensive urban growth, mirroring our observations. Similarly, investigations in Mekelle (Fenta et al., 2017), using multi-temporal Landsat imagery, highlighted substantial land conversion and urban sprawl. This pattern is further reinforced by studies in Dire Dawa (Taffa et al., 2017), Hawassa (Tessema & Abebe, 2023), Bahir Dar (Kindu et al., 2020) and Dukem (Abebe et al., 2023), all reporting substantial transformations to urban land cover. The striking convergence of these independent studies, employing comparable methodologies, powerfully underscores the pervasive and significant nature of land conversion and urban sprawl affecting Ethiopia's urban landscape. This widespread phenomenon demands urgent attention in urban planning and policy development to ensure sustainable urban growth.
Implications for Sustainable Urban Development
LULC pattern distribution in cities can indicate several things about the environment. It can affect things like how much water is in the ground, the local weather, and how healthy the environment is. Changes in how land is used, like more buildings and fewer green spaces, can affect the groundwater level in the area. Understanding these changes is important for figuring out how much water is going into the ground and how it is affecting the groundwater level. This implication is also described by (Nath et al., 2021). Looking at and predicting how land use is changing can help us understand how the environment is changing in different places and times. This is especially important as cities grow and affect nearby farmland and nature, and as we try to manage natural resources (Haregeweyn et al., 2012). Urbanization alters carbon storage by replacing carbon-rich ecosystems with built environments that store considerably less carbon. This shift, coupled with increased emissions from construction and transportation, significantly influences the local and global carbon cycle. Urban land use changes, such as deforestation and increased impervious surfaces, alter local climate patterns, influencing air quality and increasing pollution. The resulting emissions from construction, transportation, and industrial activities further exacerbate air pollution problems in urban areas. In addition, urban LULC the thermal variation has an implication on public health, which is mainly affected by urbanization, caused heat variation and intensification. Elevated urban temperatures increase the risk of heat-related illnesses, especially for vulnerable groups (elderly, children, individuals with pre-existing conditions), a finding supported by (Tong et al., 2021). To mitigate the negative impacts of urban LULC change, urban planning and design must integrate green infrastructure, sustainable land practices, and heat-resilient design. By considering these effects, cities can create safer, more sustainable environments for current and future residents.
Conclusion and Key Recommendation
This study aims to assess the long-term urbanization-driven LULC change in Adama City, Ethiopia, utilizing Landsat remote sensing data and Google Earth engine workspaces. The study used a Random Forest Algorithm for LULC classification. The study analyzed the spatial and temporal changes in urbanization, LULC in Adama City over the past 28 years, from 1995 to 2023. In the years, the most significant type of transformed land cover has been the built-up area. Agricultural land significantly declined, decreasing from 60.55% to 20.14% of the total area. Similarly, forest cover experienced a substantial reduction, falling from 14.87% to 8.58%. In contrast, the grassland area showed an increase, expanding from 12.89 square kilometers (13% of the total area) in 1995 to 19.75 square kilometers (19.7%) in 2023. Urban areas also expanded considerably, growing from a relatively small 6.75 square kilometers (6.99%) in 1995 to 22.41 square kilometers (22.31%) in 2010 and a substantial 44.65 square kilometers (44.05%) by 2023, demonstrating a clear trend of urbanization. The strongest urban growth intensity happened from 1995 to 2023. The results revealed that the urban area was 96.6 km2 (18.3%) in 1995, expanding to 165.4 km2 (31.4%) in 2010, and further to 277.2 km2 (52.6%) in 2023. Between 1995 and 2010, cropland dominated the land use, but by 2023, built-up areas comprised nearly half the total land area, surpassing cropland as the most prevalent land use type. Over the two transitions, the classified LULC had a net urban expansion of 15.66 km2 and 22.24 km2 with urban expansion intensity index of 1.02 and 1.65. Similarly, surface temperatures have gradually risen in the last 28 years. To promote sustainable urban development in the context of urban land use, land cover dynamics, and urban sprawl management, the following key recommendations can be considered:
- Implement and rigorously enforce comprehensive land-use plans. These plans must integrate environmental protection, incorporating detailed zoning, stringent building codes, and environmentally conscious infrastructure strategies to minimize harm. These plans must move beyond general aspirations and become actionable blueprints, guiding all phases of urban expansion. Sustainable urban development necessitates the implementation and strict enforcement of comprehensive land-use plans that seamlessly integrate environmental protection with urban growth objectives.
- Implement a robust, long-term LULC monitoring system using remote sensing. This system should continuously track changes over time, providing data for regular analyses to evaluate policy effectiveness and pinpoint areas needing further attention.
- Promote green infrastructure, urban forestry, and permeable paving to manage storm water runoff, reduce the environmental and sustainability issues of LULC dynamics, and enhance biodiversity. Educate developers and urban planners on these strategies to minimize environmental impact during urbanization. Incentivize the adoption of these sustainable practices.
Funding
This research received no external funding.
Declaration competing interests
The author declares no competing interests.
Availability of data and materials
The data that support the findings of this study are available from the corresponding author, upon reasonable request.
References
- Abebe, B.G.; Gemeda, B.S.; Sisay, G. Analyzing land use land cover (LULC) dynamics by using remote sensing and GIS techniques: the case of Dukem town, Oromia special zone. Geocarto International 2023, 38. [Google Scholar] [CrossRef]
- Agidew A meta, A.; Singh, K.N. The implications of land use and land cover changes for rural household food insecurity in the Northeastern highlands of Ethiopia: The case of the Teleyayen sub-watershed. Agriculture and Food Security 2017, 6, 1–14. [Google Scholar] [CrossRef]
- Ahmed, B.; Kamruzzaman, M.D.; Zhu, X.; Shahinoor Rahman, M.D.; Choi, K. Simulating land cover changes and their impacts on land surface temperature in Dhaka, Bangladesh. Remote Sensing 2013, 5, 5969–5998. [Google Scholar] [CrossRef]
- Ahmed, H.A.; Singh, S.K.; Kumar, M.; Maina, M.S.; Dzwairo, R.; Lal, D. Impact of urbanization and land cover change on urban climate: Case study of Nigeria. Urban Climate 2020, 32, 100600. [Google Scholar] [CrossRef]
- Aitali, R.; Snoussi, M.; Kolker, A.S.; Oujidi, B.; Mhammdi, N. Effects of Land Use/Land Cover Changes on Carbon Storage in North African Coastal Wetlands. Journal of Marine Science and Engineering 2022, 10. [Google Scholar] [CrossRef]
- Akubia JE, K.; Bruns, A. Unraveling the frontiers of urban growth: Spatio-Temporal dynamics of land-use change and urban expansion in greater Accra metropolitan area, Ghana. Land 2019, 8, 1–23. [Google Scholar] [CrossRef]
- Alam, I.; Nahar, K.; Morshed, M.M. Measuring urban expansion pattern using spatial matrices in Khulna City, Bangladesh. Heliyon 2023, 9, e13193. [Google Scholar] [CrossRef]
- Alemu, B. The Effect of Land Use Land Cover Change on Land Degradation in the Highlands of Ethiopia. Journal of Environment and Earth Science 2015, 5, 1–13 . [Google Scholar]
- Ashwini, K.; Sil, B.S. Impacts of Land Use and Land Cover Changes on Land Surface Temperature over Cachar Region, Northeast India—A Case Study. Sustainability (Switzerland) 2022, 14. [Google Scholar] [CrossRef]
- Bulti, D.T.; Abebe, B.G. Analyzing the impacts of urbanization on runoff characteristics in Adama city, Ethiopia. SN Applied Sciences 2020, 2, 1–13. [Google Scholar] [CrossRef]
- Bulti, D.T.; Assefa, T. Analyzing the ecological footprint of residential building construction in Adama City, Ethiopia. Environmental Systems Research 2019, 8. [Google Scholar] [CrossRef]
- Calderón-Loor, M.; Hadjikakou, M.; Bryan, B.A. High-resolution wall-to-wall land-cover mapping and land change assessment for Australia from 1985 to 2015. Remote Sensing of Environment 2021, 252. [Google Scholar] [CrossRef]
- Chen, H.; Yang, L.; Wu, Q. Enhancing Land Cover Mapping and Monitoring: An Interactive and Explainable Machine Learning Approach Using Google Earth Engine. Remote Sensing 2023, 15. [Google Scholar] [CrossRef]
- Choudhury, U.; Singh, S.K.; Kumar, A.; Meraj, G.; Kumar, P.; Kanga, S. Assessing Land Use/Land Cover Changes and Urban Heat Island Intensification: A Case Study of Kamrup Metropolitan District, Northeast India (2000–2032). Earth (Switzerland) 2023, 4, 503–521. [Google Scholar] [CrossRef]
- Congalton, R.G.; Green, K. Assessing the accuracy of remotely sensed data: Principles and practices, second edition. In Assessing the Accuracy of Remotely Sensed Data: Principles and Practices, Second Edition ed; 2008. [Google Scholar]
- Daba, M.H.; You, S. Quantitatively Assessing the Future Land-Use/Land-Cover Changes and Their Driving Factors in the Upper Stream of the Awash River Based on the CA–Markov Model and Their Implications for Water Resources Management. Sustainability (Switzerland) 2022, 14. [Google Scholar] [CrossRef]
- Degefu, M.A.; Argaw, M.; Feyisa, G.L.; Degefa, S. Regional and urban heat island studies in megacities: A systematic analysis of research methodology. Indoor and Built Environment 2022, 31, 1775–1786. [Google Scholar] [CrossRef]
- Dibaba, W.T. Urbanization-induced land use/land cover change and its impact on surface temperature and heat fluxes over two major cities in Western Ethiopia. Environmental Monitoring and Assessment 2023, 195, 1–20. [Google Scholar] [CrossRef]
- Fan, Y.; Zhu, X.; He, Z.; Zhang, S.; Gao, J.; Chen, F.; Peng, X.; Li, J. Urban expansion assessment in Huaihe River Basin, China, from 1998 to 2013 using remote sensing data. Journal of Sensors 2017, 2017. [Google Scholar] [CrossRef]
- Fenta, A.A.; Yasuda, H.; Haregeweyn, N.; Belay, A.S.; Hadush, Z.; Gebremedhin, M.A.; Mekonnen, G. The dynamics of urban expansion and land use/land cover changes using remote sensing and spatial metrics: The case of Mekelle city of northern Ethiopia. International Journal of Remote Sensing 2017, 38, 4107–4129. [Google Scholar] [CrossRef]
- Fikadu, G.; Olika, G. Impact of land use land cover change using remote sensing with integration of socio-economic data on Rural Livelihoods in the Nashe watershed, Ethiopia. Heliyon 2023, 9, e13746. [Google Scholar] [CrossRef]
- García, D.H. Analysis of Urban Heat Island and Heat Waves Using Sentinel-3 Images: a Study of Andalusian Cities in Spain. Earth Systems and Environment 2022, 6, 199–219. [Google Scholar] [CrossRef] [PubMed]
- Gebreselassie, T.A.; Rao PP, J. Geospatial Location Based Study for Establishment of New Public Health Centers: A Case of Adama City, Oromia, Ethiopia. International Journal of Recent Technology and Engineering (IJRTE) 2021, 10, 221–230. [Google Scholar] [CrossRef]
- Halder, B.; Karimi, A.; Mohammad, P.; Bandyopadhyay, J.; Brown, R.D.; Yaseen, Z.M. Investigating the relationship between land alteration and the urban heat island of Seville city using multi-temporal Landsat data. Theoretical and Applied Climatology 2022 2015, 150, 613–635. [Google Scholar] [CrossRef]
- Haregeweyn, N.; Fikadu, G.; Tsunekawa, A.; Tsubo, M.; Meshesha, D.T. The dynamics of urban expansion and its impacts on land use/land cover change and small-scale farmers living near the urban fringe: A case study of Bahir Dar, Ethiopia. Landscape and Urban Planning 2012, 106, 149–157. [Google Scholar] [CrossRef]
- Hussein, A. Impacts of Land Use and Land Cover Change on Vegetation Diversity of Tropical Highland in Ethiopia. Applied and Environmental Soil Science 2023, 2023. [Google Scholar] [CrossRef]
- Kabiso, A.F.; O’Neill, E.; Brereton, F.; Abeje, W. Rapid Urbanization in Ethiopia: Lakes as Drivers and Its Implication for the Management of Common Pool Resources. Sustainability (Switzerland) 2022, 14, 1–20. [Google Scholar] [CrossRef]
- Kanga, S.; Meraj, G.; Johnson, B.A.; Singh, S.K.; PV, *!!! REPLACE !!!*; MN, *!!! REPLACE !!!*; Farooq, M.; Kumar, P.; Marazi, A.; Sahu, N. Understanding the Linkage between Urban Growth and Land Surface Temperature—A Case Study of Bangalore City, India. Remote Sensing 2022, 14. [Google Scholar] [CrossRef]
- Kindu, M.; Angelova, D.; Schneider, T.; Döllerer, M.; Teketay, D.; Knoke, T. Monitoring of urban growth patterns in rapidly growing Bahir Dar city of northwest Ethiopia with 30-year Landsat imagery record. ISPRS International Journal of Geo-Information 2020, 9, 1–19. [Google Scholar] [CrossRef]
- Leta, B.M.; Adugna, D.; Wondim, A.A. A comprehensive investigation of flood-resilient neighborhoods: the case of Adama City, Ethiopia. Applied Water Science 2024, 14, 1–19. [Google Scholar] [CrossRef]
- Liu, P.; Jia, S.; Han, R.; Liu, Y.; Lu, X.; Zhang, H. RS and GIS Supported Urban LULC and UHI Change Simulation and Assessment. Journal of Sensors 2020, 2020. [Google Scholar] [CrossRef]
- Loukika, K.N.; Keesara, V.R.; Sridhar, V. Analysis of land use and land cover using machine learning algorithms on Google Earth engine for Munneru river basin, India. Sustainability (Switzerland) 2021, 13. [Google Scholar] [CrossRef]
- Martínez-Retureta, R.; Aguayo, M.; Stehr, A.; Sauvage, S.; Echeverría, C.; Sánchez-Pérez, J.M. Response of a Southern Center Basin of Chile. Water (Switzerland) 2020, 1–21. [Google Scholar]
- McGrane, S.J. Impacts of urbanization on hydrological and water quality dynamics, and urban water management: a review. Hydrological Sciences Journal 2016, 61, 2295–2311. [Google Scholar] [CrossRef]
- Moisa, M.B.; Dejene, I.N.; Roba, Z.R.; Gemeda, D.O. Impact of urban land use and land cover change on urban heat island and urban thermal comfort level: a case study of Addis Ababa City, Ethiopia. Environmental Monitoring and Assessment 2022, 194. [Google Scholar] [CrossRef] [PubMed]
- Moisa, M.B.; Gemeda, D.O. Analysis of urban expansion and land use/land cover changes using geospatial techniques: a case of Addis Ababa City, Ethiopia. Applied Geomatics 2021, 13, 853–861. [Google Scholar] [CrossRef]
- Mwangi, P.W.; Karanja, F.N.; Kamau, P.K. Analysis of the Relationship between Land Surface Temperature and Vegetation and Built-Up Indices in Upper-Hill, Nairobi. Journal of Geoscience and Environment Protection 2018, 06, 1–16. [Google Scholar] [CrossRef]
- Nath, B.; Ni-Meister, W.; Choudhury, R. Impact of urbanization on land use and land cover change in Guwahati city, India and its implication on declining groundwater level. Groundwater for Sustainable Development 2021, 12, 100500. [Google Scholar] [CrossRef]
- Negese, A. Impacts of Land Use and Land Cover Change on Soil Erosion and Hydrological Responses in Ethiopia. Applied and Environmental Soil Science 2021, 2021, 15–17. [Google Scholar] [CrossRef]
- Noi Phan, T.; Kuch, V.; Lehnert, L.W. Land cover classification using google earth engine and random forest classifier-the role of image composition. Remote Sensing 2020, 12. [Google Scholar] [CrossRef]
- Norouzi, Y. Measuring Land Use Changes and Quantifying Urban Expansion Using Remote Sensing and Gis Techniques - a Case Study of Qom. ISPRS Annals of the Photogrammetry, Remote Sensing and Spatial Information Sciences 2023, 10, 609–615. [Google Scholar] [CrossRef]
- Okeleye, S.O.; Okhimamhe, A.A.; Sanfo, S.; Fürst, C. Impacts of Land Use and Land Cover Changes on Migration and Food Security of North Central Region, Nigeria. Land 2023, 12. [Google Scholar] [CrossRef]
- Past, A.; Land, F.; Land, U.; Kumar, P. Cellular Automata-Based Artificial Neural Network Model for Cover Dynamics. Agronomy 2022, 12, 2772. [Google Scholar]
- Rayhan, A. Urbanization and Climate Change: Challenges and Opportunities for Sustainable Cities Urbanization and Climate Change: Challenges and Opportunities for Sustainable Cities Urbanization and Climate Change: Challenges and Opportunities for Sustainable Cities; 2024. [Google Scholar] [CrossRef]
- Regassa, B.; Kassaw, M.; Bagyaraj, M. Analysis of Urban Expansion and Modeling of LULC Changes Using Geospatial Techniques: The Case of Adama City. Remote Sensing of Land 2020, 4, 40–58. [Google Scholar] [CrossRef]
- Rodriguez-Galiano, V.F.; Ghimire, B.; Rogan, J.; Chica-Olmo, M.; Rigol-Sanchez, J.P. An assessment of the effectiveness of a random forest classifier for land-cover classification. ISPRS Journal of Photogrammetry and Remote Sensing 2012, 67, 93–104. [Google Scholar] [CrossRef]
- Mithun, S.; Mithun, M.S.; Sahana, M.; Chattopadhyay, S.; Johnson, B.; Khedher, K.; R., A. Monitoring Metropolitan Growth Dynamics for Achieving Sustainable Urbanization (SDG 11.3) in Kolkata Metropolitan Area, India. Remote Sensing 2021, 13. [Google Scholar] [CrossRef]
- Shu, Y.; Zou, K.; Li, G.; Yan, Q.; Zhang, S.; Zhang, W.; Liang, Y.; Xu, W. Evaluation of Urban Thermal Comfort and Its Relationship with Land Use/Land Cover Change: A Case Study of Three Urban Agglomerations, China. Land 2022, 11. [Google Scholar] [CrossRef]
- Solomon, N.; Pabi, O.; Annang, T.; Asante, I.K.; Birhane, E. The effects of land cover change on carbon stock dynamics in a dry Afromontane forest in northern Ethiopia. Carbon Balance and Management 2018, 13. [Google Scholar] [CrossRef]
- Su, Q.; Chen, K.; Liao, L. The impact of land use change on disaster risk from the perspective of efficiency. Sustainability (Switzerland) 2021, 13, 1–14. [Google Scholar] [CrossRef]
- Sun, W.; Shan, J.; Wang, Z.; Wang, L.; Lu, D.; Jin, Z.; Yu, K. Geospatial Analysis of Urban Expansion Using Remote Sensing Methods and Data: A Case Study of Yangtze River Delta, China. Complexity 2020, 2020. [Google Scholar] [CrossRef]
- Taffa, C.; Mekonen, T.; Mulugeta, M.; Tesfaye, B. Data on spatiotemporal urban sprawl of Dire Dawa City, Eastern Ethiopia. Data in Brief 2017, 12, 341–345. [Google Scholar] [CrossRef]
- Terfa, B.K.; Chen, N.; Liu, D.; Zhang, X.; Niyogi, D. Urban expansion in Ethiopia from 1987 to 2017: Characteristics, spatial patterns, and driving forces. Sustainability (Switzerland) 2019, 11, 1–21. [Google Scholar] [CrossRef]
- Tessema, M.W.; Abebe, B.G. Quantification of land use/land cover dynamics and urban growth in rapidly urbanized countries: The case Hawassa city, Ethiopia. Urban, Planning and Transport Research 2023, 11. [Google Scholar] [CrossRef]
- Tikuye, B.G.; Rusnak, M.; Manjunatha, B.R.; Jose, J. Land Use and Land Cover Change Detection Using the Random Forest Approach: The Case of The Upper Blue Nile River Basin, Ethiopia. Global Challenges 2023, 7, 1–11. [Google Scholar] [CrossRef]
- Tong, S.; Prior, J.; McGregor, G.; Shi, X.; Kinney, P. Urban heat: An increasing threat to global health. The BMJ 2021, 375, 1–5. [Google Scholar] [CrossRef] [PubMed]
- Winkler, K.; Fuchs, R.; Rounsevell, M.; Herold, M. Global land use changes are four times greater than previously estimated. Nature Communications 2021, 12, 1–10. [Google Scholar] [CrossRef]
- Woldesemayat, E.M.; Genovese, P.V. Monitoring urban expansion and urban green spaces change in Addis Ababa: Directional and zonal analysis integrated with landscape expansion index. Forests 2021, 12, 1–19. [Google Scholar] [CrossRef]
- Yesuph, A.Y.; Dagnew, A.B. Land use/cover spatiotemporal dynamics, driving forces, and implications at the Beshillo catchment of the Blue Nile Basin, North Eastern Highlands of Ethiopia. Environmental Systems Research 2019, 8. [Google Scholar] [CrossRef]
Figure 1.
Study Area Map.
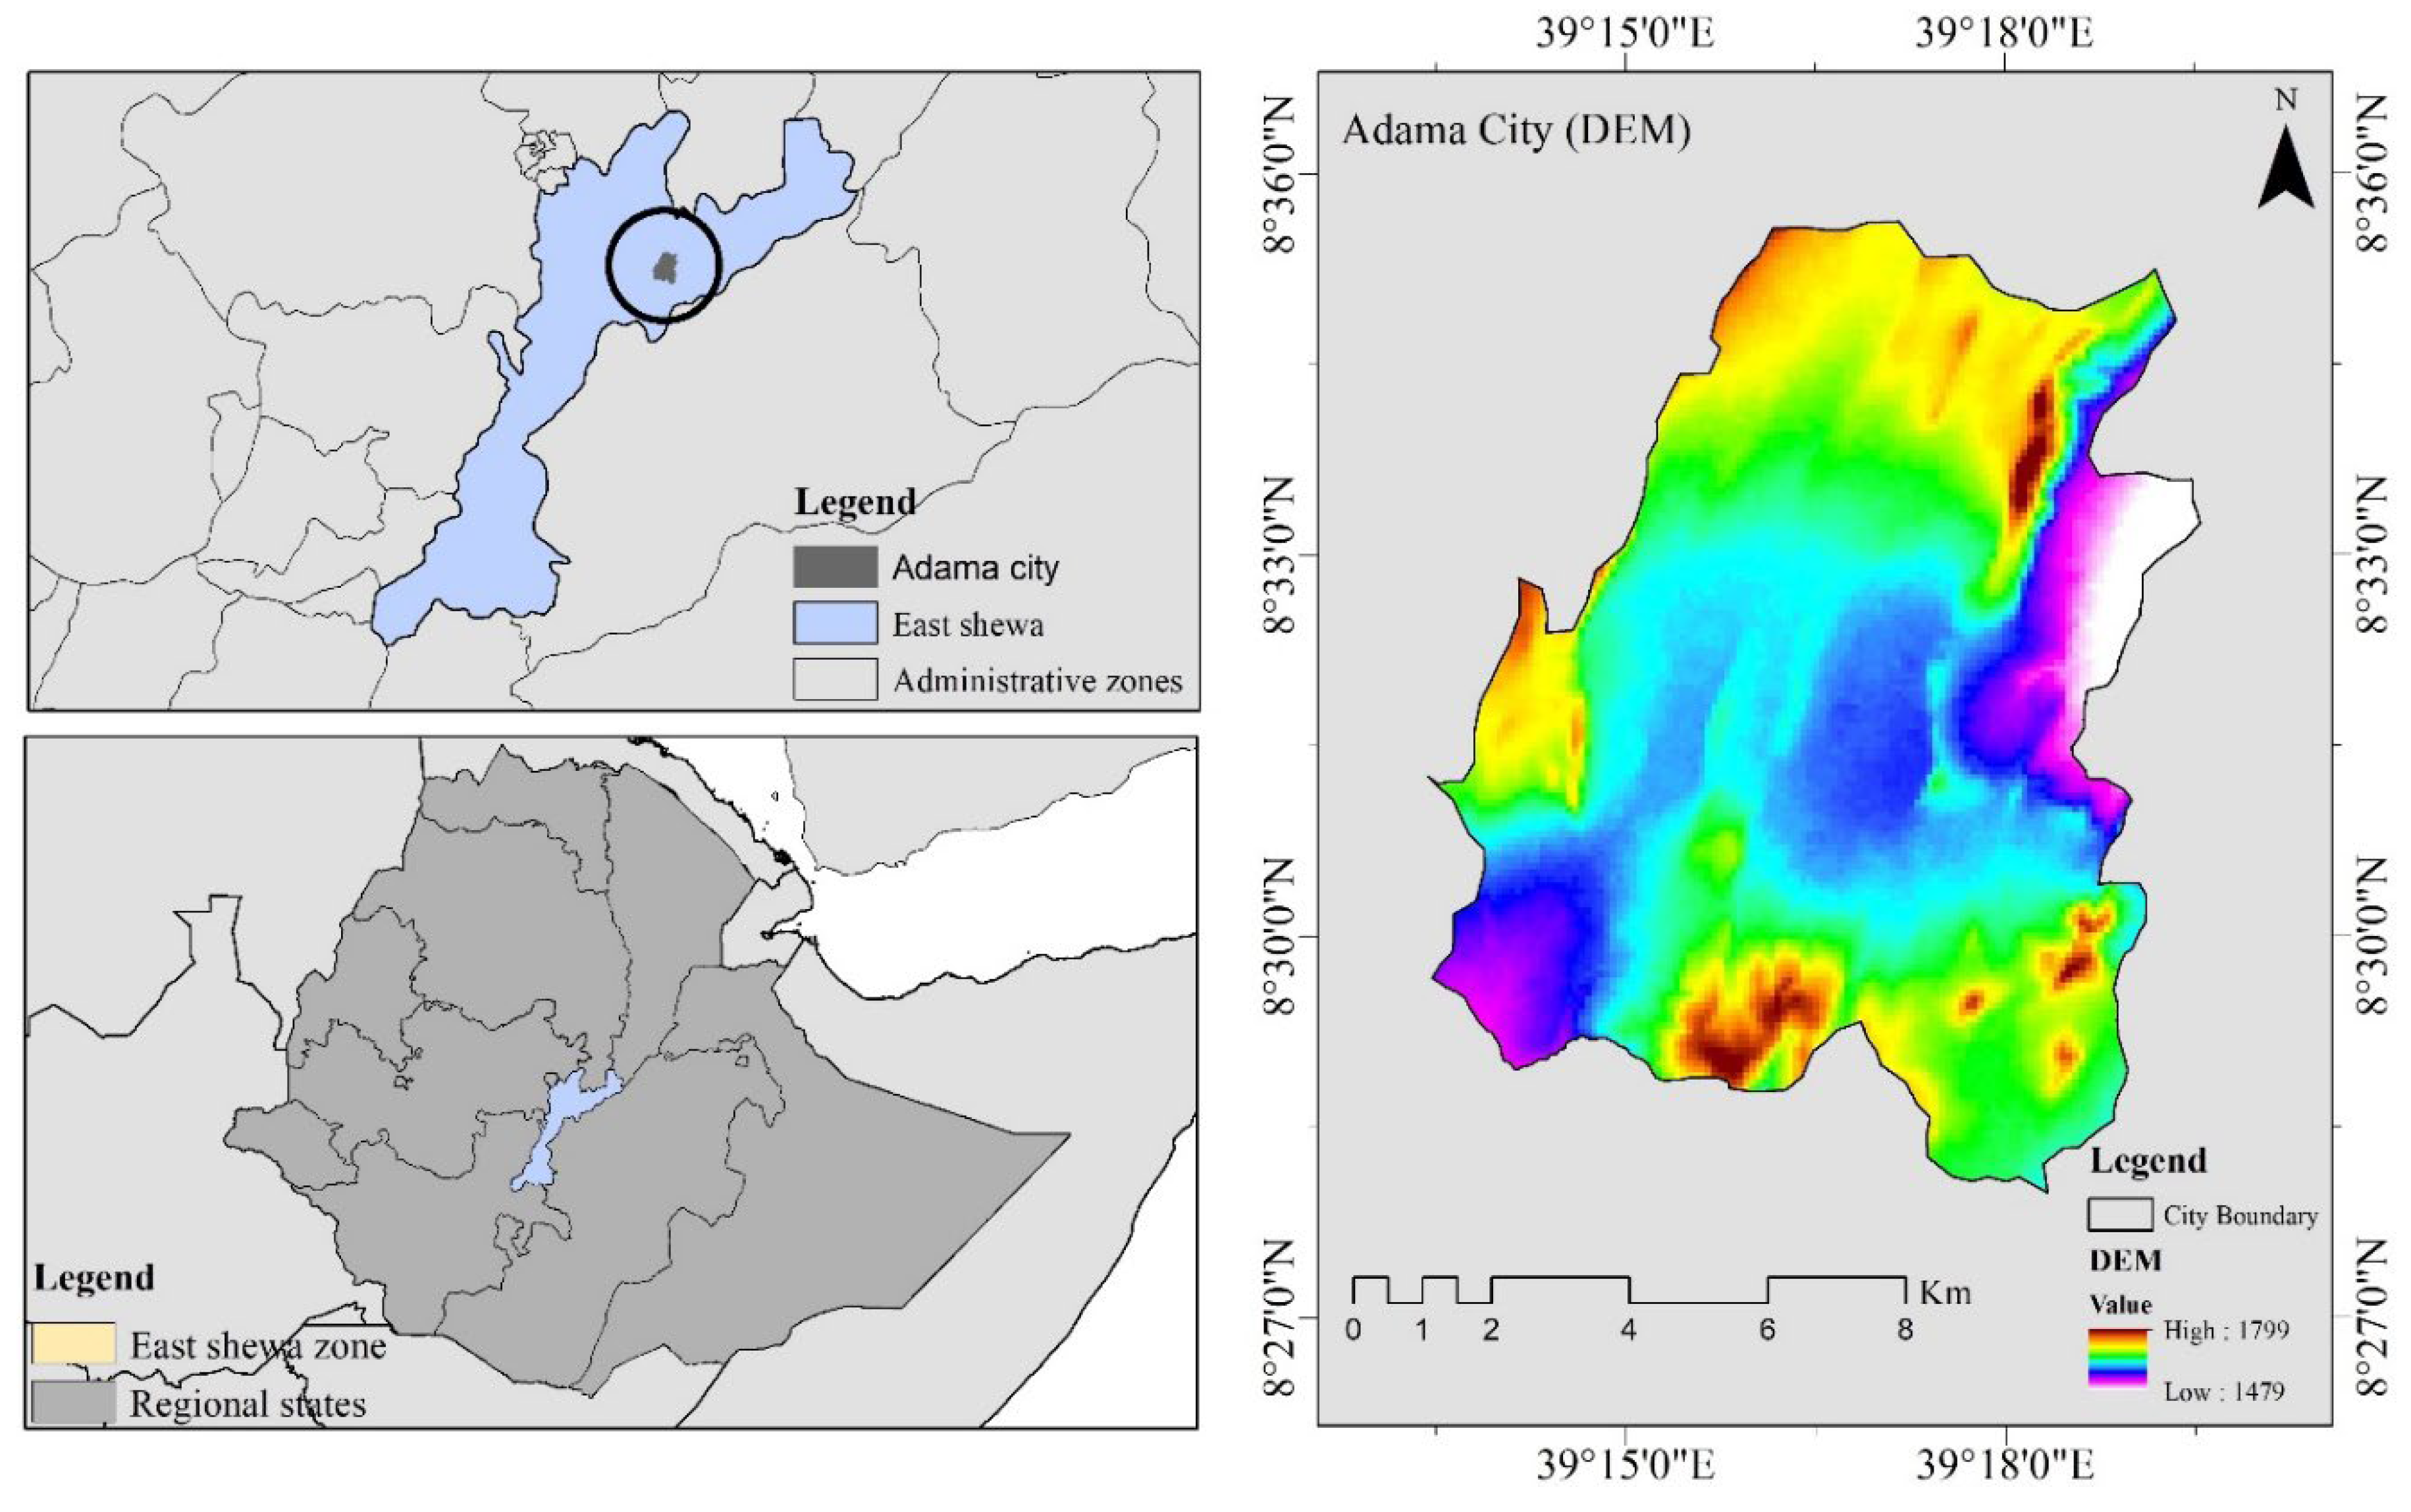
Figure 2.
Flow chart of methodology approach.
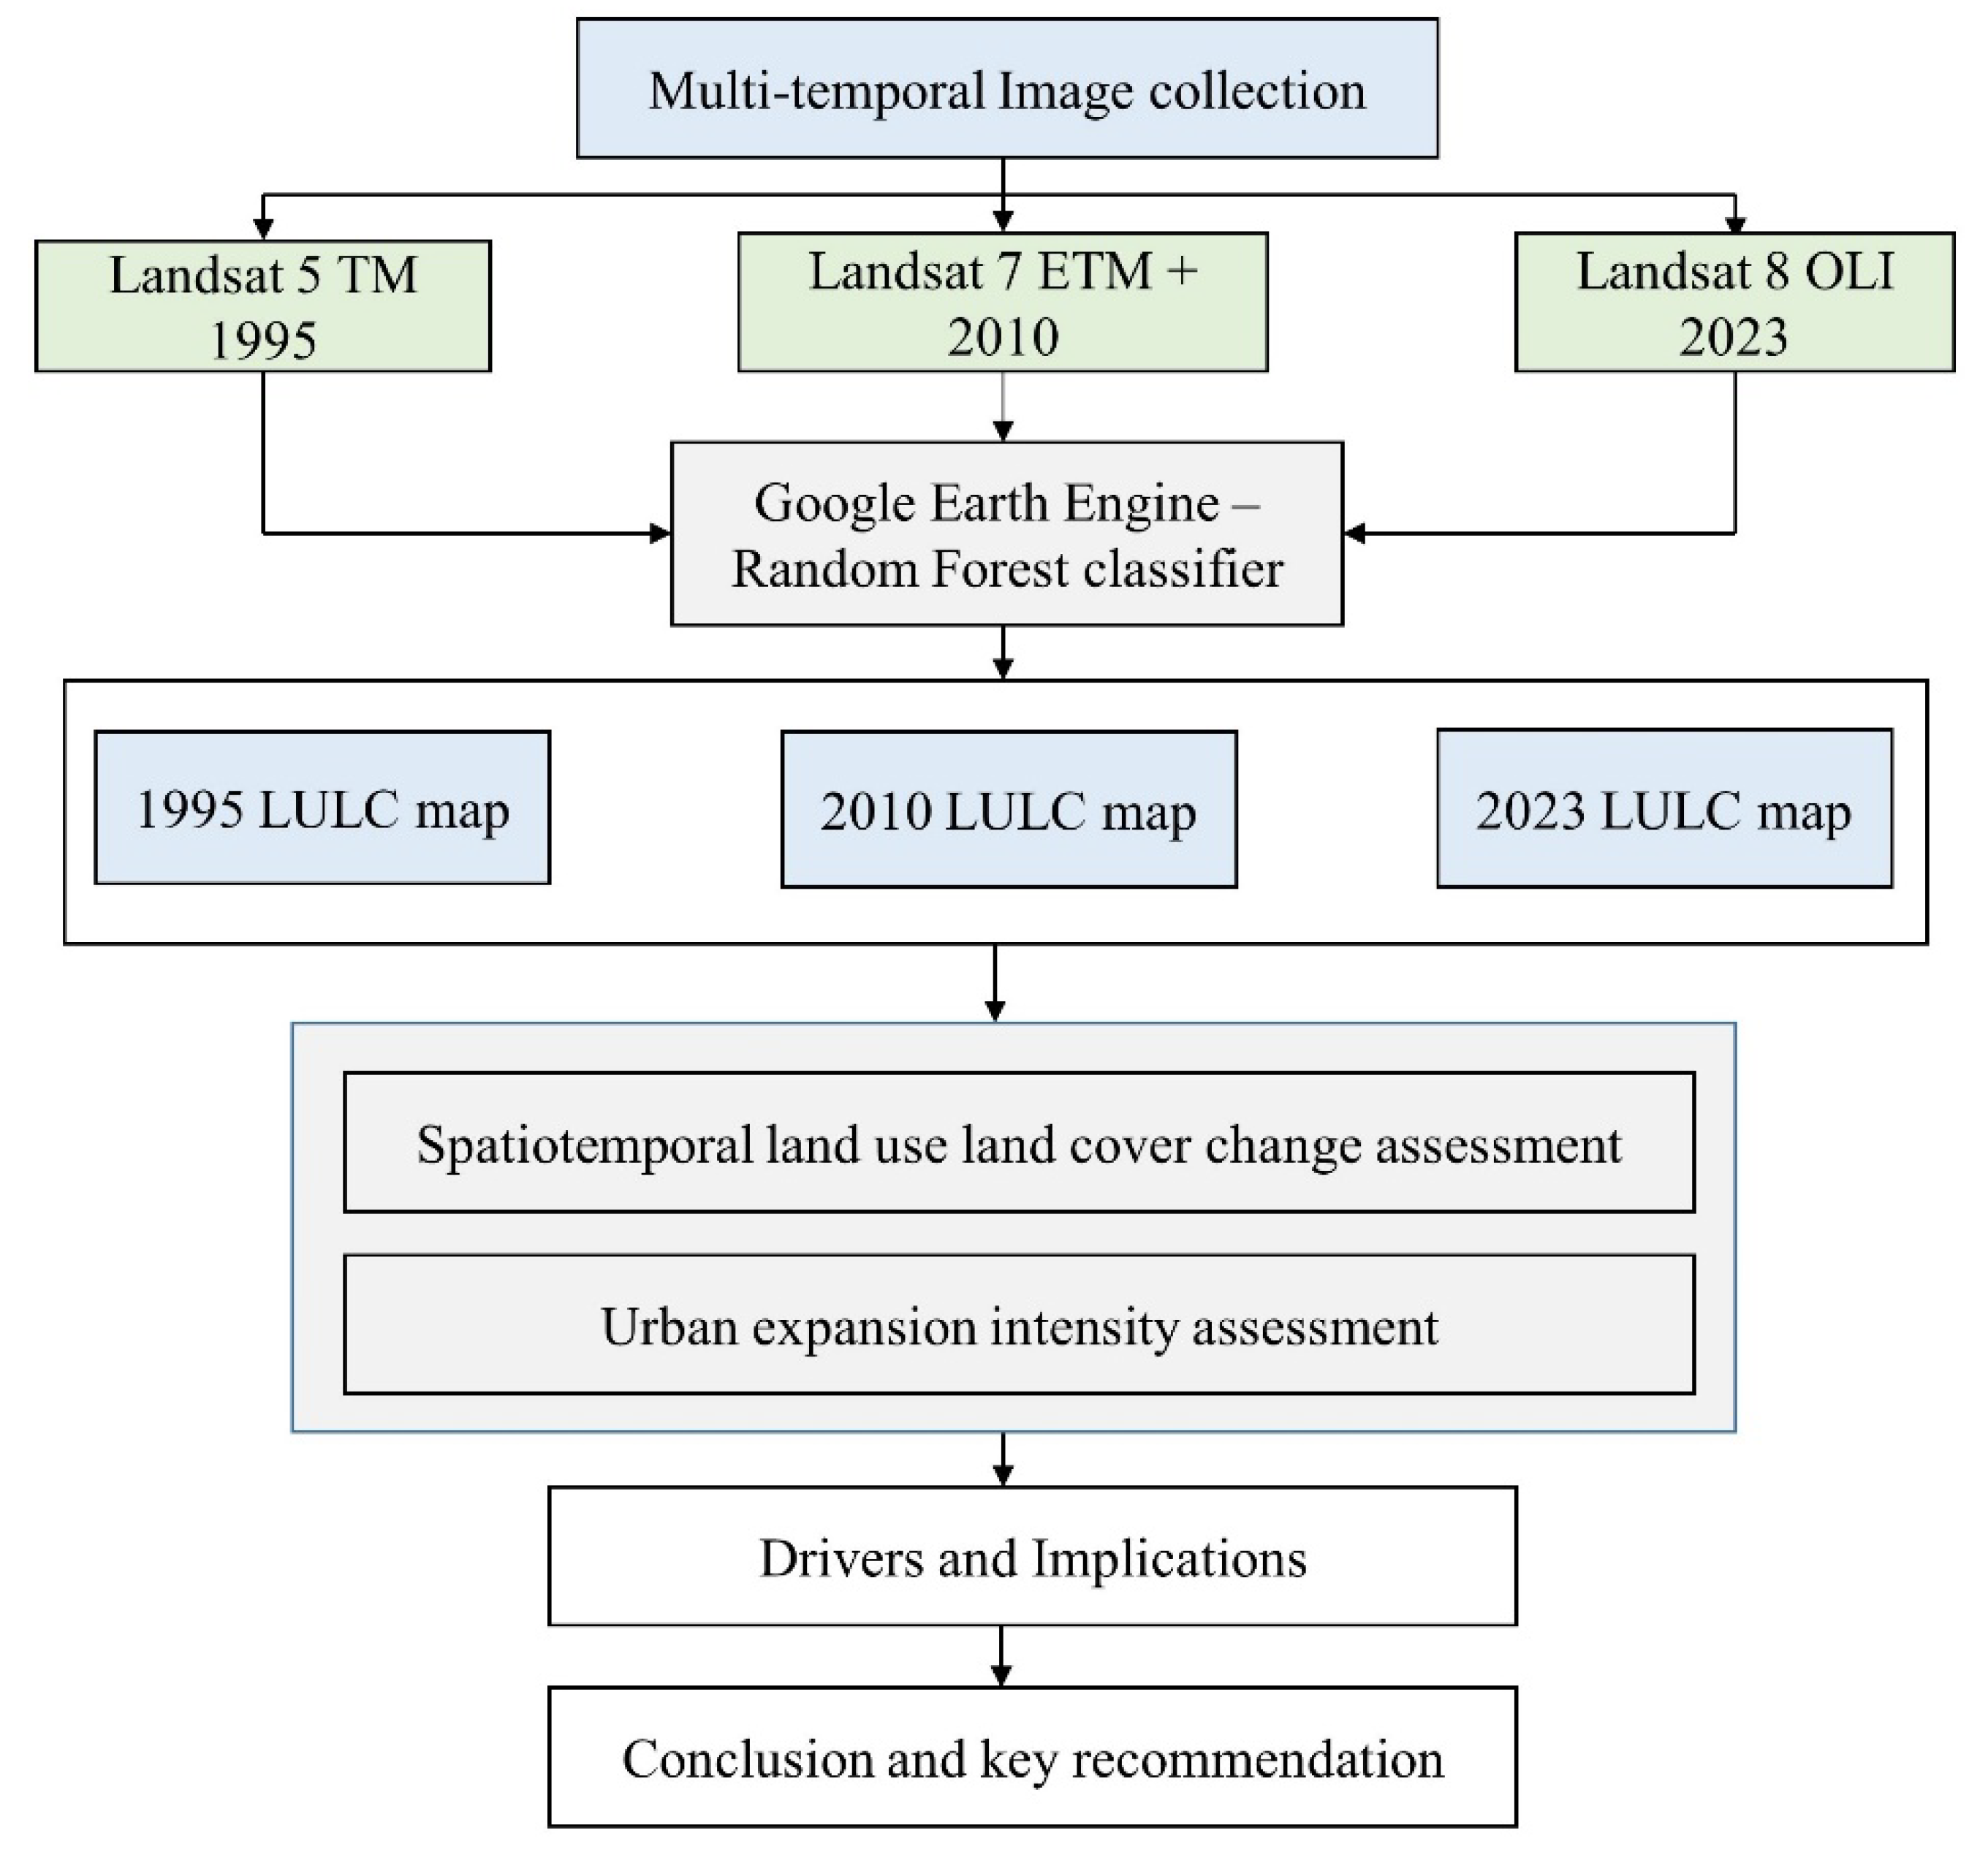
Figure 3.
1995, 2010, and 2023 LULC map of Adama City.
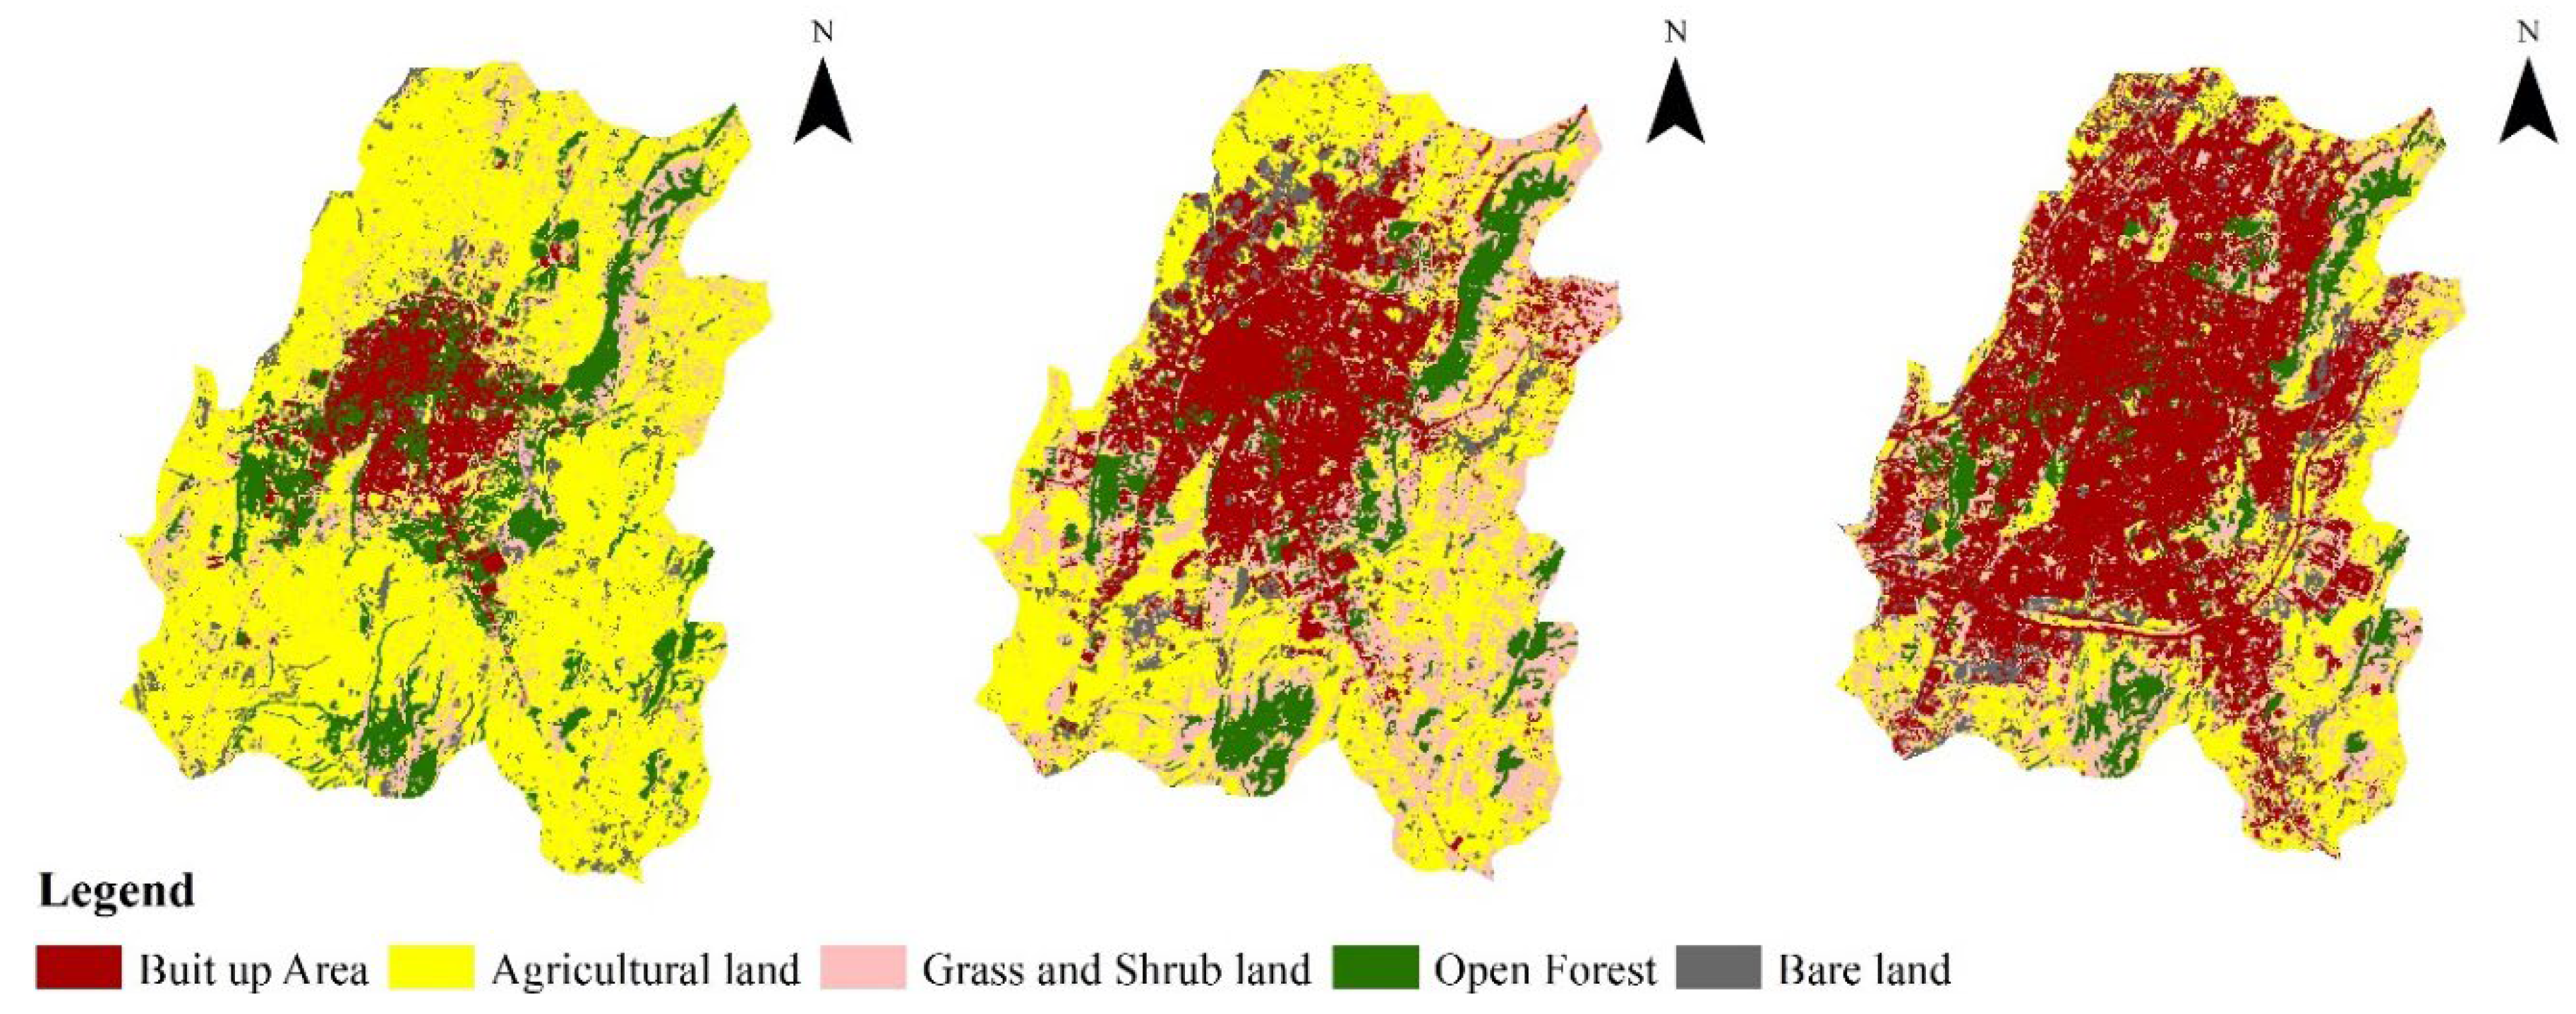
Figure 4.
LULC percentage distribution over the years.
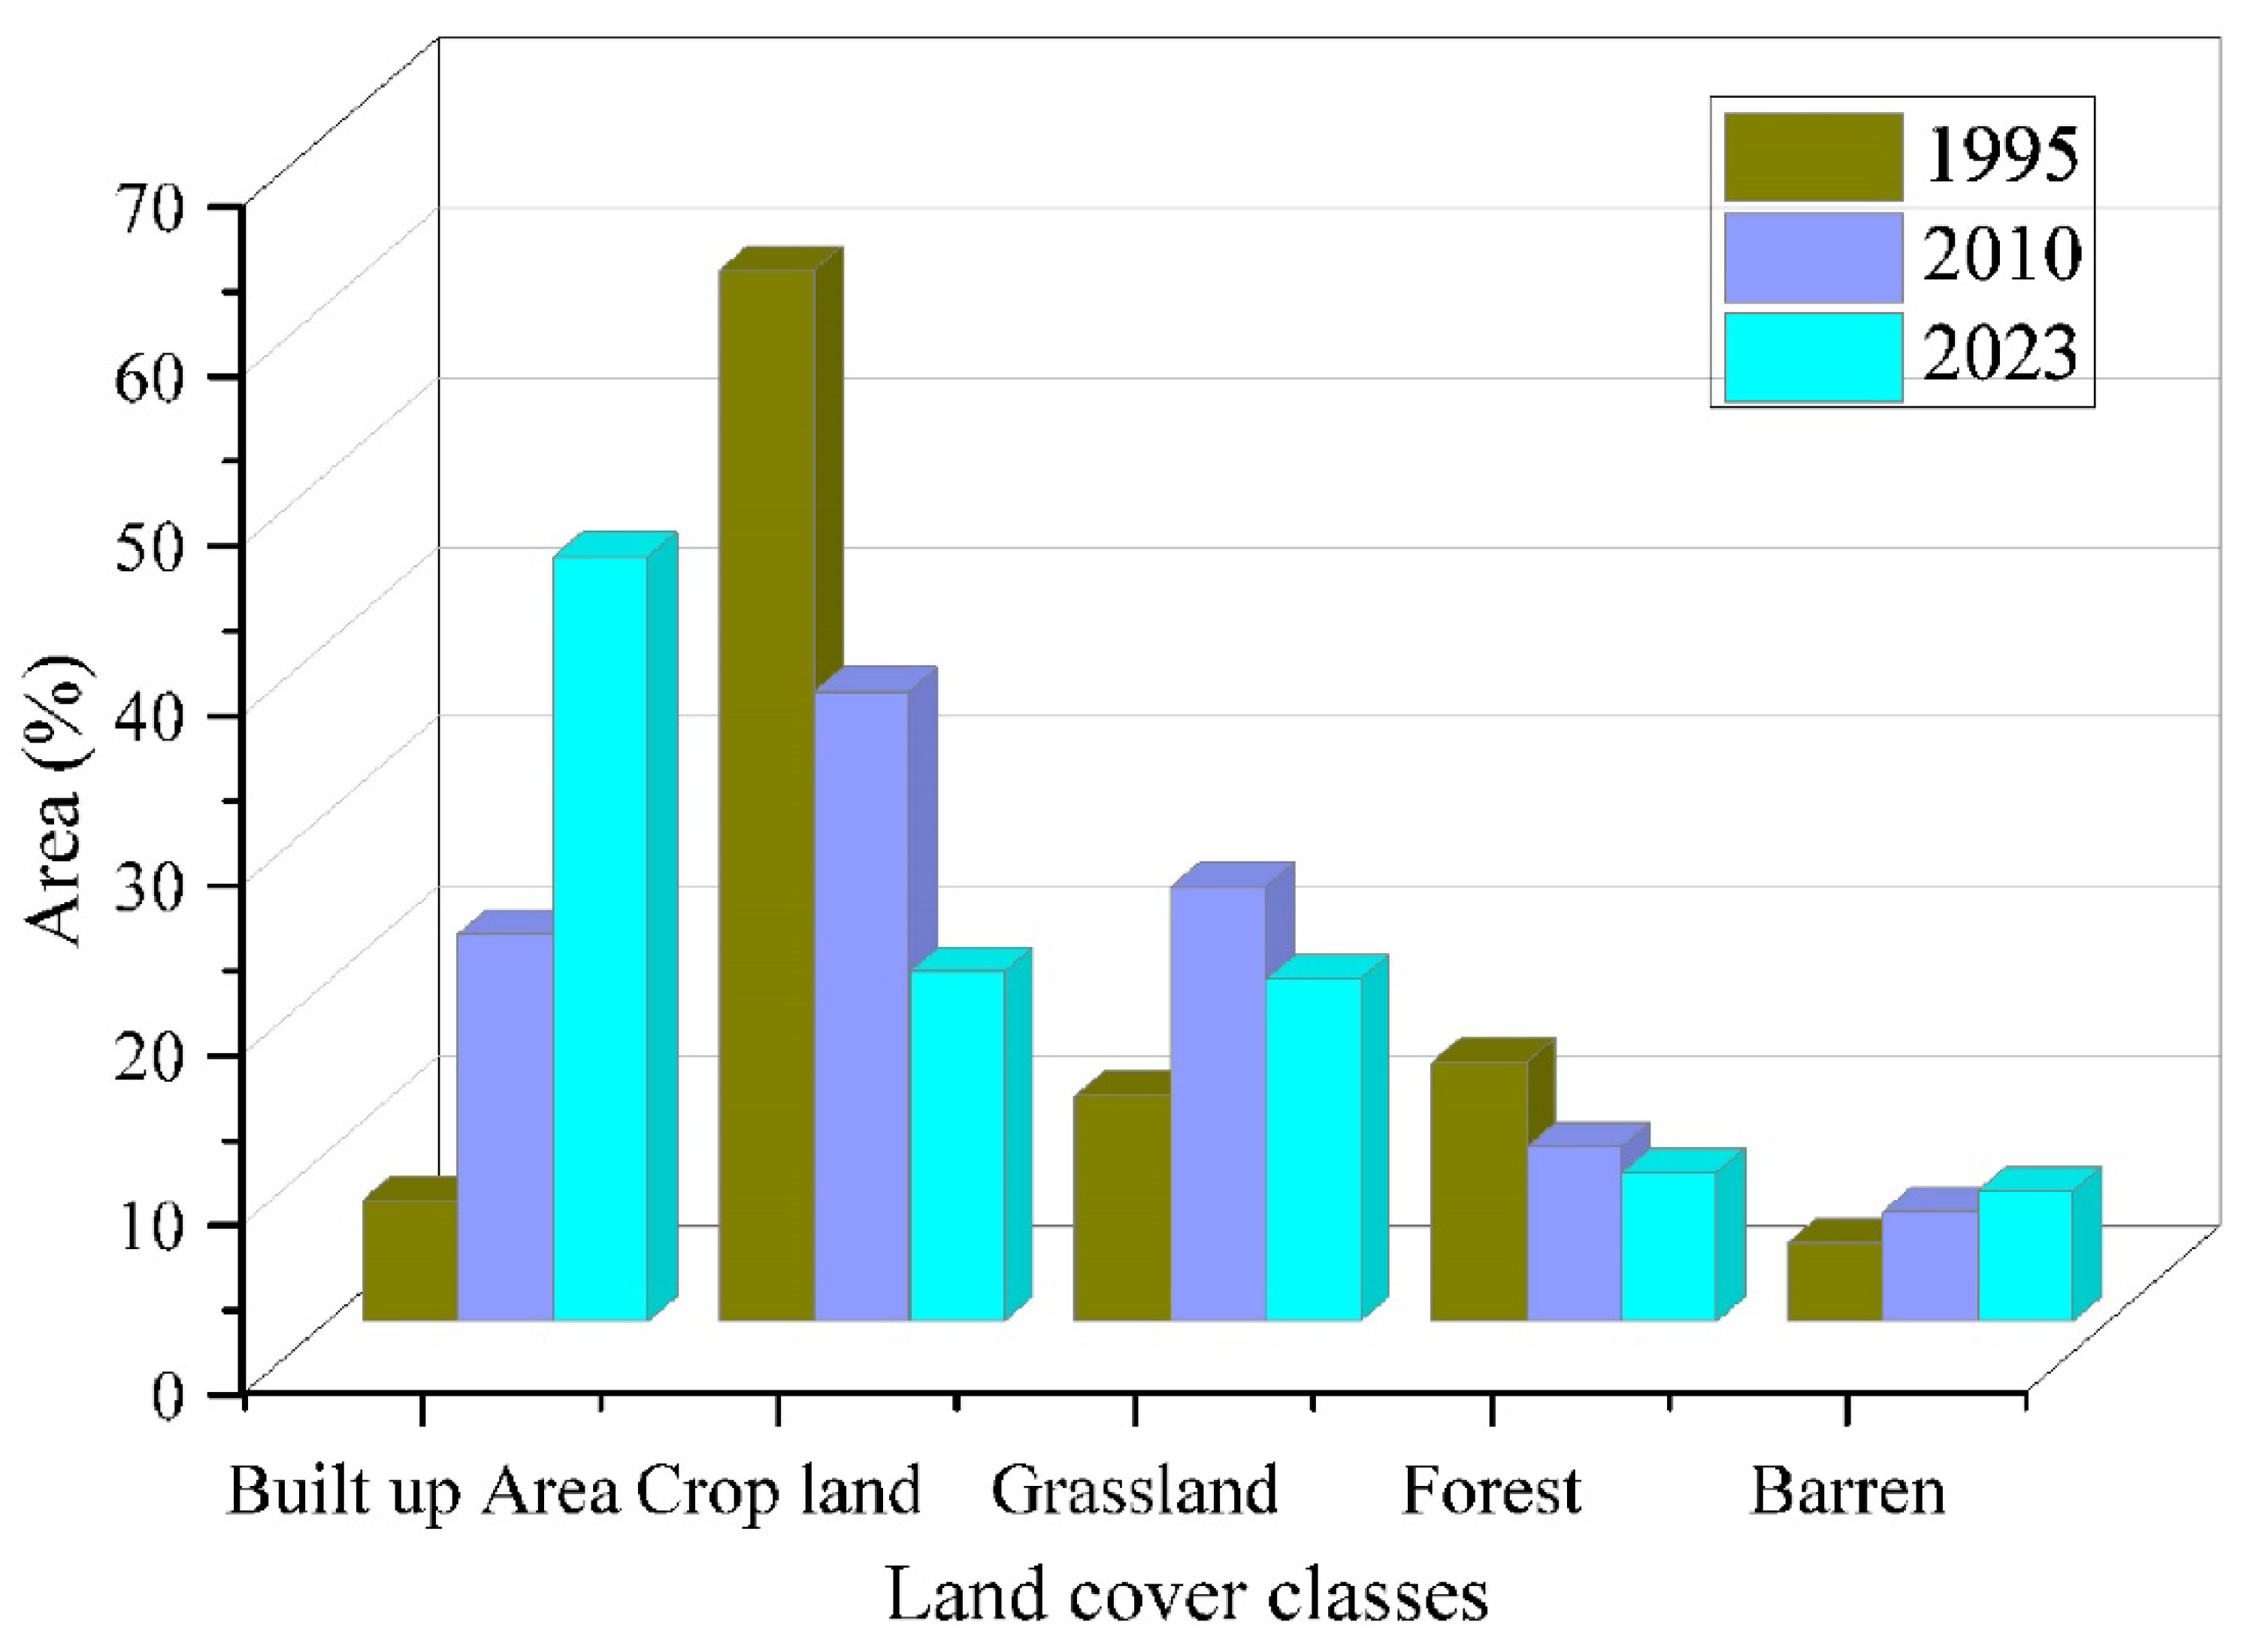
Figure 5.
LULC percentage gain/loss over the years.
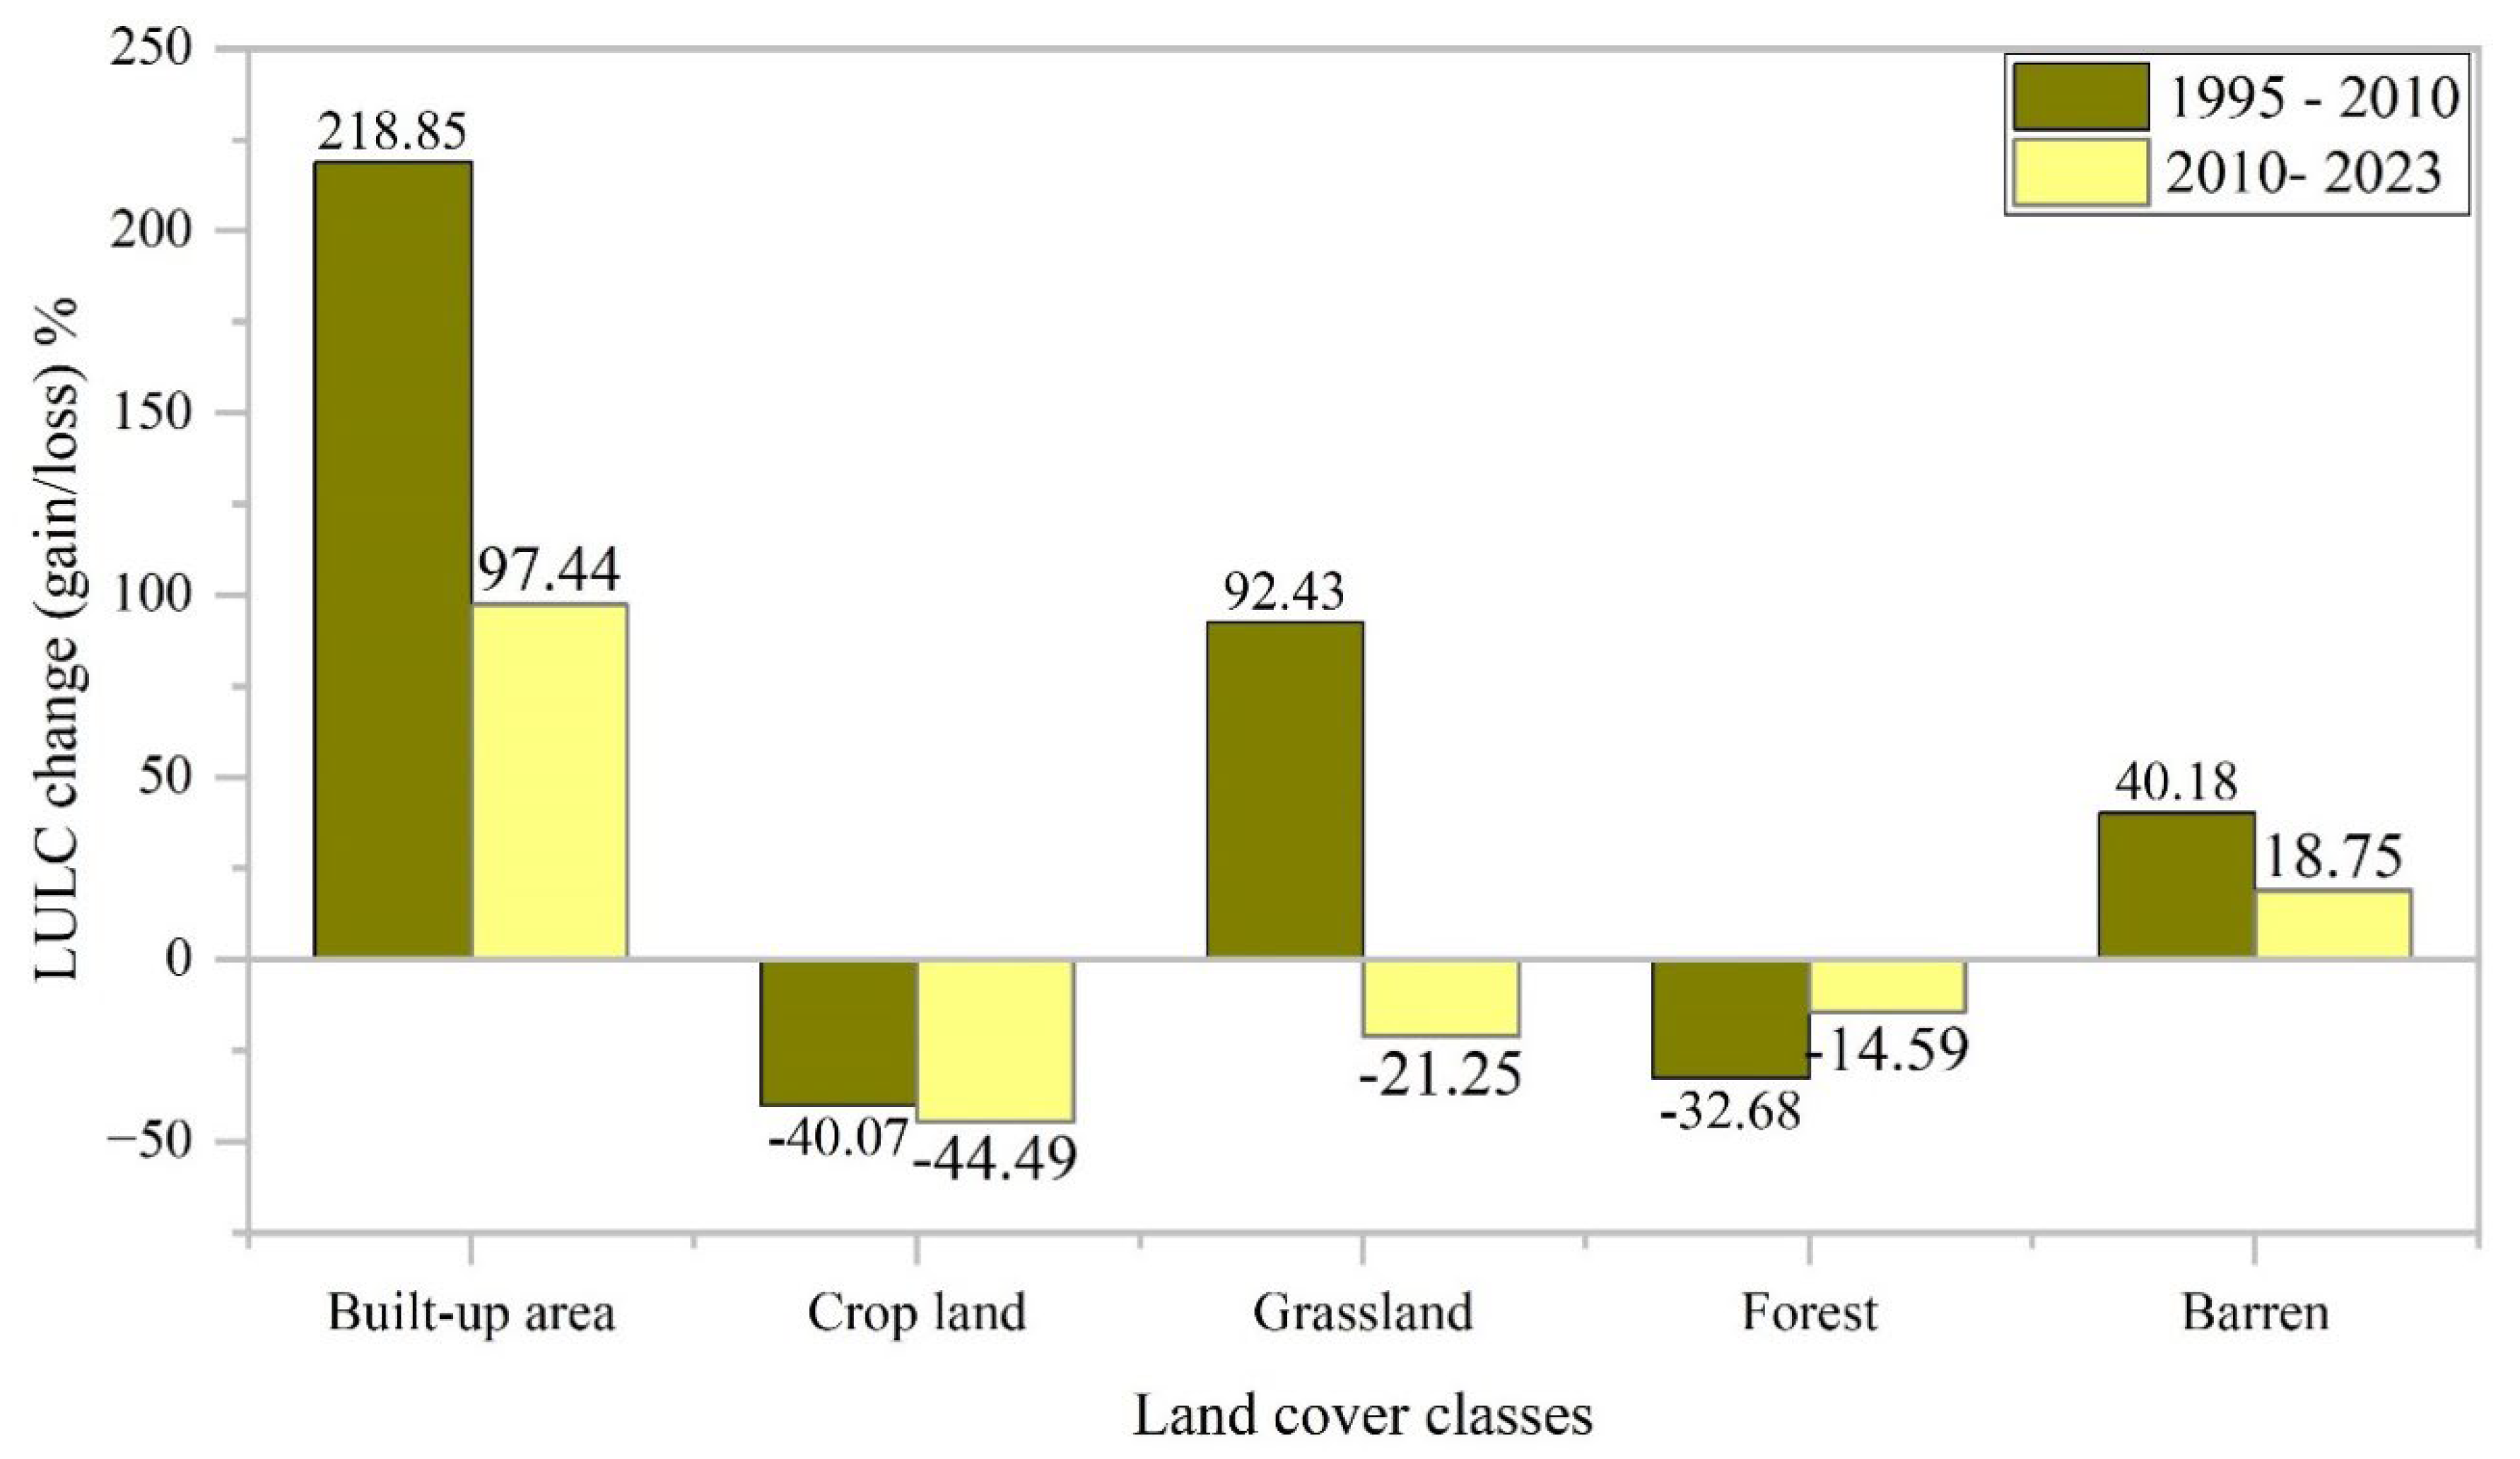
Figure 7.
Chord diagram for LULC transition (a) from 1995 to 2010, and (b) from 2010 to 2023.
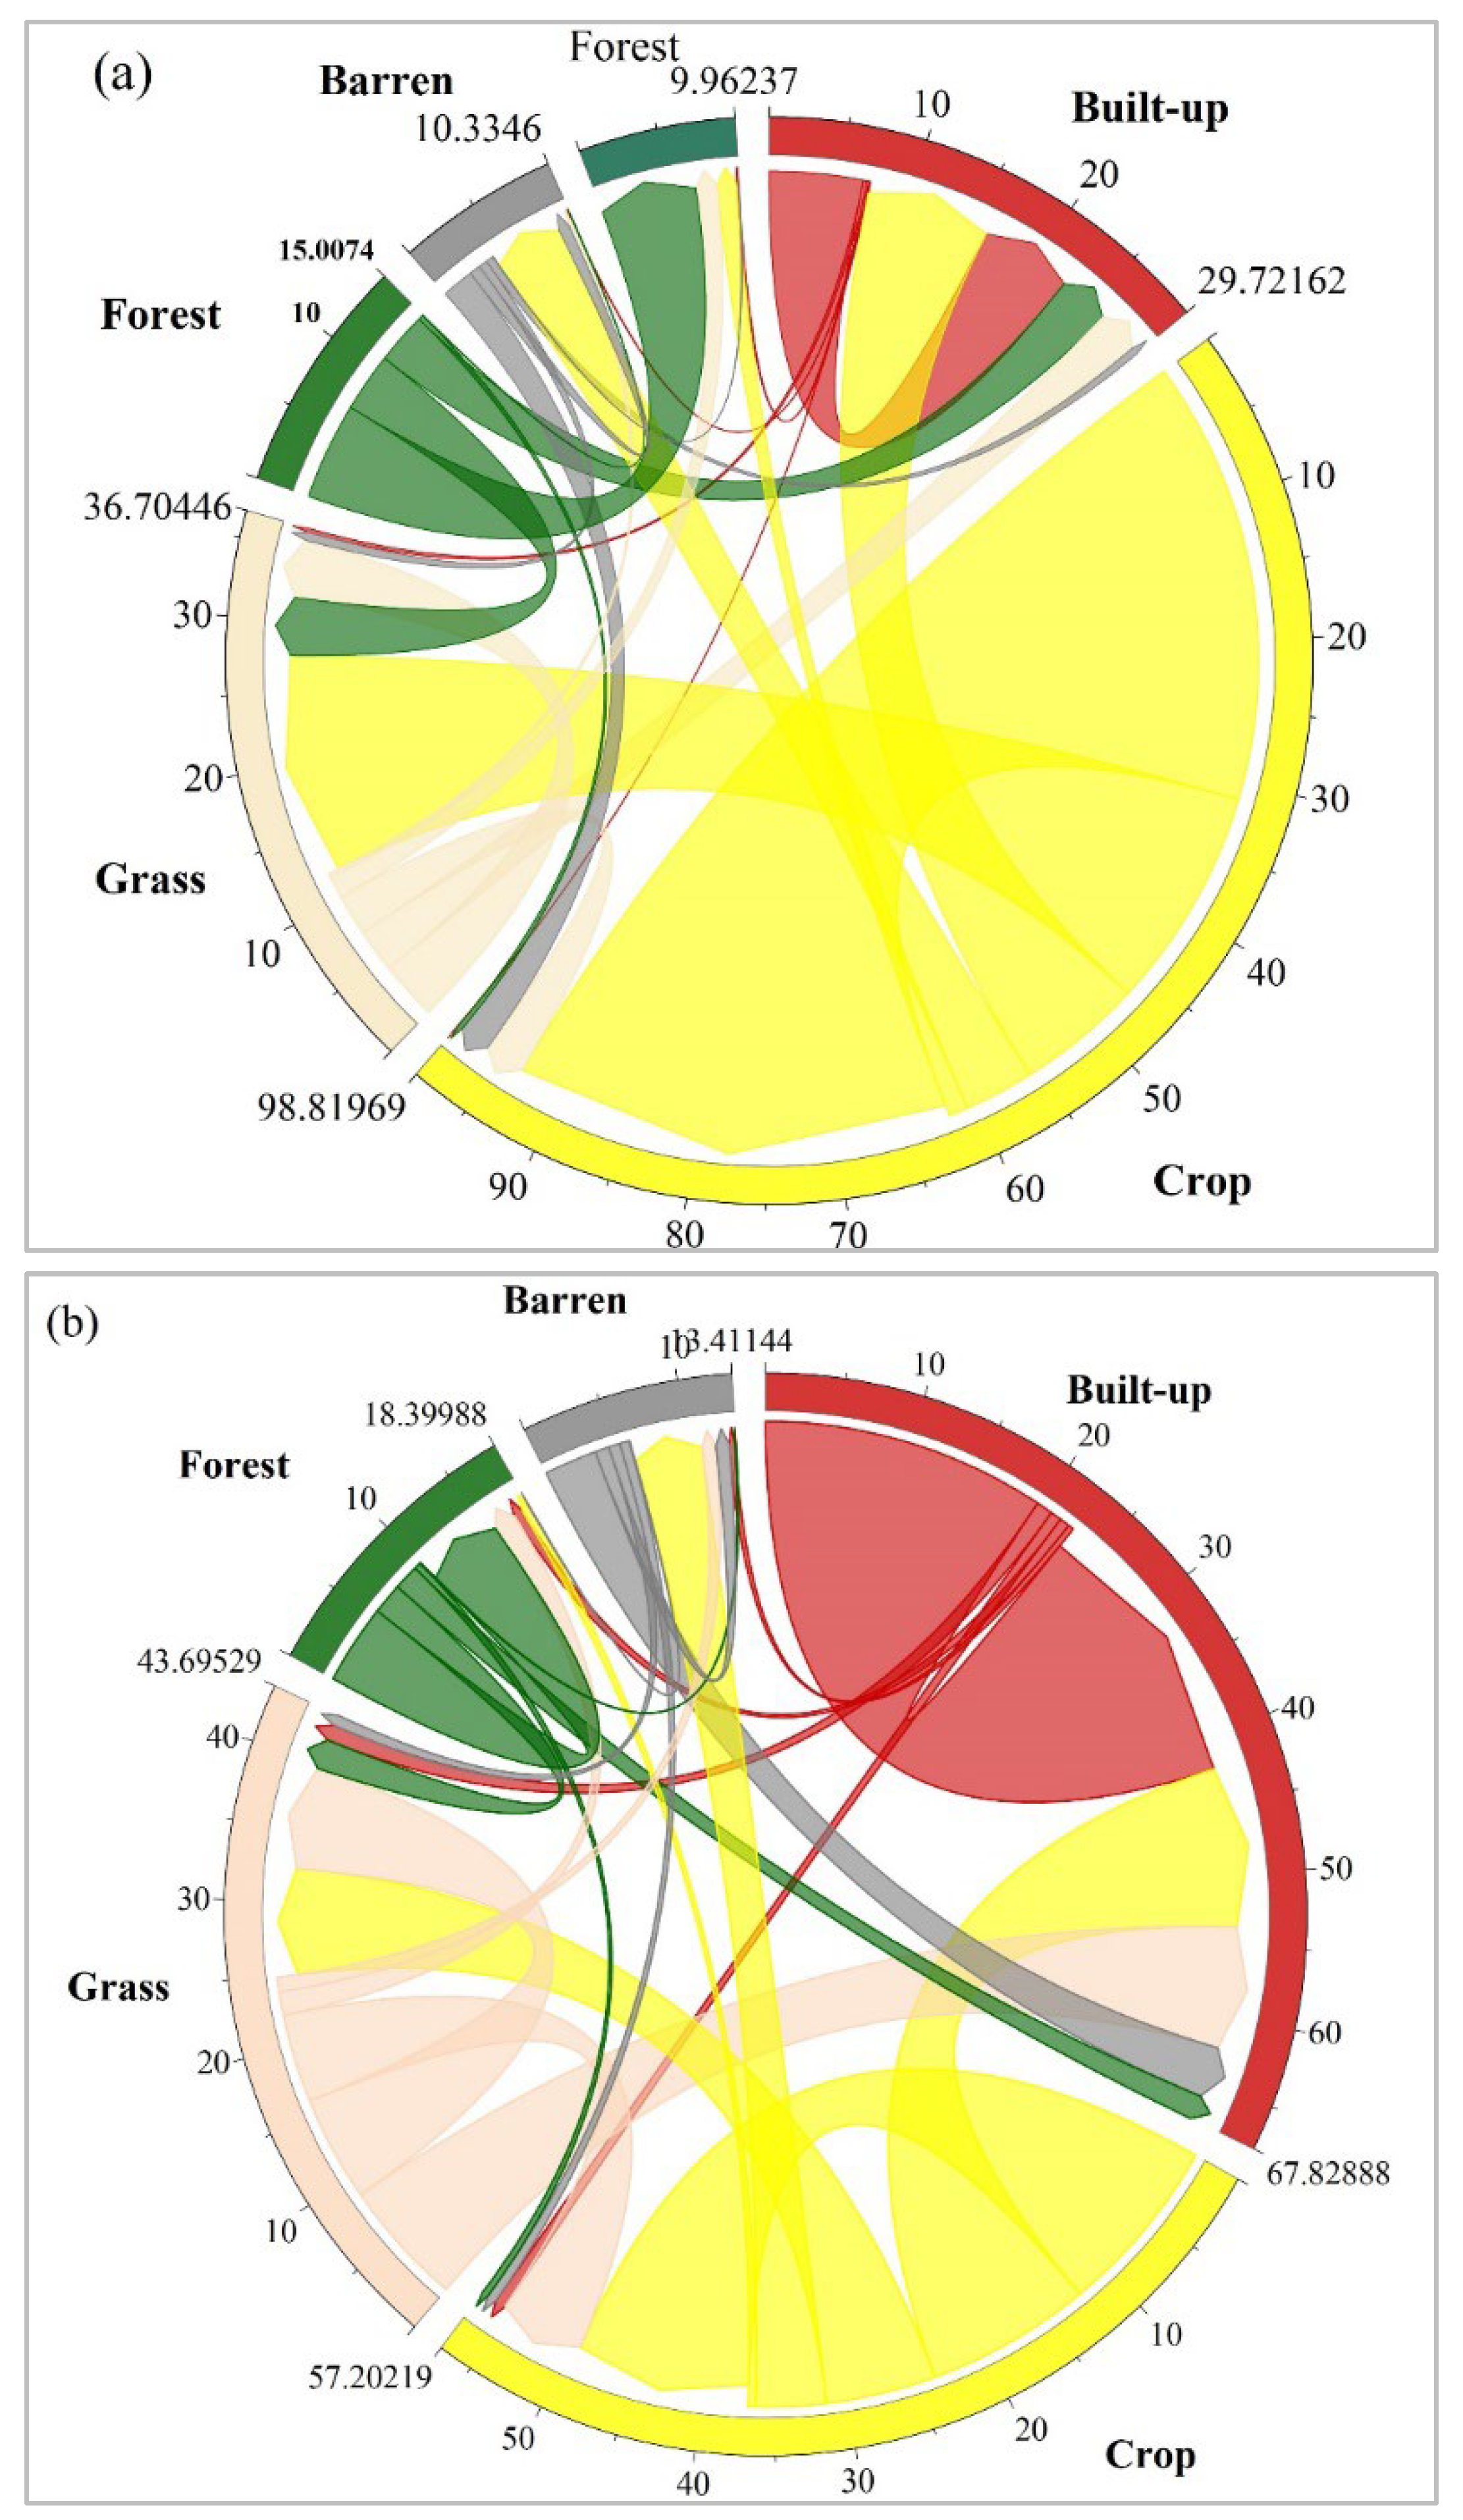
Figure 8.
Urban expansion intensity plot (a) 1995 – 2010 and (b) 2010 - 2023.
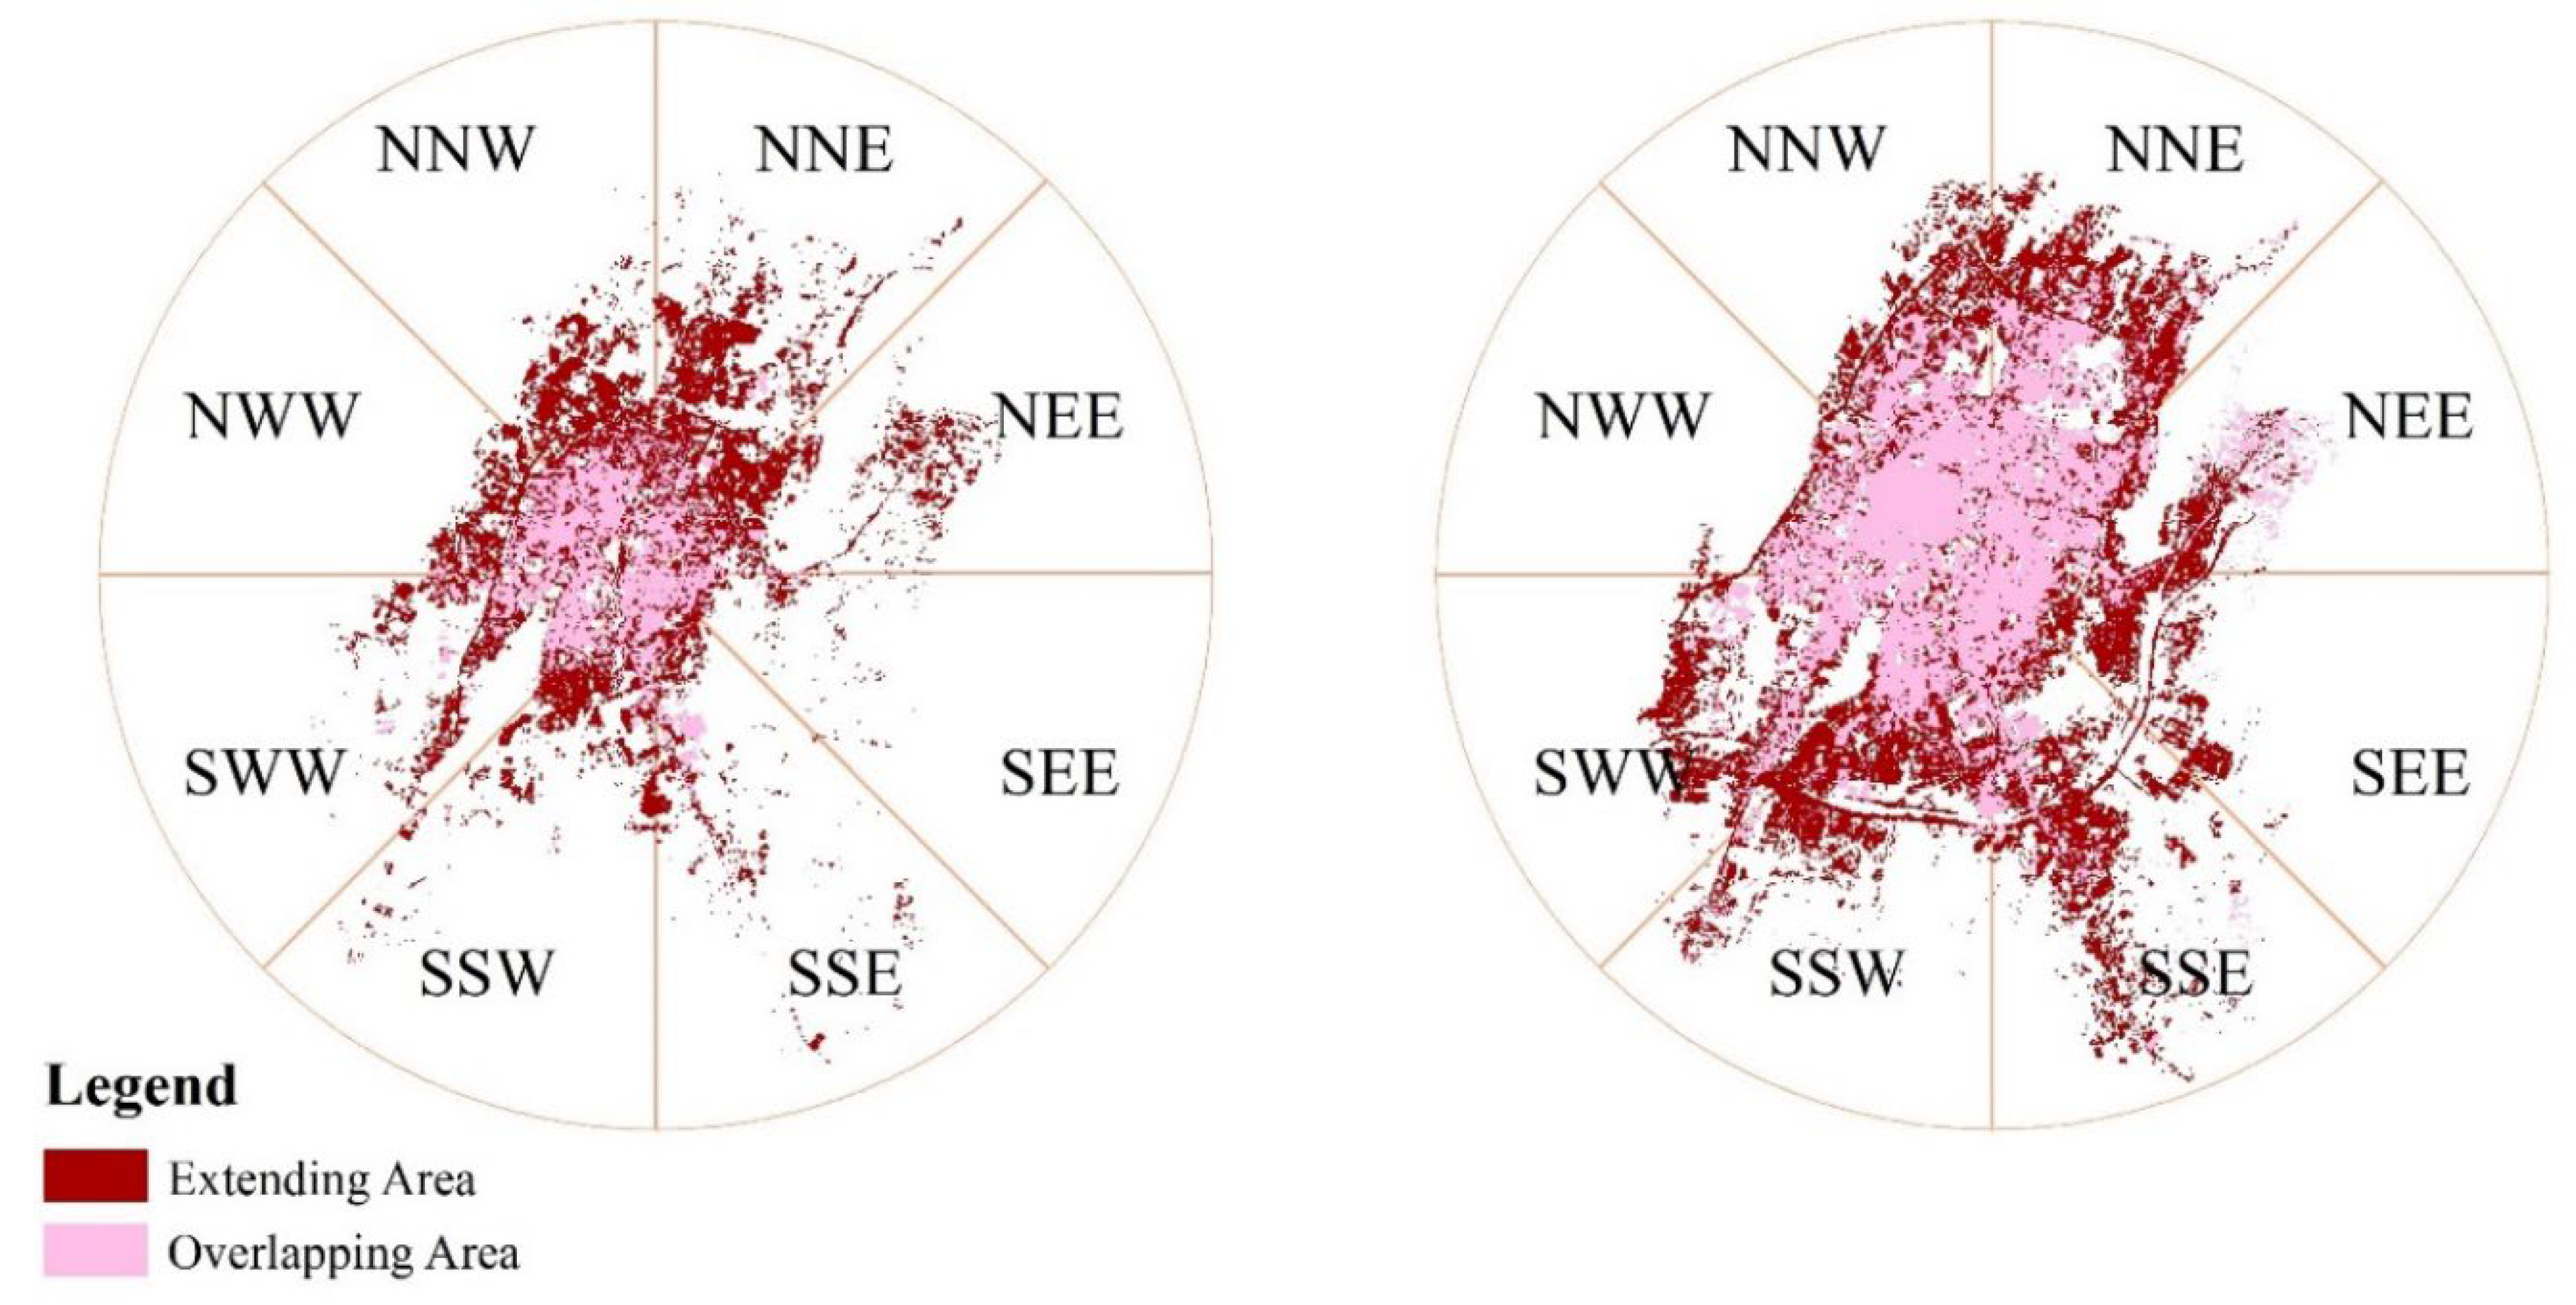

Table 1.
Data sets.
| Data type/sensor | Acquisition Date | Resolution | Year | Source |
| Landsat 5 TM | 21/12/2023 | 30m × 30m | 1995 | USGS |
| Landsat 7 ETM+ | 22/12/2023 | 30m × 30m | 2010 | USGS |
| Landsat 8 OLI | 22/12/2023 | 30m × 30m | 2023 | USGS |
Table 2.
Land cover classes identified in Adama city.
| LULC Classes | Description |
|---|---|
| Forest land | Locations with dense and open trees, including deciduous, mixed, and evergreen forests, as well as plantations of indigenous tree species, were also considered. |
| Bare land | Open fields with, little to without trees, beached, dunes, grass, sparsely vegetated areas, and bare gravel. |
| Grass and shrub land | Grass, shrubs, and bushes. |
| Cropland | Permanent crops. |
| Built-up area | Residential, commercial units and industries, roads, and other related property |
Table 3.
Number of training samples identified on Google Earth Engine.
| Year | Number of training Data | ||||
| Built-up | Crop | Grass | Forest | Barren | |
| 1995 | 911 | 1956 | 876 | 906 | 877 |
| 2010 | 1234 | 1571 | 767 | 877 | 899 |
| 2023 | 1707 | 1011 | 711 | 854 | 875 |
Table 4.
LULC classification accuracy.
| Year | Classifier | Overall Accuracy (%) | Kappa Coefficient |
| 1995 | Google Earth Engine – Random Forest Classifier | 85.13 | 0.86 |
| 2010 | 81.22 | 0.771 | |
| 2023 | 79.42 | 0.73 |
Table 5.
Areal coverage of the LULC of Adama City in 1995, 2010, and 2023.
| 1995 | 2010 | 2023 | Change (gain/loss) | |||||
| Area (Km2) | Percent | Area (Km2) | Percent | Area (Km2) | Percent | 1995-2010 | 2010-2023 | |
| Built up Area | 6.7568 | 6.997659 | 22.4195 | 22.31208 | 44.6558 | 44.05393 | 218.850 | 97.444 |
| Crop Land | 61.5299 | 60.55281 | 36.7097 | 36.28452 | 20.1983 | 20.14027 | -40.077 | -44.493 |
| Shrub and Grass Land | 12.8993 | 13.00357 | 25.1924 | 25.02332 | 19.7537 | 19.70556 | 92.434 | -21.251 |
| Forest | 14.8703 | 14.93074 | 9.8789 | 10.05034 | 8.5786 | 8.583396 | -32.687 | -14.595 |
| Barren | 4.2179 | 4.515215 | 6.0737 | 6.329749 | 7.2878 | 7.516852 | 40.187 | 18.754 |
| Total | 100.274 | 100 | 100.274 | 100 | 100.274 | 100 | 0 | 0 |
Table 6.
LULC change matrix of 1995 – 2010 and 2010 - 2023.
| Year | 2010 | |||||||
| 1995 | Classes | Built-up | Crop | Grass | Forest | Barren | Grand Total | |
| Built-up | 6.564958 | 0.036263 | 0.276567 | 0.152676 | 0.060284 | 7.0907475 | ||
| Crop | 8.879653 | 31.25843 | 15.59571 | 1.353066 | 4.916062 | 62.002927 | ||
| Grass | 3.03436 | 2.928003 | 4.12759 | 1.558342 | 0.307829 | 11.956124 | ||
| Forest | 3.629646 | 0.341267 | 4.14099 | 6.83569 | 0.059811 | 15.007403 | ||
| Barren | 0.522253 | 2.252796 | 0.607479 | 0.062593 | 0.772745 | 4.2178666 | ||
| Grand Total | 22.63087 | 36.81676 | 24.74834 | 9.962367 | 6.11673 | 100.27507 | ||
| Gain | 16.06591 | 5.558329 | 20.62075 | 3.126677 | 5.343985 | |||
| Loss | 0.525789 | 30.7445 | 7.828535 | 8.171714 | 3.445122 | |||
| Net change | 15.54012 | -25.1862 | 12.79222 | -5.04504 | 1.898864 | |||
| Year | 2023 | |||||||
| 2010 | Classes | Built-up | Crop | Grass | Forest | Barren | Grand Total | |
| Built-up | 19.62866 | 0.77681 | 1.145546 | 0.68501 | 0.393375 | 22.629401 | ||
| Crop | 11.43747 | 12.38515 | 7.603771 | 0.53666 | 4.850245 | 36.813297 | ||
| Grass | 8.726522 | 6.110376 | 7.280488 | 1.632094 | 0.999423 | 24.748904 | ||
| Forest | 1.748153 | 0.455484 | 2.142511 | 5.530249 | 0.084839 | 9.9612361 | ||
| Barren | 3.658679 | 0.66107 | 0.774067 | 0.054631 | 0.967554 | 6.1160015 | ||
| Grand Total | 45.19948 | 20.38889 | 18.94638 | 8.438645 | 7.295436 | 100.26884 | ||
| Gain | 25.57082 | 8.003739 | 11.6659 | 2.908395 | 6.327882 | |||
| Loss | 3.000741 | 24.42814 | 17.46842 | 4.430987 | 5.148447 | |||
| Net change | 22.57008 | -16.4244 | -5.80252 | -1.52259 | 1.179434 | |||
Table 7.
Urban expansion intensity indices.
| Year | UEII | Category |
|---|---|---|
| 1995 – 2010 | 1.04 | Medium-speed |
| 2010 - 2023 | 1.67 | Fast-Speed |
Disclaimer/Publisher’s Note: The statements, opinions and data contained in all publications are solely those of the individual author(s) and contributor(s) and not of MDPI and/or the editor(s). MDPI and/or the editor(s) disclaim responsibility for any injury to people or property resulting from any ideas, methods, instructions or products referred to in the content. |
© 2024 by the authors. Licensee MDPI, Basel, Switzerland. This article is an open access article distributed under the terms and conditions of the Creative Commons Attribution (CC BY) license (http://creativecommons.org/licenses/by/4.0/).
Copyright: This open access article is published under a Creative Commons CC BY 4.0 license, which permit the free download, distribution, and reuse, provided that the author and preprint are cited in any reuse.


