Submitted:
25 August 2025
Posted:
26 August 2025
You are already at the latest version
Abstract
Urban expansion is a pervasive global phenomenon with profound environmental, social, and economic implications, particularly in rapidly developing regions. This paper presents a spatiotemporal analysis of urban expansion in Debark Town, Ethiopia. In this study, machine learning algorithms, such as the random forest algorithm and support vector machine, were investigated for satellite image classification to observe spatiotemporal urban land cover changes. The Google Earth Engine has been utilized to pre-process the Landsat 7, 8, and Sentinel-2 Landsat imagery. Classification accuracy was assessed using an 80:20 training-to-testing split. RF demonstrated higher classification performance with overall accuracies of 95.86% (2000), 95.9% (2015), and 97.29% (2025), outperforming SVM’s 95%, 93.06%, and 93.74% respectively. The research revealed that feature changes occurred during such transition periods. The results revealed agricultural land decreased markedly from 12,384.65 hectares (71.45%) to 7,951.21 hectares (45.88%), and urban land increased built-up areas from 780 hectares (4.50%) in the year 2000 to 2,741.52 hectares (15.82%) in the year 2025, an increase of approximately 1,961.55 hectares, or 11.32%. Furthermore, urban land rose rapidly due to declining vegetative cover, and the built-up areas increased at a rate of 78.46 ha per year. Overall, this research offers useful information regarding the urban land cover change that can assist decision makers, natural resource managers, and policymakers in making the right decisions. This concluded that urban expansion in the research area occurred, and subsequently, urbanization occurred at a high rate within the past years, leading to a decline in agricultural lands.
Keywords:
Classification
; Google Earth Engine
; Machine Learning
; Urban Expansion
; Satellite Image
; Spatiotemporal Analysis
1. Introduction
Globally, urban expansion refers to the development of cities (Schneider & Woodcock, 2008). In addition, urbanization is defined as the process that involves transforming rural civilization into an urban one, followed by changes to the landscape (Gharaibeh et al., 2023). Urbanization is a primary driver of land use and land cover transformation in urban areas (Moisa et al., 2022). Today, urban expansion is a complex geographical and demographic process in which cities and urban settlements are viewed as centers of population focus owing to their distinctive economic and social traits, which represent an important component in the evolution of human civilizations (Dadras et al., 2015). The United Nations reported that just 13% of the world's population resided in cities in 1990. However, during the last two decades, the number of urban people has significantly outpaced their counterparts in the periphery. The concept of urban expansion is a rapidly changing and complicated phenomenon; it frequently involves detrimental changes in land use and land cover (Gondwe et al., 2021).
Africa is considered the least urbanized region, with just 43% of its inhabitants living in cities compared to Asia and Europe. Although its urban development and people are not well recorded (Hamud et al., 2021). Rapid urbanization is frequently responsible for the worsening of urban eco-environmental quality, which includes ecological, environmental, and anthropogenic components (Pramanik et al., 2022). Additionally, Ranagalage et al., (2020) presented that rapid urbanization in a country's largest cities creates challenges for long-term development. The process of fast urbanization is poorly understood, particularly in Africa, and most studies focus on single cities.
Similarly, in the theoretical literature, it is stated by (Bedada et al., 2024) that Ethiopia has experienced significant LULC change in recent years, particularly due to growth in population, agricultural development, urban development, and overgrazing. The previous study presents a detailed comparative examination of the growth and spatial patterns of urban development in Ethiopia's three largest cities (Addis Ababa, Adama, and Hawassa) from 1987 to 2017 (Terfa et al., 2019). In comparison to urban expansion in the Valley, the rate of population growth has accelerated (Sofi, 2005). Understanding urban expansion spatiotemporally is vital for landscape and urban development planning utilizing remote sensing data and GIS technologies (Subasinghe et al., 2016).
Numerous studies have provided novel insights into understanding urban land dynamics, and their causes are crucial to managing and forecasting both urban growth and its associated environmental aspects (Shifaw et al., 2020). Referring to the 2025 report by Hassen et al., ( 2025) on the rapid urban expansion and impact on agricultural land reduction in central Ethiopian metropolitan districts (Addis Abeba and Sheger City), it emphasized these concerns while also providing opportunities for sustainable development. In contrast, Ethiopia has a low degree of urbanization, even by African standards, with just 18% of the population residing in urban areas, 23% of whom live in metropolitan Addis Ababa (Deribew, 2020). According to Regassa et al., (2020), Unexpected urban growth is currently a significant problem, particularly in developing nations where reliable and consistent data, including spatial data, is difficult to obtain.
Some studies in Ethiopian towns have some research to examined urban growth and how it reacts to the environment. For instance, Barow et al., (2019) examined Jigjiga town's spatiotemporal changes throughout the previous thirty years. The quantification of the LULC dynamic in Hawassa city over thirty years using remote sensing and group action geographic information systems (Tessema & Abebe, 2023).
This study addresses the gap of previous studies related to the limited availability of high-quality, cloud-free satellite imagery; model performance; unbalanced training sample selection; preprocessing techniques; diverse feature extraction methods; spatial differences; and temporal changes. This study overcomes such challenges by using machine learning algorithms to improve the accuracy, efficiency, and scope of urban growth assessments. By utilizing the capabilities of strong machine learning algorithms, this study seeks to deliver more precise classification of features, such as bare land, built-up areas, agriculture, and vegetation, to enable better-informed and more sustainable urban planning processes.
The objective of this paper are: (i) to evaluate the effectiveness of machine learning (ML) models in accurately classifying these LULC categories, such as random forest, and support vector machine, (ii) to simulate urban expansion using remote sensing data and machine learning techniques, and (iii) analyzed the trend, and rate of urban expansion by utilizing multi-temporal satellite imagery, enabling a comprehensive understanding of how the urban environment has evolved.
Google Earth Engine is a popular tool that has recently gained a lot of popularity as a massive cloud-based system for global geospatial analysis. It leverages Google's enormous computing power to enable clients to easily view and consider satellite imagery. Tesfaye et al., (2024) had conducted Google Earth Engine (GEE), with its multiple machine learning algorithms, which have become the most powerful open-source worldwide platform for speedy and accurate LULC categorization. Generally, this study bridges the knowledge gap by utilizing machine learning algorithms to map built-up areas in analyzing urban expansion in Debark Town. Machine learning algorithms were renowned due to their effectiveness in managing remote sensing data and their proven ability in classifying and mapping land cover accurately. In the context of Google Earth Engine (GEE), they produce precise and reliable land cover classification results by effectively handling complex spatial relationships and processing large-scale geospatial data.
The (Coq-Huelva & Asián-Chaves, 2019) established sprawl as a form of undesirable urban growth, which is defined as fast-paced and unplanned development that often leads to the deterioration of agricultural land and the challenges facing infrastructure planning. Globally, urban processes have been transformed immensely in the last two decades, converting previously stable geographies into highly expanding urban centers. Urban planners and resource managers, hence, require reliable tools to efficiently monitor the impact of urban expansion. For instance, the Urban sprawl was evaluated, according to (Bedada et al., 2024), to significantly influence land use and land cover (LULC) pattern changes, which primarily have negative environmental and socio-economic consequences. Furthermore, prior research has shown notable changes in land use and land cover (LULC), with an increase in built-up regions, lake bodies, and bare land and a decrease in mangroves, bushes, agriculture, and salt areas. Over the past 33 years, Djibouti's predominant land cover, bush land has been significantly transformed into urban centers, lake bodies, and bare ground. Additionally, the researchers assessed the Random Forest (RF) algorithm's performance in classifying land uses and analyzing temporal changes (Pandit et al., 2024). Hassen et al., (2025) used supervised random forest classification based on the Google Earth Engine (GEE) to generate LULC maps for 1990, 2000, 2010, and 2023. Their study implemented an all-encompassing analytical strategy, which comprised intensity analysis at interval, categorical, and transitional scales to quantify urban expansion patterns, as well as gradient direction and distance analyses to assess spatial extent patterns. Similarly, Mutale et al., (2024) used Random Forest and Support Vector Machine classifiers within GEE to analyze atmospherically corrected, cloud-free surface reflectance imagery for selected years. These papers together show the effectiveness of merging cloud-hosted geospatial platforms and machine learning algorithms for monitoring and analysis of temporal urban growth patterns.
Durowoju et al. (2025) proved that the use of Google Earth Engine and machine learning algorithms can be used to study the dynamics of urban change. Their results showed that there are significant environmental changes in the study area, such as a 26.17% decline in bare surfaces and a whopping 95.79% reduction in water bodies over three decades. In the same way, Ouma et al. (2023) applied and tested the performance of various machine learning classifiers, and multi-temporal and multisensory Landsat imagery was employed in their study. Machine learning is a common tool for urban cover change evaluation.
This study enhanced the accuracy of urban land cover mapping and expansion forecasting in Debark town by applying machine learning algorithms, specifically random forest and support vector machine, to detect spatial patterns and trends beyond human capability. The findings provide reliable insights for informed decision-making, supporting sustainable urban planning, infrastructure development, and effective land use management.
2. Materials and Methods
This study adopted a comprehensive methodology tailored for cloud-based geospatial analysis, integrating multi-temporal satellite imagery with Machine Learning techniques on the Google Earth Engine platform.
2.1. Study Area
The study area is located in Debark town (see Figure 1), encompassing approximately 17,330 hectares within the Amhara National Regional State (ANRS) in northwestern Ethiopia. Located about 843 kilometers northwest of Addis Ababa, Debark was selected due to its strategic role as a gateway for travelers visiting the Simien Mountains National Park a UNESCO World Heritage Site (Desta & Gugssa, 2022). It functions as the center of the North Gondar zone. However, such growth brings pressure on existing infrastructure, the establishment of Debark University, and population growth. Administratively, Debark Town is divided into eight kebeles: Zebena, Debir, Mikara, Kino, Kirar Wegamba, and Debark Town Kebeles 01, 02, and 03. Geographically, it lies between longitudes 37º24'50''E and 37º56'56''E, and latitudes 13º02'28''N and 13º12'20''N. The elevation ranges from 1,993 to 3,207 meters above mean sea level (AMSL), with the northern region of the study area featuring some of the highest altitudes in Ethiopia.
2.2. Dataset
The United States Geological Survey (USGS) provides access to Landsat and Sentinel data in GEE (Loukika et al., 2021). This paper used multi-temporal Landsat satellite imagery gathered from the USGS over three different years: 2000, 2015, and 2025. These data were the backbone of our analysis (see Table 1). The ETM+ sensor provides high-resolution, multispectral imagery of Earth's surface. It generates eight spectral bands in blue, green, red, NIR, and mid-infrared (MIR). Bands 1-5 and 7 have a 30-meter resolution; it had a 185 km swath, 8-bit radiometric resolution, and 16-day revisited temporal resolution (Sigopi et al., 2024).
In historical studies, Landsat imagery is composed of data from multiple spectral bands; it has a 185 km swath, 12-bit radiometric resolution, and 16-day revisited temporal resolution, each capturing different parts of the electromagnetic spectrum (Dharani & Sreenivasulu, 2021). Sentinel-2 was a high-resolution multispectral imaging mission that enabled Copernicus Land Monitoring studies, which included the observation of vegetation, water cover, inland water bodies, and coastal areas. It had a 290 km swath, 12-bit radiometric resolution, and 5-day temporal resolution (equator-dependent) (Park et al., 2021).
In this study, a systematic procedure was followed to select the most appropriate Landsat spectral bands for accurate land cover classification. A wide range of spectral bands was utilized, including the blue, green, red, near-infrared (NIR), shortwave infrared 1 (SWIR1), and shortwave infrared 2 (SWIR2) bands (Roy et al., 2014).
Modern platforms like Google Earth Engine (GEE), ArcGIS 10.3, and QGIS significantly enhanced the precision and efficiency of LULC classification and spatial analysis. GEE and Python were also employed for applying machine learning algorithms, generating random sample points, and improving data visualization.
2.3. Methods
2.3.1. Data Preprocessing
The preprocessing refers to changing the raw data into a computer-readable format that the computer and machine learning algorithms could understand and analyze. This study involved several image preprocessing steps to ensure data quality and accuracy. These steps included masking clouds, applying geometric correction to the UTM Zone 37s projection, performing radiometric correction, stacking the image layers, applying pan-sharpening techniques, and creating appropriate band combinations for analysis. The scholars (Deep. et al., 2017) have discussed four stages in remote sensing image processing: preprocessing, enhancement, transformation, and classification. Preprocessing corrects any radiometric, atmospheric, or geometric distortions in the raw image data. Following this (see Figure 2), supervised classification was applied individually to the datasets from each year. All datasets were standardized to align with the study area's boundaries and projected using the UTM Zone 37 North in the WGS-84 coordinate system to ensure consistency and accuracy in spatial analysis.
2.3.2. Train and Testing Split
In developing a machine learning model for urban expansion analysis from satellite images, the dataset was labeled and divided into training and testing. The scholar Ouma et al., (2023) concluded that visual identification and interpretation of the Landsat imagery were used to obtain the training and testing data samples. In addition Sahak et al., (2024) conducted 80% of the data were employed for training purposes, while 20 % were kept for testing for each of the algorithms.
The training and testing sample distribution utilized for urban land use and land cover (LULC) classification in 2000, 2015, and 2025 Table 2 illustrates the training and testing sample distribution utilized for urban land use and land cover (LULC) classification in 2000, 2015, and 2025. In Google Earth Engine, points representing various land cover classes were manually digitized to prepare the training data. A total of 2055, 2450, and 2395 ground truth samples were collected, including 530, 621, and 603 samples each for bare land and agricultural land, 490, 593, and 586 samples for built-up areas, and 505, 615, and 603 samples for vegetation in each year’s respectively. These samples were split into training and testing datasets using by 80 to 20 ratios via a random sampling technique, resulting in 1644, 1960, and 1916 samples for training and 411, 490, and 479 samples for testing, respectively.
2.3.3. Implementing the ML Algorithm
For urban land cover classification, we employed machine learning algorithms, such as support vector machines (SVM) and ensemble classifiers based on random forest (RF). Machine learning algorithms have been proven to be highly effective for image analysis operations, e.g., land-use classification, simulation, and predictive analysis (Mostafa et al., 2021).
Furthermore, urban growth patterns along with their driving factors have been geospatially and statistically modeled by researchers using ML algorithm classifiers (Kang, 2019). Existing technologies, particularly machine learning (ML) techniques, a subfield of artificial intelligence, are increasingly being employed for remote sensing (RS) data analysis and earth observation studies. These are essential tools to be employed by data scientists as well as by decision-makers when analyzing and making conclusions from large datasets. Vishwakarma (2024) describes ML as the study of algorithms that allow systems to learn from experience and improve over time. It is a strategy for teaching machines how to manage data more effectively. Machine learning algorithms create models based on existing data, which can then be used to predict future data. The (Puttinaovarat & Horkaew, 2017) was developed through a learning process that extracts useful patterns from previously observed data during the system’s data generation process.
Random forest (RF)
Random Forest (RF) is among the most widely used machine learning algorithms available. Another more recent land cover classification technique is with ensemble methods, such as Random Forests (Gu et al., 2023). Strong in its operation, this algorithm relies on making multiple decision trees and then producing an output after taking their outputs to create the right output (Hamud et al., 2021). Researchers from different backgrounds are drawn to (Ouma et al., 2023), the RF is an ensemble of k random decision trees with at most a root node and trained on M bootstrap samples. In contrast to the traditional parametric multispectral image classification techniques, this study employed the non-parametric random forest classifier to classify the Landsat image.
Support Vector Machine (SVM)
The SVM algorithm is a supervised machine learning classifier. Mantero et al., (2004), demonstrated that SVMs are commonly applied in RS images because they can outperform traditional practices in terms of accuracy in classification, even when smaller training datasets are used. The SVM method uses support vectors to determine the best separating hyper plane by maximizing the class boundaries, a non-parametric statistical learning technique in which a hyper plane is formed to separate of different classes in such a way that the distance (margin) of the examples that are closest to it is maximized (Kuhn & Johnson, 2013) (Megahed et al., 2015) (Ouma et al., 2023).
Hyperparameter tuning
Grid Search was utilized as a systematic hyperparameter tuning technique in this research work to improve the performance of ensemble machine learning algorithms, support vector machines (SVM), and random forests (RF), for urban land cover classification (Chowdhury, 2024). Therefore, it helps to find the optimum set of parameters that leads to the most accurate model and overall model performance, ensuring good and stable classification results.
For the Random Forest model, achieving high accuracy in urban land cover classification involved fine-tuning Hyperparameters using a grid search approach. The chosen settings n_estimators = 1000, max_features = 16, min_samples_leaf = 10, bootstrap = 0.8, and random_state = 42 strike a balance between accuracy, generalization, and reproducibility, with 1000 trees enhancing stability and 16 features per split supporting robust decision-making within each tree.
The SVM algorithm’s performance in classifying urban land cover is highly influenced by key hyperparameter: kernel type, gamma (γ), and cost (C). In this study, using an RBF kernel with gamma = 0.1 and cost = 100 enabled the model to effectively capture complex, non-linear spatial patterns while balancing flexibility and generalization making it well-suited for high-dimensional land cover classification tasks.
2.3.4. Image Classification
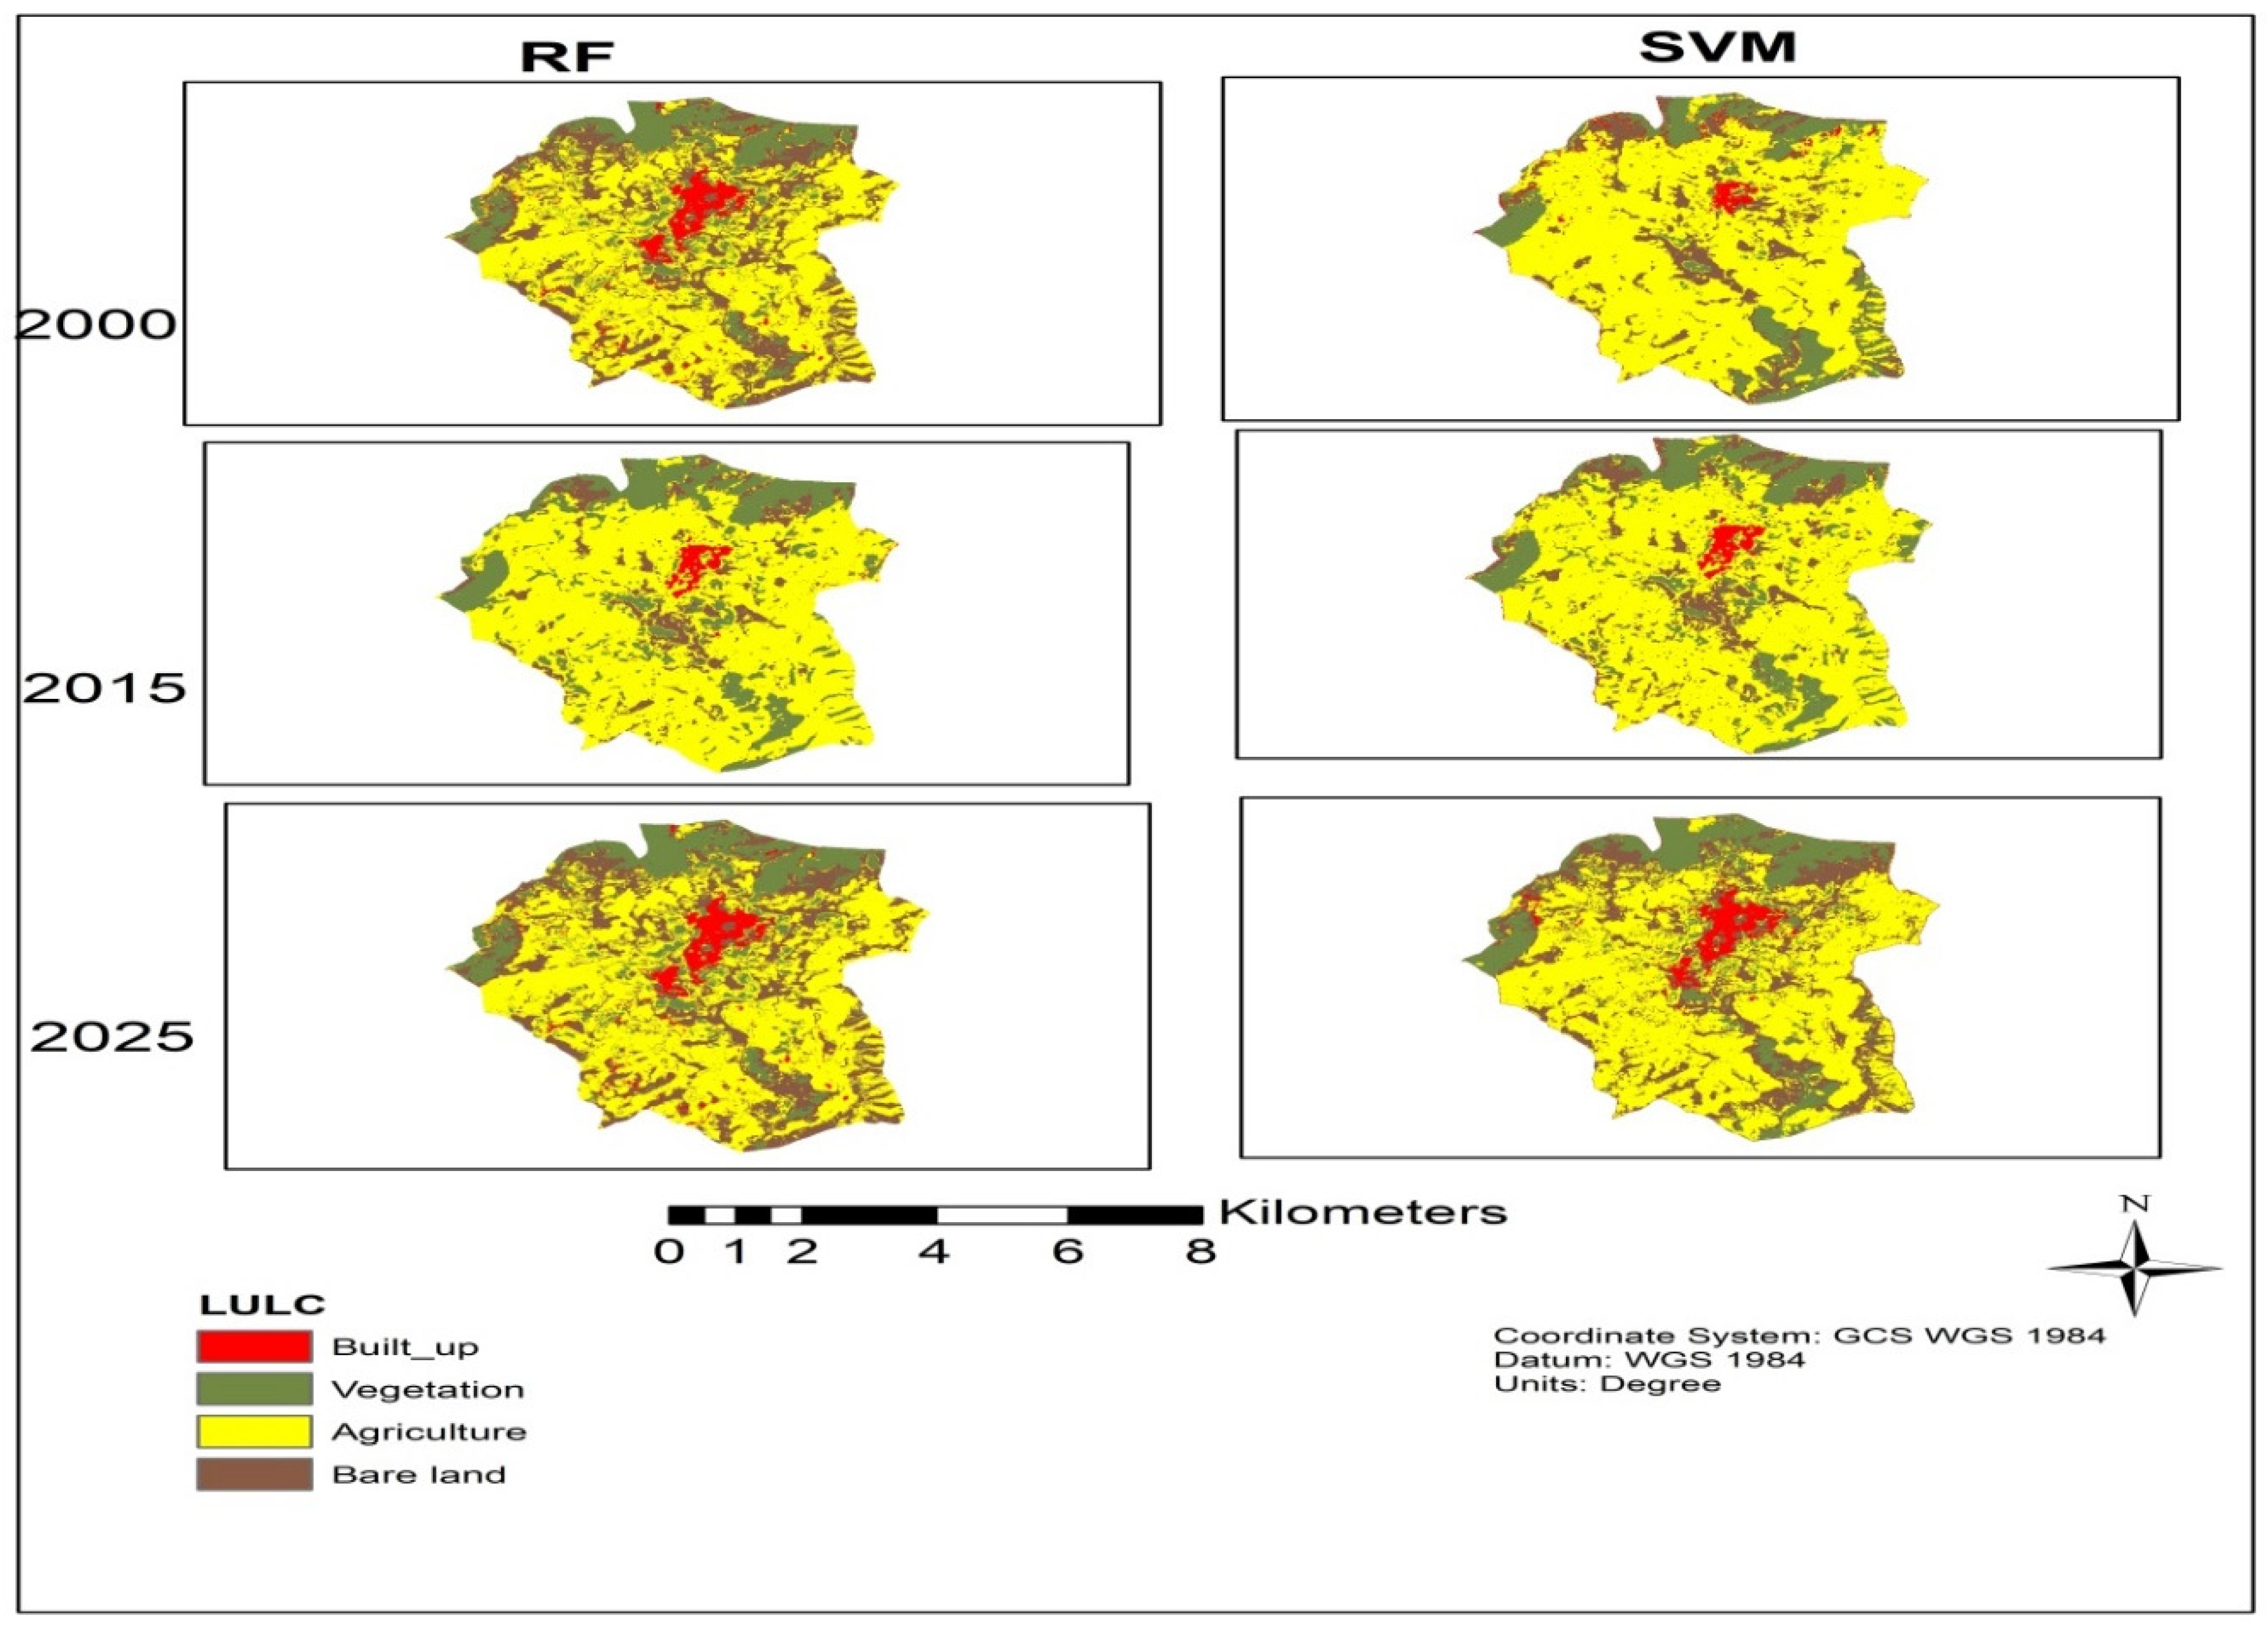
The process of classifying satellite images used two machine learning methods, random forest (RF) and support vector machine (SVM), to create maps showing how land was used in urban areas for the years 2000, 2015, and 2025. Applying both classifiers to multi-temporal satellite images, the study was able to capture spatial and temporal land cover changes effectively as urban expansion, vegetation patterns, agricultural practices, and land degradation. Detecting, recognizing, and classifying multiple objects according to their true classifications on the ground is made practical by image classification, a very efficient technique for analyzing satellite image data (Sapkota et al., 2024). According to (Tikuye et al., 2023)(Sahak et al., 2024), four broad LULC types were classified for the selected satellite images based on previous literature on LULC classification in study (Pushpalatha et al., 2024)(Khan & Sudheer, 2022). As shown in Figure 3, we obtained our preliminary urban land cover classification results by training and testing supervised classifiers on GEE Random Forest (RF) and Support Vector Machines (SVM) on the Sentinel-2 and Landsat image composites.
The visualization of the Landsat images taken in the years 2000, 2015 and 2025 exhibits clear trends. Urban land use land cover (LULC) classes of the study area as differentiated by the maps into four prevalent classes conventional colors are built-up (red), vegetation cover (green), agricultural land (yellow), and bare land (brown). The study was divided into four distinct classes (built-up, vegetation, agriculture, and bare land) utilizing the machine learning supervised classification algorithm. A detailed explanation of each class is provided in Table 3 (Gawali, 2009).
2.3.5. Accuracy Assessment
Land use and land cover (LULC) classification was accomplished by the Random Forest and Support Vector Machine algorithms within the Google Earth Engine (GEE) environment. An accuracy assessment of the generated classification was then carried out to ensure the validity and credibility of the study's findings. Accordingly, Gessesse et al., (2015) has significantly contributed to improving the sample generated by the stratified random sampling reference data collection technique, accuracy evaluation indices comprising the producer's accuracy (also known as “recall”), user's accuracy (also known as “precision”), and overall accuracy, as well as the Kappa coefficient of agreement, which were adjusted to the known areal fraction of map categories (Tassi et al., 2021). With greater sensitivity and specificity, the F-score is a composite metric that assesses algorithm reliability (Abdi, 2020) (Sokolova et al., 2006).
- ❖
- Overall Accuracy (OA): is the number of pixel correctly classified by the total number of instances, indicating the extent to which the classification outcomes match the reference data (Al-Saady et al., 2015).
- ❖
- Recall: The link between true positives and the sum of true positives and false positives is another way to define PA, or recall the omission error's complement is the PA.
- ❖
- Precision: the relationship between true positives and the overall number of true positives and false negatives is another definition of the UA, or precision (Yang et al., 2025). The commission error's complement is the UA.
- ❖ Kappa coefficient: measures agreement between predicted and actual classifications while correcting for chance agreement. One of the most widely utilized accuracy indicators (Bedada et al., 2024), the accuracy of land use classification in this study, was tested using the Kappa coefficient.
2.3.6. Change Detection
The maps were utilized to determine the urban LULC class regions and the urban LULC analysis and change rates to determine. Based on the previous studies (Bedada et al., 2024), highlighted that it was tested that the analysis of the urban LULC change was computed using equation (5).
Where, AF is the final produced urban LULC area in ha, and Ai is the previous area of urban LULC (e.g., urban LULC at an earlier time t) in ha.
- ❖
- Rate of change (RC)
For every urban LULC type, the yearly rate of change was determined using Equation 6 (Molla et al., 2024) (Zhang et al., 2020) using the data derived from the remote sensing image analysis. The urban expansion rate (UER) was adopted to evaluate the changes in urban coverage over a certain period of time and was the main indicator of changes in urban expansion.
Where UER is the urban expansion rate of the annual rate of change, Ai and Af are the areas of a class in time one and time two classification maps, respectively, and Δt is the time interval between time one and time two classification maps.
3. Results
3.1. Image Classification and Accuracy Assessment
In urban land cover classification, remote sensing data play a crucial role. The accuracy of such maps depends on various factors, including the choice of classification algorithms, the quality of training and testing data, the complexity of the urban environment, and the specific satellite datasets employed. The study illustrated the classification result obtained from three different satellite missions of different years. Satellite imagery from Landsat 7, Landsat 8, and Sentinel-2 was utilized to classify land cover into distinct classes: built-up areas, vegetation, agriculture, and bare land. Feature extraction was guided by a combination of literature review and expert knowledge of the study area of band composition.
In this study, two supervised classification methods were evaluated on the 2000, 2015, and 2025 dataset. As shown in Figure 4 and illustrated in Table 4, and then we used a testing dataset that was distinct from the training datasets to evaluate the accuracy of each classifier. Generally, the study area was separated into four mutually exclusive classes: built-up, vegetation, agriculture, and bare land for each year under consideration, allowing appropriate insight into land cover dynamics over the years.
Figure 4.
Classification results with SVM, and RF, in 2000, 2015 and 2025 years.
3.2. Accuracy Assessment and Comparison of Classification Models
The experiments were conducted to select the optimal classification model and develop suitable classification methods. Each experiment involved applying machine learning algorithms to satellite data with four varied features assigned by the researchers. To have a comprehensive evaluation, three different experiments were conducted using two popular machine learning algorithms: random forest and support vector machine. For all three experiments and both algorithms, the same list of objective-based measuring metrics was used. These included accuracy, precision (user accuracy), recall (producer accuracy), and the Kappa coefficient, allowing direct comparison of model performance. In these findings, the researchers conducted a total of three experiments, and four land cover classes were used in each experiment. The features that were identified were used as input in developing a classification model for analyzing urban cover change in Debark town.
According to Table 4, a comparison of the overall performance of the SVM and RF models in the years 2000, 2015, and 2025 reveals that the RF model has better performance than the SVM in nearly all the metrics taken into consideration. RF has better overall accuracy in all three years: 95.86% (2000), 95.9% (2015), and 97.29% (2025), compared to SVM's 95%, 93.06%, and 93.74%, respectively. In addition, the Kappa coefficient, which measures reliability of classification, also favors RF, increasing from 94.15% in 2000 to 96.32% in 2025, indicating more consistent agreement between predicted and actual classes. Conversely, SVM has declining Kappa values with time (93.94% in 2000 to 91.5% in 2025), suggesting a relative decline in classification reliability.
Figure 5.
omparison of user and producer accuracy of a) 2000 (RF, SVM), b) 2015(RF, SVM), and c) 2025(RF, SVM) models for urban LULC classes.
Figure 5.
omparison of user and producer accuracy of a) 2000 (RF, SVM), b) 2015(RF, SVM), and c) 2025(RF, SVM) models for urban LULC classes.
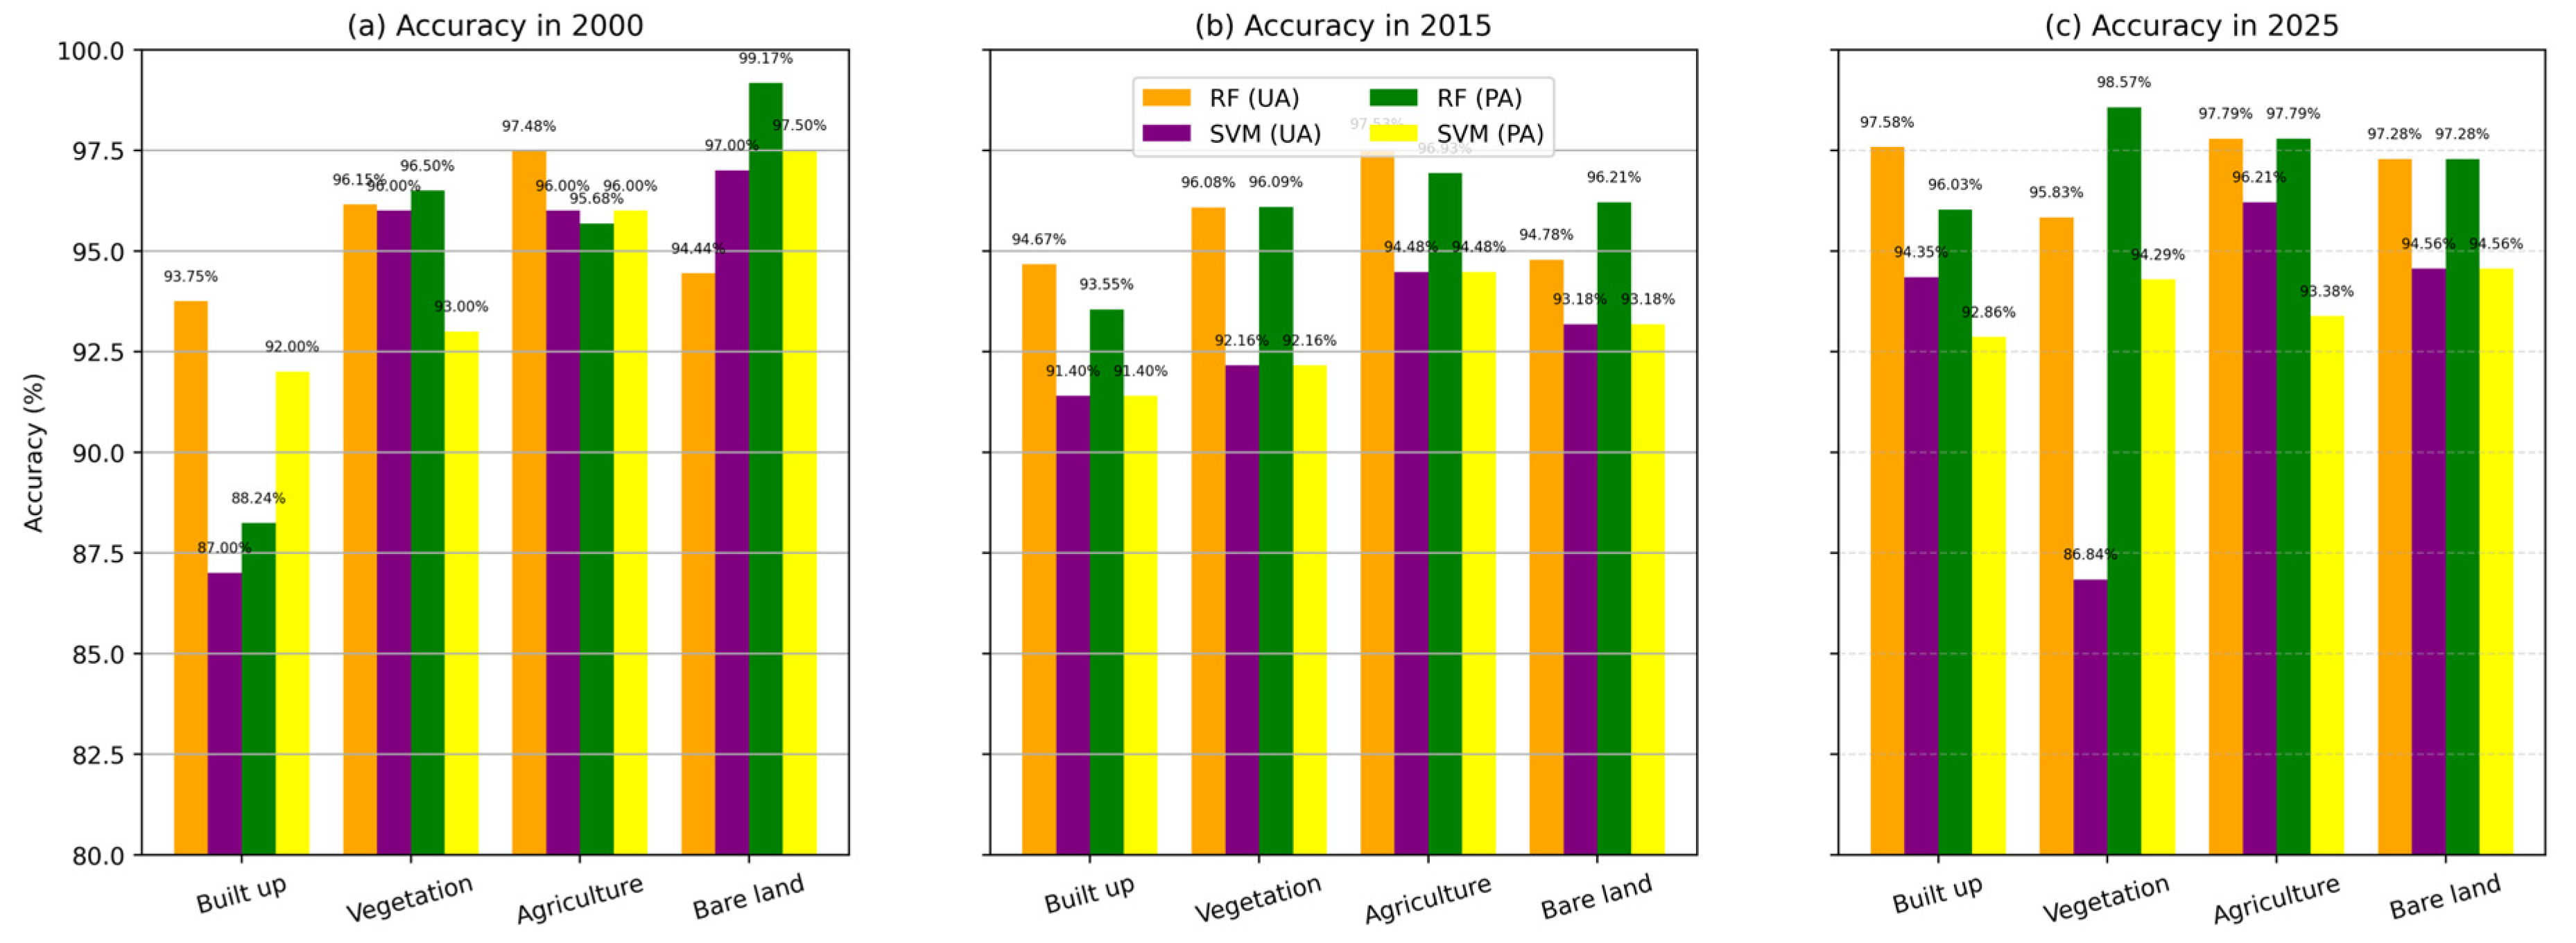
For example, in 2025, RF gets high user accuracy (precision) of 97.58% in built-up area and 97.28% in bare land, whereas SVM is just 94.35% and 94.56%, respectively. RF also obtains higher producer's accuracy (recall) for vegetation (98.57%) and built-up (96.03%) in the year 2025, indicating higher sensitivity in identifying these classes. SVM, however, exhibits more variability and an overall declining trend in the performances of the prominent classes; in other words, vegetation accuracy falls to 86.84% for 2025.
3.3. Urban Simulation
The urban land cover simulation of the study area as it existed in 2000-2025, as evident from Figure 6, shows four dominant land cover types: urban land, vegetation, agricultural land, and bare land. The dominant land cover component was agricultural land that occupied the majority of the land. This implies that the region was primarily used for agriculture and other related agricultural activities throughout the time. Conversely, built-up areas or development occupied the lowest percentage of land cover, with only slight urbanization and a relatively low level of infrastructure extension in 2000.
3.4. Change Detection Between 2000 and 2025
This study applied two machine learning classification methods, random forest (RF) and support vector machine (SVM), on Landsat and Sentinel satellite imagery. This finding selected the optimum algorithm for each image from their performance as described in the above section. Urban growth was analyzed by measuring pixel-level change from 2000 to 2015 and 2000 to 2025.
Figure 7.
Land covers change detection in the years of 2000-2015, 2015-2025 and 2000-2015.
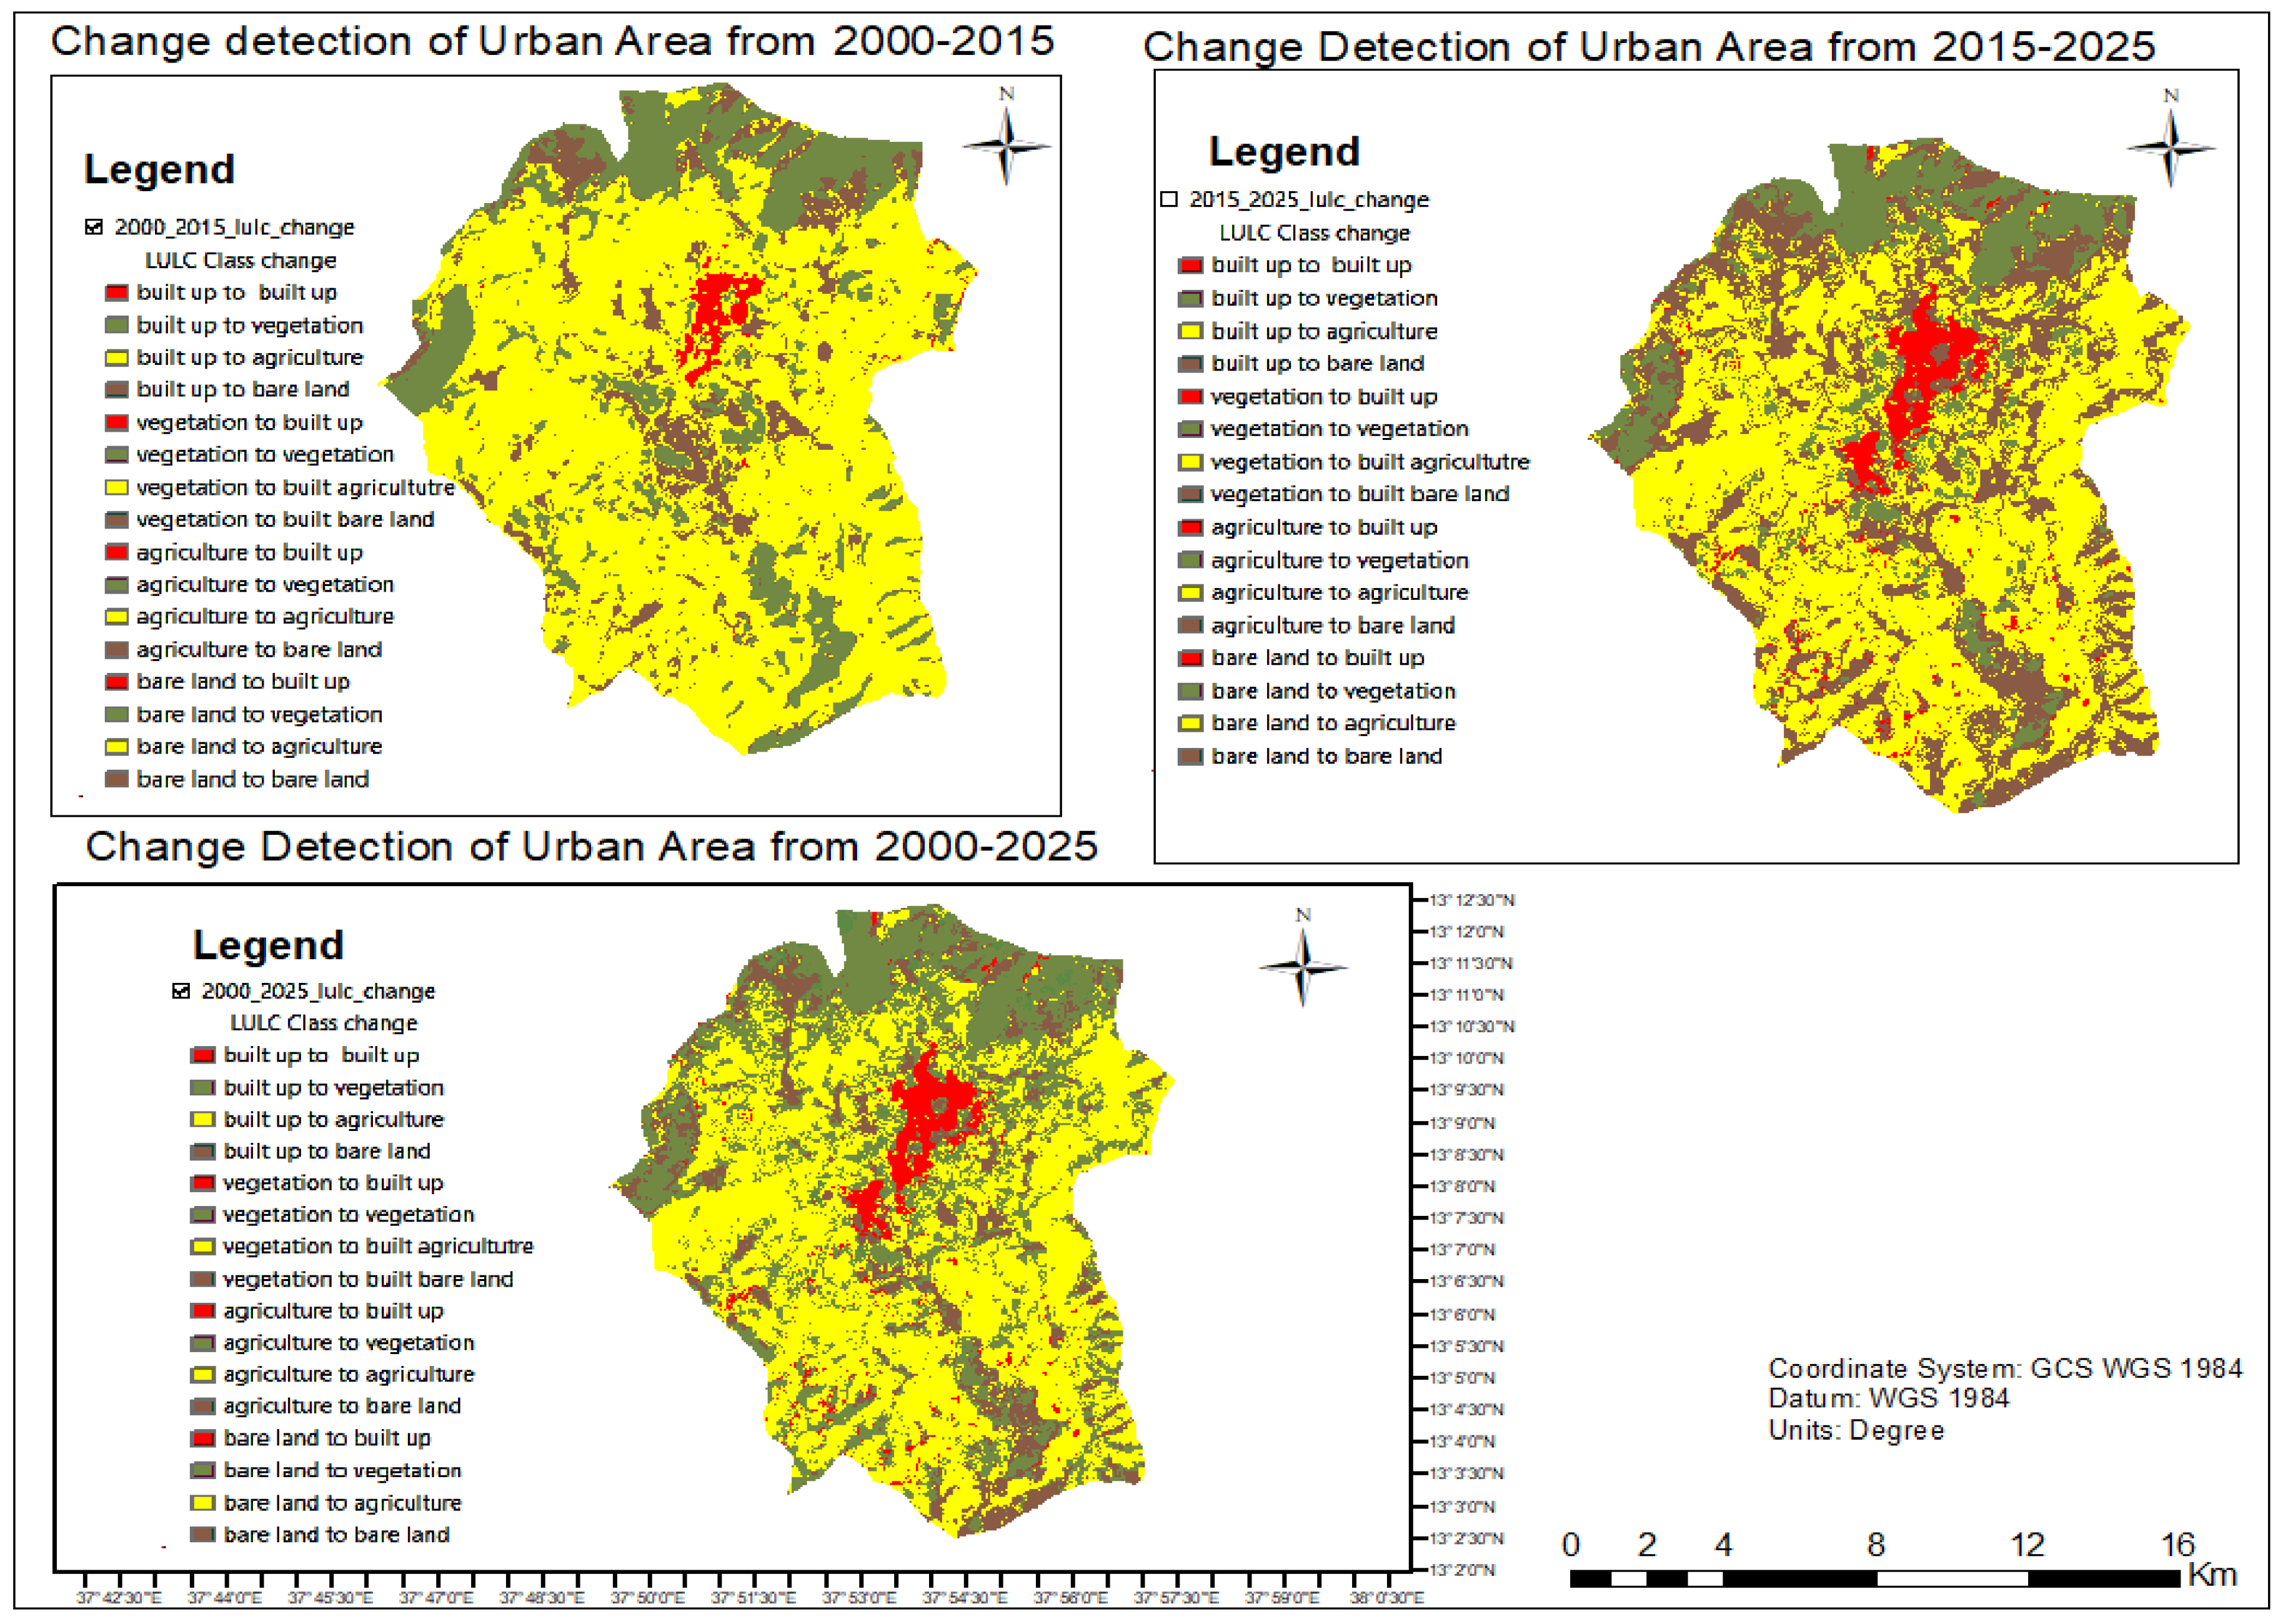
Between 2000 and 2015, as is clear from Table 5 bellow, urban land cover (LC) in the study area experienced significant change, indicating dynamic socio-economic as well as environmental changes. Figure 8 shows a visual comparison done through overlaying three satellite images captured in different years to assess the extent of built-up area expansion. The research confirms that for the 25 years of study, urbanized areas expanded noticeably in all directions except northeast and covered other categories of urban land use and land cover (LULC), such as vegetation, agricultural land, and bare land.
The expansion in space implies the process of ongoing urbanization and its effects on the landscape. The most obvious land cover alteration between 2000 and 2015 was the significant expansion of built-up areas, which grew from 779.97 ha (4.50%) in 2000 to 1,875.65 ha, (10.82%) in 2015. That represents 1,095.68 ha (6.32%) increase, revealing fast urbanization and infrastructural development caused by population growth and settlement expansion. As indicated in Table 5, the built-up area of Debark town expanded steadily over the study years. In the early 2000s, built-up areas were highly fragmented.
The spatial trend and magnitude of these changes are represented graphically in Figure 8 presenting a concise graph of the evolving urban form. The figure is a critical element in understanding each trend and pattern shaping ULULC conversion within the study area.
The urban land cover (LC) data considered for 2015-2025 gives pivotal trends of land use for the area. Specifically, the urban area has recorded phenomenal growth, from 1,875.646 ha (10.82%) in 2015 to 2,741.515 ha (15.82%) in 2025. This increase of approximately 865.87 ha accounts for an impressive rise of 5%, reflecting enhanced urbanization and development. Conversely, the area of vegetative cover declined significantly from 3,013.55 ha (17.39%) to 2,033.85 ha (11.74%), translating into a loss of about 979.70 ha and signifying a decline of 5.65%.

Table 6.
Area of LC change between 2015 and 2025.
| LULC Class |
Area 2015(ha) |
Area 2015(%) | Area 2025 (ha) | 2025 Area (%) |
Change (ha) |
Change Area (%) |
| Built up | 1875.646 | 10.82% | 2741.515 | 15.82% | +865.869 | +5.0% |
| Vegetation |
3,013.55 |
17.39% | 2,033.85 | 11.74% |
−979.700 |
-5.65% |
| Agriculture |
10,696.33 |
61.69% | 7,951.21 | 45.88% |
−2,745.120 |
-15.81% |
| Bare land |
1,744.90 |
10.07% | 4,604.01 | 26.56% |
+2,859.110 |
+16.49% |
The urban LC statistics between 2000 and 2025 below Figure 9 indicated that drastic alterations in most of the land use categories suggested a dramatic overhaul of the landscape. Typically, the built-up area increased from 779.969 hectares (4.50%) to 2,741.515 ha (15.82%), representing a rise of approximately 1,961.55 ha or 11.32%. This growth suggests a vigorous process of urbanization, most likely driven by an expansion of the population and consolidated infrastructure development.
The spatial arrangement and trends (see Figure 10) of geographic features was obtained by subjecting the classified images to spatial analysis; the information about changes in land cover proportion was derived. Subsequently, changes in the spatial composition of geographic features were obtained by comparing the classified images of 2000, 2015 and 2025 against each. In the present study, the analysis of urban land use increased by approximately 4.5% to 15.82% in 2000–2025 in the study areas, and the expansion of built-up areas mostly occurred over agricultural land. Built-up areas increased rapidly throughout the 25-year period, according to the spatial data obtained via the temporal analysis of land cover graphs
Annual Rate of Urban Expansion
From 2000 to 2025, the area of investigation experienced significant land cover alteration, with urbanized land increasing very rapidly at an average annual rate of 78.46 ha, equivalent to a year-over-year percentage increase of 0.45%, showing accelerating urbanization. On the other hand, agricultural land decreased substantially by losing 177.34 ha each year or 1.02% annually, showing extensive conversion of agricultural land into urban and other uses. Bare land also registered a higher increase of 108.53 ha/year (0.63% per year) due to land clearing or degradation that is attributed to development activities. Vegetation cover decreased slightly, by 9.65 ha or 0.06% per year is presented in (Figure 11). These trends reflect unbalanced land use planning and highlight the need for sustainable urban development policies to protect agricultural and natural land while managing urban growth responsibly.
The annual rate of urban expansion evaluates the gains and losses in the urban land cover class. It was found that from 2000 to 2025, 78.46 ha of built up area were increased annually. In contrast, from 2000 to 2025, the agricultural land was an annual loss of 177.34 ha/year. Finally, between 2000 and 2025, 108.53 ha of bare lands were gain to other LULC categories annually, and this represented the highest amount of lost agricultural lands.
4. Discussion
4.1. Result Comparison with Other LULC Datasets
Findings of this research align with other studies, to compare findings from other studies that have applied ML techniques to urban LC classification and change detection.
4.2. Machine Learning Model Performance Comparisons
As discussed in the recent (2024) study report by (Nigar et al., 2024), who analyzed the spatiotemporal variation in land use and land cover (LULC) in Sukkur, Pakistan, employing supervised classification techniques. Durowoju et al., (2025) compared some ML models and found that RF worked best with a total accuracy of 80% and kappa value 60%. Other models such as MARS, SVM, and KNN were less accurate. Although their accuracy for the free RF model was lower than the result, their study verifies that RF is generally more accurate for change detection in cities. Similarly, (Zhu & Ling, 2024) demonstrated the efficacy of RF classification using the Google Earth Engine (GEE) platform, with a reduction in open areas from 91.83% to 69.63% between 1980 and 2020. While slightly less accurate their study emphasizes the usability of RF to track land cover at large scales and long durations and confirms the findings of diminishing open and agricultural land for urbanization.
Amini et al. (2022) demonstrated the strong capability of the RF algorithm in 1985-2019 urban land use and land cover classification with 94.44% overall accuracy, 93% Kappa, and 93% F1-score, which far outweighed the Copernicus global land cover layers map. Their conclusions, with robust consensus over 90%, support the study, where RF achieved even higher accuracy (97.29%) and Kappa (96.32%), confirming RF as a highly accurate model for accurate urban LULC mapping and monitoring sudden land changes. As far as the performance of classification is concerned, the use of the random forest (RF) algorithm that recorded a maximum accuracy of up to 97.29% outperformed the accuracies reported by (Ouma et al., 2023), who compared different machine learning techniques and different Landsat sensors and concluded that RF achieved a lowest average accuracy of 92.8% compared with other classifiers such as MLP-ANN (91.2%), SVM (90.9%), and GTB (87.8%). The implications emphasize the robustness of RF in urban LULC classification; this suggests that RF is better suited for handling complex, heterogeneous landscapes and multi-temporal data.
In the recent study conducted by Atef et al.( 2023), evaluated the performance of various classification algorithms including MLH, RF, and SVM algorithms for monitoring spatiotemporal land use changes in El-Fayoum, Egypt, reporting the highest classification accuracy with SVM (kappa = 91.6%), followed by RF (90.9%) and MLH (87.8%). In contrast, our study found that RF outperformed SVM, achieving a higher overall accuracy of 97.29% is notably high and compares favorably with similar land cover classification studies in Africa and other developing regions, where overall accuracies typically range between 85% and 95%. The implications emphasize the robustness of RF in urban LULC classification; this suggests that RF is better suited for handling complex, heterogeneous landscapes and multi-temporal data.
4.3. Urban LULC Change Detection
Frimpong & Molkenthin (2025) quantified LULC dynamics in Kumasi and noted that urban land occupied 4,622.49 ha (23.78%) in 1986 but 14,004.60 ha (72.05%) in 2015. This is consistent with a discernible trend of urban growth overtaking agricultural and forested areas, as noted in the study, though on a lower absolute extent of urbanization. The (Dibaba, 2023) observed rapid urban expansion between 2001 to 2021 in Nekemte and Jimma Cities, with the built-up area growing by 929.25 ha (172.75%) and 2,285.64 ha (226.93%), respectively. These movements are of the same order as own observation of a 1,961.55 ha increase of built-up area, exhibiting the same trend of urban expansion in other areas. Salim et al. (2025) applied the RF algorithm on Landsat images of the Lucknow district. There was a net urban expansion of 48,459 ha accompanied by significant declines in forests (7,544 ha) and wetlands (67,452 ha). Similar to the observation of urban sprawl across natural and agricultural land is the study's accuracy of 97.29%, although higher than that of Salim.
Some of the previous studies recorded similar results to this study. Furthermore, the study follows along the same lines as that of Bisewur Eyaya (2014), Nyamekye et al. (2020), and Ouma et al. (2023) by highlighting the emerging trend of urbanization at the expense of agricultural land loss. We observed results indicate a significant reduction in agricultural area under cultivation by approximately 4,433.44 ha (25.57%) and an increase in urban area by approximately 1,961.55 ha (11.32%) between 2000 and 2025, consistent with the urban expansion rates documented by Bisewur Eyaya (Belay, 2014) of 113.32 ha in 13 years and 10,626 ha within 5 years. Similarly, (Nyamekye et al., 2020) considered a persistent rate of land use transition, dominated predominantly by urban built-up (21.24%) and agricultural land conversions (13.19%). Similarly, Fenta et al., (2017) also observed significant land use changes in Mekelle City, noting expansion of built-up areas at the expense of agricultural and vegetative lands. Likewise, Temesgen and Tesfaye (2020) reported spatiotemporal urban growth in Bure town, with forest and farmland declining due to increasing urban coverage. The rapid urban expansion in Debark town from 2000 to 2025, characterized by a massive increase in built-up land at the loss of agricultural land and vegetative cover, illustrates Figure 9 implications that call for sustainable urban development.
4.4. Annual Rate Change of Urban Expansion
In the present study, the analysis of urban land use annual rate change shows that the rate of the built-up area at a rate of 78.46 ha per year, equivalent to an annual percentage increase of 0.45%, increased by approximately 4.5% to 15.82% in 2000–2025 in the study areas, and the expansion of built-up areas mostly occurred over agricultural land. Built-up areas increased rapidly throughout the 25-year period, according to the spatial data obtained via the temporal analysis of land cover graphs (see Figure 11). This is similar to the previous studies Hassan & Southworth (Hassan & Southworth, 2018), in contrast, the annual population growth rate was assessed in the earlier research. Similarly, according to Temesgen and Tesfaye (2020), due to the expansion of Bure town, from the year 1989 to 2019, the farmland lost 5.13km2 (513ha) within with rate changes 0.17km2 (17ha/year) in 30 years. In addition, the study result of Debark town is directly agreed with the findings of (Molla et al., 2024), which is conducted in Hawassa City expansion from 1984 – 2021 using Landsat images in ten year intervals, the result portrayed that the built-up area increased by 85.10 ha per year.
The results were confirmed the extent and rate of urban expansion in Debark Town. The analyses were showing how the town has grown both spatially and in terms of density over the past two decades. We anticipate a substantial increase in built-up area, likely at accelerated rates in the more recent period (2015-2025) compared to the earlier one (2000-2015), aligning with Ethiopia's general urbanization trends. The detailed LULC change matrix were reveal the primary land covers being consumed for urban development, critically highlighting the conversion of agricultural land and natural vegetation.
5. Conclusion
This study successfully conducted a spatiotemporal analysis of urban expansion in Debark Town, Ethiopia, utilizing multi-temporal Landsat satellite imagery, Machine Learning techniques, and the Google Earth Engine cloud computing platform. The research quantified and mapped the significant increase in built-up area over the past two decades, revealing rapid urban growth rates and distinct spatial patterns of expansion. The employed Random Forest classifier within GEE demonstrated high accuracy in delineating LULC classes, affirming the robustness and efficiency of the methodological framework.
The findings underscore the immense pressure on surrounding agricultural lands and natural environments due to uncontrolled urban sprawl. This research provides critical, spatially explicit data that has been historically lacking for Debark Town, offering invaluable insights for local authorities and urban planners. By understanding the historical trajectories and patterns of growth, future urban development can be guided towards more sustainable and resilient pathways, mitigating negative environmental impacts and ensuring equitable resource allocation for the growing population of Debark.
Funding
This research did not receive any specific grant from funding agencies.
References
- Abdi, A. M. (2020). Land cover and land use classification performance of machine learning algorithms in a boreal landscape using Sentinel-2 data. GIScience and Remote Sensing, 57(1), 1–20. [CrossRef]
- Al-Saady, Y., Merkel, B., Al-Tawash, B., & Al-Suhail, Q. (2015). Land use and land cover (LULC) mapping and change detection in the Little Zab River Basin (LZRB), Kurdistan Region, NE Iraq and NW Iran. FOG - Freiberg Online Geoscience, 43, 1–32.
- Amini, S., Saber, M., Rabiei-Dastjerdi, H., & Homayouni, S. (2022). Urban Land Use and Land Cover Change Analysis Using Random Forest Classification of Landsat Time Series. Remote Sensing, 14(11), 1–23. [CrossRef]
- Atef, I., Ahmed, W., & Abdel-Maguid, R. H. (2023). Modelling of land use land cover changes using machine learning and GIS techniques: a case study in El-Fayoum Governorate, Egypt. Environmental Monitoring and Assessment, 195(6). [CrossRef]
- Barow, I. , Megenta, M., & Megento, T. (2019). Spatiotemporal analysis of urban expansion using GIS and remote sensing in Jigjiga town of Ethiopia. ( 11(2), 121–127. [CrossRef]
- Bedada, B. A., Engine, G. E., & Scholar, G. (2024). Urban Land Use Land Cover Dynamics and Urban Expansion Intensity Assessment Using Multi-Temporal Landsat Imageries and Google Earth Engine over Adama City , Ethiopia Urban Land Use Land Cover Dynamics and Urban. 0–19. [CrossRef]
- Belay, E. (2014). Impact of Urban Expansion on the Agricultural Land Use a Remote Sensing and GIS Approach : A Case of Gondar City , Ethiopia. International Journal of Innovative Research & Development, 3(6), 129–133.
- Chowdhury, M. S. (2024). Comparison of accuracy and reliability of random forest, support vector machine, artificial neural network and maximum likelihood method in land use/cover classification of urban setting. Environmental Challenges, 14(November 2023), 100800. [CrossRef]
- Coq-Huelva, D., & Asián-Chaves, R. (2019). Urban sprawl and sustainable urban policies. A review of the cases of Lima, Mexico City and Santiago de Chile. Sustainability (Switzerland), 11(20). [CrossRef]
- D., S., Deepa, P., & K., V. (2017). Remote Sensing Satellite Image Processing Techniques for Image Classification: A Comprehensive Survey. International Journal of Computer Applications, 161(11), 24–37. [CrossRef]
- Dadras, M., Shafri, H. Z. M., Ahmad, N., Pradhan, B., & Safarpour, S. (2015). Spatio-temporal analysis of urban growth from remote sensing data in Bandar Abbas city, Iran. Egyptian Journal of Remote Sensing and Space Science, 18(1), 35–52. [CrossRef]
- Deribew, K. T. (2020). Spatiotemporal analysis of urban growth on forest and agricultural land using geospatial techniques and Shannon entropy method in the satellite town of Ethiopia, the western fringe of Addis Ababa city. Ecological Processes, 9(1). [CrossRef]
- Desta, S. Z., & Gugssa, M. A. (2022). The Implementation of Andragogy in the Adult Education Program in Ethiopia. Education Research International, 2022. [CrossRef]
- Dharani, M., & Sreenivasulu, G. (2021). Land use and land cover change detection by using principal component analysis and morphological operations in remote sensing applications. International Journal of Computers and Applications, 43(5), 462–471. [CrossRef]
- Dibaba, W. T. (2023). Urbanization-induced land use/land cover change and its impact on surface temperature and heat fluxes over two major cities in Western Ethiopia. Environmental Monitoring and Assessment, 195(9). [CrossRef]
- Durowoju, O. S., Obateru, R. O., Adelabu, S., & Olusola, A. (2025). Urban change detection: assessing biophysical drivers using machine learning and Google Earth Engine. Environmental Monitoring and Assessment, 197(4). [CrossRef]
- Fenta, A. A., Yasuda, H., Haregeweyn, N., Belay, A. S., Hadush, Z., Gebremedhin, M. A., & Mekonnen, G. (2017). The dynamics of urban expansion and land use/land cover changes using remote sensing and spatial metrics: The case of Mekelle city of northern Ethiopia. International Journal of Remote Sensing, 38(14), 4107–4129. [CrossRef]
- Frimpong, B. F., & Molkenthin, F. (2025). Tracking Urban Expansion Using Random Forests for the Classification of Landsat Imagery ( 1986 – 2015 ) and Predicting.
- Gawali, B. W. (2009). Classification of land use / land cover using artificial intelligence.
- Gessesse, B., Bewket, W., & Ababa, A. (2015). Why Does Accuracy Assessment and Validation of Multiresolution based Satellite Image Classification Matter ? Ethiopian Journal of Science and Technology, 38(1), 29–42.
- Gharaibeh, A. A., Jaradat, M. A., & Kanaan, L. M. (2023). A Machine Learning Framework for Assessing Urban Growth of Cities and Suitability Analysis. Land, 12(1), 1–19. [CrossRef]
- Gondwe, J. F., Lin, S., & Munthali, R. M. (2021). Analysis of Land Use and Land Cover Changes in Urban Areas Using Remote Sensing: Case of Blantyre City. Discrete Dynamics in Nature and Society, 2021. [CrossRef]
- Gu, Q., Sun, W., Li, X., Jiang, S., & Tian, J. (2023). A new ensemble classification approach based on Rotation Forest and LightGBM. Neural Computing and Applications, 35(15), 11287–11308. [CrossRef]
- Hamud, A. M., Shafri, H. Z. M., & Shaharum, N. S. N. (2021). Monitoring Urban Expansion and Land Use/Land Cover Changes in Banadir, Somalia Using Google Earth Engine (GEE). IOP Conference Series: Earth and Environmental Science, 767(1). [CrossRef]
- Hassan, M. M., & Southworth, J. (2018). Analyzing land cover change and urban growth trajectories of the mega-urban region of Dhaka using remotely sensed data and an ensemble classifier. Sustainability (Switzerland), 10(1), 1–24. [CrossRef]
- Hassen, K., Anteneh, Y., Iguala, D., & Bedo, T. (2025). Discover Sustainability Spatiotemporal analysis of urban expansion and its impact on farmlands in the central Ethiopia metropolitan area. Discover Sustainability. [CrossRef]
- Kang, N. N. H. (2019). © 2019. This manuscript version is made available under the Elsevier user license https://www.elsevier.com/open-access/userlicense/1.0/. In Reseachgate (Vol. 95616, Issue 509).
- Khan, A., & Sudheer, M. (2022). Machine learning-based monitoring and modeling for spatio-temporal urban growth of Islamabad. Egyptian Journal of Remote Sensing and Space Science, 25(2), 541–550. [CrossRef]
- Kuhn, M., & Johnson, K. (2013). Applied Predictive Modeling with Applications in R. In Springer (Vol. 26). http://appliedpredictivemodeling.com/s/Applied_Predictive_Modeling_in_R.pdf.
- Loukika, K. N., Keesara, V. R., & Sridhar, V. (2021). Analysis of land use and land cover using machine learning algorithms on google earth engine for Munneru river basin, India. Sustainability (Switzerland), 13(24). [CrossRef]
- Mantero, P., Moser, G., & Serpico, S. B. (2004). Partially supervised classification of remote sensing images using SVM-based probability density estimation. 2003 IEEE Workshop on Advances in Techniques for Analysis of Remotely Sensed Data, 43(3), 327–336. [CrossRef]
- Megahed, Y., Cabral, P., Silva, J., & Caetano, M. (2015). Land cover mapping analysis and urban growth modelling using remote sensing techniques in greater Cairo region-Egypt. ISPRS International Journal of Geo-Information, 4(3), 1750–1769. [CrossRef]
- Moisa, M. B., Dejene, I. N., Roba, Z. R., & Gemeda, D. O. (2022). Impact of urban land use and land cover change on urban heat island and urban thermal comfort level: a case study of Addis Ababa City, Ethiopia. Environmental Monitoring and Assessment, 194(10). [CrossRef]
- Molla, M. B., Gelebo, G., & Girma, G. (2024). Urban expansion and agricultural land loss : a GIS-Based analysis and policy implications in Hawassa city , Ethiopia. November. [CrossRef]
- Mostafa, E., Li, X., Sadek, M., & Dossou, J. F. (2021). Monitoring and Forecasting of Urban Expansion Using Machine Learning-Based Techniques and Remotely Sensed Data: A Case Study of Gharbia Governorate, Egypt. Remote Sensing, 13(22), 4498. [CrossRef]
- Mutale, B., Withanage, N. C., Mishra, P. K., Shen, J., Abdelrahman, K., & Fnais, M. S. (2024). A performance evaluation of random forest, artificial neural network, and support vector machine learning algorithms to predict spatio-temporal land use-land cover dynamics: a case from lusaka and colombo. Frontiers in Environmental Science, 12(September), 1–18. [CrossRef]
- Nigar, A., Li, Y., Jat Baloch, M. Y., Alrefaei, A. F., & Almutairi, M. H. (2024). Comparison of machine and deep learning algorithms using Google Earth Engine and Python for land classifications. Frontiers in Environmental Science, 12(May), 1–18. [CrossRef]
- Nyamekye, C., Kwofie, S., Ghansah, B., Agyapong, E., & Boamah, L. A. (2020). Assessing urban growth in Ghana using machine learning and intensity analysis: A case study of the New Juaben Municipality. Land Use Policy, 99. [CrossRef]
- Ouma, Y. O., Keitsile, A., Nkwae, B., Odirile, P., Moalafhi, D., & Qi, J. (2023). Urban land-use classification using machine learning classifiers: comparative evaluation and post-classification multi-feature fusion approach. European Journal of Remote Sensing, 56(1). [CrossRef]
- Pandit, S., Shimada, S., & Dube, T. (2024). Comprehensive analysis of land use and cover dynamics in djibouti using machine learning technique: A multi-temporal assessment from 1990 to 2023. Environmental Challenges, 15(February), 100920. [CrossRef]
- Park, J., Lee, Y., & Lee, J. (2021). Assessment of machine learning algorithms for land cover classification using remotely sensed data. Sensors and Materials, 33(11), 3885–3902. [CrossRef]
- Pramanik, S., Areendran, G., Punia, M., & Sahoo, S. (2022). Spatio-temporal pattern of urban eco-environmental quality of Indian megacities using geo-spatial techniques. Geocarto International, 37(17), 5067–5090. [CrossRef]
- Pushpalatha, V., Mahendra, H. N., Prasad, A. M., Sharmila, N., Kumar, D. M., Basavaraju, N. M., Pavithra, G. S., & Mallikarjunaswamy, S. (2024). An Assessment of Land Use Land Cover Using Machine Learning Technique. Nature Environment and Pollution Technology, 23(4), 2211–2219. [CrossRef]
- Puttinaovarat, S., & Horkaew, P. (2017). Urban areas extraction from multi sensor data based on machine learning and data fusion. Pattern Recognition and Image Analysis, 27(2), 326–337. [CrossRef]
- Ranagalage, M., Ratnayake, S. S., Dissanayake, D. M. S. L. B., Kumar, L., Wickremasinghe, H., Vidanagama, J., Cho, H., Udagedara, S., Jha, K. K., Simwanda, M., Phiri, D., Perera, E. N. C., & Muthunayake, P. (2020). Spatiotemporal variation of urban heat islands for implementing nature-based solutions: A case study of kurunegala, Sri Lanka. ISPRS International Journal of Geo-Information, 9(7). [CrossRef]
- Regassa, B., Kassaw, M., & Bagyaraj, M. (2020). Analysis of Urban Expansion and Modeling of LULC Changes Using Geospatial Techniques: The Case of Adama City. Remote Sensing of Land, 4(1–2), 40–58. [CrossRef]
- Roy, D. P., Wulder, M. A., Loveland, T. R., C.E., W., Allen, R. G., Anderson, M. C., Helder, D., Irons, J. R., Johnson, D. M., Kennedy, R., Scambos, T. A., Schaaf, C. B., Schott, J. R., Sheng, Y., Vermote, E. F., Belward, A. S., Bindschadler, R., Cohen, W. B., Gao, F., … Zhu, Z. (2014). Landsat-8: Science and product vision for terrestrial global change research. Remote Sensing of Environment, 145, 154–172. [CrossRef]
- Sahak, A. S., Karsli, F., Ahmadi, K., & Saraj, M. A. (2024). Geospatial Assessment of Urban Sprawl: A Case Study of Herat City, Afghanistan. Australian Journal of Engineering and Innovative Technology, May, 51–69. [CrossRef]
- Salim, M., Bhattacharjee, S., Sharma, N., Sharma, K., & Garg, R. D. (2025). Spatial analysis and classification of land use patterns in Lucknow district , UP , India using GIS and random forest approach Spatial analysis and classification of land use patterns in Lucknow district , UP , India using GIS and random forest approach. January. [CrossRef]
- Sapkota, S., Bhurtyal, U., & Campus, P. (2024). Urban Growth Prediction Using Satellite Imageries with Applications of Machine Learning Algorithm in Pokhara Metropolitan City. 3(2).
- Schneider, A., & Woodcock, C. E. (2008). Compact, dispersed, fragmented, extensive? A comparison of urban growth in twenty-five global cities using remotely sensed data, pattern metrics and census information. Urban Studies, 45(3), 659–692. [CrossRef]
- Shifaw, E., Sha, J., Li, X., Jiali, S., & Bao, Z. (2020). Remote sensing and GIS-based analysis of urban dynamics and modelling of its drivers, the case of Pingtan, China. Environment, Development and Sustainability, 22(3), 2159–2186. [CrossRef]
- Sigopi, M., Shoko, C., & Dube, T. (2024). Advancements in remote sensing technologies for accurate monitoring and management of surface water resources in Africa: an overview, limitations, and future directions. Geocarto International, 39(1). [CrossRef]
- Sofi, A. A. (2005). Urban growth and its impact on environment in Kashmir valley. Mukt Shabd Journal, 9(5), 5558–5564.
- Sokolova, M., Japkowicz, N., & Szpakowicz, S. (2006). AI 2006: Advances in Artificial Intelligence: 19th Australian Joint Conference on Artificial Intelligence, Hobart, Australia, December 4-8, 2006. Proceedings. AI 2006: Advances in Artificial Intelligence, c, 1015–1021. [CrossRef]
- Subasinghe, S., Estoque, R. C., & Murayama, Y. (2016). Spatiotemporal analysis of urban growth using GIS and remote sensing: A case study of the Colombo metropolitan area, Sri Lanka. ISPRS International Journal of Geo-Information, 5(11). [CrossRef]
- Tassi, A., Gigante, D., Modica, G., Di Martino, L., & Vizzari, M. (2021). Pixel-vs. Object-based landsat 8 data classification in google earth engine using random forest: The case study of maiella national park. Remote Sensing, 13(12). [CrossRef]
- Terfa, B. K., Chen, N., Liu, D., Zhang, X., & Niyogi, D. (2019). Urban expansion in Ethiopia from 1987 to 2017: Characteristics, spatial patterns, and driving forces. Sustainability (Switzerland), 11(10), 1–21. [CrossRef]
- Tesfaye, F. T. (2020). Analysis of Spatio-temporal urban expansion of Bure town since. 19(4), 2875–2885. [CrossRef]
- Tesfaye, W., Elias, E., Warkineh, B., Tekalign, M., & Abebe, G. (2024). Modeling of land use and land cover changes using google earth engine and machine learning approach: implications for landscape management. Environmental Systems Research, 13(1). [CrossRef]
- Tessema, M. W., & Abebe, B. G. (2023). Quantification of land use / land cover dynamics and urban growth in rapidly urbanized countries : The case Hawassa city , Ethiopia. Urban, Planning and Transport Research, 11(1). [CrossRef]
- Tikuye, B. G., Rusnak, M., Manjunatha, B. R., & Jose, J. (2023). Land Use and Land Cover Change Detection Using the Random Forest Approach: The Case of The Upper Blue Nile River Basin, Ethiopia. Global Challenges, 7(10), 1–11. [CrossRef]
- Vishwakarma, A. (2024). a Review: Machine Learning Algorithms. Data Science: Practical Approach with Python & R, August, 162–175. [CrossRef]
- Yang, D., Gao, X., Yang, Y., Guo, K., Han, K., & Xu, L. (2025). Advances and Future Prospects in Building Extraction from High-Resolution Remote Sensing Images. IEEE Journal of Selected Topics in Applied Earth Observations and Remote Sensing, 18, 6994–7016. [CrossRef]
- Zhang, Y., Wang, H., Xie, P., Rao, Y., & He, Q. (2020). Revisiting Spatiotemporal Changes in Global Urban Expansion during 1995 to 2015. Complexity, 2020. [CrossRef]
- Zhu, Y., & Ling, G. H. T. (2024). Spatio-Temporal Changes and Driving Forces Analysis of Urban Open Spaces in Shanghai between 1980 and 2020: An Integrated Geospatial Approach. Remote Sensing, 16(7). [CrossRef]
Figure 1.
The geographic location of the study area.
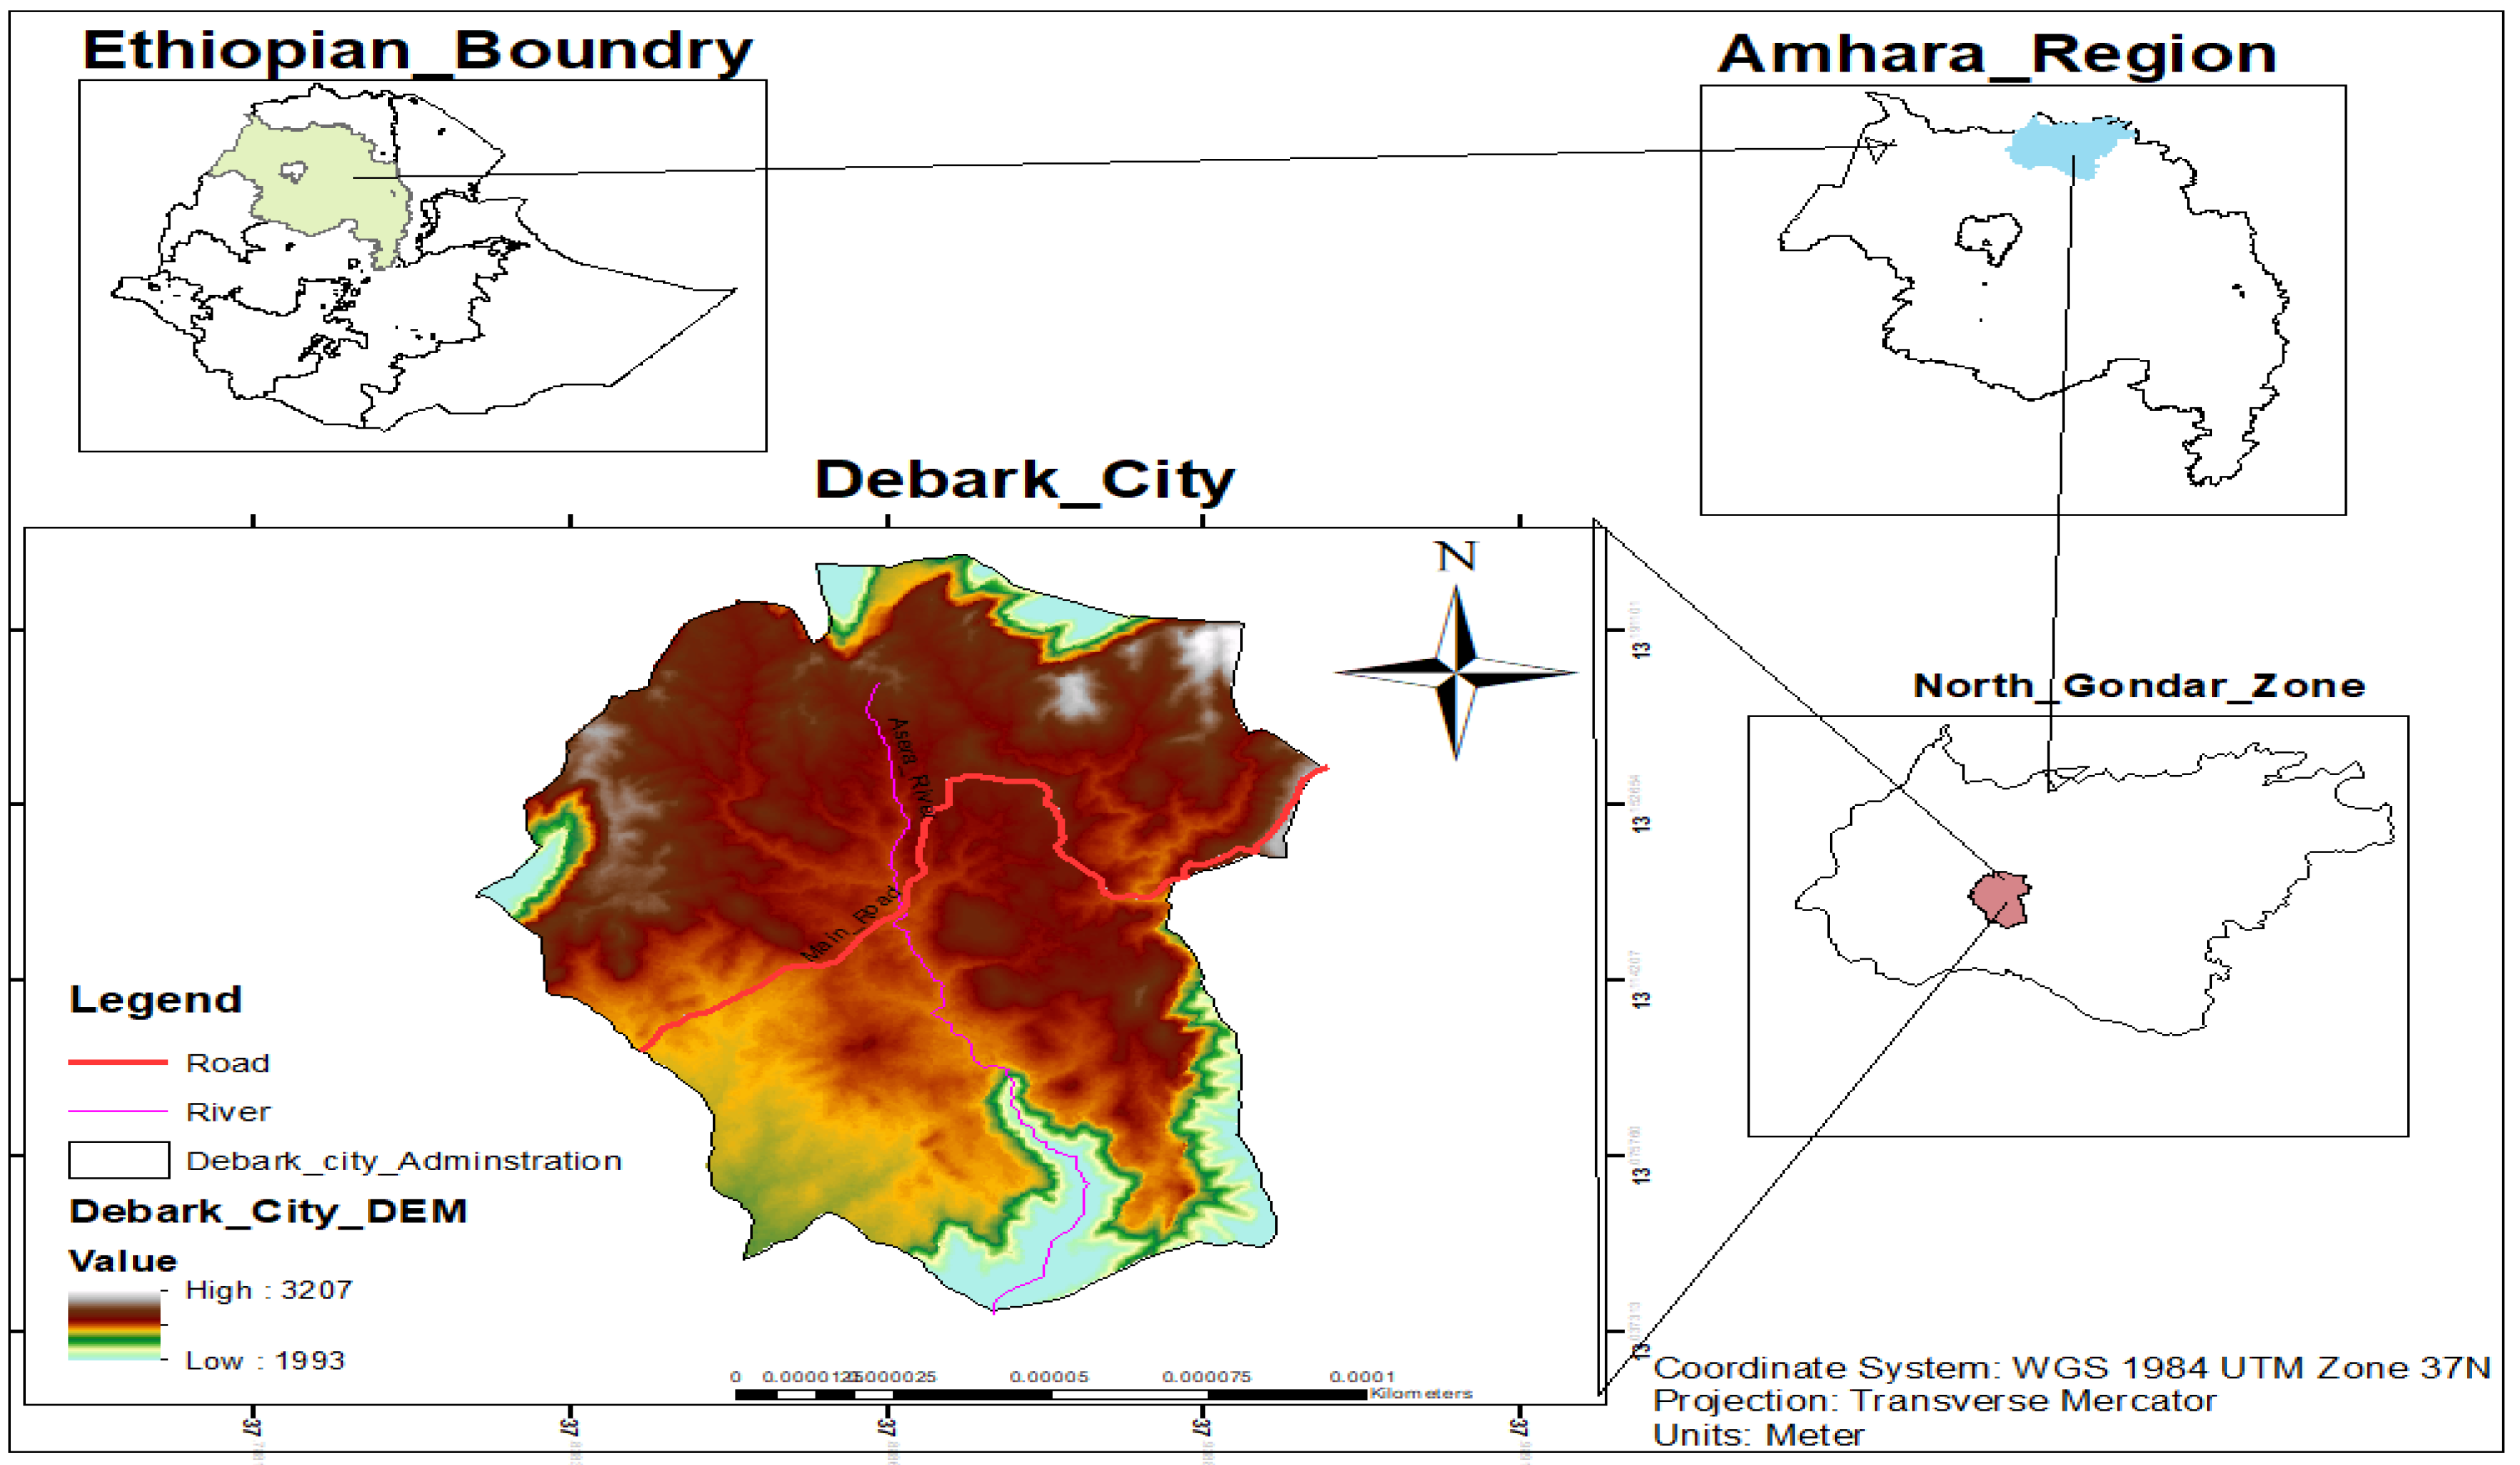
Figure 2.
The methodological flow chart of the study.
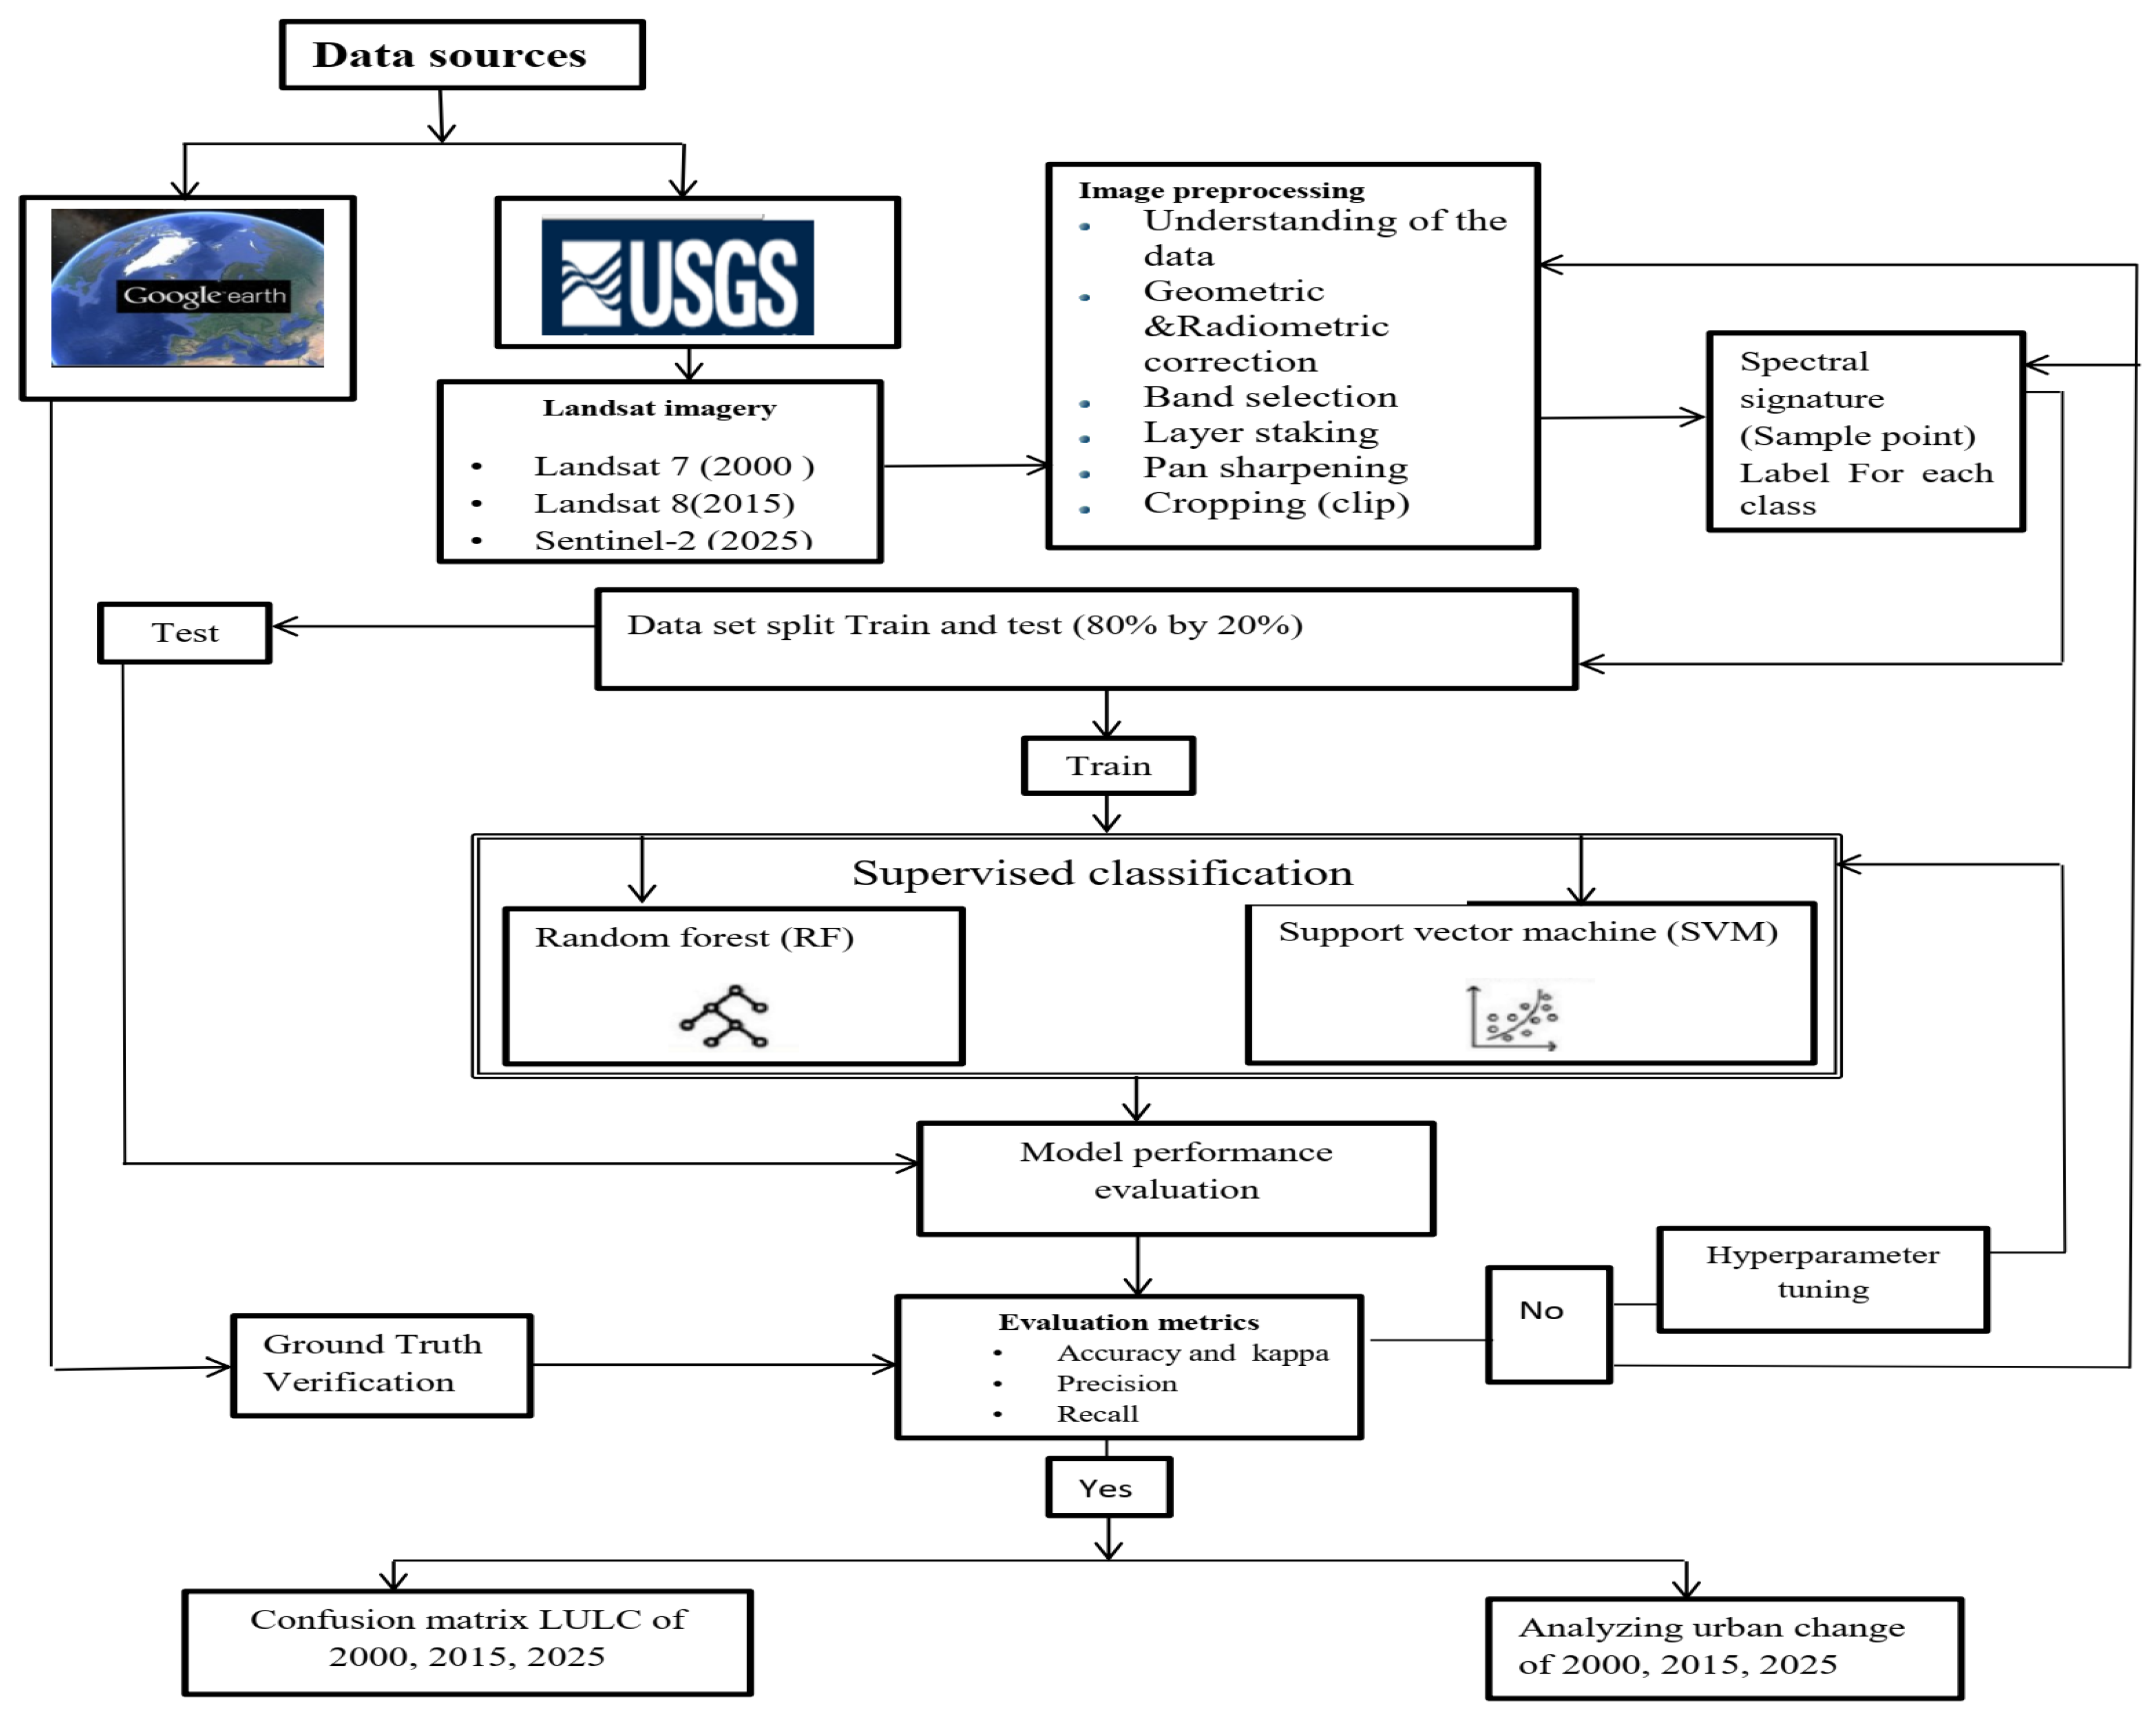
Figure 3.
Process of satellite image classification.
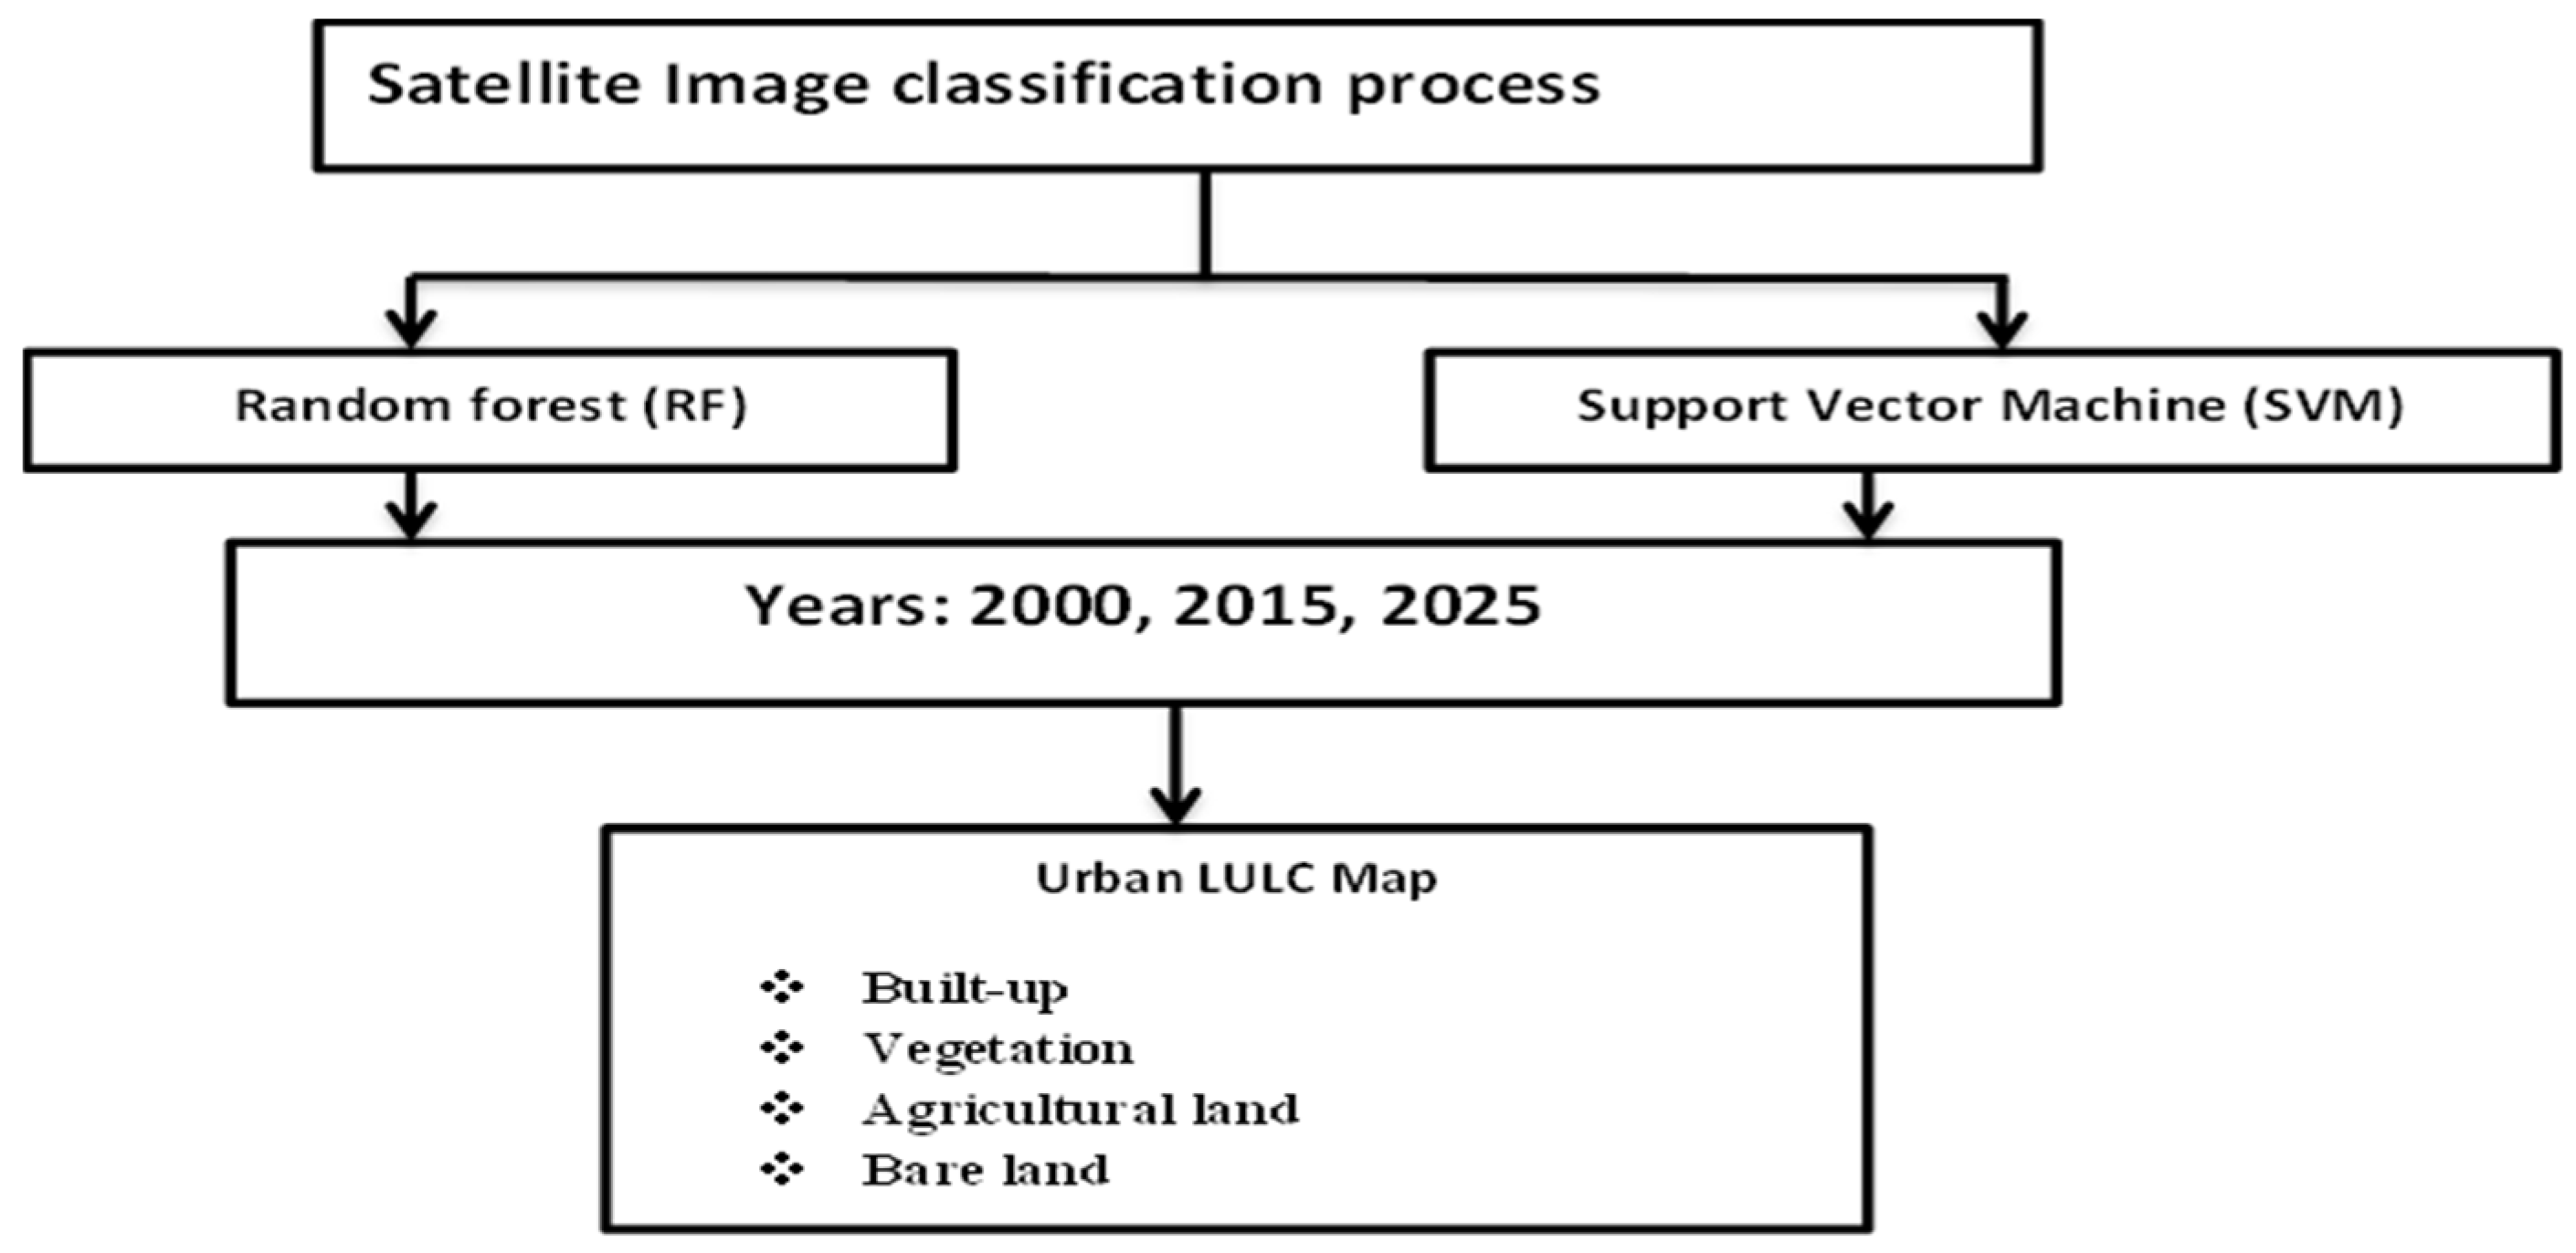
Figure 6.
The simulated map in the 2000 between 2025.
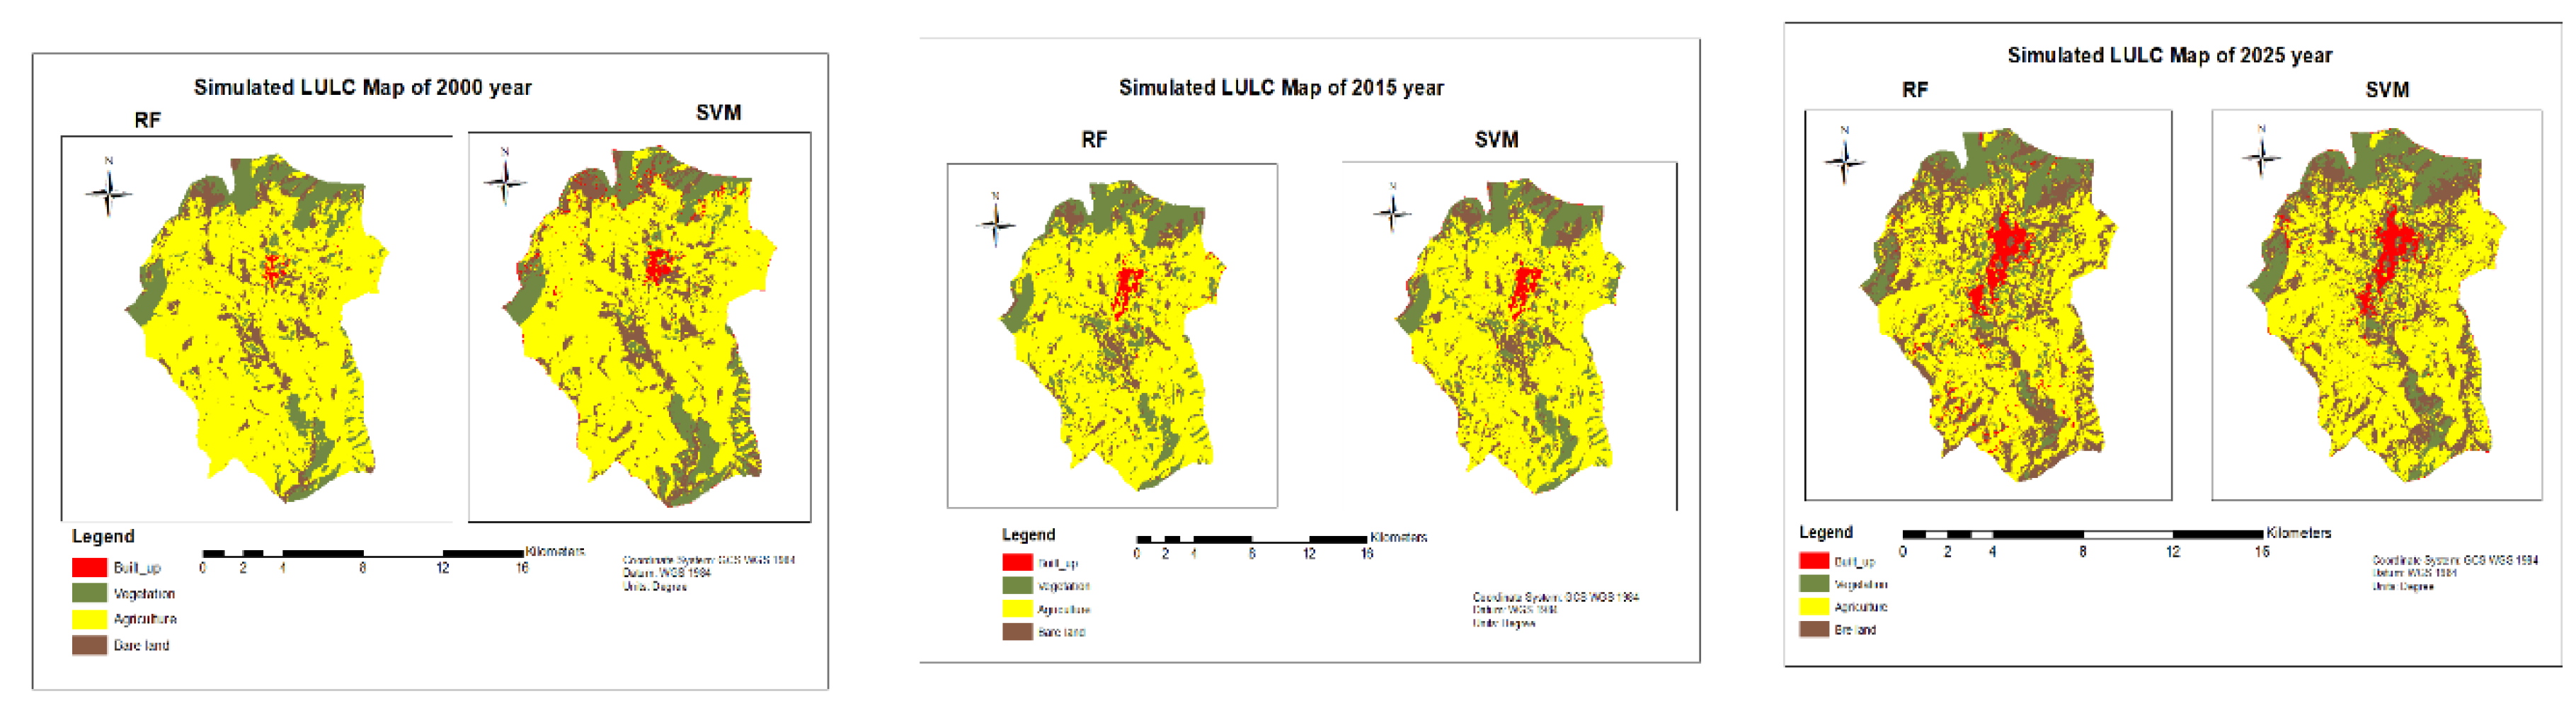
Figure 8.
The Urban cover change in the 2000 and 2015.
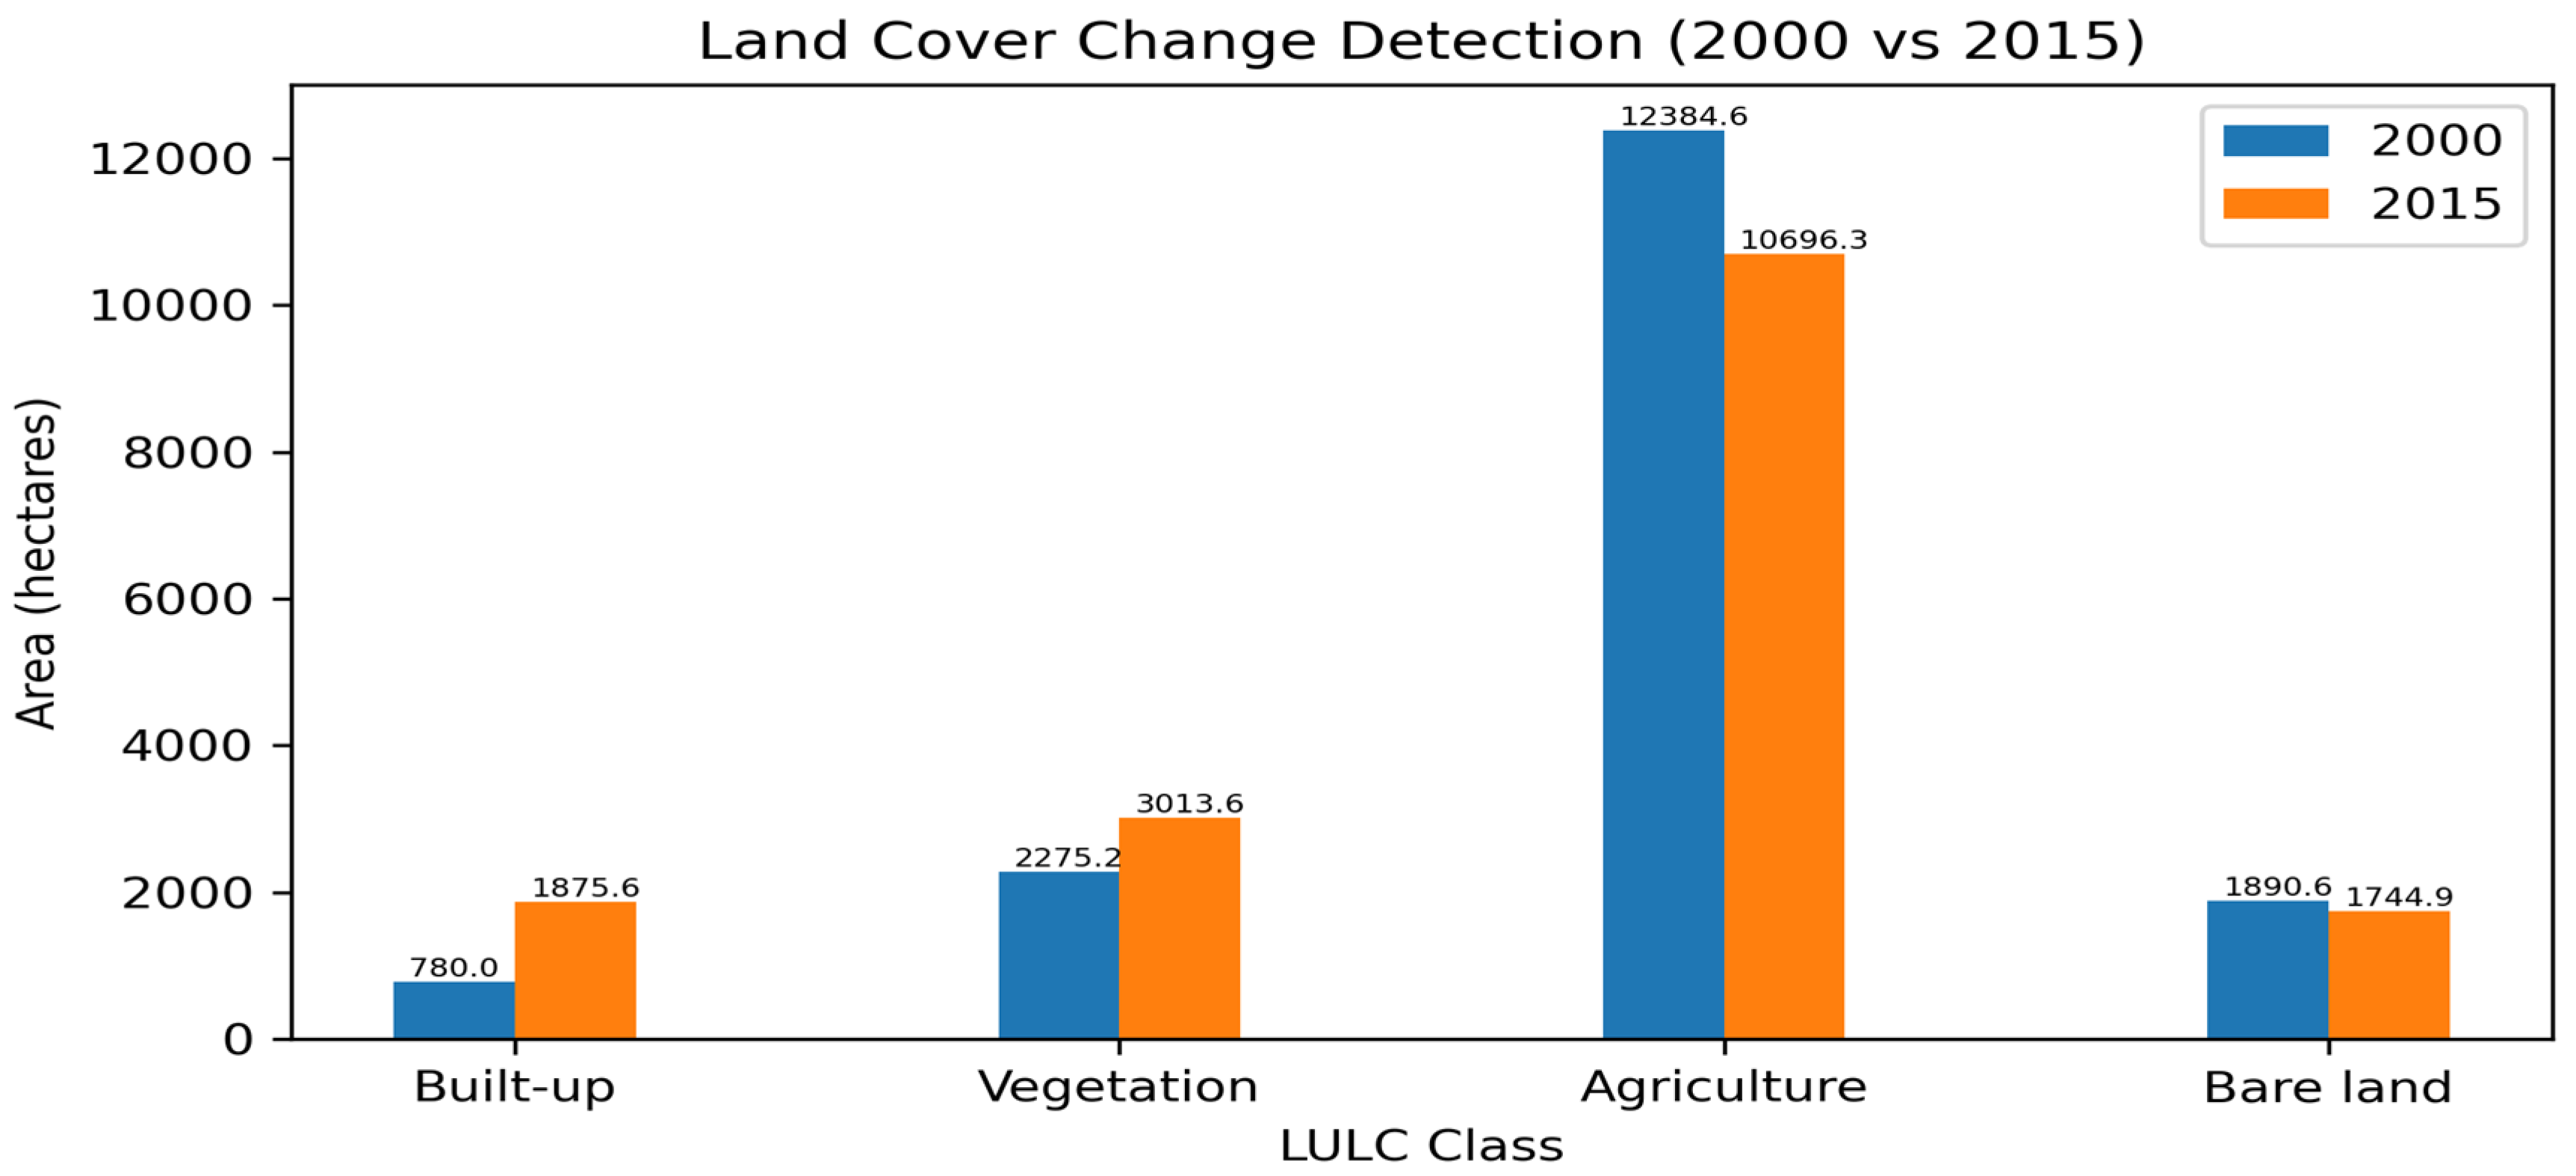
Figure 9.
The Urban cover change in the 2000 - 2025.
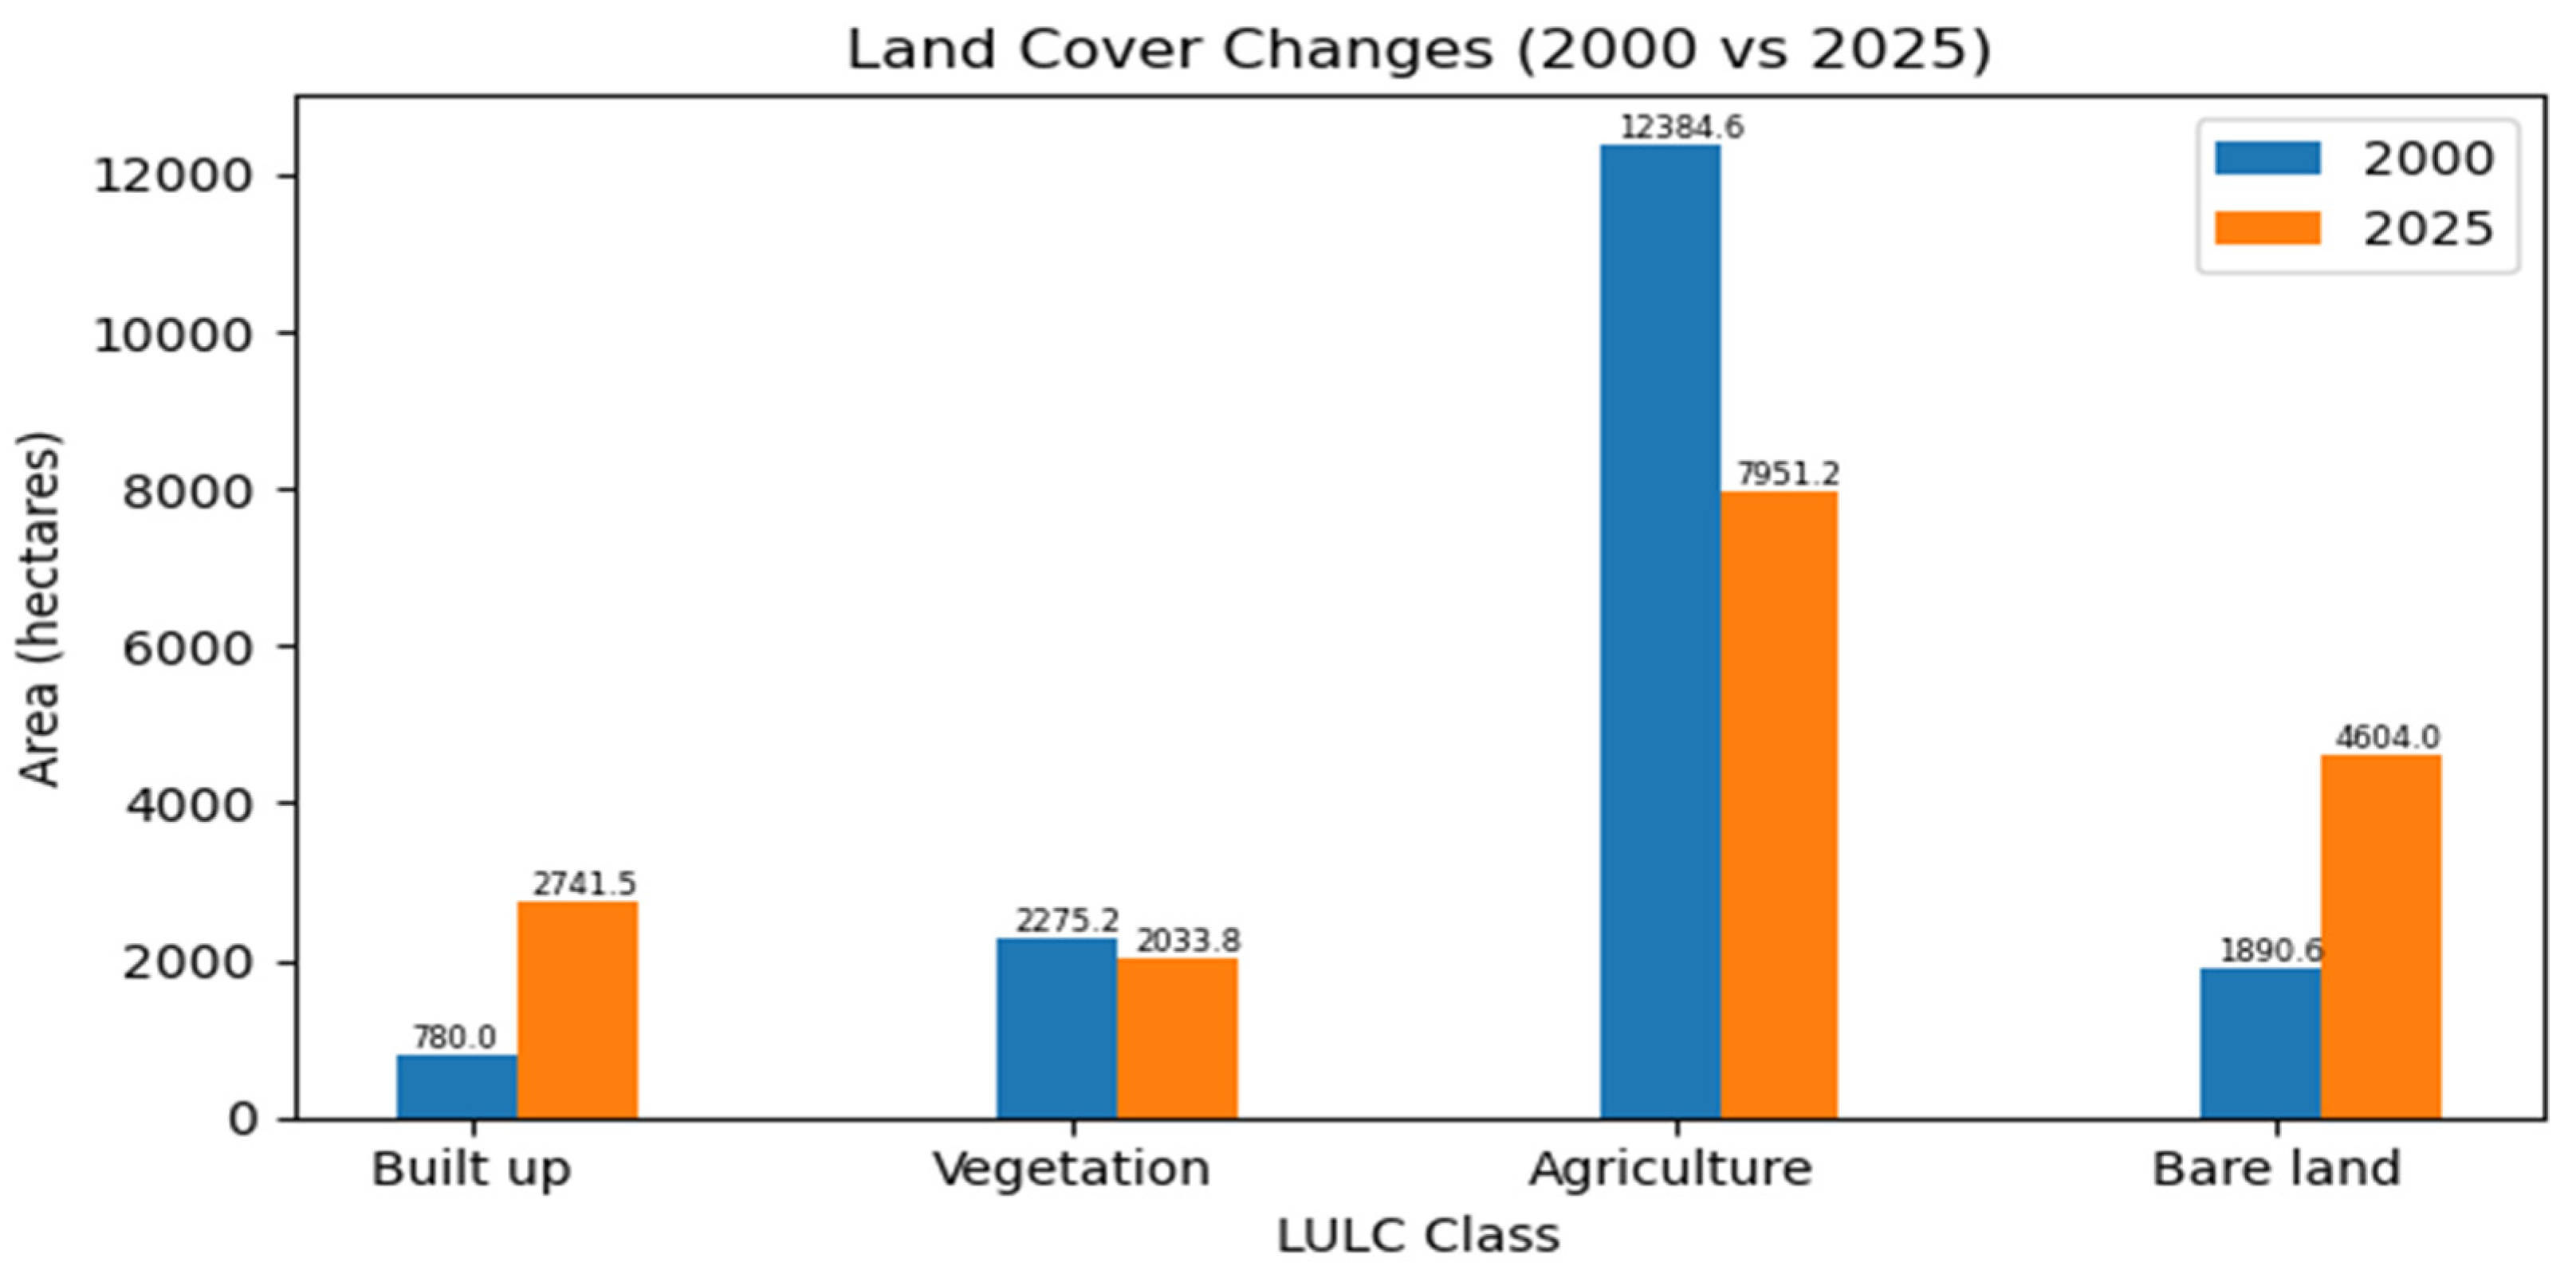
Figure 10.
the spatial trends of the urban land cover change over the years.
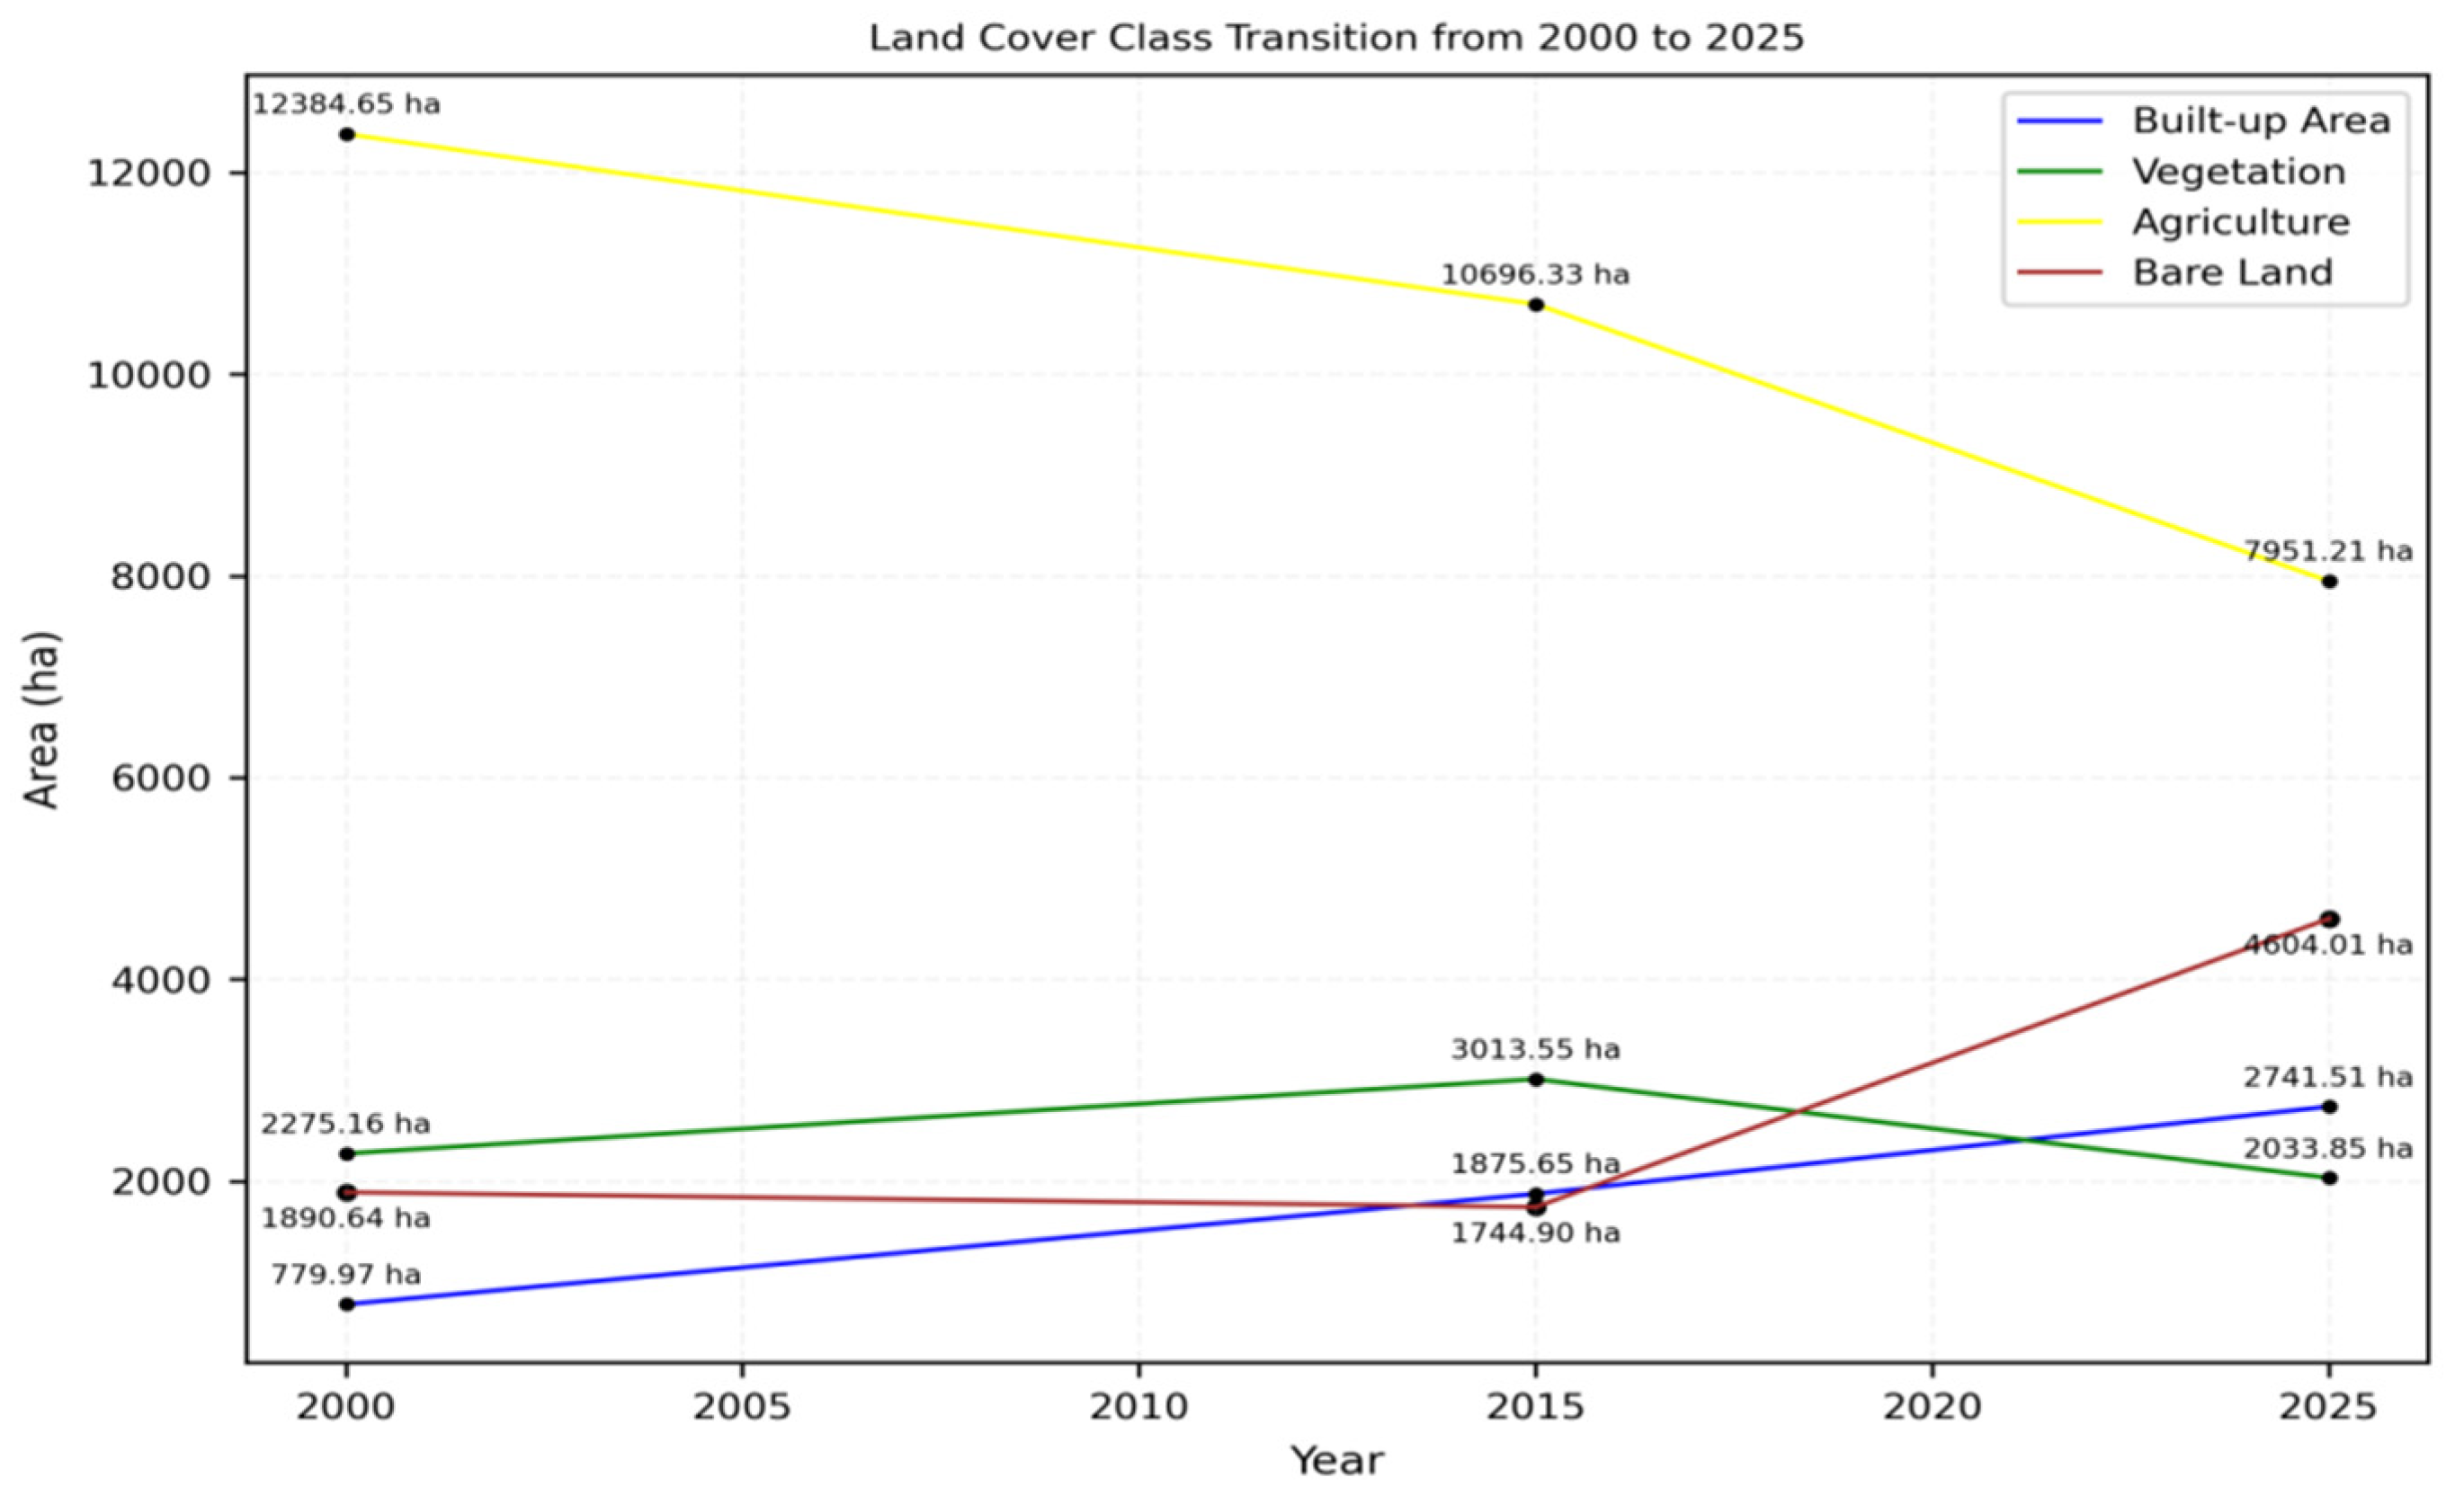
Figure 11.
The annual urban expansion rate (%) from 2000 to 2025 with the given class.
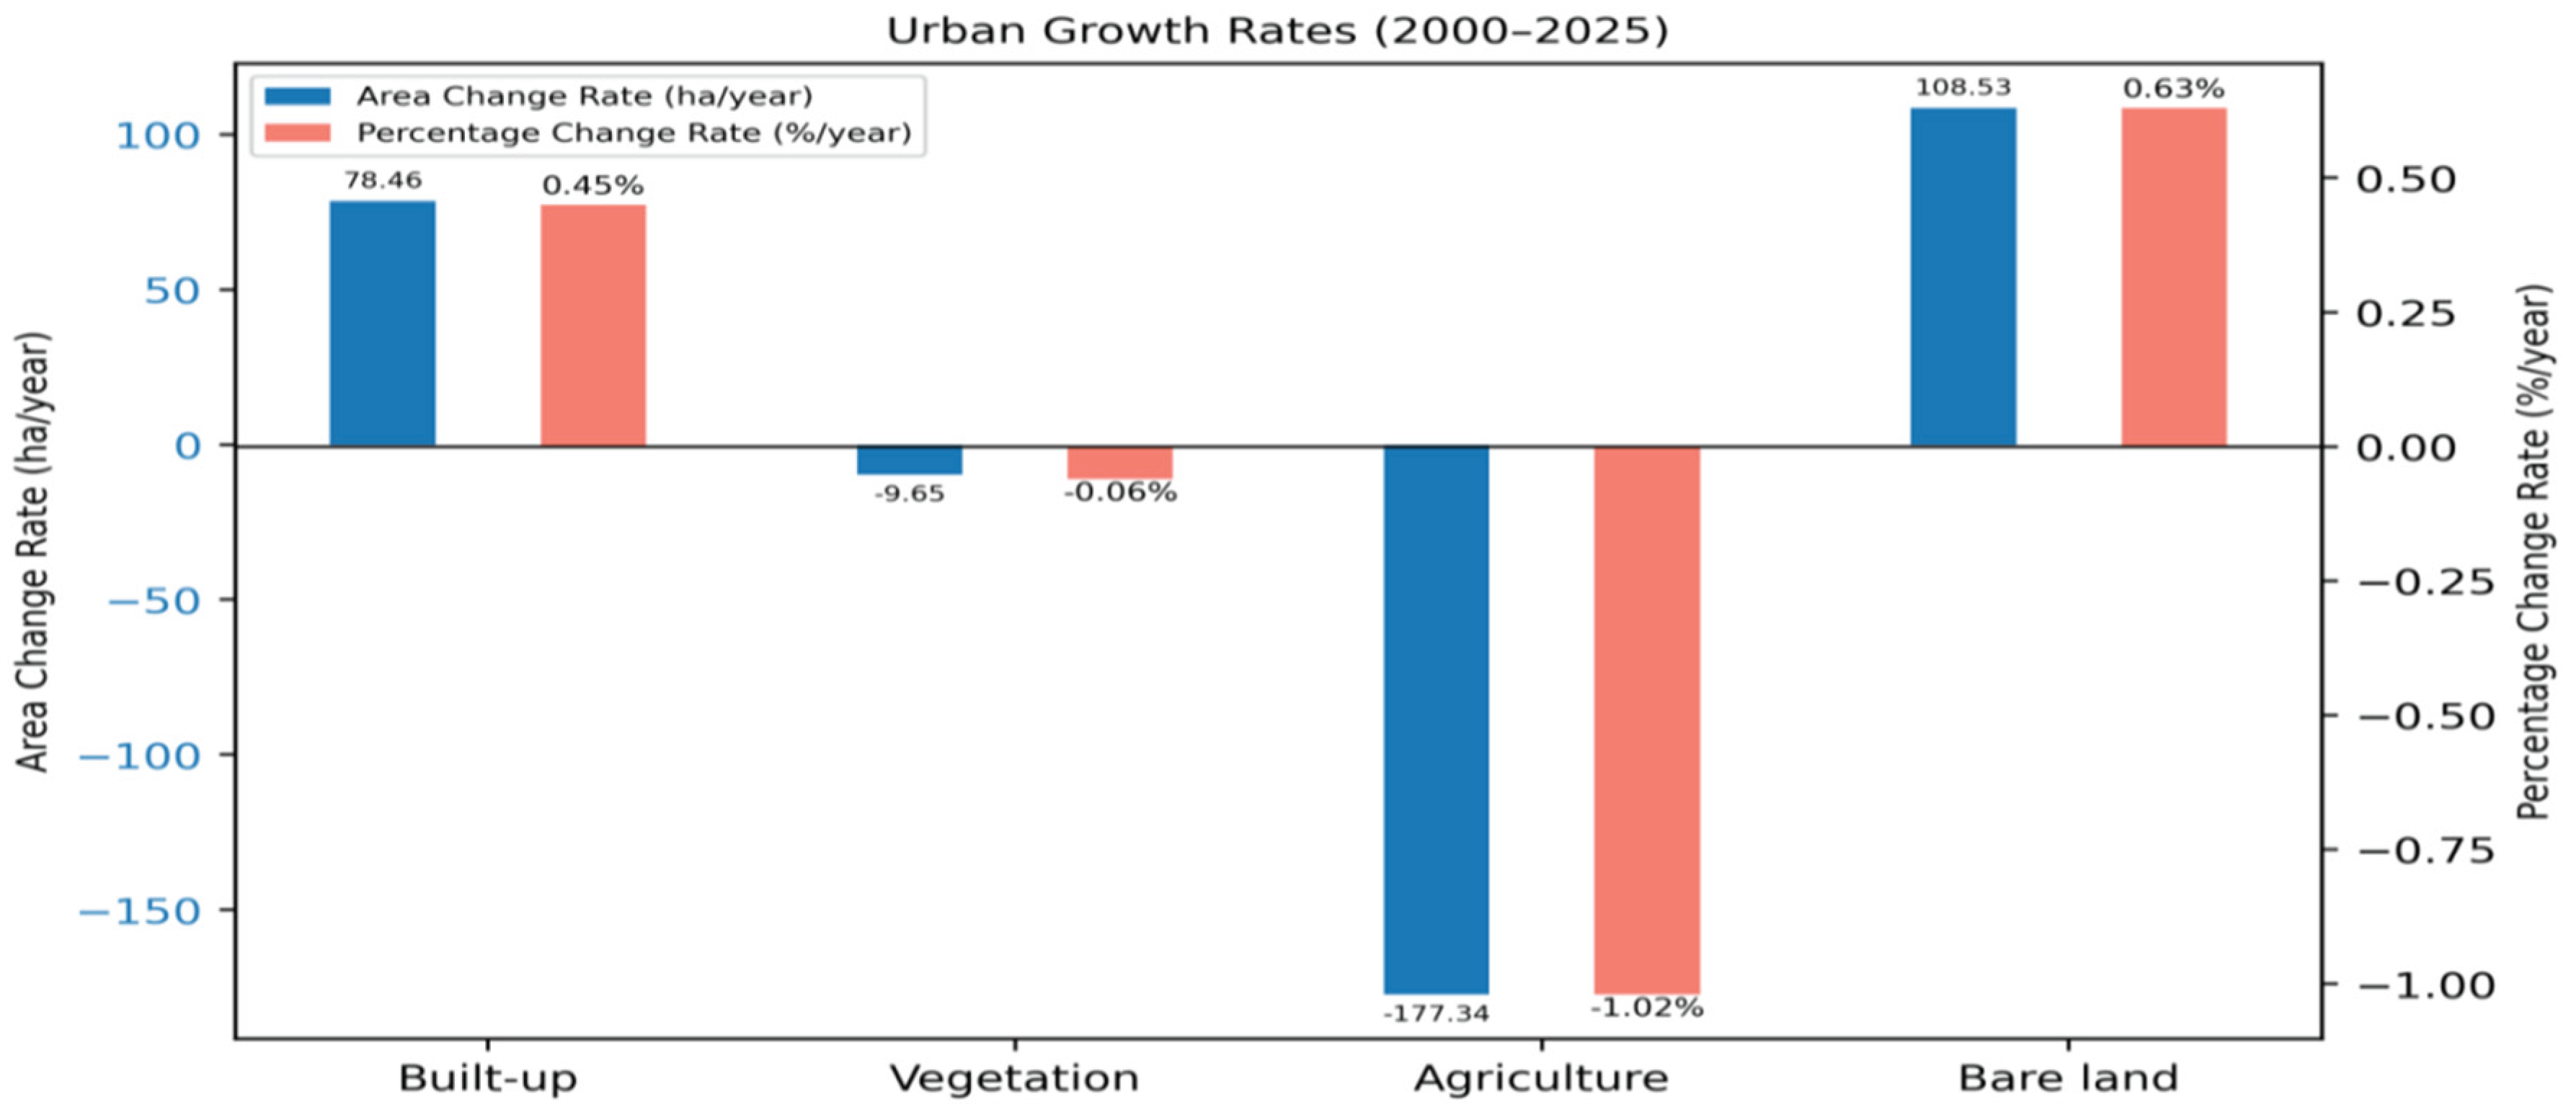
Table 1.
Description of satellites Landsat 8 OLI/TIRS, Sentinel-2, and Landsat 7.
| Landsat7 (ETM+) | Landsat8 (LOI) | Sentinel-2 | ||||||
| Band no | Wavelength (µm) | Pixel size(m) | Band no | Wave length (µm) | Pixel size(m) | Band no | Wave length (µm) | Pixel size(m) |
| B1 | 0.45 -0.52 | 30 | B1 | 0.433-0.45 | 30 | B1 | 0.443 | 60 |
| B2 | 0.52 - 0.60 | 30 | B2 | 0.45- 0.515 | 30 | B2 | 0.490 | 10 |
| B3 | 0.63 - 0.69 | 30 | B3 | 0.525- 0.60 | 30 | B3 | 0.560 | 10 |
| B4 | 0.76 - 0.90 | 30 | B4 | 0.630- 0.68 | 30 | B4 | 0.665 | 10 |
| B5 | 1.55 - 1.75 | 30 | B5 | 0.845-0.88 | 30 | B5 | 0.705 | 20 |
| B6 | 10.4 -12.3 | 60 | B6 | 1.56 -1.66 | 30 | B6 | 0.740 | 20 |
| B7 | 2.08 - 2.35 | 30 | B7 | 2.10 - 2.30 | 60 | B7 | 0.783 | 20 |
| B8 | 0.52 -0.90 | 15 | B8 | 0.50 - 0.68 | 15 | B8 | 0.842 | 10 |
| B9 | 1.36 - 1.39 | 30 | B8A | 0.865 | 20 | |||
| B10 | 10.3- 11.3 | 100 | B9 | 0.945 | 60 | |||
| B11 | 11.5 -12.5 | 100 | B10 | 1.375 | 60 | |||
| B11 | 1.610 | 20 | ||||||
| B12 | 2.190 | 20 | ||||||
Table 2.
Descriptions of land cover classes sample collection identified in the study area (2000-2025).
Table 2.
Descriptions of land cover classes sample collection identified in the study area (2000-2025).
| Urban cover class Data sets | |||||||
| Years | Built up | Vegetation | Agriculture | Bare land | Training | Testing | Total |
| 2000 | 490 | 505 | 530 | 530 | 1644 | 411 | 2055 |
| 2015 | 593 | 615 | 621 | 621 | 1960 | 490 | 2450 |
| 2025 | 586 | 603 | 603 | 603 | 1916 | 479 | 2395 |
Table 3.
Description of urban LULC classifications features.
| LULC class (features) | Description of the class (features) |
| Vegetation Area |
Areas characterized by natural or partially natural vegetation, such as urban forests, areas dominated by shrubs, and grass land |
| Built Up Area | Areas decided on as residential, commercial, industrial, urban settlements, and transportation facilities |
| Bare Land |
Areas with minimum plants in the main comprise uncovered earth substances which include stone, gravel, sand, silt, and clay. Examples include sandy areas, barely exposed rocks, degraded lands, and quarries. |
|
Agricultural Area |
Agricultural croplands, cultivated lands, and agricultural fallow lands and irrigated agriculture area, perennial crops |
Table 4.
Overall model performances comparison of the three experiments.
| Model | Evaluation metrics | years | |||
| 2000 | 2015 | 2025 | |||
| Accuracy | 95.86% | 95.9% | 97.29% | ||
|
RF |
User’s accuracy (Precision) | Built up | 93.75% | 94.67% | 97.58% |
| Vegetation | 96.15% | 96.08% | 95.83% | ||
| Agriculture | 97.48% | 97.53% | 97.79% | ||
| Bare land |
94.44% |
94.78% | 97.28% | ||
| Produce’s Accuracy (Recall) | Built up | 88.24% | 93.55% | 96.03% | |
| Vegetation | 96.5% | 96.09% | 98.57% | ||
| Agriculture | 95.68% | 96.93% | 97.79% | ||
| Bare land | 99.17% | 96.21% | 97.28% | ||
| Kappa coefficient | 94.15% | 94.5% | 96.32% | ||
|
SVM |
Accuracy | 95% | 93.06% | 93.74 | |
| User’s accuracy (Precision) | Built up | 87% | 91.40% | 94.35% | |
| Vegetation | 96% | 92.16% | 86.84% | ||
| Agriculture | 96% | 94.48% | 96.21% | ||
| Bare land | 97% | 93.18% | 94.56% | ||
| Produce’s Accuracy (Recall) | Built up | 92% | 91.40% | 92.86% | |
| Vegetation | 93% | 92.16% | 94.29% | ||
| Agriculture | 96 % | 94.48% | 93.38% | ||
| Bare land | 97.50% | 93.18% | 94.56% | ||
| Kappa coefficient | 93.94% | 90.63% | 91.5% | ||
Table 5.
Area of LC change between 2000 and 2015.
|
LULC Class |
Area 2000 (ha) |
2000 Area (%) |
Area 2015 (ha) |
2015 Area (%) |
Change (ha) |
Change Area (%) |
| Built up | 779.969 | 4.50% | 1875.646 | 10.82% | +1,095.68 | +6.32% |
| Vegetation | 2,275.16 | 13.13% | 3,013.55 | 17.39% | +738.39 | +4.26% |
| Agriculture | 12,384.65 | 71.45% | 10,696.33 | 61.69% | –1,688.32 | –9.76% |
| Bare land | 1,890.64 | 10.91% | 1,744.90 | 10.07% | –145.74 | –0.84% |
Disclaimer/Publisher’s Note: The statements, opinions and data contained in all publications are solely those of the individual author(s) and contributor(s) and not of MDPI and/or the editor(s). MDPI and/or the editor(s) disclaim responsibility for any injury to people or property resulting from any ideas, methods, instructions or products referred to in the content. |
© 2025 by the authors. Licensee MDPI, Basel, Switzerland. This article is an open access article distributed under the terms and conditions of the Creative Commons Attribution (CC BY) license (http://creativecommons.org/licenses/by/4.0/).
Copyright: This open access article is published under a Creative Commons CC BY 4.0 license, which permit the free download, distribution, and reuse, provided that the author and preprint are cited in any reuse.


