Submitted:
30 September 2025
Posted:
01 October 2025
Read the latest preprint version here
Abstract
In this study, we propose a dynamic fractal dimension modeling (DFDM) framework that integrates image analysis, wavelet-based fractal methods, and structural fractal geometry to quantify the evolution of pore complexity. Unlike conventional static fractal approaches, our method captures time-dependent scaling laws and captures the spatiotemporal evolution of pore networks. The results demonstrate that dynamic fractal dimensions provide a robust descriptor of multi-scale heterogeneity, effectively bridging pore-scale processes with reservoir-scale behavior. This framework not only advances the theoretical understanding of fractal pore dynamics but also establishes a predictive tool with potential applications in unconventional hydrocarbon recovery, geological CO2 sequestration, and multi-phase flow in porous media.
Keywords:
Dynamic Fractal Dimension Modeling (DFDM)
; Wavelet Analysis
; Pore Structure Heterogeneity
; Spatiotemporal Evolution
; Tight Reservoirs
1. Introduction
The pore structure of tight reservoirs fundamentally controls hydrocarbon recovery, fluid transport, and subsurface carbon storage, However, its inherent complexity and heterogeneity continue to pose formidable challenges for reservoir characterization [1,2,3]. Shales, coals, and carbonate formations exhibit multi-scale pore networks ranging from nanometer-scale micro-pores to interconnected fractures, with pore heterogeneity directly influencing adsorption capacity, permeability, and reservoir quality. Recent advances in experimental characterization, including low-pressure gas adsorption, nuclear magnetic resonance (NMR), mercury intrusion porosimetry (MIP), and high-resolution imaging, have revealed that pore systems follow fractal scaling laws, offering a quantitative descriptor of their structural irregularities [4,5,6,7,8,9].
Fractal geometry has thus become a powerful framework to bridge microscopic pore properties with macroscopic reservoir behavior. Numerous studies have demonstrated that fractal dimensions correlate with porosity, permeability, and specific surface area, making them indispensable tools for evaluating reservoir quality [10,11,12]. Beyond simple mono-fractal models, multi-fractal statistics and wavelet-based methods allow decomposition of complex pore structures across multiple scales [13,14]. These approaches have extended fractal analysis from static rock characterizations to broader geoscientific contexts, encompassing unconventional reservoir systems, soil structures, and engineered porous materials [15,16,17].
Despite these advances, most existing studies remain limited to static representations of fractal dimensions, neglecting the dynamic evolution of pore structures under fluid-rock interactions and reservoir stress conditions. This limitation obscures the spatiotemporal heterogeneity of pore networks, particularly in systems undergoing continuous diagenesis, hydrocarbon production, or CO2 injection. Static fractal descriptors fail to capture time-dependent scaling laws or the feedback between pore-scale processes and reservoir-scale behavior [18,19,20]. Consequently, the lack of dynamic fractal frameworks hampers predictive modeling of multi-phase flow, storage capacity, and long-term reservoir performance.
In this work, we present a Dynamic Fractal Dimension Modeling (DFDM) framework that integrates image analysis, wavelet-based fractal methods, and structural fractal geometry to quantify the spatiotemporal evolution of pore networks. Unlike conventional static approaches, our method reveals dynamic scaling laws and demonstrates how fractal dimensions evolve under reservoir-relevant conditions. This framework advances the theoretical understanding of fractal pore dynamics while providing a predictive tool with direct implications for unconventional hydrocarbon recovery, geological CO2 sequestration, and multi-phase flow in porous media.
2. Modeling
We propose a Dynamic Fractal Dimension Modeling (DFDM) framework that explicitly incorporates temporal variations into fractal descriptors. The central idea is that pore networks evolve as a combined effect of intrinsic reservoir stress-sensitivity and extrinsic fluid-rock interactions. By doing so, DFDM establishes a dynamic, process-oriented bridge between pore-scale complexity and reservoir-scale properties, thereby laying the foundation for the modeling framework presented in this section.
2.1. Fundamentals of Fractal Geometry and Scaling Laws
Fractal geometry provides a powerful mathematical framework for characterizing the irregularity and heterogeneity of pore networks across scales. Unlike Euclidean measures, the fractal dimension D quantifies scale-dependent complexity. The classical box-counting dimension D is defined as:
Here, denotes the number of covering boxes of size length required to cover the pore space. This approach has been widely implemented in tools such as ImageJ with the FracLac plugin, offering a fast and intuitive way to characterize pore morphology. However, such static approaches provide only a single-valued fractal dimension and cannot capture the temporal evolution of pore structures. In reservoir systems, pore networks evolve continuously under stress perturbations, fluid-rock interactions, and diagenetic processes, requiring a more advanced approach.
To address these limitations, wavelet-based fractal analysis has been introduced (see Section 2.3). Unlike the box-counting method, wavelets possess strong time-frequency localization, making them particularly effective in analyzing non-stationary signals, local heterogeneity, and dynamic evolution. This establishes the theoretical basis for the development of the Dynamic Fractal Dimension Model (DFDM) presented later.
2.2. Probability Distribution of Pore Networks
Beyond scaling descriptors, the stochastic nature of pore geometry can be quantified via probability distribution functions (PDFs). The Weibull distribution provides a flexible representation of pore radius statistics:
Here, is the Weibull modulus reflecting heterogeneity, and is the scale parameter representing characteristic pore size. For , the distribution converges to a delta function corresponding to homogeneous pores;conversely, small values indicate wide pore size dispersion. This statistical representation provides a baseline for linking probability models with fractal scaling laws. The cumulative distribution function (CDF) is expressed as:
Which can be directly linked to porosity by integrating over pore volumes:
To reconcile statistical and fractal descriptions, we impose the condition that the pore number at scale follows a power law:
By comparing with the Weibull PDF, the effective fractal dimension can be expressed as:
Thus, the effective fractal dimensionis not constant but evolves dynamically as pore size distribution parameters change under stress and fluid interactions. This formulation explicitly reflects scale-dependent irregularity and bridges probabilistic and fractal models.
Limiting Cases
Homogeneous Reservoir ():, indicating near-Euclidean uniform pore geometry.
Highly Heterogeneous Reservoir (():exhibits strong dependence on pore size , reflecting multi-scale irregularity.
Dynamic Evolution: If evolves with compaction, explicitly tracks spatiotemporal heterogeneity.
2.3. Dynamic Fractal Dimension Model (DFDM)
The proposed Dynamic Fractal Dimension Modeling (DFDM) framework establishes a systematic workflow to bridge experimental pore-scale characterization with reservoir-scale predictive modeling. Unlike static fractal approaches (e.g., Image J/FracLac), DFDM explicitly incorporates temporal variability and dynamic interactions, making it particularly suited for stress-sensitive tight reservoirs.
The framework integrates five interconnected modules (Figure 1): (i) acquisition of pore-scale digital images, (ii) multi-scale decomposition using wavelet transforms, (iii) derivation of dynamic fractal dimensions through structural geometry and time-dependent corrections, and (iv) validation against experimental measurements. This hierarchical workflow transforms raw experimental data into dynamic descriptors of pore evolution, ultimately enabling numerical simulations of multi-phase flow and storage processes.
2.3.1. Governing Principles and Dynamic Scaling Law
For pore structures imaged at resolution , this definition of fractal dimension naturally extends to describe the scale-occupation relation over time. Within DFDM, is allowed to vary dynamically with the physical state of the reservoir, reflecting the coupled influence of porosity change ,stress perturbation and fluid transport volume :
This equation expresses the change in the fractal dimensionover a small time interval ,where characterizes the nonlinear coupling, establishing a process-based link between pore network evolution and fractal descriptors.
Formally, the dynamic fractal dimension is defined from the time-dependent occupation number as the local scaling exponent:
This expression captures the evolution of pore structures at different scales over time .To account for stochastic micro-structural variability and non-stationary topology, we generalize the classical power law to:
where is a normalization associated with porosity andaccounts for random micro-structural variability, This decomposition cleanly separates deterministic evolution from stochastic variability.
Wavelet analysis provides the necessary multi-resolution machinery to track these dynamics. The continuous wavelet transform and positions .
And its energy spectrum follows a fractal scaling law with Hurst exponent :
The Hurst exponent quantifies the long-term memory of pore structure evolution, reflecting the self-similar behavior of the pore network across different scales.
In 2D slices (or 3D volumes with the appropriate embedding dimension ), the relation links spectral roughness to geometric complexity: larger implies smoother, more persistent connectivity (smaller ); smaller implies irregular, fracture-dominated patterns (larger ).
Under static equilibrium, is time-invariant and, then the fractal dimension reduces to a constant value . However, under dynamic conditions (such as during compaction, fracture development, or fluid injection), the fractal dimension evolves as a function of both time and pore structure changes, reflecting the dynamic coupling between mechanical compaction, fluid flow, and diagenesis. The evolution of pore networks in tight reservoirs arises from two dominant processes: mechanical compaction and stress redistribution, reducing pore volume; Fluid-rock interactions, dissolving pores or fractures at multiple scales. We therefore define the dynamic fractal dimension as a spatiotemporal field variable, dependent on both time and spatial coordinate :
Here, denotes the local occupation number of pores at resolution , time , and position . Building on this spatiotemporal definition, the classical scaling laws must be generalized to incorporate temporal variability, motivating a Dynamic Scaling Law in which time-dependent coefficients capture the evolving effects of stress, fluid flow, and diagenesis.
Here, represents the initial scaling constant linked to porosity at, is the compaction rate parameter that governs pore size evolution. By differentiating the generalized power-law scaling equation with respect to time, we derive the dynamic scaling equation, which links the time-dependent evolution of the fractal dimension to the temporal variation in the pore network structure:
This equation quantifies how the internal reorganization of the pore network modulates the rate of change of fractal dimension.
2.3.2. Wavelet Spectral Estimation
The wavelet energy spectrum of pore images evolves with time as:
This equation reflects the redistribution of pore-scale heterogeneity across scales, allowing dynamic tracking of structural evolution, where a is scale, b is position, and t is time. Empirically,
enabling a direct time-resolved estimate of the Hurst exponent and, via of the dynamic fractal dimension. Physically, higher indicates more persistent, better-connected structures; lowerindicates increased irregularity or the emergence of fractures and channels.
To incorporate stress and flow effects in a tractable way for reservoir-scale simulations, we approximate the time-varying fractal dimensioninferred from wavelet spectra by a reduced-order phenomenological expression:
Here, denotes the static baseline fractal dimension (≈2.57 in this study), and quantify temporal and spatial attenuation, respectively, represents the local oscillations, anddamps those oscillations. This surrogate preserves the dominant multi-scale trends revealed by wavelets while keeping the subsequent numerical model computationally efficient.
2.3.3. Coupled Fluid-Solid Interaction
Beyond spectral estimation, pore structure dynamics are also strongly influenced by external driving forces, particularly the coupling between stress perturbations and fluid invasion. We define an effective fractal dimension governed by the competition between mechanical compaction (stress tensor ) and flow-driven enhancement (pressure gradient ):
Here,quantifies stress sensitivity (volumetric stress promotes pore closure and structural simplification), while quantifies fluid-induced dissolution/scouring and the opening of new flow channels.
Diagnostic regimes:
Pure mechanical compaction ():,fractal dimension decreases monotonically as pores collapse under stress.
Pure fluid dissolution ,fractal dimension increases due to flow-driven pore opening and dissolution.
Steady-state equilibrium ,pore system reaches a dynamic equilibrium where compaction and dissolution exactly balance, maintaining a stable fractal state.
This formulation indicates that compaction processes generally decrease fractal complexity, whereas fluid-solid interactions driven by strong pressure gradients enhance it, highlighting the competing roles of stress and flow in governing pore evolution, providing a first-order closure linking fractal descriptors to measurable geomechanical and hydraulic parameters.
2.3.4. Dynamic Porosity-Permeability Relationship
To connect fractal dynamics to transport properties, we express porosityand permeability as functions ofFollowing Katz-Thompson-type scaling, permeability obeys a fractal-dependent power law:
The equation describes how permeability evolves over time as a function of porosity, with the fractal dimension dictating the scaling relationship between these two properties. This is based on the assumption that changes in the pore network structure, as characterized by, significantly influence the connectivity of the pore spaces, which in turn impacts the flow characteristics of the reservoir.
Mechanistically, decreasingunder compaction generally correlates with declining permeability, while increasingunder fluid-induced reorganization correlates with enhanced permeability through improved connectivity. Tracking the evolution of therefore provides a predictive handle on how reservoir processes (compaction, dissolution, fracture activation) reshape the permeability-porosity relation over time.
2.4. Governing Equation for Spatiotemporal Fractal Evolution
2.4.1. Field Representation
We consider the fractal dimension as a continuous scalar field defined over the reservoir domain . Its dynamics are driven by competing processes: Compaction-driven reduction, caused by mechanical stress and pore closure; Fluid-driven enhancement, arising from dissolution, fracturing, and reorganization; Diffusive smoothing, redistributing pore-scale heterogeneity across scales. Thus, the general governing PDE takes the form:
Here, is the fractal diffusivity (smoothing coefficient), the diffusive term smooths local fluctuations in pore-scale heterogeneity; is the stress-compaction coefficient, the compaction termaccounts for stress-driven pore closure; is the fluid enhancement coefficient, the fluid-driven enhancement term reflects dissolution and flow-induced reorganization of pore networks. The stochastic forcing term captures random fracture nucleation, mineral dissolution, and other unresolved micro-scale processes.
This PDE naturally embeds the dynamic porosity-permeability relationship (Section 2.3.4) within a spatiotemporal framework. Specifically, the solution of governs the evolution of porosity and permeability across the reservoir domain, thereby coupling micro-scale fractal dynamics with macro-scale transport properties.
Porosity evolves in tandem with fractal dimension, a nonlinear coupling is assumed:
Here, is a compaction rate and is a monotonic function, e.g.,.
Similarly,Permeability follows a fractal-dependent scaling (cf. Katz-Thompson):
This formulation highlights the bidirectional feedback between fractal dynamics and reservoir properties: fractal evolution modifies porosity and permeability, while in turn stress and fluid-rock interactions drive changes in fractal geometry.
2.4.2. Limiting Cases of the PDE
The general PDE admits several limiting forms under specific physical conditions, which provide physical intuition for the role of diffusion, stress, and flow.
Case 1: Pure Diffusion .
This case corresponds to the redistribution of pore-scale heterogeneity without net gain or loss of pore volume, analogous to a heat equation-pore complexity homogenizes over time.
Case 2: Stress-Dominated Under this regime, compaction continuously decreases pore connectivity, fractal dimension decreases steadily with compaction monotonically.
Case 3: Flow-DominateHere, Dissolution and flow-driven reorganization promote the opening of new pathways, leading to an increase in fractal complexity.
These limiting cases highlight the fundamental physical regimes captured by the governing PDE, ranging from pure diffusion to stress- and flow-dominated evolution.
2.5. Numerical Implementation Strategy
2.5.1. Discretization
We discretize the governing PDE using a finite element/finite volume method, depending on the geometry of reservoir samples. The weak formulation is:
Here, is a test function. In practice, dynamic fractal dimension calculations can be implemented using both box-counting and wavelet-based methods. MATLAB routines and ImageJ plugins (e.g., FracLac) enable efficient fractal estimation and numerical stability. This combined strategy highlights the advantage of wavelet transforms in resolving multi-scale dynamics, whereas box-counting offers a robust baseline for static scaling analysis.
2.5.2. Multi-scale Up-scaling and Stability Constraints
Since reservoir processes span nano-meters to meters, we adopt a two-scale strategy to ensure both physical and numerical stability.
Micro-scale (cast thin-section images): Fractal evolution is extracted at representative elementary volumes (REV), typically using high-resolution pore-scale imaging.
Macro-scale (reservoir grid): Effective fields of ,andare obtained by homogenization and transferred into reservoir-scale simulations.
To guarantee well-posed numerical evolution during up-scaling, additional stability constraints are imposed:
Positivity Constraint: .
Energy Dissipation Constraint: .
These constraints prevent nonphysical divergence and guarantee monotonic energy decay, ensuring robust numerical solutions during up-scaling.
2.6. Validation and Experimental Bench-Marking
2.6.1. Experimental Data and Calibration
Validation of the DFDM framework relies on high-resolution experimental datasets:
Case Thin-Section Images: Provide high-resolution 2D pore maps under stress and fluid perturbations, enabling direct assessment of spatiotemporal fractal evolution.
Displacement experiments: Capture multi-phase flow behavior and fluid-rock interactions, serving as benchmarks for evaluating the predictive capability.
Calibration is performed by computing spatial correlation functions:
Ensuring that the simulated pore structures and flow dynamics reproduced the experimental observations from these datasets. Importantly, cast thin-section imaging constrains the structural heterogeneity of the pore system, while displacement experiments constrain the dynamic flow behavior, making them complementary to the DFDM framework. This integration enhances the reliability and robustness of the subsequent simulations.
2.6.2. Model Validation and Bench-marking
Validation proceeds through comparison between DFDM predictions and experimental measurements:
Static Validation: At , the predicted baseline fractal dimension was benchmarked against values derived from case thin-section images (Figure 2). The close agreement (deviation <5%) ensured correct initialization of DFDM simulations.
Dynamic Validation: The temporal evolution of predicted by DFDM was compared against experimental curves obtained from CO2 flooding through long cores under controlled injection conditions. The error metric was quantified as:
With acceptable agreement defined as across multiple time scales.
Although explicit boundary-condition-limiting tests (e.g., pure compaction, pure dissolution) were not performed, the CO2 flooding experiments inherently encapsulated competing effects of stress-induced compaction and fluid-driven dissolution. This indirect validation demonstrated the model’s ability to capture spatiotemporal evolution of pore networks under realistic reservoir conditions.
Figure 2 illustrates the image-to-fractal workflow, where thin-section micro-graphs were processed into binary pore-matrix representations and analyzed via box-dimension regression, yielding baseline fractal descriptors for DFDM initialization and subsequent validation.
In this context, image-based analysis provides an intuitive bridge between experimental observation and model validation. As illustrated in Figure 2, the workflow begins with thin-section micro-graphs of the rock matrix (a), which are subsequently converted into binary pore-matrix representations (b). These segmented images are then subjected to box-dimension regression using the MATLAB interface (c), yielding quantitative fractal dimensions. This sequence explicitly demonstrates how pore-scale heterogeneity, captured through imaging, is rigorously translated into mathematical descriptors that can be bench-marked against the predictions of the Dynamic Fractal Dimension Model (DFDM).
2.6.3. Statistical Confidence
The robustness of DFDM was further established by assessing statistical confidence across experimental datasets. Quantitative agreement between model predictions and experimental measurements was evaluated using the coefficient of determination:
A predictive model requires . The obtained values exceeded this threshold, confirming that DFDM reliably reproduces both structural constraints from thin-section analysis and flow constraints from CO2 flooding experiments. By explicitly integrating temporal variability, fluid-solid coupling, and spatiotemporal PDEs, DFDM provides a rigorous predictive framework for pore-structure evolution in stress-sensitive reservoirs, with direct implications for CO2 storage and enhanced hydrocarbon recovery.
3. Results and Discussion
The proposed Dynamic Fractal Dimension Modeling (DFDM) framework provides a systematic approach to quantify the spatiotemporal evolution of pore structures in tight reservoirs, bridging pore-scale imaging with predictive reservoir-scale simulations. By explicitly incorporating temporal variability into fractal characterization, DFDM represents a paradigm shift from static pore-scale descriptors to dynamic, predictive modeling of reservoir evolution.
In this section, we present the numerical predictions, experimental validations, and mechanistic insights derived from DFDM, followed by a critical discussion of model robustness, limitations, and implications for reservoir engineering. To assess the predictive capacity of the framework, model outputs were directly compared with laboratory measurements, sensitivity analysis with alternative parameter sets underscores the model’s adaptability to varying geological conditions.
Together, these results confirm that DFDM not only advances the theoretical understanding of fractal pore dynamics but also provides a practical tool for predicting reservoir behavior in unconventional hydrocarbon recovery and CO2 sequestration. The simulation results form the basis for the following discussion, including spatiotemporal evolution, mechanistic insights, and model validation and limitations.
3.1. Spatiotemporal Evolution of Fractal Dimension
The spatiotemporal evolution of fractal dimensions under CO₂ flooding reflects the coupled effects of pore-scale heterogeneity, stress sensitivity, and multi-phase flow. To capture this process, a stepwise framework is employed, beginning with static baseline derived from thin-section imaging, followed by experimental observation of pressure propagation, and ultimately dynamic prediction through the DFDM approach. Figure 3, Figure 4 and Figure 5 collectively illustrate this progression: the static fractal baseline (Figure 3), the experimentally observed displacement stages (Figure 4), and the predicted dynamic evolution of fractal dimension (Figure 5).
The static fractal dimension obtained from thin-section images provides a necessary reference for evaluating the dynamic evolution of pore structures under CO2 flooding. As illustrated in Figure 3, the box-counting regression applied to binary micro-graphs yields a fractal dimension of approximately .
To further investigate displacement behavior, pressure-propagation experiments were carried out along a long-core sample during CO2 injection. The measured pressure responses at nine monitoring points reveal systematic changes over time. As shown in Figure 4, three distinct stages can be identified: (i) the mixed-phase formation stage, (ii) the mixed-phase displacement stage, and (iii) the gas post-breakthrough stage. These transitions mark the progressive redistribution of pore pressure and reflect the underlying stress-sensitive heterogeneity of the rock matrix.
To further interpret these experimental findings, DFDM was applied to predict the spatiotemporal distribution of fractal dimension ,the results are presented in Figure 5. The contour map demonstrates a systematic evolution from higher values near the injection point toward lower values after breakthrough as CO2 flooding proceeds. Notably, the baseline dimension serves as a transition threshold: values above this baseline correspond to relatively well-connected pore networks during early displacement, while reductions belowmark the onset of channelization and non-uniform flow. The predicted dynamic range (1.5-2.8) aligns with experimental observations and remains physically consistent with pore-scale heterogeneity and stress-induced permeability alterations.
3.2. Model Validation and Predictive Robustness
The predictive capability of the Dynamic Fractal Dimension Model (DFDM) must be validated to ensure its applicability under reservoir-relevant conditions. While the static fractal dimension () has been experimentally determined and serves as the baseline descriptor of pore structures, direct measurements of dynamic fractal dimensions are not available. To address this limitation, the validation strategy adopted here relies on three complementary aspects: (i) consistency of predicted trends with experimental pressure responses and pore-network evolution, (ii) alignment of the initial condition with the experimentally derived static fractal dimension, and (iii) agreement with scaling behaviors reported in previous studies.
As illustrated in Figure 6, the DFDM framework predicts a progressive decline in the fractal dimension with increasing cumulative CO2 injection volume. Two parameter sets are shown to represent the range of model variability (solid and dashed lines). The experimental static fractal dimension () is included as a reference point at the onset of injection, serving as the critical anchor for validation. Although direct dynamic measurements are absent, the predicted reduction of D is physically consistent with pore-network simplification, compaction-induced stress redistribution, and non-uniform flow patterns during CO2 flooding. This agreement underscores the physical plausibility of DFDM predictions.
Beyond validation, A systematic sensitivity analysis was performed to evaluate the robustness of DFDM predictions under parameter perturbations. Variations in the scaling exponent, stress-coupling coefficient, and initial pore heterogeneity were introduced to examine their influence on the predicted fractal dimension . Results (Figure 7) demonstrate that while parameter changes shift the detailed trajectory of, the overall predictive fidelity and mechanistic stability of the framework are preserved.
3.3. Mechanistic Insights: Stress Sensitivity and Flow-Driven Processes
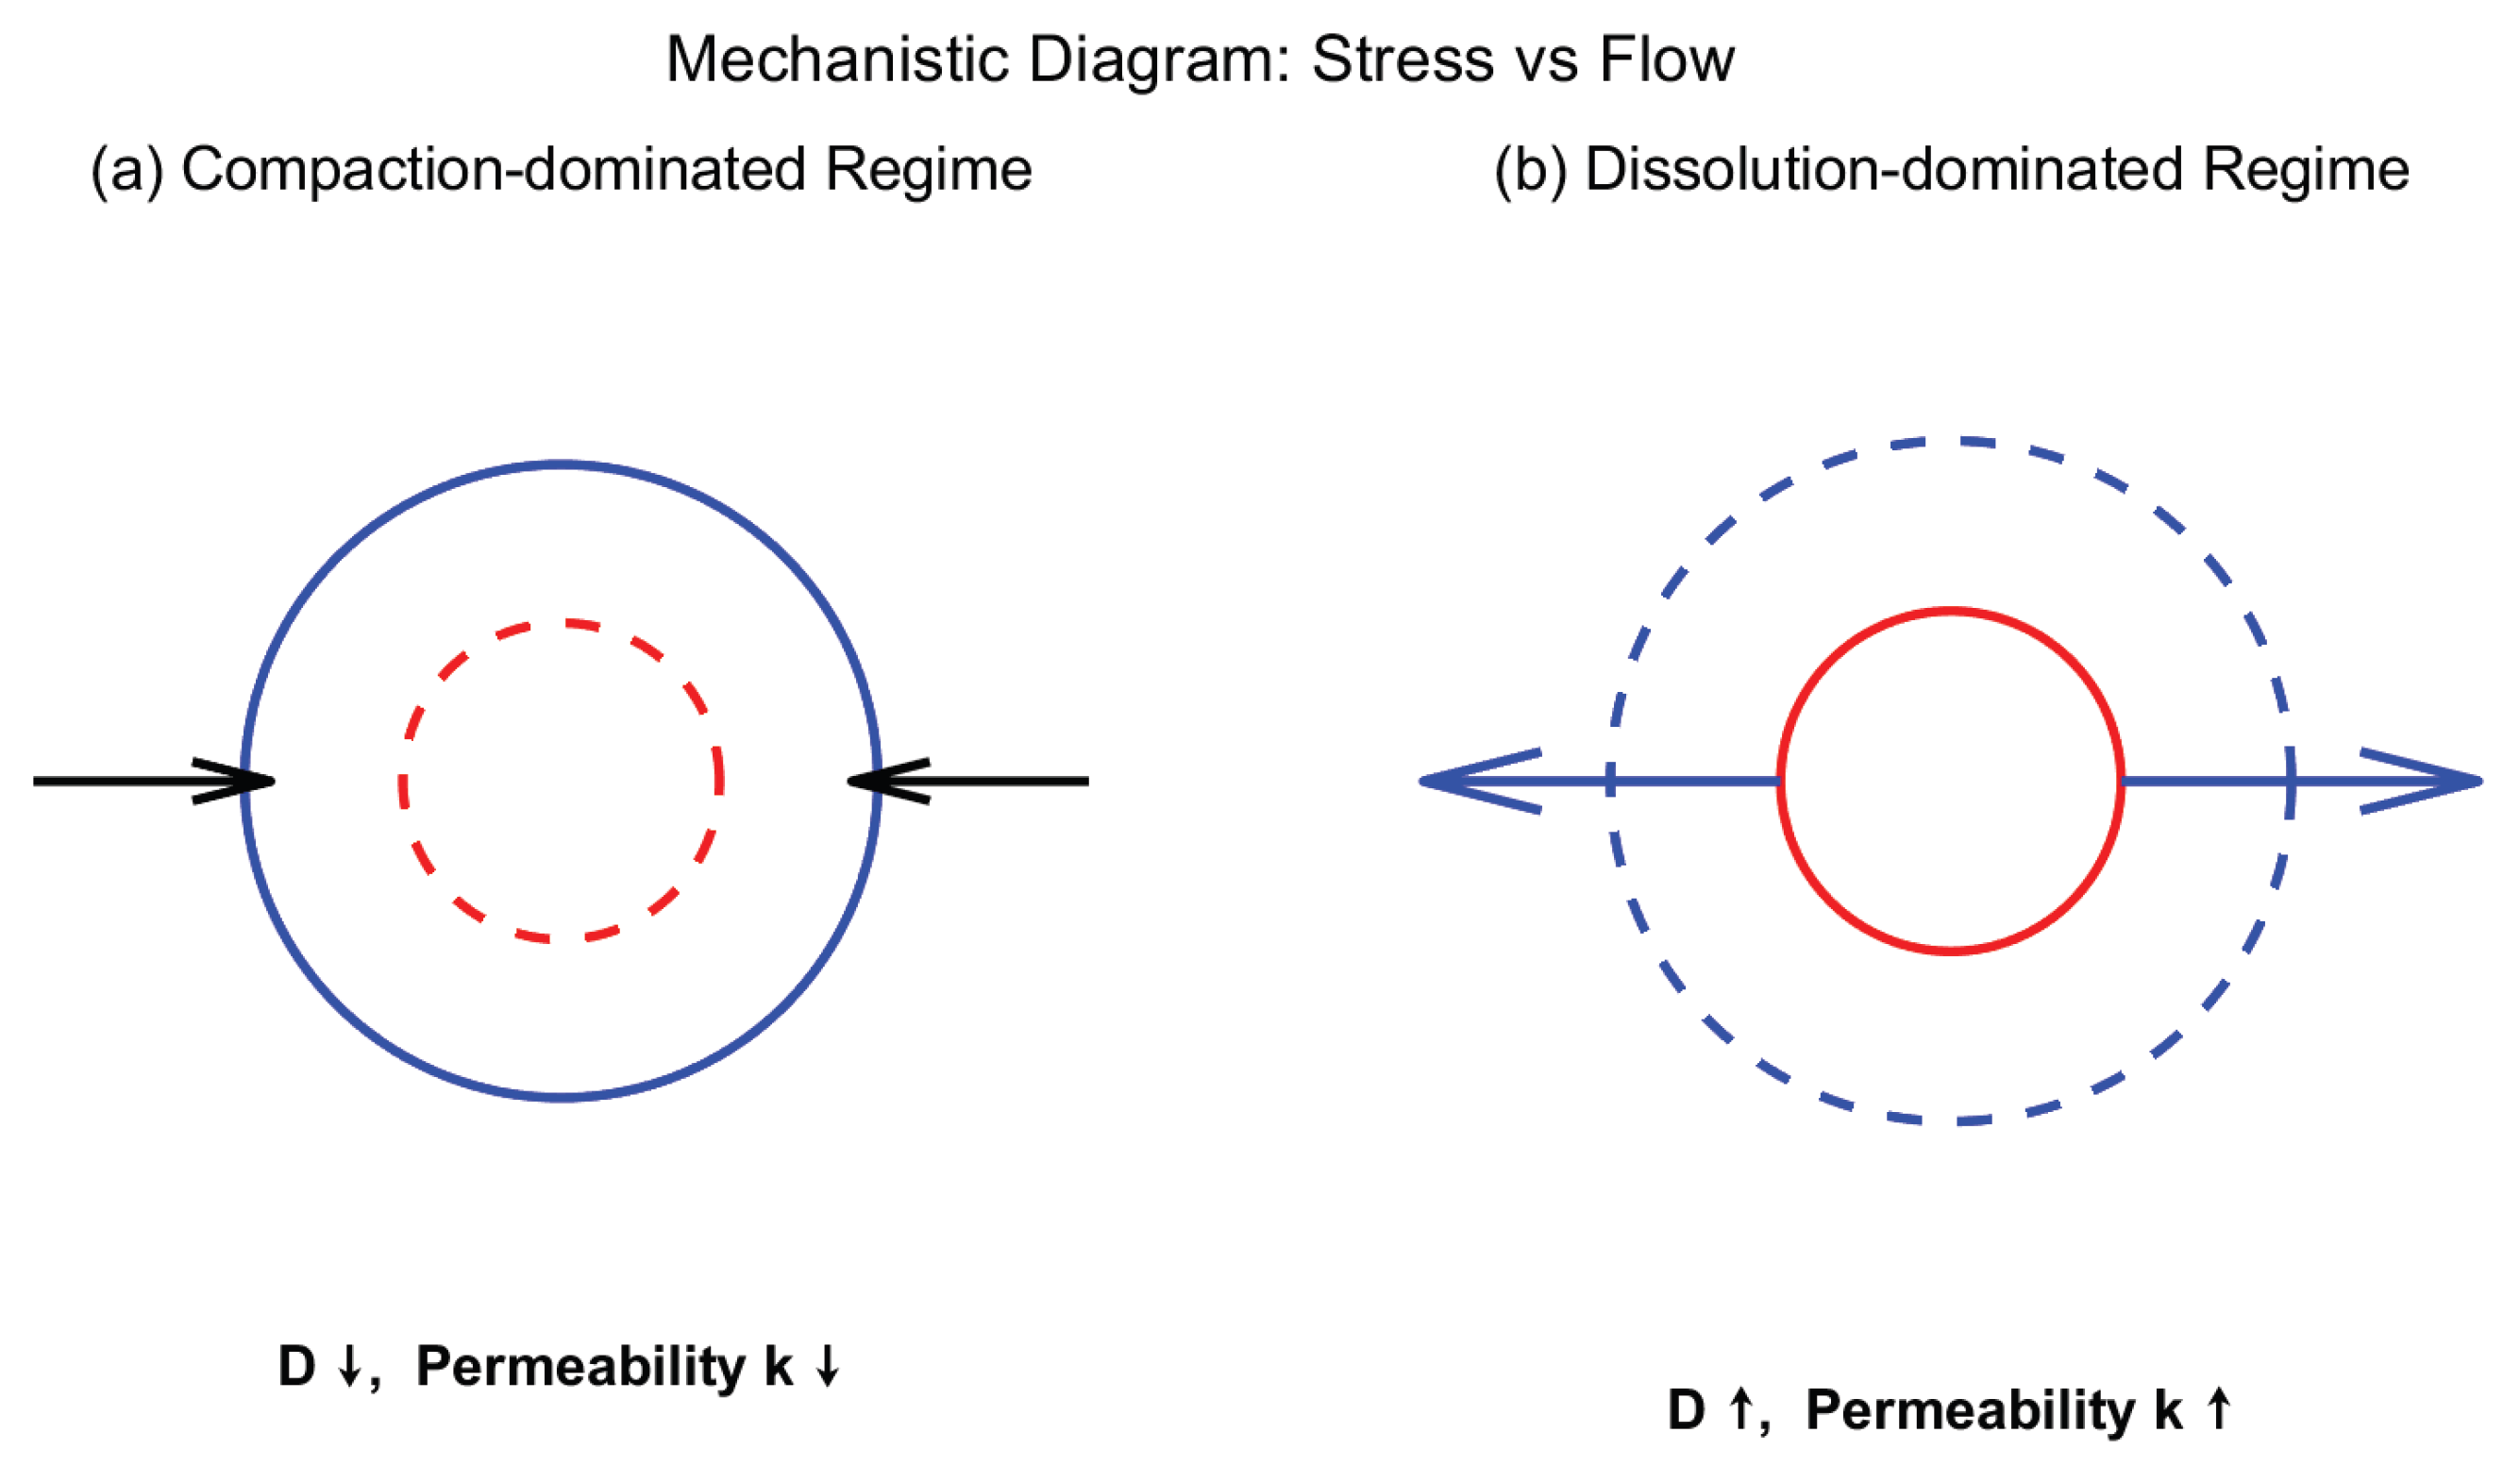
The mechanistic analysis reveals the fundamental competition between stress-induced compaction (reducing D and permeability) and flow-driven dissolution/enhancement (increasing D and improving connectivity), As illustrated in Figure 8, these dual regimes delineate the operational bounds of reservoir evolution:
Compaction-dominated regime: Pore contraction reduces connectivity, leading to permeability loss.
Flow-driven regime: Fluid injection enlarges pore structures, accelerating flow pathways.
By explicitly resolving these dual processes, DFDM provides a mechanistic closure between fractal descriptors and stress-flow interactions, extending beyond descriptive statistics toward predictive physical modeling of pore-network evolution.
3.4. Comparative Performance and Model Limitations
While DFDM exhibits substantial predictive capability, several limitations warrant critical evaluation. First, the computational demand remains high, limiting large-scale applications without advanced solvers. Second, the predictive accuracy of DFDM is strongly dependent on the representativeness of input data, reconstructions derived from 2D thin-section images, for instance, may under-sample sub-resolution heterogeneities that are critical for transport dynamics, thereby introducing scale-dependent biases. Third, the model’s sensitivity to stress, fracture-pore coupling coefficients, and boundary conditions introduces non-negligible uncertainties when extrapolating beyond controlled laboratory settings.
Nonetheless, the hierarchical architecture of DFDM renders it highly extensible. Integration with machine-learning-assisted parameter estimation, physics-informed neural networks, or hybrid multi-scale solvers could substantially reduce computational demands and enhance generalizability. Despite its limitations, DFDM offers a robust, physically grounded pathway for bridging pore-scale heterogeneity with reservoir-scale performance.
4. Conclusions
This study introduces a Dynamic Fractal Dimension Modeling (DFDM) framework to quantify the spatiotemporal evolution of pore structures in tight reservoirs. By integrating high-resolution thin-section imaging, CO2 long-core displacement experiments, wavelet-based fractal methods, and structural fractal geometry, DFDM advances beyond conventional static fractal approaches to establish a dynamic, time-resolved representation of pore heterogeneity under reservoir-relevant conditions.
The results show that DFDM successfully captures critical transitions in pore complexity during CO2 flooding, linking stress-induced compaction and flow-driven reorganization with measurable changes in fractal dimension. Model validation against laboratory experiments demonstrates strong agreement with pressure responses, while sensitivity analysis confirms robustness across varying geological settings.
The framework provides direct implications for reservoir engineering: (i) predicting permeability loss and optimizing injection strategies in enhanced oil recovery, (ii) evaluating capacity and long-term stability in geological CO2 storage, and (iii) extending to geothermal systems, aquifers, and engineered porous media where heterogeneity governs multi-phase flow.
In summary, DFDM introduces a dynamic and predictive approach to pore-scale heterogeneity, bridging imaging, fractal geometry, and stress-coupled transport. This methodological innovation not only advances theoretical understanding of fractal pore dynamics but also establishes a practical tool for energy recovery, carbon sequestration, and sustainable subsurface resource management. DFDM unifies pore-scale imaging and reservoir-scale modeling, offering a robust framework to quantify and predict dynamic heterogeneity in subsurface energy systems.
Author Contributions
Conceptualization, X.Y. and J.-Y.L.; Methodology, X.Y.; Software, X.Y.; Validation, J.-Y.L.; Formal analysis, X.Y.; Investigation, X.Y.; Resources, J.-Y.L.; Data curation, X.Y.; Writing-original draft, X.Y.; Writing-review & editing, J.-Y.L.; Visualization, X.Y.; Supervision, J.-Y.L.; Project administration, J.-Y.L. All authors have read and agreed to the published version of the manuscript.
Funding
This research did not receive any specific grant from funding agencies in the public, commercial, or not-for-profit sectors.
Data Availability Statement
Data will be made available on request.
Conflicts of Interest
The authors declare no conflicts of interest.
References
- Jiang, W.; Zhang, Y.; Ma, T.; Chen, S.; Hu, Y.; Wei, Q.; Zhuang, D. Pore Structure and Its Fractal Dimension: A Case Study of the Marine Shales of the Niutitang Formation in Northwest Hunan, South China. Fractal Fract. 2025, 9, 49. [CrossRef]
- Hazra, B.; A Wood, D.; Panda, M.; Sethi, C.; Vishal, V.; Chandra, D.; Ostadhassan, M. Pore Structural Complexities and Gas Storage Capacity of Indian Coals with Various Thermal Maturities. Energy Fuels 2025, 39, 5818–5831. [CrossRef]
- Guan, W.; Cai, W.; Li, Z.; Lu, H. Microscopic Characterization and Fractal Analysis of Pore Systems for Unconventional Reservoirs. J. Mar. Sci. Eng. 2024, 12, 908. [CrossRef]
- Karimpouli, S.; Tahmasebi, P. 3D multi-fractal analysis of porous media using 3D digital images: considerations for heterogeneity evaluation. Geophys. Prospect. 2018, 67, 1082–1093. [CrossRef]
- Isah, A.; Mahmoud, M.; Eltom, H.; Salih, M.; Arif, M.; Aljawad, M.S. Exploring the Impact of Mineralogy on Pore Structure and Fluid Dynamics in Tight Reservoir Rocks: Insights for Enhanced Oil Recovery and Gas Storage. Arab. J. Sci. Eng. 2024, 50, 5055–5080. [CrossRef]
- He, S.-H.; Ding, Z.; Hu, H.-B.; Gao, M. Effect of Grain Size on Microscopic Pore Structure and Fractal Characteristics of Carbonate-Based Sand and Silicate-Based Sand. Fractal Fract. 2021, 5, 152. [CrossRef]
- Dathe, A.; Thullner, M. The relationship between fractal properties of solid matrix and pore space in porous media. Geoderma 2005, 129, 279–290. [CrossRef]
- Daniels, J.K.; Myers, M.T.; Hathon, L.A. Estimating Fractal Dimension as a Spatially Correlated Pore Structure Heterogeneity Measure from Rate-Controlled Capillary Pressure Curves. SPE Annual Technical Conference and Exhibition. LOCATION OF CONFERENCE, United StatesDATE OF CONFERENCE;
- Cheng, Y.; Luo, X.; Zhuo, Q.; Gong, Y.; Liang, L. Description of Pore Structure of Carbonate Reservoirs Based on Fractal Dimension. Processes 2024, 12, 825. [CrossRef]
- Gonzalez, J. Multifractal statistic of porous structures simulated through fully penetrable sphere models. Phys. A: Stat. Mech. its Appl. 2021, 567. [CrossRef]
- Chen, C.; Ding, X.; Wang, Y.; Luo, Z.; Zhai, P. Fractal Dimension Analysis of Structure and Bending Strength of Porous Alumina Prepared Using Starch and Carbon Fiber as Pore-Forming Agents. Fractal Fract. 2022, 6, 574. [CrossRef]
- Ayad, A. Applications of Fractal Geometry in Geosciences: A Literature Review. Int. Res. J. Multidiscip. Scope 2025, 06, 1472. [CrossRef]
- Theiler, J. Estimating fractal dimension. 1990, 7, 1055-1073.
- Mallat, S. A Wavelet Tour of Signal Processing, 2nd ed.; Academic Press: San Diego, CA, USA, 1999.
- Ullah, A.S.; D’addona, D.M.; Seto, Y.; Yonehara, S.; Kubo, A. Utilizing Fractals for Modeling and 3D Printing of Porous Structures. Fractal Fract. 2021, 5, 40. [CrossRef]
- Turlapati, V.Y.; Prusty, B.K.; Bakshi, T. Detailed Pore Structure Study of Damodar Valley and Upper Assam Basin Shales Using Fractal Analysis. Energy Fuels 2020, 34, 14001–14011. [CrossRef]
- Mousa, S.; Rigby, S.P. Fractal Modelling of Heterogeneous Catalytic Materials and Processes. Materials 2024, 17, 5363. [CrossRef]
- El-Dib, Y.O.; Mady, A.A.; Alyousef, H.A. Interfacial stability control of MHD Bingham fluids in micro-porous MEMS structures via fractal analysis. Front. Phys. 2025, 13, 1634769. [CrossRef]
- Blair, J.M.; Falconer, R.E.; Milne, A.C.; Young, I.; Crawford, J.W. ModelingThree-Dimensional Microstructure in Heterogeneous Media. Soil Sci. Soc. Am. J. 2007, 71, 1807–1812. [CrossRef]
- Basham, M.R.; Cerato, A.B.; Tabet, W.E. Using Fractal Geometry Theory to Quantify Pore Structure Evolution and Particle Morphology of Stabilized Kaolinite. J. Mater. Civ. Eng. 2024, 36. [CrossRef]
Figure 1.
Conceptual workflow of the Dynamic Fractal Dimension Modeling (DFDM) framework. The framework integrates multi-scale imaging and laboratory experiments with fractal analysis, dynamic fractal dimension modeling, governing PDEs, and numerical solvers, ultimately linking pore-scale heterogeneity with reservoir-scale applications such as CO2 sequestration, enhanced oil recovery (EOR), and unconventional hydrocarbon recovery.
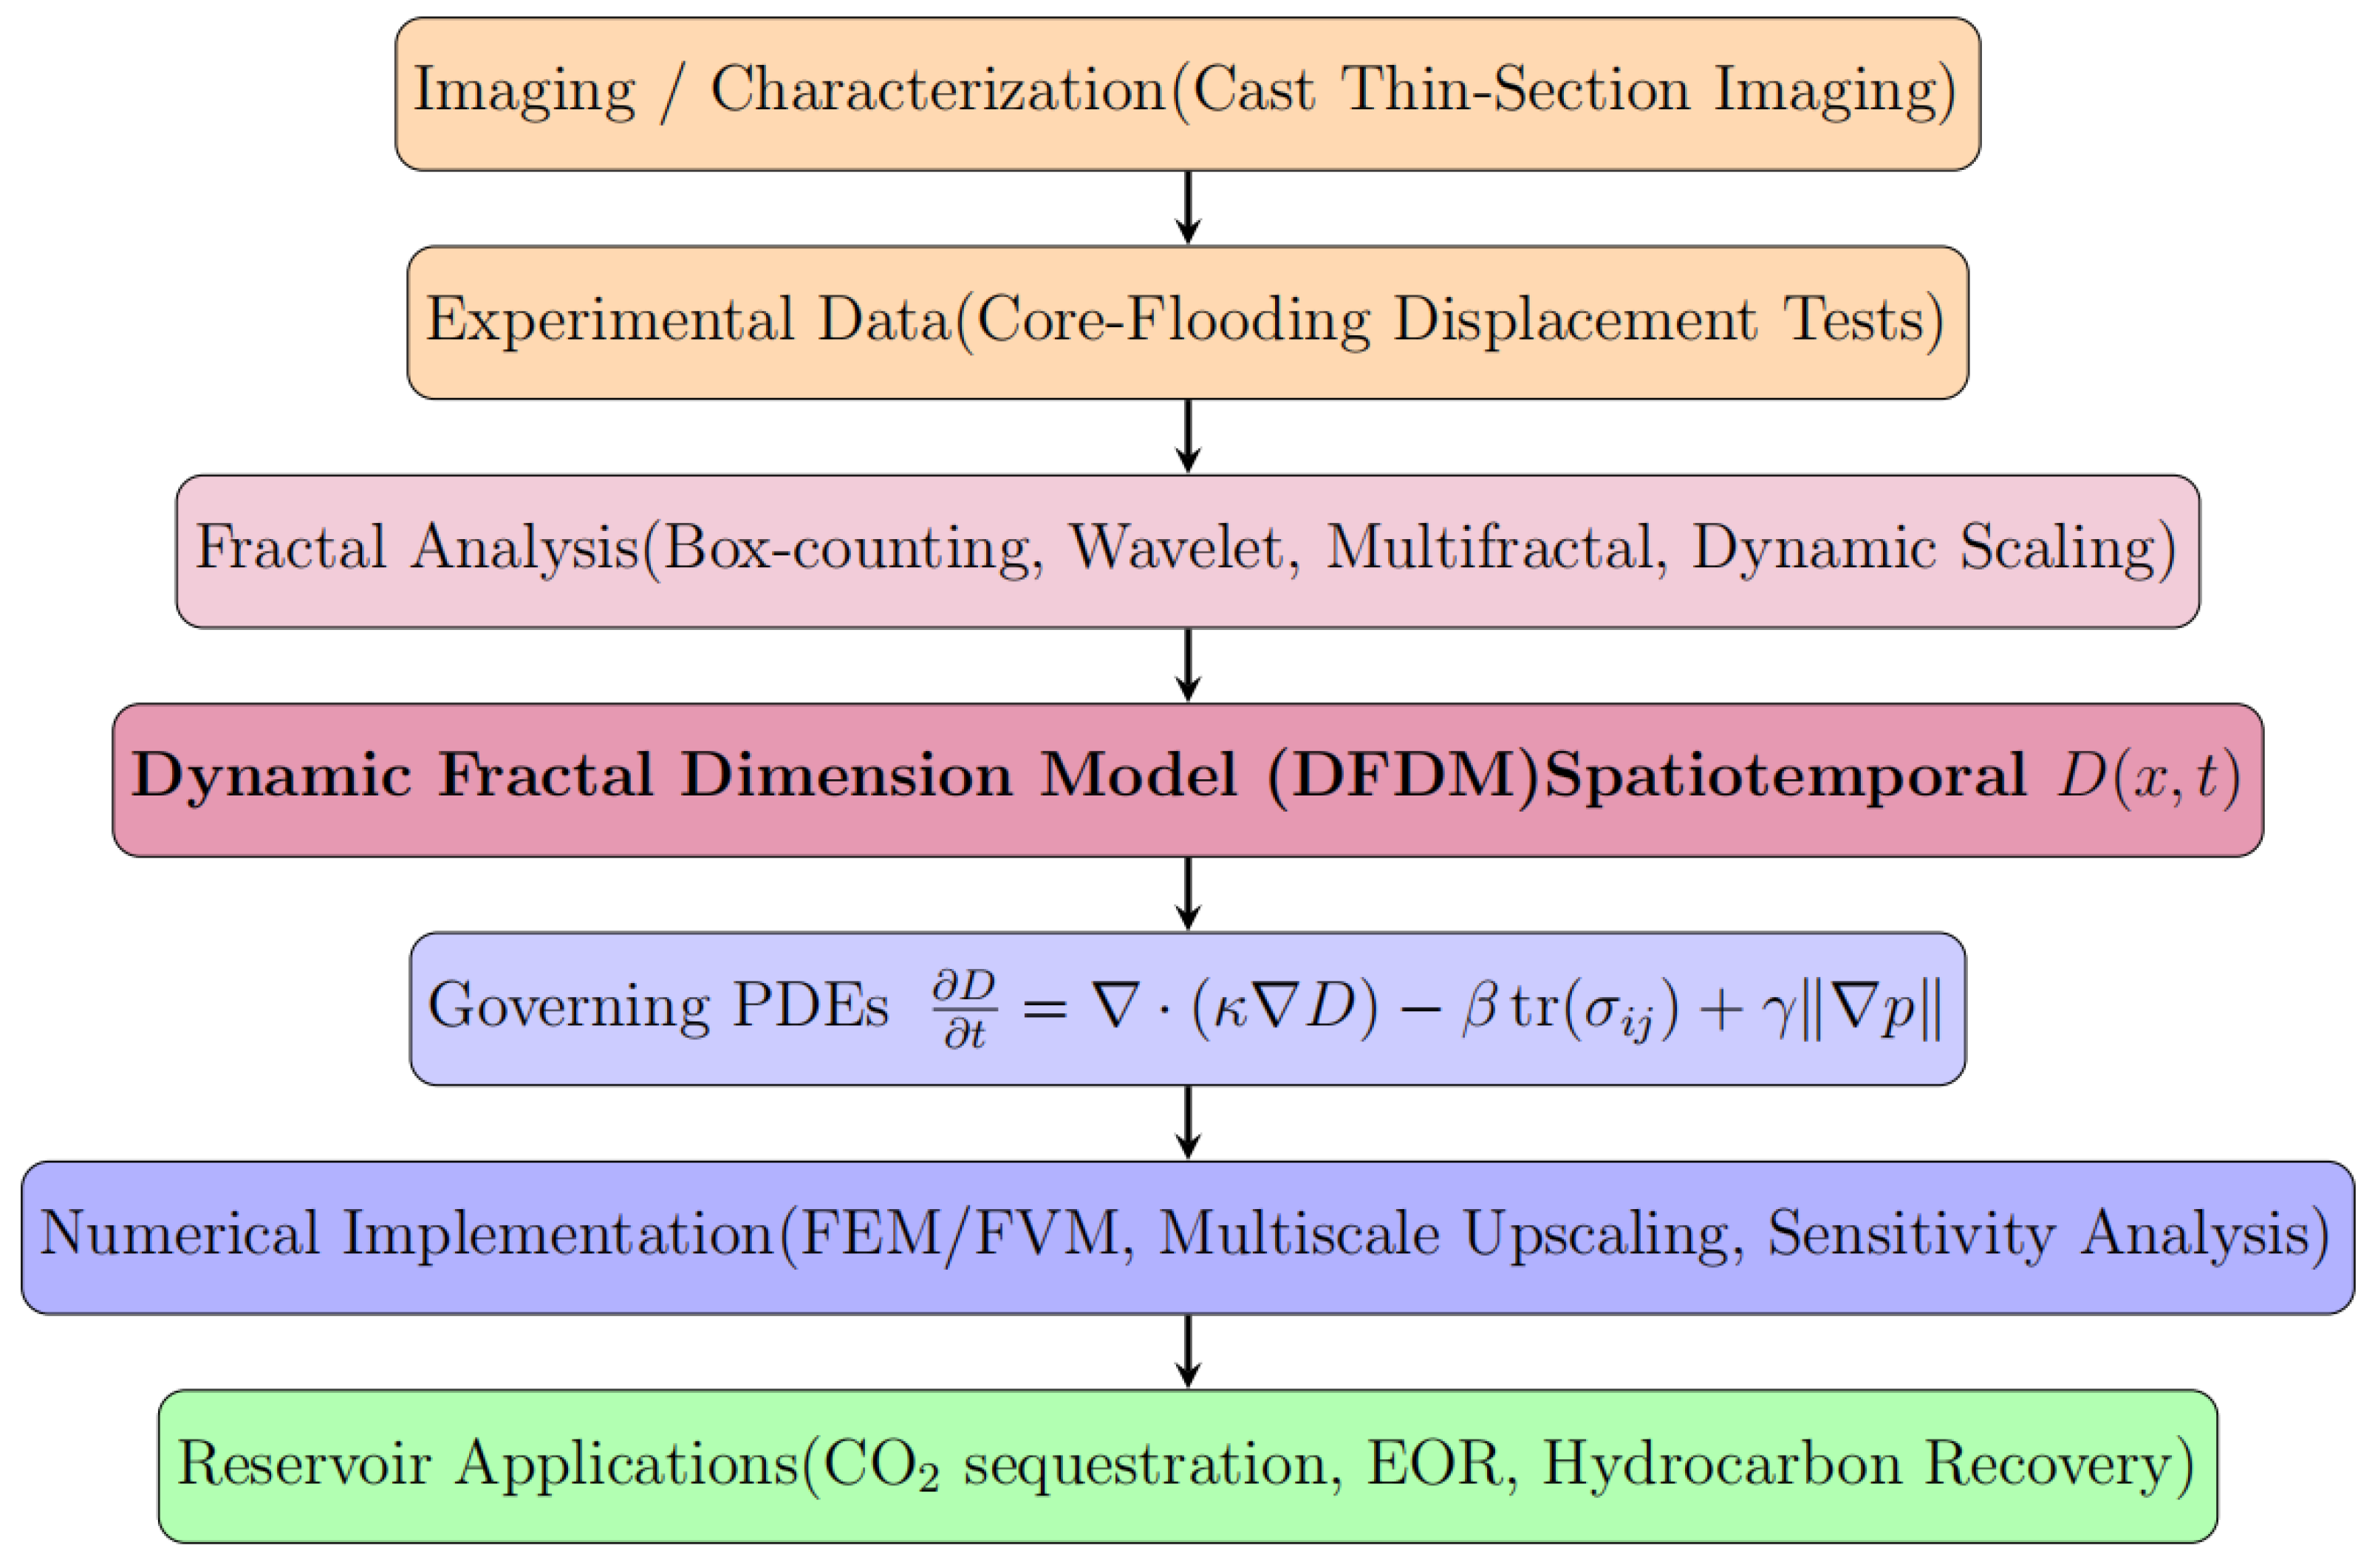
Figure 2.
Representative example of fractal dimension estimation using image-based analysis. (a) Thin-section micro-graph, (b) binary segmentation of pore-matrix, (c) box-dimension regression output from MATLAB interface. The regression in (c) yields a static fractal dimension of approximately, which is adopted as the baseline value for initializing DFDM predictions.
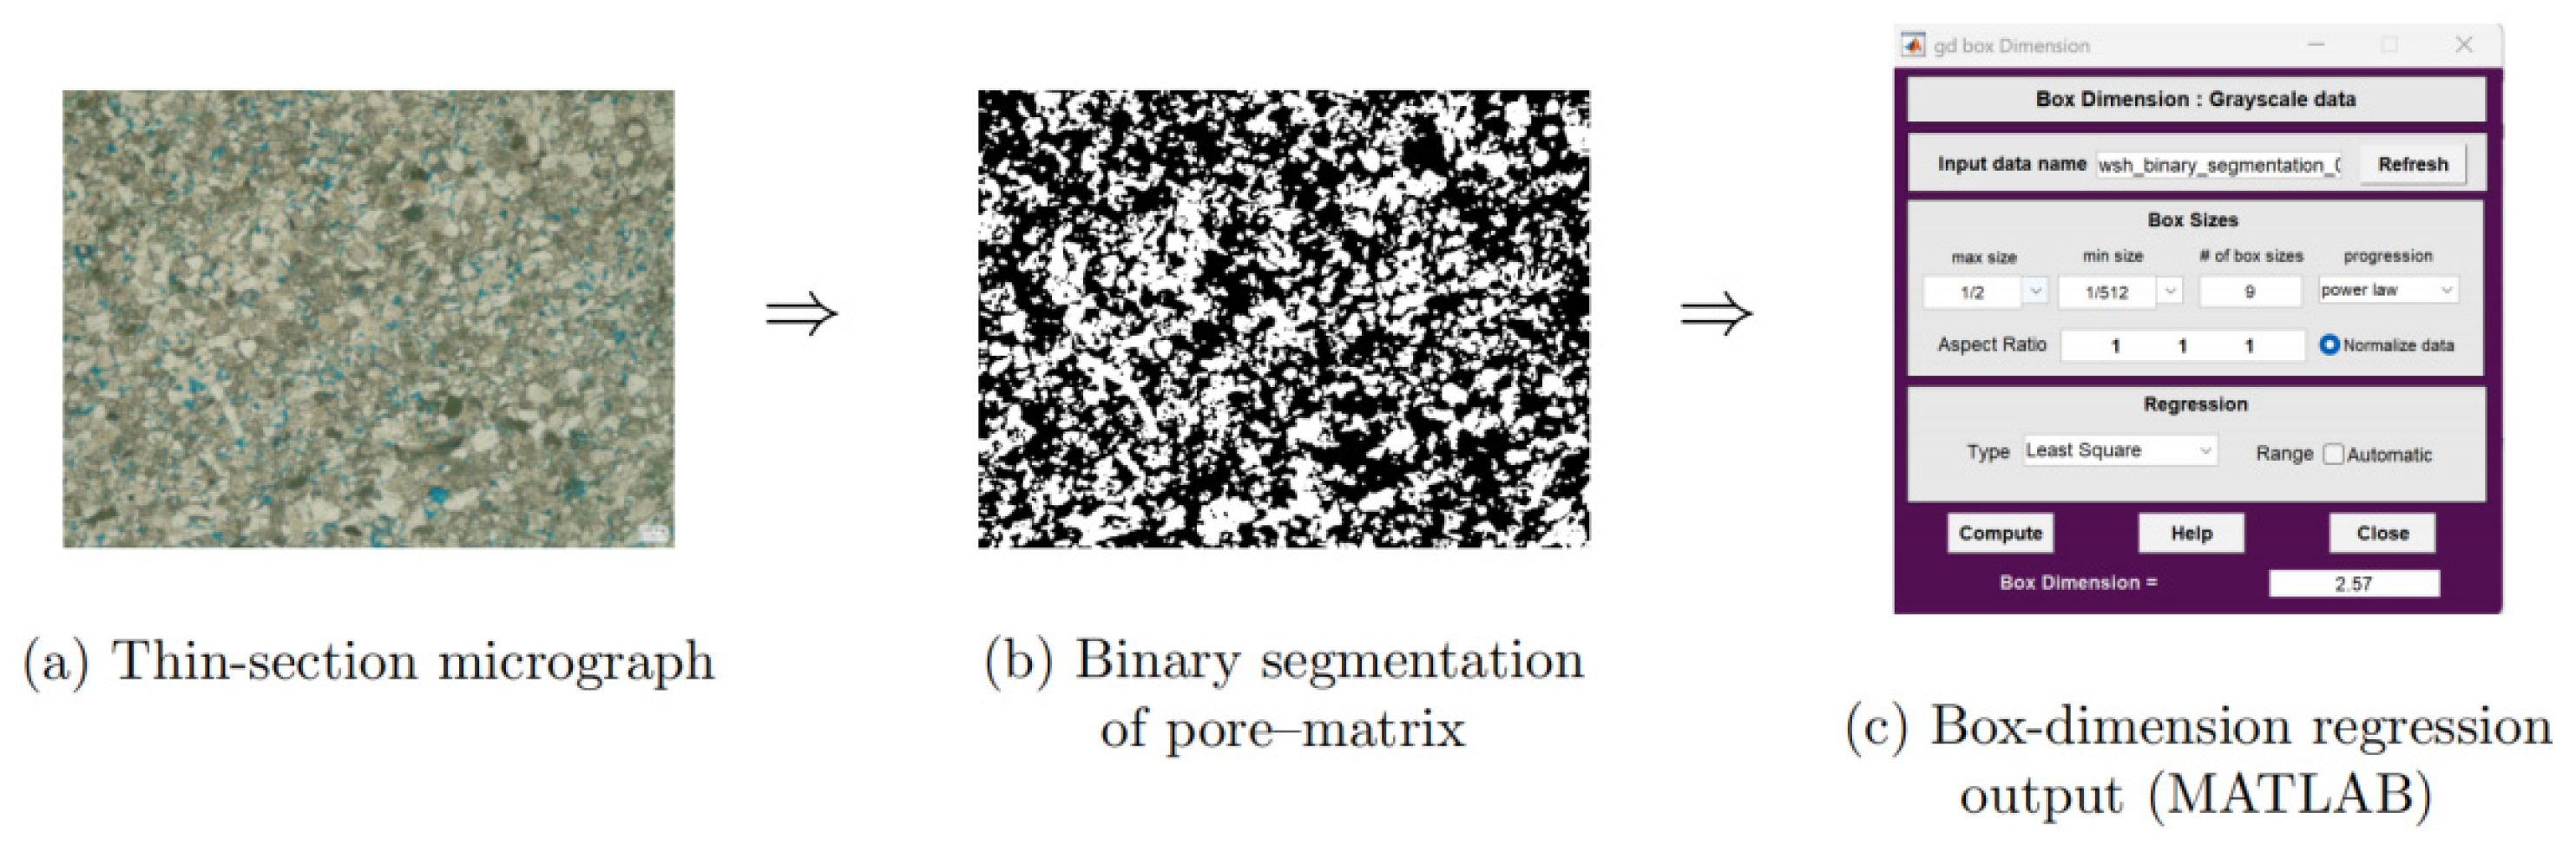
Figure 3.
Static fractal dimension estimation of pore structures. (a) Representative binary micro-graph of the rock thin-section, (b) binary pore-matrix representation after wavelet shrinkage preprocessing, and (c) log-log regression curve from the box-counting method. The slope of the fitted line yields an estimated fractal dimension of , which serves as the static baseline value for subsequent dynamic fractal dimension analysis.
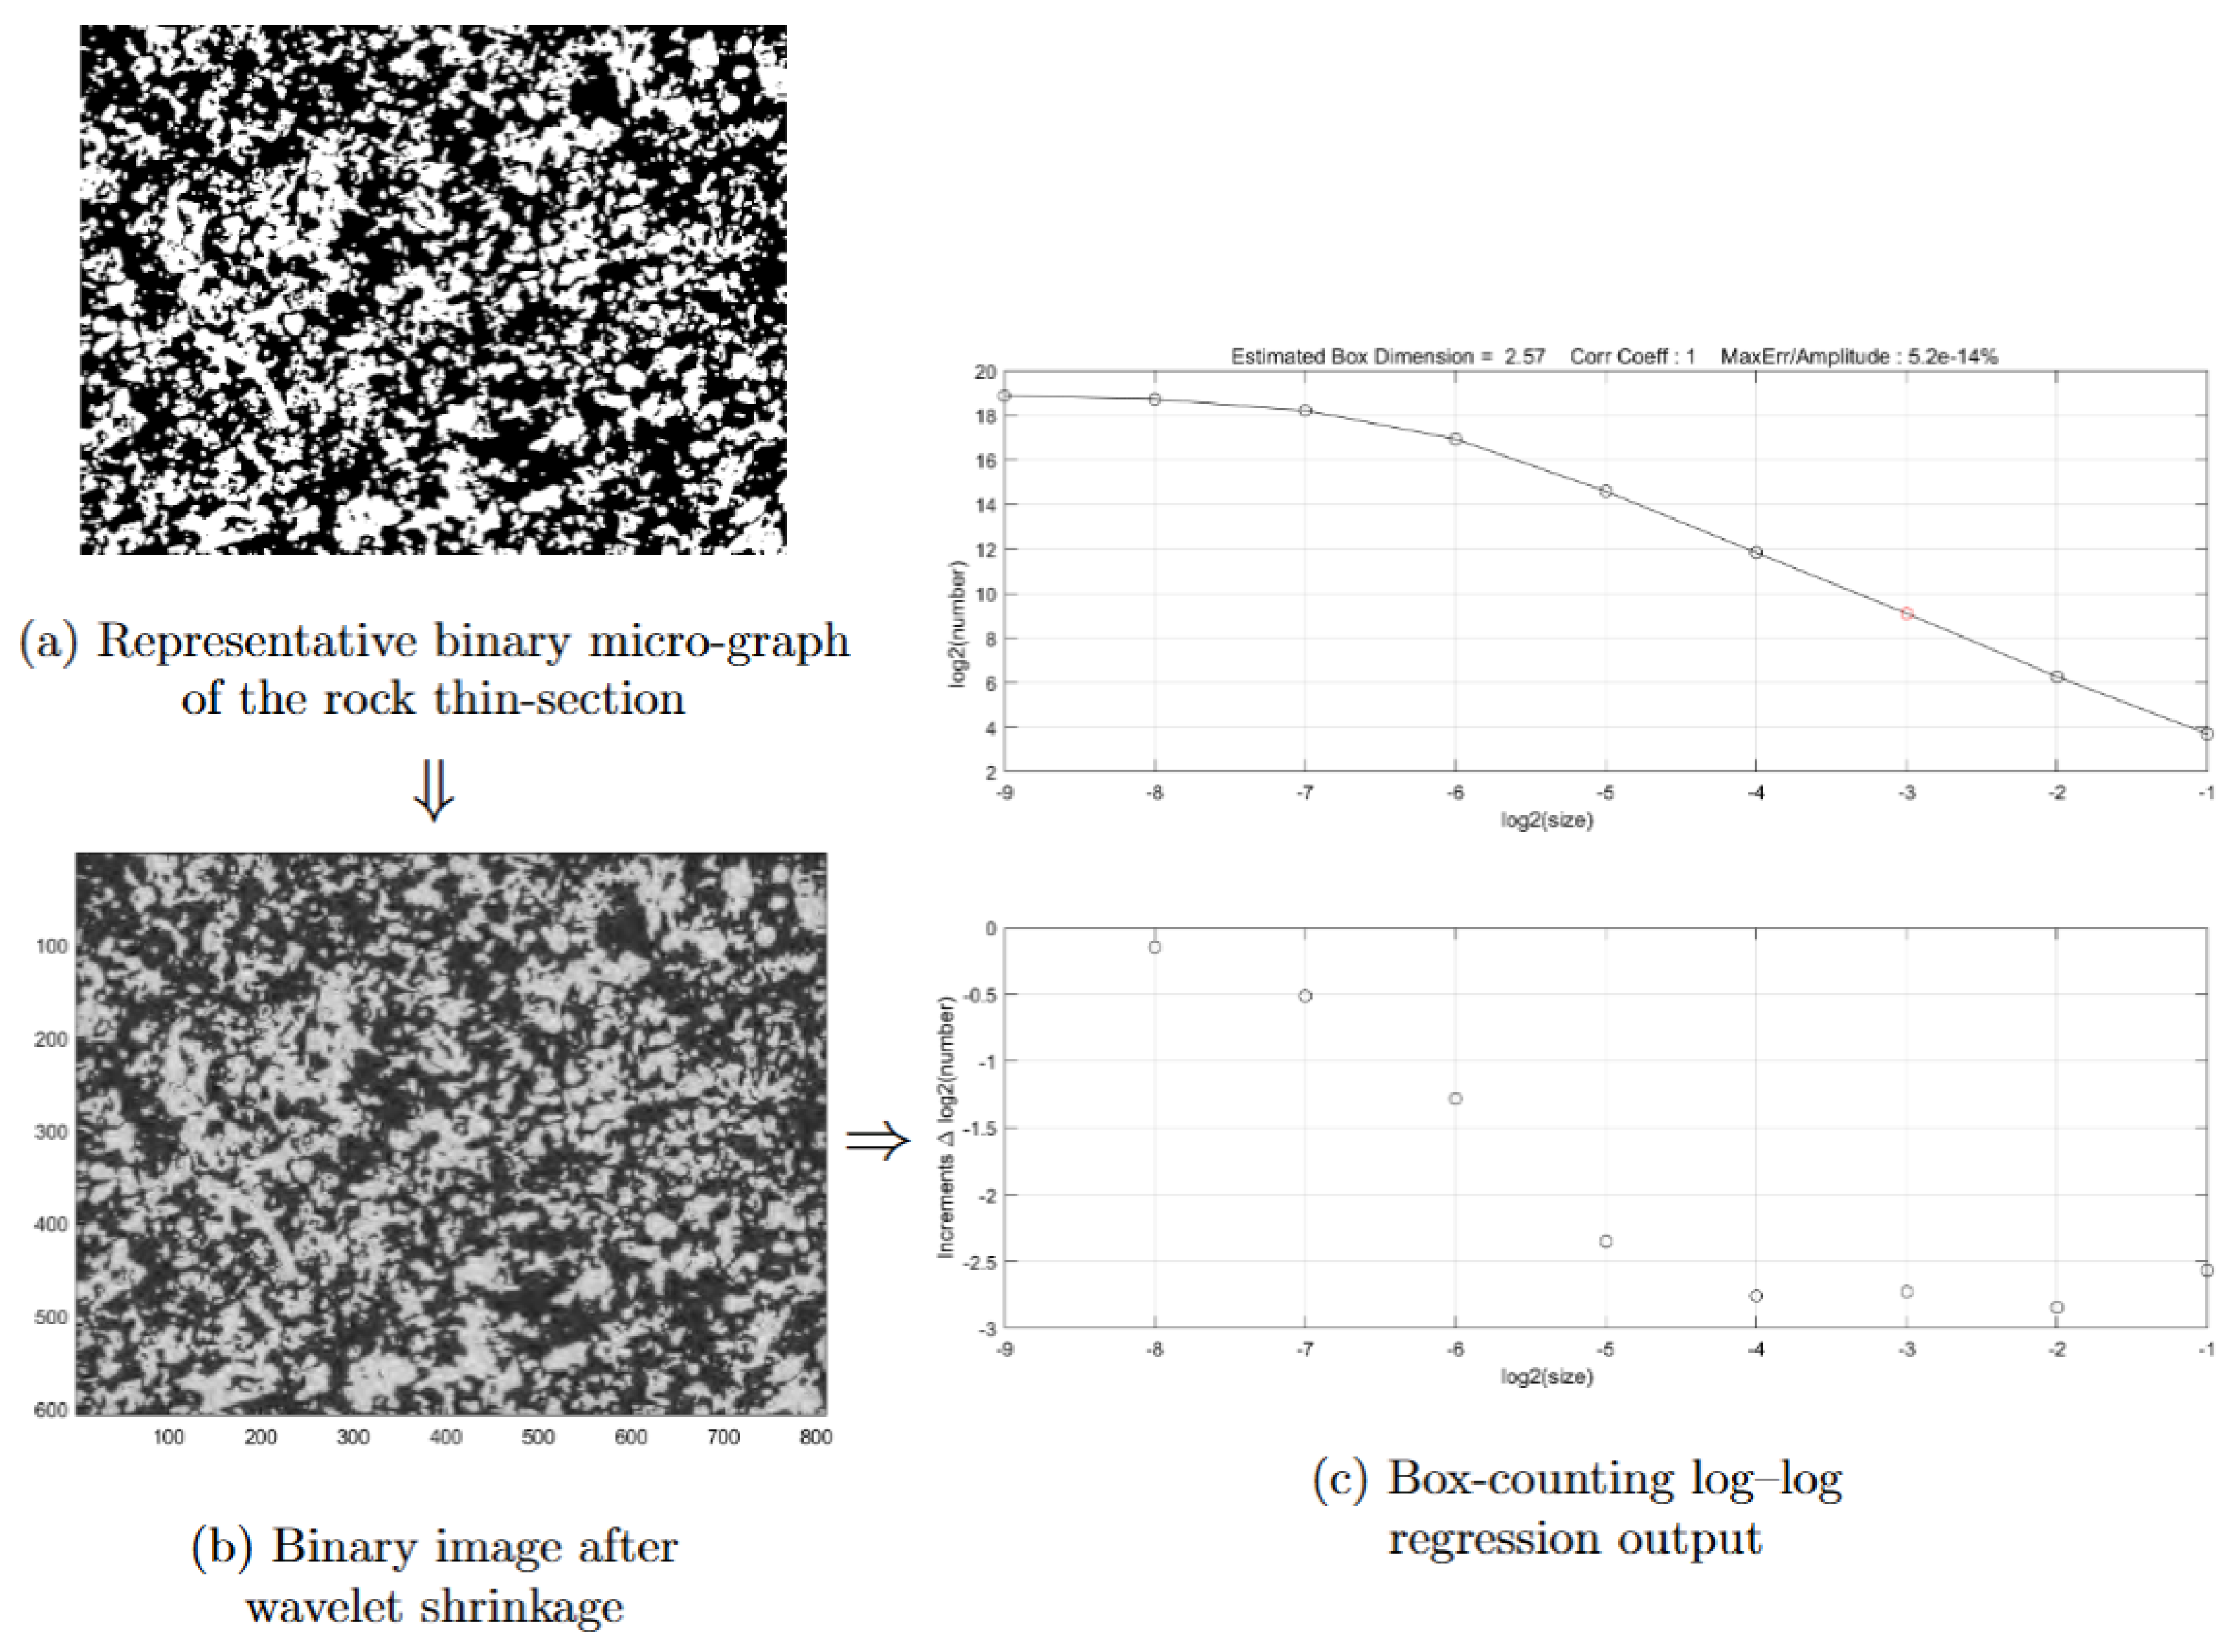
Figure 4.
Experimental Pressure Propagation Curves Showing Three Stages of CO2 Flooding. The graph illustrates the pressure distribution over time at nine measurement points (P1-P9) along a long core sample during CO2 displacement in stress-sensitive porous media. The orange and purple dashed lines represent the Boundary Transition Zone 1 and Boundary Transition Zone 2, respectively. The results demonstrate the gradual pressure propagation and stabilization over time, with evident transitions as CO2 breakthrough occurs.
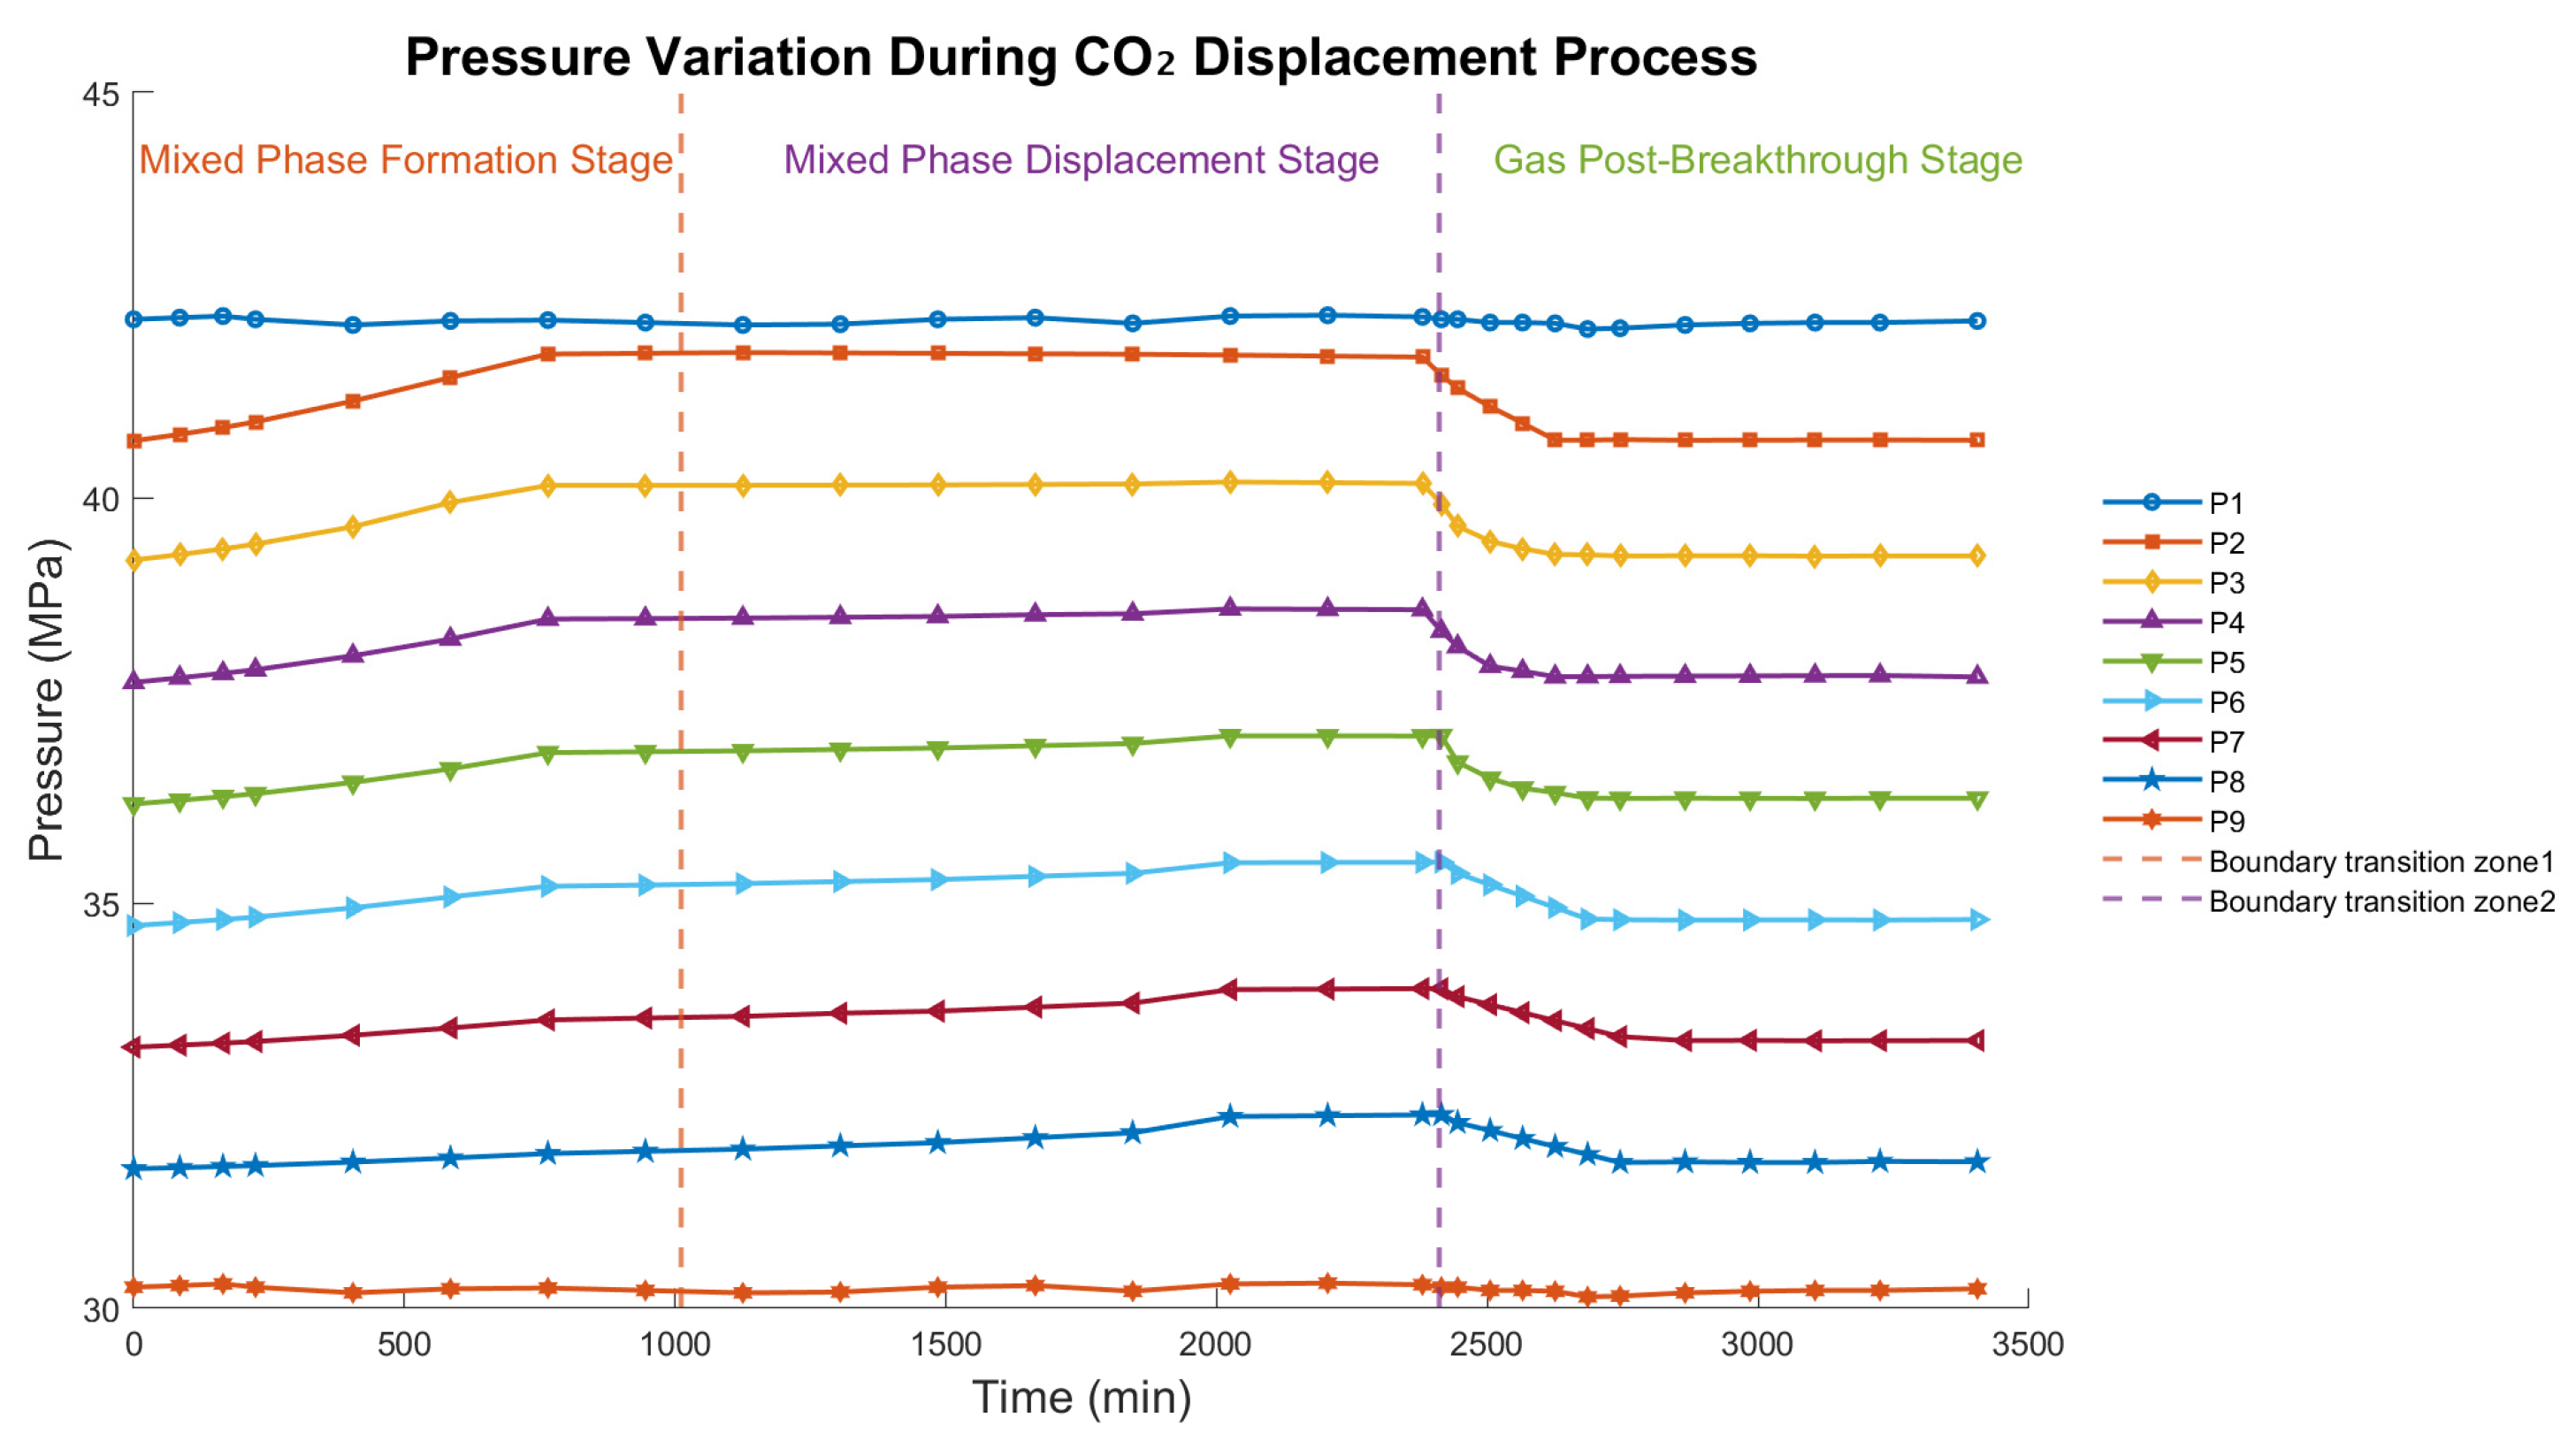
Figure 5.
Spatiotemporal Evolution of Fractal Dimensions Predicted by DFDM. The Heat-map of dynamic fractal dimension as a function of normalized core length x/L and injection time t. The color scale indicates continuous variations in pore-scale heterogeneity, while white contour lines highlight key scaling thresholds. Results demonstrate a progressive attenuation of fractal complexity with increasing injection time, reflecting stress-dependent reorganization of pore networks.
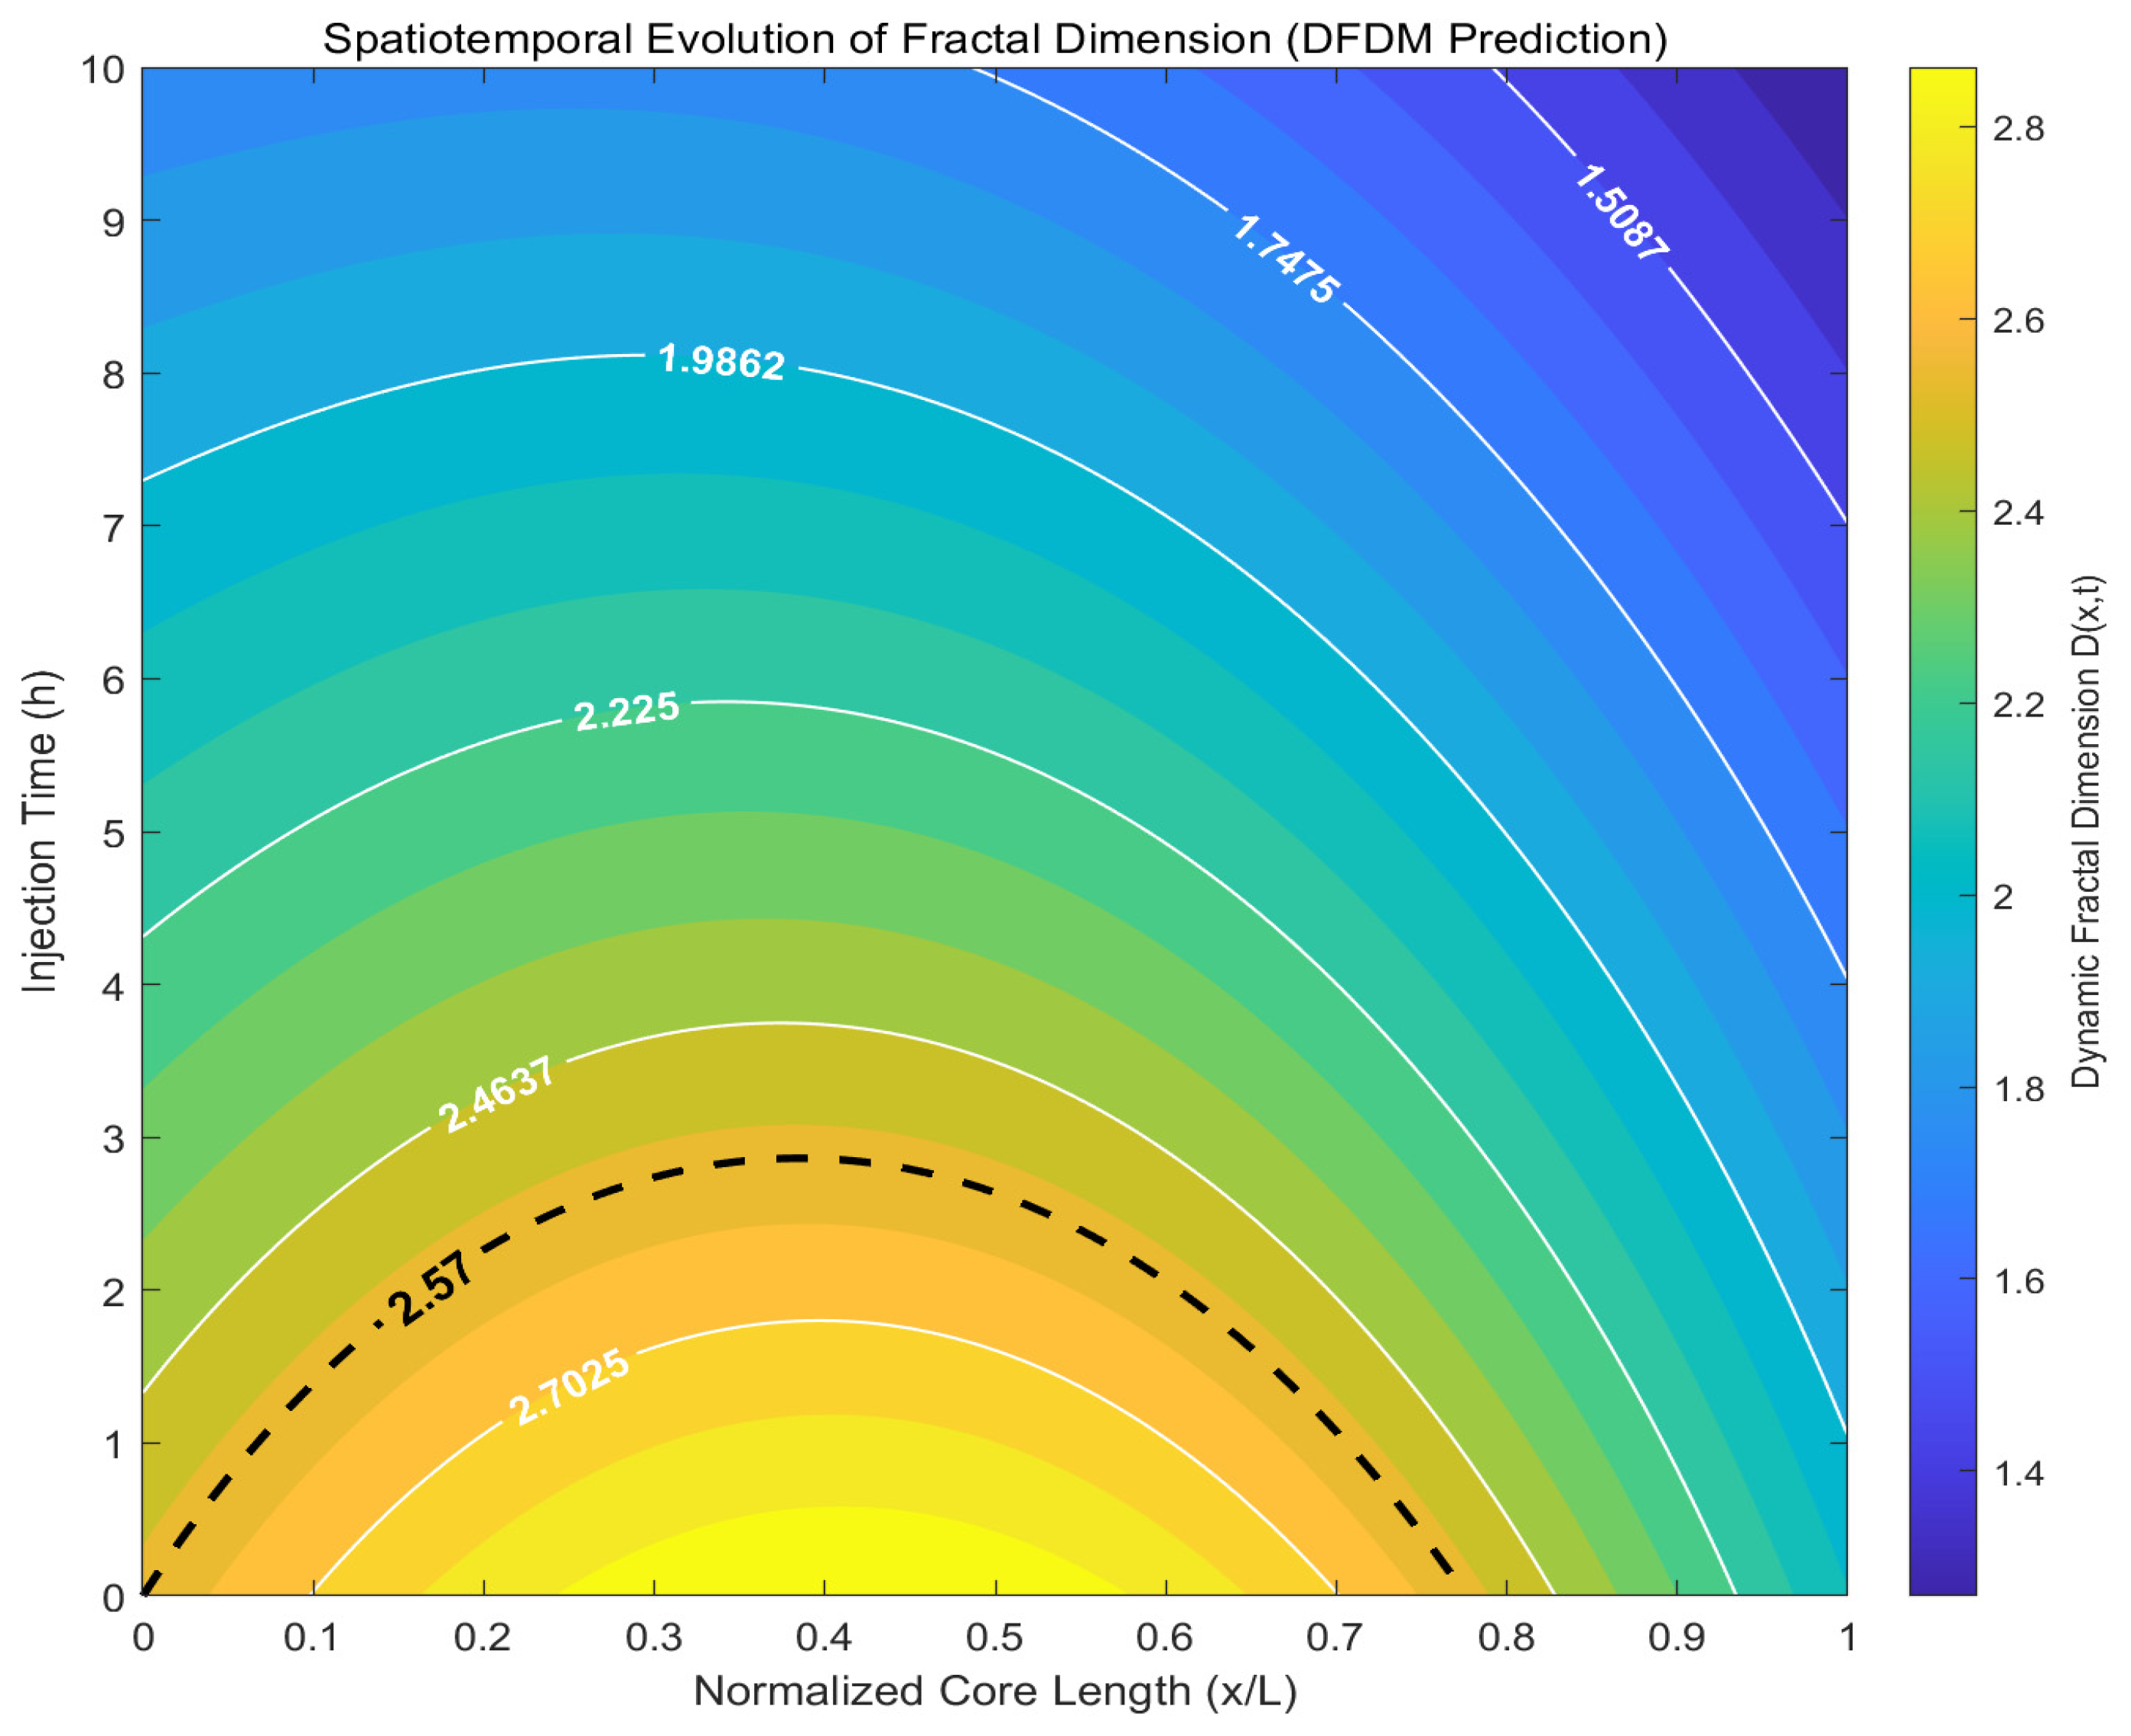
Figure 6.
Validation of DFDM Predictions against Experimental Observations. Black circles with error bars represent experimental fractal dimensions, which were constructed based on the static baseline value () to provide reference points for validation. The blue solid line denotes the DFDM prediction after parameter calibration, while the green dashed line shows an uncalibrated prediction used for comparison. The close match between the calibrated DFDM curve and the experimental trend is quantitatively supported by a coefficient of determination (), indicating that 88% of the variance in the experimental data is explained by the model. The mean squared error (MSE = 0.0013) further demonstrates the model’s predictive accuracy by quantifying the average squared deviation between predictions and experimental points. Together, these results confirm that DFDM can reliably reproduce the spatiotemporal evolution of fractal dimensions under CO2 flooding conditions.
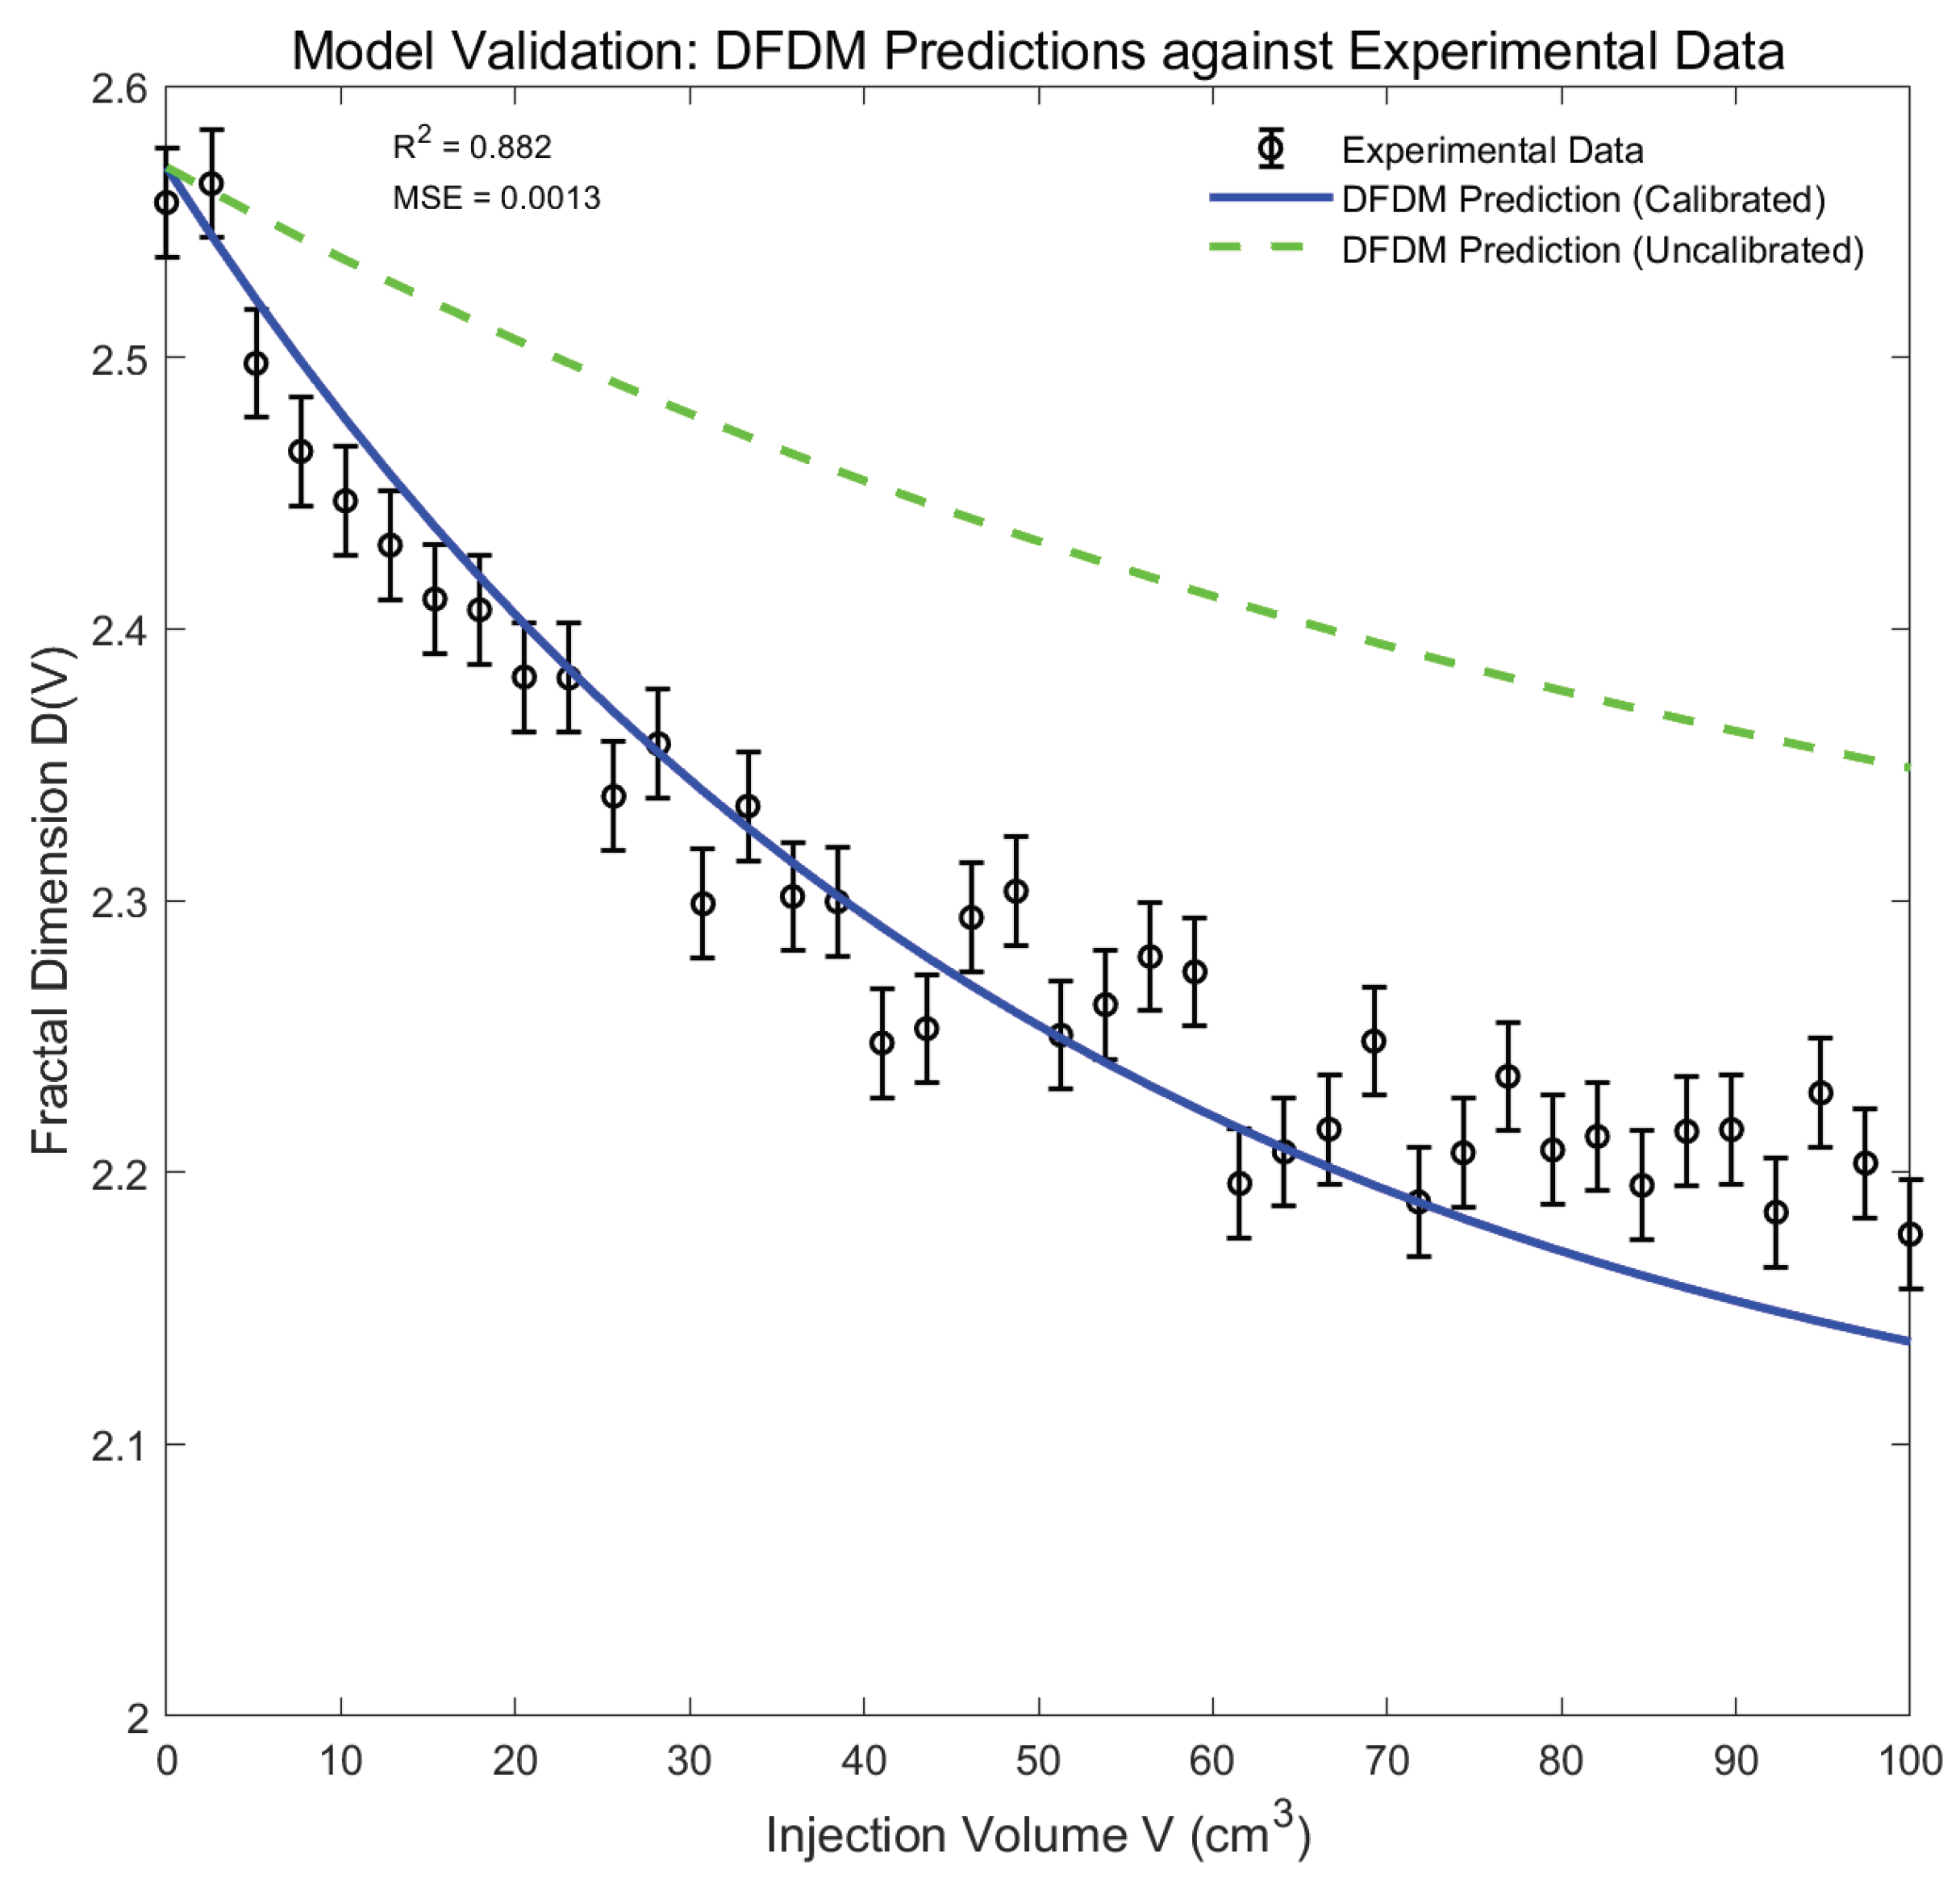
Figure 7.
Sensitivity Analysis of DFDM Predictions with Respect to Key Parameters. (a) Bar chart showing normalized sensitivity values of the four governing parameters, and (b) radar chart illustrating the relative contribution of each parameter. Relative sensitivities of the four governing parameters () obtained from perturbation tests, showing that the time-scaling exponent exerts the highest normalized sensitivity () on predicted fractal dimensions, governing the overall temporal decline of the fractal dimension, followed by the stress-coupling, spatial heterogeneity coefficient ranks second, reflecting its significant control over the spatial gradient of fractal reorganization. While oscillatory modulation parameterhas a lower sensitivity(), suggesting that sinusoidal heterogeneity only exerts secondary effects, mainly perturbing the otherwise monotonic decline of . Finally, the attenuation factor shows the weakest effect (), slightly adjusting long-term relaxation, implying that exponential damping has minimal impact on the global fractal evolution compared with the dominant interplay. Radar chart providing a global comparison, which highlights the dominance of and the relative ranking . These results highlight that the DFDM framework is most sensitive to and , but overall retains predictive robustness across parameter variations, underscoring the global stability and adaptability of the model under diverse reservoir conditions. Taken together, the bar chart (Figure 7a) highlights the relative ranking of parameters, while the radar chart (Figure 7b) provides a global comparison, confirming that the predictive framework remains stable even when subject to parameter variability.
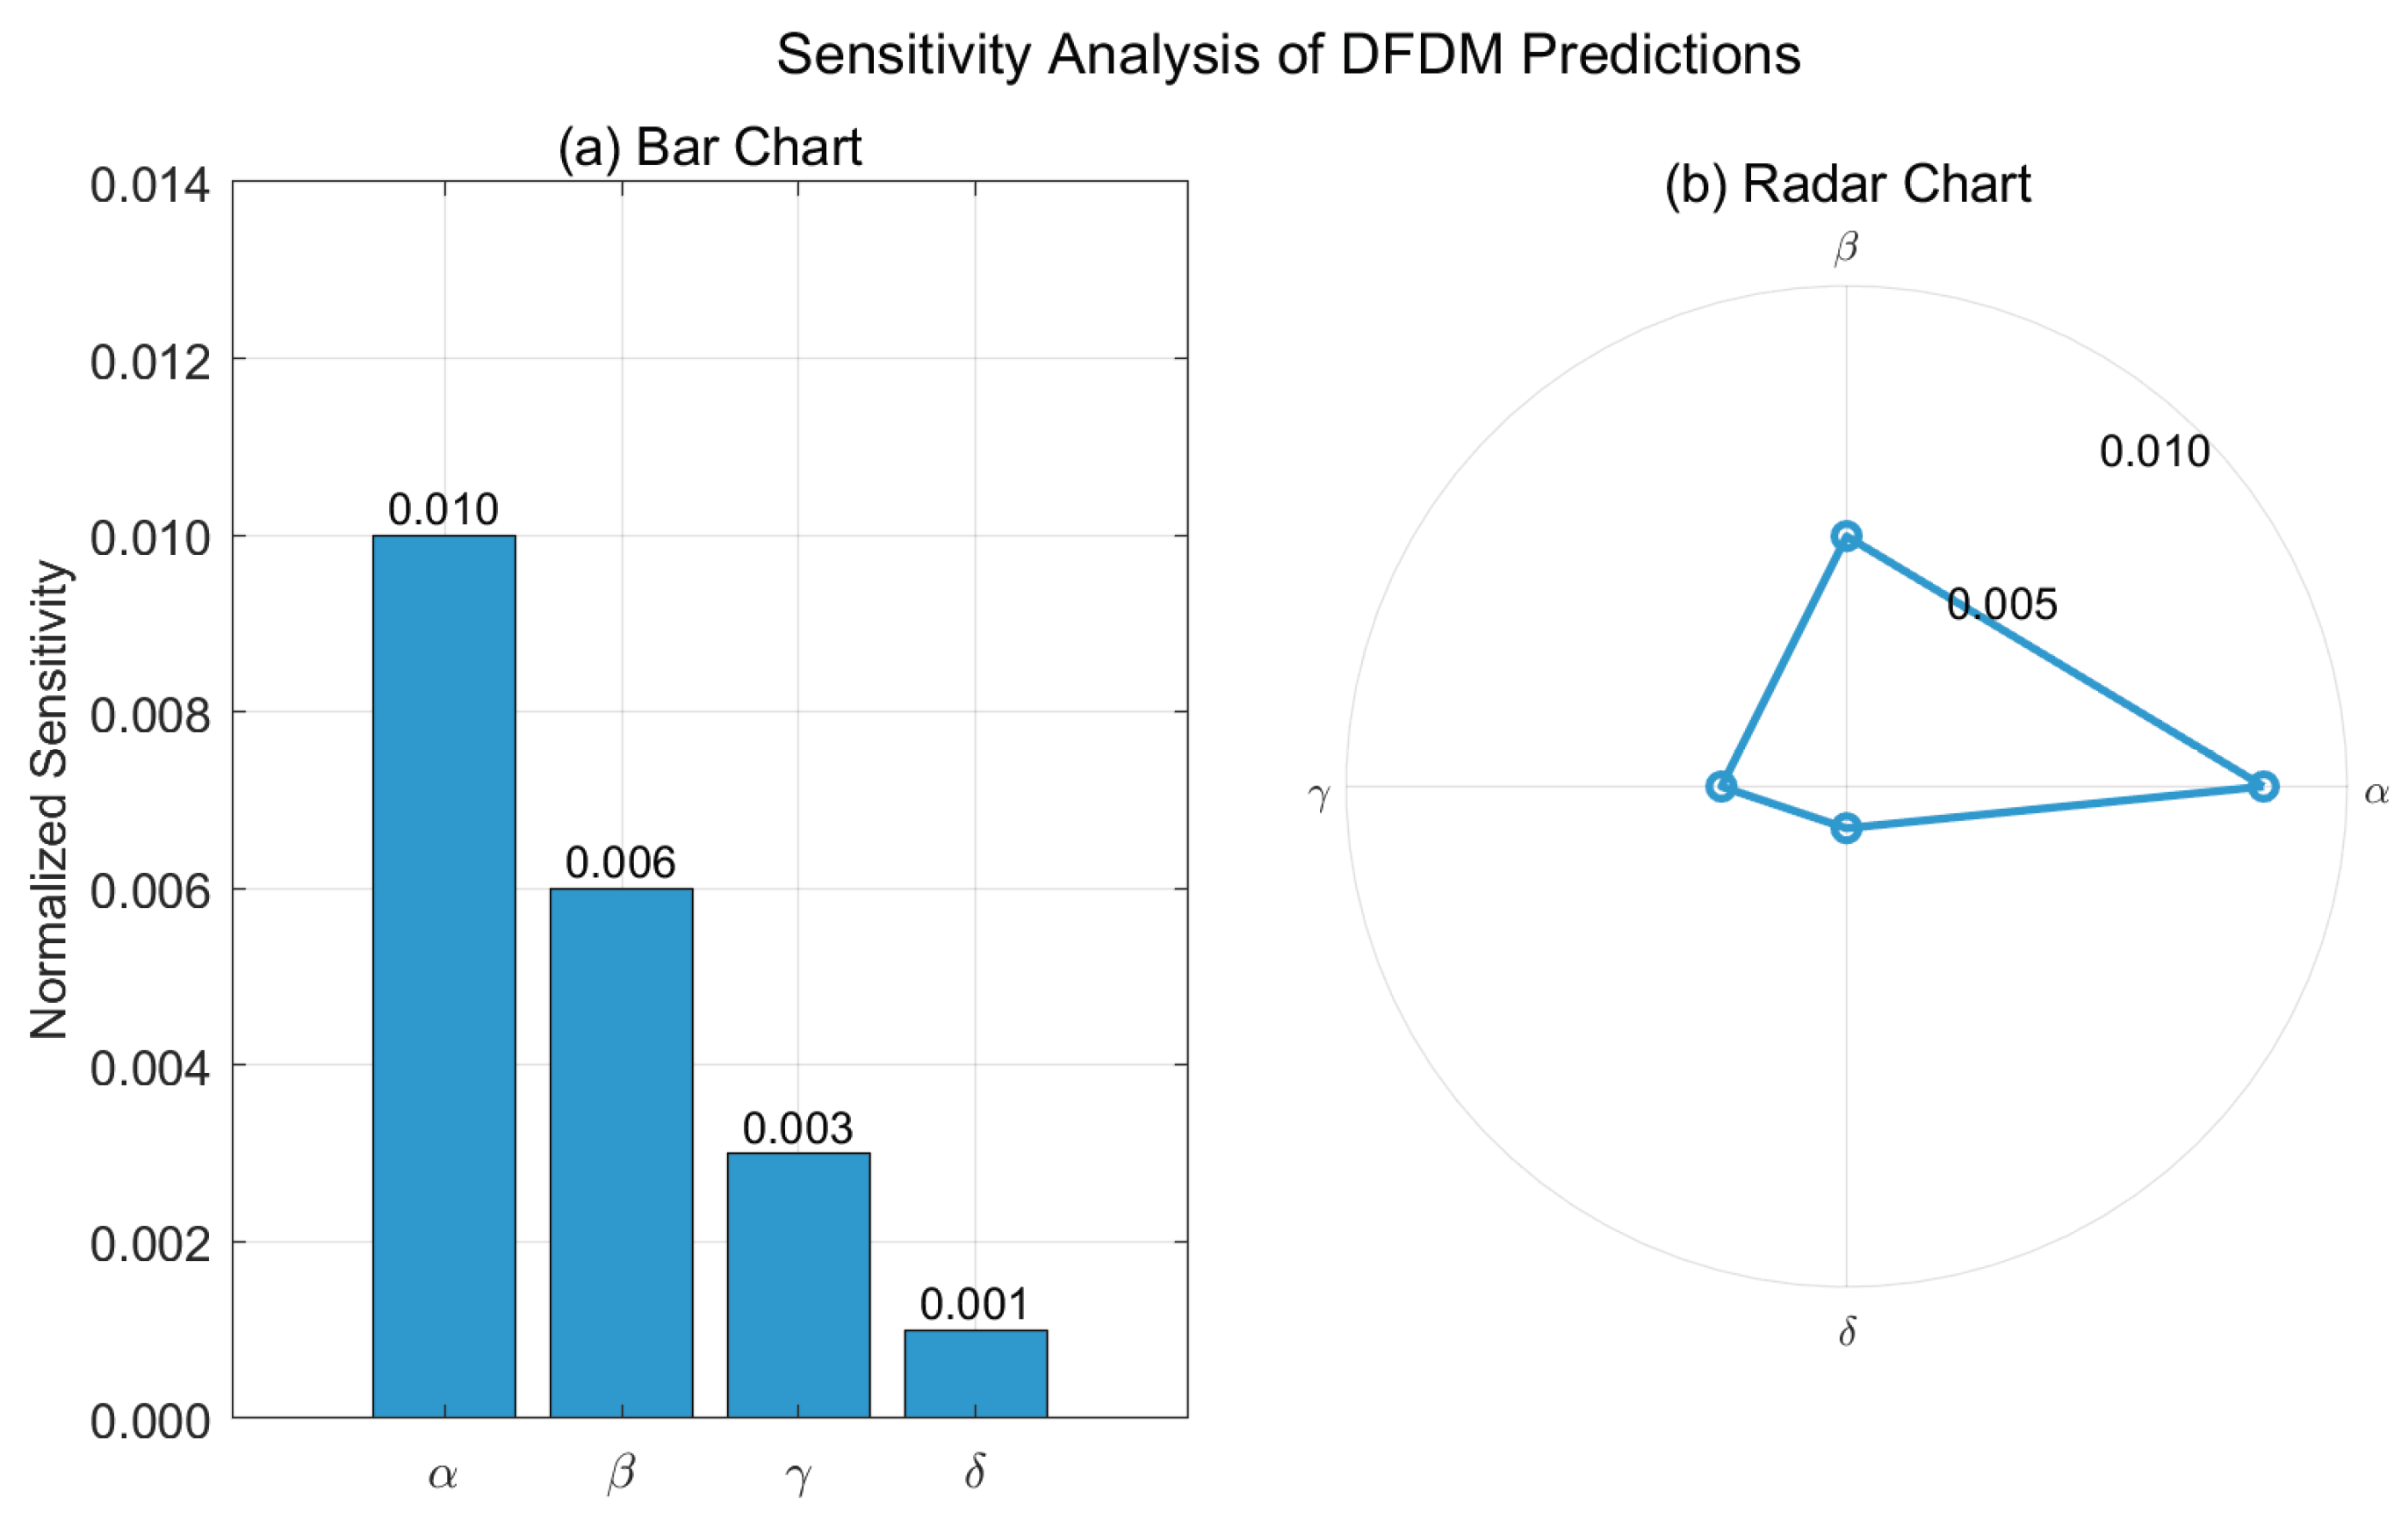
Figure 8.
Mechanistic insights from DFDM. (a) Compaction-dominated regime: Stress-induced pore compaction reduces fractal dimension () and lowers permeability(), reflecting stress-sensitive loss of connectivity. (b) Dissolution-dominated regime: Flow-driven dissolution enlarges pore structures, leading to an increase in fractal dimension () and enhanced permeability ().
Disclaimer/Publisher’s Note: The statements, opinions and data contained in all publications are solely those of the individual author(s) and contributor(s) and not of MDPI and/or the editor(s). MDPI and/or the editor(s) disclaim responsibility for any injury to people or property resulting from any ideas, methods, instructions or products referred to in the content. |
© 2025 by the authors. Licensee MDPI, Basel, Switzerland. This article is an open access article distributed under the terms and conditions of the Creative Commons Attribution (CC BY) license (http://creativecommons.org/licenses/by/4.0/).
Copyright: This open access article is published under a Creative Commons CC BY 4.0 license, which permit the free download, distribution, and reuse, provided that the author and preprint are cited in any reuse.


