
Submitted:
29 September 2025
Posted:
01 October 2025
You are already at the latest version
Abstract
Marine diatoms are an important group of phytoplankton that can shape marine ecosystems and global carbon cycling. When stressed, either physiologically or by grazing, diatoms release oxidized, lipid-derived signals known as oxylipins. Diatom-derived oxylipins are proposed to serve as defense and signaling chemicals that affect multiple components of marine ecosystems. Despite their role as chemical mediators, much less is known about types of stressors that induce oxylipin release and the diversity of those compounds. Therefore, to elucidate the kinds of diatom-derived oxylipins produced during stress, we profiled the spectrum of dissolved lipids of five diatom species in culture under silicon limitation and across growth phase using ultra-high performance liquid chromatography coupled to a high-resolution accurate mass spectrometer. In this study, we present evidence that physiological changes associated with Si-limitation elicit the extracellular release of LOFAs across five diatom species. For diatoms like Skeletonema japonicum and Pseudo-nitzschia multiseries, silicon limitation also induced a distinct lipidomic signature driven by various oxylipins known to be allelopathic. While their lipoxygenases were found to be different, S. japonicum and P. multiseries had the most similar dissolved lipidomes which suggests alternative controls on oxylipin biosynthesis. Consequently, the increased release of oxylipins with silicon limitation poses implications for diatoms at sea which can elevate local oxylipin concentrations during blooms, potentially affecting ecosystems and biogeochemistry.

Keywords:
phytoplankton
; diatom
; oxylipin
; lipidomics
; lipids
; linear oxygenated fatty acids
; nonvolatile oxylipins
; chemical signaling
1. Introduction
Marine phytoplankton account for a substantial portion of primary production [1,2] that is transferred up marine food webs, exported to depth as particulate organic matter (POM) [3,4], or released as dissolved organic matter (DOM). Release of DOM from live phytoplankton can serve multiple roles, namely as a mechanism for carbon excretion in the form of transparent exopolymer particles (TEP) [5], but also as a dispersal mechanism for signaling and defense chemicals that overall shape marine ecosystems and biogeochemistry [6,7]. In particular, diatoms release lipid-derived compounds known as oxylipins that are bioactive in other phytoplankton [8], zooplankton [9,10,11], and bacteria [12,13,14]. First documented as defense chemicals that affect copepod reproduction [9,11], diatom-derived oxylipins have since been proposed to act as signaling chemicals [15,16] and allelochemicals [10,17,18].
Oxylipin biosynthesis is mediated by multiple enzymes, resulting in two major groups: polyunsaturated aldehydes (PUA) and linear oxygenated fatty acids (LOFA, previously known as non-volatile oxylipins). PUA production in diatoms generally occurs under stress or when cell membranes are disrupted [16,19,20,21,22]. PUAs are associated with reduced copepod hatching success [9,11] and are proposed to regulate diatom cell death during unfavorable conditions [15,17]. PUAs can also play a role in marine biogeochemistry, affecting the remineralization of POM by stimulating bacterial respiration [13,23]. LOFAs, the precursors to PUAs, are also released with cell membrane disruption [24], though release can occur with viral infection [16], in the presence of an algicidal bacterium [14], and at the end of diatom blooms [22]. In field observations, LOFAs were confirmed to be mainly produced by diatoms and concentrations per cell were inversely correlated with diatom density, suggesting a chemical signaling role [25]. Similar to PUAs, LOFAs are also thought to serve as a form of chemical defense by affecting copepod reproduction [22,26,27], microzooplankton grazing [10], and growth of the algicidal bacterium, Kordia algicida [14]. Though considering that LOFAs are important secondary metabolites in diatoms, much less is known about their chemical diversity, bioactivity, and, consequently, their role in marine ecosystems.
Thus, to elucidate the chemical diversity of diatom-derived oxylipins produced during stress, we profiled the spectrum of dissolved lipids (the dissolved lipidome) of five diatom cultures under silicon limitation (Si-limitation) and across growth phase (Table 1). We investigated these effects on two bloom-forming diatoms commonly found in the Pacific Ocean, Skeletonema japonicum and Pseudo-nitzschia multiseries. The model PUA producer, Thalassiosira rotula, was also investigated in addition to two diatoms isolated from the San Pedro Ocean Time-series (SPOT) off the coast of California, USA. One of the SPOT isolates was identified as a Chaetoceros species, which are ubiquitous across the global ocean (Table 1). Previous observations with Skeletonema marinoi have observed PUA release with culture decline [20] and nutrient limitation, especially silicon [21]. However, the effect of Si-limitation on the release of LOFAs remains underexplored. By leveraging lipidomics, we provide insights into the fatty acid and LOFA diversity of marine diatoms, some of which could serve as potential stress markers and candidates for assessing chemical signaling in marine ecosystems.

Table 1.
Diatom species and isolates cultured in this study. Reports of cell length, silicon content, Si:C ratio, and distribution were obtained from other studies.
Table 1.
Diatom species and isolates cultured in this study. Reports of cell length, silicon content, Si:C ratio, and distribution were obtained from other studies.
| Diatom | Label | Morphology | Cell length (µm) | Silicon content (pmol/cell) | Si:C | Distribution | References |
| Skeletonema japonicum | SJ | Centric | 5.3-5.5 | 0.03-3.40a | 0.07-0.11a | Cold temperate coasts and upwelling zones | [28,29,30,31,32] |
| Pseudo-nitzschia multiseries | PNM | Pennate | 50-140 | 1.07, 1.9b | 0.16, 0.21 | Coasts alongside the NW Pacific, NE Atlantic, and Mediterranean | [33,34,35,36,37,38] |
| Thalassiosira rotula | TR | Centric | 10.5-65.8 | 0.07b, 0.09b | 0.09 | North Pacific and Atlantic, Mediterranean, Southern Ocean | [39,40,41,42] |
| Chaetoceros sp. | SPOT2312 | Centric | 0.12-7.30c | 0.09-0.15c | Global | [28,43] | |
| Unidentified | SPOT2302 | Centric |
a Reported values for Skeletonema costatum. b Values converted from pg Si/cell to pmol Si/cell. c Range across Chaetoceros species and strains.
2. Results
2.1. Identified Oxylipins
A total of sixty features were obtained through the lipidomic R package, LOBSTAHS. Twenty-eight of these were putatively annotated as oxylipins, six of which were further confirmed with MS2 fragmentation. Five additional oxylipins were identified and confirmed only through the MSDIAL pipeline (Table S1). Details on the annotation process are discussed in the methods section. MS2 fragmentation for each compound can be found in the supplementary materials (Figures S1-13). Two C14 oxylipins and a C15 oxylipin were confirmed based on the in silico fragmentation of 9-hydroxy-tetradeca-10-enoic acid and 9-hydroxy-pentadeca-10-enoic acid, respectively. Three C16 oxylipins were identified as 6-oxoHME (6-oxo-hexadecaenoic acid), 9-epHTrE (9-epoxy-hexadecatrienoic acid), and 9-HHTE (9-hydroxy-hexadecatetraenoic acid). A C18 oxylipin was identified as 9-HODE (9-hydroxy-octadecadienoic acid). Four C20 oxylipins were identified as 5-HpEPE (5-hydroperoxy-eicosapentaenoic acid), 15-HpEPE (15-hydroperoxy-eicosapentaenoic acid), 5-HEPE (5-hydroxy-eicosapentaenoic acid), and 11,12-EpETE (11,12-epoxy-eicosatetraenoic acid). Lastly, two prostaglandins were identified as 6-keto-PGE1 (6-ketoprostaglandin E1) and 15-deoxy-PGD2 (15-deoxyprostaglandin D2).
Figure 1.
Score plots generated from partial least squares discriminant analysis (PLS-DA) and principal component analysis (PCA) on features annotated as fatty acids by LOBSTAHS (n=60) and their cell normalized and log transformed peak areas: (a) PLS-DA on all samples; (b) PCA on samples from Skeletonema japonicum (Si-replete, blue); (c) PCA on samples from Pseudo-nitzschia multiseries (Si-replete, green); (d) PCA on samples from Thalassiosira rotula (Si-replete, purple); (e) PCA on samples from the SPOT2302 isolate (Si-replete, yellow); (f) PCA on samples from the SPOT2312 isolate (Si-replete, red). Si-limited samples collected during logarithmic growth are colored gray, whereas those collected during stationary growth are colored black.
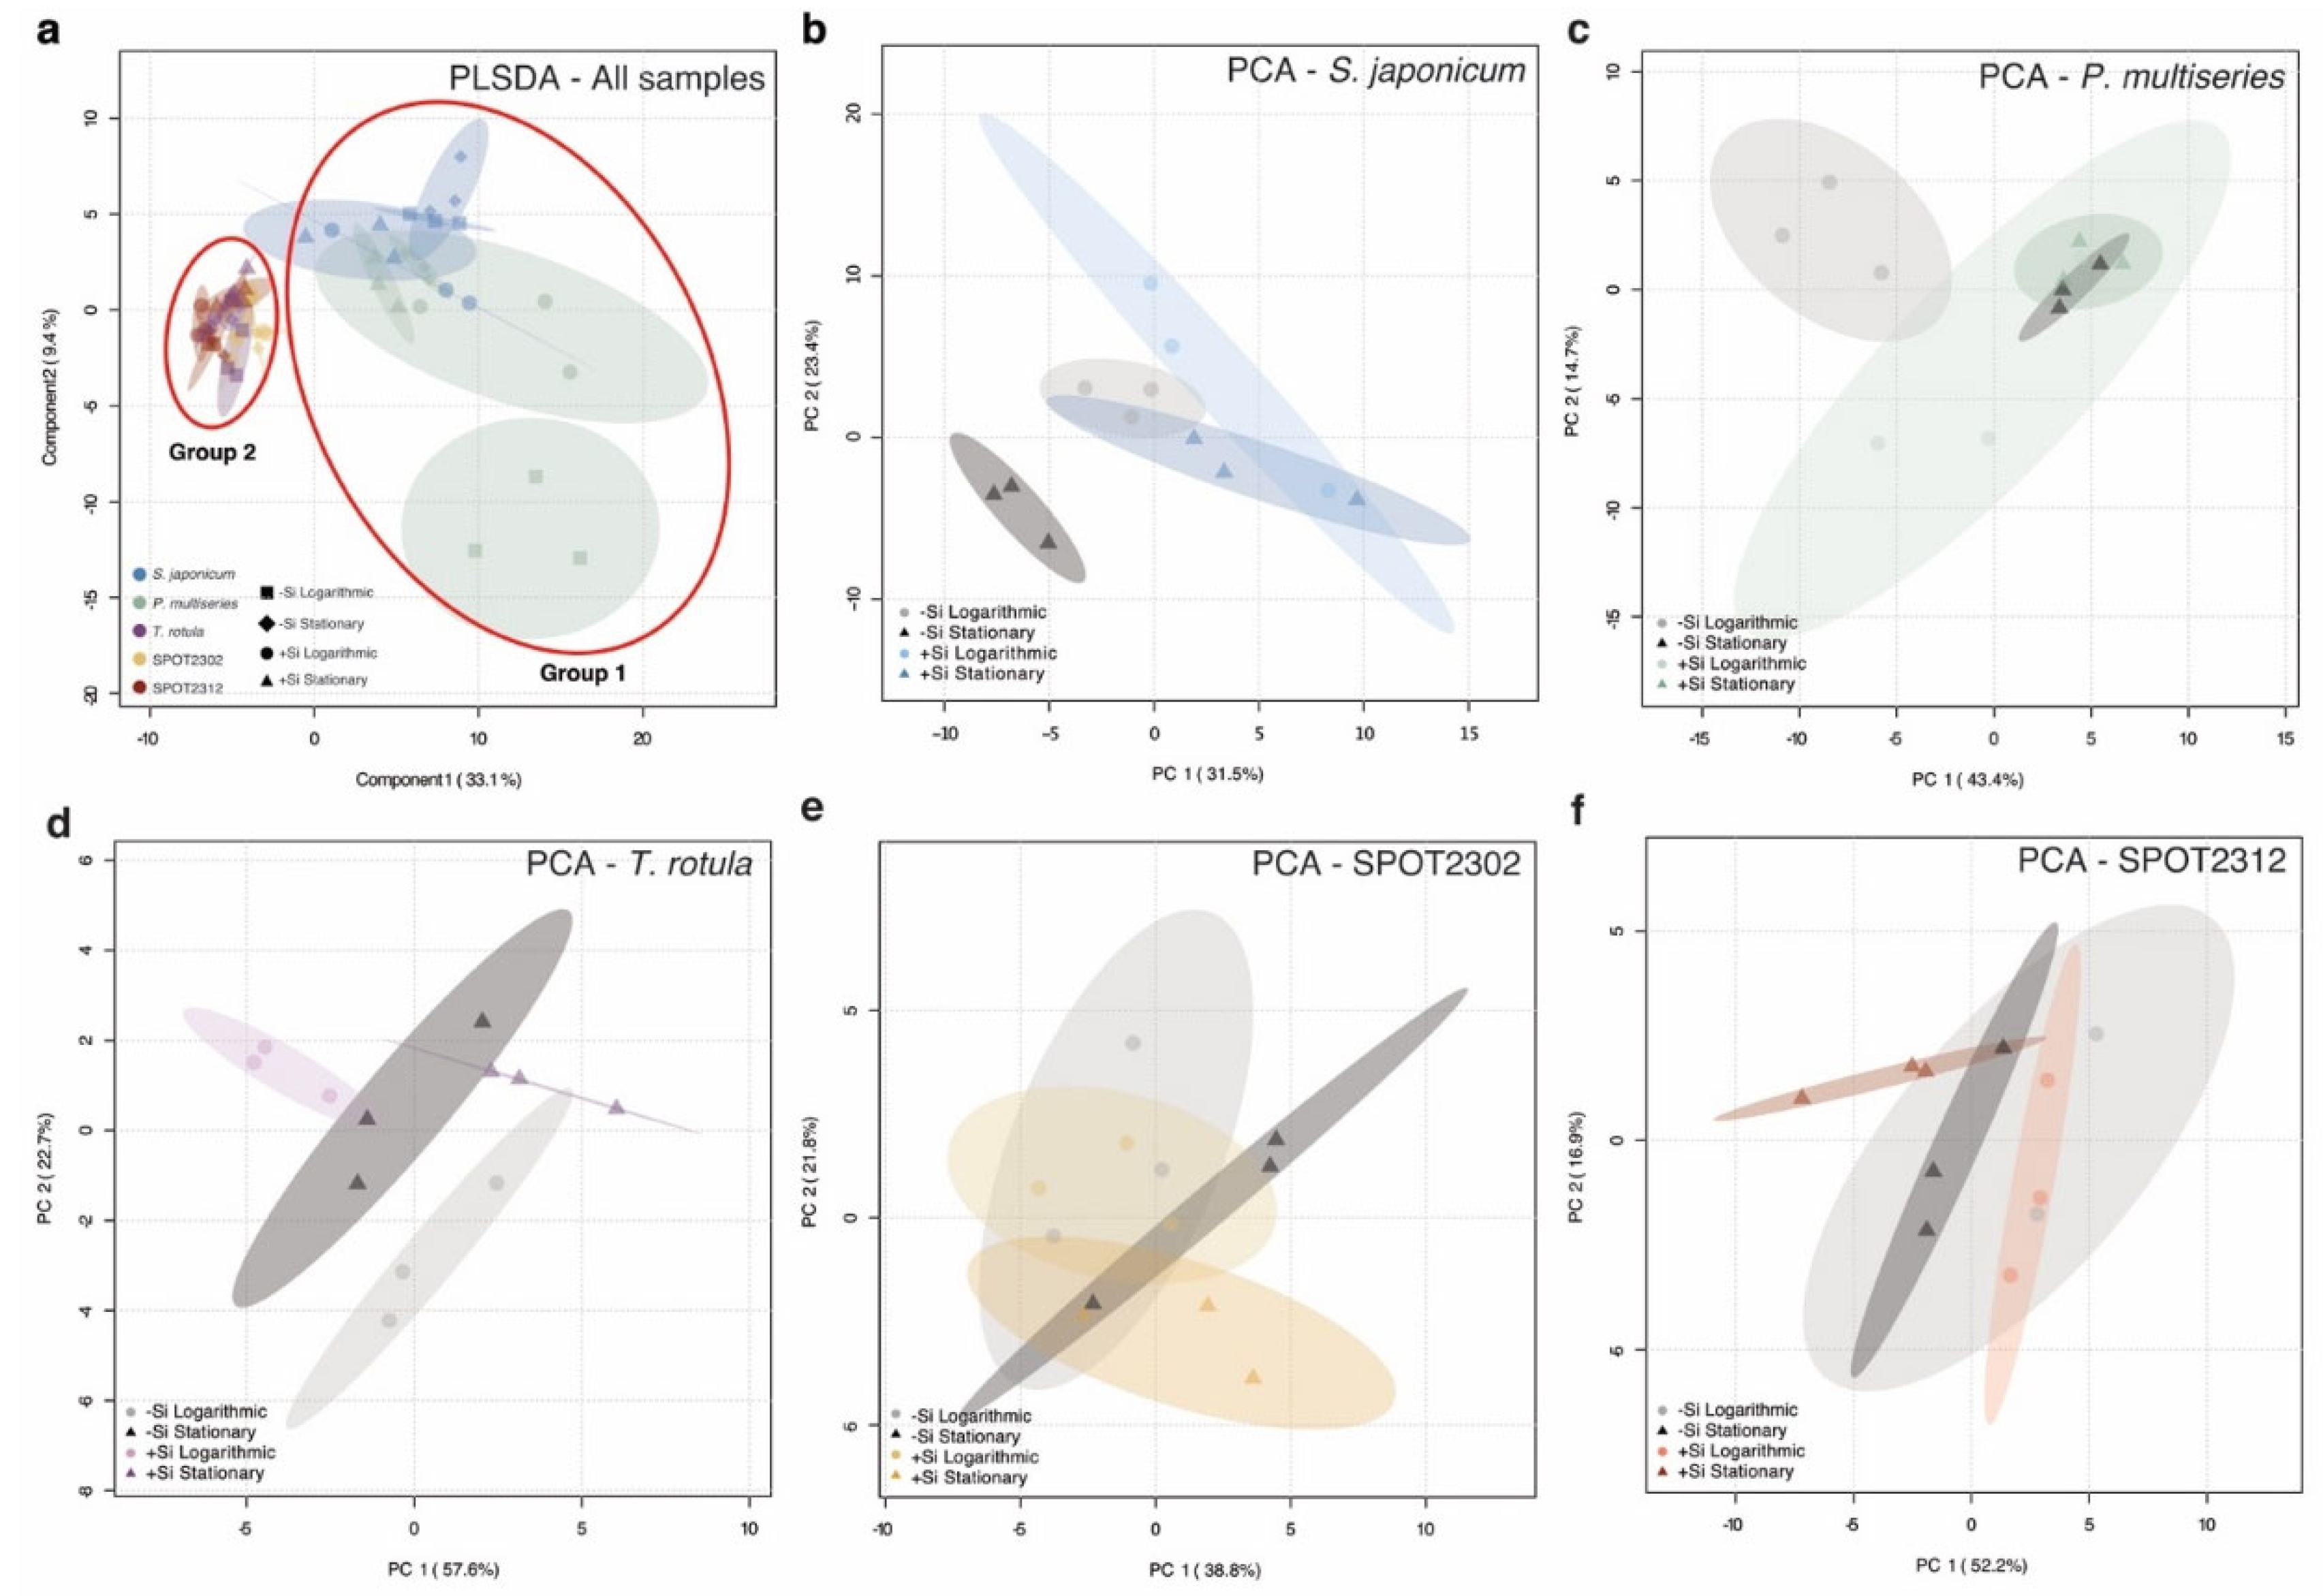
2.2. Species-Specific Dissolved Lipidomes
Features annotated by LOBSTAHS (n = 60) were compared across all species and culture conditions using a partial least squares discriminant analysis (PLS-DA). PLS-DA model performance was evaluated using a permutation test (p-value = 0.001, Figure S17). Samples separated into two groups alongside component 1 (33.1%), with Group 1 consisting of samples from S. japonicum and P. multiseries and Group 2 consisting of samples from T. rotula and the SPOT isolates (Figure 1a). Samples also clustered in the same manner using a principal component analysis (PCA, Figure S17). For the PLSDA (Figure 1a), the highest variable importance in projection (VIP) scores for component 1 included: FFA 22:6 +3O, FFA 18:3 +3O, FFA 15:1 +1O, FFA 12:3 +2O, FFA 18:4 +1O, and 9-HHTE. Cell normalized and log transformed peak areas for FFA 22:6 +3O, FFA 18:4 +1O, FFA 15:1 +1O, and 9-HHTE were higher in S. japonicum and P. multiseries whereas FFA 18:3 +3O and FFA 12:3 +2O were higher in T. rotula and the SPOT isolates (Figure S17).
To gather species-specific insights into the effect of growth phase and Si-limitation, PCAs were performed on each species separately. PLS-DAs were also performed, though results were not significant possibly due to model overfitting with smaller sample sizes. In S. japonicum, Si-limitation alongside stationary growth elicited a distinct response in the dissolved lipidome evidenced by the separation of the 95% confidence interval from the other samples (Figure 1b). The oxylipins driving the separation between culture condition in S. japonicum included: FFA 15:1 +1O, FFA 22:6 +3O, FFA 14:1 +1O, FFA 18:4 +1O, and FFA 22:4 +4O (Figure S18). In P. multiseries, Si-limited cultures collected during logarithmic growth were the most distinct from the other culture conditions (Figure 1c). Separation of P. multiseries samples was mostly driven by fatty acids, but the top oxylipins included: FFA 18:5 +1O, FFA 13:2 +2O, and FFA 16:1 +1O. (Figure S18). In T. rotula, samples separated mainly based on growth phase, with some overlap in the 95% confidence intervals between Si-replete and Si-limited cultures (Figure 1d). The top oxylipins accounting for this separation in T. rotula included: FFA 12:3 +2O, FFA 22:4 +4O, FFA 14:1 +1O, FFA 18:1 +1O, and FFA 18:3 +3O (Figure S18). The SPOT isolates (SPOT2302 and SPOT2312) did not display many differences in their dissolved lipidomes across culture condition (Figure 1e,f). FFA 10:3, FFA 14:1 +1O (RT = 18.55), and FFA 22:4 +4O were the only features consistently present in three or more PCAs for each species (Figure S18), considering only the top 10 features with the highest loading values.
Additionally, an analysis of variance (ANOVA, Tukey HSD, p-value < 0.05) was performed on samples from each species to obtain insights into the significantly different compounds between growth condition. The ANOVA across S. japonicum samples displayed similar results to the PCA (Figure 1b), pulling out significant features that were higher in Si-limited cultures during stationary growth (Table S2). The following features were significantly different across S. japonicum samples and were higher with Si-limitation: FFA 14:1 +1O (RT = 18.79), FFA 15:0, FFA 16:2, HTrA (C16:3), FFA 16:4, Stearic acid (C18:0), FFA 18:2 +1O (RT = 20.61), EPA (C20:5), and 11,12-EpETE (Table S2, Figure S19). In P. multiseries, the following five features were significant: FFA 12:3, FFA 13:2 (RT = 15.07), FFA 14:1 +1O (RT = 18.55), FFA 18:5 +1O, FFA 20:0 (Table S2). Of these, the oxylipins (FFA 12:3 +2O, FFA 14:1 +1O, FFA 18:5 +1O) were significantly higher in Si-limited cultures during logarithmic growth (Figure S19). In T. rotula, the following six compounds were significantly higher in Si-replete cultures collected during logarithmic growth: FFA 10:3, FFA 16:0, FFA 18:3 +3O, FFA 16:4, FFA 13:2, and FFA 18:1 +1O (Table S2). Similarly to P. multiseries, FFA 12:3 +2O in T. rotula was significantly higher in Si-limited cultures collected during logarithmic growth. In SPOT2302, FFA 16:1 was the only significant feature, which was higher in Si-replete cultures during logarithmic growth (Table S2). Lastly, three features were significantly different in SPOT2312: FFA 10:3, FFA 12:3 +2O (RT = 7.88), and EPA (Table S2). In SPOT2312, 12:3 +2O and FFA 10:3 were significantly higher during logarithmic growth whereas EPA was higher in Si-limited cultures during stationary growth.
Figure 2.
Overview of oxylipins and fatty acids by carbon chain length: (a) Sum of oxylipin peak areas for each feature (cell normalized, square root transformed, then averaged between triplicates); (b) Oxylipin relative abundance in each growth condition from Figure 2a; (c) Sum of average fatty acid peak areas for each (cell normalized, square root transformed, then averaged between triplicates); (d) Fatty acid relative abundance in each growth condition from Figure 2c. Peak areas for each feature are colored by carbon chain length. Diatom cultures collected during stationary growth are shaded in gray. Bar plots are separated by species and are denoted by the following acronyms: Skeletonema japonicum (SJ), Pseudo-nitzschia multiseries (PNM), Thalassiosira rotula (TR), SPOT2302 isolate (SPOT2302), SPOT2312 isolate (SPOT2312). (+Si) denotes Si-replete cultures whereas (-Si) denotes Si-limited cultures.
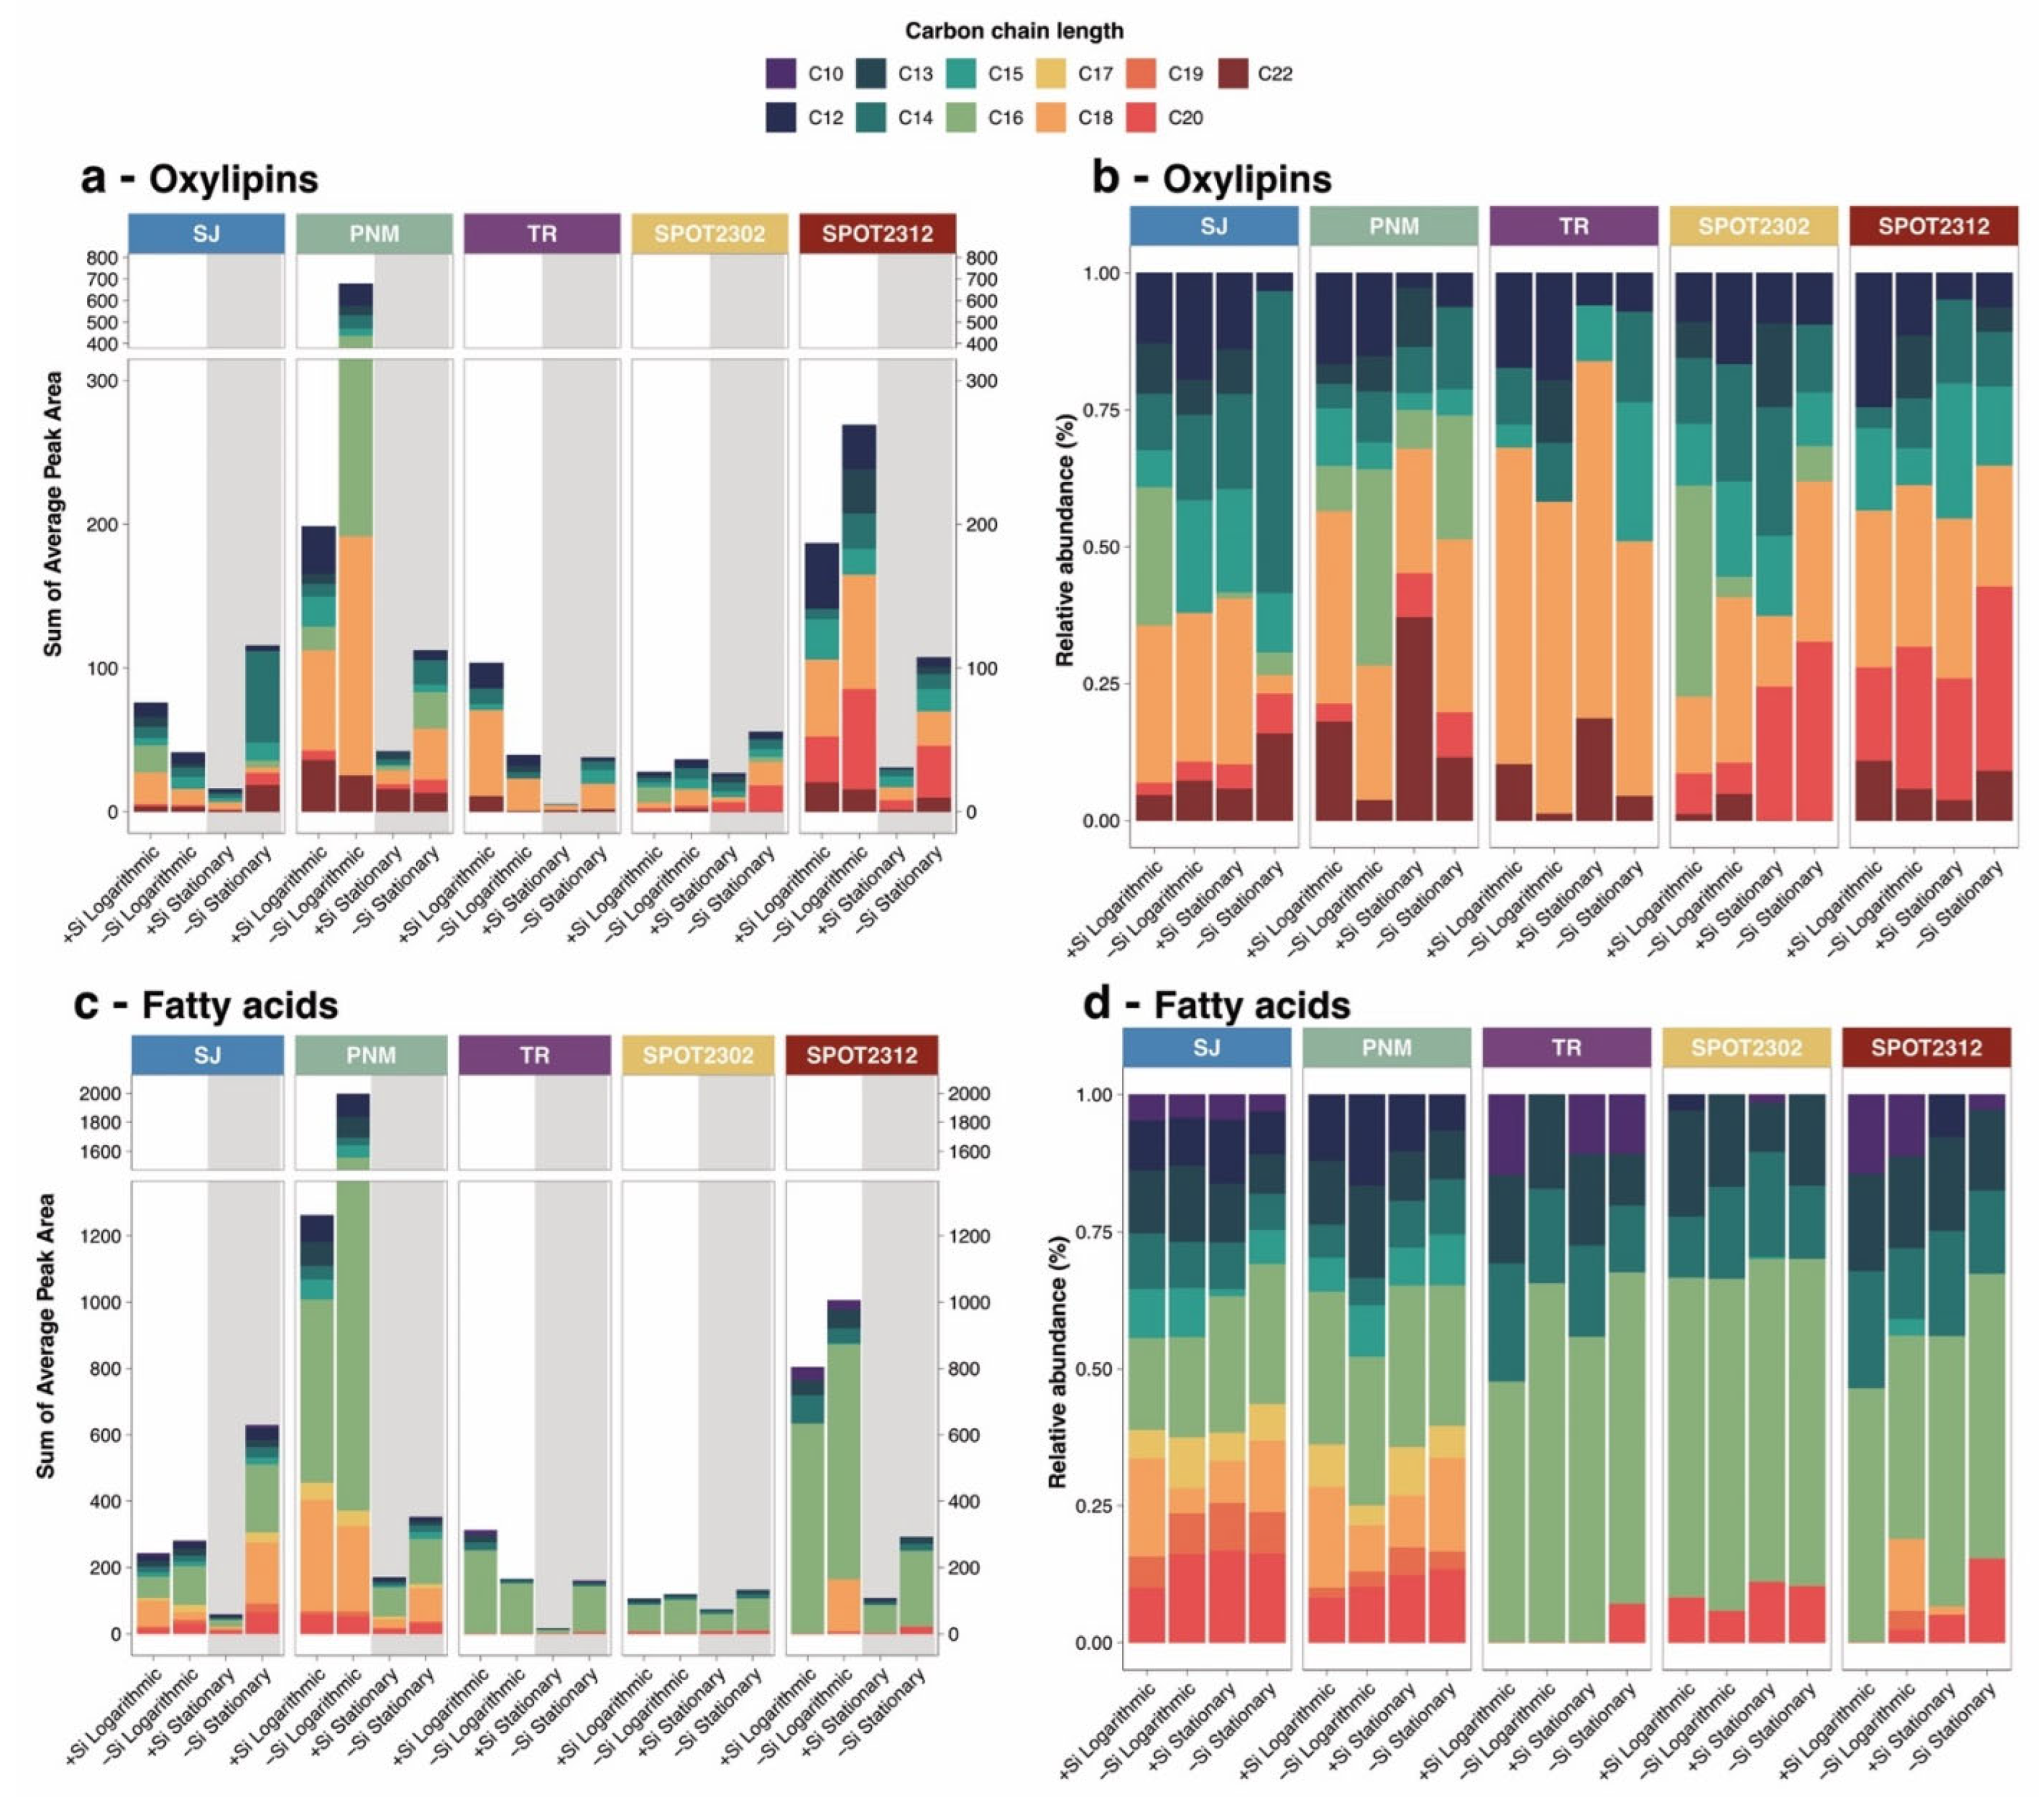
2.3. Differential release Of Oxylipins and Fatty Acids by Carbon Chain Length, Degree of Oxidation, and Saturation
S. japonicum, P. multiseries, and the SPOT2312 isolate released a higher amount of oxylipins and fatty acids per cell compared to T. rotula and the SPOT2302 isolate (Figure 2a,c). Generally, Si-limitation increased the amount of oxylipins and fatty acids released for S. japonicum, P. multiseries, and the SPOT isolates. While the amount of oxylipins released differed by species and growth condition, considering the relative abundance of oxylipins by carbon chain length revealed a diverse suite of compounds across all species (Figure 2b). In S. japonicum, C14, C20, and C22 oxylipins were higher during Si-limited, stationary growth whereas C18 oxylipins were higher during logarithmic growth (Figure 2, S20). In P. multiseries, C12-13, C15-16, and C18 oxylipins were all higher during logarithmic growth, especially with Si-limitation. (Figure 2, S20). On a relative basis, P. multiseries released more C22 oxylipins in Si-replete samples. In T. rotula, C14 and C15 oxylipins were higher during Si-limited stationary growth. Interestingly, no C16 and C20 oxylipins were observed in T. rotula. During stationary growth in the SPOT2302 isolate, C14 and C20 oxylipins were higher (Figure S20). Similar to P. multiseries, C12 and C18 oxylipins were higher in the SPOT2312 isolate with logarithmic growth.
Insights into the degree of oxidation revealed that oxylipins with a single oxygen insertion were the most abundant in all diatom species (Figure S21-22). Highly oxidized oxylipins (3 to 4 oxygen insertions) were produced more by S. japonicum, P. multiseries, and the SPOT2312 isolate. Interestingly, the SPOT2312 isolate produced the most amount of these highly oxidized features in comparison to the other species despite subtle differences in the structure of its dissolved lipidome with stress (Figure 1a,f). Monounsaturated oxylipins were the most abundant across all species (Figure S23-24). S. japonicum and P. multiseries contained more polyunsaturated (5-6 double bonds) oxylipins in comparison to T. rotula and the SPOT isolates which had more oxylipins with 3-4 double bonds. The SPOT2302 isolate produced more 5-double bond oxylipins than other diatom strains on a relative abundance basis (Figure 2b).
Intriguingly, species trends in the fatty acids released per cell were similar to those observed with oxylipins (Figure 2c). Si-limitation generally increased the amount of fatty acids released by diatoms, though they were not as diverse compared to oxylipins (Figure 2d). C16 fatty acids were released the most across all species and comprised most of the fatty acid pool in T. rotula and the SPOT isolates, which also had a lower diversity of fatty acid carbon chain-lengths. In contrast, S. japonicum and P. multiseries released an array of fatty acids ranging from C12-16 and C17-C20 (Figure S25). Moreover, fatty acid trends associated with culture condition also varied between species. In S. japonicum, Si-limitation with stationary growth increased the amount of C16 and C18 fatty acids. On the other hand, P. multiseries released more C12-15, C16, C18, and C20 fatty acids during logarithmic growth. Saturated fatty acids were the largest component of the fatty acid pool (Figure S26). However, polyunsaturated fatty acids (PUFA) increased in Si-limited S. japonicum during stationary growth whereas PUFAs were higher during logarithmic growth in P. multiseries and the SPOT2312 isolate.
Figure 3.
Estimated oxylipin quantities. (a) Boxplots of log-transformed and cell-normalized oxylipin quantities; (b) nanograms of oxylipin released per cell; (c) picograms of oxylipin released per cell. Calculated oxylipin concentrations were normalized to cell counts, then averaged across triplicates. ± denotes the standard deviation between triplicates. Features with no values or values near zero are denoted by empty white boxes. Features are organized by carbon-chain length. Samples are grouped by species and organized by culture condition.
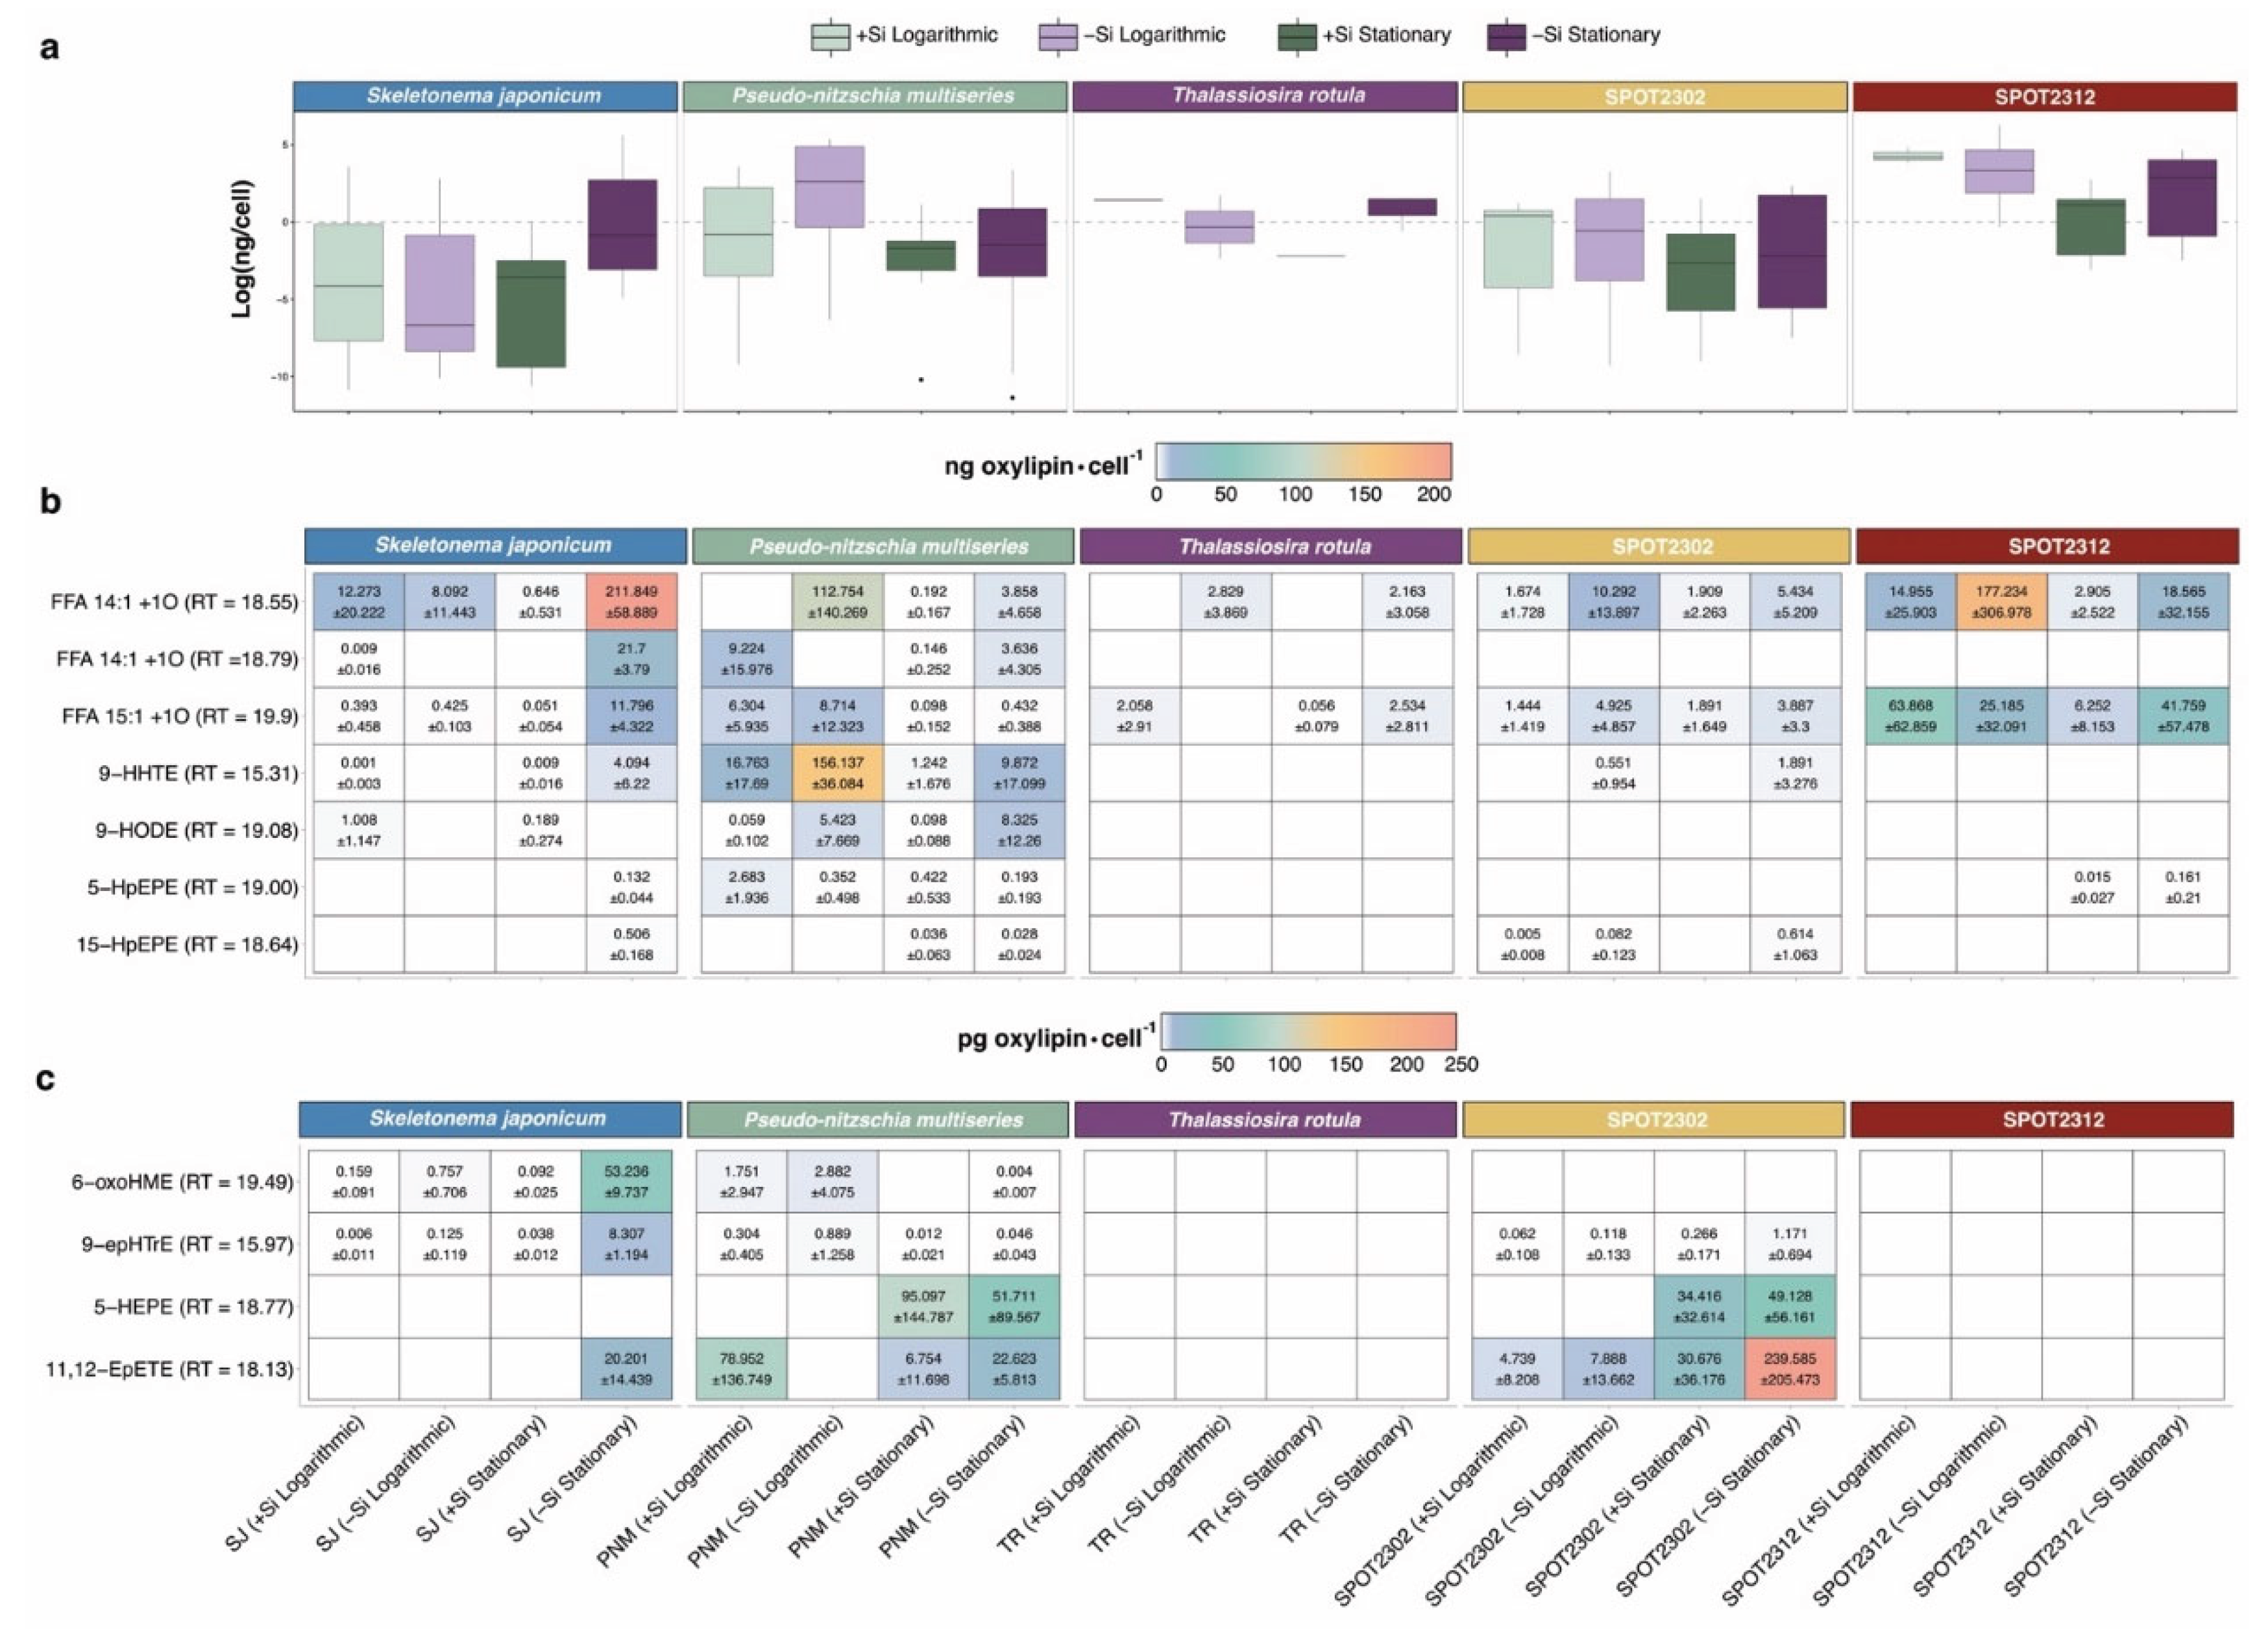
2.5. Oxylipin Concentrations
For structurally confirmed oxylipins, concentrations were calculated using a linoleic acid oxylipin standard curve (Linoleic Acid Oxylipins MaxSpec® LC-MS Mixture, Cayman Chemical, USA). Variations between oxylipin standard curves were observed (Figure S27), so concentrations were calculated based on functional group similarity between the standard and the oxylipin. Some oxylipin concentrations were high enough to be displayed in nanograms per cell (Figure 3b) while others were displayed in picograms due to their low concentration (Figure 3c).
In S. japonicum, oxylipin concentrations were particularly high in Si-limited cultures during stationary growth (Figure 3). In this condition, FFA 14:1 +1O (RT = 18.55) had the highest concentration which accounted for 211.849 ng/cell. Of the C16 oxylipins, 9-HHTE accounted for 4.094 ng/cell, while 9-epHTrE and 6-oxoHME were lower at around 53.236 pg/cell and 8.307 pg/cell, respectively. 5-HpEPE and 15-HpEPE were present at around 0.132 and 0.506 ng/cell, respectively, while 11,12-epETE was lower at around 20.201 pg/cell.
In P. multiseries, the highest oxylipin concentrations were observed in Si-limited cultures during logarithmic growth, with 9-HHTE and FFA 14:1 +1O (RT = 18.55) estimated at 156.137 and 112.754 ng/cell, respectively. Interestingly, it appears C16 oxylipins are released more during logarithmic growth while C20 oxylipins are released more during stationary growth. 6-oxoHME and 9-epHTrE accounted for 2.882 and 0.889 pg/cell, respectively, in Si-limited samples collected during logarithmic growth. On the other hand, 5-HEPE and 11,12-epETE accounted for 51.711 and 22.623 pg/cell, respectively, in Si-limited samples collected during stationary growth.
Compared to S. japonicum and P. multiseries, T. rotula and the SPOT isolates released only a subset of annotated LOFAs. In T. rotula, many of the LOFAs were absent except for FFA 14:1 +1O (RT = 18.55), which was higher during Si-limitation ranging from 2.163-2.829 ng/cell. For the SPOT2302 isolate, both FFA 14:1 +1O and FFA 15:1 +1O were higher in Si-limited cultures. Interestingly, C20 oxylipins like 5-HEPE and 11,12-epETE were higher during stationary growth, with 11,12-epETE estimated at around 239.585 pg/cell. In the SPOT2312 isolate, the oxylipin FFA 14:1 +1O had a high concentration of 177.234 ng/cell, with concentrations of FFA 15:1 +1O as high as 63.868 ng/cell. 5-HpEPE was also produced in smaller amounts during stationary growth, ranging from 0.015-0.161 ng/cell.
Figure 4.
Boxplots of cell normalized and log transformed peak areas for features of interest in Skeletonema japonicum and P. multiseries: (a) FFA 12:3 +2O; (b) FFA 14:1 +1O, retention time = 18.55 minutes; (c) FFA 14:1 +1O, retention time = 18.79 minutes,;(d) FFA 15:1 +1O; (e) FFA 16:2; (f) Hexadecatrienoic acid; (g) FFA 16:4, retention time = 17.87 minutes; (h) FFA 16:4, retention time = 19.49 minutes; (i) 6-oxo-hexadecaenoic acid; (j) FFA 16:1 +1O; (k) 9-hydroxy-hexadecatetraenoic acid; (l) 9-epoxy-hexadecatrienoic acid; (m) 9-hydroxy-octadecadienoic acid; (n) FFA 18:2 +1O; (o) FFA 18:5 +1O; (p) Eicosapentaenoic acid; (q) 5-hydroperoxy-eicosapentaenoic acid; (r) 15-hydroperoxy-eicosapentaenoic acid; (s) 11,12-epoxy-eicosatetraenoic acid; (t) 6-ketoprostaglandin E1; (u) FFA 22:4 +4O; (v) FFA 22:6 +3O. Si-replete samples colored green whereas Si-limited samples are colored purple. Samples collected during logarithmic growth are lighter. Stars and triangles denote significant features from ANOVA in S. japonicum and P. multiseries, respectively.
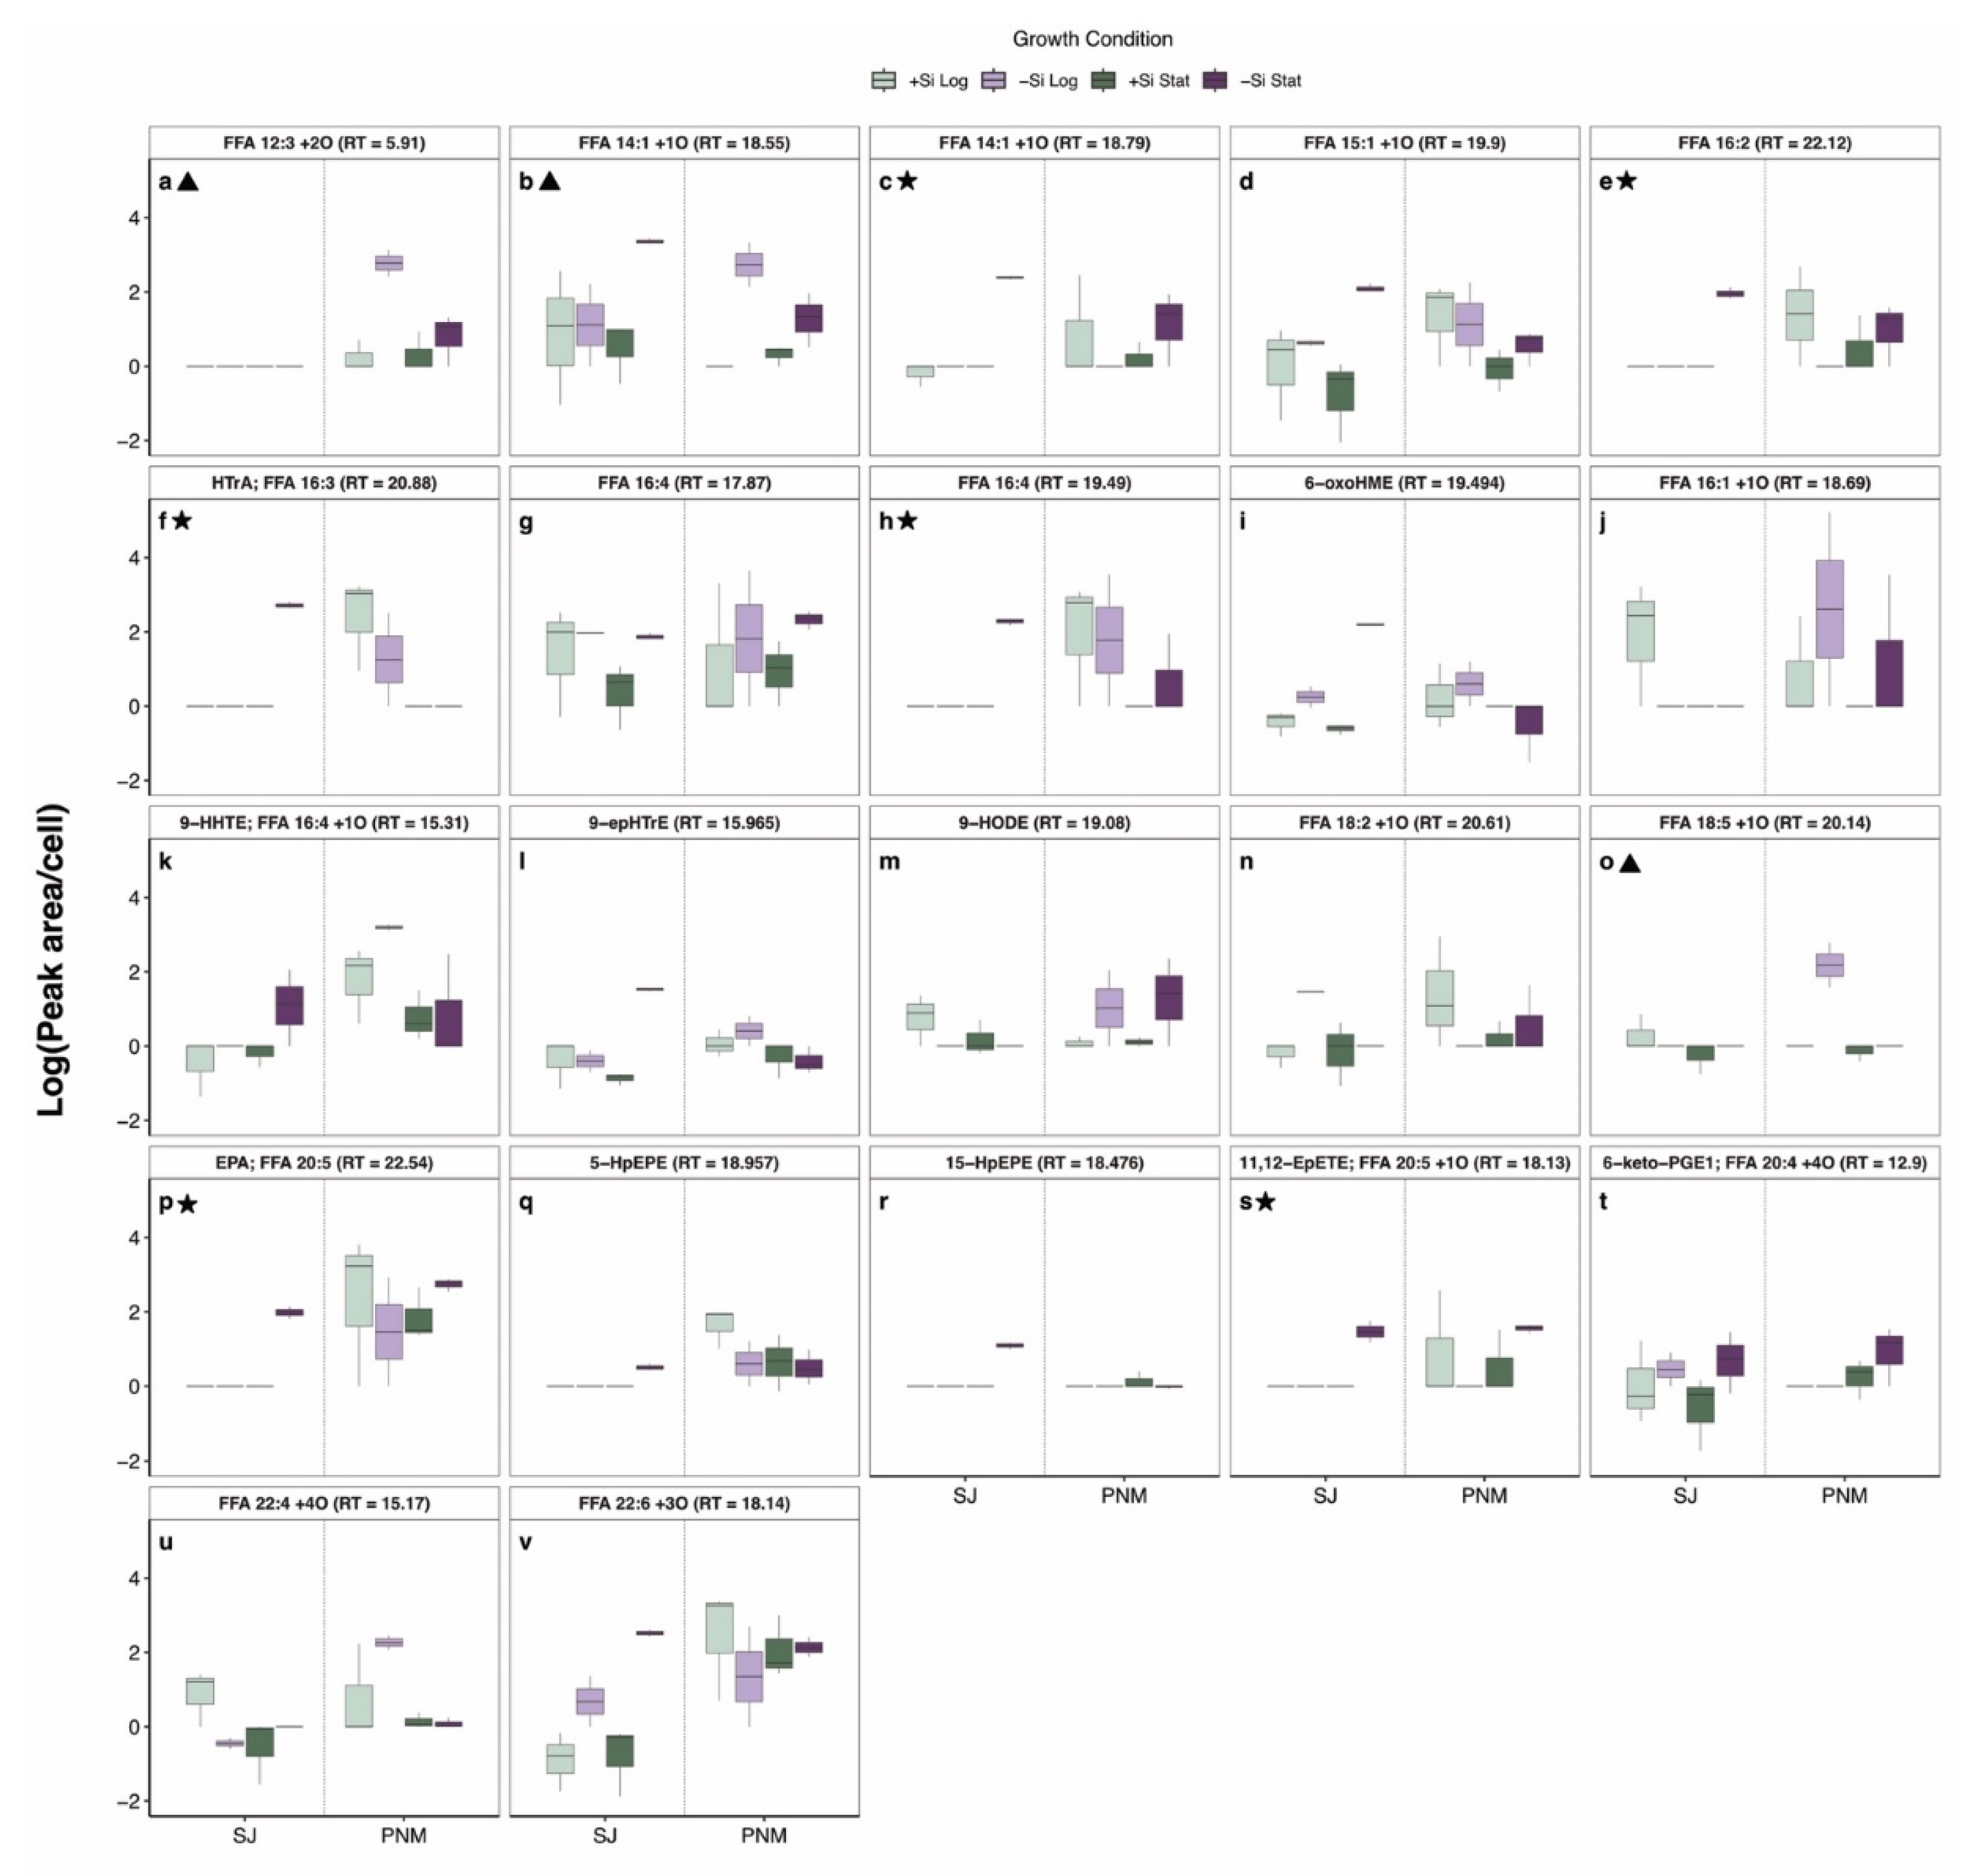
2.4. Comparison Between S. Japonicum and P. Multiseries
Analyses on S. japonicum and P. multiseries revealed a distinct response in the dissolved lipidomes cultures (Figure 1a,b), with the highest release of compounds during Si-limited stationary growth in S. japonicum and during Si-limited logarithmic growth in P. multiseries (Figure 2, Figure 3 and Figure 4). To explore the variability between the two diatoms, several compounds of interest were compared (Figure 4). A few features displayed similar trends between the two species, with FFA 14:1 +1O (RT = 18.79) and 11,12-epETE both increasing in Si-limited samples during stationary growth (Figure 4c,s). However, several features displayed different trends.
In samples from S. japonicum, the following features were only higher in Si-limited cultures under stationary growth: FFA 14:1 +1O (RT = 18.55), FFA 14:1 +1O (RT = 18.79), FFA 15:1 +1O, FFA 16:2, HTrA, FFA 16:4 (RT = 19.49), 6-oxoHME, 9-HHTE, 9-epHTrE, EPA, 5-HpEPE, 15-HpEPE, 11,12-epETE (Figure 4). FFA 16:1 +1O and FFA 22:4 +4O were both higher in Si-replete cultures during logarithmic growth (Figure 4j,u). 9-HODE and FFA 18:5 +1O were the highest amongst Si-replete cultures (Figure 4m,o). The prostaglandin, 6-ketoPGE1, and FFA 22:6 +3O were both higher in Si-limited cultures (Figure 4t,v). Lastly, FFA 18:2 +1O was higher only in Si-limited cultures during logarithmic growth (Figure 4n).
In samples from P. multiseries, the following features were high during logarithmic growth: FFA 15:1 +1O, HTrA, FFA 16:4 (RT = 19.49), 6-oxoHME, FFA 16:1 +1O, and 9-HHTE (Figure 4). The prostaglandin, 6-ketoPGE1, was higher during stationary growth (Figure 4t). Features like FFA 12:3 +2O, FFA 14:1 +1O (RT = 18.55), and 9-HODE were higher in Si-limited samples (Figure 4a,b,m) whereas FFA 18:5 +1O and FFA 22:4 +4O were also higher in Si-limited cultures but only during logarithmic growth (Figure 4o,u). While there were variations in compound-specific trends between the two species, some generalizations could be observed. For instance, C16 oxylipins and fatty acid precursors (HTrA, FFA 16:4, 6-oxoHME, 9-epHTrE, and 9-HHTE were higher in Si-limited cultures of S. japonicum during stationary growth while they were higher during logarithmic growth in P. multiseries (Figure 4c,f,h,i,s,t).
Figure 5.
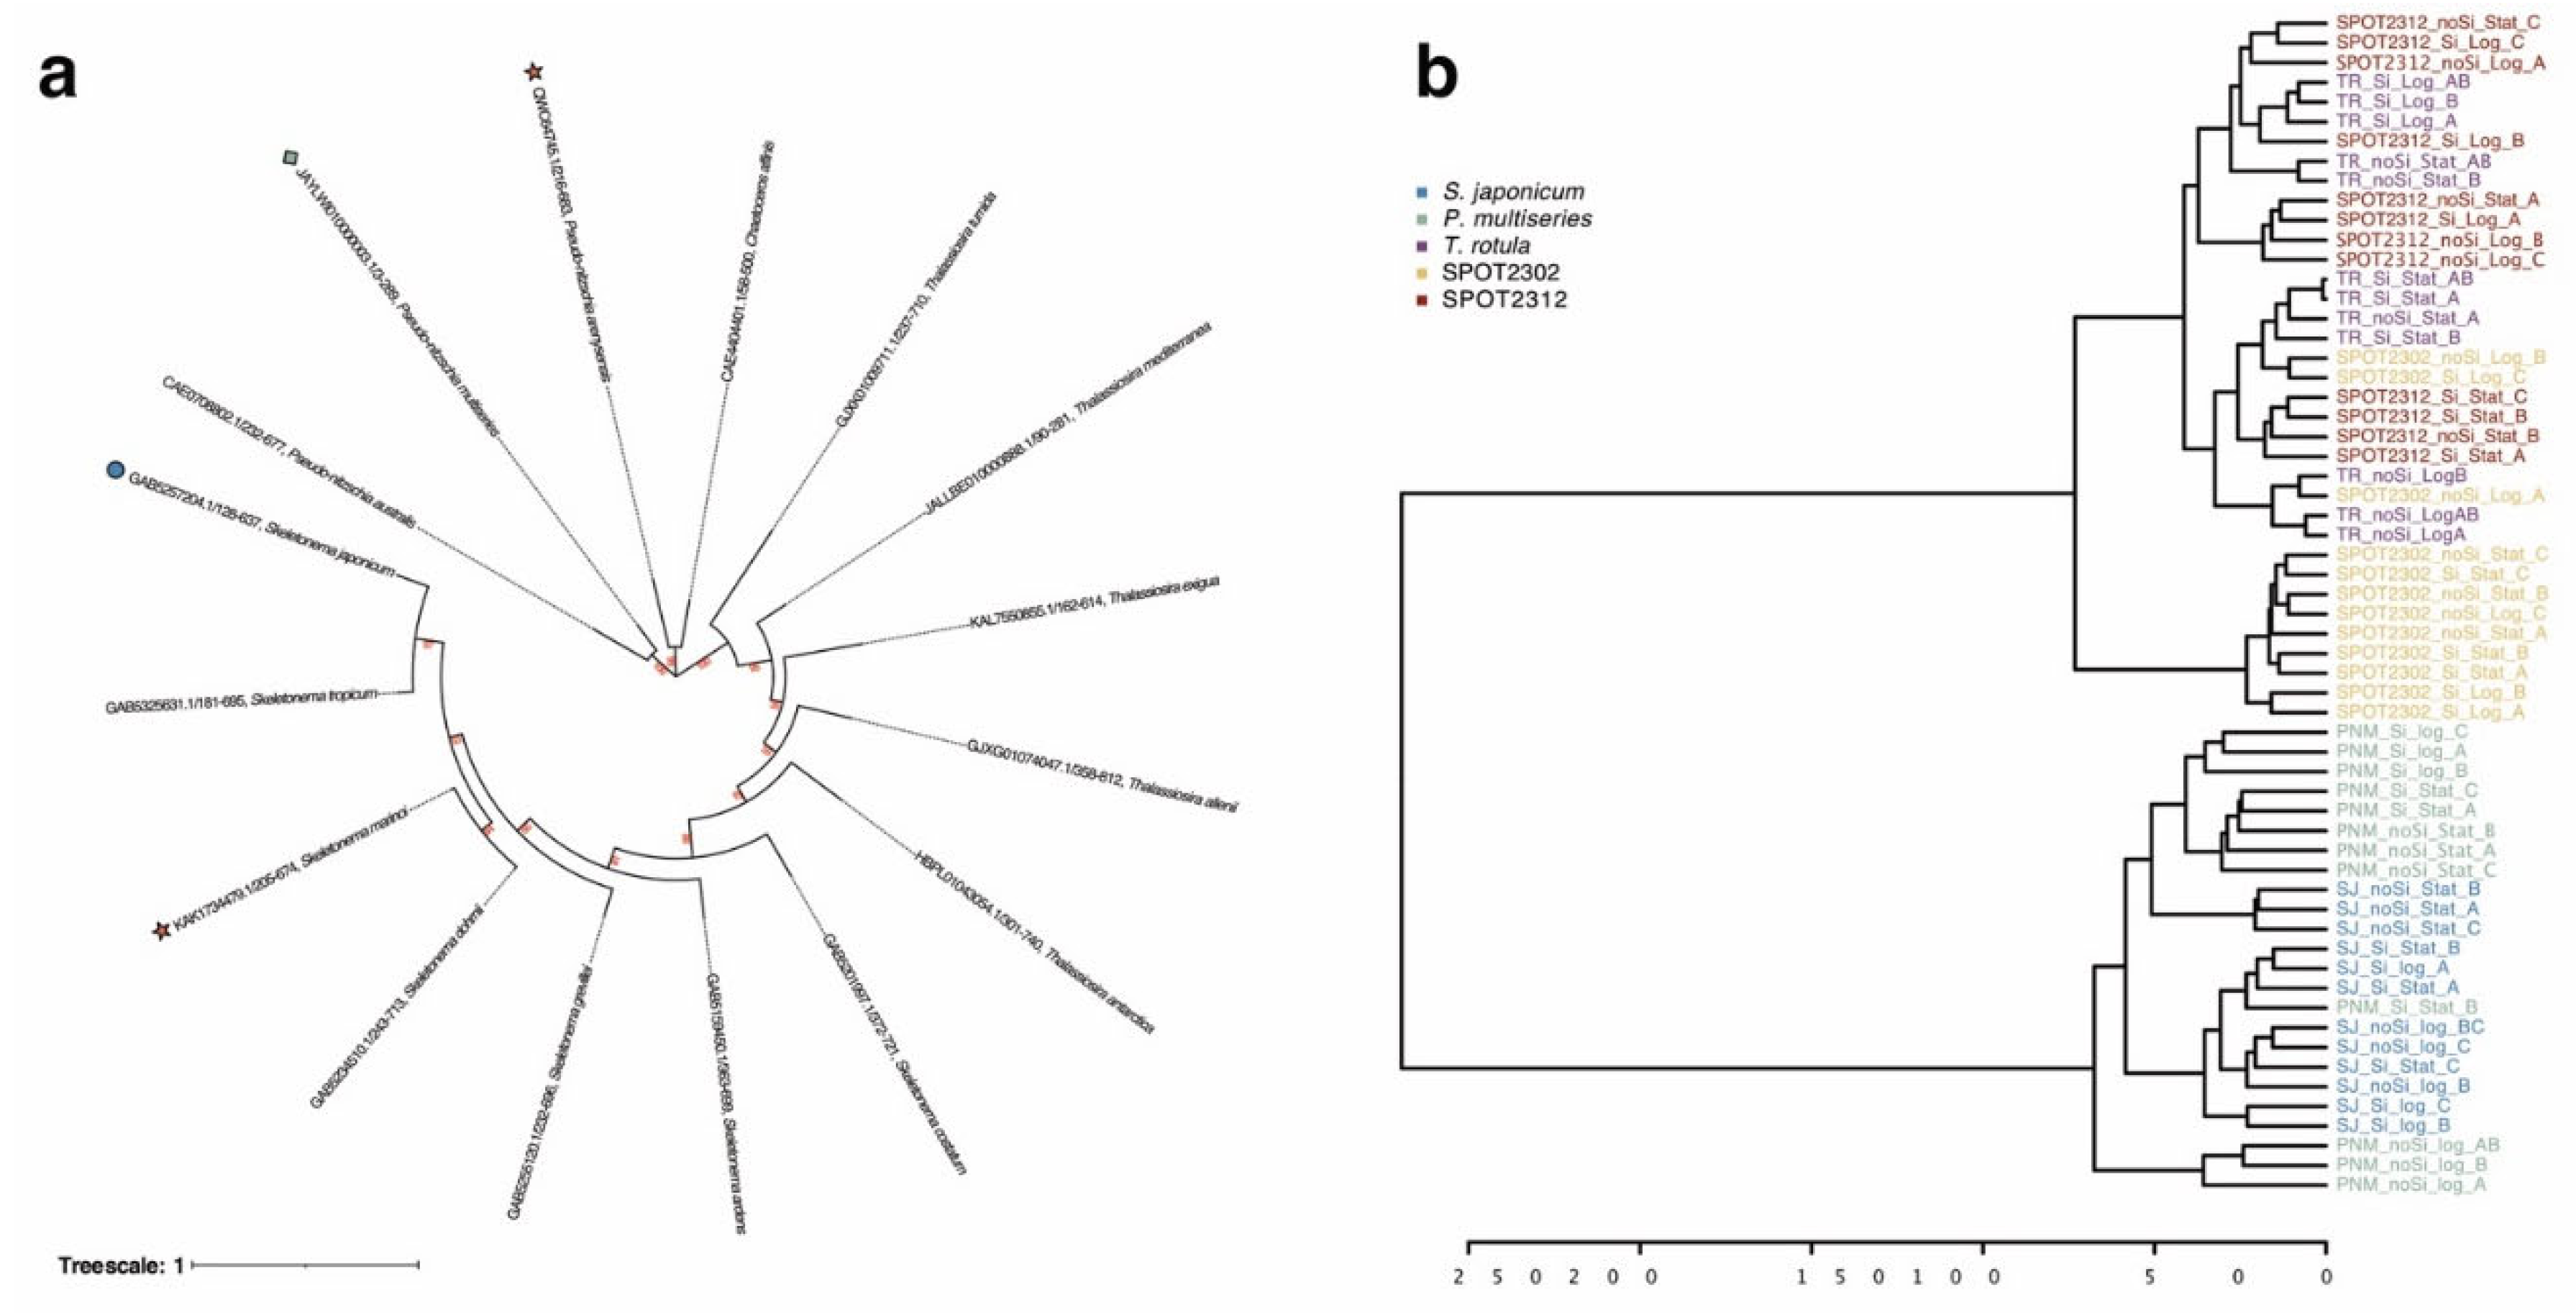
Analysis of diatom lipoxygenases and dissolved lipidomes: (a) phylogenetic analysis of lipoxygenase sequences aligned to the HMM profile of the lipoxygenase domain (PF00305); (b) dendrogram comparing annotated dissolved lipidomes. Each lipoxygenase sequences contains their NCBI accession number and the diatom species. Bootstrap values are displayed in red. Red stars denote reference lipoxygenase sequences while Skeletonema japonicum and Pseudo-nitzschia multiseries are denoted by a blue circle and a green diamond, respectively. For the dendrogram, samples are colored by diatom species: Skeletonema japonicum (blue), Pseudo-nitzschia multiseries (green), Thalassiosira rotula (purple), SPOT2302 isolate (yellow), SPOT2312 isolate (orange).
Figure 5.
Analysis of diatom lipoxygenases and dissolved lipidomes: (a) phylogenetic analysis of lipoxygenase sequences aligned to the HMM profile of the lipoxygenase domain (PF00305); (b) dendrogram comparing annotated dissolved lipidomes. Each lipoxygenase sequences contains their NCBI accession number and the diatom species. Bootstrap values are displayed in red. Red stars denote reference lipoxygenase sequences while Skeletonema japonicum and Pseudo-nitzschia multiseries are denoted by a blue circle and a green diamond, respectively. For the dendrogram, samples are colored by diatom species: Skeletonema japonicum (blue), Pseudo-nitzschia multiseries (green), Thalassiosira rotula (purple), SPOT2302 isolate (yellow), SPOT2312 isolate (orange).
2.5. Comparison of lipoxygenases and Lipidomic Profiles
To bridge lipidomic analyses with the mechanisms behind oxylipin biosynthesis, a closer look into lipoxygenases was performed. Reference sequences annotated as lipoxygenases from Pseudo-nitzschia arenysensis (QWC64745.1) and Skeletonema marinoi (KAK1734479.1) were used to search for putative lipoxygenase sequences from diatoms from genera in our study. Retrieved lipoxygenase sequences were aligned to the lipoxygenase hidden Markov model (PF00305) prior to building a maximum likelihood tree (Figure 5a). Sequences formed four major groups based on the diatom genus: two Pseudo-nitzschia branches and a Skeletonema branch within the Thalassiosira branch. While more sequences from Chaetoceros are needed, it appears that lipoxygenase sequences from C. affinis are closely related to those of P. arenysensis while P. australis and P. multiseries share a different lipoxygenase. Furthermore, sequences from Skeletonema appear more closely related to sequences from Thalassiosira than those from Pseudo-nitzschia. When comparing lipidomic samples only based on annotated features, diatom species display opposing trends (Figure 5b). Lipidomic samples from S. japonicum were closely related to those of P. multiseries and samples from T. rotula and the SPOT2312 isolate formed another cluster. Interestingly, samples from the SPOT2302 isolate formed their own cluster, separate from the other four diatom species.
3. Discussion
3.1. Oxylipins Associated with Growth Phase and Si-Limitation
Oxylipin production, mainly PUAs, occurs when diatoms are stressed or wounded by grazing [16,19,20,21,22]. Here, we present evidence that physiological changes associated with growth phase and Si-limitation elicit the extracellular release of LOFAs across five diatom species. Our results suggest that the release of LOFAs in each growth phase varies by diatom, with Si-limitation generally increasing quantities released.
3.1.1. Effect of Growth Phase
Intriguingly, we observed the highest release of LOFAs and fatty acids in P. multiseries and the SPOT2312 isolate during logarithmic growth (Figure 2). These results oppose previous findings, which observed the highest oxylipin release with culture age [14,16,20,21,44]. Differences in our observations could be attributed to the species-specific release of LOFAs (Figure 1), which also display different trends based on carbon chain length (Figures 2,4). For instance, C20-derived compounds like 11,12-epETE and 5-HEPE were both higher during stationary growth in P. multiseries and the SPOT2302 isolate (Figure 3,4). Trends within this group of compounds align with previous findings which observed higher release of 15-HpEPE and 15-HEPE during stationary growth in Chaetoceros spp and Pseudo-nitzschia delicatissima. [16,44]. However, when considering the overall signal, trends in P. multiseries and the SPOT2312 were driven by C18 LOFAs (Figure 2). A range of C18 LOFAs (FFA 18:1 +1O, FFA 18:2 +1O, FFA 18:4 +1O) and some smaller LOFAs (FFA 12:2 +1O, FFA 12:3 +2O, FFA 13:2 +1O) were all higher during logarithmic growth in P. multiseries (Figure S16). For the SPOT2312 isolate, compounds like FFA 18:3 +3O and FFA 12:3 +2O were higher during logarithmic growth (Figure S19).
The increase of LOFAs during logarithmic growth for P. multiseries and the SPOT2312 isolate is confounding, but this trend could align with phytoplankton assemblages in the Mediterranean where oxylipin production was inversely correlated with diatom abundance [25]. Russo et al. proposed that this inverse relationship could be indicative of quorum sensing like chemical signaling, with communication facilitated by stronger signals at low diatom abundances. Thus, we hypothesize that the elevated levels of C18 LOFAs might regulate growth, potentially acting as quorum sensing compounds. Because C18 fatty acids are minor components in diatoms [45], it is possible that C18-derived LOFAs could serve as highly specific signals.
While controlled experiments on diatom oxylipin quorum sensing have not been done yet, oxylipins in the bacterium, Pseudomonas aeruginosa, and the fungi, Aspergillus ochraceus, display quorum sensing properties [46,47]. Furthermore, reduced growth in P. arenysensis variants with silenced lipoxygenase transcripts alludes to the role of oxylipins in regulating growth [48]. It also conceivable that C18 LOFAs could facilitate interactions between diatoms and microbes during growth, allowing diatoms to “fine-tune” their microbiome as observed with other compounds [49]. PUAs, for instance, can have a differential effect on marine bacteria [12]. Nonetheless, more information is needed to elucidate the role of LOFAs in regulating diatom growth and interactions with their microbiome.
3.1.2. Effect of Si-Limitation
Notably, S. japonicum and P. multiseries produced a distinct lipid signal in response to Si-limitation (Figures 1b,c). In S. japonicum, the elevated release of LOFAs (C14, C16, C20) and PUFA oxylipin precursors (HTrA, EPA) was observed in Si-limited cultures only during stationary growth (Figure 4, Table S2). In this condition, compounds like 6-oxoHME, 9-epHTrE, 9-HHTE, 11,12-epETE, 5-HpEPE, and 15-HpEPE were all elevated (Figure 4). Because C20-derived LOFAs have been observed to be allelopathic, it is possible that S. japonicum increases LOFA production when Si-limited as a form of chemical defense or signaling. Our results align with previous findings in Si-limited S. marinoi, which attributed the increase of PUAs like heptadienal and octadienal as form of chemical defense to compensate for thinner siliceous cell walls [50]. Additionally, Si-limited S. japonicum cultures during stationary growth had a negative growth rate compared to the other culture conditions (Table S3). Because the highest release of LOFAs occurred in this growth condition, it is possible that LOFAs could also negatively affect growth in S. japonicum. The elevated release of LOFAs in Si-limited S. japonicum could be indicative of stress response to regulate cell death, as observed with PUAs [15,17]. Whereas in P. multiseries, Si-limited cultures during logarithmic growth were elevated in compounds like FFA 14:1 +1O and FFA 18:5 +1O (Figure 4, Figure S19). Because of the differential release of LOFAs in each growth phase with Si-limitation, LOFAs might serve a different role in P. multiseries compared S. japonicum. Interestingly, FFA 14:1 +1O, analogous to 9-hydroxy-tetradeca-7-enoic acid, was also higher in Si-limited S. japonicum, serving as a general marker for stress due to observations of C14 LOFAs with grazing and viral lysis [10,16].
In general, Si-limitation increased the extracellular release of LOFAs and fatty acids across all species (Figures 2a,c). Release of LOFAs and fatty acids mirrored each other, perhaps indicating alternative release mechanisms for oxylipins. Though it is generally understood that oxylipin biosynthesis terminating in PUA production begins right after cell membrane disruption, oxylipin release from intact cells can occur through mechanisms that are not fully understood [14,51]. One possible explanation for the increase in LOFAs and fatty acids with Si-limitation could be associated with increased cell “leakage” or passive diffusion. Because the microstructures of diatom cell walls can affect diffusion [52], it is plausible that altered cell wall morphology with Si-limitation (i.e. thinner frustules) could increase the leakage of intracellular LOFAs and fatty acids. Another release mechanism could be extracellular vesicle production, which can remove intracellular oxylipins. In Coscinodiscus radiatus, production of vesicles containing both oxylipins and fatty acids was observed when silicon became depleted [53]. While extracellular vesicles were not measured, future studies profiling the lipidome of these vesicles could provide insights on the mechanisms of oxylipin release from intact diatoms.
3.2. Variability Between Diatom Species
Oxylipin biosynthesis is mainly initiated by lipoxygenases that insert hydroperoxyl moieties on polyunsaturated fatty acids (PUFA) [54,55]. While most diatoms contain the molecular machinery for oxylipin biosynthesis [56], production of LOFAs and PUAs is not always conserved across species or even strains [57,58,59]. Thus, the differences in the dissolved lipidomes and LOFA profiles with growth and Si-limitation (Figure 1) could be explained by differences between lipoxygenases (Figure 5). Previous bioinformatic investigations on the structure and function of lipoxygenases in diatoms attributed the variability in oxylipin products to small changes in amino acid residues, allowing diatoms to ‘fine-tune’ their lipoxygenases [60]. This is evident in the Pseudo-nitzschia genus, with oxylipins proposed to serve as markers for phenotypic delineation [57,58]. While our bioinformatic analysis did not include lipoxygenase sequences from other diatom genera, our results generally agree with previous findings on diatom lipoxygenases [60] with Pseudo-nitzschia sequences falling into two separate branches of the phylogenetic tree (Figure 5). However, there is likely some other control on oxylipin production as P. multiseries and S. japonicum had the most distantly related lipoxygenase sequences but the most similar dissolved lipidomes (Figure 1a, 5). For instance, diatoms could alter their dissolved metabolome to facilitate interactions between their microbiomes, as observed in Asterionellopsis glacialis through the release of azelaic and rosmarinic acid [61].
Furthermore, we noted an absence of some PUFA precursors and LOFAs in T. rotula, (Figure 3, Figure S19), which has been used a model organism for oxylipin biosynthesis [62,63]. Previous studies explored oxylipin production in T. rotula by stimulating grazing through freeze-thaw cycles or sonication whereas we looked at the dissolved oxylipins after gently removing the cells from the media with filtration. Thus, it is plausible that T. rotula might only produce oxylipins when grazed upon.
3.3. Implications for Marine Ecosystems and Biogeochemistry
Our observations of diatoms in culture indicate Si-limitation increases the release of fatty acids and oxylipins. Specifically, in S. japonicum and P. multiseries, Si-limitation drove a distinct lipid signal (Figure 1) that could extend to diatoms in Si-limited regions or during bloom demise when silicon becomes depleted [64]. Considering P. multiseries can release up to 156.137 ng of 9-HHTE per cell and the estimation of 10,000 cells per liter of seawater, concentrations of 9-HHTE could amount to 5.91 µM. Within this concentration range, 9-HHTE and other LOFAs could decrease zooplankton grazing, inhibit phytoplankton competitors, and alter bacterioplankton growth. For instance, high concentrations of LOFAs have been observed to negatively impact copepod reproduction both at sea and in laboratory studies [22,26,27]. Increased LOFAs can also deter microzooplankton grazing, providing diatoms with a competitive edge over other phytoplankton [10]. Johnson et al. observed a reduction in dinoflagellate grazing on diatoms with the addition of 1 nM of 15-hydroperoxy-eiocsatetraenoic acid (15-HpETE) and 1 mM 2E,4Z-decadienal [10]. Moreover, while the effect of LOFAs on other phytoplankton needs further evaluation, PUA concentrations higher than 1 µM were observed to decrease phytoplankton growth [8]. Bacterioplankton could also be “sensitive” to increases in LOFAs, as observed with the growth reduction of K. algicida with 1 µg/mL of 15-HEPE [14]. Thus, for diatoms like Skeletonema and Pseudo-nitzschia, increased levels of LOFAs associated with Si-limitation could impact various components of marine ecosystems under blooming conditions.
Further, the concomitant release of PUFAs with Si-limitation poses further implications for marine ecosystems, as PUFAs can act as energy sources that connect to phytoplankton to other trophic levels. In S. japonicum, Si-limitation significantly increased the release of EPA and C16 PUFAs (Figure 4, Table S2) possibly due to cell leakage. Because EPA is considered an essential fatty acid that is generally obtained from diet, increased release with Si-limitation could provide a source of energy for heterotrophic organisms. DOM from Si-stressed diatoms has been observed to promote bacterial activity, suggesting that diatom exudates post-bloom could impact subsequent heterotrophic organisms [65].
Lastly, increases in LOFAs and fatty acids during Si limitation has important implications for understanding the fate of diatom blooms. These compounds have previously been shown to play roles in deterring or inhibiting grazing activity and growth rate of protist grazers [10,18,66] and disrupting the development of copepod eggs and nauplii [9,11,26]. Without accounting for viral losses, these findings raise the possibility that during Si limitation, diatom bloom biomass may persist longer due to depressed grazing. Taking this into account, and considering that Si-limited diatoms are known to have high sinking rates [67], our results suggest that Si-limited diatom blooms may have an increased propensity for sinking out of the surface layer and contributing to export. Increased formation of transparent exopolymer particles as a result of PUAs could also account for export to depth [68]. Conversely, PUAs can also affect the remineralization of particulate organic matter [13] and organic phosphorous [23]. While not many studies have investigated the effect of LOFAs on marine biogeochemistry, higher enzyme activity was observed in sinking particle incubations with 15-HpETE [69]. Thus, LOFAs might act similarly to PUAs, allowing oxylipin-resistant microbes to outcompete oxylipin-sensitive microbes [13,70]. Identification of a primary receptor for oxylipins in P. aeruginosa [46], further raises implications for interkingdom signaling between diatoms and associated bacteria via lipid based signals [49]. In this study, several LOFAs (6-oxoHME, 9-epHTrE, 9-HHTE, 11,12-EpETE, 5-HEPE) associated with Si-limitation could serve as potential candidates for assessing interactions between diatom-derived LOFAs and particle associated bacteria. Ultimately, given that the net effect of chemical interactions can shape marine biogeochemistry, more investigations in culture and at sea are needed to elucidate how LOFAs affect the fate of diatom primary production.
4. Materials and Methods
4.1. Diatom Cultures
Skeletonema japonicum and Pseudo-nitzschia multiseries were isolated in 2021 from Monterey Bay and kindly provided by Holly Bowers. Thalassiosira rotula (CCMP3362 ) was obtained from Bigelow National Center for Marine Algae and microbiota (NCMA), and cultures SPOT2302 (unidentified diatom) and SPOT2312 (Chaetoceros sp.) were isolated in 2023 from the San Pedro Ocean Time Series by Matt Johnson. All stock cultures were maintained at 15°C in 35 PSU coastal sea water from Martha’s Vineyard Sound amended with f/2 + Si media. For experiments herein, diatom cultures were grown in triplicate batch cultures under either nutrient replete (f/2+Si) or silicon-limited (f/2-Si) conditions, and cells were harvested at both logarithmic and stationary phase of growth. In our study, stationary growth was defined as cultures sampled during the final sampling point, which displayed lower growth rates compared to the cultures sampled earlier defined as logarithmic growth. Growth rates were calculated via daily cell counts using microscopy (Table S3).
4.2. Lipid Extraction and Data Acquisition
Media (~15 mL) collected from cultures was filtered through a 0.2 µm Durapore filter, loaded onto conditioned HLB-SPE cartridges, and stored at -80°C until extraction. Dissolved lipids were eluted with methanol (2 mL) into combusted vials containing butylated hydroxytoluene (antioxidant) and 10 µL of deuterated internal standard (SPLASH LIPIDOMIX, Avanti Polar Lipids, Alabaster, AL, USA). Extracts were transferred into combusted HPLC vials, capped under nitrogen gas, and stored at -80°C. Samples (2 µL) were separated on a C8 column (155 mm × 2.1 mm × 2.6 μm) using reverse phase ultra-high-pressure liquid chromatography (Vanquish, ThermoFisher Scientific). A solvent gradient of 45A/55B to 1A/99B over 30 minutes was used. Eluent A consisted of LC-grade water and Eluent B consisted of acetonitrile and isopropanyl (70:30), both of which contained 10 mM ammonium acetate and 0.1% acetic acid. Mass spectrometric analysis was performed in negative mode using a high-resolution accurate-mass spectrometer (Orbitrap ID-X, ThermoFisher Scientific).
4.3. Lipidomic Analysis.
Raw files were converted to mzXML format using msconvert [71]. Feature annotation was performed using the LOBSTAHS R package which utilized XCMS and CAMERA to align chromatograms and integrate peaks [72,73,74]. A total of 5,852 features were identified and a subset were annotated as free fatty acids (FFA), polyunsaturated aldehydes (PUA), intact monoacylglycerols (IP-MAG), and intact diacylglycerols (IP-DAG). Annotations as FFAs and PUAs (n = 256) were retained for manual verification in MAVEN [75], resulting in 60 features with high quality extracted ion chromatograms. Peak areas were blank subtracted, then normalized to an internal standard, 1-oleoyl(d7)-2-hydroxy-sn-glycero-3-phosphoethanolamine (LPE), and cell counts. Because many of these features lacked MS2 fragmentation, a subset of samples was run again with a given list of m/z ratios to fragment. List of m/z ratios were retrieved from the LOBSTAHS analysis on the first LCMS run. To confirm annotations, raw files from both LCMS runs were converted to .ABF format using (Reifycs Abf Converter) and analyzed separately in MSDIAL [76]. Features with MS2 fragmentation were confirmed using modeled fragmentation databases via Competitive Fragmentation Modeling-ID (CFMID) and an ESI(-)-MS/MS MSDIAL database from authentic standards. Annotations from LOBSTAHS (n = 60) and MSDIAL were matched based on observed m/z and retention time similarity (threshold: 0.001) and retention time (threshold: 0.1). Differences in retention time were observed from the first LCMS run, so a threshold of 0.25 minutes was applied to match features from the second LCMS run. For compounds with MS2 verification, concentrations were estimated from peak area using a linoleic acid oxylipin standard curve (Linoleic Acid Oxylipins MaxSpec® LC-MS Mixture, Cayman Chemical, USA). Estimated concentrations were then normalized to cell counts.
4.4. Statistical Analysis
Statistical analyses were performed in the online version of MetaboAnalyst 5.0 [77], using peak areas (cell normalized and log-transformed) generated from the LOBSTAHS pipeline. Partial Least Squares Discriminant Analysis (PLSDA) was performed on all samples and verified via cross validation. Principal component analysis (PCA) and analysis of variance (ANOVA) were performed on samples from each species separately. The dendrogram comparing lipidomic samples was constructed using Euclidean distance and a Ward clustering algorithm.
4.5. Lipoxygenase Sequence Analysis
Reference sequences annotated as lipoxygenases from Pseudo-nitzschia arenysensis (QWC64745.1) and Skeletonema marinoi (KAK1734479.1) were used to search for putative lipoxygenase sequences via the Basic Local Alignment Search Tool (BLAST) from the National Center of Biotechnology Information (NCBI). Protein sequences were searched for in the non-redundant protein sequences (nr) and the transcriptome shotgun assembly proteins (tsa_nr) databases. Nucleotide sequences were searched for using translated BLAST in the whole-genome shotgun contigs (wgs) and transcriptome shotgun assembly (TSA) databases. For nucleotide sequences, InterPro Scan was used to identify lipoxygenase domains and translate sequences. Curated protein sequences were then aligned to the lipoxygenase hidden Markov model, PF00305, obtained from InterPro. For alignment, an E-value threshold of 1E-5 was used to construct a maximum likelihood tree via RAxML. Tree visualization was performed in iTOL.
Supplementary Materials
The following supporting information can be downloaded at the website of this paper posted on Preprints.org, Figure S1: Fragmentation of 9-hydroxy-tetradeca-10-enoic acid, Figure S2: Fragmentation of 9-hydroxy-tetradeca-10-enoic acid, Figure S3: Fragmentation of 9-hydroxy-pentadeca-10-enoic acid, Figure S4: Fragmentation of 9-hydroxy-hexadecatetraenoic acid, Figure S5: Fragmentation of 9-hydroxy-octadecadienoic acid, Figure S6: Fragmentation of 11,12-epoxy-eicosatetraenoic acid, Figure S7: Fragmentation of 6-ketoprostaglandin E1, Figure S8: Fragmentation of 9-epoxy-hexadecatrienoic acid, Figure S9: Fragmentation of 6-oxo-hexadecaenoic acid, Figure S10: Fragmentation of 15-deoxyprostaglandin D2, Figure S11: Fragmentation of 15-hydroperoxy-eicosapentaenoic acid, Figure S12: Fragmentation of 5-hydroperoxy-eicosapentaenoic acid, Figure S13: Fragmentation of 5-hydroxy-eicosapentaenoic acid, Figure S14: Fragmentation of Hexadecatrienoic acid. Figure S15: Fragmentation of Stearic acid. Figure S16: Fragmentation of Eicosapentaenoic acid. Figure S17: Comparison between PCA and PLSDA, Figure S18: Features with the highest PCA loadings, Figure S19: Cell normalized and log transformed peak area for each feature, Figure S20: Boxplots of oxylipin peak areas by carbon chain length, Figure S21: Degree of oxidation for oxylipins, Figure S22: Boxplots of oxylipin peak areas by degree of oxidation, Figure S23: Degree of saturation for oxylipins and fatty acids, Figure S24: Boxplots of oxylipin peak areas by degree of saturation, Figure S25: Boxplots of fatty acid peak areas by carbon chain length, Figure S26: Boxplots of fatty acid peak areas by degree of saturation, Figure S27: Linoleic acid oxylipin standard curves, Table S1: MS2 Confirmed compounds, Table S2: Significant compounds from ANOVA, Table S3: Growth rates for diatom species and culture condition.
Author Contributions
Conceptualization, B.R.E. and M.D.J.; Methodology, I.U., J.H., M.D.J., B.R.E.; Resources, B.R.E. and M.D.J.; Data curation, I.U.; Visualization, I.U.; Writing – draft preparation, I.U; Writing – review and editing, J.H., M.D.J., B.R.E.; All authors have agreed to the published version of the manuscript.
Funding
Research was funded by the NSF grant OCE-2231921, McMinn Endowment, McCone Block Grant, and the Society of Hellman Fellows.
Data Availability Statement
Files from lipidomic analysis are deposited into the MassIVE repository. https://doi.org/doi:10.25345/C54X54W08.
Conflicts of Interest
Authors declare no conflicts of interest.:
Abbreviations
The following abbreviations are used in this manuscript:
| Si-limitation | Silicon limitation |
| POM | Particulate organic matter |
| DOM | Dissolved organic matter |
| TEP | Transparent exopolymer particles |
| PUA | Polyunsaturated aldehyde |
| LOFA | Linear oxygenated fatty acid |
| SPOT | San Pedro Ocean Time series |
| 6-oxoHME | 6-oxo-hexadecaenoic acid |
| 9-EpHTrE | 9-epoxy-hexadecatrienoic acid |
| 9-HHTE | 9-hydroxy-hexadecatetraenoic acid |
| 9-HODE | 9-hydroxy-octadecadienoic acid |
| 5-HpEPE | 5-hydroperoxy-eicosapentaenoic acid |
| 15-HpEPE | 15-hydroperoxy-eicosapentaenoic acid |
| 5-HEPE | 5-hydroxy-eicosapentaenoic acid |
| 11,12-EpETE | 11,12-epoxy-eicosatetraenoic acid |
| 15-HpETE | 15-hydroperoxy-eiocsatetraenoic acid |
| 6-keto-PGE1 | 6-ketoprostaglandin E1 |
| 15-deoxy-PGD2 | 15-deoxyprostaglandin D2 |
| HTrA | Hexadecatrienoic acid |
| EPA | Eicosapentaenoic acid |
| PLSDA | Partial Least Squares Discriminant Analysis |
| PCA | Principal Component Analysis |
| FFA | Free fatty acid |
| ANOVA | Analysis of variance |
| PUFA | Polyunsaturated fatty acids |
References
- Field, C. B.; Behrenfeld, M. J.; Randerson, J. T.; Falkowski, P. Primary Production of the Biosphere: Integrating Terrestrial and Oceanic Components. Science 1998, 281, 237–240. [Google Scholar] [CrossRef]
- Falkowski, P. G.; Barber, R. T.; Smetacek, V. Biogeochemical Controls and Feedbacks on Ocean Primary Production. Science 1998, 281, 200–206. [Google Scholar] [CrossRef]
- Tréguer, P.; Bowler, C.; Moriceau, B.; Dutkiewicz, S.; Gehlen, M.; Aumont, O.; Bittner, L.; Dugdale, R.; Finkel, Z.; Iudicone, D.; Jahn, O.; Guidi, L.; Lasbleiz, M.; Leblanc, K.; Levy, M.; Pondaven, P. Influence of Diatom Diversity on the Ocean Biological Carbon Pump. Nat. Geosci. 2018, 11, 27–37. [Google Scholar] [CrossRef]
- Jin, X.; Gruber, N.; Dunne, J. P.; Sarmiento, J. L.; Armstrong, R. A. Diagnosing the Contribution of Phytoplankton Functional Groups to the Production and Export of Particulate Organic Carbon, CaCO3, and Opal from Global Nutrient and Alkalinity Distributions. Glob. Biogeochem. Cycles 2006, 20. [Google Scholar] [CrossRef]
- Engel, A.; Goldthwait, S.; Passow, U.; Alldredge, A. Temporal Decoupling of Carbon and Nitrogen Dynamics in a Mesocosm Diatom Bloom. Limnol. Oceanogr. 2002, 47, 753–761. [Google Scholar] [CrossRef]
- Thornton, D. C. O. Dissolved Organic Matter (DOM) Release by Phytoplankton in the Contemporary and Future Ocean. Eur. J. Phycol. 2014, 49, 20–46. [Google Scholar] [CrossRef]
- Deng, Y.; Vallet, M.; Pohnert, G. Temporal and Spatial Signaling Mediating the Balance of the Plankton Microbiome. Annu. Rev. Mar. Sci. 2022, 14, 239–260. [Google Scholar] [CrossRef]
- Ribalet, F.; Berges, J. A.; Ianora, A.; Casotti, R. Growth Inhibition of Cultured Marine Phytoplankton by Toxic Algal-Derived Polyunsaturated Aldehydes. Aquat. Toxicol. 2007, 85, 219–227. [Google Scholar] [CrossRef]
- Miralto, A.; Barone, G.; Romano, G.; Poulet, S. A.; Ianora, A.; Russo, G. L.; Buttino, I.; Mazzarella, G.; Laabir, M.; Cabrini, M.; Giacobbe, M. G. The Insidious Effect of Diatoms on Copepod Reproduction. Nature 1999, 402, 173–176. [Google Scholar] [CrossRef]
- Johnson, M. D.; Edwards, B. R.; Beaudoin, D. J.; Van Mooy, B. A. S.; Vardi, A. Nitric Oxide Mediates Oxylipin Production and Grazing Defense in Diatoms. Environ. Microbiol. 2020, 22, 629–645. [Google Scholar] [CrossRef] [PubMed]
- Ianora, A.; Miralto, A.; Poulet, S. A.; Carotenuto, Y.; Buttino, I.; Romano, G.; Casotti, R.; Pohnert, G.; Wichard, T.; Colucci-D’Amato, L.; Terrazzano, G.; Smetacek, V. Aldehyde Suppression of Copepod Recruitment in Blooms of a Ubiquitous Planktonic Diatom. Nature 2004, 429, 403–407. [Google Scholar] [CrossRef]
- Ribalet, F.; Intertaglia, L.; Lebaron, P.; Casotti, R. Differential Effect of Three Polyunsaturated Aldehydes on Marine Bacterial Isolates. Aquat. Toxicol. 2008, 86, 249–255. [Google Scholar] [CrossRef]
- Edwards, B. R.; Bidle, K. D.; Van Mooy, B. A. S. Dose-Dependent Regulation of Microbial Activity on Sinking Particles by Polyunsaturated Aldehydes: Implications for the Carbon Cycle. Proc. Natl. Acad. Sci. 2015, 112, 5909–5914. [Google Scholar] [CrossRef]
- Meyer, N.; Rettner, J.; Werner, M.; Werz, O.; Pohnert, G. Algal Oxylipins Mediate the Resistance of Diatoms against Algicidal Bacteria. Mar. Drugs 2018, 16. [Google Scholar] [CrossRef]
- Vardi, A.; Formiggini, F.; Casotti, R.; Martino, A. D.; Ribalet, F.; Miralto, A.; Bowler, C. A Stress Surveillance System Based on Calcium and Nitric Oxide in Marine Diatoms. PLOS Biol. 2006, 4. [Google Scholar] [CrossRef] [PubMed]
- Edwards, B. R.; Thamatrakoln, K.; Fredricks, H. F.; Bidle, K. D.; Van Mooy, B. A. S. Viral Infection Leads to a Unique Suite of Allelopathic Chemical Signals in Three Diatom Host–Virus Pairs. Mar. Drugs 2024, 22. [Google Scholar] [CrossRef] [PubMed]
- Casotti, R.; Mazza, S.; Brunet, C.; Vantrepotte, V.; Ianora, A.; Miralto, A. Growth Inhibition and Toxicity of the Diatom Aldehyde 2-Trans, 4-Trans-Decadienal on Thalassiosira Weissflogii (Bacillariophyceae). J. Phycol. 2005, 41, 7–20. [Google Scholar] [CrossRef]
- Franzè, G.; Pierson, J. J.; Stoecker, D. K.; Lavrentyev, P. J. Diatom-Produced Allelochemicals Trigger Trophic Cascades in the Planktonic Food Web. Limnol. Oceanogr. 2018, 63, 1093–1108. [Google Scholar] [CrossRef]
- Pohnert, G. Wound-Activated Chemical Defense in Unicellular Planktonic Algae. Angew. Chem. Int. Ed. 2000, 39, 4352–4354. [Google Scholar] [CrossRef]
- Ribalet, F.; Wichard, T.; Pohnert, G.; Ianora, A.; Miralto, A.; Casotti, R. Age and Nutrient Limitation Enhance Polyunsaturated Aldehyde Production in Marine Diatoms. Phytochemistry 2007, 68, 2059–2067. [Google Scholar] [CrossRef]
- Vidoudez, C.; Pohnert, G. Growth Phase-Specific Release of Polyunsaturated Aldehydes by the Diatom Skeletonema Marinoi. J. Plankton Res. 2008, 30, 1305–1313. [Google Scholar] [CrossRef]
- Lauritano, C.; Romano, G.; Roncalli, V.; Amoresano, A.; Fontanarosa, C.; Bastianini, M.; Braga, F.; Carotenuto, Y.; Ianora, A. New Oxylipins Produced at the End of a Diatom Bloom and Their Effects on Copepod Reproductive Success and Gene Expression Levels. Harmful Algae 2016, 55, 221–229. [Google Scholar] [CrossRef]
- Wu, Z.; Li, Q. P.; Rivkin, R. B.; Lin, S. Role of Diatom-Derived Oxylipins in Organic Phosphorus Recycling during Coastal Diatom Blooms in the Northern South China Sea. Sci. Total Environ. 2023, 903, 166518. [Google Scholar] [CrossRef]
- Rettner, J.; Werner, M.; Meyer, N.; Werz, O.; Pohnert, G. Survey of the C20 and C22 Oxylipin Family in Marine Diatoms. Tetrahedron Lett. 2018, 59, 828–831. [Google Scholar] [CrossRef]
- Russo, E.; d’Ippolito, G.; Fontana, A.; Sarno, D.; D’Alelio, D.; Busseni, G.; Ianora, A.; von Elert, E.; Carotenuto, Y. Density-Dependent Oxylipin Production in Natural Diatom Communities: Possible Implications for Plankton Dynamics. ISME J. 2020, 14, 164–177. [Google Scholar] [CrossRef]
- Ianora, A.; Bastianini, M.; Carotenuto, Y.; Casotti, R.; Roncalli, V.; Miralto, A.; Romano, G.; Gerecht, A.; Fontana, A.; Turner, J. T. Non-Volatile Oxylipins Can Render Some Diatom Blooms More Toxic for Copepod Reproduction. Harmful Algae 2015, 44, 1–7. [Google Scholar] [CrossRef]
- Barreiro, A.; Carotenuto, Y.; Lamari, N.; Esposito, F.; D’Ippolito, G.; Fontana, A.; Romano, G.; Ianora, A.; Miralto, A.; Guisande, C. Diatom Induction of Reproductive Failure in Copepods: The Effect of PUAs versus Non Volatile Oxylipins. J. Exp. Mar. Biol. Ecol. 2011, 401, 13–19. [Google Scholar] [CrossRef]
- Conley, D. J.; Kilham, S. S.; Theriot, E. Differences in Silica Content between Marine and Freshwater Diatoms. Limnol. Oceanogr. 1989, 34, 205–212. [Google Scholar] [CrossRef]
- Harrison, P. J.; Conway, H. L.; Holmes, R. W.; Davis, C. O. Marine Diatoms Grown in Chemostats under Silicate or Ammonium Limitation. III. Cellular Chemical Composition and Morphology of Chaetoceros Debilis, Skeletonema Costatum, and Thalassiosira Gravida. Mar. Biol. 1977, 43, 19–31. [Google Scholar] [CrossRef]
- Kooistra, W. H. C. F.; Sarno, D.; Balzano, S.; Gu, H.; Andersen, R. A.; Zingone, A. Global Diversity and Biogeography of Skeletonema Species (Bacillariophyta). Protist 2008, 159, 177–193. [Google Scholar] [CrossRef] [PubMed]
- Sarno, D.; Kooistra, W. H. C. F.; Medlin, L. K.; Percopo, I.; Zingone, A. Diversity in the Genus Skeletonema (Bacillariophyceae). Ii. an Assessment of the Taxonomy of S. Costatum-Like Species with the Description of Four New Species. J. Phycol. 2005, 41, 151–176. [Google Scholar] [CrossRef]
- Shevchenko, O. G.; Ponomareva, A. A.; Turanov, S. V.; Dutova, D. I. Morphological and Genetic Variability of Skeletonema Dohrnii and Skeletonema Japonicum (Bacillariophyta) from the Northwestern Sea of Japan. Phycologia 2019, 58, 95–107. [Google Scholar] [CrossRef]
- Y, P.; Dv, S. R.; Kh, M.; Rg, B.; R, P. Effects of Silicate Limitation on Production of Domoic Acid, a Neurotoxin, by the Diatom Pseudo-Nitzschia Multiseries. I. Batch Culture Studies. Mar. Ecol. Prog. Ser. 1996, 131, 225–233. [Google Scholar] [CrossRef]
- Marchetti, A.; Harrison, P. J. Coupled Changes in the Cell Morphology and Elemental (C, N, and Si) Composition of the Pennate Diatom Pseudo-Nitzschia Due to Iron Deficiency. Limnol. Oceanogr. 2007, 52, 2270–2284. [Google Scholar] [CrossRef]
- Pan, Y.; Subba Rao, D. V.; Mann, K. H. Changes in Domoic Acid Production and Cellular Chemical Composition of the Toxigenic Diatom Pseudo-Nitzschia Multiseries Under Phosphate Limitation. J. Phycol. 1996, 32, 371–381. [Google Scholar] [CrossRef]
- Trainer, V. L.; Bates, S. S.; Lundholm, N.; Thessen, A. E.; Cochlan, W. P.; Adams, N. G.; Trick, C. G. Pseudo-Nitzschia Physiological Ecology, Phylogeny, Toxicity, Monitoring and Impacts on Ecosystem Health. Harmful Algae 2012, 14, 271–300. [Google Scholar] [CrossRef]
- Zhang, S.; Zheng, T.; Lundholm, N.; Huang, X.; Jiang, X.; Li, A.; Li, Y. Chemical and Morphological Defenses of Pseudo-Nitzschia Multiseries in Response to Zooplankton Grazing. Harmful Algae 2021, 104, 102033. [Google Scholar] [CrossRef]
- Stern, R.; Moore, S. K.; Trainer, V. L.; Bill, B. D.; Fischer, A.; Batten, S. Spatial and Temporal Patterns of Pseudo-Nitzschia Genetic Diversity in the North Pacific Ocean from the Continuous Plankton Recorder Survey. Mar. Ecol. Prog. Ser. 2018, 606, 7–28. [Google Scholar] [CrossRef]
- Brzezinski, M. A. THE Si:C:N RATIO OF MARINE DIATOMS: INTERSPECIFIC VARIABILITY AND THE EFFECT OF SOME ENVIRONMENTAL VARIABLES. J. Phycol. 1985, 21, 347–357. [Google Scholar] [CrossRef]
- Shen, Z.; Wu, Y.; Liu, Q.; Yao, Y. Nutrient Compositions of Cultured Thalassiosira Rotula and Skeletonema Costatum from Jiaozhou Bay. In Studies of the Biogeochemistry of Typical Estuaries and Bay. In Studies of the Biogeochemistry of Typical Estuaries and Bays in China; Shen, Z., Ed.; Springer: Berlin, Heidelberg, 2020. [Google Scholar] [CrossRef]
- Whittaker, K. A.; Rignanese, D. R.; Olson, R. J.; Rynearson, T. A. Molecular Subdivision of the Marine Diatom Thalassiosira Rotulain Relation to Geographic Distribution, Genome Size, and Physiology. BMC Evol. Biol. 2012, 12. [Google Scholar] [CrossRef]
- Tran, Q. D.; Neu, T. R.; Sultana, S.; Giebel, H.-A.; Simon, M.; Billerbeck, S. Distinct Glycoconjugate Cell Surface Structures Make the Pelagic Diatom Thalassiosira Rotula an Attractive Habitat for Bacteria. J. Phycol. 2023, 59, 309–322. [Google Scholar] [CrossRef]
- De Luca, D.; Kooistra, W. H. C. F.; Sarno, D.; Gaonkar, C. C.; Piredda, R. Global Distribution and Diversity of Chaetoceros (Bacillariophyta, Mediophyceae): Integration of Classical and Novel Strategies. PeerJ 2019, 7, e7410. [Google Scholar] [CrossRef]
- D’Ippolito, G.; Lamari, N.; Montresor, M.; Romano, G.; Cutignano, A.; Gerecht, A.; Cimino, G.; Fontana, A. 15S-Lipoxygenase Metabolism in the Marine Diatom Pseudo-Nitzschia Delicatissima. New Phytol. 2009, 183, 1064–1071. [Google Scholar] [CrossRef]
- Jónasdóttir, S. H. Fatty Acid Profiles and Production in Marine Phytoplankton. Mar. Drugs 2019, 17. [Google Scholar] [CrossRef]
- Martínez, E.; Cosnahan, R. K.; Wu, M.; Gadila, S. K.; Quick, E. B.; Mobley, J. A.; Campos-Gómez, J. Oxylipins Mediate Cell-to-Cell Communication in Pseudomonas Aeruginosa. Commun. Biol. 2019, 2. [Google Scholar] [CrossRef]
- Gao, J.; Liu, H.; Zhang, Z.; Liang, Z. Quorum Sensing-Mediated Lipid Oxidation Further Regulating the Environmental Adaptability of Aspergillus Ochraceus. Metabolites 2023, 13. [Google Scholar] [CrossRef] [PubMed]
- Sabatino, V.; Orefice, I.; Marotta, P.; Ambrosino, L.; Chiusano, M. L.; d’Ippolito, G.; Romano, G.; Fontana, A.; Ferrante, M. I. Silencing of a Pseudo-Nitzschia Arenysensis Lipoxygenase Transcript Leads to Reduced Oxylipin Production and Impaired Growth. New Phytol. 2022, 233, 809–822. [Google Scholar] [CrossRef] [PubMed]
- Amin, S. A.; Parker, M. S.; Armbrust, E. V. Interactions between Diatoms and Bacteria. Microbiol. Mol. Biol. Rev. 2012, 76, 667–684. [Google Scholar] [CrossRef]
- Ribalet, F.; Vidoudez, C.; Cassin, D.; Pohnert, G.; Ianora, A.; Miralto, A.; Casotti, R. High Plasticity in the Production of Diatom-Derived Polyunsaturated Aldehydes under Nutrient Limitation: Physiological and Ecological Implications. Protist 2009, 160, 444–451. [Google Scholar] [CrossRef] [PubMed]
- Ruocco, N.; Albarano, L.; Esposito, R.; Zupo, V.; Costantini, M.; Ianora, A. Multiple Roles of Diatom-Derived Oxylipins within Marine Environments and Their Potential Biotechnological Applications. Mar. Drugs 2020, 18. [Google Scholar] [CrossRef] [PubMed]
- Bhatta, H.; Kong, T. K.; Rosengarten, G. Diffusion through Diatom Nanopores. J. Nano Res. 2009, 7, 69–74. [Google Scholar] [CrossRef]
- Deng, Y.; Yu, R.; Grabe, V.; Sommermann, T.; Werner, M.; Vallet, M.; Zerfaß, C.; Werz, O.; Pohnert, G. Bacteria Modulate Microalgal Aging Physiology through the Induction of Extracellular Vesicle Production to Remove Harmful Metabolites. Nat. Microbiol. 2024, 9, 2356–2368. [Google Scholar] [CrossRef] [PubMed]
- Ivanov, I.; Heydeck, D.; Hofheinz, K.; Roffeis, J.; O’Donnell, V. B.; Kuhn, H.; Walther, M. Molecular Enzymology of Lipoxygenases. Arch. Biochem. Biophys. 2010, 503, 161–174. [Google Scholar] [CrossRef] [PubMed]
- Newcomer, M. E.; Brash, A. R. The Structural Basis for Specificity in Lipoxygenase Catalysis. Protein Sci. 2015, 24, 298–309. [Google Scholar] [CrossRef] [PubMed]
- d’Ippolito, G.; Nuzzo, G.; Sardo, A.; Manzo, E.; Gallo, C.; Fontana, A. Chapter Four - Lipoxygenases and Lipoxygenase Products in Marine Diatoms. In Methods in Enzymology; Moore, B. S., Ed.; Marine Enzymes and Specialized Metabolism - Part B; Academic Press, 2018; Vol. 605, pp 69–100. [CrossRef]
- Wichard, T.; Poulet, S. A.; Halsband-Lenk, C.; Albaina, A.; Harris, R.; Liu, D.; Pohnert, G. Survey of the Chemical Defence Potential of Diatoms: Screening of Fifty Species for α,β,γ,δ-Unsaturated Aldehydes. J. Chem. Ecol. 2005, 31, 949–958. [Google Scholar] [CrossRef]
- Lamari, N.; Ruggiero, M. V.; d’Ippolito, G.; Kooistra, W. H. C. F.; Fontana, A.; Montresor, M. Specificity of Lipoxygenase Pathways Supports Species Delineation in the Marine Diatom Genus Pseudo-Nitzschia. PLOS ONE 2013, 8. [Google Scholar] [CrossRef]
- Gerecht, A.; Romano, G.; Ianora, A.; d’Ippolito, G.; Cutignano, A.; Fontana, A. Plasticity of Oxylipin Metabolism Among Clones of the Marine Diatom Skeletonema Marinoi (Bacillariophyceae). J. Phycol. 2011, 47, 1050–1056. [Google Scholar] [CrossRef]
- Giordano, D.; Bonora, S.; D’Orsi, I.; D’Alelio, D.; Facchiano, A. Structural and Functional Characterization of Lipoxygenases from Diatoms by Bioinformatics and Modelling Studies. Biomolecules 2024, 14. [Google Scholar] [CrossRef]
- Shibl, A. A.; Isaac, A.; Ochsenkühn, M. A.; Cárdenas, A.; Fei, C.; Behringer, G.; Arnoux, M.; Drou, N.; Santos, M. P.; Gunsalus, K. C.; Voolstra, C. R.; Amin, S. A. Diatom Modulation of Select Bacteria through Use of Two Unique Secondary Metabolites. Proc. Natl. Acad. Sci. 2020, 117, 27445–27455. [Google Scholar] [CrossRef]
- d’Ippolito, G.; Cutignano, A.; Briante, R.; Febbraio, F.; Cimino, G.; Fontana, A. New C16 Fatty-Acid-Based Oxylipin Pathway in the Marine Diatom Thalassiosira Rotula. Org. Biomol. Chem. 2005, 3, 4065–4070. [Google Scholar] [CrossRef]
- Barofsky, A.; Pohnert, G. Biosynthesis of Polyunsaturated Short Chain Aldehydes in the Diatom Thalassiosira Rotula. Org. Lett. 2007, 9, 1017–1020. [Google Scholar] [CrossRef]
- Krause, J. W.; Schulz, I. K.; Rowe, K. A.; Dobbins, W.; Winding, M. H. S.; Sejr, M. K.; Duarte, C. M.; Agustí, S. Silicic Acid Limitation Drives Bloom Termination and Potential Carbon Sequestration in an Arctic Bloom. Sci. Rep. 2019, 9. [Google Scholar] [CrossRef]
- Wear, E. K.; Carlson, C. A.; Windecker, L. A.; Brzezinski, M. A. Roles of Diatom Nutrient Stress and Species Identity in Determining the Short- and Long-Term Bioavailability of Diatom Exudates to Bacterioplankton. Mar. Chem. 2015, 177, 335–348. [Google Scholar] [CrossRef]
- Lavrentyev, P. J.; Franzè, G.; Pierson, J. J.; Stoecker, D. K. The Effect of Dissolved Polyunsaturated Aldehydes on Microzooplankton Growth Rates in the Chesapeake Bay and Atlantic Coastal Waters. Mar. Drugs 2015, 13, 2834–2856. [Google Scholar] [CrossRef] [PubMed]
- Bienfang, P. K.; Harrison, P. J.; Quarmby, L. M. Sinking Rate Response to Depletion of Nitrate, Phosphate and Silicate in Four Marine Diatoms. Mar. Biol. 1982, 67, 295–302. [Google Scholar] [CrossRef]
- Bartual, A.; Vicente-Cera, I.; Flecha, S.; Prieto, L. Effect of Dissolved Polyunsaturated Aldehydes on the Size Distribution of Transparent Exopolymeric Particles in an Experimental Diatom Bloom. Mar. Biol. 2017, 164. [Google Scholar] [CrossRef]
- Edwards, B.; Thamatrakoln, K.; Kranzler, C. F.; Ossolinski, J.; Fredricks, H.; Johnson, M. D.; Krause, J. W.; Bidle, K. D.; Mooy, B. A. S. V. Viral Infection Induces Oxylipin Chemical Signaling at the End of a Summer Upwelling Bloom: Implications for Carbon Cycling. bioRxiv , 2025, p 2025.05.18.654734. 28 June. [CrossRef]
- Balestra, C.; Alonso-Sáez, L.; Gasol, J. M.; Casotti <br />, R.; Casotti , R. Group-Specific Effects on Coastal Bacterioplankton of Polyunsaturated Aldehydes Produced by Diatoms. Aquat. Microb. Ecol. 2011, 63, 123–131. [Google Scholar] [CrossRef]
- Adusumilli, R.; Mallick, P. Data Conversion with ProteoWizard msConvert. In Proteomics: Methods and Protocols; Comai, L., Katz, J. E., Mallick, P., Eds.; Springer: New York, NY, 2017. [Google Scholar] [CrossRef]
- Collins, J. R.; Edwards, B. R.; Fredricks, H. F.; Van Mooy, B. A. S. LOBSTAHS: An Adduct-Based Lipidomics Strategy for Discovery and Identification of Oxidative Stress Biomarkers. Anal. Chem. 2016, 88, 7154–7162. [Google Scholar] [CrossRef]
- Smith, C. A.; Want, E. J.; O’Maille, G.; Abagyan, R.; Siuzdak, G. XCMS: Processing Mass Spectrometry Data for Metabolite Profiling Using Nonlinear Peak Alignment, Matching, and Identification. Anal. Chem. 2006, 78, 779–787. [Google Scholar] [CrossRef]
- Kuhl, C.; Tautenhahn, R.; Böttcher, C.; Larson, T. R.; Neumann, S. CAMERA: An Integrated Strategy for Compound Spectra Extraction and Annotation of Liquid Chromatography/Mass Spectrometry Data Sets. Anal. Chem. 2012, 84, 283–289. [Google Scholar] [CrossRef]
- Seitzer, P.; Bennett, B.; Melamud, E. MAVEN2: An Updated Open-Source Mass Spectrometry Exploration Platform. Metabolites 2022, 12. [Google Scholar] [CrossRef] [PubMed]
- Tsugawa, H.; Cajka, T.; Kind, T.; Ma, Y.; Higgins, B.; Ikeda, K.; Kanazawa, M.; VanderGheynst, J.; Fiehn, O.; Arita, M. MS-DIAL: Data-Independent MS/MS Deconvolution for Comprehensive Metabolome Analysis. Nat. Methods 2015, 12, 523–526. [Google Scholar] [CrossRef] [PubMed]
- Pang, Z.; Zhou, G.; Ewald, J.; Chang, L.; Hacariz, O.; Basu, N.; Xia, J. Using MetaboAnalyst 5.0 for LC–HRMS Spectra Processing, Multi-Omics Integration and Covariate Adjustment of Global Metabolomics Data. Nat. Protoc. 2022, 17, 1735–1761. [Google Scholar] [CrossRef] [PubMed]
Disclaimer/Publisher’s Note: The statements, opinions and data contained in all publications are solely those of the individual author(s) and contributor(s) and not of MDPI and/or the editor(s). MDPI and/or the editor(s) disclaim responsibility for any injury to people or property resulting from any ideas, methods, instructions or products referred to in the content. |
© 2025 by the authors. Licensee MDPI, Basel, Switzerland. This article is an open access article distributed under the terms and conditions of the Creative Commons Attribution (CC BY) license (http://creativecommons.org/licenses/by/4.0/).
Copyright: This open access article is published under a Creative Commons CC BY 4.0 license, which permit the free download, distribution, and reuse, provided that the author and preprint are cited in any reuse.


