Submitted:
30 September 2025
Posted:
01 October 2025
You are already at the latest version
Abstract
The studies of hexavalent or trivalent chromium coatings via vibrational spectroscopy have been revised. The coatings can be formed via a conversion bath or electrodeposition from aqueous solutions. Most of these studies are related to the process of forming hexavalent chromium conversion coatings. In this case, there is a profound understanding of the system when vibrational spectroscopy is used in combination with other techniques; for example, synchrotron infrared microspectroscopy confirmed that ferricyanide is a mediator that oxidizes aluminum in the acceleration mechanism for coating formation. When pitting corrosion occurs, the zones with high Cr(VI) contents migrate to repair the coating in other zones. However, the toxicity of hexavalent chromium species has restricted their use in surface finishing, and they have slowly been replaced by trivalent chromium species. Vibrational spectroscopy revealed the formation mechanism of trivalent chromium conversion on an aluminum alloy. The undesired presence of Cr(VI) in these coatings is promoted by the presence of hydrogen peroxide in the bath. Raman spectroscopy combined with X-ray photoelectron spectroscopy (XPS) was used to determine the mechanisms of the inhibition of the formation of hexavalent chromium species. Despite the plethora of work on hexavalent or trivalent chromium electrodeposition in aqueous baths, vibrational spectroscopy has rarely been used to answer several questions about the process. Nonetheless, vibrational spectroscopy was able to identify the bonds Cr-O in the outer layer of a coating and the Cr-O-C bonds in the inner layer. Vibrational spectroscopy can differentiate between Cr(VI) and Cr(III) species.
Keywords:
electrodeposition
; conversion coating
; hexavalent chromium
; trivalent chromium
; Raman spectroscopy
; infrared spectroscopy
; vibrational spectroscopy
in the outer layer of a coating and the bonds in the inner layer. Vibrational spectroscopy can differentiate between Cr(VI) and Cr(III) species.
1. Introduction
In the nineteenth century, three patents were filed on trivalent chrome baths; however, the massive use of chrome coatings emerged in the 1930s. During these historical time periods, the quality of the coatings obtained from Cr(III) baths was lower than that of the Cr(VI) coatings [1]. Therefore, industrial production during the 20th century was based on Cr(VI) baths, but at the beginning of the 21st century, interest in Cr(III) baths resumed on the basis of its lower toxicity. Currently, there is a systematic abandonment of Cr(VI) baths in favor of Cr(III) baths, but the success of these new coatings depends on understanding precisely the underlying mechanisms of protection offered by hexavalent chromium. Consequently, studies involving vibrational spectroscopy of hexavalent baths have also been revised.
The coatings can be formed by electrodeposition of a chromium plating bath with trivalent chromium or by conversion coatings, which are formed through a chemical reaction between a metal substrate and a solution containing trivalent chromium. Studies of the electrodeposition of chrome from Cr(VI) baths were reviewed by Dubpernell [1] and Mandich et al. [2], and studies of chromate(VI) conversion coatings were reviewed by Prakash and Balaraju [3]. The processes involving Cr(VI) provide excellent corrosion protection but have the disadvantage that Cr(VI) is highly toxic. Studies of the electrodeposition of coatings from Cr(III) baths have been reviewed by several authors [4,5,6]. Hesamedini [7] reviewed 105 studies of Cr(III)-based conversion coatings and analyzed how the studies answered fundamental questions.
In the aerospace industry, chromate conversion coatings have been used because of their outstanding performance in the corrosion protection of aluminum alloys. Becker [8] presented a comprehensive overview of new promising technologies in terms of corrosion inhibition. In the case of chromate coatings, the formation of Cr(VI) from Cr(III) is an intense drawback, and future research should focus on eliminating Cr(VI) formation. On the other hand, chromium plating comprises 2 categories according to the thickness of the Cr layer: 1) a decorative coating with a thickness of less than 0.8 μm, which provides acceptable resistance to corrosion, and 2) a functional coating with a thickness greater than 0.8 μm, which provides hardness and high corrosion resistance [2].
There are more publications based on vibrational spectroscopies for the characterization of coating surfaces [9,10,11,12,13,14,15,16,17,18,19,20,21,22,23,24,25,26,27,28,29,30,31,32,33,34,35,36,37,38,39,40,41,42,43,44,45,46,47,48,49,50,51], and few studies have focused on plating baths [52,53,54,55,56,57,58,59,60,61,62,63,64,65,66], which implies a lack of use of vibrational spectroscopies to determine the species in solution. On the other hand, UV‒visible spectroscopy is routinely used in Cr(III) bath studies; however, this technique has not allowed us to understand the mechanisms of coating formation, and our proposal is that it must be complemented with vibrational spectroscopies. Therefore, our objective is to summarize the contributions of vibrational spectroscopy to the study of chromium coatings and to demonstrate that these techniques are fundamental to understanding the electrodeposition process.
Vibrational spectroscopy studies can focus on several aspects: i) determining the influence of surface species on the tribological, visual or other properties (section 2); 2) identifying corrosion products on the surface (section 2); and 3) determining the species in the solution and electrolyte/electrode interface to understand the mechanisms of formation of the coating (section 3). The aspects i) and ii) are presented in the majority of studies, whereas the aspect iii) is addressed in a few studies.
2. Vibrational Spectroscopy to Elucidate the Structures of the Coatings
2.1. Studies of Hexavalent Chromium Conversion Coatings
Between 1920 and 1985, the unfortunate results of trivalent chrome baths favored the entry of hexavalent chrome baths [1]. Hexavalent baths have few requirements and extensive lifetimes, which makes it difficult to replace them with trivalent baths, which require many conservation operations. This explains why chromate conversion Cr(VI) baths were first studied, and these coatings were prepared from commercially named Alodine baths.
This chemical treatment of surfaces involves immersing the metal piece in a solution containing chromic acid and potassium hexacyanoferrate, which reacts with the metal surface to form a thin film. The coatings have the objective of creating a layer that is highly resistant to corrosion, which is why studies have focused on determining the species on the surface and the evolution of the passive layer immersed in corrosion media.
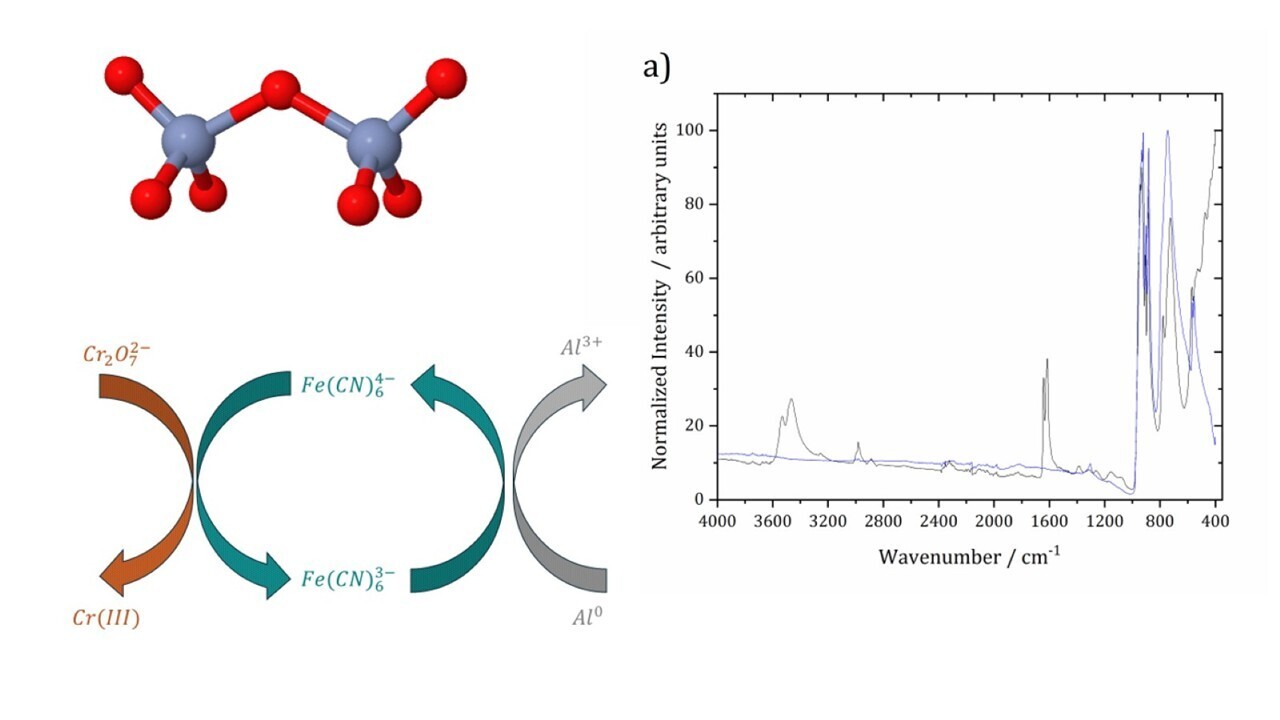
Ahern et al. [9] compared the sensitivity of 3 Fourier transform infrared spectroscopy (FTIR) techniques to characterize chromium-phosphate conversion coatings on aluminum: 1) attenuated total reflectance (ATR), 2) diffuse reflectance infrared spectroscopy (DRIFTS), and 3) reflection absorption infrared spectroscopy (RAIRS). This study and other studies [10,11] revealed that these techniques have very low sensitivity to chrome species. Nonetheless, IR specular reflectance detected the presence of deposited in the stainless steel [12]. The bands observed via infrared spectroscopy in several studies [11,12,13,14,15,16,20,26,27] are listed in Table 1. In the IR spectra, there is a band of C-N, and the bands of water are related to the hydration of the films. In addition, the wavenumbers of the aluminum oxide bands were reported by Ahern [9] and Campestrini [16]. Chromating has also been applied to hot-dipped galvanized steels to improve the protective action of metallic zinc coatings. Petit [17] identified bands of zinc chromate at 960, 860, and 820 cm-1, which are similar to the bands of the anions . Chromium phosphate conversion coatings on aluminum were studied by Schram et al. [18]. In the RAIRS spectra, several bands of chromium phosphate were observed, and a band at 758 cm-1 was assigned to chromium oxide. The Raman spectra of this coating revealed that aluminum oxide was a minor component of the surface. The combination of vibrational and ellipsometry techniques results in a two-layer optical model in which the upper layer can be attributed to the chromium phosphate film. Schram and Terryn [19] selected the infrared spectroscopic ellipsometry (IRSE) technique to analyze chromium phosphate conversion films. This technique involves directing infrared light onto the sample surface at various angles of incidence and analyzing the reflected light. This technique allows for a comprehensive characterization of a film, which is essentially composed of chromium phosphate () with a lower concentration of aluminum oxide. The IRSE technique measures the thickness of the films, which varies from approximately 20 nm to a few micrometres. Chidambaram [20] analyzed aluminum alloys AA2024-T3 via two different FTIR techniques employing a synchrotron source: 1) grazing angle infrared spectroscopy (GAIRS) and 2) the RAIRS technique. This type of electromagnetic radiation is produced when charged particles accelerate to high speeds, and the radiation is in the range of far-infrared wavelengths [21]. The grazing incidence was highly sensitive, and the chromium on the surface was aligned perpendicular to the surface, whereas approximately half of the bonds of Cr(III) were oriented in that direction. The thickness of the coating (approximately 400 nm) was calculated via theoretical expressions. A new band of Cr(III) was observed at 606 cm-1 and was tentatively assigned to oxide . Vasquez et al. [22,23] analyzed coatings on the aluminum-copper alloy AA2024-T3 via synchrotron radiation. The synchrotron infrared microspectroscopy (SIRMS) measurements were performed on a small spot (less than 5 μm) in reflection mode. This technique was complemented by extended X-ray absorption fine structure (EXAFS) and X-ray absorption near edge structure (XANES) techniques. Infrared radiation was used to map the distribution of chromate oxides (820 cm-1) and cyano species (2100 cm-1) on the surface. Additionally, wavenumbers at approximately 3300 cm-1 were analyzed to determine the hydration state of the film. The coating formed on the AA2024-T3 alloy had a topographically heterogeneous composition and was formed by a mixed oxide. Moreover, a lower aluminum content in the film decreases the thickness of the coating. In addition, the surface was monitored for 24 h after deposition of the coating. A slight decrease in the Cr(VI)/Cr(III) ratio was observed in the mixed oxide, and there was no significant change in hydration. Vasquez and Halada [23] confirmed that ferricyanide is a mediator that oxidizes aluminum in the mechanism of coating formation (Figure 1). A thinner coating was formed, only when ferricyanide was absorbed by the Cu-enriched particles. When damage occurred in the coating, the Cr(VI) located on the thicker film mitigated corrosion [23]; that is, the Cr(VI) present on the coating provided a repair mechanism by migrating to active sites and Chidambaram [24] studied this process via SIRMS. The coating contains a Cr(VI)/Cr(III) mixed oxide, but several lateral and depth heterogeneities are associated with the microstructural features. Repassivation occurred when Cr(VI) ions slowly migrated from the protected surface to the scratch. In addition, a band corresponding to the Al(III)-Cr(VI) film (797 cm-1) appeared in the pits, and secondary ion mass spectra revealed an adjacent film of . These two-layer film processes are referred to as bipolar models of repassivation. The Al(III)–Cr(VI) complex formed within the scratch, predominantly along the edges, where the chromium concentration was relatively high [24].
Between 1998 and 2012, chromate(VI) conversion coatings were systematically studied via Raman spectroscopy [13,14,25,26,27]. These studies highlight the great potential of vibrational spectroscopy, since the mechanism of coating formation has been clarified [14,25]. Zhao et al. [26] reported the spectra of pure oxides , , and Cr(VI) coatings, and the Raman bands of the coatings were close to those of the pure elements but significantly broadened. The spectrum of the coating displayed a band at 852 cm-1 when the spatial resolution was 15 μm. In another series of experiments, the laser was focused across a light area of approximately 50 μm in diameter, and a mapping surface was obtained. After 48 h of exposure to 0.1 M NaCl, the pit corrosion zone had a diameter of approximately 100 μm, and the band corresponding to Cr(VI) was observed at 839 cm-1. The Raman spectra were plotted in a Cartesian coordinate system, where the x-axis represents the wavenumber, the y-axis represents the distance from a central point, and the z-axis represents the signal intensity [25]. This graph significantly assists in identifying the distributions on the surfaces of the different phases present. A protective film was detected, and a low concentration of Cr(VI) in the film or a lack of chromium did not ensure good corrosion protection. This study demonstrates how vibrational spectroscopy is very effective in determining the conditions under which a highly corrosion-resistant coating is formed. In these studies [13,26], mixed oxide Cr(VI)/Cr(III) bands were observed, and the wavenumbers are listed in Table 1. In the study of McGovern [25], the formation of chromium conversion coatings on aluminum alloys was monitored via a single band at 860 cm-1. Raman spectroscopy revealed that the reduction of Cr(VI) to Cr(III) during coating formation is dependent upon redox mediation by ferricyanide. Figure 1 shows a scheme of the mechanism proposed on the basis of Raman spectroscopy; Cr(VI) ions react with hexacyanoferrate(II) ions, forming Cr(III) and hexacyanoferrate(III) ions, which subsequently undergo redox mediation, and the latter reacts with aluminum metal to form a passive layer in aluminum [14,25]. Hurley [27] attributed a broad band between 535 and 665 cm-1 to a Cr(III) species with contributions from α-CrOOH.
2.2. Studies of Trivalent Chromium Conversion Coatings
Owing to the high toxicity of Cr(VI), it began to be replaced by the trivalent chrome process. Cr(III) coatings on aluminum alloys were studied from 2004-2023 via infrared [28,29] and Raman spectroscopy [29,30,31,32,33,34,35,36,37,38,39,40]. Table 2 lists the Raman bands observed in studies of chromate(III) conversion coatings.
Zhang [28] investigated the compositions of conversion coatings on electrogalvanized steel via FTIR and Auger electron spectroscopy. The Cr(III) coatings contained a mixture of zinc oxides and Cr(III) oxides. The main constituents of trivalent chrome conversion baths are Cr(III) and fluoro-zirconate salts [30,31,32,33,34,35,36,37,38,39,40], and no IR or Raman spectra of these solutions have been reported. On the other hand, the surfaces were well characterized via vibrational spectroscopy, and Table 2 lists the Cr(III) oxide and hydroxide bands observed in the studies [13,29,30,32,34,35,39,42,43,44]. The first Raman study of the trivalent coating process revealed a band at 547 cm-1 assigned to the oxide Cr(III) [29], but the band position shifted between 520–580 cm-1 depending on the state of hydration of the oxide [30]. Previous studies [29,30,31,32,33] revealed the formation mechanism of the coating on an Al alloy from a bath, which contains , and a Cr(III) sulfate salt.
In the first step, the anions assisted in the dissolution of the native oxide layer of , and simultaneously, the oxygen reduction reaction and hydrogen discharge accompanied the dissolution of the alloy. In the second step, as a consequence of these reactions, the interfacial pH increases, and and precipitate. The trivalent chromium conversion coating consists of two main layers [32]: 1) the outer layer of a mixture of aluminum hydroxide and oxide (438, 804 and 945 cm-1) [32,34,35], zirconium oxide (233 and 470 cm-1) [32], chromium hydroxide species and species [32]; 2) the inner layer has a high content of aluminum, with the presence of oxide and fluoride species. The products of reactions (1) and (2) form a two-layer coating, and the combination of Raman and X-ray photoelectron spectroscopy (XPS) allows a detailed description of the formation of these two-layers on an Al alloy [32] or an AZ91D magnesium alloy [39,40].
The main components of the coating were , , and . Although the bath solutions were composed only of Cr(III) ions, species on the surface were identified on the basis of the Raman spectra (Table 1), which implies that the coating contains mixed oxides of Cr(VI) and Cr(III) on the surface (Table 1) [25,26,29,30,31,32,33,34,35]. Munson et al. [34] evaluated 3 different baths and noted that the precipitates contained a mixture of (Table 2) and transiently formed (Table 1) species. Raman imaging spectra were plotted in a Cartesian coordinate system with axes as previously described in section 2.1. The spectra revealed the presence of spot regions of species with neighboring regions containing the formed species [29,34].
The presence of Cr(VI) is promoted by the presence of hydrogen peroxide [33,36,37,38], which is formed by the reduction of dissolved oxygen gas (reaction (3)). This reaction is promoted by the presence of anions [35]. Reaction (3) involves the formation of peroxide, which reacts with hydroxide Cr(III) to produce Cr(VI) in reaction (4).
The Raman band of is approximately 3 orders of magnitude larger than that of , and consequently, verifying the proposed reaction (4) was difficult [30]. The Cr(VI) Raman band at 860 cm-1 is only observed in coatings formed in an oxygenated solution [30]; in contrast, coatings formed from a deoxygenated solution do not present bands in the range of 840–904 cm-1 [30]. These observations indicate that Cr(VI) species are only formed in oxygenated solutions, and this band is evidence that Cr(III) species are oxidized by peroxide, which is produced by the oxygen reduction reaction (3) [30]. It has been proposed that the formation of Cr(VI) is suppressed in baths containing Cu(II) or Fe(II) species [36,37,38]; since these ions react preferentially with hydrogen peroxide. The success of this strategy could be accurately evaluated on the basis of Raman spectroscopy [36,37,38]. Qi et al. [33] used a sodium sulfite solution to eliminate Cr(VI) species from a coating, and the Cr(VI) of the first layer was effectively removed by sulfite ions.
2.3. Studies of Coatings Formed from Electroplated Cr(VI) Baths
The mechanisms of Cr(VI) electrodeposition remain unidentified [2], and the identification of intermediates remains unclear. In general, the literature [2] assumes the following consecutive reactions to electrodeposition from Cr(VI) species:
Industrial experience has noted that Cr(VI) electroplating can be performed only in the presence of [2]. However, there are no studies that use vibrational spectroscopy to characterize sulfate baths used in the electrodeposition of Cr(VI). Other Cr(VI) coatings have been explored for elaborate cathodes for the production of sodium chlorate. In 2016, Hedenstedt et al. [41] noted that the nature of the coating formed by the reduction of Cr(VI) was unknown. In subsequent years, chromium species were determined via vibrational spectroscopy. These Chromate(VI) coatings were studied via Raman spectroscopy in Au [42,43], Fe [43] and Ti [43,44] substrates. Table 1 lists the bands observed in the Raman spectra of these chrome coatings from a solution of Cr(VI). Hatch [42] models several reactions on the basis of these bands, and the most relevant are the following:
where m=3 or 2 and n=0 or 3
“Traditional electrochemical methods” are usually based on measuring the current required to establish the experimental potential of a working electrode. These techniques suggest general models similar to schema reactions (5)-(7). In contrast, the combination of electrochemical methods and vibrational spectroscopy results in an understanding of the structural features at the molecular level, and it is possible to elaborate the scheme of reactions (8)-(9).
Two processes are noted: first, amorphous is formed in the coating, and second, the phase transformation of amorphous produces crystalline [44]. As a result of local heating by the Raman laser there is in-situ formation of [43,44]; with this consideration, the coating on Au consists of an oxide, whereas the coatings on Fe and Ti are covered with a mixture of hydroxides and oxides [44]. A weak band at 850 cm-1 is observed for amorphous ; conversely, at higher laser powers, the oxide forms in-situ as a result of local heating, and new bands are observed [44]. Different symmetries (A1g symmetry [47] or Eg symmetry [42,43]) have been reported for a band at 550-552 cm-1 of . Nevertheless, Table 2 is based on the study of Hatch [42]; that is, the characteristic band at approximately 550-552 cm-1 corresponds to the A1g vibrational mode involving Cr-O stretching in octahedrally O-coordinated Cr(III) of .
2.4. Studies of Coatings Formed from Electroplated Cr(III) Baths
Cr(III) plating is an essential process in several industries and needs improvement. There are approximately 880 articles focused on evaluating the quality of Cr(III) coatings, and in some cases, the quality of these coatings is acceptable. However, few studies have reported vibrational spectroscopy results [45,46,47,48,49,50,51], which limits a deeper understanding of the coating formation process.
Mardanifar et al. [45] evaluated the effects of heat treatment temperature on the characteristics of cobalt chromium coatings. FTIR spectra of the surfaces of the deposited oxides were obtained at several temperatures. Mardanifar et al. [45] suggested that the surface is composed of oxide on the basis of bands at 589 and 882 cm-1; however, in our opinion, this claim needs to be revised, and the bands corresponding to water (1623 cm-1) and hydroxyl groups (1680 cm-1) observed in the spectra indicate that Cr(III) was hydrated (bond in Table 2). In addition, the Raman spectra obtained by Zhao et al. [26] of pure did not display a band at 882 cm-1, and consequently, in the study [45], the coating contained some Cr(VI). The band observed at 420 cm-1 is related to the formation of an oxide . Kus [46] electrodeposited Cr(III) via a pulse current and recorded the FTIR spectra of the coating over time. The evaporation of water was detected by the changes in the bands corresponding to water (1620 cm-1) and hydroxyl groups (3100 cm-1). Kus [46] reported a band at 1430 cm-1, which was attributed to a native oxide formed due to exposure to air; however, this band has not been reported in other studies. Zhou [47] prepared a Cr/SiC coating on a ferronickel alloy via pulse electrodeposition. Raman and XPS revealed that the coating mainly included a small amount of SiC and the oxide (551 cm-1 bond in Table 2). Kajita et al. [48] recorded the Raman spectrum of Cr(III) electrodeposited on . The authors attributed the band at 850 cm-1 to chromium-oxo compounds (), which implies that the band is related to a vibrational mode of . In addition, a band at 848 cm-1 (Table 2) was ascribed to amorphous in the mixed oxide Cr(III)/Cr(VI) [44]. In our opinion, these 2 claims need to be revised, and it is likely that the spot area of the laser focused in the area that contains Cr(III) and Cr(VI) species. Consequently, bands cannot be directly related to specific species. These bands may be related to dehydrated Cr(VI) oxide ( in Table 1). Huang et al. [49] analyzed the carbon in a coating by monitoring the Raman band of sp3 carbon at several temperatures (approximately 1330 cm-1). The hardness increases with the precipitation of the diamond structure on the surface. Prabhakar et al. [50] evaluated a coating with an outer layer composed of oxygen and chromium () and an inner layer containing chromium, oxygen and carbon (). The thickness of the outer layer was between 1.5 nm and 12 nm, and the thickness of the inner layer was approximately 10 nm. In the outer layer, a Raman band appears at 551 cm-1 ( bond and Eg symmetry in Table 2); conversely, in the inner phase, this band disappears, probably due to the formation of new bonds . In addition, Raman spectroscopy and XPS revealed the presence of unsaturated carbon () and aliphatic carbon ().
Survilienė [51] recorded the IR spectra of coatings formed from a formate-urea bath, a formate–urea bath containing hydroxylaminophosphate and a formate–urea bath containing hydrazine. The analysis of the spectra focused on bands of organic compounds, and no data on the Cr(III) bands were provided. In the coating, no bands were attributed to hydroxylaminophosphate, and consequently, this compound was not incorporated into the Cr(III) coating; conversely, in the bath with hydrazine, a band appeared at 1625 cm-1, and the authors speculated that this feature was related to amino compounds, but in our opinion, this band was related to water in the coating (the bending vibrations are shown in Table 1). On the other hand, the XPS spectra of the coatings displayed signals of Cr(III), oxygen, nitrogen, carbon and phosphate, which suggested that the species were derived from the decomposition of hydroxylaminophosphate, hydrazine and urea. These residual compounds were integrated into the Cr deposits during the electrodeposition process.
3. Vibrational Studies on Aqueous Solutions
3.1. Studies of Hexavalent Chrome Baths for Conversion Coatings or Electrodeposition Processes
It is possible that the species in the baths used for electrodeposition and conversion coating are similar, so they are discussed in a single section. Several studies have focused on the spectra of the coating surface (Section 2.1-2.4); conversely, very few studies have focused on dissolved species [13,26,52], and the observed bands of these studies are listed in Table 3. Only 2 studies [13,26] have reported the Raman bands of commercial baths for chromate (VI) conversion coatings, and only 1 electroplating bath study has been reported [52]. Nonetheless, some speciation studies of Cr(VI) have also been reviewed [53,54,55,56,57,58].
The concentration of Cr(VI) used in the conversion coating process is approximately 0.05 M, and the pH ranges between 1 and 2 [53]. Frankel et al. [13,26] reported a Raman band at 373 cm-1, but these authors did not assign the band to vibrational modes; however, in our opinion, this band is related to bending deformation (δ in Table 3). In industry, the Cr(VI) plating bath concentration ranges from 1.5 M to 2.5 M, and Raman spectroscopy detected ions at significant concentrations in this bath [52]. Ottonello [54] compared vibrational frequencies calculated via density functional theory with experimental vibrational frequencies. There are 4 main vibrational modes of anions , and these modes correspond to tetrahedral symmetry (Td) [54,55,59].
Industrial experience indicates that ions are orange in solution and that ions are yellow [2]. Moreover, X-ray diffraction studies have identified the following species in bath solutions: trichromate (), dichromate () and monochromate () ions [60]. In the 1980s, Michel et al. [55,56] studied Cr(VI) solutions via Raman spectroscopy and reported that hydrogen chromate () was not present in aqueous solutions; conversely, Ramsey et al. [53] assumed the existence of this protonated species. This discrepancy is resolved via a sufficiently sensitive spectrometer [53]; consequently, the band of the species is listed in Table 3.
Zheng [52] studied the corrosion of a pure Cr electrode via cyclic voltammetry and in-situ Raman spectroscopy. This combination of techniques enables an understanding of reaction mechanisms because each voltammetric peak can be associated with a specific reaction. The Cr electrode was corroded to , which in turn transformed into . The concentration of Cr(VI) is high in the conversion coating bath; however, in other cases, when the coating is corroded, the concentration of Cr(VI) is lower. In this context, Ramsey et al. [53] studied dilute chromate solutions, and the experimentally observed bands are listed in Table 3. The corrosion of Ni–Cr alloys was investigated by Honesty [57] via voltammetry and Raman spectroscopy. This study established a clear correlation between techniques because the current density in voltammograms can be related to features in the Raman spectra. Cr(VI) ions are the major product formed in the transpassive voltammetric region. For example, at 0.95 V (V vs Ag/AgCl), a group of bands appearing at 783 cm-1 and 943 cm-1 are assigned to ions, which are formed from the corrosion of the alloy [57].
Dvoynenko [58] reported surface enhanced Raman scattering spectra of Cr(VI) in water (0.05 M ≈ 2.6 g/L) at several pH values. At pH 3.5 and 5.5, weak broad bands were observed at approximately 610 cm-1 and 850 cm-1; conversely, at pH 10, these broad bands were observed at approximately 350 cm-1 and 800 cm-1, and a shoulder was also observed at approximately 900 cm-1. These features can be explained on the basis of the speciation diagram [53], which indicates that at pH values below 6, the and - ions were the predominant species. On the other hand, the predominant species at pH values higher than 6 is ions. Although the presence of and in an aqueous solution [52,53,57,58] is well accepted, there are still discrepancies in the other species. Another species is assumed to exist at high acidity or high concentrations of Cr(VI): chromic acid (), hydrogen dichromate (), trichromate (), and tetrachromate (). However, Raman bands are observed only for certain species, which are listed in Table 3. In the literature, there are still discrepancies in the predominance ranges of Cr(VI), and Szabó [61] claimed that these discrepancies can be resolved via pH potentiometric and UV–vis titrations; however, this claim on the basis of these techniques is questionable. A comparison between the UV‒visible and Raman spectra of Cr(VI) shows that vibrational spectroscopy is more sensitive to changes in the Cr(VI) concentration [53]; consequently, studies need to include vibrational spectroscopy combined with other analytical techniques to reach a conclusion.
3.2. Studies of Trivalent Chromium Baths Used for Conversion Coatings or Electrodeposition Processes
Studies of the baths used for electrodeposition and conversion of Cr(III) coatings are discussed in this section [62,63,64,65,66]. The principal oligomers (monomers, dimers, and trimers) of Cr(III) were studied via several techniques, including IR spectroscopy [62]. The oligomers were placed in weakly acidic solutions (pH 2.5), which is the pH range of the baths used for electrodeposition. The wavenumbers of the rocking bands decrease from the monomer (FTIR 528 cm-1) to the dimer (FTIR 472 cm-1) and trimer (FTIR 481 cm-1) species. This trend can be explained by the formation of bridging hydroxyl groups in the dimer and trimer; that is, the oxygen atoms of the hydroxyl groups of the complexes bind 2 Cr(III) ions simultaneously, and consequently, the bond or bond water is weakened [62]. In another study, urea and formate in sulfate-based Cr(III) baths were studied via FTIR and XPS techniques [63]. In the solutions, bands of water were observed (Table 1), and a band at 3220 cm-1 was produced by stretching vibrations (ν) of the amido group (), implying the formation of a bond between the carboxylic group of formate and the amide group of urea. The authors suggested that a bond occurs between the Cr(III) ions and the carboxylic group of formate or the carbamate groups. However, this claim should be interpreted with great caution because there is no band attributed to . Therefore, it cannot be confirmed that Cr(III) participates in the changes observed in organic compounds and that these variations may be due to reactions in organic compounds and not to new bonds with Cr. This study also includes XPS results, which suggest that deposits on the surface. The FTIR spectrum of the coating displays bands corresponding to the sulfate and amide groups incorporated into the coating [63].
In 2006, plating baths containing Cr(III), Ni(II) and oxalate were studied via IR spectroscopy [64]. The Cr(III) was deposited as a CrNi alloy, but the FTIR bands of Cr(III) or Ni(II) were not addressed; that is, the study focused on oxalate bands. Additionally, water bands were observed (Table 1). The author suggested that all oxalate ions (L) are coordinated to chromium to form an inner complex; however, this claim should be taken with caution because the authors did not provide evidence of the formation of bonds or . The FTIR spectra of the freshly prepared Cr(III) bath were compared with those of the spent bath, and the oxalate band shifted from 1677 cm-1 to 1717 cm-1. This variation could be produced by changes in the pH of the solution, which was not addressed by the authors. This shift was attributed to the coordination of oxalate and Cr(III) [64]. In 2021, in-situ infrared spectroscopy was performed in a bath containing oxalic acid and glycine compounds [65]. The authors claim that inner complexes were formed between organic compounds and Cr(III); however, no bands were attributed to bonds or , and consequently, this claim must be revised. Conversely, the IR bands of the carbonyl groups (1717 cm-1) of oxalate or glycine evolve with the electric potential of the nickel electrode; simultaneously, the voltammograms display slight changes in electric current density. This finding indicates that voltammetry suggests reactions without distinctive features, whereas in-situ spectroscopy provides clear evidence of reactions. The presence of organic compounds such as oxalic acid or glycine promotes the formation of Cr(III) coatings [65].
García-Antón et al. [66] evaluated the quality of passivation baths by monitoring the Raman band at 541 cm-1 (vibrational mode at 553 cm-1 in Table 3). The presence of Cr(III) oxides on coatings decreases with increasing impurities of zinc and iron in spent baths, and the band intensity of Cr(III) ions increases with increasing purity of the baths [66].
4. Reference Spectra of the Pure Chromium Compounds
Dichromate ion spectra have been reported in some studies, but this section reviews the most representative [67,68]. In 1973, Bates et al. [67] reported that the bending vibrational modes of bridge bonds () were observed at wavenumbers less than 390 cm-1, and the stretching vibrational modes of terminal bonds () were observed between 746 and 968 cm-1. In 2023, Vats et al. [68] reviewed studies of Cr(VI) compounds and noted that the characteristic antisymmetric vibrations (742 cm-1) can be distinguished from the symmetric stretching vibrational modes associated with the tetrahedra (894 cm-1).
A comparison between the spectra of the coatings and the spectra of the pure oxides would enable the identification of the vibrational modes. In addition, it facilitates comparisons between spectra obtained in different laboratories. Therefore, the spectra of the pure dichromate oxides recorded in our laboratory are included (Figure 2a), and these spectra are compared with the measurements reported in the database of the National Institute of Standards and Technology (NIST) [69], which is an agency of the Administration of Technology of the United States of America government. In Figure 2b, the structure of dichromate ions displays central bonds and terminal bonds, where the oxygen atom is bonded to a single Cr(VI). The NIST reference spectrum is related to hydrated oxide and Nujol absorption bands in the IR range of 1300-4000 cm-1. This reference spectrum is similar to the experimental spectrum of hydrate oxide (black line in Figure 2a). Hydration produces the features observed at wavenumbers of 1570–1650 cm-1 and 3200-3600 cm-1. The broad band at 410-545 cm-1 is observed only when the oxide is hydrated. When the ATR spectrum (Figure 2a) is compared with the transmission spectrum of hydrated oxide (NIST reference spectrum on a web link [69], Figure 2b), there are slight differences between them; that is, there are variations in peak intensity and peak position, and these differences arise from the differing indices of refraction of the ATR crystal. Therefore, when the wavelength (λ) changes from 10μm (1000 cm-1) to 20μm (500 cm-1), the experimental spectrum (ATR) has 7 peaks very close to each other, and the NIST spectrum shows only 5 peaks. Figure 2b shows the experimental spectra corresponding to hydrated (black line) and nonhydrated (blue line) oxides, which, in the region of 840-1040 cm-1, have approximately the same intensity. In the range of 560-800 cm-1 the maximum band shifted to 10-20 cm-1 between the spectra of hydrated and nonhydrated oxides, and the intensities also differed. The band at 774 cm-1 is clearly defined when the oxide is hydrated. Bates et al. [67] calculated 21 vibrational normal modes of dichromate, and the ion has a structure of two tetrahedra that share a corner as shown in Figure 2b. The calculation shows that the central bonds are weaker than the terminal bonds. In databases, there are no spectra of Cr(III) sulfates or other Cr(III) compounds.
5. Future Needs: Perspective on Methodology
The wavelengths of the bands for each oligomer of hexa-aqueous complexes were measured via IR spectroscopy [62], as discussed in section 3.2. However, these data are not addressed in studies of electrodeposition by Survilienė et al. [63]. These authors presented a graph of time electrodeposition versus current efficiency (CE). In the free solution without additives, there was a decrease in the CE, which was attributed to the effect of inert oligomeric species. This assumption can be tested with IR spectra of the solutions before, during, and after electrolysis. Survilienė et al. [64] suggested the formation of the bond in the spectra of a bulk solution (section 3.2); however, this claim needs to be revised because there is a formation of compounds between additives, which also produces features in the IR spectra. In addition, the bands of the monomer, dimer and trimer complexes were not measured. Nonetheless, the approach of Survilienė et al. [63,64] can be used to understand the chemical nature of baths.
Liu et al. [65], via FTIR spectroscopy, studied the electrodeposition of Cr(III) in a bath with glycine and oxalic acid as additives. Liu et al. [65] suggested that oxalic acid or glycine can replace one water molecule in ; however, there are no bands directly assigned to or bonds. An analysis of the spectra in these studies is still incomplete, and more measurements are needed.
Our work updates the Cr(VI) oxide spectra, and it is important to conduct experiments to determine the reference Cr(III) spectra. Ottonello [54] reviewed studies of Cr(III) hexa-hydration on the basis of density functional theory, and there is no comparison between experimental FTIR bands and theoretical studies. These reference spectra will enable comparisons between laboratories.
6. Conclusions
Studies on hexavalent or trivalent chromium were reviewed in 3 sections. The conclusions are more profound when vibrational spectroscopy is used in combination with microscopy techniques. Different techniques have been used in Cr(VI) conversion coatings, resulting in a complete description of the formation process of these coatings. The conclusions for each system are as follows:
- Studies of hexavalent chromium conversion coatings
- The majority of these studies focus on this kind of coating, and several powerful techniques have been used, including synchrotron infrared microspectroscopy. It was possible to understand the structure of the two-layer coating and the chemical composition of each layer.Additionally, the distributions on the surfaces of the different phases present were accurately identified; for example, vibrational spectroscopy reveals zones with high Cr(VI) contents, which are located at the edges of the scratch. Vibrational spectroscopy confirmed the mechanism for coating formation, in which ferricyanide was a redox mediator. In addition, vibrational spectroscopy was effective in determining the mechanism of corrosion resistance of the coatings. When pitting corrosion occurs, the migration process of Cr(VI) ions to repair the coating in damage zones was described on the basis of Raman or IR spectra.
- Studies of trivalent chromium conversion coatings
- The toxicity of Cr(VI) species has restricted their use in surface finishing, and they have been replaced by Cr(III) species. Raman spectroscopy is a very effective technique for surface characterization because it clearly shows how the constituent ions of the bath are transformed into surface species. Vibrational spectroscopy revealed the formation mechanism of the coating on an alloy from a bath, which contains , and a Cr(III) sulfate salt. The trivalent chromium conversion coating consists of two main layers, whose compositions were identified on the basis of vibrational spectroscopy. The presence of Cr(VI) in these coatings is promoted by the presence of hydrogen peroxide, which is formed by the reduction of dissolved oxygen gas in the bath. The formation of Cr(VI) in these coatings is controversial with respect to environmental directives. Consequently, it has been proposed that baths containing Cu(II) or Fe(II) species suppress the formation of Cr(VI). This strategy was evaluated via vibrational spectroscopy.
- Studies of coatings formed from electroplated Cr(VI) baths.
Vibrational spectroscopy has scarcely been used to answer the questions presented in Cr(VI) electrodeposition in sulfate baths. Nevertheless, studies of cathodes for the production of sodium chlorate have been described. The combination of several methods and vibrational spectroscopy results in a complete understanding of the surface at the molecular level, and the mechanisms of deposition were identified.
- Studies of coatings formed from electroplated Cr(III) baths
There are very few studies via vibrational spectroscopy, and unlike in the previous sections, where the baths and substrates were similar, in this section, the great differences in operational conditions and substrates prevent a common conclusion. In addition, in some studies, the Cr(III) bands were not addressed, and the spectra focused on the additives in the baths. Nonetheless, vibrational spectroscopy was able to identify the bonds in the outer layer of a coating and the bonds in the inner layer.
- Studies of hexavalent chrome baths for conversion coatings or electrodeposition processes
Few studies have focused on species in solutions. The candidate species of commercial Alodine Cr(VI) baths for chromate (VI) conversion coatings are and ; conversely, the use of a sulfate bath for the electrodeposition of Cr(VI) was revised in only 1 study, with the conclusion that the species in the bath are ions. The solution species produced by the corrosion of a pure Cr electrode or Ni–Cr alloys were clearly identified. The combination of cyclic voltammetry and in-situ Raman spectroscopy enables an understanding of corrosion mechanisms. The predominant species at pH values less than 6 are and ions, whereas the predominant species at pH values greater than 6 are ions. In the literature, there are still discrepancies in the predominance ranges of Cr(VI), which can be resolved when vibrational spectroscopy is combined with other analytical techniques.
- Studies of trivalent chromium baths used for conversion coatings or electrodeposition processes
There are only 4 studies concerning Cr(III) baths. The wavenumbers of the IR bands of the main oligomers (monomers, dimers, and trimers) are clearly identified, and the bonds are weak in dimers or trimers because of the formation of hydroxide bridges between 2 Cr(III) ions. In other studies, the bands of Cr(III) are not addressed, but only the IR spectra of organic compounds are recorded; consequently, there is no evidence of the formation of bonds.
- Reference spectra of the pure chromium compounds
The reference spectra permit comparison between laboratories, and in our study, reference spectra of pure potassium dichromate were included. The reference spectra and data of the positions of the stretching vibrations (ν) in Table 1, Table 2 and Table 3 allow us to create the following inequality for the wavenumbers of the dichromate bands:
where are the terminal bonds and are bridge bonds in the dichromate compound. The inequality (11) was deduced on the basis of the positions of the bands corresponding to the stretching vibrations (ν) of pure and .
Inequalities (10)-(12) demonstrate that vibrational spectroscopy can effectively differentiate between Cr(VI) and Cr(III) species.
Author Contributions
Conceptualization, G. Orozco; methodology, E. J. Aldeco-Pérez; investigation, J. C. Avalos; resources, R. Garcia-Garcia and J. Torres-González; writing—original draft preparation, J. C. Avalos, E. J. Aldeco-Pérez; writing—review and editing, G. Orozco; supervision, R. Garcia-Garcia and J. Torres-González; project administration, J. Torres-González; All authors have read and agreed to the published version of the manuscript.
Funding
No funding.
Data Availability Statement
There are not research data date to share.
Acknowledgments
J. C. Avalos gratefully acknowledges SECIHTI for the scholarship for the resources provided during the Ph Doctorate program and the research for this work. This research did not receive any specific grant from funding agencies in the public or not-for-profit sectors.
Conflicts of Interest
The Julio C. Avalos, Eugenia Aldeco-Pérez, Julieta Torres-González, Raul Garcia-Garcia, German Orozco declare no conflicts of interest.
Abbreviations
| FTIR | Fourier transform infrared spectroscopy |
| ATR | Attenuated total reflectance |
| DRIFTS | Diffuse reflectance infrared spectroscopy |
| RAIRS | Reflection absorption infrared spectroscopy |
| IRSE | Infrared spectroscopic ellipsometry |
| GAIRS | Grazing angle infrared spectroscopy |
| SIRMS | synchrotron infrared microspectroscopy |
| EXAFS | Extended X-ray absorption fine structure |
| XANES | X-ray absorption near edge structure |
| XPS | X-ray photoelectron spectroscopy |
| NIST | National Institute of Standards and Technology |
| CE | Current efficiency |
References
- Dubpernell G.; History of chromium plating, Plat. Surf. Finish., 1984, 71, 84-91.
- Mandich N.V.; Snyder D.L.; Electrodeposition of chromium, In Modern Electroplating; M., Schlesinger, M. Paunovic, Eds.; John Wiley & Sons Inc, Hoboken, New Jersey, U.S. 2010, pp 205-211,214,233. [CrossRef]
- Prakash B. S.; Balaraju J. N.; Chromate (Cr6+)-free surface treatments for active corrosion protection of aluminum alloys: a review, J. Coat Technol Res., 2024, 21, 105–135. [CrossRef]
- Protsenko V. S.; Kinetics and Mechanism of Electrochemical Reactions Occurring during the Chromium Electrodeposition from Electrolytes Based on Cr(III) Compounds: A Literature Review, Reactions, 2023, 4, 398–419. [CrossRef]
- Tian X.; Chen S.; F. Zhu; Z. Cai; L. Wang; Review, Towards cleaner production of trivalent chromium electrodeposition: Mechanism, process and challenges, J. Clean. Prod., 2024, 476, 143768. [CrossRef]
- Protsenko V.; A review on electrodeposition and tribological performance of chromium-based coatings from eco-friendly trivalent chromium baths, Discover Electrochemistry, 2025, 2, 22. [CrossRef]
- Hesamedini S.; Bund A., Trivalent chromium conversion coatings, J. Coat. Technol. Res., 2019, 16, 623–641. [CrossRef]
- Becker M.; Chromate-free chemical conversion coatings for aluminum alloys, Corros. Rev, 2019, 37, 321–342. [CrossRef]
- Ahern A. M.; Schwartz P. R.; Shaffer L. A.; Characterization of Conversion-Coated Aluminum Using Fourier Transform Infrared and Raman Spectroscopies, Appl. Spectrosc., 1992, 46, 1412-1419 https://opg.optica.org/as/abstract.cfm?URI=as-46-9-1412. [CrossRef]
- Matienzo L. J.; Holum K. J.; Surface studies of corrosion-preventing coatings for aluminum alloys, Appl. Surf. Sci., 1981, 9, 47—73.
- Lytle F. W.; Greegor R. B.; Bibbins G. L.; Blohowiak K. Y.; Smith R. E.; Tuss G. D.; An investigation of the structure and chemistry of a chromium-conversion surface layer on aluminum, Corros. Sci., 1995, 37, 349-369. [CrossRef]
- Lenglet M.; Petit F.; Malvault J. Y.; Reflectance spectroscopy (0.03 to 6 eV) of Cr3+ and Cr (VI) products of chromate conversion coatings, Phys. Status Solidi (a), 1994, 143, 361-365. [CrossRef]
- Xia L.; McCreery R. L.; Chemistry of a Chromate Conversion Coating on Aluminum Alloy AA2024-T3 Probed by Vibrational Spectroscopy, J. Electrochem. Soc., 1998, 145, 3083-3089. [CrossRef]
- L. Xia; R.L. McCreery; Structure and Function of Ferricyanide in the Formation of Chromate Conversion Coatings on Aluminum Aircraft Alloy, J. Electrochem Soc., 1999, 146, 3696-3701. [CrossRef]
- Juffs L.; Hughes A. E.; Furman S.; Paterson P. J. K.; The use of macroscopic modelling of intermetallic phases in aluminium alloys in the study of ferricyanide accelerated chromate conversion coatings, Corros. Sci., 2002, 44, 1755-1781. [CrossRef]
- Campestrini P.; Böhm S.; Schram T.; Terryn H.; Wit J. H. W. de; Study of the formation of chromate conversion coatings on Alclad 2024 aluminum alloy using spectroscopic ellipsometry, Thin Solid Films, 2002, 410, 76–85. [CrossRef]
- Petit F.; Debontride H.; Lenglet M.; Juhel G.; Verchere D.; Contribution of Spectrometric Methods to the Study of the Constituents of Chromating Layers, Appl. Spectrosc., 1995, 49, 207-210. [CrossRef]
- Schram T.; Laet J. De; Terryn H.; Nondestructive optical characterization of chemical conversion coatings on aluminum, J. Electrochem Soc., 1998, 145, 2733-2739. [CrossRef]
- Schram T.; Terryn H.; The use of Infrared spectroscopic ellipsometry for the thickness determination and molecular characterization of thin films on aluminum, J. Electrochem Soc., 2001, 148, F12-F20. [CrossRef]
- Chidambaram D.; Halada G. P.; Clayton C. R.; Synchrotron Radiation Based Grazing Angle Infrared Spectroscopy of Chromate Conversion Coatings Formed on Aluminum Alloys, J. Electrochem Soc., 2004, 151, B160-B164. [CrossRef]
- R. Holze; Surface and Interface Analysis, An Electrochemists Toolbox, Springer Berlin Heidelberg. 2009, PP.102, 128, 137-139. [CrossRef]
- J. Vasquez; M.; G.P. Halada; C.R. Clayton; J.P. Longtin; On the nature of the chromate conversion coating formed on intermetallic constituents of AA2024-T3. Surf. Interface Anal., 2002, 33, 607-616. [CrossRef]
- Vasquez M. J.; Halada G.P.; Clayton C.R.; The application of synchrotron-based spectroscopic techniques to the study of chromate conversion coatings, Electrochim. Acta, 2002, 47, 3105-3115. [CrossRef]
- Chidambaram D.; Vasquez M. J.; Halada G. P.; Clayton C. R.; Studies on the repassivation behavior of aluminum and aluminum alloy exposed to chromate solutions, Surf. Interface Anal., 2003, 35, 226-230. [CrossRef]
- McGovern W. R.; Schmutz P.; Buchheit R. G.; McCreery R. L.; Formation of Chromate Conversion Coatings on Al-Cu-Mg Intermetallic Compounds and Alloys, J. Electrochem. Soc., 2000, 147, 4494-4501. [CrossRef]
- Zhao J.; Xia L.; Sehgal A.; Lu D.; McCreery R.L.; Frankel G.S.; Effects of Chromate Conversion Coatings on Corrosion of Aluminum Alloy 2024-T3, Surf. Coat. Technol., 2001,140, 51-57. [CrossRef]
- Hurley B. L.; McCreery R. L.; Raman Spectroscopy of Monolayers Formed from Chromate Corrosion Inhibitor on Copper Surfaces, J. Electrochem. Soc., 2003, 150, B367-B373. [CrossRef]
- Zhang X.; Van Den Bos C.; Sloof W.G.; Terryn H.; Hovestad A.; Wit J. H. W. De; Investigation of Cr(III) based conversion coatings on electrogalvanised steel, Surf. Eng., 2004, 20, 244-250. [CrossRef]
- Li L.; Swain G. P.; Howell A.; Woodbury D.; Swain G. M.; The formation, structure, electrochemical properties and stability of trivalent chrome process (TCP) coatings on AA2024, J. Electrochem. Soc., 2011, 158, C274-C283. [CrossRef]
- Li L.; Kim D. Y.; Swain G. M.; Transient formation of chromate in trivalent chromium process (TCP) coatings on AA2024 as probed by Raman spectroscopy, J. Electrochem. Soc., 2012, 159 C326-C333. [CrossRef]
- L. Li, G. M., Swain, Formation and structure of trivalent chromium process coatings on aluminum alloys 6061 and 7075, Corrosion, 2013, 69, 1205-1216.
- Qi J. T.; Hashimoto T.; Walton J. R.; Zhou X.; Skeldon P.; Thompson G. E.; Trivalent chromium conversion coating formation on aluminium, Surf. Coat. Technol., 2015, 280, 317–329. [CrossRef]
- Qi J.; Walton J.; Thompson G. E.; Albu S. P.; Carr J.; Spectroscopic studies of chromium VI formed in the trivalent chromium conversion coatings on aluminum, J. Electrochem. Soc., 2016,163, C357. [CrossRef]
- Munson C. A.; Swain G. M.; Structure and chemical composition of different variants of a commercial trivalent chromium process (TCP) coating on aluminum alloy 7075-T6. Surf. Coat. Technol., 2017, 315, 150-162. [CrossRef]
- Qi J.; Gao L.; Liu Y.; Liu B.; Hashimoto T.; Wang Z.; Thompson G. E.; Chromate formed in a trivalent chromium conversion coating on aluminum, J. Electrochem. Soc. 164 (2017) 442-C449. [CrossRef]
- Qi J.; Miao Y.; Wang Z.; Li Y.; Zhang X.; Skeldon P.; Thompson G.E.; Influence of copper on trivalent chromium conversion coating formation on aluminum, J. Electrochem. Soc., 2017, 164, C611-C617. [CrossRef]
- Qi J.; Zhang B.; Wang Z.; Li Y.; Skeldon P.; Thompson G. E.; Effect of an Fe (II)-modified trivalent chromium conversion process on Cr (VI) formation during coating of AA 2024 alloy, Electrochem. commun., 2018, 92 (1-4. [CrossRef]
- Qi J.; Światowska J.; Skeldon P.; P. Marcus; Chromium valence change in trivalent chromium conversion coatings on aluminium deposited under applied potentials, Corros. Sci., 2020, 167, 108482. [CrossRef]
- Qi J.; Z. Ye; Gong N.; Qu X.; Mercier D.; Światowska J.; Skeldon P.; Marcus P.; Formation of a trivalent chromium conversion coating on AZ91D magnesium alloy, Corros. Sci., 2021, 186, 109459. [CrossRef]
- Sun W.; Bian G.; Jia L.; Pai J.; Ye Z.; Wang N.; Qi J.; Li T.; Study of trivalent chromium conversion coating formation at Solution—Metal interface. Metals, 2023, 13, 93. [CrossRef]
- Hedenstedt K.; Gomes A. S. O.; Busch M.; Ahlberg E, Study of Hypochlorite Reduction Related to the Sodium Chlorate Process, Electrocatalysis (2016) 7:326–335. [CrossRef]
- Hatch J. J; Gewirth A A.; Potential dependent chromate adsorption on gold, J. Electrochem. Soc., 2009, 156, D497-D502. [CrossRef]
- Gomes A. S. O.; Busch M.; Wildlock M.; Simic N.; Ahlberg E.; Understanding Selectivity in the Chlorate Process: A Step towards Efficient Hydrogen Production, Chemistry Select, 2018, 3, 6683 – 6690. [CrossRef]
- Gomes A. S. O.; Simic N.; Wildlock M.; Martinelli A.; Ahlberg E.; Electrochemical Investigation of the Hydrogen Evolution Reaction on Electrodeposited Films of Cr(OH)3 and Cr2O3 in Mild Alkaline Solutions, Electrocatalysis, 2018, 9 333–342. [CrossRef]
- Mardanifar A.; Mohseni A.; Mahdavi S.; Wear and corrosion of Co-Cr coatings electrodeposited from a trivalent chromium solution: Effect of heat treatment temperature, Surf. Coat. Technol., 2021, 422, 127535. [CrossRef]
- Kus E.; Haciismailoglu M.; Arper M.; Binary potential loop electrodeposition and corrosion resistance of Cr coatings, J. Appl. Electrochem., 2024, 54, 2871-2886. [CrossRef]
- Zhou Q.; Lu Z.; Ling Y.; Wang J.; Wang R.; Li Y.; Zhang Z.; Characteristic and behavior of an electrodeposited chromium (III) oxide/silicon carbide composite coating under hydrogen plasma environment, Fusion Eng. Des., 2019, 143, 137-146. [CrossRef]
- Kajita M.; Saito K.; Abe N.; Shoji; K. Matsubara; T. Yui; M. Yagi; Visible-light-driven water oxidation at a polychromium-oxo-electrodeposited TiO2 electrode as a new type of earth-abundant photoanode, Chem. Commun., 2014, 50, 1241-1243. [CrossRef]
- Huang C.A.; Liu Y.W.; Chuang-Chen Y.; Role of carbon in the chromium deposit electroplated from a trivalent chromium based bath, Surf. Coat. Technol, 2011, 205, 3461-3466. [CrossRef]
- Prabhakar J. M.; Varanasi R. S.; Silva C. C. da; Saood S.; Vooys A. de; Erbe A.; Rohwerder M.; Chromium coatings from trivalent chromium plating baths: Characterization and cathodic delamination behaviour, Corros. Sci., 2021, 187, 109525. [CrossRef]
- Survilienė S.; Jasulaitienė V.; Nivinskienė O.; Češūnienė A.; Effect of hydrazine and hydroxylaminophosphate on chrome plating from trivalent electrolytes, Appl. Surf. Sci., 2007, 253 6738-6743. [CrossRef]
- Zheng J-X.; Ou Yang S.Q.; Feng L.; Sun J-J.; Xuan Z-W.;. Fang J-H; In-situ Raman spectroscopic studies on electrochemical oxidation behavior of chromium in alkaline solution, J. Electroanal. Chem., 2022, 921, 116682. [CrossRef]
- Ramsey J. D., Xia L., Kendig M. W., McCreery R. L., Raman Spectroscopic Analysis of the Speciation of Dilute Chromate Solutions, Corros. Sci., 2001, 43, 1557-1572. [CrossRef]
- Ottonello G.; Zuccolini M. V.; Ab-initio structure, energy and stable Cr isotopes equilibrium fractionation of some geochemically relevant HO-Cr-Cl complexes. Geochim Cosmochim Act., 2005, 69, 851-74. [CrossRef]
- Michel G.; Machiroux R.; Raman spectroscopic investigations of the CrO42-/Cr2O72- equilibrium in aqueous solution, J. Raman Spectrosc., 1983, 14, 22. [CrossRef]
- Michel G.; Cahay R.; Raman spectroscopic investigations on the chromium(VI) equilibria part 2—species present, influence of ionic strength and CrO42--Cr2O72- equilibrium constant, J. Raman Spectrosc., 1986, 17, 79-82. [CrossRef]
- Honesty N. R., Gewirth A. A., Investigating the effect of aging on transpassive behavior of Ni-based alloys in sulfuric acid with shell-isolated nanoparticle enhanced Raman spectroscopy (SHINERS), Corros. Sci., 2013, 67, 67-74. [CrossRef]
- Dvoynenko O.; Lo S. L.; Chen Y. J.; Chen G. W; Tsai H. M.; Wang Y. L.; Wang J. K.; Speciation Analysis of Cr (VI) and Cr (III) in Water with Surface-Enhanced Raman Spectroscopy. ACS omega, 2021, 6, 2052-2059. [CrossRef]
- Atkins P.; Paula J. de; Keeler J.; Physical Chemistry, Eighth Edition, Oxford University Press, 2006, pp. 467. ISBN: 0-7167-8759-8.
- T. Radnai, C. Dorgai, An X-ray diffraction study of the structure of di- and trichromate ions in solutions used for electrochemical chromium deposition, Electrochim. Acta, 1992, 37 1239-1246. [CrossRef]
- Szabó M.; Kalmár J.; Ditrói T.; Bellér G.; Lente G.; Simic N.; I. Fábián; Equilibria and kinetics of chromium(VI) speciation in aqueous solution –A comprehensive study from pH 2 to 11, Inorganica Chim. Acta, 2018, 472, 295–301. [CrossRef]
- Zhang Z.; Clark S. B.; Rao L.; Puzon G. J.; Xun L.; Further structural analysis of Cr(III) oligomers in weakly acidic solutions, Polyhedron, 2016, 105, 77–83. [CrossRef]
- Survilienė S.; Nivinskienė O.; Češūnienė A.; Selskis A.; Effect of Cr(III) solution chemistry on electrodeposition of chromium, J. Appl. Electrochem., 2006, 36, 649-654. [CrossRef]
- Survilienė S.; Češūnienė A.; Selskis A.; Butkienė R.; Effect of Cr(III)+Ni(II) solution chemistry on electrodeposition of CrNi alloys from aqueous oxalate and glycine baths, Int. J. Surf. Sci. Eng., 2013, 91, 24-31. [CrossRef]
- Liu L. C.; Jin L.; Yang J-Q; Yang F-Z; Tian Z-Q; Electro-reduction of Cr(III) ions under the effects of complexing agents and Fe(II) ions, J. Electroanal. Chem., 2021, 882, 114987. [CrossRef]
- García-Antón J.; Fernández-Domene R.M.; Sánchez-Tovar R.; Escrivà-Cerdán C.; Leiva-García R.; García V.; Urtiaga A.; Improvement of the electrochemical behaviour of Zn-electroplated steel using regenerated Cr (III) passivation baths, Chem. Eng. Sci., 2014, 111, 402–409. [CrossRef]
- Bates J. B.; Toth L. M.; Quist A. S.; Boyd G. E.; Vibrational spectra of crystalline, molten and aqueous potassium dichromate, Spectrochim. Acta Part A, 1973, 29, 1585-1600. [CrossRef]
- Vats V.; Melton G.; Islam M.; Krishnan V. V.; FTIR spectroscopy as a convenient tool for detection and identification of airborne Cr(VI) compounds arising from arc welding fumes, J. Hazard. Mater., 2023, 448, 130862. [CrossRef]
- NIST Chemistry WebBook, NIST Standard Reference Database Number 69, Eds. P.J. Linstrom and W.G. Mallard, National Institute of Standards and Technology, Gaithersburg MD, 20899. [CrossRef]
- Jmol: an open-source Java viewer for chemical structures in 3D. Available online: http://www.jmol.org/ Consulted (1, September, 2025).
Figure 1.
The scheme was constructed on the basis of the hexacyanoferrate (II)/(III) ions mediation mechanism. Reactions during coating formation are dependent upon redox mediation by ferricyanide. The arrows represent reactions. Diagram modified from [25].
Figure 1.
The scheme was constructed on the basis of the hexacyanoferrate (II)/(III) ions mediation mechanism. Reactions during coating formation are dependent upon redox mediation by ferricyanide. The arrows represent reactions. Diagram modified from [25].
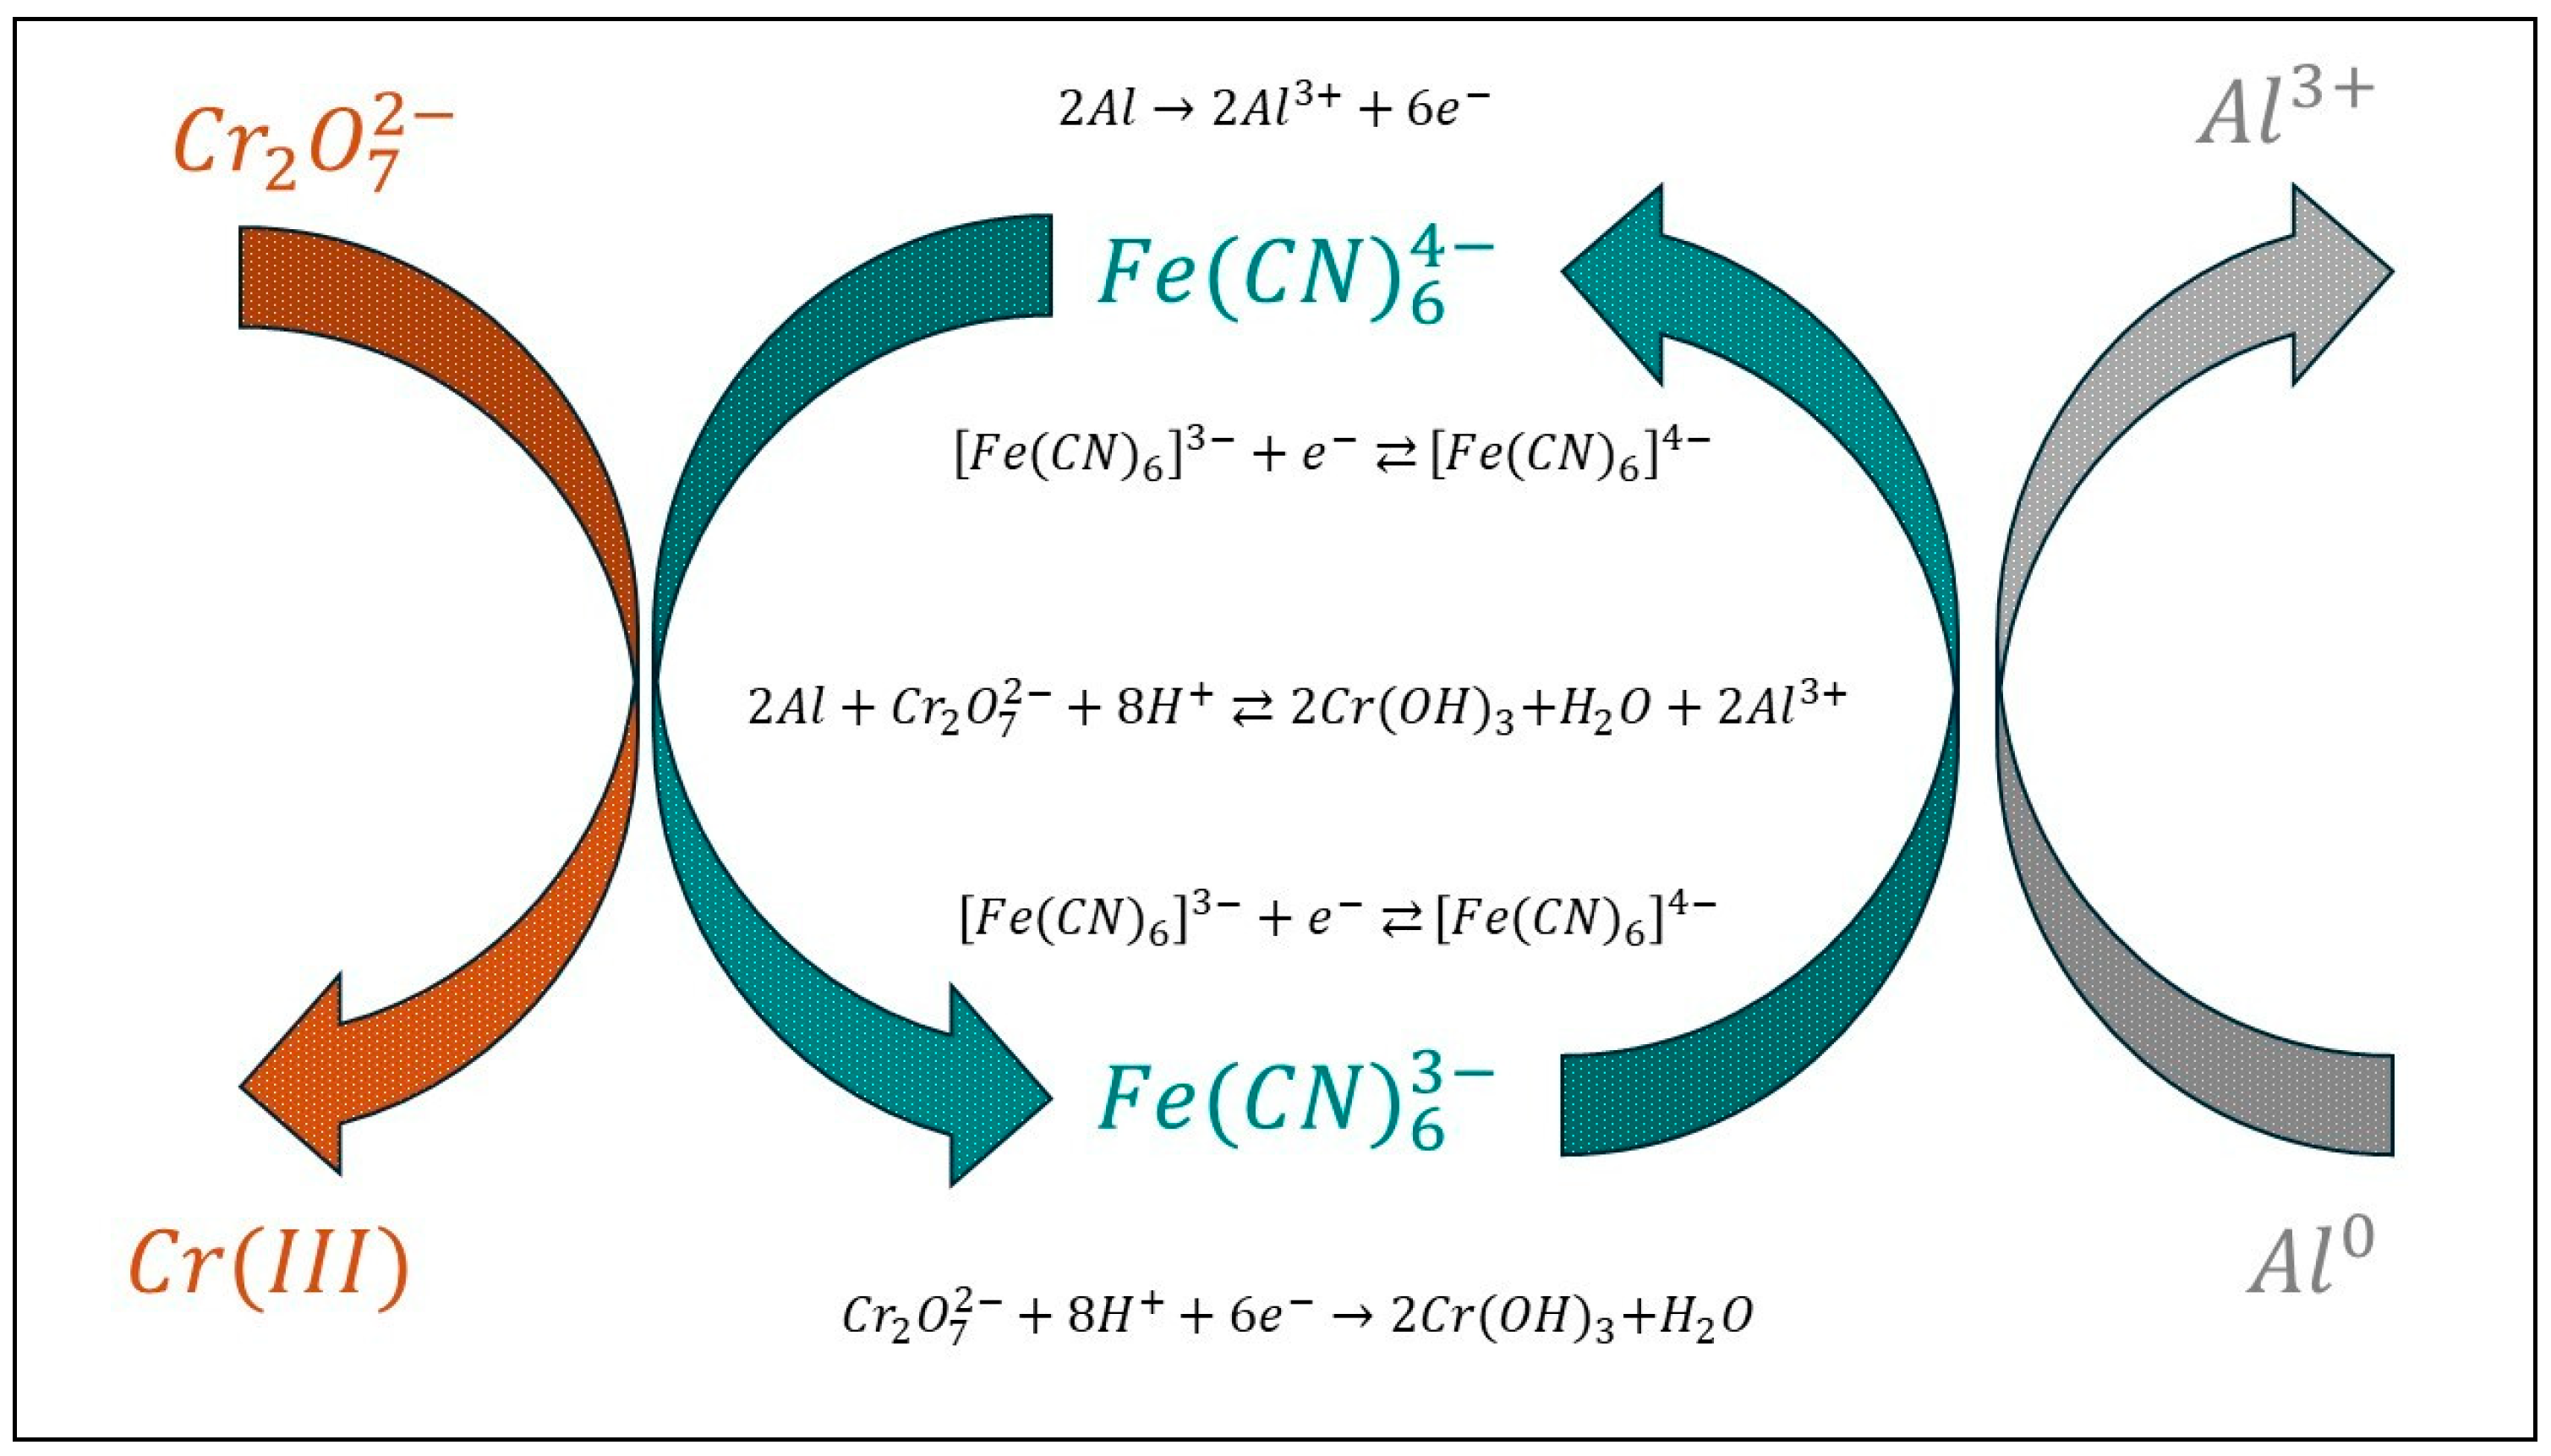
Figure 2.
Spectra of dichromate of potassium (99.7% purity Baker). The y-axis was normalized to the peak at the maximum intensity. a) The entire observed spectral range (in Table data of reference [68]) and b) zoomed-in view of the spectra and structure of oxides with oxygen atoms in red and chrome atoms in gray. The equipment used was a Perkin Elmer model Spectrum Two. Fourier transform infrared spectroscopy (FTIR) was performed in attenuated total reflectance (ATR) mode. The measurements were taken at room temperature (20–25 °C, 0.8 Atm). The sample base plate was coated with diamond, and the signal-to-noise ratio was 15000:1. The resolution of the measurement was 4 cm-1, with 20 scans per sample. The equipment had a high-resolution DTGS lithium tantalate () detector with an Opt KBr beam splitter. Before the measurements, the background was recorded in the atmosphere. https://webbook.nist.gov/cgi/cbook.cgi?Scan=cob466&Type=IR [69]. Jmol software was used to construct the structure [70].
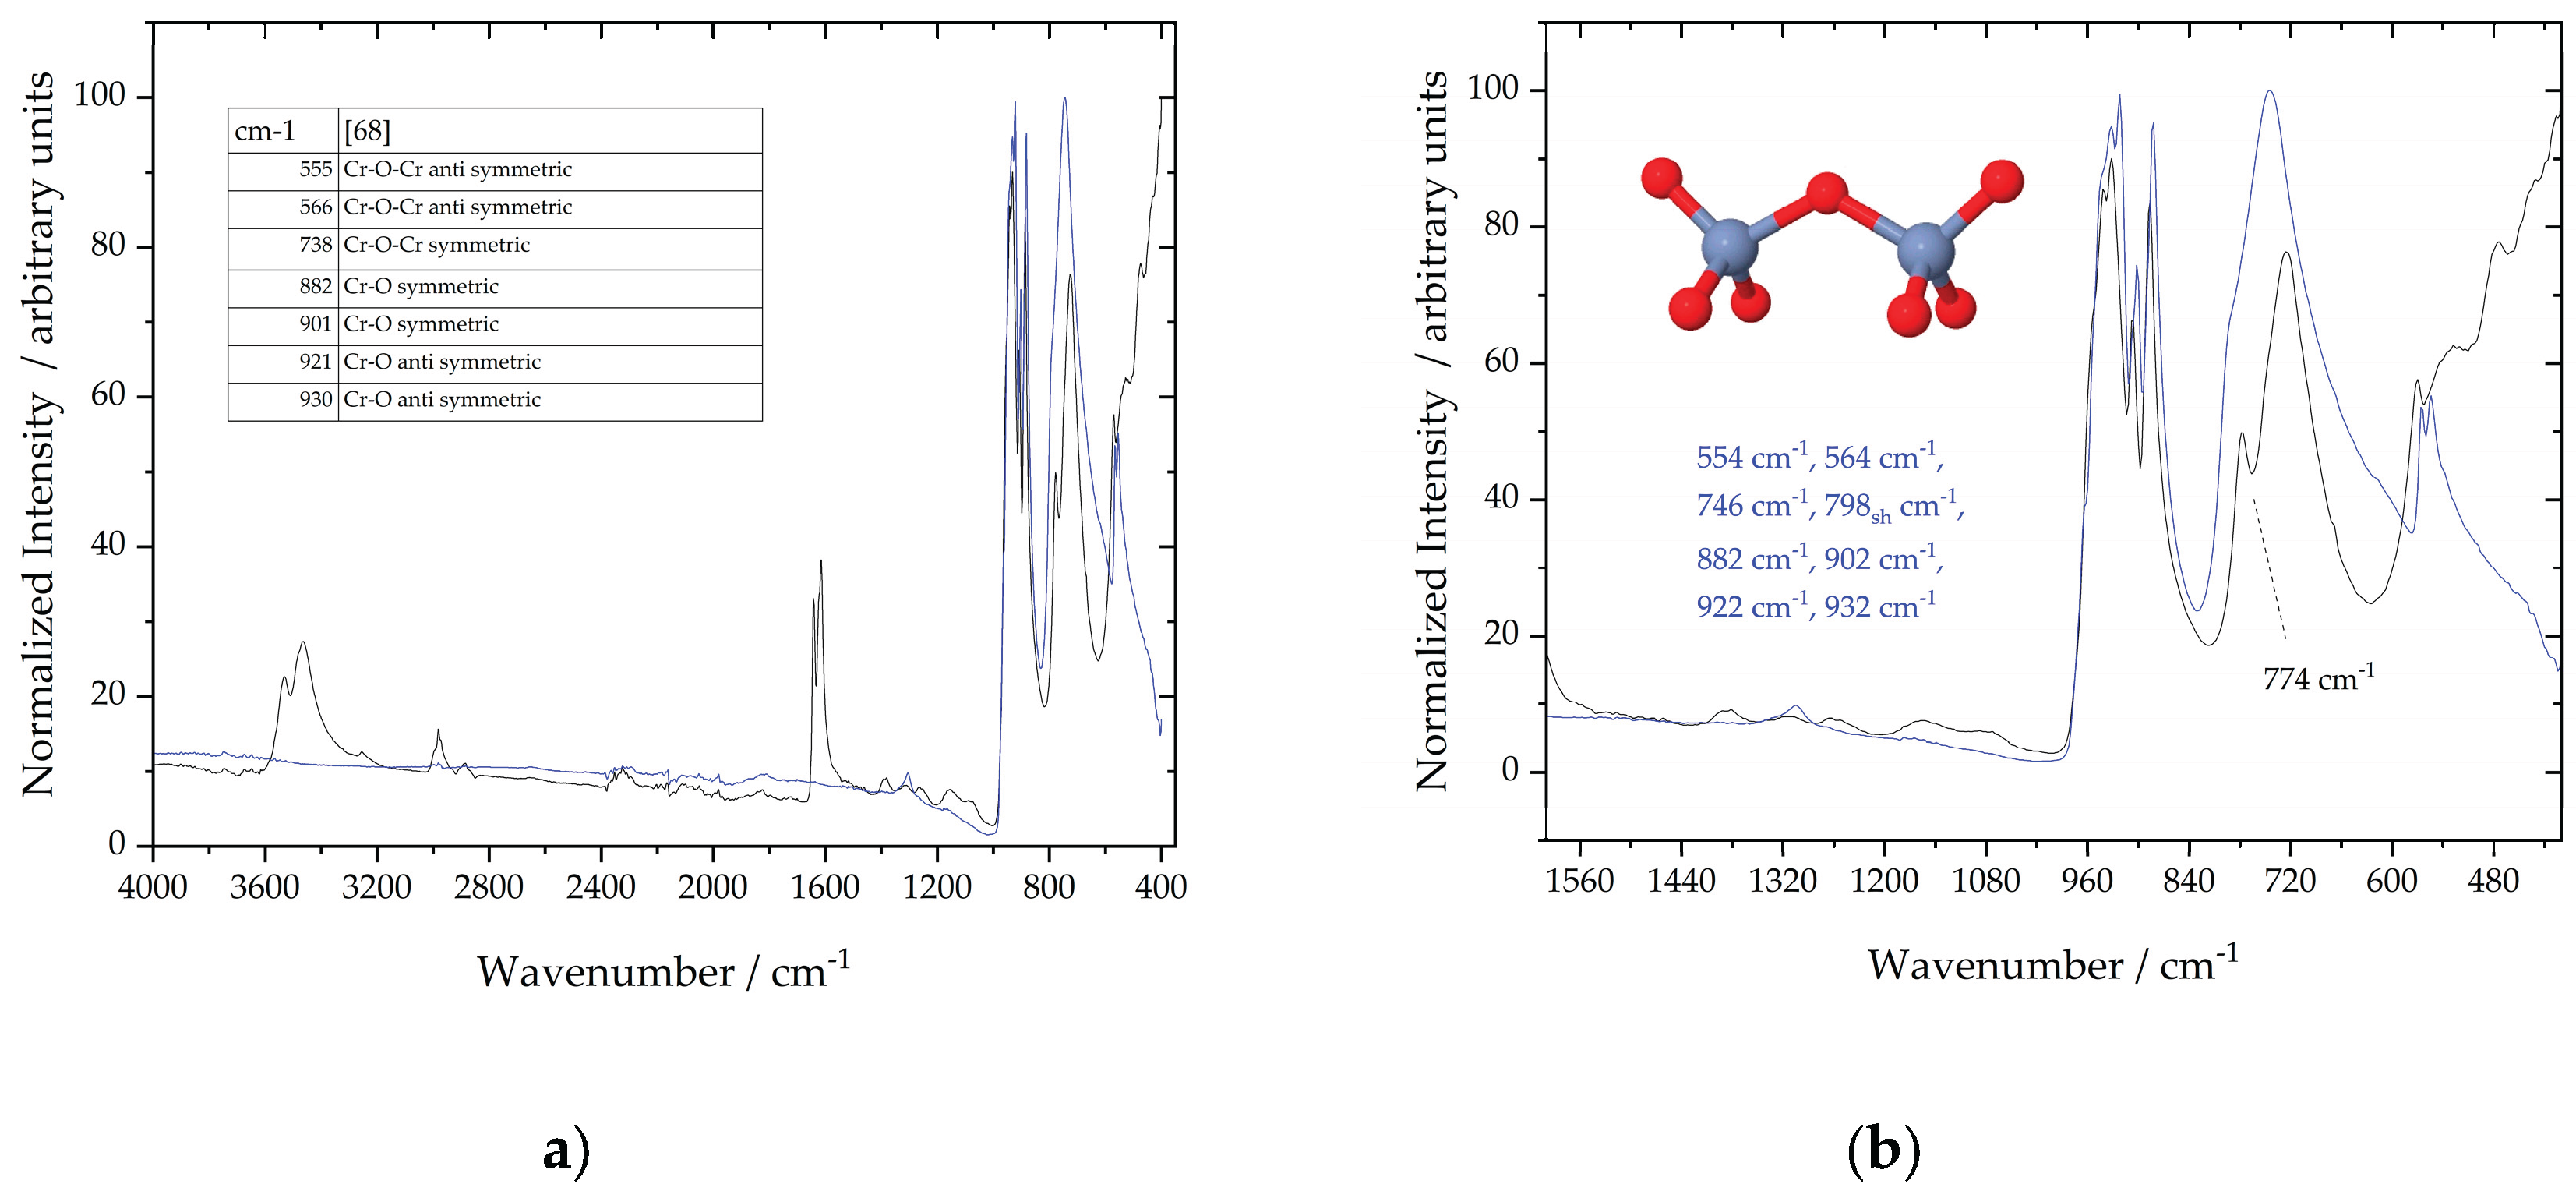

Table 1.
Assignments of the main bands observed in the IR or Raman spectra of the chromate(VI) conversion coatings. The band shoulder is abbreviated as sh.
Table 1.
Assignments of the main bands observed in the IR or Raman spectra of the chromate(VI) conversion coatings. The band shoulder is abbreviated as sh.
| Wavenumber cm-1 | Technique | Vibration assignment | Reference |
| 398,416,417 | IR | rock | [12] |
| 492, 510sh,526,528,555 | IR | [13,15,16] | |
| 592-593 | IR | [13,14,15] | |
| 606 | IR | [20] | |
| 805,817,933,934 | IR | asymmetric stretching | [12] |
| 852,862,955,957, | IR | symmetric stretching | [12] |
| 816-817, 840, 903, 919-933, 960sh | IR | [15] | |
| 1400,1384 | IR | [13] | |
| 1621, 1623 | IR | bending | [11,13,15] |
| 2083, 2088, 2090,2098 2154sh, 2145 | IR | [11,13,14,15] | |
| 3386, 3000, 3338 | IR | stretching | [11,13,15] |
| 535, 665 | Raman | oxyhydroxide | [27] |
| 750-950 | Raman | stretching | [27] |
| 858-860 | Raman | ) mixed oxide | [25,26] |
| 987 | Raman | sulfate ions | [27] |
| 1709 | Raman | bending | [13] |
| 2095,2145 | Raman | [25] | |
| 3600-3000 | Raman | stretching | [13] |
Table 2.
Assignments of the main bands Cr(III) observed in the Raman spectra.
| Wavenumber cm-1 | Vibration assignment | Reference |
| 526–540 | [13,29,30,32,34,35,39] | |
| 550-580 | [33] | |
| 550-552 | [42,43] | |
| 625 | [42] | |
| 995, 1050, 1155 | [32,34] | |
| 538-540,543 | [33,34] | |
| 255 | * | [42] |
| 446 | * | [42] |
| 800 | bound to Au | [42] |
| 848 | mixed oxide Cr(III)/Cr(VI) ** | [42,44] |
| 946 | dichromate | [42] |
* The solution contained 200 μM and 0.1 M
Table 3.
Raman bands of commercial Cr(VI) baths and chromate in aqueous solutions. There is a symmetric stretch, which implies that bonds stretch simultaneously in a symmetrical manner (). There are doubly degenerate vibrations, where bonds bend symmetrically into two independent modes with the same energy (). There is an asymmetric bend () or asymmetric stretch (), where bonds stretch or bend in three independent ways [59]. The band shoulder is abbreviated as sh. The Raman shift is independent of the excitation wavelength. , antisymmetric stretching; , symmetric stretching; , bending deformation.
| Wavenumber cm-1 | Bath or Solution | Assignee | Reference |
| 373 | Alodine | unassigned | [26] |
| 944sh, 906 | Alodine | [13,26] | |
| 1050 | Alodine | [13,26] | |
| 1648 | Alodine | bending | [13,26] |
| 2134 | Alodine | [13,26] | |
| 3600-3000 | Alodine | [13] | |
| 347-349 | Electroplated | [53,54] | |
| 364,368-398 | Electroplated | [52,53,54] | |
| 844-847 | Electroplated | [52,53,54,57] | |
| 884-891 | Electroplated | [53,54] | |
| 217,220 | [52,53] | ||
| 320 | [52] | ||
| 340 | [52] | ||
| 364,365 | [52,53] | ||
| 553 | [52] | ||
| 558 | [5][] | ||
| 772,783 | [53,5][] | ||
| 833sh | [5][] | ||
| 898 | [53] | ||
| 903,904 | [52,53] | ||
| 942,946,943 | [52,53,57] |
Disclaimer/Publisher’s Note: The statements, opinions and data contained in all publications are solely those of the individual author(s) and contributor(s) and not of MDPI and/or the editor(s). MDPI and/or the editor(s) disclaim responsibility for any injury to people or property resulting from any ideas, methods, instructions or products referred to in the content. |
© 2025 by the authors. Licensee MDPI, Basel, Switzerland. This article is an open access article distributed under the terms and conditions of the Creative Commons Attribution (CC BY) license (http://creativecommons.org/licenses/by/4.0/).
Copyright: This open access article is published under a Creative Commons CC BY 4.0 license, which permit the free download, distribution, and reuse, provided that the author and preprint are cited in any reuse.


