Submitted:
28 September 2025
Posted:
30 September 2025
Read the latest preprint version here
Abstract
Background/Objectives: T cell bispecific antibodies (TCBs) activate T cells for the killing of tumor cells upon binding to tumor antigens resulting in the activation of T cell receptor signaling providing the so-called signal 1 to T cells. In order to enhance and sustain the activity of T cells a co-stimulatory signal 2 is required. Here we describe CEACAM5-targeted 4-1BBL antibody fusion protein for combination with the CEA-TCB cibisatamab investigating the relationship of CEACAM5 epitope and activity. Methods: CEACAM5-targeted bispecific 4-1BBL antibody fusion proteins (CEA-4-1BBL) were generated using different CEACAM5 antibodies and characterized in vitro in Jurkat-4-1BB reporter and PBMC cell assays. The impact of shed CEA on in vitro activity was studied. In vivo efficacy was assessed in human stem cell humanized NSG mice xenograft models bearing MKN-45 and HPAFII tumors. Results: MFE23-4-1BBL and Sm9b-4-1BBL showed superior functional activity in Jurkat-4-1BB reporter and in primary T cell assays when combined with the CD3 antibody V9, whereas T84.66-LCHA-4-1BBL and A5B7-4-1BBL performed better when combined with CEA-TCB. In humanized NSG mice xenograft models T84.66-LCHA-4-1BBL showed overall the best anti-tumor efficacy. Concluions: In vitro assays and in vivo studies lead to different conclusions showing that in order to select the best candidate screening with different cell assays and in vivo efficacy studies together with the potential combination partner are essential. Based on the totality of data the T84.66-LCHA-4-1BBL antibody fusion protein based on the CEACAM5 antibody T84.66-LCHA was selected as optimal costimulatory antibody fusion protein for the combination with the CEA-TCB cibisatamab.
Keywords:
CEACAM5
; 4-1BB
; TNFRSF9
; CD137
; membrane close
; membrane distal
; epitope
1. Introduction
Checkpoint inhibitory and bispecific antibodies have shaped cancer immunotherapy strategies during the decade [1,2]. Tumor infiltrating T cells can either receive a “natural” activation signal 1 through the T cell receptor (TCR) from its interaction with peptide-MHC complexes (endogenous immunity), or “artificially” by a T cell bispecific antibody (TCB) simultaneously bound to a tumor cell surface antigen and the CD3e chain of the TCR complex leading to redirected T cell-mediated tumor cell killing (synthetic immunity). With the aim to sustain the TCR-driven signal 1 to T cells, we have previously described the tumor (stroma) targeted 4-1BBL antibody fusion proteins CD19-4-1BBL and FAP-4-1BBL that can bind simultaneously to the costimulatory receptor 4-1BB/CD137 and to the tumor (stroma) antigens CD19 or FAP, respectively [3]. These 4-1BBL antibody fusion proteins provide the so-called signal 2 to 4-1BB expressing T cells, either in cis by binding to CD19-expressing malignant B cells in combination with the CD20-TCB glofitamab [4] or in trans by binding to FAP-expressing tumor adjacent tumor fibroblasts in combination with the carcinoembryonic antigen cell adhesion molecule 5- (CEACAM5-) TCB [5]. Here we describe the design, optimization and characterization of novel CEACAM5-targeted CEA-4-1BBL antibody fusions proteins with the goal to provide signal 2 in cis to T cells receiving their signal 1 from CEA-TCB (cibisatamab) independent of FAP expression on fibroblasts.
CEACAM5 , also known as CEA or CD66e, is a highly glycosylated cell surface protein, anchored in the membrane via a glycosylphosphatidylinositol (GPI) and normally functions as an adhesion molecule that can interact with CEACAM6 and CEACAM1 and together play a pivotal role in cancer biology [6]. CEACAM5 expression has been shown to be important for metastasis in colon cancer but also for immune evasion of the tumor cells [6,7]. CEACAM5 is overexpressed in various epithelial malignancies, including gastric, colorectal, pancreatic or non-small cell lung cancer. For colorectal cancer, shed CEA is an FDA-approved diagnostic tumor marker, with potential to become a prognostic maker [6,7].
In this study several CEA-4-1BBL antibody fusion proteins directed against different epitopes of CEACAM5 were generated. The selected CEACAM5 antibodies recognize membrane-distal or membrane-proximal epitopes and were tested for functionality in vitro and in vivo. Reporter T cell assays were applied for a ranking of functionality. Targeting membrane-distal CEACAM5 epitopes mediated better T cell activation in reporter cells compared to targeting membrane-proximal epitopes when tested as a monotherapy. In contrast to the reporter cell line assays two different PBMC-based in vitro activation assays in combination with different signal 1 providers were not able to provide a clear differentiation between the different CEACAM5 targeting antibodies. Notably, in the tested in vivo models the CEA-4-1BBL antibody fusions protein targeting the membrane-proximal CEACAM5 epitope showed a tendency for improved tumor control in combination with CEA-TCB. These data indicate that the efficacy of the tested CEA-4-1BBL antibody fusion proteins may depend on the combination partner. Based on the totality of data CEA-4-1BBL antibody fusion protein constructed with the CEACAM5 antibody T84.66-LCHA was selected as optimal costimulatory antibody fusion protein for the combination with CEA-TCB (cibisatamab).
The data presented indicate that reporter cell line assays can be limited in translatability and that in order to select the best candidate screening with different cell assays and in vivo efficacy studies together with the potential combination partner are essential.
2. Materials and Methods
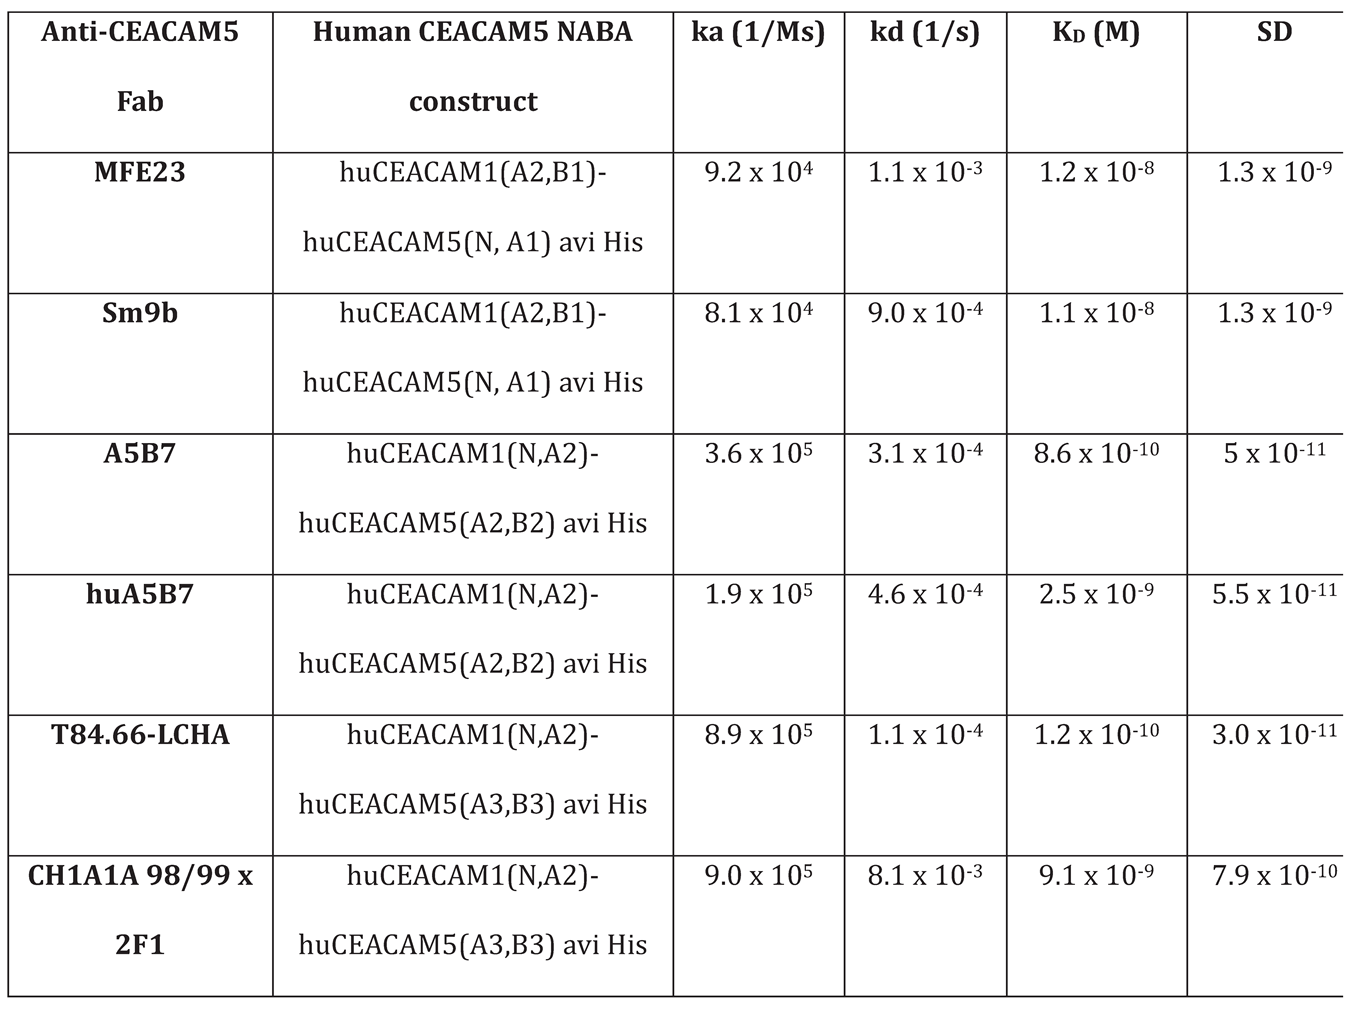
Reagents: CEA–4-1BBL molecules, non-binding control DP47–4-1BBL, CEA-TCB (cibisatamab), huCEACAM5 peptides (NCBI EDL26990.1) were generated by Roche Innovation Centers Zurich or Munich. CEA–4-1BBL and DP47-4-1BBL were assembled using the following polypeptide chains: a) two ectodomains of 4-1BBL (UniProtKB P41273) fused to CL followed by human IgG1 Fc-knob chain, b) one ectodomain of 4-1BBL fused to CH1, c) a CEACAM5 or DP47 VH-CH1 fused to human IgG1 Fc-hole chain and d) a CEACAM5 or DP47 VL-CL. As previously described a knob into hole technology (kih) [8], a crossed CH1 and CL with charge mutations, [9,10] and a PGLALA mutations have been introduced [11]. Molecules were produced in HEK293-EBNA or CHO cells and purified by affinity chromatography followed by size exclusion chromatography [3]. The monomer content (>95%), integrity (>95%), and mass of the molecule was determined. Anti-CEACAM5 Fabs were prepared by plasmin (Roche, 10602361001) digestion of the respective human IgG1 as recently described [3]. The NABA constructs were used as antigens for the anti-CEACAM5 Fabs. Since the anti-CEACAM5 binders recognize different CEACAM5 domains the following NABA constructs, containing N, A or B domains of human CEACAM1 and CEACAM5, were prepared (Table 1). The constructs were purified by standard chromatographic methods (chelating chromatography and preparative SEC).
Surface plasmon resonance: All SPR experiments were performed on a Biacore T200 at 25 °C with HBS-EP as a running buffer (0.01 M HEPES pH 7.4, 0.15 M NaCl, 3 mM EDTA, 0.005% surfactant P20, Cytiva). Anti-His specific antibody (Qiagen, 34660) was coupled on a CM3 chip at pH 5.0 using the standard amine coupling kit (Cytiva). The NABA constructs were captured with a flow rate of 10 μL/minute for 30 or 40 seconds on flow cell 2 (Supplementary Table S1). Dilution series of anti-CEACAM5 Fab was passed on both flow cells at 30 μL/minute for 150 seconds to record the association phase. The dissociation phase was monitored for 300 seconds and triggered by switching from the sample solution to HBS-EP. The chip surface was regenerated after every cycle using a double injection of 60 seconds Glycine pH2.0. Bulk refractive index differences were corrected for by subtracting the response obtained on the reference flow cell, where no NABA construct was captured. The affinity constants were derived from the rate constants by fitting to a 1:1 Langmuir binding curve using the Biaeval software (GE Healthcare). The results are the average of three experiments.
Cell lines: Human gastric cancer cell line MKN-45 (DSMZ ACC 409), human colon adenocarcinoma cell lines CX-1 (DSMZ ACC 129) and HT-29 (ATCC HTB-38) were cultured in RPMI 1640 (Gibco 42401) supplied with 10% FBS (Gibco 16140 or Sigma F4135) and 2 mM GlutaMAX (Gibco 35050). Human pancreatic adenocarcinoma cell line HPAF-II (ATCC CRL-1997) was cultured in MEM/EBSS (Gibco 21090) supplied with 10% FBS, 2 mM GlutaMAX, 1% MEM-Nonessential amino acids (Sigma-Aldrich M7145), 1 mM Sodium-Pyruvate (Sigma-Aldrich S8636). Human colorectal adenocarcinoma cell line LS-180 (ATCC CL-187) was cultured in MEM/EBSS supplied with 10% FBS and 2 mM GlutaMAX. LoVo (ATCC CCL-229) was cultured in DMEM/F12 (Gibco 31331) supplied with 10% FBS and 2 mM GlutaMAX. All tumor cell lines grew adherent and were split 2-3 times per week keeping a confluence between 20-80%. Jurkat-human-4-1BB-NFB-luc2 (Promega CS196004) reporter cell line was cultured in RPMI 1640 supplied with 10% FBS, 2 mM GlutaMAX, 1 mM Sodium-Pyruvate, 1% (v/v) MEM-nonessential Amino acid solution, 25 mM HEPES (Sigma Life Science H0887), 600 μg/ml G-418 (Roche 04727894001) and 400 μg/ml Hygromycin B (Roche 10843555001). The suspension cells were split twice per week keeping a cell density of 0.2-1.2 x 10⁶ cells/mL. CHO-k1 (ATCC CCL-61) cells were transfected with transfection plasmid pETR19312 to express cynomolgus monkey CEACAM5 and CHO-k1-cynoCEACAM5 clone 8 was selected. CHO-k1-cynoCEACAM5 clone 8 cell line was cultured in DMEM/F-12 (Gibco 31330) supplied with 10% FBS and 6 μg/mL Puromycin (Gibco A1113802) and split 3 times per week keeping a keeping a confluence between 20-80%. To generate CHO-k1CEACAM5 clone 11 and CHO-k1-huCEACAM5 clone 12 cell lines CHO-k1 (ATCC CCL-61) cells were transfected with transfection plasmid pETR14582 to express human CEACAM5. Cells were cultured in DMEM/F-12 (Gibco 31330) supplied with 10% FBS and 500 μg/mL Zeocin (Gibco R25001) and split 3 times per week keeping a keeping a confluence between 20-80%.
Cell binding assay: Tumor cell lines or CEACAM5 transfected CHO-k1 cells were harvested using 0.05% Trypsin-EDTA (Gibco 25300) for 10 minutes, washed and resuspended in DPBS (Gibco 14190). 2 x 10⁵ cells/well or 3 x 10³ cells/well were seeded to a round bottom 96-well plate (Cellstar 650185) or a round bottom 384-well plate (Corning 3830) respectively. Cells were stained with fixable viability stain eF450 (eBioscience 65-0863-18) according to manufacturer’s recommendations. Cells were washed with DPBS and incubated for 1 hour at 4 °C in flow cytometry staining buffer containing different concentrations (starting concentration 300 nM titrated in 1:5 or 1:4 dilution steps) of CEA-4-1BBL molecules. Cells were washed with DPBS and incubated for 30 minutes in flow cytometry staining buffer containing 2.5 μg/mL PE-conjugated secondary antibody (Jackson ImmunoResearch 109-116-098). Cells were washed, fixed in PBS with 1% Paraformaldehyde for 15 minutes. Cells were acquired using the MACS Quant X (Miltenyi Biotec) coupled to a Cytomat line 2, a 4 °C fridge and plate handling system (Thermo Fisher Scientific). Data were analyzed using FlowJo Version 10 to gate on living cells and evaluating the median fluorescence intensity of the PE-conjugated secondary antibody.
Reporter cell line assay: NFkB-downstream signaling after 4-1BB activation was measured by co-culturing 2x10³ Jurkat-human-4-1BB-NFB-luc2 reporter cells with 1x10⁴ tumor cells or CEACAM5-transfected CHO-k1 cells in a 384-well flat bottom white plates (Corning 3826). Titrated CEA-4-1BBL molecules were added and plates were incubated for 5 hours at 5% CO2 and 37 °C. For one experiment, a fixed dose of 1 nM CEA-4-1BBL was used and different concentration of soluble CEACAM5 (BioRad PHP282) were added (starting dose 190 nM, titrated in 1:5 dilution steps). Afterwards One-Glo Luciferase reagent (Promega E6110) was added and luminescence was measured for 0.5 seconds/well using a Tecan Spark plate reader.
Human PBMC activation assay: Buffy coats were obtained from Zurich blood donation center in accordance with the Declaration of Helsinki. Donors signed a written informed consent before sample collection. Peripheral blood mononuclear cell (PBMCs) were isolated by Ficoll density centrifugation as following: buffy coat was mixed 1:1 with sterile DPBS (Gibco, 14190-136) and 35 mL of this mixture were layered over 15 mL Histopaque 1077 (SIGMA LifeScience 10771, density 1.077 g/mL) in 50 mL Falcon containers. Containers were centrifuged 30 minutes at 450xg at room temperature without break. The lymphocyte fraction was harvested, pooled and washed several times with DPBS. PBMCs were frozen in 80% FBS and 10% DMSO (Sigma LifeScience D2650) and stored in Vapor Phase. PBMCs were thawed, washed and directly seeded. 7.5 x 10⁴ PBMCs, 2 x 10⁴ 45 Gy irradiated MKN-45 tumor cells, 2nM agonistic anti-human CD3 human IgG1 (clone V9) or titrated concentrations of CEA-TCB in combination with different concentration of CEA-4-1BBL or untargeted control were combined in 200 μL/well of assay medium in a 96 round bottom well plate (TTP 92097). As assay medium RPMI 1640 (GIBCO 42401) supplied with 10% (v/v) FBS, 2 mM GlutaMAX (Gibco 35050), 1 mM Sodium-Pyruvat (Sigma-Aldrich S8636), 1% (v/v) MEM-nonessential Amino acid solution (Sigma-Aldrich M7145) and 50 μM beta-mercaptoethanol were used. Cells were incubated under humidity at 5% CO2 and 37 °C. At day 4 cells were harvested, washed and stained with LIVE/DEAD Fixable Aqua Dead Cell Stain (Molecular Technology, L34957) according to manufacture’s recommendations. Afterwards cells were stained in 50 μL/well flow cytometry staining buffer containing 0.3 μg/mL anti-human CD25-APC (BioLegend 301016, clone BC96), 0.67 μg/mL anti-human CD4-BV421 (BioLegend 300532, clone RPA-T4) and 0.67 μg/mL anti-human CD8-APC/Cy7 (BioLegend 301016, clone RPA-T8) for 30 minutes at 4 °C. Cells were washed, fixed in PBS with 1% paraformaldehyde for 15 minutes and acquired using the Canto II (BD). Data was analyzed using FlowJo Version 10 to gate on living CD4 and CD8 T cells to determine the frequency of CD137+ or CD25+ cells of parental populations.
Mouse in vivo studies: The experimental study protocol was reviewed and approved by local government (P2011/128, ZH193-2014 and ZH223/17). NOD.Cg-PrkdcscidIL2rgtm1Wjl/SzJ (NSG) were supplied by The Jackson Laboratory. Female NSG mice
were bred by Charles River Laboratories (Lyon, France). After arrival, animals were maintained for one week to get accustomed to the new environment and for observation. Continuous health monitoring was carried out on a regular basis. NSG mice were at the age of 4-5 weeks at start of human stem cell engraftment and mice were maintained under specific-pathogen-free condition with daily cycles of 12 hours light / 12 hours darkness according to committed guidelines (GV-Solas; Felasa; TierschG). To generate human stem cell-engrafted (HSC)-NSG mice, NSG mice were administered 15 mg/kg busulfan (Busilvex, Pierre Fabre) intraperitoneally (i.p.). Twenty-four hours later, each mouse received an intravenous (i.v.) injection of 1x10⁵ human CD34+ cord blood cells (purchased from STEMCELL Technologies). At 15-17 weeks post engraftment, mice were screened and only mice with more than 25% human CD45+ cells and a T cell count greater than 80 cells/μL were enrolled in the studies. For tumor inoculation, 1x10⁶ tumor cells were resuspended in a 1:1 mixture of RPMI 1640 (Gibco Life Technologies, 42401) and GFR Matrigel (Corning 734-0269) to a total volume of 100 μL and injected subcutaneously into the flank. Tumor volume was calculated using the formula V = length x width2 x 0.5 and used to randomize groups one day before treatment. Tumor-bearing mice (average tumor size 200 mm3, randomized groups) were treated intravenously with vehicle, 2.5 mg/kg CEA-TCB alone or in combination with 1, 3, or 10 mg/kg CEA–4-1BBL molecules). Tumor volume was calculated using the formula V = length x width2 x 0.5.
Flow cytometry measurement ex vivo: For ex vivo flow-cytometry analysis, tumor single-cell suspensions were prepared using the gentleMACS Octo Dissociator (Miltenyi Biotec, Germany) according to the manufacturer’s protocol and subsequently analyzed by flow cytometry. Formaldehyde-fixed tumor tissues were utilized for immunohistochemistry. Digested tumor single cell suspension were stained in all with 1:500 diluted live/death fixable blue dye (molecular probes L-23105) according to manufacturer’s recommendation. Cells were washed and stained in flow cytometry staining buffer containing anti-mouse CD45-AF700 (BioLegend 103128, clone 30-F11), anti-human CD3-BV605 (BD 750985), anti-human CD4-BV421 (BioLegend 317434, clone OKT4), all diluted 1:300 and incubated for 30 minutes at 4 °C in the dark. Cells were washed fixed and permeabilized using Permeablization buffer 10x from the FoxP3 Transcription Buffer staining kit (eBioscience, 00-5523-00). Cells were stained in perm-buffer containing 1:300 diluted anti-human FoxP3-PE and incubated for 30 minutes at 4 °C in the dark. Cells were acquired with a 5-laser BD Fortessa flow cytometer and analyzed.
Immunohistology ex vivo: Immunohistochemical staining was performed in formalin-fixed paraffin-embedded tissue (FFPET) as described (3, 4] with anti-human CD8 (Cell Marque Tissue Diagnostic, clone SP16), anti-human CD3 (ThermoFischer Scientific MA5-13473, clone C8/144B). Human CD3+ and human CD8+ cells were quantified with Definiens software (Definiens).
Images: Shown pictograms were designed with Biorender.com.
Statistics: Binding and activation values were baseline corrected. Curves were analyzed by calculating the area under the curve (AUC)- AUC values were then used to calculate significant differences using an unpaired one-way ANOVA test.
3. Results
3.1. CEA-4-1BBL Antibody Fusion Protein Design
Following the recently published molecule design different CEA-4-1BBL antibody fusion proteins were generated [3] using five different human CEACAM5 specific antibodies for tumor targeting (Figure 1A). As non-tumor targeted control, the previously published DP47-4-1BBL was applied [3]. This construct does not bind to the cell surface of cancer cells. CEA-4-1BBL was specifically designed for combination with CEA-TCB (cibisatamab, RG7802) that contains the human CEA-specific clone CH1A1A98/99x2F1 targeting the membrane-proximal CEACAM5 domain B3 [5,12]. Thus, to allow combination of CEA-TCB with CEA-4-1BBL only CEACAM5 specific antibodies were selected which do not share the same CEACAM5 epitope and do not compete for binding with CEA-TCB (Figure 1B). The following clones known from the literature were chosen: 1) the humanized clone T84.66-LCHA binding domain A3 [11], 2) the parental clone A5B7 and its humanized version clone huA5B7 binding domain A2 [14,15] and 3) the parental clone MFE23 [16,17] and its humanized, stabilized and affinity matured version clone Sm9b binding to domain A1 [18]. All these five CEACAM5 antibodies recognize soluble CEACAM5, a product induced by glycosylphosphatidylinositol-phospholipase D cleavage activity [19], as their epitopes are above the shedding site (Figure 1B). In contrast, the epitope of CH1A1A98/99x2F1 applied in CEA-TCB is close to the shedding site and binding to soluble CEACAM5 as well as inhibition by by soluble CEACAM5 is considered negligible [20,21] as it has been shown for its parental clone PR1A3 that is not inhibited.
3.2. CEA-4-1BBL In Vitro Characterization
The affinity determination of the CEACAM5 targeting Fab fragments for CEACAM5 NABA constructs covering the N-A1-B2-A2 domains (Supplementary Table S1) via surface plasmon resonance (SPR) demonstrated that T84.66-LCHA and A5B7 have the highest and MFE23 and Sm9b the lowest affinity (Table 1). To test the cellular binding of the different CEA-4-1BBL antibody fusion proteins six different human tumor cell lines were chosen representative for high to low CEACAM5 surface expression as described previously [5]. These different CEACAM5+ tumor cell lines were incubated with titrated concentrations of CEA-4-1BBL and binding to cells was detected by flow cytometry (Figure 1C). The measured binding as median fluorescence intensity (MdFI) showed that Sm9b-4-1BBL and its parental variant MFE23-4-1BBL displayed similar MdFI values, which were higher than for A5B7-4-1BBL or T84.66-LCHA-4-1BBL (Figure 1E, Supplementary Table S2). The discrepancy between affinity determined by surface plasmon resonance and cell binding is likely caused by a different epitope accessibility and different glycosylation profiles between recombinant NABA-CEACAM5 constructs and full length CEACAM5 expressed on tumor cell surface. To test if the differences in tumor cell binding translate into differences in functionality Jurkat-human-4-1BB-NFB-luc2 reporter cell line assays were performed (Figure 1D) using the same tumor cell lines as in the cell binding assay (Figure 1F, Supplementary Table S3). MFE23-4-1BBL and Sm9b-4-1BBL displayed comparable functionality similar to the cell binding results. On the other hand, A5B7-4-1BBL and T84.66-LCHA-4-1BBL, which showed lower overall binding behavior, displayed lower reporter cell functionality with T84.66-LCHA-4-1BBL showing the lowest activity (Figure 1F).
In subsequent experiments it was tested whether these differences in function can also be observed in primary T cell assays. For this purpose human PBMCs from different healthy donors were activated in the presence of CEACAM5 expressing MKN-45 tumor cells with 2 nM agonistic anti-human CD3 clone V9 human IgG1 (Figure 2B) or titrated concentrations of CEA-TCB (Figure 2C). This activation step was introduced to induce sufficient 4-1BB expression as resting T cells do not express 4-1BB constitutively [3]. Interestingly, in both assays, in presence of signal 1 we could not observe major differentiation between the different CEA-4-1BBL molecules as they were observed in the Jurkat-human-4-1BB-NFB-luc2 reporter cell line assays using CEA-4-1BBL as a monotherapy (Figure 2D,E, Supplementary Tables S4 and S5). In the primary T cell assays the observed differences were minimal, and we only a tendency that MFE23-4-1BBL and Sm9b-4-1BBL performed better when combined with agonistic anti-human CD3 clone V9 (Figure 2D) could be observed whereas T84.66-LCHA-4-1BBL and A5B7-4-1BBL appeared to perform better when combined with CEA-TCB (Figure 2F). This demonstrates that the resolution of PBMC activation assays is smaller and different to the reporter cell assay. Furthermore, it demonstrated that the signal 1 provider, CD3 antibody versus TCB, may have an impact on the activity of the CEA-4-1BBL fusion proteins.
As the PBMC based assays had a longer incubation time of four days than the reporter cell line assay with five hours, subsequent experiments investigated whether the accumulation of soluble CEACAM5 causing a reduction in the binding to cell-bound CEACAM5 could provide an explanation for the findings. Indeed, over-expression of CEACAM5 in colorectal cancer correlates with soluble CEACAM5 concentrations in serum and in cancer patients’ concentrations from 0.002 to 5.187 g/mL have been reported with soluble CEACAM5 values generally correlating with increased cancer stage [18]. To test whether soluble human CEACAM5 can serve as a sink leading to inhibition of CEA-4-1BBL functionality a fixed concentration of 1 nM CEA-4-1BBL was chosen (Figure 3B). By adding increasing concentrations of soluble human CEACAM5 in the Jurkat-human-4-1BB-NFB-luc2 reporter cell line assay the IC50 values was evaluated. In these experiemets the strongest inhibition was seen for T84.66-LCHA-4-1BBL and the lowest for A5B7-4-1BBL and MF23-4-1BBL (Figure 3B). Therefore, the functional differences in the different assays could not be explained with the sole impact of soluble CEACAM5.
3.3. Cynomolgus Cross-Reactivity
To select the best molecule for further development cynomolgus cross-reactivity of the different CEA-4-1BBL molecules was determined in subsequent experiments. The human 4-1BBL cynomolgus cross-reactivity had already been confirmed [3], so that only the cynomolgus cross-reactivity of the different CEACAM5 binders was tested. For this purpose CHO-k1 cell lines were generated stably expressing either human or cynomolgus monkey CEACAM5. To compare the expression levels of the different chosen CHO-k1 clones a human/Cynomolgus cross-reactive anti-human CD66 APC-conjugated detection antibody was chosen. Based on the expression data CHO-k1-cynoCEACAM5 clone 8 with good cynomolgus monkey CEACAM5 expression was selected for subsequent experiements. Furthermore, CHO-k1-huCEACAM5 clone 12 and clone 11 were selected as controls (Figure 3C). With these three cell lines cell binding assays were performed (Figure 3D, Supplementary Table 6). Only A5B7-4-1BBL showed cyno-cross-reactivity although with reduced binding to cynomolgus monkey CEACAM5. A5B7-4-1BBL bound much weaker to CHO-k1-cynoCEACAM5 clone 8 (EC50= 41.8 nM) than to CHO-k1-huCEACAM5 clone 12 (EC50=21.69 nM) although both clones displayed a similar CEACAM5 expression (Figure 3C). As A5B7 was the only cyno-cross-reactive clone, it was humanized and converted into the CEA-4-1BBL format (huA5B7-4-1BBL). The humanization lead to slightly reduced binding to CHO-k1-huCEACEACAM5 cells, however unfortunately the binding to CHO-k1-cynoCEACAM5 clone 8 decreased dramatically by the humanization (Figure 3D, Supplementary Table S6). To test if the low binding to cynomolgus monkey CECAM5 had an impact on functionality the same transgenic CHO-k1 cell lines were used in the functional Jurkat-human-4-1BB-NFB-luc2 reporter activation assay (Figure 3E, Supplementary Table S7). As expected only A5B7-4-1BBL and huA5B7-4-1BBL induced reporter cell line activation in the presence of CHO-k1-cynoCEACAM5. However, both antibody fusion proteins showed a lower activity with CHO-k1-cynoCEACAM5 than with CHO-k1-humanCEACAM5 controls. Interestingly huA5B7-4-1BBL functionality was not as much reduced compared to A5B7-4-1BBL as the binding to CHO-k1-cynoCEACAM5 would have suggested. Furthermore, no significant differences between CHO-k1-huCEACAM5 clone 11 and CHO-k1-huCEACAM5 clone 12 were observed in the reporter cell line assay (Figure 3E) although both cell lines had quite differential CEACAM5 expression (Figure 3C). It is important to mention that the CHO-k1 cell lines express high levels of CEACAM5 compared to tumor cell lines (Figure 1D) and that the saturation of the reporter cell line assay activity with CHO-k1-huCEACAM5 clone 11 might have been reached.
3.4. In Vivo Efficacy Studies
Finally, the potential of the different CEA-4-1BBL antibody fusion proteins as signal 2 provider in combination with CEA-TCB was tested in vivo in human CD34+ stem cell humanized NSG mice xenograft models bearing human gastric adenocarcinoma MKN-45 or human pancreatic adenocarcinoma HPAFII. Both models exhibit comparable and high CEACAM5 expression as well as low CD3 T cell infiltration at baseline (Figure 4A,B) making them xenograft models with good translational potential for colorectal, gastric and pancreatic cancer. Notably, T84.66-LCHA-4-1BBL consistently demonstrated superior tumor growth control across all three experiments as a combination partner when compared to the other CEA-4-1BBL antibody fusion proteins and CEA-TCB monotherapy. However, the differences were not statistically significant in each individual experiment (Figure 4C–E). To establish this activity further and evaluate the dose respone relationship , T84.66-LCHA-4-1BBL was evaluated at different doses in the MKN45/3T3 co-grafting tumor model [3]. All three doses (1,3 and 10 mg/kg) of T84.66-LCHA-4-1BBL demonstrated comparable efficacy (Figure 5A) and induced similar immune-pharmacodynamic changes, as determined by flow cytometry analysis of human CD4 and CD8 T cell counts per mg of tumor (Figure 5C). Although there was an increase of CD8 T cell infiltration into the tumor measured by immunohistochemistry at the 3 mg/kg dose (Figure 5C,D) and cytokine accumulation in the tumor at endpoint day 44 (Figure 5F) these differences were not statistically significant. Based on the totality of the in vivo and PBMC activation data in combination with CEA-TCB, T84.66-LCHA-4-1BBL was chosen as the lead candidate based on its overall activity. Importantly these outcomes were very different to the reporter cell line assay data, where T84.66-LCHA-4-1BBL showed the lowest activity as a monotherapy. Therefore, the reporter cell line assay in this special case was not the choice of assay for the selection of the lead candidate.
4. Discussion
For colorectal cancer therapy development CEACAM5 is a well-studied marker, and soluble CEA serves as FDA-approved diagnostic tumor marker [7,23]. Thus, CEACAM5 has a high potential to serve as a target for cancer immunotherapy. Notably CEACAM5 has been described to display immune cell inhibitory functions. For example, CEACAM5 expressed by tumor cells can interact with CEACAM1 expressed by NK cells and lead to the inhibition of NK-cell-mediated tumor target cell killing [24]. Furthermore, it has been proposed that CEACAM5 can directly interact with CD1d via its B3 domain and with CD8α via its N-domain leading to the formation of suppressive CD8 regulatory T cells [25]. CEACAM5 expression in pancreatic cancer also correlates with an impairment of the tumoricidal function of M1 macrophages and neutrophils although the mechanism is not fully understood [26].
Here we tested different CEACAM5-specific antibodies to see which of these when used as targeting antibodies in CEA-4-1BBL fusion proteins would lead to the best CEA-4-1BBL-mediated tumor control in combination with the CEA-TCB cibisatamab. Interestingly in vitro MFE23-4-1BBL and Sm9b-4-1BBL (clones with membrane distal CEACAM5 epitope) performed superior in binding on tumor cells and in the functional Jurkat-human-4-1BB-NFB-luc2 reporter cell assays. Similarly, with anti-CD3 human IgG as signal 1 provider both molecules had a tendency to perform better in the PBMC activation assay. In contrast, T84.66-LCHA-4-1BBL targeting a membrane proximal epitope showed weaker binding on tumor cells and the lowest activity in the reporter cell assays. However, when combined with CEA-TCB as signal 1 provider T84.66-LCHA-4-1BBL showed overall the best profile, both in a human PBMC assay and in vivo as most relevant model in two different xenograft models in human CD34+ stem cell humanized NSG mice, although differences were not significant regarding the individual settings.
The location of the tumor target epitope, such as whether the binder-specific epitope is proximal or distal from the membrane, can influence T cell bispecific antibody function. Membrane-proximal epitopes are generally considered beneficial for TCBs as they lead to a close functional synapse formation between T cell and tumor cell. Bluemel and colleagues used a MCSP/CD3 bispecific molecule (BiTE) comparing different MCSP-specific binders which recognized either membrane-proximal, central or membrane-distal domains [27]. Membrane-proximal binding led to the strongest T cell-mediated tumor cell killing in vitro. Further an EpCAM T cell bispecific antibody was tested, where not the anti-EpCAM clone but the location of the recognized epitope was modified by introducing spacers to move the same EpCAM epitope more distal. In this case, creating a membrane-distal location led to the loss of bispecific-mediated T cell cytotoxicity [27]. Li and colleagues have studied an FcRH5/CD3-bispecific antibody format. The membrane-proximal domain FcRH5 binder demonstrated the strongest in vitro functionality, and the membrane-distal binder mediated a similar tumor cell killing if the epitope was moved membrane-proximal through genetic engineering [28]. Chen and colleagues investigated BCMA/CD3-bispecific and Flt3/CD3 bispecific molecules and their specific lysis capacity depending on epitope localization, affinity and molecular design of the bispecific antibodies. They showed that molecular design and tumor-target epitope location can decouple cytotoxicity and cytokine release and must be coordinated to achieve the best synapse and tumor killing results. Antigen-binding affinities, on the other hand, appear to be positively correlated with cytotoxicity and cytokine release [29].
The improved performance of membrane-distal CEACAM5 binding CEA-4-1BBL bispecific molecules in vitro in the Jurkat-human-4-1BB-NFB-luc2 reporter cell line assay was therefore surprising, as in general a smaller interspace has been considered superior due to mimicking better the natural synapse formation. However, the improved performance of MFE23-4-1BBL and Sm9b-4-1BBL could be partially explained by the better tumor cell occupancy and/or epitope access leading potentially to a higher accumulation of 4-1BB receptors on the effector T cells. In order to trigger TCR signaling in Jurkat reporter cells physical immobilization and crosslinking may be more important than the actual synapse formation. Accordingly, this ranking was not that obvious in the PBMC based activation assays. In fact, in vivo T84.66-LCHA-4-1BBL displayed the tendency of the best tumor growth control in combination with cibisatamab over several in vivo studies and models. Importantly, testing in the in vitro PMBC activation assay or in vivo requires presence of an active signal 1, whereas the Jurkat reporter cell line express works without additional signal 1 provision, and therefore may not reflect the impact of functional synapse formation in the presence bispecific molecules targeting two different CEACAM5 epitopes at the same time. Therefore, the reporter cell line assay in this particular case cannot be considered as assay of choice for the selection of bispecific lead candidates. Based on these findings in vitro reporter cell line functionality may in general not be to the preferred strategy to identify the most active 4-1BB costimulatory fusion protein and a broader testing implementing potential T cell bispecific combination partners and in vivo experiments is recommended.
Based on the totality of the PBMC activation and in vivo data in combination with CEA-TCB, T84.66-LCHA-4-1BBL was chosen as the lead candidate due to its overall activity profile. Due to the discontinuation of the clinical development of CEA-TCB (cibisatamab) further preclinical development of T84.66-LCHA-4-1BBL was halted.
Supplementary Materials
The following supporting information can be downloaded at: Preprints.org, Table S1: NABA constructs and conditions used for determining the affinity constants of the anti-CEACAM5 Fabs via Surface plasmon resonance (SPR); Table S2: EC50 in nM and area under the curve (AUC) values of binding curves to different CEACAM5 expressing tumor cell lines shown in Figure 1E; Table S3: EC50 in nM and area under the curve (AUC) values of activation curves of Jurkat-human-4-1BB-NFB-luc reporter cell line in the present of different CEACAM5 expressing tumor cell lines shown in Figure 1F; Table S4: EC50 in nM and area under the curve (AUC) values of activation curves of the PBMC activation assay from two different donors shown in Figure 2D; Table S5: Area under the curve (AUC) values of activation curves of the PBMC activation assay from two different donors shown in Figure 2E; Table S6: EC50 in nM and area under the curve (AUC) values of binding curves to different transgenic cynomolgus monkey or human CEACAM5 expressing CHO-k1 cell lines shown in Figure 3C and 3D; Table S7: EC50 in nM and area under the curve (AUC) values of binding curves to different transgenic cynomolgus monkey or human CEACAM5 expressing CHO-k1 cell lines shown in Figure 3E.
Author Contributions
Conceptualization, C.C., C.F.K, J.S., S.C., M.B., P.U., C.K.; methodology, C.C., C.F.K., J.S., S.L., R.A., R.B., E.B., V.N.; writing—original draft preparation, C.C., C.F.K, C.K.; writing—review and editing, ; visualization, X.X.; supervision, X.X.; project administration, X.X.; funding acquisition, Y.Y. All authors have read and agreed to the published version of the manuscript.
Funding
This research received no external funding
Institutional Review Board Statement
The experimental in vivo study protocol was reviewed and approved by local government (P2011/128, ZH193-2014 and ZH223/17).
Data Availability Statement
Data are available upon reasonable requests from the authors.
Acknowledgments
We thank all contributors from Roche Innovation Centers Basel, Zurich and Munich supporting this work.
Conflicts of Interest
All authors declare employment with Roche during the performance of this study, stock ownership and patents with Roche.
Abbreviations
The following abbreviations are used in this manuscript:
| CEACAM5 | Carcinoembryonic antigen 5 |
| TCB | T cell bispecific antibody |
References
- Klein C, Brinkmann U, Reichert JM, Kontermann RE. The present and future of bispecific antibodies for cancer therapy. Nat Rev Drug Discov. 2024 Apr;23(4):301-319. [CrossRef]
- Surowka M, Klein C. A pivotal decade for bispecific antibodies? MAbs. 2024 Jan-Dec;16(1):2321635. [CrossRef]
- Claus C, Ferrara C, Xu W, Sam J, Lang S, Uhlenbrock F, Albrecht R, Herter S, Schlenker R, Husser T, Diggelmann S, Challier J, Mossner E, Hosse RJ, Hofer T, Brunker P, Joseph C, Benz J, Ringler P, Stahlberg H, Lauer M, Perro M, Chen S, Kuttel C, Mohan PLB, Nicolini V, Birk MC, Ongaro A, Prince C, Gianotti R, Dugan G, Whitlow CT, Kumar K, Sai S, Caudell DL, Burgos-Rodriguez AG, Cline JM, Hettich M, Ceppi M, Giusti AM, Crameri F, Driessen W, Morcos PN, Freimoser-Grundschober A, Levitsky V, Amann M, Grau-Richards S, von Hirschheydt T, Tournaviti S, Molhoj M, Fauti T, Heinzelmann-Schwarz V, Teichgraber V, Colombetti S, Bacac M, Zippelius A, Klein C, Umana P. Tumor-targeted 4-1BB agonists for combination with T cell bispecific antibodies as off-the-shelf therapy. Sci Transl Med. 2019 Jun 12;11(496):eaav5989. [CrossRef]
- Bacac M, Colombetti S, Herter S, Sam J, Perro M, Chen S, Bianchi R, Richard M, Schoenle A, Nicolini V, Diggelmann S, Limani F, Schlenker R, Husser T, Richter W, Bray-French K, Hinton H, Giusti AM, Freimoser-Grundschober A, Lariviere L, Neumann C, Klein C, Umana P. CD20-TCB with Obinutuzumab Pretreatment as Next-Generation Treatment of Hematologic Malignancies. Clin Cancer Res. 2018 Oct 1;24(19):4785-4797. [CrossRef]
- Bacac M, Fauti T, Sam J, Colombetti S, Weinzierl T, Ouaret D, Bodmer W, Lehmann S, Hofer T, Hosse RJ, Moessner E, Ast O, Bruenker P, Grau-Richards S, Schaller T, Seidl A, Gerdes C, Perro M, Nicolini V, Steinhoff N, Dudal S, Neumann S, von Hirschheydt T, Jaeger C, Saro J, Karanikas V, Klein C, Umana P. A Novel Carcinoembryonic Antigen T-Cell Bispecific Antibody (CEA TCB) for the Treatment of Solid Tumors. Clin Cancer Res. 2016 Jul 1;22(13):3286-97. [CrossRef]
- Benchimol S, Fuks A, Jothy S, Beauchemin N, Shirota K, Stanners CP. Carcinoembryonic Antigen, a Human-Tumor Marker, Functions as an Intercellular-Adhesion Molecule. Cell. 1989 Apr 21;57(2):327-34. [CrossRef]
- Thirunavukarasu P, Sukumar S, Sathaiah M, Mahan M, Pragatheeshwar KD, Pingpank JF, Zeh H, Bartels CJ, Lee KKW, Bartlett DL. C-stage in Colon Cancer: Implications of Carcinoembryonic Antigen Biomarker in Staging, Prognosis, and Management. J Natl Cancer Inst. 2011 Apr 20;103(8):689-97. [CrossRef]
- Carter, P. Bispecific human IgG by design. J Immunol Methods. 2001 Feb 1;248(1-2):7-15. [CrossRef]
- Regula JT, Imhof-Jung S, Molhoj M, Benz J, Ehler A, Bujotzek A, Schaefer W, Klein C. Variable heavy-variable light domain and Fab-arm CrossMabs with charged residue exchanges to enforce correct light chain assembly. Protein Eng Des Sel. 2018 Jul 1;31(7-8):289-299. [CrossRef]
- Schaefer W, Regula JT, Bahner M, Schanzer J, Croasdale R, Durr H, Gassner C, Georges G, Kettenberger H, Imhof-Jung S, Schwaiger M, Stubenrauch KG, Sustmann C, Thomas M, Scheuer W, Klein C. Immunoglobulin domain crossover as a generic approach for the production of bispecific IgG antibodies. Proc Natl Acad Sci U S A. 2011 Jul 5;108(27):11187-92. [CrossRef]
- Schlothauer T, Herter S, Koller CF, Grau-Richards S, Steinhart V, Spick C, Kubbies M, Klein C, Umana P, Mossner E. Novel human IgG1 and IgG4 Fc-engineered antibodies with completely abolished immune effector functions. Protein Eng Des Sel. 2016 Oct;29(10):457-466. [CrossRef]
- Bacac M, Klein C, Umana P. CEA TCB: A novel head-to-tail 2:1 T cell bispecific antibody for treatment of CEA-positive solid tumors. Oncoimmunology. 2016 Jun 24;5(8):e1203498. [CrossRef]
- Teijeira A, Migueliz I, Garasa S, Karanikas V, Luri C, Cirella A, Olivera I, Canamero M, Alvarez M, Ochoa MC, Rouzaut A, Rodriguez-Ruiz ME, Sanmamed MF, Klein C, Umana P, Ponz M, Bacac M, Melero I. Three-dimensional colon cancer organoids model the response to CEA-CD3 T-cell engagers. Theranostics. 2022 Jan 1;12(3):1373-1387. [CrossRef]
- Harwood PJ, Britton DW, Southall PJ, Boxer GM, Rawlins G, Rogers GT. Mapping Epitope Characteristics on Carcinoembryonic Antigen. Br J Cancer. 1986 Jul;54(1):75-82. [CrossRef]
- Chester KA, Robson L, Keep PA, Pedley RB, Boden JA, Boxer GM, Hawkins RE, and Begent RHJ. Production and Tumor-Binding Characterization of a Chimeric Anti-Cea Fab Expressed in Escherichia-Coli. Int J Cancer. 1994 Apr 1;57(1):67-72. [CrossRef]
- Boehm MK, Corper AL, Wan T, Sohi MK, Sutton BJ, Thornton JD, Keep PA, Chester KA, Begent RHJ, Perkins SJ. Crystal structure of the anti-(carcinoembryonic antigen) single-chain Fv antibody MFE-23 and a model for antigen binding based on intermolecular contacts. Biochem J. 2000 Mar 1;346 Pt 2(Pt 2):519-28. PMID: 10677374; PMCID: PMC1220881. https://pmc.ncbi.nlm.nih.gov/articles/PMC1220881/.
- Chester KA, Begent RHJ, Robson L, Keep P, Pedley RB, Boden JA, Boxer G, Green A, Winter G, Cochet O, Hawkins RE. Phage Libraries for Generation of Clinically Useful Antibodies. Lancet. 1994 Feb 19;343(8895):455-6. [CrossRef]
- Graff CP, Chester K, Begent R, Wittrup KD. Directed evolution of an anti-carcinoembryonic antigen scFv with a 4-day monovalent dissociation half-time at 37 degrees C. Protein Eng Des Sel. 2004 Apr;17(4):293-304. [CrossRef]
- Yamamoto Y, Hirakawa E, Mori S, Hamada Y, Kawaguchi N, Matsuura N. Cleavage of carcinoembryonic antigen induces metastatic potential in colorectal carcinoma. Biochem Biophys Res Commun. 2005 Jul 22;333(1):223-9. [CrossRef]
- Van De Vyver AJ, Weinzierl T, Eigenmann MJ, Frances N, Herter S, Buser RB, Somandin J, Diggelmann S, Limani F, Lehr T, Bacac M, Walz AC. Predicting Tumor Killing and T-Cell Activation by T-Cell Bispecific Antibodies as a Function of Target Expression: Combining In Vitro Experiments with Systems Modeling. Mol Cancer Ther. 2021 Feb;20(2):357-366. [CrossRef]
- Conaghan P, Ashraf S, Tytherleigh M, Wilding J, Tchilian E, Bicknell D, Mortensen NJ, Bodmer W. Targeted killing of colorectal cancer cell lines by a humanised IgG1 monoclonal antibody that binds to membrane-bound carcinoembryonic antigen. Br J Cancer. 2008 Apr 8;98(7):1217-25. [CrossRef]
- Wild N, Andres H, Rollinger W, Krause F, Dilba P, Tacke M, Karl J. A Combination of Serum Markers for the Early Detection of Colorectal Cancer. Clin Cancer Res. 2010 Dec 15;16(24):6111-21. [CrossRef]
- Thomas J, Klebanov A, John S, Miller LS, Vegesna A, Amdur RL, Bhowmick K, Mishra L. CEACAMS 1, 5, and 6 in disease and cancer: interactions with pathogens. Genes Cancer. 2023 Feb 1:14:12-29. [CrossRef]
- Stern N, Markel G, Arnon TI, Gruda R, Wong H, Gray-Owen SD, Mandelboim O. Carcinoembryonic antigen (CEA) inhibits NK killing via interaction with CEA-related cell adhesion molecule 1. J Immunol. 2005 Jun 1;174(11):6692-701. [CrossRef]
- Roda G, Jianyu X, Park MS, DeMarte L, Hovhannisyan Z, Couri R, Stanners CP, Yeretssian G, Mayer L. Characterizing CEACAM5 interaction with CD8alpha and CD1d in intestinal homeostasis. Mucosal Immunol. 2014 May;7(3):615-24. [CrossRef]
- Shi H, Tsang Y, Yang Y. Identification of CEACAM5 as a stemness-related inhibitory immune checkpoint in pancreatic cancer. MC Cancer. 2022 Dec 9;22(1):1291. [CrossRef]
- Bluemel C, Hausmann S, Fluhr P, Sriskandarajah M, Stallcup WB, Baeuerle PA, Kufer P. Epitope distance to the target cell membrane and antigen size determine the potency of T cell-mediated lysis by BiTE antibodies specific for a large melanoma surface antigen. Cancer Immunol Immunother. 2010 Aug;59(8):1197-209. [CrossRef]
- Li J, Stagg NJ, Johnston J, Harris MJ, Menzies SA, DiCara D, Clark V, Hristopoulos M, Cook R, Slaga D, Nakamura R, McCarty L, Sukumaran S, Luis E, Ye Z, Wu TD, Sumiyoshi T, Danilenko D, Lee GY, Totpal K, Ellerman D, Hotzel I, James JR, Junttila TT. Membrane-Proximal Epitope Facilitates Efficient T Cell Synapse Formation by Anti-FcRH5/CD3 and Is a Requirement for Myeloma Cell Killing. Cancer Cell. 2017 Mar 13;31(3):383-395. [CrossRef]
- Chen W, Yang F, Wang C, Narula J, Pascua E, Ni I, Ding S, Deng X, Chu ML, Pham A, Jiang X, Lindquist KC, Doonan PJ, Van Blarcom T, Yeung YA, Chaparro-Riggers J. One size does not fit all: navigating the multi-dimensional space to optimize T-cell engaging protein therapeutics. MAbs. 2021 Feb 9;13(1):1871171. [CrossRef]
Figure 1.
Evaluating binding to CEACAM5-expressing tumor cells and crosslinking functionality in an analogous reporter cell line assay. (A) Tested CEA-4-1BBL bispecific molecules. (B) different CEACAM5 epitopes and binders (C) Schematic illustration of binding assay. (D) Schematic illustration of functional reporter cell line assay. (E) CEA-4-1BBL binding to different CEACAM5 expressing tumor cells. CEA-4-1BBL molecules were incubated with the indicated tumor cell lines. Specific binding was detected using a PE-conjugated secondary antibody and median of fluorescence intensity (MdFI) was measured by flow cytometry and baseline corrected. Each point is the mean of technical duplicates. Shown is one of three similar experiments. (F) CEA-4-1BBL molecules were titrated and incubated for 5 hours with the reporter cell line Jurkat-human-4-1BB-NFB-luc and different tumor cells in a 1:1 ratio. Emitting luminescence after substrate addition was measured for 0.5 seconds/well as relative light units (RLUs). Each point is the mean of technical duplicates. Shown is one of three independent and similar experiments.
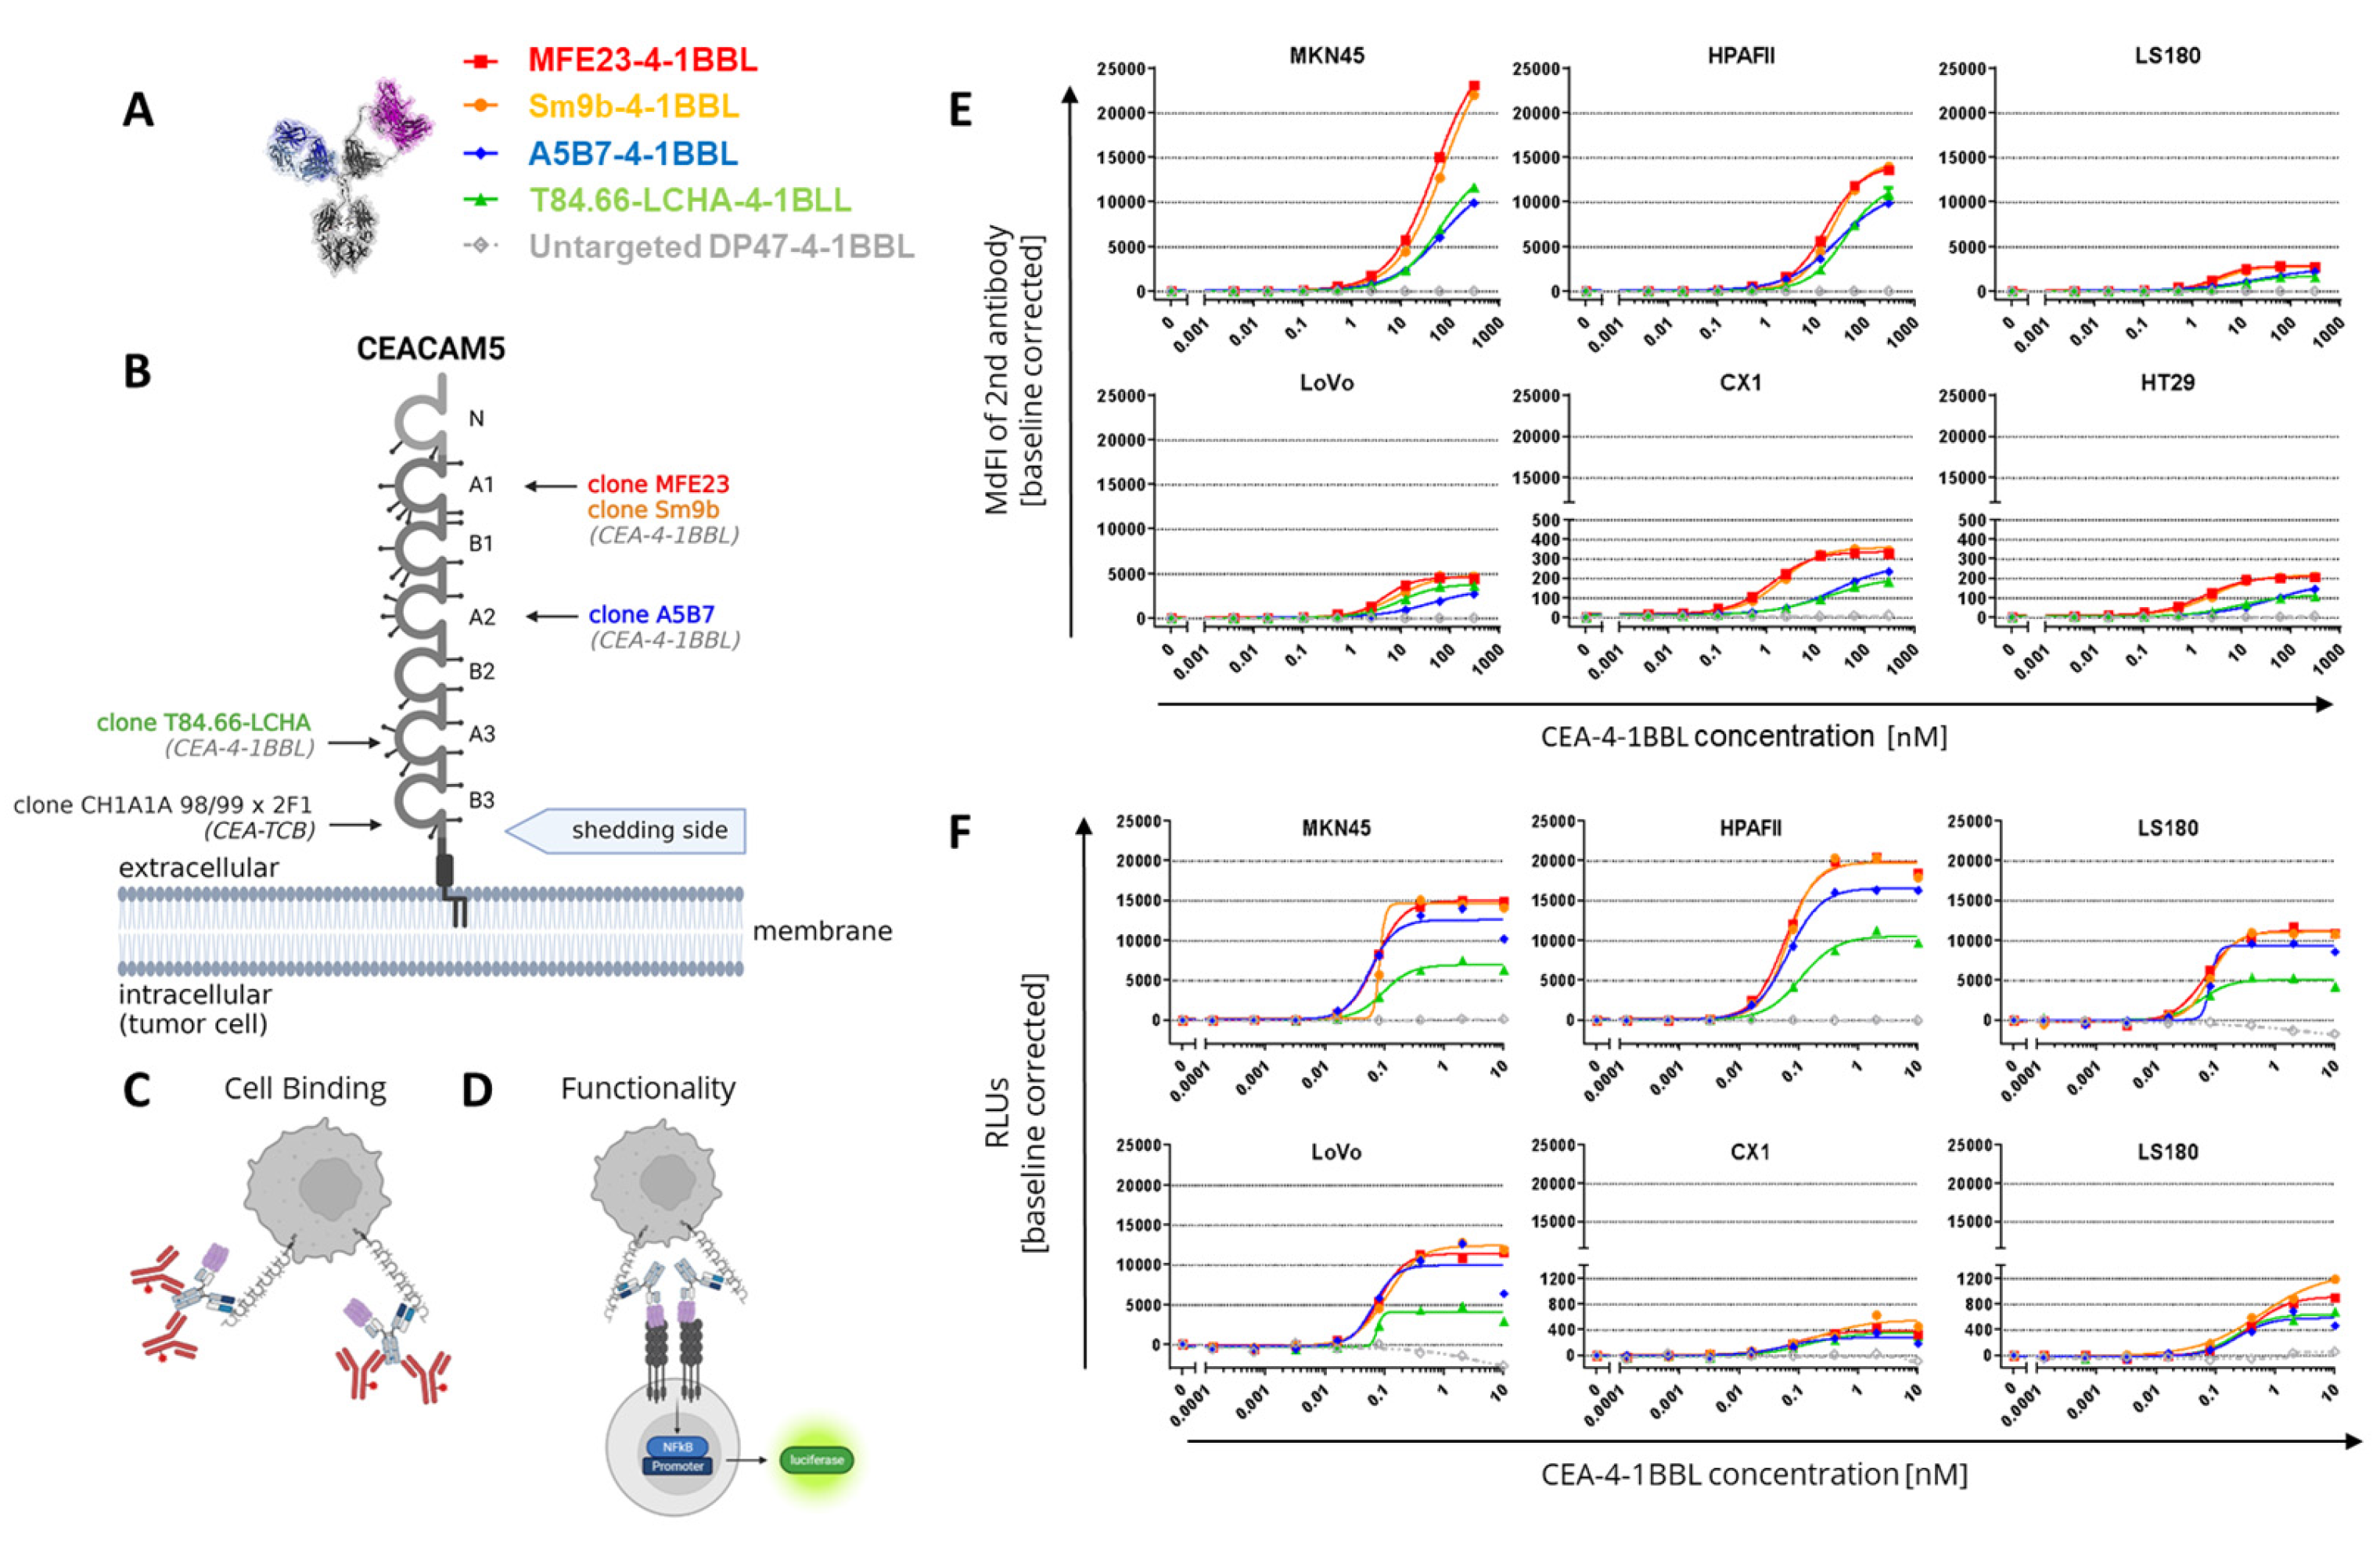
Figure 2.
Costimulatory activity of CEA-4-1BBL molecules on primary human T cells. (A) Tested CEA-4-1BBL bispecific molecules. (B) Schematic display of the assay with CD3 IgG1. (C) Schematic display of the assay with CEA-TCB. (D) CEA-4-1BBL molecules were titrated and incubated with human PBMCs from two different donors as indicated, 45 Gy irradiated MKN-45 tumor and 2 nM agonistic CD3 human IgG1 clone V9 antibody delivering signal 1. After 4 days T cells were analyzed by flow cytometry. The frequency of CD25 upregulation on the parental CD4 or CD8 T cell population was determined as indicated. Each point is the mean of technical triplicates. Error bars indicate the standard deviation. Only one experiment was performed. (E) Human PBMCs of two different donors were incubated with 45 Gy irradiated MKN-45 tumor cells, titrated CEA-TCB and 1 nM CEA- 4-1BBL molecules as indicated. After 4 days T cells were analyzed by flow cytometry. The frequency of CD25 upregulation on the parental CD4 or CD8 T cell population was determined. Each point is the mean of technical triplicates. Error bars indicate the standard deviation. Only one experiment was performed. (F) Area under the curve (AUC) was calculated from both assays and baseline corrected by subtracting the AUC value from DP47-4-1BBL control. Shown is the mean.
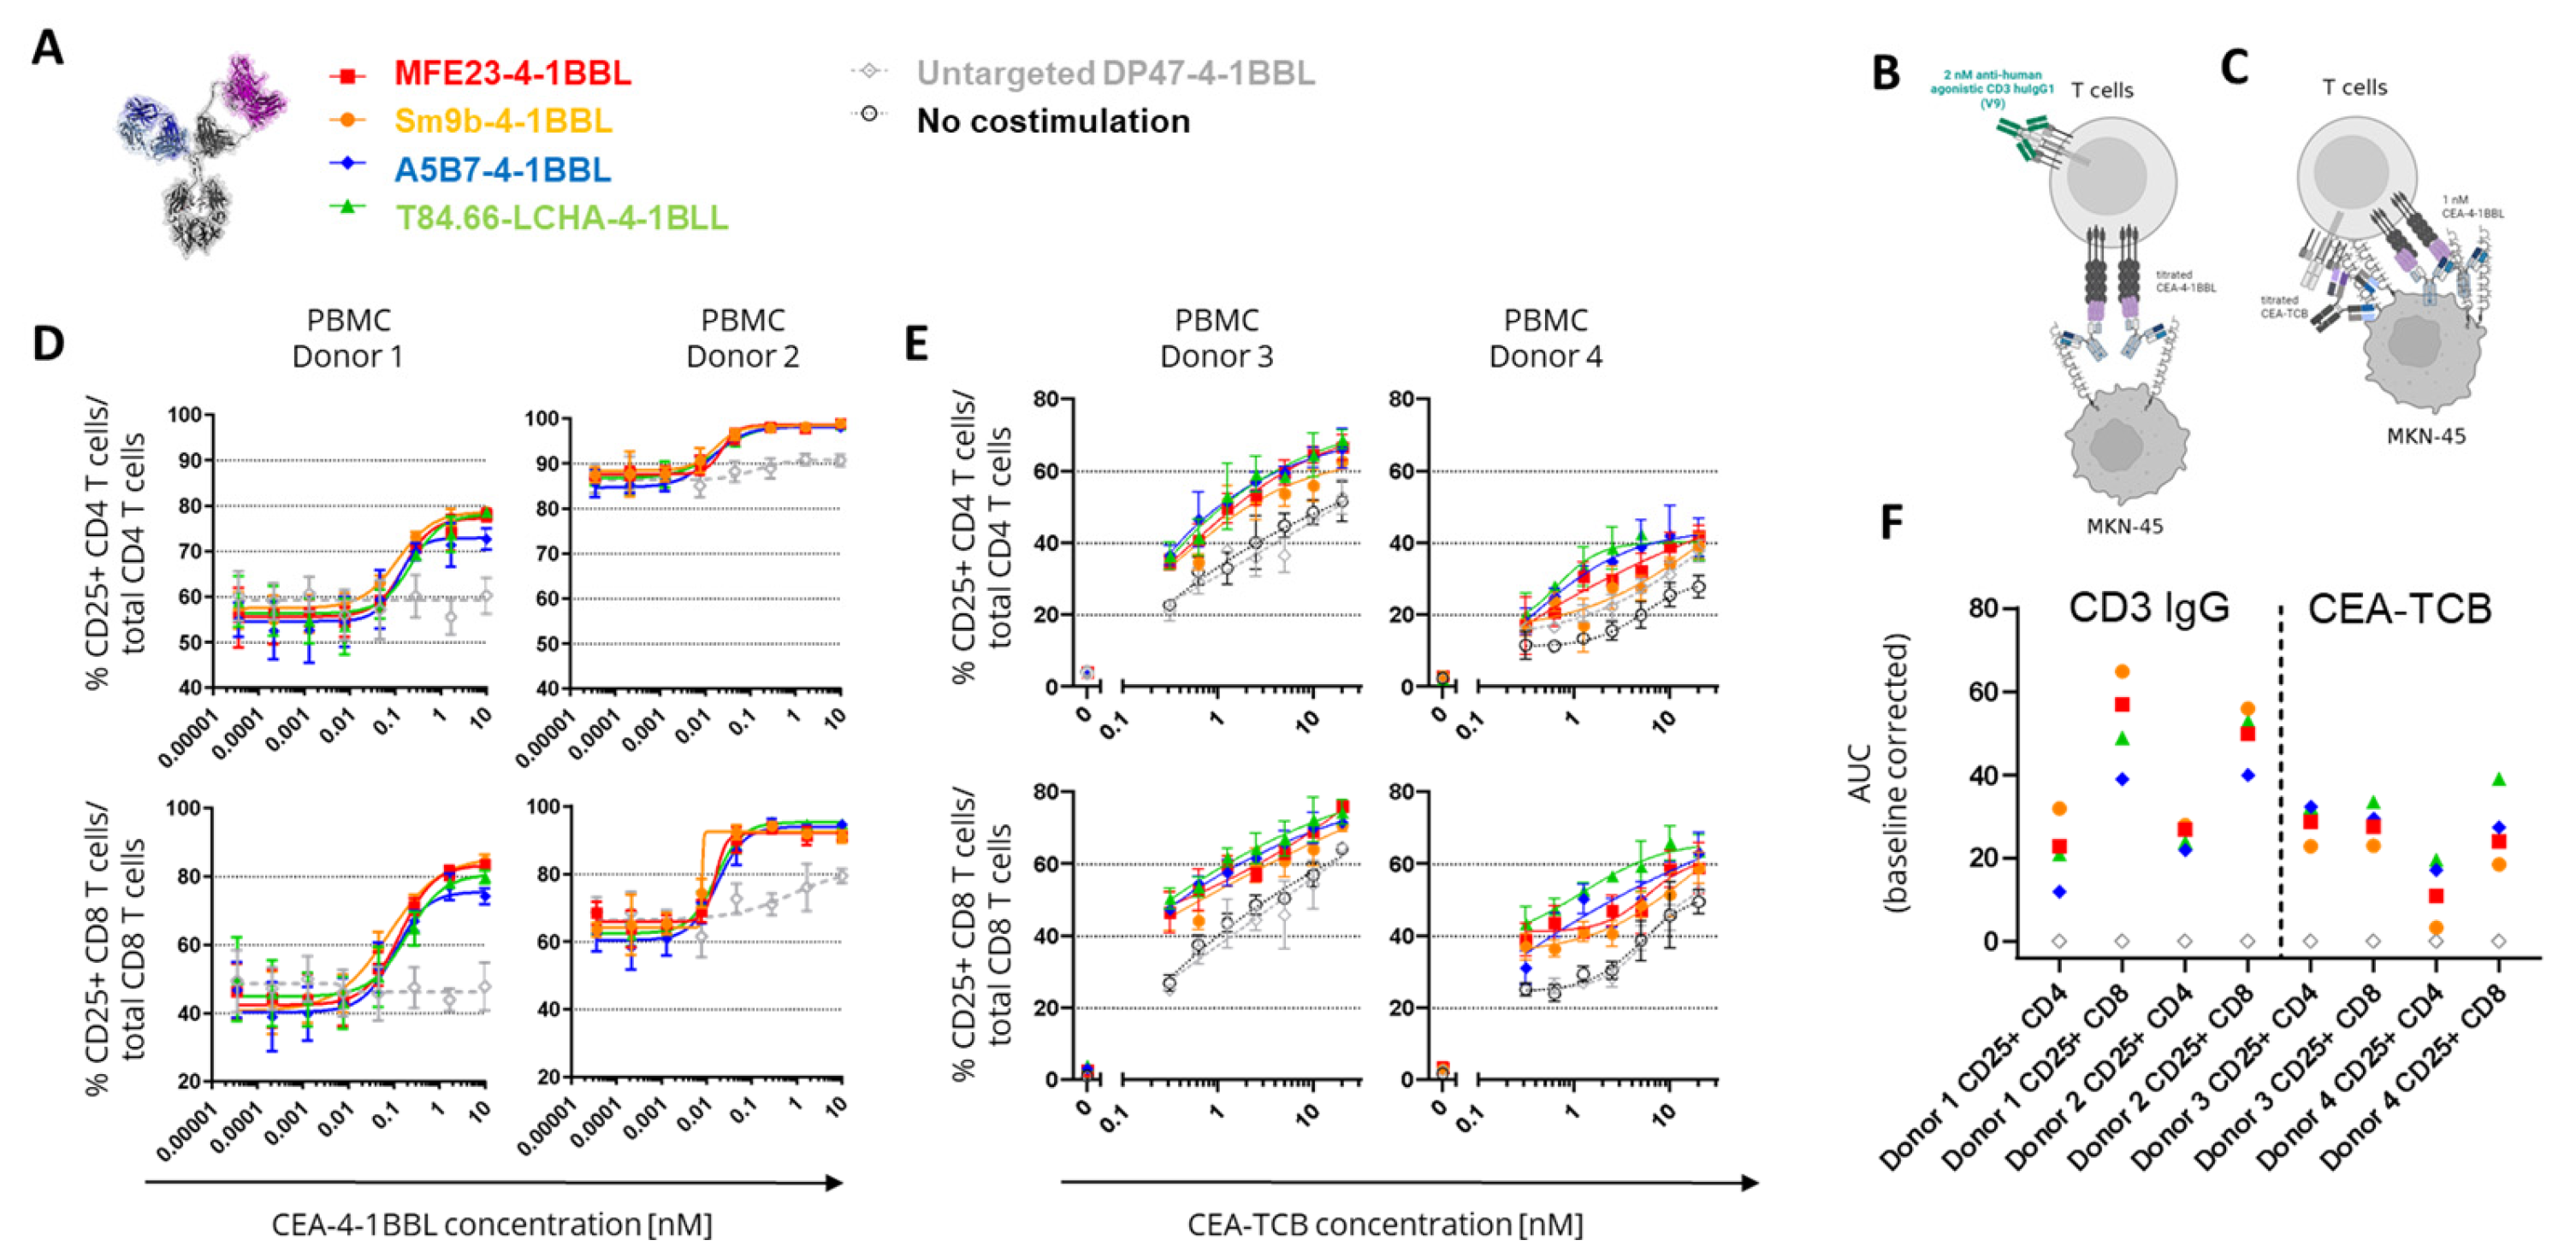
Figure 3.
Inhibitory capacity of soluble CEACAM5 and cynomolgus monkey cross-reactivity. (A) Tested CEA-4-1BBL bispecific molecules. (B) 1 nM of indicated CEA-4-1BBL molecules were incubated for 5 hours with the reporter cell line Jurkat-human-4-1BB-NFB-luc and with or without MKN-45 tumor cells in a 1:1 ratio and in the presence of titrated concentrations of soluble human CEACAM5. After substrate addition emitting luminescence was measured for 0.5 seconds/well as relative light units (RLUs) and baseline corrected. Each point is the mean of technical duplicates. IC50 values were calculated and are display. Only one experiment was performed. (C) CHO-k1 cells were stable transduced with cynomolgus monkey (cynoCEACAM5) or human CEACAM5 (huCEACAM5). To compare expression levels between the different clones a human/cynomolgus monkey-crossreactive anti-CD66-APC detection antibody was used for flow cytometry analysis. The concentration of the anti-CD66-APC detection antibody is displayed against the median fluorescence intensity (MdFI). Each point indicates the mean of technical duplicates. Shown is one of five independent and similar experiments. (D) CEA-4-1BBL molecules were incubated with the indicated transgenic CHO-k1 cells and detected with a PE-conjugated secondary antibody. The MdFI was measured by flow cytometry and values were baseline corrected. Each point is the mean of technical duplicates. Shown is one of five independent and similar experiments. (E) CEA-4-1BBL molecules were titrated and incubated for 5 hours with the reporter cell line Jurkat-human-4-1BB-NFB-luc and in the absence or present of transgenic CHO-k1 cells in a 1:1 ratio. After addition of substrate emitting luminescence was measured for 0.5 seconds/well as RLUs. Each point is the mean of technical duplicates. Shown is one of three independent and similar experiments.
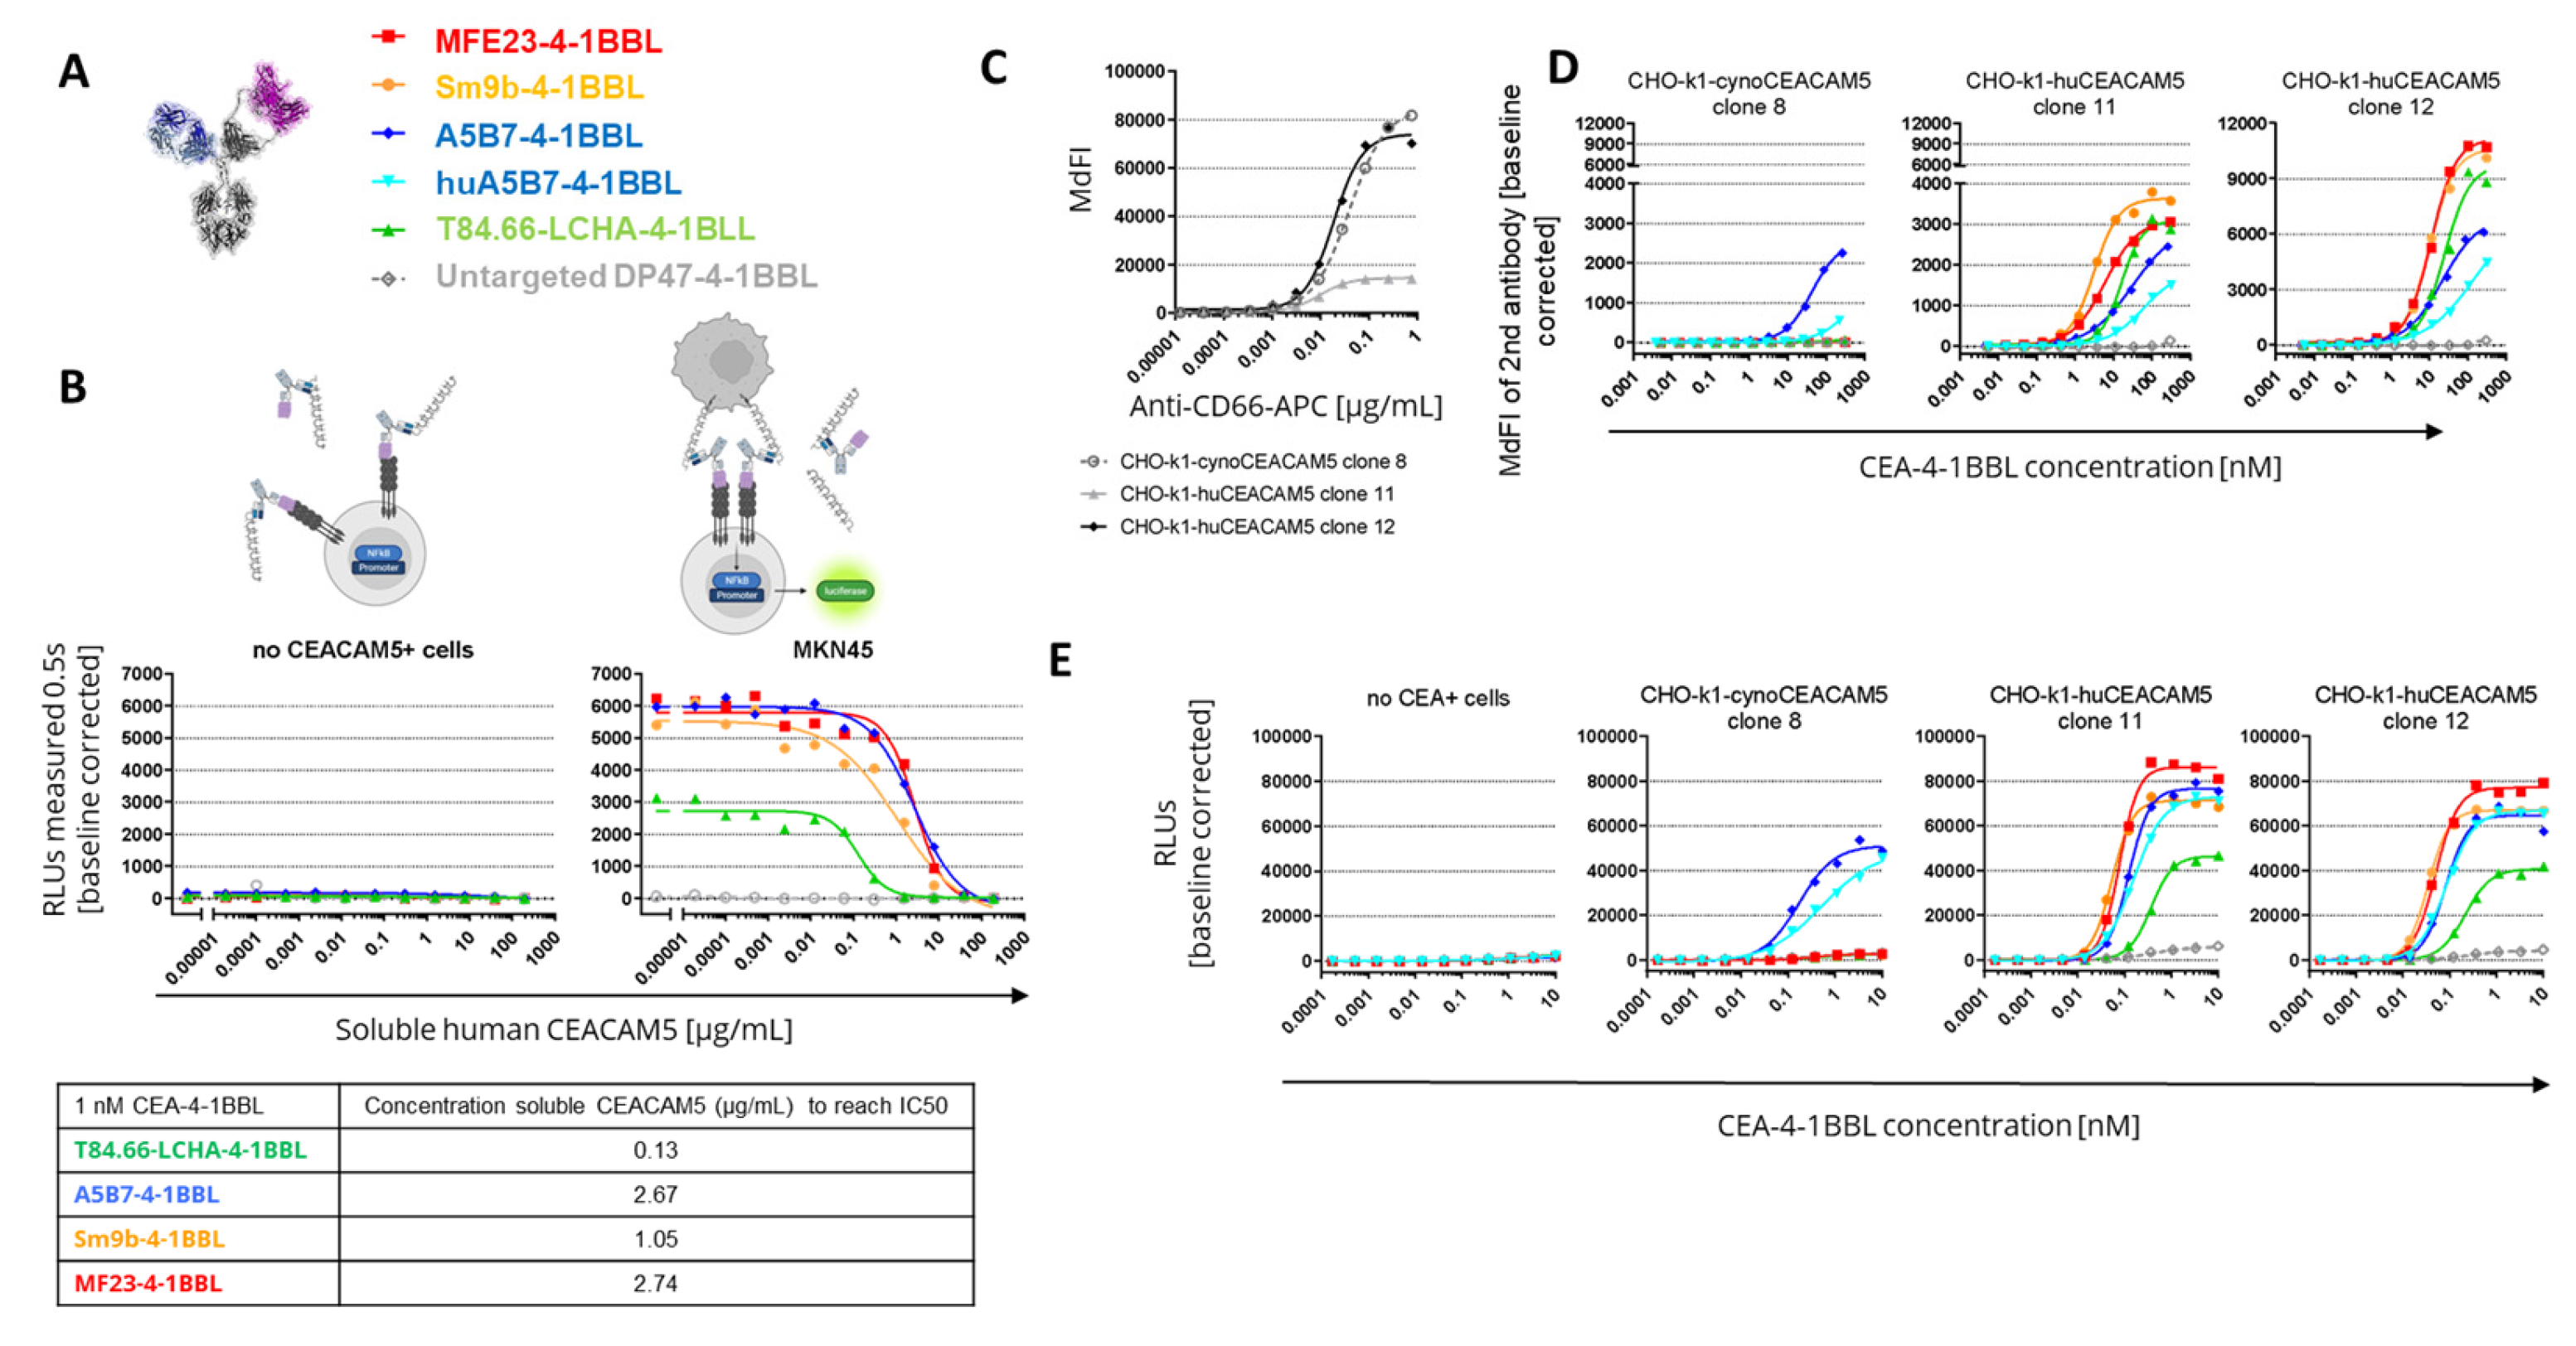
Figure 4.
CEA-4-1BBL-mediated tumor growth inhibition in humanized mice (A and B) Shown is the human CEACAM5 expression and human CD3+ cell infiltration measured by IHC on FFPET at a tumor size of 200 mm3 before treatment of MKN-45 or HPAFII tumors. (C) CD34+ human cord blood humanized NOG mice received subcutaneous injection of MKN-45 tumor cells. When a tumor volume of around 200 mm3 was reached, mice were randomized and treated with vehicle (grey filled circle) or 2.5 mg/kg CEA-TCB (black filled diamond) twice per week. Four of the six groups received a combination treatment of 2.5 mg/kg CEA-TCB twice per week and 3 mg/kg CEA-4-1BBL one per week (the different colors indicate CEA-4-1BBL molecules implementing different CEACAM5 binders). Schedule of treatment is indicated at the x-axis, tumor growth in mm3 is indicated at the y-axis. Each point indicates the mean of 10 mice, error bars show the standard error of the mean (SEM). (D) Shows a repetition of experiment shown in C with indicated molecules. (E) Shows a repetition of experiment shown in C but with HPAFII tumor cells instead of MKN45 with indicated molecules.
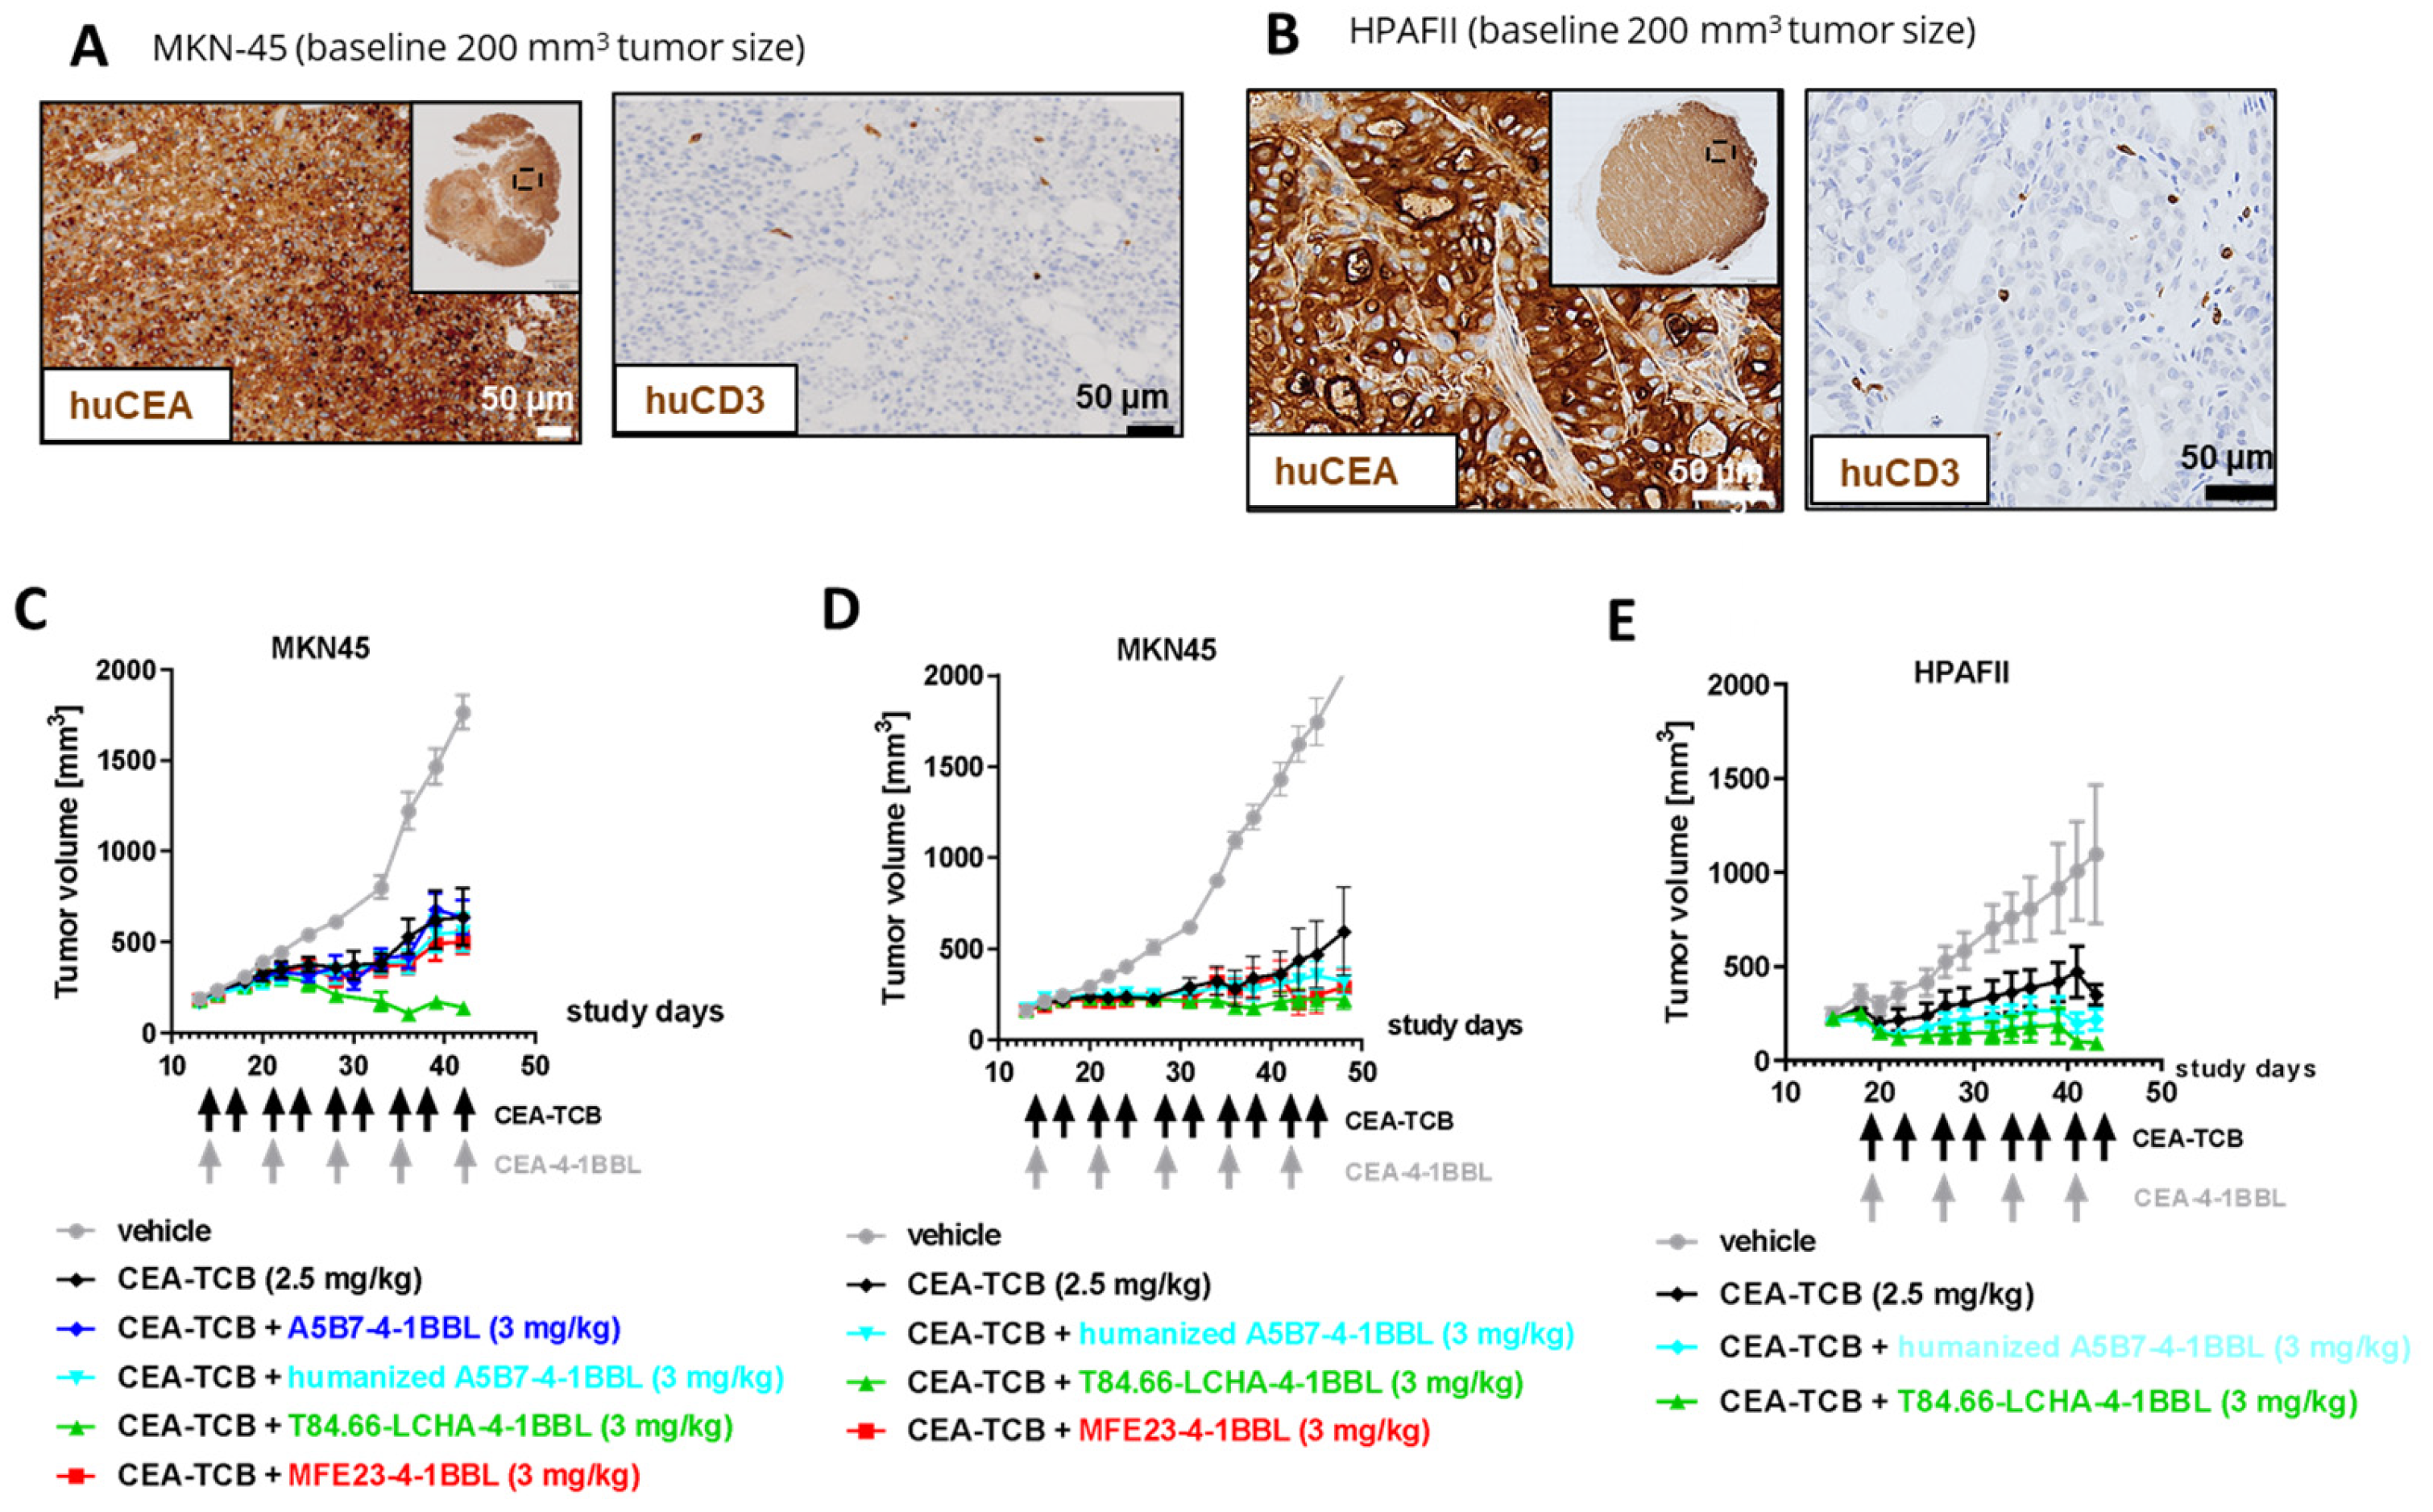
Figure 5.
CEA-4-1BBL-mediated increased CD8 T cell accumulation in a dose dependent manner (A) CD34+ human cord blood humanized NOG mice received subcutaneous injection of MKN-45 tumor cells and murine 3T3 fibroblasts. When a tumor volume of around 200 mm3 was reached mice were randomized and were treated with vehicle (grey) or 2.5 mg/kg CEA-TCB (black) twice per week. Three of the five groups received a combination treatment of 2.5 mg/kg CEA-TCB twice per week and 1m 3 or 10 mg/kg CEA-4-1BBL one per week (different shades of green). Schedule of treatment is indicated at the x-axis, tumor growth in mm3 is indicated at the y-axis. Each point indicates the mean of 10 mice, error bars show the standard error of the mean (SEM). (B) Shown is the human CEACAM5 expression measured by IHC on FFPET at a tumor size of 200 mm3 before treatment. (C) At endpoint (day 44) tumors were isolated and weighted. Three to four of 10 tumors were digested and analyzed by flow cytometry. Shown is the count of CD45+ CD3+ T cells, CD45+ CD3+ CD4+ T cells and CD45+ CD3+ CD8+ T cells per mg tumor. Each symbol indicates an individual mouse, the bar indicates the mean and the error bars standard deviation (SD). Significance was calculated using unpaired one-way ANOVA with Tukey’s multiple comparison test. * = p≤0.05, ** p=0.01. (D) 3-6 tumors per group were harvested at endpoint (day 44), tissue was formalin-fixed, paraffin embedded and stained by immunohistochemistry (IHC) for human CD8 to monitor the tumor infiltration of CD8+ T cells. Tissue sections were scanned, and whole scans were analyzed by Definiens. Shown is one reprehensive picture per group. (E) Shown is the CD3+ and CD8+ T cells count per square millimeter of immunohistochemistry. Each symbol represents one individual mouse, the bar indicates the mean and the error bar indicates the standard deviation (SD). Significance was calculated using unpaired one-way ANOVA with Tukey’s multiple comparison test. * = p≤0.05. (F) Tumor was digested and centrifuged at endpoint day 44. Human cytokines were measured from supernatant using a 24plex R&D. For Vehicle, CEA-TCB, CEA-TCB + 3 mg/kg T84.66-LCHA-4-1BBL tumors of n=4 mice, for CEA-TCB + 1 mg/kg T84.66-LCHA-4-1BBL tumors of n=5 mice and for CEA-TCB + 10 mg/kg T84.66-LCHA-4-1BBL tumors of n=3 mice were analyzed. Measured cytokines are shown in different colors as mean ± SD per treatment group.
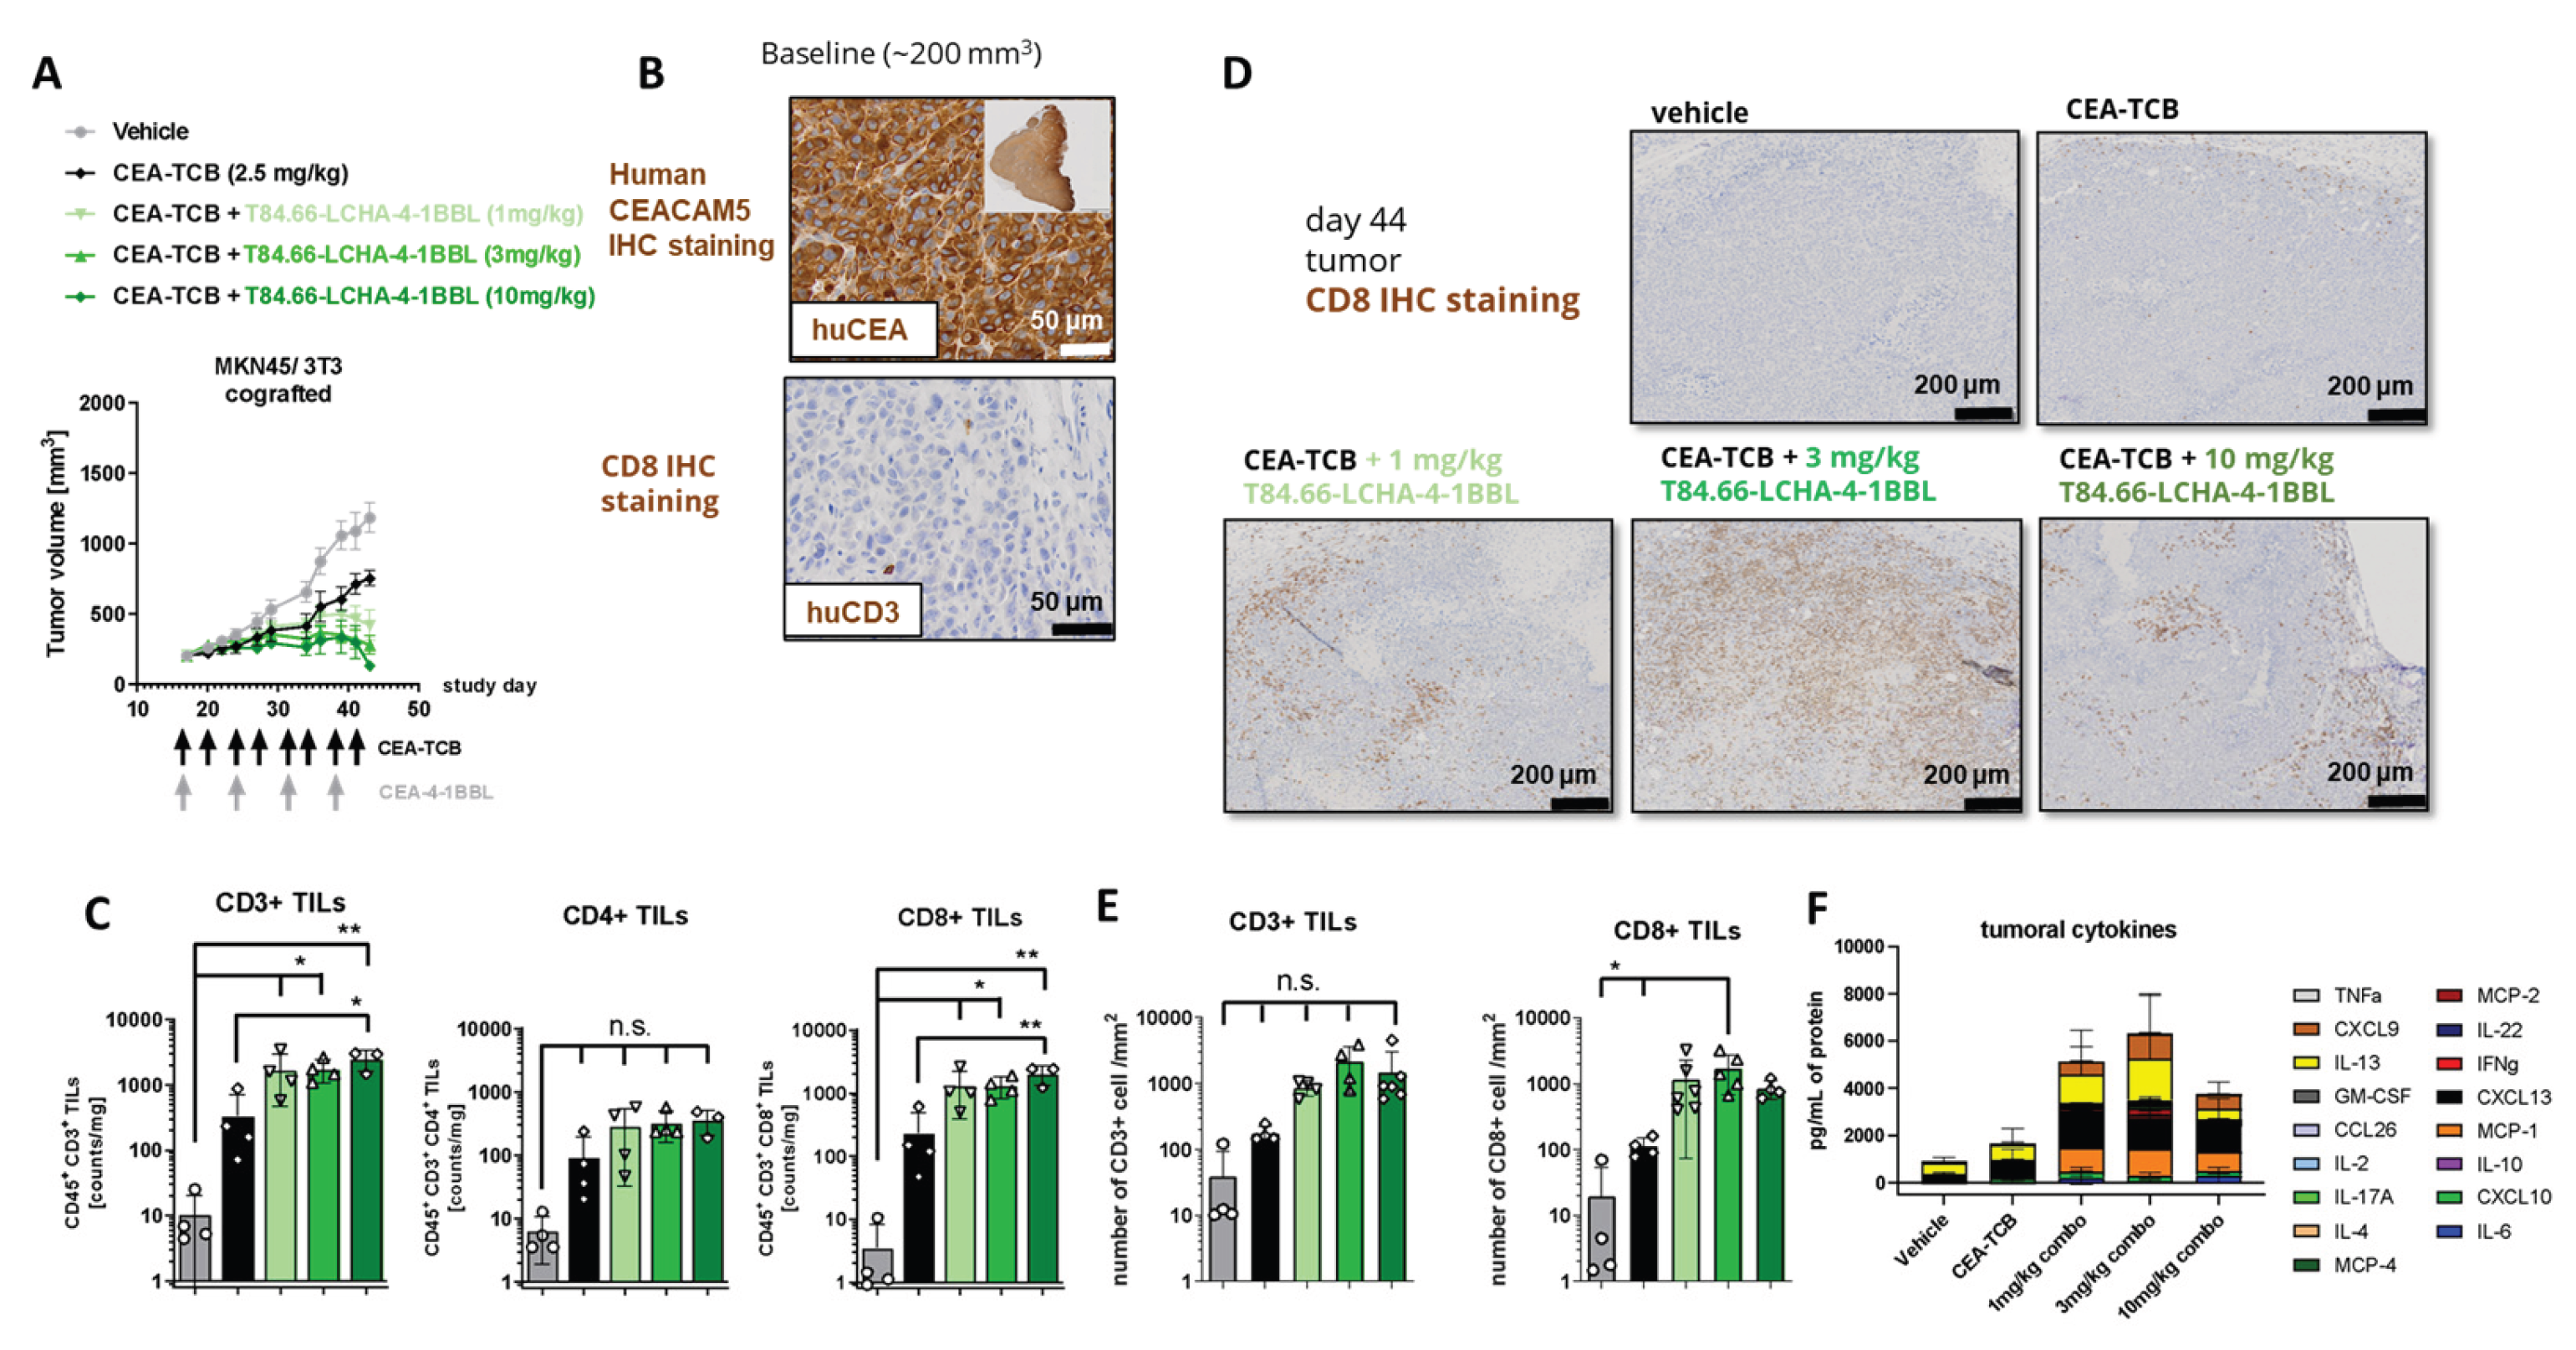

Table 1.
Affinity constants of anti-CEACAM5 Fabs for human CEACAM5 NABA constructs. The results are the average of three experiments.
Table 1.
Affinity constants of anti-CEACAM5 Fabs for human CEACAM5 NABA constructs. The results are the average of three experiments.
 |
Disclaimer/Publisher’s Note: The statements, opinions and data contained in all publications are solely those of the individual author(s) and contributor(s) and not of MDPI and/or the editor(s). MDPI and/or the editor(s) disclaim responsibility for any injury to people or property resulting from any ideas, methods, instructions or products referred to in the content. |
© 2025 by the authors. Licensee MDPI, Basel, Switzerland. This article is an open access article distributed under the terms and conditions of the Creative Commons Attribution (CC BY) license (http://creativecommons.org/licenses/by/4.0/).
Copyright: This open access article is published under a Creative Commons CC BY 4.0 license, which permit the free download, distribution, and reuse, provided that the author and preprint are cited in any reuse.


