1. Introduction
Checkpoint inhibitory and bispecific antibodies have shaped cancer immunotherapy strategies during the last decade [
1,
2,
3,
4]. Tumor infiltrating T cells can either receive a “natural” activation signal 1 through the T cell receptor (TCR) from its interaction with peptide-MHC complexes (endogenous immunity), or “artificially” by a T cell bispecific antibody (TCB) simultaneously bound to a tumor cell surface antigen and the CD3e chain of the TCR complex leading to redirected T cell-mediated tumor cell killing (synthetic immunity) [
2,
5,
6,
7,
8,
9]. To enhance and sustain the activity of T cells a co-stimulatory signal 2 is required and various approaches have been described to provide this signal 2 co-stimulatory signal by agonizing CD28 or 4-1BB/CD137 with bispecific antibodies or fusion proteins [
10,
11,
12,
13,
14]. In the clinic promising data have been reported for several bispecific 4-1BB agonists, both as single agents and in combination with checkpoint inhibition [
15,
16,
17,
18,
19,
20], while clinical data for the combination with TCBs is eagerly awaited.
Carcinoembryonic antigen cell adhesion molecule 5 (CEACAM5), also known as CEA or CD66e, is a highly glycosylated cell surface protein, anchored in the membrane via a glycosylphosphatidylinositol (GPI) anchor and normally functions as an adhesion molecule that can interact with CEACAM6 and CEACAM1 and plays a pivotal role in cancer biology [
21,
22]. CEACAM5 expression has been shown to be important for metastasis in colon cancer, but also for immune evasion of tumor cells [
21,
23]. CEACAM5 is overexpressed in various epithelial malignancies, including gastric, colorectal, pancreatic, breast and non-small cell lung cancer making it an attractive drug target. Furthermore, in colorectal cancer, shed CEA is an FDA-approved diagnostic tumor marker [
21,
23].
We have previously described tumor stroma-targeted FAP-4-1BBL and tumor targeted CD19-4-1BBL antibody fusion proteins that can bind simultaneously to fibroblast activation protein (FAP) or CD19, respectively and the co-stimulatory receptor 4-1BB/CD137 [
24,
25]. These 4-1BBL antibody fusion proteins provide the signal 2 to 4-1BB expressing T cells, either
in cis by binding to CD19-expressing malignant B cells in combination with the CD20-TCB glofitamab [
26] or
in trans by binding to FAP-expressing tumor fibroblasts in combination with the CEA-TCB cibisatamab [
27,
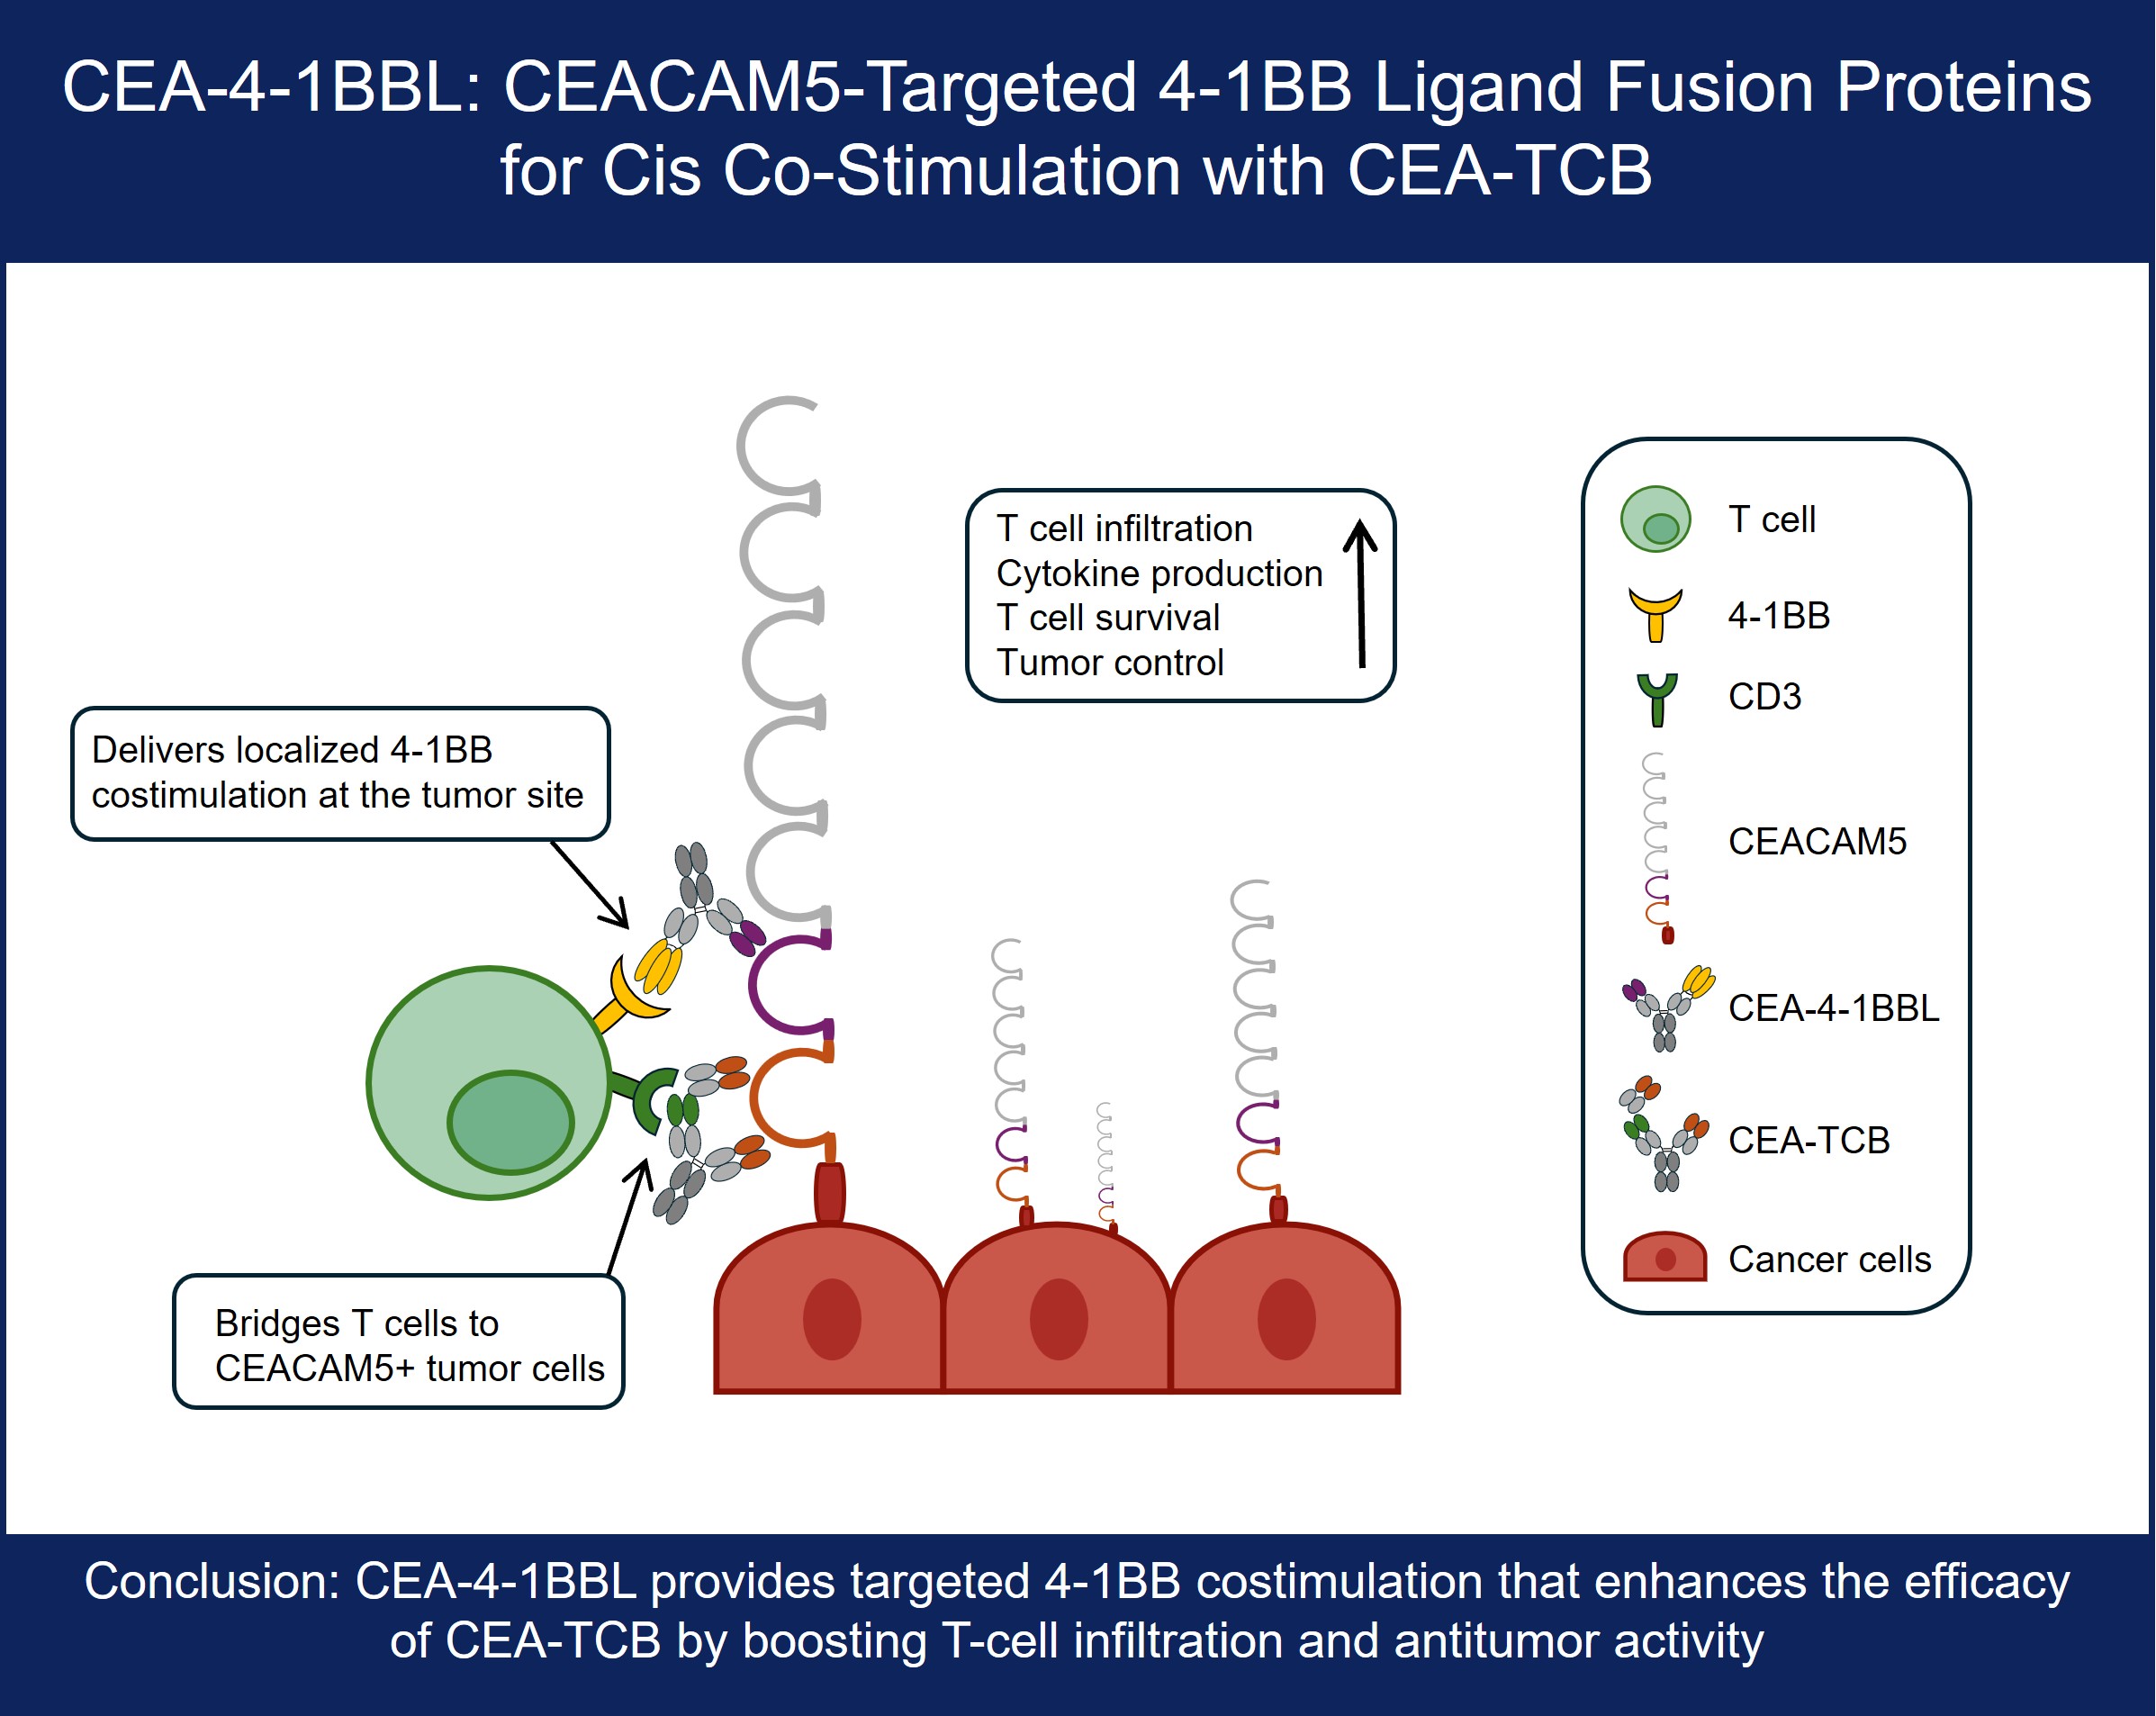
28]. Likewise, the combination of a CEACAM5-targeted CEA-4-1BBL fusion protein in combination with CEA-TCB was shown to strongly enhance T cell infiltration in the MKN-45 xenograft model in humanized NSG mice using the CD8-specific PET-Tracer 89Zr-Df-IAB22M2C [
29]. While we have not seen major differences between 4-1BB co-stimulation
in cis versus
in trans Otano et al. found that co-stimulation may be more potent when provided
in cis as compared to
in trans [
30]. Another recent approach for 4-1BB co-stimulation
in cis has been the generation of trispecific T cell engagers with integrated co-stimulation through 4-1BB binding moieties [
31,
32,
33].
Here the design, optimization and characterization of novel CEACAM5-targeted CEA-4-1BBL antibody fusions proteins with the goal to provide signal 2 to T cells receiving their signal 1 from CEA-TCB in cis -e.g. independent of FAP expression on fibroblasts- is described. For this purpose, several CEA-4-1BBL antibody fusion proteins directed against different domains of CEACAM5 were generated and tested for functionality in vitro and in vivo. The CEACAM5 antibodies chosen for the construction of the respective CEA-4-1BBL antibody fusion proteins recognize membrane-distal or membrane-proximal epitopes. Reporter T cell assays were applied for a first ranking of functionality. Targeting membrane-distal CEACAM5 epitopes mediated better T cell activation in reporter cells compared to targeting membrane-proximal epitopes when tested as a monotherapy. In contrast to the reporter cell line assays, two different PBMC-based in vitro activation assays in combination with different signal 1 providers were not able to provide a clear differentiation between the different CEACAM5 targeting antibodies. However, in MKN45 and HPAFII in vivo xenograft models in humanized NSG mice the CEA-4-1BBL antibody fusion protein constructed with the CEACAM5 antibody T84.66-LCHA targeting a membrane-proximal CEACAM5 epitope showed overall the best tumor control in combination with CEA-TCB. Based on the totality of data, the T84.66-LCHA-4-1BBL antibody fusion protein was selected as optimal co-stimulatory antibody fusion protein for the combination with CEA-TCB. Furthermore, the preclinical data presented indicate that reporter cell line assays can be limited in translatability and that in order to select the best candidate screening with different cell assays and particularly in vivo efficacy studies together with the potential combination partner are essential.
2. Materials and Methods
Reagents: CEA–4-1BBL molecules, non-binding control DP47–4-1BBL, CEA-TCB (cibisatamab, RG7802), huCEACAM5 peptides (NCBI EDL26990.1) were generated by Roche Innovation Centers Zurich or Munich. CEA–4-1BBL and DP47-4-1BBL were assembled using the following polypeptide chains: a) two ectodomains of 4-1BBL (UniProtKB P41273) fused to CL followed by human IgG1 Fc-knob chain, b) one ectodomain of 4-1BBL fused to CH1, c) a CEACAM5 or DP47 VH-CH1 fused to human IgG1 Fc-hole chain and d) a CEACAM5 or DP47 VL-CL. As previously described correct chain association was enabled using knob into hole technology [
34] and CH1-CL crossover with charge mutations [
35,
36] and Fc silencing was achieved with P329G LALA mutations [
37]. Molecules were produced in HEK293-EBNA or CHO cells and purified by affinity chromatography followed by size exclusion chromatography as previously described [
24].
The monomer content and integrity of the molecules were determined respectively by size exclusion on HPLC using a TSKgel UP-SW3000 column (<95%) and by CE-SDS (<95%). The mass of the purified molecules was confirmed by LC-MS analysis in non-reduced state and endotoxin content was determined. All constructs fulfilled the internal standards and were released for use in vivo. CEACAM5 Fabs were prepared by plasmin (Roche, 10602361001) digestion of the respective human IgG1 as recently described [
24]. The NABA constructs were used as antigens for the CEACAM5 Fabs. Since the CEACAM5 binders recognize different CEACAM5 domains the following NABA constructs, containing N, A or B domains of human CEACAM1 and CEACAM5, were prepared (
Table 1). The constructs were purified by standard chromatographic methods (chelating chromatography and preparative SEC).
Surface plasmon resonance: All SPR experiments were performed on a Biacore T200 at 25°C with HBS-EP as a running buffer (0.01 M HEPES pH 7.4, 0.15 M NaCl, 3 mM EDTA, 0.005% surfactant P20, Cytiva). His specific antibody (Qiagen, 34660) was coupled on a CM3 chip at pH 5.0 using the standard amine coupling kit (Cytiva). The NABA constructs were captured with a flow rate of 10 μL/minute for 30 or 40 seconds on flow cell 2 (
Supplementary Table 1). Dilution series of CEACAM5 Fab was passed on both flow cells at 30 μL/minute for 150 seconds to record the association phase. The dissociation phase was monitored for 300 seconds and triggered by switching from the sample solution to HBS-EP. The chip surface was regenerated after every cycle using a double injection of 60 seconds Glycine pH2.0. Bulk refractive index differences were corrected for by subtracting the response obtained on the reference flow cell, where no NABA construct was captured. The affinity constants were derived from the rate constants by fitting to a 1:1 Langmuir binding curve using the Biaeval software (GE Healthcare). The results are the average of three experiments.
Cell lines: Human gastric cancer cell line MKN-45 (DSMZ ACC 409), human colon adenocarcinoma cell lines CX-1 (DSMZ ACC 129) and HT-29 (ATCC HTB-38) were cultured in RPMI 1640 (Gibco 42401) supplied with 10% FBS (Gibco 16140 or Sigma F4135) and 2 mM GlutaMAX (Gibco 35050). Human pancreatic adenocarcinoma cell line HPAF-II (ATCC CRL-1997) was cultured in MEM/EBSS (Gibco 21090) supplied with 10% FBS, 2 mM GlutaMAX, 1% MEM-Nonessential amino acids (Sigma-Aldrich M7145), 1 mM Sodium-Pyruvate (Sigma-Aldrich S8636). Human colorectal adenocarcinoma cell line LS-180 (ATCC CL-187) was cultured in MEM/EBSS supplied with 10% FBS and 2 mM GlutaMAX. LoVo (ATCC CCL-229) was cultured in DMEM/F12 (Gibco 31331) supplied with 10% FBS and 2 mM GlutaMAX. All tumor cell lines grew adherent and were split 2-3 times per week keeping a confluence between 20-80%. Jurkat-human-4-1BB-NFkB-luc2 (Promega CS196004) reporter cell line was cultured in RPMI 1640 supplied with 10% FBS, 2 mM GlutaMAX, 1 mM Sodium-Pyruvate, 1% (v/v) MEM-nonessential Amino acid solution, 25 mM HEPES (Sigma Life Science H0887), 600 μg/ml G-418 (Roche 04727894001) and 400 μg/ml Hygromycin B (Roche 10843555001). The suspension cells were split twice per week keeping a cell density of 0.2-1.2 x 10⁶ cells/mL. CHO-k1 (ATCC CCL-61) cells were transfected with transfection plasmid pETR19312 to express cynomolgus monkey CEACAM5 and CHO-k1-cynoCEACAM5 clone 8 was selected. CHO-k1-cynoCEACAM5 clone 8 cell line was cultured in DMEM/F-12 (Gibco 31330) supplied with 10% FBS and 6 μg/mL Puromycin (Gibco A1113802) and split 3 times per week keeping a keeping a confluence between 20-80%. To generate CHO-k1CEACAM5 clone 11 and CHO-k1-huCEACAM5 clone 12 cell lines CHO-k1 (ATCC CCL-61) cells were transfected with transfection plasmid pETR14582 to express human CEACAM5. Cells were cultured in DMEM/F-12 (Gibco 31330) supplied with 10% FBS and 500 μg/mL Zeocin (Gibco R25001) and split 3 times per week keeping a keeping a confluence between 20-80%.
Cell binding assay: Tumor cell lines or CEACAM5 transfected CHO-k1 cells were harvested using 0.05% Trypsin-EDTA (Gibco 25300) for 10 minutes, washed and resuspended in DPBS (Gibco 14190). 2 x 10⁵ cells/well or 3 x 10³ cells/well were seeded to a round bottom 96-well plate (Cellstar 650185) or a round bottom 384-well plate (Corning 3830) respectively. Cells were stained with fixable viability stain eF450 (eBioscience 65-0863-18) according to manufacturer’s recommendations. Cells were washed with DPBS and incubated for 1 hour at 4°C in flow cytometry staining buffer containing different concentrations (starting concentration 300 nM titrated in 1:5 or 1:4 dilution steps) of CEA-4-1BBL molecules. Cells were washed with DPBS and incubated for 30 minutes in flow cytometry staining buffer containing 2.5 μg/mL PE-conjugated secondary antibody (Jackson ImmunoResearch 109-116-098). Cells were washed, fixed in PBS with 1% Paraformaldehyde for 15 minutes. Cells were acquired using the MACS Quant X (Miltenyi Biotec) coupled to a Cytomat line 2, a 4°C fridge and plate handling system (Thermo Fisher Scientific). Data were analyzed using FlowJo Version 10 to gate on living cells and evaluating the median fluorescence intensity of the PE-conjugated secondary antibody.
Reporter cell line assay: NFkB-downstream signaling after 4-1BB activation was measured by co-culturing 2x10³ Jurkat-human-4-1BB-NFkB-luc2 reporter cells with 1x10⁴ tumor cells or CEACAM5-transfected CHO-k1 cells in a 384-well flat bottom white plates (Corning 3826). Titrated CEA-4-1BBL molecules were added and plates were incubated for 5 hours at 5% CO2 and 37°C. For one experiment, a fixed dose of 1 nM CEA-4-1BBL was used and different concentration of soluble CEACAM5 (BioRad PHP282) were added (starting dose 190 nM, titrated in 1:5 dilution steps). Afterwards One-Glo Luciferase reagent (Promega E6110) was added and luminescence was measured for 0.5 seconds/well using a Tecan Spark plate reader.
Human PBMC activation assay: Buffy coats were obtained from Zurich blood donation center in accordance with the Declaration of Helsinki. Donors signed a written informed consent before sample collection. Peripheral blood mononuclear cell (PBMCs) were isolated by Ficoll density centrifugation as following: buffy coat was mixed 1:1 with sterile DPBS (Gibco, 14190-136) and 35 mL of this mixture were layered over 15 mL Histopaque 1077 (SIGMA LifeScience 10771, density 1.077 g/mL) in 50 mL Falcon containers. Containers were centrifuged 30 minutes at 450xg at room temperature without break. The lymphocyte fraction was harvested, pooled and washed several times with DPBS. PBMCs were frozen in 80% FBS and 10% DMSO (Sigma LifeScience D2650) and stored in Vapor Phase. PBMCs were thawed, washed and directly seeded. 7.5 x 10⁴ PBMCs, 2 x 10⁴ 45 Gy irradiated MKN-45 tumor cells, 2nM agonistic human CD3 human IgG1 (clone V9) or titrated concentrations of CEA-TCB in combination with different concentration of CEA-4-1BBL or untargeted control were combined in 200 μL/well of assay medium in a 96 round bottom well plate (TTP 92097). As assay medium RPMI 1640 (GIBCO 42401) supplied with 10% (v/v) FBS, 2 mM GlutaMAX (Gibco 35050), 1 mM Sodium-Pyruvat (Sigma-Aldrich S8636), 1% (v/v) MEM-nonessential Amino acid solution (Sigma-Aldrich M7145) and 50 μM beta-mercaptoethanol were used. Cells were incubated under humidity at 5% CO2 and 37°C. At day 4 cells were harvested, washed and stained with LIVE/DEAD Fixable Aqua Dead Cell Stain (Molecular Technology, L34957) according to manufacture’s recommendations. Afterwards cells were stained in 50 μL/well flow cytometry staining buffer containing 0.3 μg/mL human CD25-APC (BioLegend 301016, clone BC96), 0.67 μg/mL human CD4-BV421 (BioLegend 300532, clone RPA-T4) and 0.67 μg/mL human CD8-APC/Cy7 (BioLegend 301016, clone RPA-T8) for 30 minutes at 4°C. Cells were washed, fixed in PBS with 1% paraformaldehyde for 15 minutes and acquired using the Canto II (BD). Data was analyzed using FlowJo Version 10 to gate on living CD4 and CD8 T cells to determine the frequency of CD137+ or CD25+ cells of parental populations.
In vivo studies in humanized mice: The experimental study protocol was reviewed and approved by local government (P2011/128, ZH193-2014 and ZH223/17). NOD.Cg-PrkdcscidIL2rgtm1Wjl/SzJ (NSG) were supplied by The Jackson Laboratory. Female NSG mice were bred by Charles River Laboratories (Lyon, France). After arrival, animals were maintained for one week to get accustomed to the new environment and for observation. Continuous health monitoring was carried out on a regular basis. NSG mice were at the age of 4-5 weeks at start of human stem cell engraftment and mice were maintained under specific-pathogen-free condition with daily cycles of 12 hours light / 12 hours darkness according to committed guidelines (GV-Solas; Felasa; TierschG). To generate human stem cell-engrafted (HSC)-NSG mice, NSG mice were administered 15 mg/kg busulfan (Busilvex, Pierre Fabre) intraperitoneally (i.p.). Twenty-four hours later, each mouse received an intravenous (i.v.) injection of 1x10⁵ human CD34+ cord blood cells (purchased from STEMCELL Technologies). At 15-17 weeks post engraftment, mice were screened and only mice with more than 25% human CD45+ cells and a T cell count greater than 80 cells/μL were enrolled in the studies. For tumor inoculation, 1x10⁶ tumor cells were resuspended in a 1:1 mixture of RPMI 1640 (Gibco Life Technologies, 42401) and GFR Matrigel (Corning 734-0269) to a total volume of 100 μL and injected subcutaneously into the flank. Tumor volume was calculated using the formula V = length x width2 x 0.5 and used to randomize groups one day before treatment. Tumor-bearing mice (average tumor size 200 mm3, randomized groups) were treated intravenously with vehicle, 2.5 mg/kg CEA-TCB alone or in combination with 1, 3, or 10 mg/kg CEA–4-1BBL molecules). The dose for CEA-TCB has been determined in previous experiments as optimal for xenograft studies in (HSC)-NSG mice and translatable. Tumor volume was calculated using the formula V = length x width2 x 0.5.
Flow cytometry measurement ex vivo: For ex vivo flow-cytometry analysis, tumor single-cell suspensions were prepared using the gentleMACS Octo Dissociator (Miltenyi Biotec, Germany) according to the manufacturer's protocol and subsequently analyzed by flow cytometry. Formaldehyde-fixed tumor tissues were utilized for immunohistochemistry. Digested tumor single cell suspension were stained in all with 1:500 diluted live/death fixable blue dye (molecular probes L-23105) according to manufacturer’s recommendation. Cells were washed and stained in flow cytometry staining buffer containing mouse CD45-AF700 (BioLegend 103128, clone 30-F11), human CD3-BV605 (BD 750985), human CD4-BV421 (BioLegend 317434, clone OKT4), all diluted 1:300 and incubated for 30 minutes at 4°C in the dark. Cells were washed fixed and permeabilized using Permeablization buffer 10x from the FoxP3 Transcription Buffer staining kit (eBioscience, 00-5523-00). Cells were stained in perm-buffer containing 1:300 diluted human FoxP3-PE and incubated for 30 minutes at 4°C in the dark. Cells were acquired with a 5-laser BD Fortessa flow cytometer and analyzed.
Immunohistology ex vivo: Immunohistochemical staining was performed in formalin-fixed paraffin-embedded tissue (FFPET) as described (3, 4] with human CD8 (Cell Marque Tissue Diagnostic, clone SP16), human CD3 (ThermoFischer Scientific MA5-13473, clone C8/144B). Human CD3+ and human CD8+ cells were quantified with Definiens software (Definiens).
CEACAM5 modelling: Inter domain centroid and center of mass distance calculations: In order to calculate typical distances between domains of the full length human CEACAM5 protein, the alphafold2 model AF-P06731-F1-v6 was applied [
38,
39], which was aligned to available published CEACAM5 CryoEM structures of the N-terminal domain (PDB: 2QSQ, 2QST, 2VER) [
40] and A3-B3 domain (PDB:8BW0) [
41]. All structures were analysed using MOE (Molecular Operating Environment (MOE), 2024.0601 Chemical Computing Group ULC, 910-1010 Sherbrooke St. W., Montreal, QC H3A 2R7, 2025.). All solved individual domains were initially superimposed based on structure and sequence similarities to evaluate folding reliability of the AlphaFold model. Sequences corresponding to the N-term (A.A. 1-34) and C-term tail (A.A. 677-702) of the CEACAM5 AlphaFold model ranked with very low confidence (per residue confidence score pLDDT < 50, as disclosed in the model description file), were removed from the structure for further analysis. Next, structures were prepared using the protonate3D function and refined using a RMS gradient of 0.1 kcal/mol/A2 . Domains were annotated and color coded according to the figure legend. In order to measure a meaningful interdomain distance, a centroid was defined as the geometric center corresponding to the average position of all atoms of each domain. Similarly, mass-weighted positions of all atoms in the domain were defined as centers of mass. Inter centroid and inter center of mass distances were next measured and compared to the maximal paratopic distance between the CDRL1 and CDRH2 of the solved CryoEM structure of tusamitamab bound to CEACAM5 (PDB:8BW0) [
41].
Images: Shown pictograms were designed with Biorender.com.
Statistics: Binding and activation values were baseline corrected. Curves were analyzed by calculating the area under the curve (AUC)- AUC values were then used to calculate significant differences using an unpaired one-way ANOVA test. For in vivo efficacy studies statistical analysis was performed using 1-way analysis of variance (ANOVA), and significant P values are indicated as follows: ns: not significant; ∗P < .05; ∗∗P < .01; ∗∗∗P < .001; ∗∗∗∗P < .0001.
3. Results
3.1. CEA-4-1BBL Antibody Fusion Protein Design
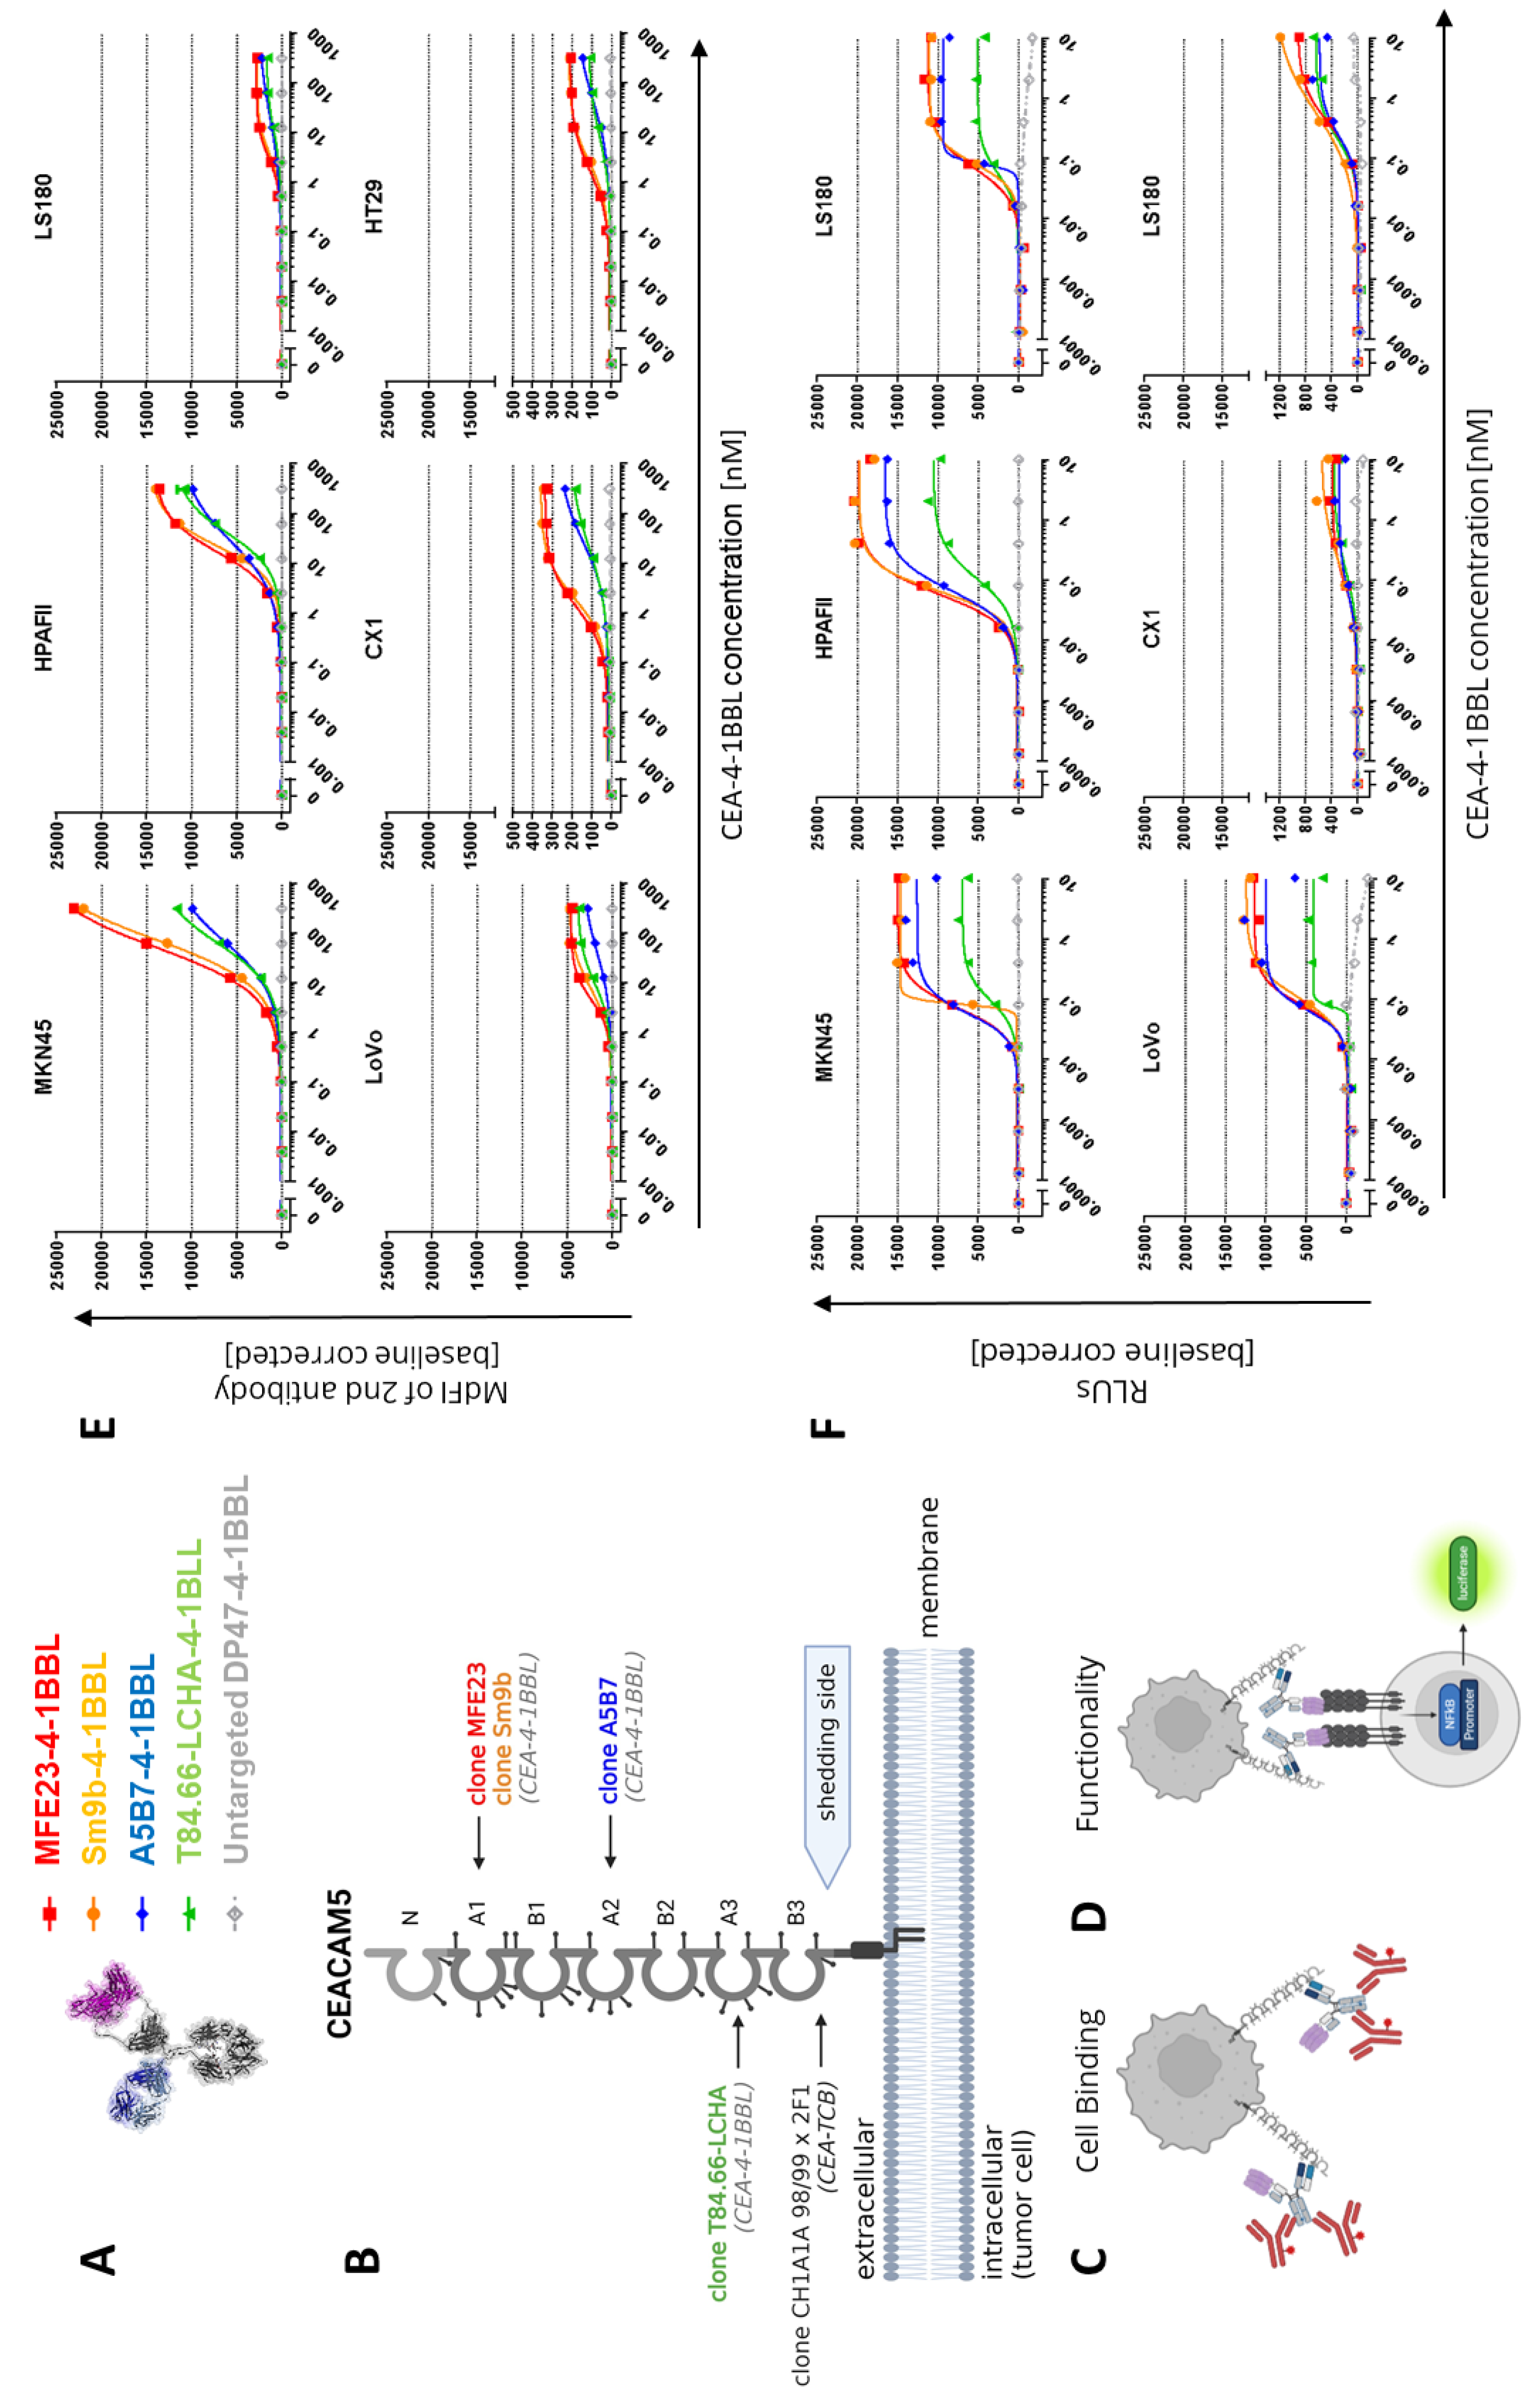
Following the recently described 4-1BBL antibody fusion protein design [
24], different CEA-4-1BBL antibody fusion proteins were generated using five different human CEACAM5 specific antibodies for tumor targeting (
Figure 1A). As non-tumor targeted control, the previously published DP47-4-1BBL fusion protein was applied [
24]. This construct does not bind to the cell surface of cancer cells. CEA-4-1BBL was specifically designed for combination with CEA-TCB that comprises the human CEA-specific antibody CH1A1A98/99x2F1 and targets the membrane-proximal CEACAM5 domain B3 [
27,
42]. Thus, to allow combination of CEA-TCB with CEA-4-1BBL only CEACAM5 specific antibodies were selected which do not share the same CEACAM5 epitope and do not compete for binding with CEA-TCB (data not shown) (
Figure 1B,
Supplementary Figure 1). The following antibodies known from the literature were chosen: 1) the humanized antibody T84.66-LCHA binding to CEACAM5 domain A3 [
43,
44,
45], 2) the parental antibody A5B7 and its humanized version huA5B7 binding to the membrane-proximal CEACAM5 domain A2 [
46,
47] and 3) the parental antibody MFE23 [
48,
49] and its humanized, stabilized and affinity matured version Sm9b binding to CEACAM5 domain A1 [
50]. All these five CEACAM5 antibodies recognize soluble CEACAM5, a product induced by glycosylphosphatidylinositol-phospholipase D cleavage activity [
51], as their epitopes are above the shedding site (
Figure 1B). In contrast, the epitope of CH1A1A98/99x2F1 applied in CEA-TCB is close to the shedding site and binding to soluble CEACAM5 as well as inhibition by soluble CEACAM5 is considered negligible as it has been shown for its parental antibody PR1A3 [
52]. To confirm that simultaneous multiple Fab binding to CEACAM5 domains is possible from a structural point of view, interdomain distances relative to the B3 domain of the AlphaFold model of human CEACAM5 were calculated (
Supplementary Figures 1A-B). Measurements show that a typical Fv paratope length scores shorter than interdomain distances (
Supplementary Figure 1C) further supporting that simultaneous binding to individual domain occurs.
3.2. CEA-4-1BBL In Vitro Characterization
The affinity determination of the CEACAM5 targeting Fab fragments for CEACAM5 NABA constructs covering the N-A1-B2-A2 domains (
Supplementary Table 1) via surface plasmon resonance (SPR) demonstrated that T84.66-LCHA and A5B7 have the highest and MFE23 and Sm9b the lowest affinity (
Table 1). To test the cellular binding of the different CEA-4-1BBL antibody fusion proteins six different human tumor cell lines were chosen representative for high to low CEACAM5 surface expression as described previously [
27,
42]. The ability of the different CEA-4-1BBL fusion proteins to bind these CEACAM5+ human cancer cell lines was assessed by flow cytometry using a binding assay as described in
Figure 1C. The measured binding as median fluorescence intensity (MdFI) showed that Sm9b-4-1BBL and its parental variant MFE23-4-1BBL displayed similar MdFI values, which were higher than for A5B7-4-1BBL or T84.66-LCHA-4-1BBL (
Figure 1E,
Supplementary Table 2). The discrepancy between affinity determined by surface plasmon resonance and cell binding is likely caused by a different epitope accessibility on cells and/or differences in the glycosylation profiles between recombinant NABA-CEACAM5 and CEACAM5 expressed on tumor cell surface. To test if these differences in tumor cell binding translate into differences in functionality the Jurkat-human-4-1BB-NFkB-luc2 reporter assay illustrated in
Figure 1D was applied using the same tumor cell line panel as applied in the cell binding assay (
Figure 1F,
Supplementary Table 3). MFE23-4-1BBL and Sm9b-4-1BBL displayed comparable functionality similar to the cell binding results. On the other hand, A5B7-4-1BBL and T84.66-LCHA-4-1BBL, which showed lower overall cell binding, displayed lower activity in the reporter cell assay with T84.66-LCHA-4-1BBL showing the lowest activity, while A5B7-4-1BBL performed more similar to MFE23-4-1BBL and Sm9b-4-1BBL (
Figure 1F).
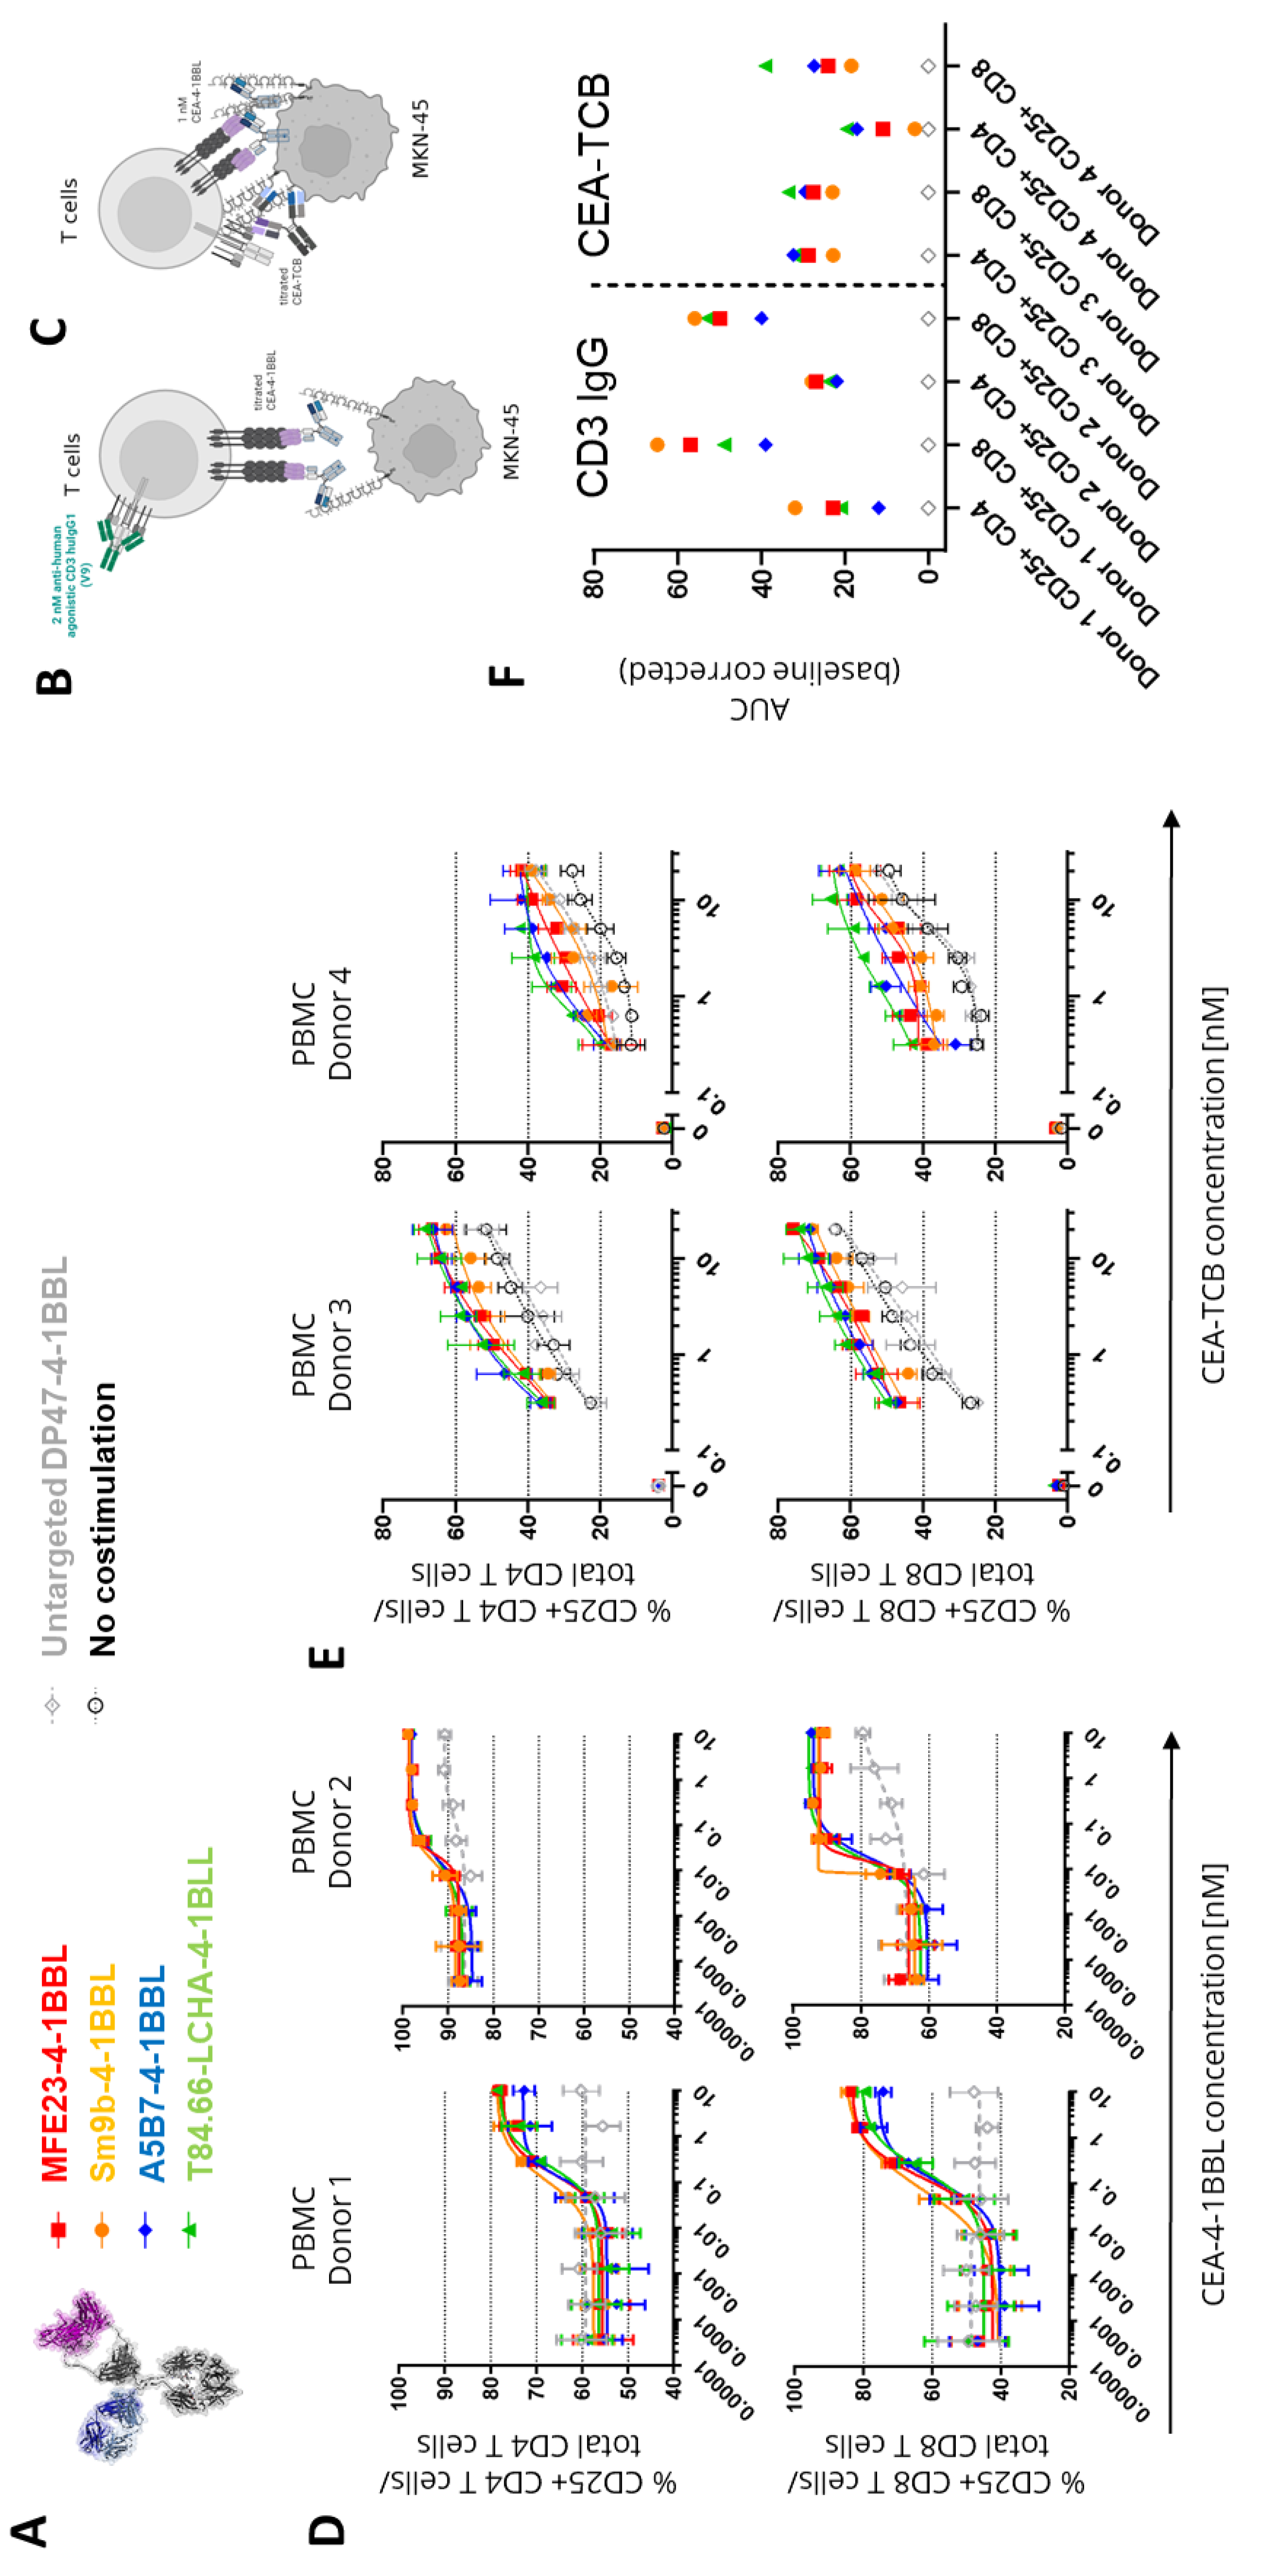
In subsequent experiments it was tested whether these differences in functional activity can also be observed in primary T cell assays. For this purpose, human PBMCs obtained from different healthy donors were activated in the presence of CEACAM5 expressing MKN-45 tumor cells in presence of 2 nM of the agonistic human CD3 IgG1 antibody V9 (
Figure 2B) or a titration of CEA-TCB (
Figure 2C). This activation step was introduced to induce sufficient 4-1BB expression as resting T cells do not express 4-1BB constitutively [
24]. The timing of this assay was optimized in pre-experiments and four days found as optimal time point (data not shown). Interestingly, in both assays, in presence of the TCR signal 1 no major differences between the tested CEA-4-1BBL fusion proteins were observed like they were seen in the Jurkat-human-4-1BB-NFkB-luc2 reporter cell line assays with CEA-4-1BBL as a monotherapy (
Figure 2D and 2E,
Supplementary Table 4 and 5). In the primary T cell assays, only minimal differences were observed. However, there was a trend suggesting that MFE23-4-1BBL and Sm9b-4-1BBL showed better performance, when combined with the agonistic human CD3 antibody V9 (
Figure 2D), whereas T84.66-LCHA-4-1BBL and A5B7-4-1BBL appeared to perform better when combined with CEA-TCB (
Figure 2F). This demonstrates that the resolution of PBMC activation assays is smaller and different to the reporter cell assay. Furthermore, it demonstrated that the signal 1 provider, CD3 antibody versus TCB, may have an impact on the activity of the CEA-4-1BBL fusion proteins.
As the PBMC based assays had a longer incubation time of four days than the reporter cell line assay with five hours, subsequent experiments investigated whether the accumulation of soluble CEACAM5 may result in a reduction of the binding to cell-bound CEACAM5 and could provide an explanation for the findings. Indeed, over-expression of CEACAM5 in colorectal cancer correlates with soluble CEACAM5 concentrations in serum and in cancer patients concentrations from 0.002 to 5.187 ug/mL have been reported with soluble CEACAM5 values generally correlating with advanced cancer stages [
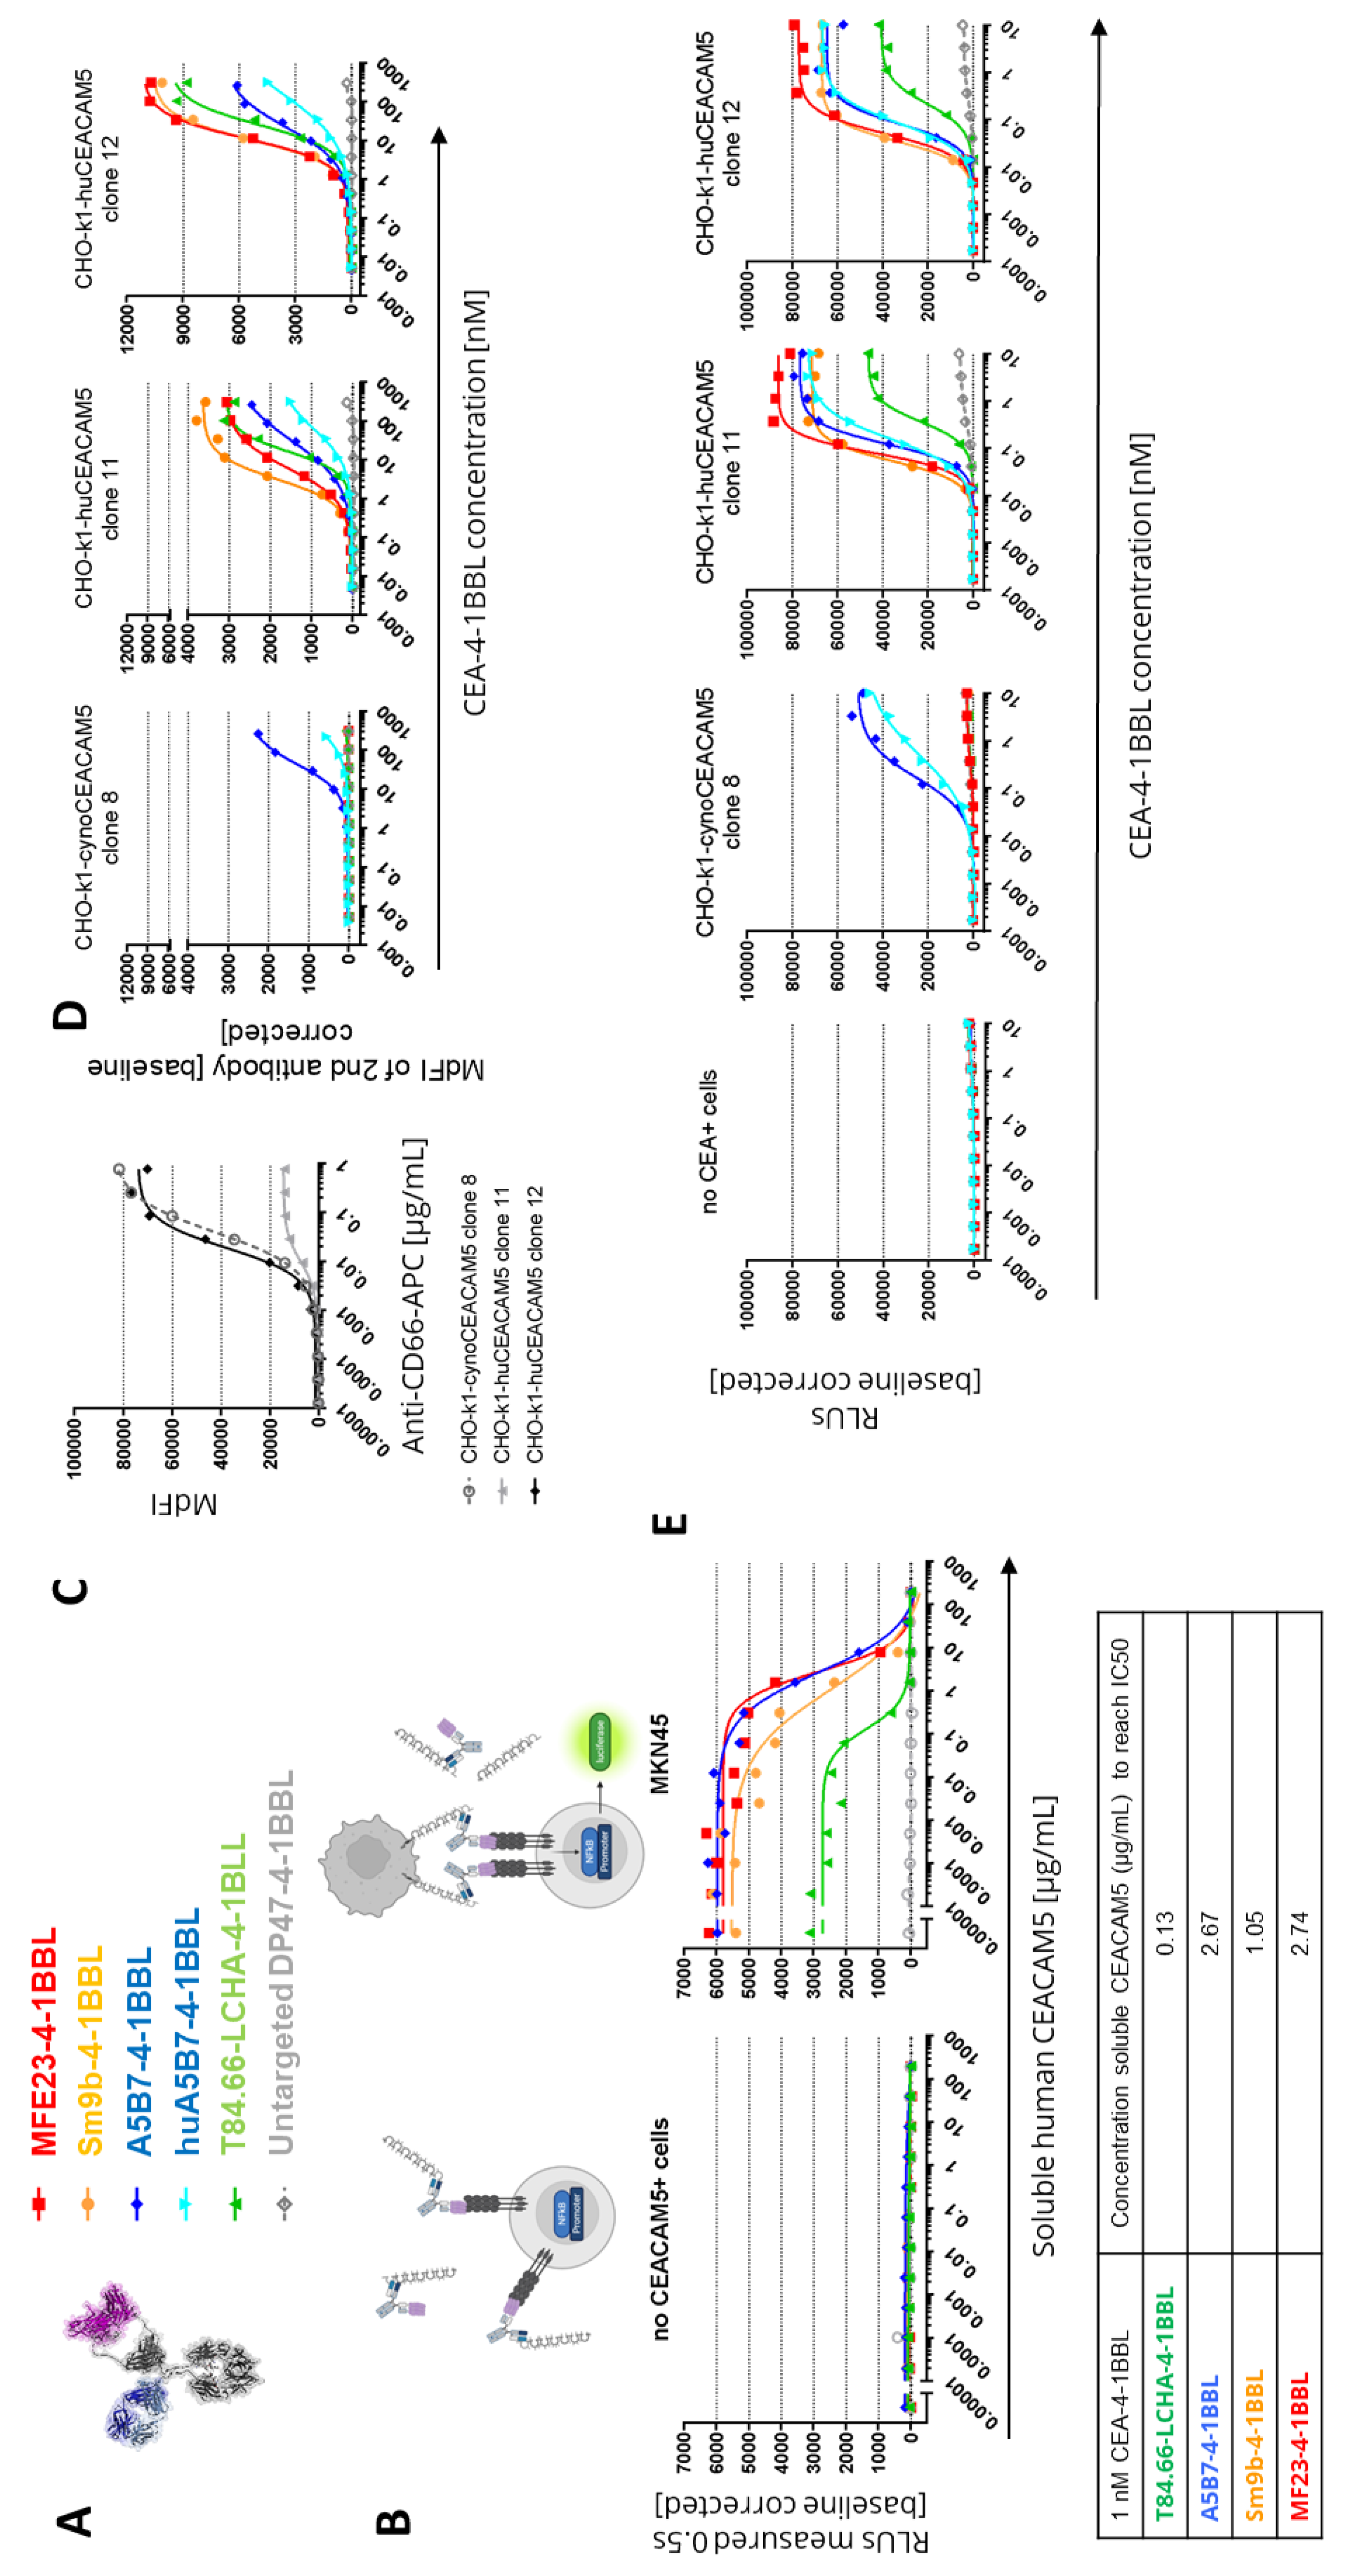
53]. To test whether soluble human CEACAM5 can lead to an inhibition of the functionality of the different CEA-4-1BBL fusion proteins (
Figure 3A), a fixed concentration of 1 nM CEA-4-1BBL was chosen (
Figure 3B). By adding increasing concentrations of soluble human CEACAM5 in the Jurkat-human-4-1BB-NFkB-luc2 reporter cell line assay the IC50 values was evaluated. In these experiments the strongest inhibition was seen for T84.66-LCHA-4-1BBL and the lowest for A5B7-4-1BBL and MF23-4-1BBL (
Figure 3B). Therefore, the functional differences in the different assays could not be explained with the sole impact of soluble CEACAM5.
3.3. Cynomolgus Cross-Reactivity
To select the best molecule for further development cynomolgus cross-reactivity of the different CEA-4-1BBL molecules was determined. Cynomolgus cross-reactivity has already been shown for human 4-1BBL [
24], so that only the cynomolgus cross-reactivity of the different CEACAM5 antibodies was determined. For this purpose CHO-k1 cell lines stably expressing either human or cynomolgus monkey CEACAM5 were generated. To compare the cynoCEACAM5 expression levels of the different chosen CHO-k1 clones a human/Cynomolgus cross-reactive CEACAM5 (CD66e) APC-conjugated detection antibody was chosen. Based on the expression data CHO-k1-cynoCEACAM5 clone 8 with good cynoCEACAM5 expression was selected for subsequent experiments. Furthermore, CHO-k1-huCEACAM5 clone 12 and clone 11 were selected as controls (
Figure 3C). With these three cell lines cell binding assays were performed (
Figure 3D,
Supplementary Table 6). Only A5B7-4-1BBL showed cyno-cross-reactivity although with reduced binding to cynoCEACAM5. A5B7-4-1BBL bound much weaker to CHO-k1-cynoCEACAM5 clone 8 (EC50= 41.8 nM) than to CHO-k1-huCEACAM5 clone 12 (EC50=21.69 nM) although both clones displayed similar CEACAM5 expression levels (
Figure 3C). As A5B7 was the only cyno-cross-reactive clone, it was humanized and converted into the CEA-4-1BBL format (huA5B7-4-1BBL). The humanization lead to slightly reduced binding to CHO-k1-huCEACAM5 cells, however unfortunately the binding to CHO-k1-cynoCEACAM5 clone 8 decreased dramatically by the humanization (
Figure 3D,
Supplementary Table 6). To test if the low binding to cynoCECAM5 had an impact on functionality, the same transgenic CHO-k1 cell lines were used in the functional Jurkat-human-4-1BB-NFkB-luc2 reporter assay (
Figure 3E,
Supplementary Table 7). As expected only A5B7-4-1BBL and huA5B7-4-1BBL induced reporter cell line activation in the presence of CHO-k1-cynoCEACAM5. However, both antibody fusion proteins showed a lower activity with CHO-k1-cynoCEACAM5 than with CHO-k1-humanCEACAM5 controls. Interestingly huA5B7-4-1BBL functionality was not as much reduced compared to A5B7-4-1BBL as the binding to CHO-k1-cynoCEACAM5 would have suggested. Furthermore, no significant differences between CHO-k1-huCEACAM5 clone 11 and CHO-k1-huCEACAM5 clone 12 were observed in the reporter assay (
Figure 3E) although both cell lines have different CEACAM5 expression (
Figure 3C). It is important to mention that the CHO-k1 cell lines express high levels of CEACAM5 compared to tumor cell lines (
Figure 1D) and that a saturation of the reporter cell line activity with CHO-k1-huCEACAM5 clone 11 might have been reached.
3.4. In Vivo Efficacy Studies
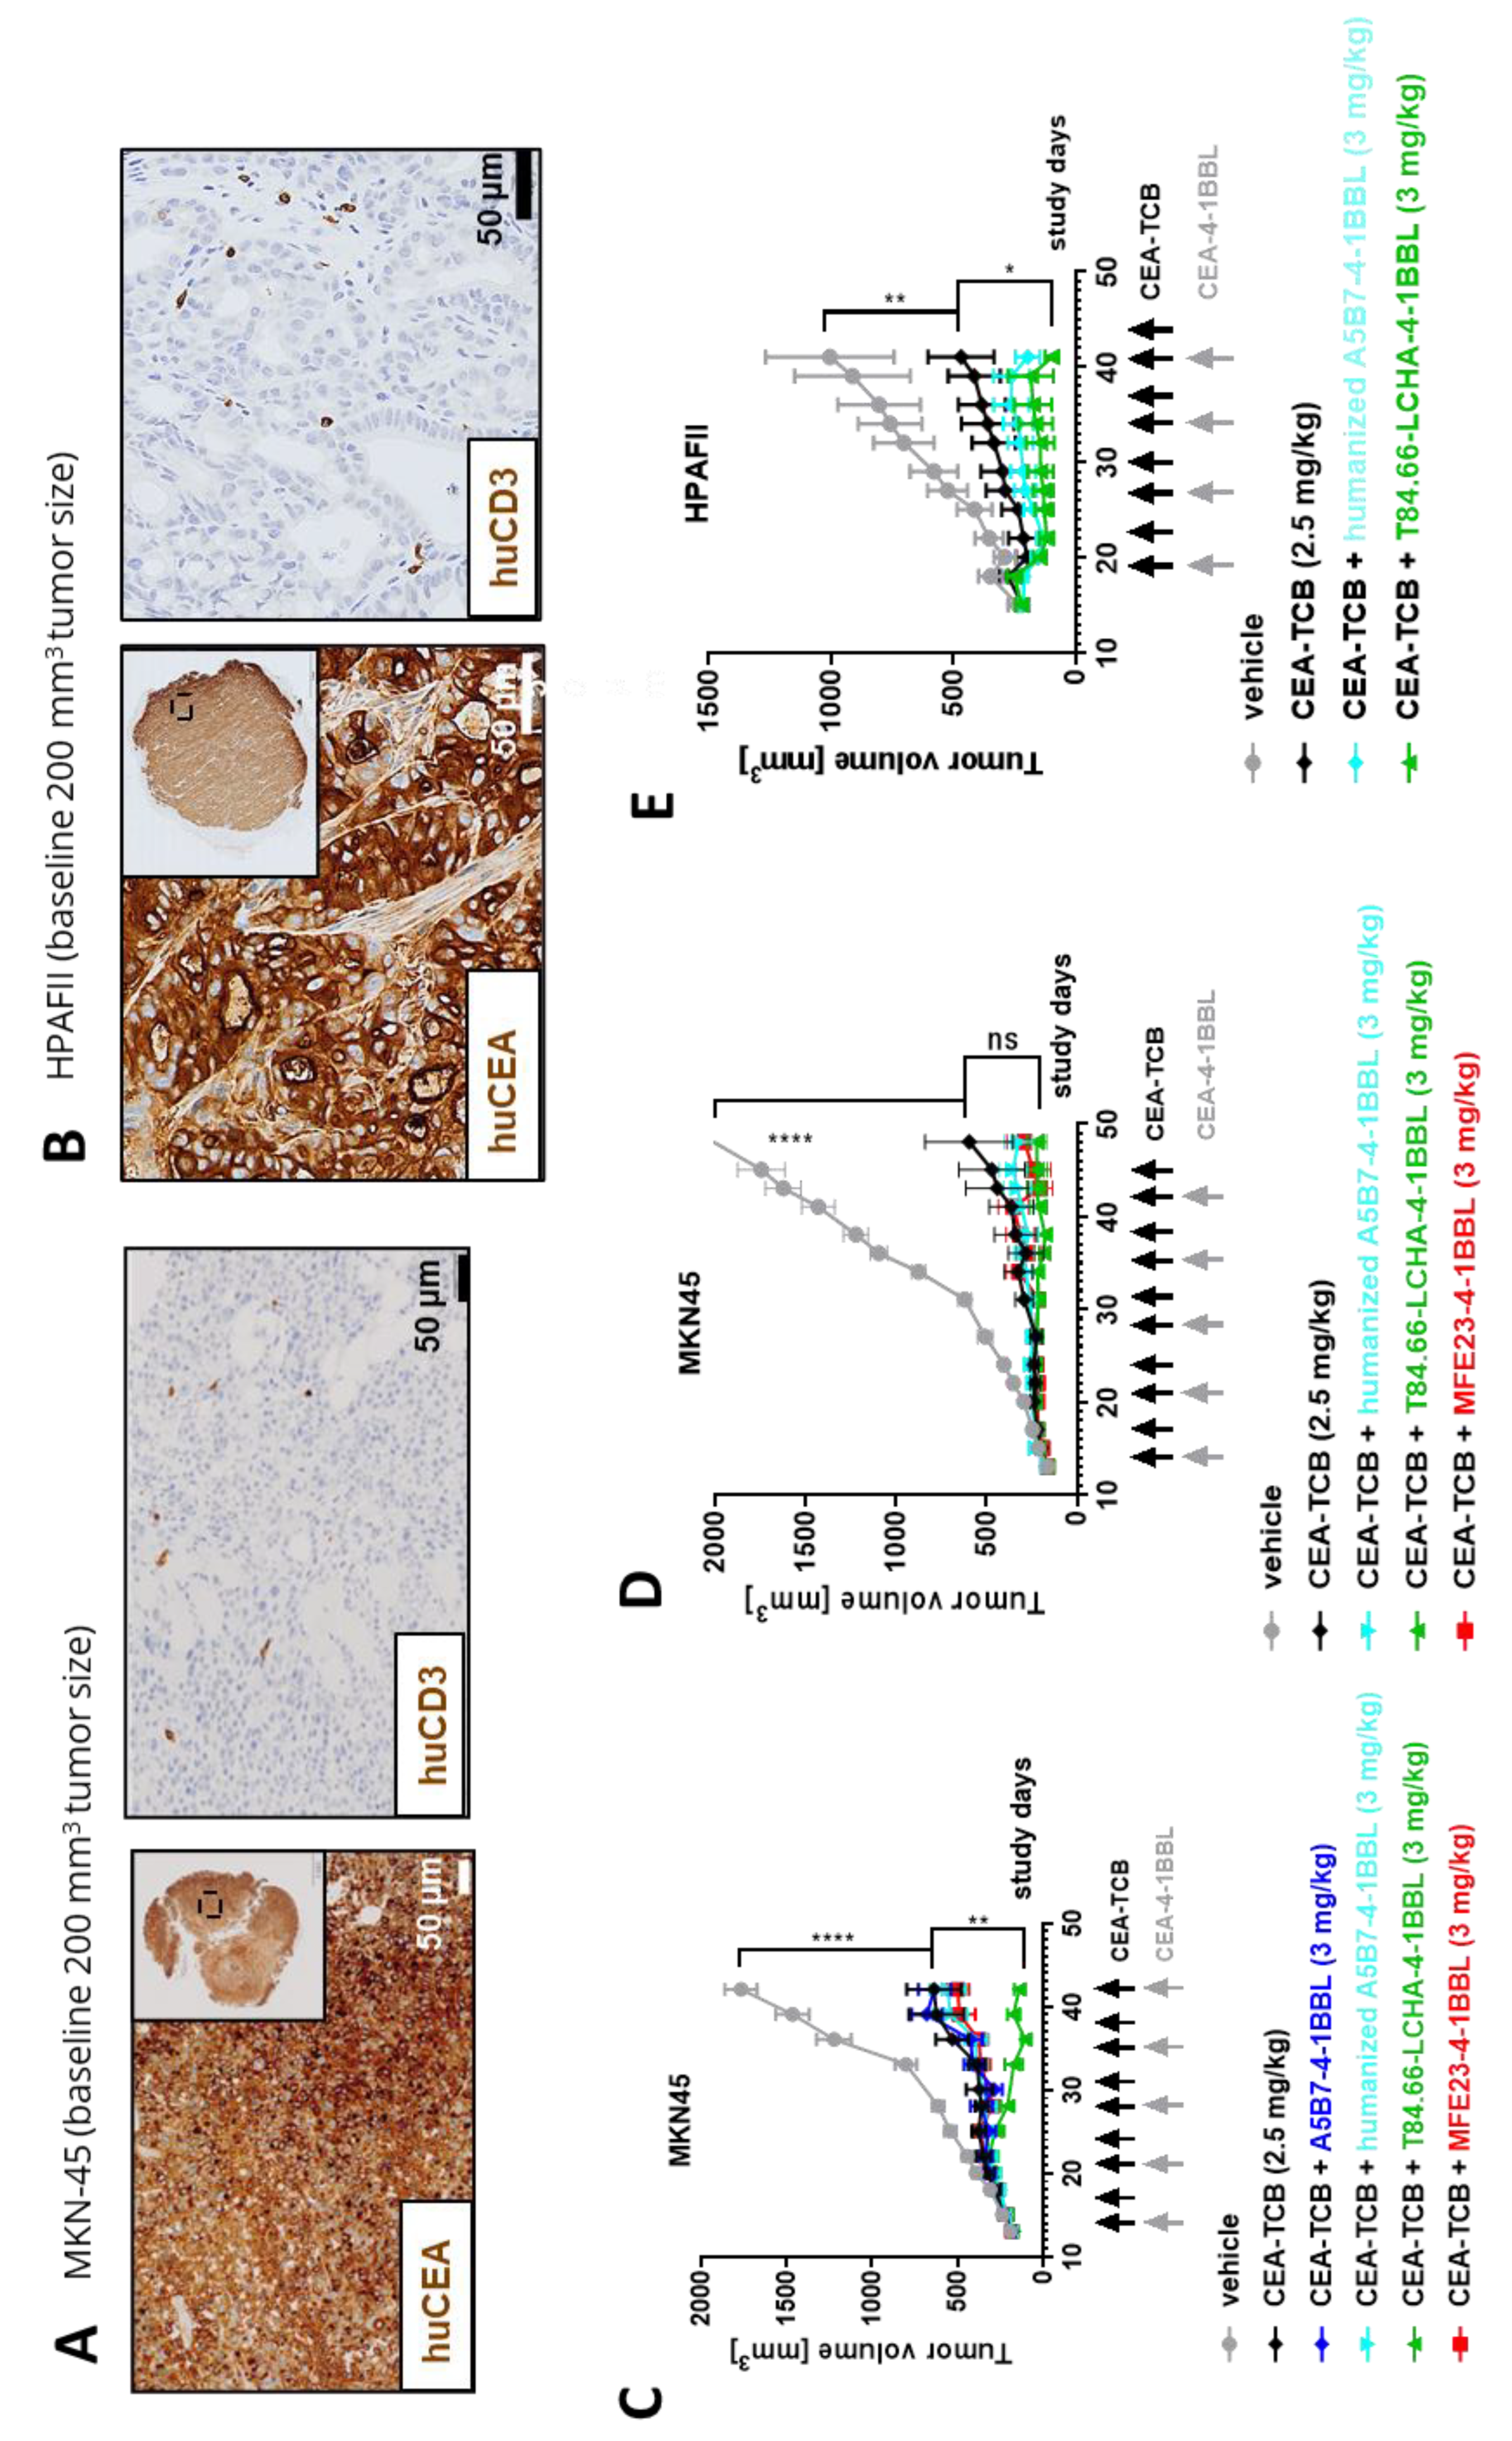
Finally, the potential of the different CEA-4-1BBL antibody fusion proteins as signal 2 providers in combination with CEA-TCB was tested in vivo in human CD34+ stem cell humanized NSG mice bearing subcutaneous human gastric adenocarcinoma MKN-45 or human pancreatic adenocarcinoma HPAFII xenografts. Both models exhibit comparable and high CEACAM5 expression and low CD3 T cell infiltration at baseline (
Figure 4A and
4B) making them xenograft models with good translational potential for colorectal, gastric and pancreatic cancers. All treated mice exhibited reduced tumor growth relative to vehicle. Notably, only T84.66-LCHA-4-1BBL consistently demonstrated significant tumor growth control across the performed experiments as a combination partner with CEA-TCB when compared CEA-TCB monotherapy (
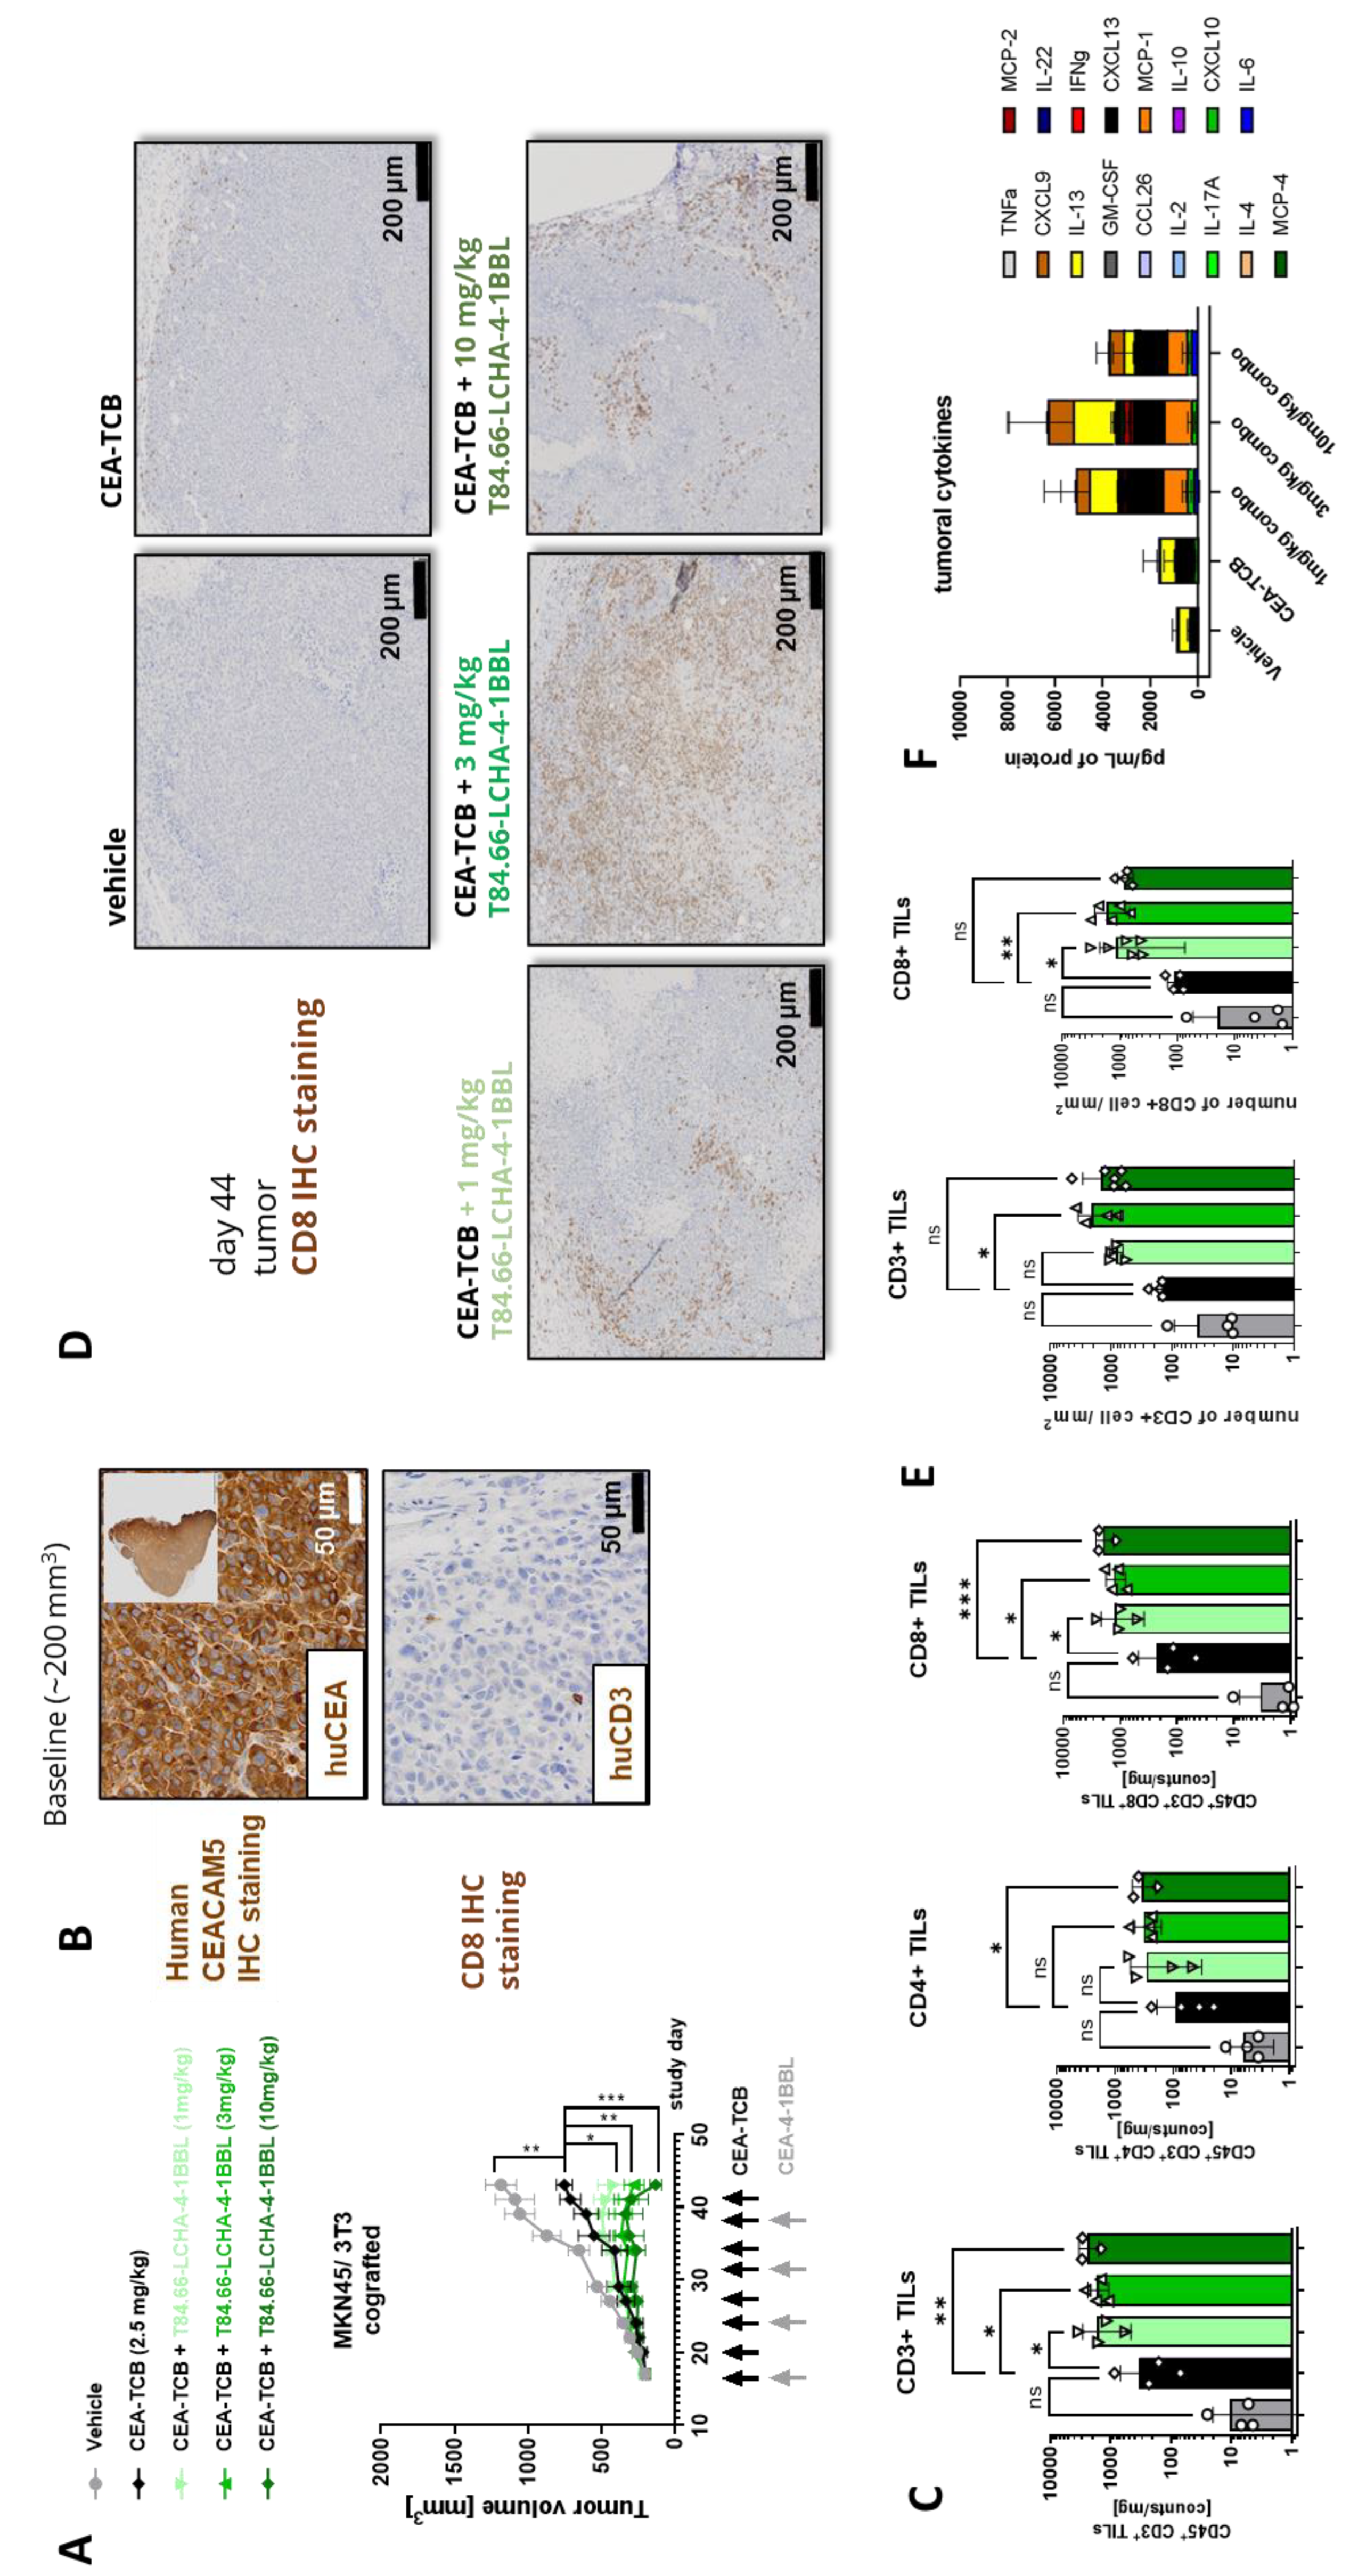
Figure 4C, D and E). To establish this activity further and evaluate the dose response relationship, T84.66-LCHA-4-1BBL was evaluated at three different doses in the MKN45/3T3 co-grafting tumor model in humanized NSG mice [
24]. Administration of T84.66-LCHA-4-1BBL at all three tested doses (1, 3, and 10 mg/kg) resulted in enhancement of CEA-TCB–mediated tumor growth inhibition (
Figure 5A), exhibiting a clear dose-dependent trend. Furthermore, treatment with all three doses resulted in comparable immune-pharmacodynamic effects in the tumor, as evidenced by flow cytometric analysis of human CD4⁺ and CD8⁺ T cell infiltration (
Figure 5C). Consistently, immunohistochemistry (
Figures 5D and
5E) demonstrated a significant increase in intratumoral human T cell density. Lastly, an increased accumulation of cytokines within the tumor was observed in the combination groups over CEA-TCB monotherapy at the study endpoint on day 44 (
Figure 5F).
4. Discussion
CEACAM5 is a well-studied marker for colorectal cancer and soluble CEA serves as FDA-approved diagnostic tumor marker [
22,
23]. Due to its broad and relatively tumor selective expression CEACAM5 has a high potential to serve as a target for different antibody-based cancer (immune-) therapies. Several CEA-targeted TCBs have reached clinical trials including CEA-TCB (cibisatamab) [
27] and MEDI-565/AMG211 [
54]. Clinical data have been reported for CEA-TCB as monotherapy and in combination with the PD-L1 antibody atezolizumab [
55]. Recently, promising data were reported for the TopoI payload-based CEACAM5 specific antibody drug conjugate precemtabart tocentecan in a Phase 1 study in colorectal cancer patients [
56]. Notably CEACAM5 has been described to display immune cell inhibitory functions. For example, CEACAM5 expressed by tumor cells can interact with CEACAM1 expressed by NK cells and lead to the inhibition of NK-cell-mediated tumor target cell killing [
57]. Furthermore, it has been proposed that CEACAM5 can directly interact with CD1d via its B3 domain and with CD8α via its N-domain leading to the formation of suppressive CD8 regulatory T cells [
58]. CEACAM5 expression in pancreatic cancer also correlates with an impairment of the tumoricidal function of M1 macrophages and neutrophils although the mechanism is not fully understood [
59].
Here different CEACAM5-specific antibodies directed against different epitopes/domains were tested to see which of these when used as targeting antibodies in CEA-4-1BBL fusion proteins would lead to the best CEA-4-1BBL-mediated tumor control in combination with CEA-TCB. Interestingly, in vitro MFE23-4-1BBL and Sm9b-4-1BBL (targeting membrane distal CEACAM5 epitopes) performed superior in binding on tumor cells and in the functional Jurkat-human-4-1BB-NFkB-luc2 reporter cell assay. Similarly, when combined with a CD3 antibody as signal 1 provider both molecules had a tendency to perform better in the PBMC activation assay. In contrast, T84.66-LCHA-4-1BBL targeting a membrane-proximal epitope showed weaker binding on tumor cells and the lowest activity in the reporter cell assay. However, when combined with CEA-TCB as signal 1 provider T84.66-LCHA-4-1BBL mediated overall the best activity, both in a human PBMC assay and in vivo in two different xenograft models in human CD34+ stem cell humanized NSG mice.
The location of the tumor target epitope, such as whether the binder-specific epitope is proximal or distal from the membrane, can influence T cell bispecific antibody function. Membrane-proximal epitopes are generally considered beneficial for TCBs as they favor formation of functional synapse between T and tumor cells. Indeed, Bluemel and colleagues used a MCSP-TCB comparing different MCSP-specific binders which recognized either membrane-proximal, central or membrane-distal domains [
60]. Membrane-proximal binding led to the strongest T cell-mediated tumor cell killing. Similarly, an EpCAM-TCB was tested, where not the EpCAM antibody but the location of the recognized epitope was modified by introducing spacers to mimic a more distal location of the same EpCAM epitope. In this example, creating a membrane-distal location led to the loss of bispecific-mediated T cell cytotoxicity [
60]. Li and colleagues have studied an FcRH5-TCB. The membrane-proximal domain FcRH5 binder demonstrated the strongest in vitro functionality, however, a membrane-distal binder mediated similar tumor cell killing when the epitope was moved in a membrane-proximal position through genetic engineering [
61]. Finally, Chen and colleagues investigated BCMA and Flt3 TCBs and their specific lysis capacity depending on epitope localization, affinity and molecular design of the bispecific antibodies [
62]. They showed that molecular design and tumor-target epitope location can decouple cytotoxicity and cytokine release and must be coordinated to achieve the best synapse and tumor killing results [
62]. Antigen-binding affinities, on the other hand, appear to be positively correlated with cytotoxicity and cytokine release [
62]. It is therefore reasonable to speculate that T84.66-LCHA-4-1BBL by virtue of binding to the membrane-proximal A3 domain turned out as optimal combination partner for CEA-TCB that recognizes the membrane-proximal B3 domain, thus, enabling optimal synapse formation (
Figure 1B,
Supplementary Figure 1).
In contrast, the improved performance of membrane-distal CEACAM5 binding CEA-4-1BBL bispecific molecules in vitro in the Jurkat-human-4-1BB-NFkB-luc2 reporter cell line assay was surprising, as in general a smaller interspace mimicking better the natural synapse formation are considered superior. In order to trigger TCR signaling in Jurkat reporter cells physical immobilization and crosslinking appears to be more important than the actual synapse formation. Accordingly, the ranking observed in the Jurkat-human-4-1BB-NFkB-luc2 reporter cell line assay was not reflected in the PBMC based activation assays. In vivo T84.66-LCHA-4-1BBL displayed the best tumor growth control in combination with CEA-TCB over several in vivo studies and models. Importantly, testing CEA-4-1BBL activity in the in vitro PMBC activation assay or in vivo requires presence of an active signal 1, whereas the Jurkat reporter cell line works without additional signal 1, and therefore ultimately may not reflect the impact of functional synapse formation in the presence bispecific molecules. Therefore, the reporter cell line assay in this particular case cannot be considered as assay of choice for the selection of bispecific lead candidates and a broader testing including TCBs as combination partners and in vivo experiments is recommended. Based on the totality of the PBMC activation and in vivo data in combination with CEA-TCB, T84.66-LCHA-4-1BBL was chosen as the lead. Due to the discontinuation of the clinical development of CEA-TCB (cibisatamab, RG7802) further preclinical development of T84.66-LCHA-4-1BBL was halted, however, these findings may be of relevance to the development of future CEACAM5-targeted costimulatory agents and their combination with T cell engagers.
Supplementary Materials
The following supporting information can be downloaded at the website of this paper posted on
Preprints.org, Table S1: NABA constructs and conditions used for determining the affinity constants of the CEACAM5 Fabs via Surface plasmon resonance (SPR); Table S2: EC50 in nM and area under the curve (AUC) values of binding curves to different CEACAM5 expressing tumor cell lines shown in
Figure 1E; Table S3: EC50 in nM and area under the curve (AUC) values of activation curves of Jurkat-human-4-1BB-NFkB-luc reporter cell line in the present of different CEACAM5 expressing tumor cell lines shown in
Figure 1F; Table S4: EC50 in nM and area under the curve (AUC) values of activation curves of the PBMC activation assay from two different donors shown in
Figure 2D; Table S5: Area under the curve (AUC) values of activation curves of the PBMC activation assay from two different donors shown in
Figure 2E; Table S6: EC50 in nM and area under the curve (AUC) values of binding curves to different transgenic cynomolgus monkey or human CEACAM5 expressing CHO-k1 cell lines shown in
Figure 3C and 3D; Table S7: EC50 in nM and area under the curve (AUC) values of binding curves to different transgenic cynomolgus monkey or human CEACAM5 expressing CHO-k1 cell lines shown in
Figure 3E. Figure S1: Interdomain distance of human CEACAM5 AlphaFold model. Centroids, defined as geometric centers of individual domains where calculated and depicted as red dots within each individual domains and used for distance calculation relative to the B3 centroid (depicted as green lines in A and reported in B). Similarly, centers of mass accounting for each domain’s atom mass were calculated and used for relative distance measurement (reported in B). Structural overlay of B3-A3 domains to solved CryoEM structure of tusamitamab bound to CEAMCAM5 (grey, PDB: 8BW0) allowed the calculation of maximal FV paratope distance between the CDRL1 and CDRH2 of a typical Fv antibody (C).
Author Contributions
Conceptualization, C.C., C.F.K, J.S., S.C., M.B., P.U., C.K.; methodology, C.C., C.F.K., J.S., S.L., R.A., R.B., E.B., V.N.; writing—original draft preparation, C.C., C.F.K, C.K.; writing—review and editing, C.C., C.F.K, V.N., C.K. G.L.S.; visualization, C.C.; supervision, C.C., C.F.K., S.C., M.B., P.U., C.K. All authors have read and agreed to the published version of the manuscript.
Funding
This research received no external funding
Institutional Review Board Statement
The experimental in vivo study protocol was reviewed and approved by local government (P2011/128, ZH193-2014 and ZH223/17).
Data Availability Statement
Data are available upon reasonable requests from the authors.
Acknowledgments
We thank all contributors from Roche Innovation Centers Basel, Zurich and Munich supporting this work.
Conflicts of Interest
All authors declare employment with Roche during the performance of this study. CC, CKF, JS, GLS, VN, SC, MB, PU, CK declare stock ownership and patents with Roche.
Abbreviations
The following abbreviations are used in this manuscript:
| CEA |
Carcinoembryonic Antigen 5 |
| CEACAM5 |
Carcinoembryonic Antigen Cell Adhesion Molecule 5 |
| FAP |
Fibroblast Activation Protein |
| MdFI |
Median Fluorescence Intensity |
| PBMC |
Peripheral Blood Mononuclear Cell |
| PET |
Positron Emission Tomography |
| SPR |
Surface Plasmon Resonance |
| TCB |
T Cell Bispecific antibody |
| TCR |
T Cell Receptor |
References
- Chan, A.C.; Martyn, G.D.; Carter, P.J. Fifty Years of Monoclonals: The Past, Present and Future of Antibody Therapeutics. Nat. Rev. Immunol. 2025, 25, 745–765. [Google Scholar] [CrossRef]
- Klein, C.; Brinkmann, U.; Reichert, J.M.; Kontermann, R.E. The Present and Future of Bispecific Antibodies for Cancer Therapy. Nat. Rev. Drug Discov. 2024, 23, 301–319. [Google Scholar] [CrossRef] [PubMed]
- Surowka, M.; Klein, C. A Pivotal Decade for Bispecific Antibodies? mAbs 2024, 16, 2321635. [Google Scholar] [CrossRef]
- Labrijn, A.F.; Janmaat, M.L.; Reichert, J.M.; Parren, P.W.H.I. Bispecific Antibodies: A Mechanistic Review of the Pipeline. Nat. Rev. Drug Discov. 2019, 18, 585–608. [Google Scholar] [CrossRef]
- Arvedson, T.; Bailis, J.M.; Britten, C.D.; Klinger, M.; Nagorsen, D.; Coxon, A.; Egen, J.G.; Martin, F. Targeting Solid Tumors with Bispecific T Cell Engager Immune Therapy. Annu. Rev. Cancer Biol. 2022, 6, 17–34. [Google Scholar] [CrossRef]
- Baeuerle, P.A.; Wesche, H. T-Cell-Engaging Antibodies for the Treatment of Solid Tumors: Challenges and Opportunities. Curr. Opin. Oncol. 2022, 34, 552–558. [Google Scholar] [CrossRef] [PubMed]
- Middelburg, J.; Kemper, K.; Engelberts, P.; Labrijn, A.F.; Schuurman, J.; van Hall, T. Overcoming Challenges for CD3-Bispecific Antibody Therapy in Solid Tumors. Cancers 2021, 13, 287. [Google Scholar] [CrossRef]
- Cao, L.; Leclercq-Cohen, G.; Klein, C.; Sorrentino, A.; Bacac, M. Mechanistic Insights into Resistance Mechanisms to T Cell Engagers. Front. Immunol. 2025, 16. [Google Scholar] [CrossRef]
- Oostindie, S.C.; Lazar, G.A.; Schuurman, J.; Parren, P.W.H.I. Avidity in Antibody Effector Functions and Biotherapeutic Drug Design. Nat. Rev. Drug Discov. 2022, 21, 715–735. [Google Scholar] [CrossRef]
- Claus, C.; Ferrara-Koller, C.; Klein, C. The Emerging Landscape of Novel 4-1BB (CD137) Agonistic Drugs for Cancer Immunotherapy. mAbs 2023, 15, 2167189. [Google Scholar] [CrossRef]
- Lotze, M.T.; Olejniczak, S.H.; Skokos, D. CD28 Co-Stimulation: Novel Insights and Applications in Cancer Immunotherapy. Nat. Rev. Immunol. 2024, 24, 878–895. [Google Scholar] [CrossRef] [PubMed]
- Olejniczak, S.H.; Lotze, M.T.; Skokos, D. Second Signals for Cancer Immunotherapy. J. Immunother. Cancer 2025, 13, e010530. [Google Scholar] [CrossRef]
- Sanmamed, M.F.; Etxeberría, I.; Otano, I.; Melero, I. Twists and Turns to Translating 4-1BB Cancer Immunotherapy. Sci. Transl. Med. 2019, 11, eaax4738. [Google Scholar] [CrossRef] [PubMed]
- Watts, T.H.; Yeung, K.K.M.; Yu, T.; Lee, S.; Eshraghisamani, R. TNF/TNFR Superfamily Members in Costimulation of T Cell Responses-Revisited. Annu. Rev. Immunol. 2025, 43, 113–142. [Google Scholar] [CrossRef]
- Eguren-Santamaría, I.; Sanmamed, M.F.; Molero-Glez, P.; Perez-Gracia, J.L.; Melero, I. Targeting T-Cell Costimulation to the Surface of Tumor Cells. Clin. Cancer Res. Off. J. Am. Assoc. Cancer Res. 2024. [Google Scholar] [CrossRef]
- Piha-Paul, S.; Olwill, S.A.; Hamilton, E.; Tolcher, A.; Pohlmann, P.; Liu, S.V.; Wurzenberger, C.; Hasenkamp, L.-C.; Hansbauer, E.-M.; Shroff, R.; et al. A First-in-Human Study of Cinrebafusp Alfa, a HER2/4-1BB Bispecific Molecule, in Patients with HER2-Positive Advanced Solid Malignancies. Clin. Cancer Res. Off. J. Am. Assoc. Cancer Res. 2025, 31, 288–298. [Google Scholar] [CrossRef]
- Ku, G.; Shen, L.; Dayyani, F.; Kratz, J.; Liang, X.; Liu, F.; Wang, Z.; Feller, L.; Girda, E.; Pan, H.; et al. A First-in-Human Study of Givastomig, a CLDN18.2 and 4-1BB Bispecific Antibody, as Monotherapy in Patients with CLDN18.2-Positive Advanced or Metastatic Solid Tumors. Clin. Cancer Res. Off. J. Am. Assoc. Cancer Res. 2025. [Google Scholar] [CrossRef]
- Muik, A.; Garralda, E.; Altintas, I.; Gieseke, F.; Geva, R.; Ben-Ami, E.; Maurice-Dror, C.; Calvo, E.; LoRusso, P.M.; Alonso, G.; et al. Preclinical Characterization and Phase I Trial Results of a Bispecific Antibody Targeting PD-L1 and 4-1BB (GEN1046) in Patients with Advanced Refractory Solid Tumors. Cancer Discov. 2022, 12, 1248–1265. [Google Scholar] [CrossRef] [PubMed]
- Pretelli, G.; Garralda, E. Rewiring Antitumor Immunity: Targeting CLDN18.2 with Conditional 4-1BB Activation. Clin. Cancer Res. Off. J. Am. Assoc. Cancer Res. 2025. [Google Scholar] [CrossRef]
- Melero, I.; Tanos, T.; Bustamante, M.; Sanmamed, M.F.; Calvo, E.; Moreno, I.; Moreno, V.; Hernandez, T.; Martinez Garcia, M.; Rodriguez-Vida, A.; et al. A First-in-Human Study of the Fibroblast Activation Protein-Targeted, 4-1BB Agonist RO7122290 in Patients with Advanced Solid Tumors. Sci. Transl. Med. 2023, 15, eabp9229. [Google Scholar] [CrossRef]
- Benchimol, S.; Fuks, A.; Jothy, S.; Beauchemin, N.; Shirota, K.; Stanners, C.P. Carcinoembryonic Antigen, a Human Tumor Marker, Functions as an Intercellular Adhesion Molecule. Cell 1989, 57, 327–334. [Google Scholar] [CrossRef]
- Thomas, J.; Klebanov, A.; John, S.; Miller, L.S.; Vegesna, A.; Amdur, R.L.; Bhowmick, K.; Mishra, L. CEACAMS 1, 5, and 6 in Disease and Cancer: Interactions with Pathogens. Genes Cancer 2023, 14, 12–29. [Google Scholar] [CrossRef]
- Thirunavukarasu, P.; Sukumar, S.; Sathaiah, M.; Mahan, M.; Pragatheeshwar, K.D.; Pingpank, J.F.; Zeh, H.; Bartels, C.J.; Lee, K.K.W.; Bartlett, D.L. C-Stage in Colon Cancer: Implications of Carcinoembryonic Antigen Biomarker in Staging, Prognosis, and Management. J. Natl. Cancer Inst. 2011, 103, 689–697. [Google Scholar] [CrossRef]
- Claus, C.; Ferrara, C.; Xu, W.; Sam, J.; Lang, S.; Uhlenbrock, F.; Albrecht, R.; Herter, S.; Schlenker, R.; Hüsser, T.; et al. Tumor-Targeted 4-1BB Agonists for Combination with T Cell Bispecific Antibodies as off-the-Shelf Therapy. Sci. Transl. Med. 2019, 11, eaav5989. [Google Scholar] [CrossRef]
- Trüb, M.; Uhlenbrock, F.; Claus, C.; Herzig, P.; Thelen, M.; Karanikas, V.; Bacac, M.; Amann, M.; Albrecht, R.; Ferrara-Koller, C.; et al. Fibroblast Activation Protein-Targeted-4-1BB Ligand Agonist Amplifies Effector Functions of Intratumoral T Cells in Human Cancer. J. Immunother. Cancer 2020, 8, e000238. [Google Scholar] [CrossRef]
- Bacac, M.; Colombetti, S.; Herter, S.; Sam, J.; Perro, M.; Chen, S.; Bianchi, R.; Richard, M.; Schoenle, A.; Nicolini, V.; et al. CD20-TCB with Obinutuzumab Pretreatment as Next-Generation Treatment of Hematologic Malignancies. Clin. Cancer Res. Off. J. Am. Assoc. Cancer Res. 2018, 24, 4785–4797. [Google Scholar] [CrossRef] [PubMed]
- Bacac, M.; Fauti, T.; Sam, J.; Colombetti, S.; Weinzierl, T.; Ouaret, D.; Bodmer, W.; Lehmann, S.; Hofer, T.; Hosse, R.J.; et al. A Novel Carcinoembryonic Antigen T-Cell Bispecific Antibody (CEA TCB) for the Treatment of Solid Tumors. Clin. Cancer Res. Off. J. Am. Assoc. Cancer Res. 2016, 22, 3286–3297. [Google Scholar] [CrossRef]
- Lehmann, S.; Perera, R.; Grimm, H.-P.; Sam, J.; Colombetti, S.; Fauti, T.; Fahrni, L.; Schaller, T.; Freimoser-Grundschober, A.; Zielonka, J.; et al. In Vivo Fluorescence Imaging of the Activity of CEA TCB, a Novel T-Cell Bispecific Antibody, Reveals Highly Specific Tumor Targeting and Fast Induction of T-Cell-Mediated Tumor Killing. Clin. Cancer Res. Off. J. Am. Assoc. Cancer Res. 2016, 22, 4417–4427. [Google Scholar] [CrossRef] [PubMed]
- Griessinger, C.M.; Olafsen, T.; Mascioni, A.; Jiang, Z.K.; Zamilpa, C.; Jia, F.; Torgov, M.; Romero, J.M.; Marchioni, F.; Satpayev, D.; et al. The PET-Tracer 89Zr-Df-IAB22M2C Enables Monitoring of Intratumoral CD8 T-Cell Infiltrates in Tumor-Bearing Humanized Mice after T-Cell Bispecific Antibody Treatment. Cancer Res. 2020, 80, 2903–2913. [Google Scholar] [CrossRef] [PubMed]
- Otano, I.; Azpilikueta, A.; Glez-Vaz, J.; Alvarez, M.; Medina-Echeverz, J.; Cortés-Domínguez, I.; Ortiz-de-Solorzano, C.; Ellmark, P.; Fritzell, S.; Hernandez-Hoyos, G.; et al. CD137 (4-1BB) Costimulation of CD8+ T Cells Is More Potent When Provided in Cis than in Trans with Respect to CD3-TCR Stimulation. Nat. Commun. 2021, 12, 7296. [Google Scholar] [CrossRef]
- Sun, Y.; Zhou, L.; Gu, X.; Zhao, J.; Bi, J.; Pan, L. Leveraging T Cell Co-Stimulation for Enhanced Therapeutic Efficacy of Trispecific Antibodies Targeting Prostate Cancer. J. Immunother. Cancer 2025, 13, e010140. [Google Scholar] [CrossRef] [PubMed]
- Kamikawa, T.; Kimura, N.; Ishii, S.; Muraoka, M.; Kodama, T.; Taniguchi, K.; Yoshimoto, M.; Miura-Okuda, M.; Uchikawa, R.; Kato, C.; et al. SAIL66, a next Generation CLDN6-Targeting T-Cell Engager, Demonstrates Potent Antitumor Efficacy through Dual Binding to CD3/CD137. J. Immunother. Cancer 2024, 12, e009563. [Google Scholar] [CrossRef]
- Mikami, H.; Feng, S.; Matsuda, Y.; Ishii, S.; Naoi, S.; Azuma, Y.; Nagano, H.; Asanuma, K.; Kayukawa, Y.; Tsunenari, T.; et al. Engineering CD3/CD137 Dual Specificity into a DLL3-Targeted T-Cell Engager Enhances T-Cell Infiltration and Efficacy against Small-Cell Lung Cancer. Cancer Immunol. Res. 2024, 12, 719–730. [Google Scholar] [CrossRef]
- Carter, P. Bispecific Human IgG by Design. J. Immunol. Methods 2001, 248, 7–15. [Google Scholar] [CrossRef]
- Schaefer, W.; Regula, J.T.; Bähner, M.; Schanzer, J.; Croasdale, R.; Dürr, H.; Gassner, C.; Georges, G.; Kettenberger, H.; Imhof-Jung, S.; et al. Immunoglobulin Domain Crossover as a Generic Approach for the Production of Bispecific IgG Antibodies. Proc. Natl. Acad. Sci. U. S. A. 2011, 108, 11187–11192. [Google Scholar] [CrossRef] [PubMed]
- Regula, J.T.; Imhof-Jung, S.; Mølhøj, M.; Benz, J.; Ehler, A.; Bujotzek, A.; Schaefer, W.; Klein, C. Variable Heavy-Variable Light Domain and Fab-Arm CrossMabs with Charged Residue Exchanges to Enforce Correct Light Chain Assembly. Protein Eng. Des. Sel. PEDS 2018, 31, 289–299. [Google Scholar] [CrossRef]
- Schlothauer, T.; Herter, S.; Koller, C.F.; Grau-Richards, S.; Steinhart, V.; Spick, C.; Kubbies, M.; Klein, C.; Umaña, P.; Mössner, E. Novel Human IgG1 and IgG4 Fc-Engineered Antibodies with Completely Abolished Immune Effector Functions. Protein Eng. Des. Sel. PEDS 2016, 29, 457–466. [Google Scholar] [CrossRef]
- Jumper, J.; Evans, R.; Pritzel, A.; Green, T.; Figurnov, M.; Ronneberger, O.; Tunyasuvunakool, K.; Bates, R.; Žídek, A.; Potapenko, A.; et al. Highly Accurate Protein Structure Prediction with AlphaFold. Nature 2021, 596, 583–589. [Google Scholar] [CrossRef]
- Fleming, J.; Magana, P.; Nair, S.; Tsenkov, M.; Bertoni, D.; Pidruchna, I.; Lima Afonso, M.Q.; Midlik, A.; Paramval, U.; Žídek, A.; et al. AlphaFold Protein Structure Database and 3D-Beacons: New Data and Capabilities. J. Mol. Biol. 2025, 437, 168967. [Google Scholar] [CrossRef]
- Korotkova, N.; Yang, Y.; Le Trong, I.; Cota, E.; Demeler, B.; Marchant, J.; Thomas, W.E.; Stenkamp, R.E.; Moseley, S.L.; Matthews, S. Binding of Dr Adhesins of Escherichia Coli to Carcinoembryonic Antigen Triggers Receptor Dissociation. Mol. Microbiol. 2008, 67, 420–434. [Google Scholar] [CrossRef] [PubMed]
- Kumar, A.; Duffieux, F.; Gagnaire, M.; Rapisarda, C.; Bertrand, T.; Rak, A. Structural Insights into Epitope-Paratope Interactions of a Monoclonal Antibody Targeting CEACAM5-Expressing Tumors. Nat. Commun. 2024, 15, 9377. [Google Scholar] [CrossRef] [PubMed]
- Bacac, M.; Klein, C.; Umana, P. CEA TCB: A Novel Head-to-Tail 2:1 T Cell Bispecific Antibody for Treatment of CEA-Positive Solid Tumors. Oncoimmunology 2016, 5, e1203498. [Google Scholar] [CrossRef]
- Teijeira, A.; Migueliz, I.; Garasa, S.; Karanikas, V.; Luri, C.; Cirella, A.; Olivera, I.; Cañamero, M.; Alvarez, M.; Ochoa, M.C.; et al. Three-Dimensional Colon Cancer Organoids Model the Response to CEA-CD3 T-Cell Engagers. Theranostics 2022, 12, 1373–1387. [Google Scholar] [CrossRef] [PubMed]
- Neumaier, M.; Shively, L.; Chen, F.S.; Gaida, F.J.; Ilgen, C.; Paxton, R.J.; Shively, J.E.; Riggs, A.D. Cloning of the Genes for T84.66, an Antibody That Has a High Specificity and Affinity for Carcinoembryonic Antigen, and Expression of Chimeric Human/Mouse T84.66 Genes in Myeloma and Chinese Hamster Ovary Cells. Cancer Res. 1990, 50, 2128–2134. [Google Scholar]
- Yazaki, P.J.; Sherman, M.A.; Shively, J.E.; Ikle, D.; Williams, L.E.; Wong, J.Y.C.; Colcher, D.; Wu, A.M.; Raubitschek, A.A. Humanization of the Anti-CEA T84.66 Antibody Based on Crystal Structure Data. Protein Eng. Des. Sel. PEDS 2004, 17, 481–489. [Google Scholar] [CrossRef]
- Harwood, P.J.; Britton, D.W.; Southall, P.J.; Boxer, G.M.; Rawlins, G.; Rogers, G.T. Mapping Epitope Characteristics on Carcinoembryonic Antigen. Br. J. Cancer 1986, 54, 75–82. [Google Scholar] [CrossRef]
- Chester, K.A.; Robson, L.; Keep, P.A.; Pedley, R.B.; Boden, J.A.; Boxer, G.M.; Hawkins, R.E.; Begent, R.H. Production and Tumour-Binding Characterization of a Chimeric Anti-CEA Fab Expressed in Escherichia Coli. Int. J. Cancer 1994, 57, 67–72. [Google Scholar] [CrossRef]
- Boehm, M.K.; Corper, A.L.; Wan, T.; Sohi, M.K.; Sutton, B.J.; Thornton, J.D.; Keep, P.A.; Chester, K.A.; Begent, R.H.; Perkins, S.J. Crystal Structure of the Anti-(Carcinoembryonic Antigen) Single-Chain Fv Antibody MFE-23 and a Model for Antigen Binding Based on Intermolecular Contacts. Biochem. J. 2000, 346 Pt 2, 519–528. [Google Scholar] [CrossRef]
- Chester, K.A.; Begent, R.H.; Robson, L.; Keep, P.; Pedley, R.B.; Boden, J.A.; Boxer, G.; Green, A.; Winter, G.; Cochet, O. Phage Libraries for Generation of Clinically Useful Antibodies. Lancet Lond. Engl. 1994, 343, 455–456. [Google Scholar] [CrossRef]
- Graff, C.P.; Chester, K.; Begent, R.; Wittrup, K.D. Directed Evolution of an Anti-Carcinoembryonic Antigen scFv with a 4-Day Monovalent Dissociation Half-Time at 37 Degrees C. Protein Eng. Des. Sel. PEDS 2004, 17, 293–304. [Google Scholar] [CrossRef] [PubMed]
- Yamamoto, Y.; Hirakawa, E.; Mori, S.; Hamada, Y.; Kawaguchi, N.; Matsuura, N. Cleavage of Carcinoembryonic Antigen Induces Metastatic Potential in Colorectal Carcinoma. Biochem. Biophys. Res. Commun. 2005, 333, 223–229. [Google Scholar] [CrossRef]
- Conaghan, P.; Ashraf, S.; Tytherleigh, M.; Wilding, J.; Tchilian, E.; Bicknell, D.; Mortensen, N.J.; Bodmer, W. Targeted Killing of Colorectal Cancer Cell Lines by a Humanised IgG1 Monoclonal Antibody That Binds to Membrane-Bound Carcinoembryonic Antigen. Br. J. Cancer 2008, 98, 1217–1225. [Google Scholar] [CrossRef] [PubMed]
- Wild, N.; Andres, H.; Rollinger, W.; Krause, F.; Dilba, P.; Tacke, M.; Karl, J. A Combination of Serum Markers for the Early Detection of Colorectal Cancer. Clin. Cancer Res. Off. J. Am. Assoc. Cancer Res. 2010, 16, 6111–6121. [Google Scholar] [CrossRef]
- Oberst, M.D.; Fuhrmann, S.; Mulgrew, K.; Amann, M.; Cheng, L.; Lutterbuese, P.; Richman, L.; Coats, S.; Baeuerle, P.A.; Hammond, S.A. CEA/CD3 Bispecific Antibody MEDI-565/AMG 211 Activation of T Cells and Subsequent Killing of Human Tumors Is Independent of Mutations Commonly Found in Colorectal Adenocarcinomas. mAbs 2014, 6, 1571–1584. [Google Scholar] [CrossRef]
- Segal, N.H.; Melero, I.; Moreno, V.; Steeghs, N.; Marabelle, A.; Rohrberg, K.; Rodriguez-Ruiz, M.E.; Eder, J.P.; Eng, C.; Manji, G.A.; et al. CEA-CD3 Bispecific Antibody Cibisatamab with or without Atezolizumab in Patients with CEA-Positive Solid Tumours: Results of Two Multi-Institutional Phase 1 Trials. Nat. Commun. 2024, 15, 4091. [Google Scholar] [CrossRef] [PubMed]
- Kopetz, S.; Boni, V.; Kato, K.; Raghav, K.P.S.; Vieito, M.; Pallis, A.; Habermehl, C.; Siddiqui, A.; Courlet, P.; Sloot, W.; et al. Precemtabart Tocentecan, an Anti-CEACAM5 Antibody-Drug Conjugate, in Metastatic Colorectal Cancer: A Phase 1 Trial. Nat. Med. 2025, 31, 3504–3513. [Google Scholar] [CrossRef]
- Stern, N.; Markel, G.; Arnon, T.I.; Gruda, R.; Wong, H.; Gray-Owen, S.D.; Mandelboim, O. Carcinoembryonic Antigen (CEA) Inhibits NK Killing via Interaction with CEA-Related Cell Adhesion Molecule 1. J. Immunol. Baltim. Md 1950 2005, 174, 6692–6701. [Google Scholar] [CrossRef]
- Roda, G.; Jianyu, X.; Park, M.S.; DeMarte, L.; Hovhannisyan, Z.; Couri, R.; Stanners, C.P.; Yeretssian, G.; Mayer, L. Characterizing CEACAM5 Interaction with CD8α and CD1d in Intestinal Homeostasis. Mucosal Immunol. 2014, 7, 615–624. [Google Scholar] [CrossRef]
- Shi, H.; Tsang, Y.; Yang, Y. Identification of CEACAM5 as a Stemness-Related Inhibitory Immune Checkpoint in Pancreatic Cancer. BMC Cancer 2022, 22, 1291. [Google Scholar] [CrossRef] [PubMed]
- Bluemel, C.; Hausmann, S.; Fluhr, P.; Sriskandarajah, M.; Stallcup, W.B.; Baeuerle, P.A.; Kufer, P. Epitope Distance to the Target Cell Membrane and Antigen Size Determine the Potency of T Cell-Mediated Lysis by BiTE Antibodies Specific for a Large Melanoma Surface Antigen. Cancer Immunol. Immunother. CII 2010, 59, 1197–1209. [Google Scholar] [CrossRef]
- Li, J.; Stagg, N.J.; Johnston, J.; Harris, M.J.; Menzies, S.A.; DiCara, D.; Clark, V.; Hristopoulos, M.; Cook, R.; Slaga, D.; et al. Membrane-Proximal Epitope Facilitates Efficient T Cell Synapse Formation by Anti-FcRH5/CD3 and Is a Requirement for Myeloma Cell Killing. Cancer Cell 2017, 31, 383–395. [Google Scholar] [CrossRef] [PubMed]
- Chen, W.; Yang, F.; Wang, C.; Narula, J.; Pascua, E.; Ni, I.; Ding, S.; Deng, X.; Chu, M.L.-H.; Pham, A.; et al. One Size Does Not Fit All: Navigating the Multi-Dimensional Space to Optimize T-Cell Engaging Protein Therapeutics. mAbs 2021, 13, 1871171. [Google Scholar] [CrossRef] [PubMed]
|
Disclaimer/Publisher’s Note: The statements, opinions and data contained in all publications are solely those of the individual author(s) and contributor(s) and not of MDPI and/or the editor(s). MDPI and/or the editor(s) disclaim responsibility for any injury to people or property resulting from any ideas, methods, instructions or products referred to in the content. |
© 2025 by the authors. Licensee MDPI, Basel, Switzerland. This article is an open access article distributed under the terms and conditions of the Creative Commons Attribution (CC BY) license (http://creativecommons.org/licenses/by/4.0/).