
Submitted:
29 September 2025
Posted:
29 September 2025
You are already at the latest version
Abstract
High temperatures during grain filling degrade rice quality, yet the metabolite-level basis of varietal tolerance—particularly root contributions—remains unclear. We compared the heat-tolerant ‘Fusaotome’ and the widely grown ‘Akitakomachi’ under control and high-temperature conditions. Panicles and roots were sampled at heading and profiled by capillary electrophoresis–mass spectrometry (CE–MS), followed by PCA, univariate testing, and KEGG pathway analysis. PCA resolved treatment and cultivar differences in an organ-specific manner. In panicles, ‘Fusaotome’ showed 8 metabolites increased (≥1.5-fold) and 11 decreased (≤1/1.5), whereas ‘Akitakomachi’ showed 19 increases and 6 decreases (p<0.05). In roots, 12 metabolites increased in ‘Fusaotome’ and 9 in ‘Akitakomachi’; no significant decreases were detected. Pathway analysis indicated activation in ‘Fusaotome’ panicles of tryptophan, nicotinate/nicotinamide, arginine/proline, glycolysis/TCA, pyruvate, and vitamin B6 pathways, while ‘Akitakomachi’ emphasized phenylpropanoid, isoquinoline alkaloid, caffeine, and ubiquinone/terpenoid–quinone biosynthesis. In roots, ‘Fusaotome’ prioritized phenylalanine/phenylpropanoid, aromatic amino acids, lysine degradation, branched-chain amino acids, glycerophospholipids, and alkaloids, whereas ‘Akitakomachi’ favored nitrogen- and antioxidant-related routes. Collectively, the tolerant cultivar maintained antioxidant capacity and energy supply while coordinating root–panicle metabolism, whereas the susceptible cultivar shifted toward secondary defenses. These signatures nominate candidate metabolic markers and targets for breeding and management to stabilize rice production under warming climates.
Keywords:
grain filling
; heat tolerance
; metabolomics (CE–MS)
; Oryza sativa L.
; panicle
; root
1. Introduction
Global warming has exerted a profound impact on global food production, and, in particular, high temperatures from the heading stage to grain filling substantially reduce both yield and quality in rice crops. In warm regions of Japan, deterioration of brown rice quality—most notably an increase in chalkiness—has been widely documented, with significant rises in chalky grains reported alongside rising air temperatures [1,2].
Two principal physiological constraints underlie heat-induced grain quality deterioration: (1) a shortage of photoassimilate supply to the endosperm (source limitation) and (2) reduced endosperm capacity for starch biosynthesis (sink limitation), which together lead to insufficient starch accumulation and consequently inferior grain appearance and quality [3,4]. With ongoing climate change, these drivers are likely to intensify, warranting elucidation of the physiological mechanisms that confer tolerance to high temperature during the heading-to-grain-filling period urgently.
To decipher heat stress responses, omics approaches, including metabolomics, have been increasingly employed in recent years. Yamakawa and Hakata [4] showed, through the integration of grain metabolome and transcriptome datasets, that high temperature suppresses the expression of starch biosynthetic genes while inducing amino acid accumulation. Proteomic analyses have likewise indicated conspicuous heat-induced changes in enzymes involved in starch metabolism and stress-responsive proteins [5]. Moreover, high temperature—especially when associated with elevated night temperatures—broadly perturbs central metabolism (glycolysis and the tricarboxylic acid (TCA) cycle), amino acid metabolism, and polyamine-related metabolism [4,6]. Additionally, heat stress increases the production of reactive oxygen species (ROS), triggering oxidative stress. Plants maintain redox homeostasis through antioxidant enzymes and low-molecular-weight antioxidants [7], and enhanced antioxidant enzyme activities may contribute to heat tolerance in rice [8,9].
However, most previous studies have focused on aboveground organs (panicles and leaves), where heat injury is most directly observed. In contrast, less is known about roots, which are metabolically active under environmental stress and indirectly support photosynthesis and starch deposition by supplying water and nutrients. Heat has been reported to impair root system formation, respiration, and water and nutrient uptake in rice [10,11].
To address this gap, we compared the metabolite dynamics in panicles and roots under high-temperature conditions between a heat-tolerant cultivar, ‘Fusaotome’, and a widely cultivated Japanese cultivar, ‘Akitakomachi’. Specifically, we established control and high-temperature treatments, sampled tissues at heading, and conducted comprehensive metabolomic profiling using capillary electrophoresis–mass spectrometry (CE-MS). Our objectives were to clarify (1) the impacts of high temperature on metabolite levels in panicles and roots and (2) cultivar-specific strategies for pathway activation. The outcomes provide a physiological basis for heat tolerance during grain filling and foundational knowledge for developing metabolic markers to support breeding programs and refine cultivation practices.
2. Materials and Methods
2.1. Plant Materials and Cultivation
Experiments were conducted at the experimental field of the Akita Prefectural University (140°05′E, 39°80′N) in 2022. Two cultivars were used: the heat-tolerant ‘Fusaotome’ and the widely cultivated Japanese cultivar ‘Akitakomachi’. Seeds were sown on April 28, 2022, in a growth chamber using Inaho granular soil (Inaho-Kako Co., Ltd., Toyama, Japan) and grown as seedlings. On May 25, 2022, single seedlings were transplanted into 1/5000-a Wagner pots filled with 3 L of Inaho granular soil. Slow-release fertilizers (Ecolong Total 391-70 and 391-140; National Federation of Agricultural Cooperative Associations, Tokyo, Japan) were each added at 0.6 g per pot. Plants were cultivated under flooded conditions. Three biological replicates were prepared for each treatment and cultivar.
2.2. Experimental Treatments
High-temperature treatment began on July 30, 2022, when pots were moved into a vinyl greenhouse located within the experimental field. The treatment was maintained until sampling. High-temperature treatments were conducted inside the greenhouse, while controls were maintained outdoors under ambient conditions. Air temperature in each treatment was recorded hourly using Em5b+RT-1 sensors (Decagon Devices, Pullman, WA, USA).
2.3. Sampling
Panicles and roots were sampled immediately after heading. Sampling dates for ‘Akitakomachi’ were August 9 (high temperature) and August 16, 2022 (control), and August 16 (high temperature) and August 22 (control) for ‘Fusaotome’. Panicles were immediately frozen in liquid nitrogen upon harvest. Roots were carefully washed within 5 min and frozen in liquid nitrogen. Frozen samples were lyophilized, pulverized, and subjected to metabolomic analysis.
2.4. Metabolomic Analysis
Metabolomic analysis was outsourced to Human Metabolome Technologies, Inc. (Tsuruoka, Yamagata, Japan). Approximately 10 mg of lyophilized tissue was extracted with 600 μL of methanol containing 50 μM internal standards, and homogenized on ice using a cell disruptor (BMS-M10N21; Bio Medical Science Inc., Tokyo, Japan) (4 °C, 1500 ×g, 2 min × 2). Chloroform (500 μL) and Milli-Q water (200 μL) were added, followed by centrifugation (2,300 ×g, 4 °C, 5 min). The aqueous phase was transferred to an ultrafiltration tube (Ultrafree-MC PLHCC HMT 5 kDa; Millipore) and centrifuged (9,100 ×g, 4 °C, 120 min). Filtrates were dried and reconstituted in 50 μL of Milli-Q water. Samples were analyzed by CE–TOF–MS (Agilent CE–TOF–MS; Agilent, Palo Alto, CA, USA) as described in Soga, et al. [12].
2.5. Data Analysis
For metabolite datasets, principal component analysis (PCA) and t-tests were performed using JMP 8 (SAS Institute Inc., Cary, NC, USA). Pathway analysis was conducted with MetaboAnalyst 6.0 (https://www.metaboanalyst.ca/), and pathway impact values were calculated [13].
3. Results
3.1. Temperature Conditions in Treatments
Temporal changes in air temperature during the experimental period are shown in Figure 1. During daytime under the treatment, the mean temperatures in ‘Akitakomachi’ were 26.5 °C (control) and 31.8 °C (high temperature), and those in ‘Fusaotome’ were 26.7 °C (control) and 30.5 °C (high temperature). Thus, the high-temperature treatments in ‘Akitakomachi’ and ‘Fusaotome’ were +5.3 °C and +3.8 °C above the controls, respectively (Table 1). The nighttime means were 22.3 °C (control) and 24.6 °C (high temperature) for ‘Akitakomachi’, and 22.1 °C (control) and 24.8 °C (high temperature) for ‘Fusaotome’, i.e., +2.3 °C and +2.7 °C relative to the control, respectively. These differences confirm that the high-temperature treatment was properly implemented.
3.2. Effects of High Temperature on Metabolite Profiles in Panicles and Roots
We detected 312 metabolites in panicles and 262 in roots. PCA was used to visualize treatment- and cultivar-dependent separations (Figure 2). In panicles, control and high-temperature samples separated clearly along PC2, indicating pronounced heat-induced metabolic shifts. Cultivar differences under high temperature were also evident between ‘Fusaotome’ and ‘Akitakomachi’. In the roots, ‘Akitakomachi’ showed clear control vs. high-temperature separation along PC2, whereas ‘Fusaotome’ separated along PC1 but with a smaller magnitude of difference.
3.3. Metabolite-Level Responses to High Temperature
Metabolites differing significantly between control and high temperature were extracted and visualized by volcano plots (Figure 3). Compounds showing significant changes at p < 0.05 with ≥1.5-fold increases or ≤1/1.5-fold decreases are summarized in Table 2 and Table 3.
In the panicles of ‘Fusaotome’, 8 metabolites increased ≥1.5-fold (mainly amino acid metabolism-related), while 11 decreased to ≤1/1.5-fold, mostly associated with amino acid, carbohydrate, and energy metabolism (Table 2). In ‘Akitakomachi’ panicles, 19 metabolites increased ≥1.5-fold, primarily ornithine and aromatic amino acid-related compounds, whereas 6 decreased to ≤1/1.5-fold, many of which were implicated in antioxidant capacity and stress responses.
In the roots, 12 metabolites increased ≥1.5-fold in ‘Fusaotome’, mainly related to nitrogen and amino acid metabolism (Table 3). In ‘Akitakomachi’, nine metabolites increased ≥1.5-fold, including amino acid derivatives, organic acids, and antioxidant-related compounds. No metabolites decreased significantly to ≤1/1.5-fold in the roots of either cultivar.
3.4. Pathway-Level Responses to High Temperature
Based on differential metabolites, pathway analysis using the KEGG database was performed. For each cultivar and organ, relationships between pathway impact and −log10 (p-value) are shown (Figure 4). A pathway “score” was computed as the product of impact and −log10 (p-value), and inter-cultivar differences were evaluated.
In ‘Fusaotome’ panicles, tryptophan metabolism, nicotinate and nicotinamide metabolism, arginine and proline metabolism, glycolysis and the TCA cycle, pyruvate metabolism, and vitamin B6 metabolism exhibited high scores (Table 4). These pathways are associated with antioxidant responses and energy supply, suggesting that ‘Fusaotome’ maintains metabolic homeostasis even under high temperature. In ‘Akitakomachi’ panicles, phenylpropanoid biosynthesis, isoquinoline alkaloid biosynthesis, caffeine metabolism, and ubiquinone/terpenoid–quinone biosynthesis showed high scores (Table 5), largely representing secondary metabolism with an emphasis on defensive responses.
In ‘Fusaotome’ roots, phenylalanine metabolism and phenylpropanoid biosynthesis, tyrosine/tryptophan-related routes, lysine degradation, branched-chain amino acid metabolism (valine, leucine, isoleucine), glycerophospholipid metabolism, and alkaloid biosynthesis showed high scores (Table 6). These pathways are related to antioxidant defense, cell wall reinforcement, carbon–nitrogen reutilization, and membrane stabilization. In ‘Akitakomachi’ roots, alanine, aspartate, and glutamate metabolism; cysteine and methionine metabolism; tryptophan metabolism; arginine and proline metabolism; taurine and hypotaurine metabolism; β-alanine metabolism; and cyanoamino acid metabolism were enriched (Table 7), indicating a bias toward nitrogen metabolism and antioxidant-related pathways.
4. Discussion
We compared metabolite and pathway dynamics in panicles and roots of the heat-tolerant ‘Fusaotome’ and the commonly cultivated ‘Akitakomachi’ under high-temperature conditions.
4.1. Metabolite-Level Responses to High Temperature
Both cultivars showed changes in amino acids and nitrogen-containing compounds, although the direction and magnitude differed markedly. In ‘Fusaotome’ panicles (Table 2), polyamines and amino-acid-related metabolites such as spermidine and N-acetylalanine were elevated, likely contributing to antioxidant defense and membrane stabilization. Polyamines are known to modulate membrane stability and ROS homeostasis, broadly promoting abiotic stress tolerance [14,15]. Exogenous spermidine has been shown to increase antioxidant enzyme activities (SOD, POD) in heat-stressed rice, mitigating oxidative damage—supporting the role of polyamines as ROS scavengers and as inducers of polyamine biosynthetic and antioxidant gene expression [16,17,18]. In contrast, although ornithine and anthranilic acid increased in ‘Akitakomachi’, declines in antioxidant-related precursors, including glutathione derivatives, suggested compromised antioxidant capacity. Given the central role of the glutathione system in plant redox homeostasis [19], ‘Akitakomachi’ may have insufficient antioxidant control under high-temperature stress.
Root responses also differed (Table 3). ‘Fusaotome’ accumulated lysine, arginine, proline, and leucine, with proline playing an important role in osmotic adjustment and ROS quenching under heat and drought conditions [20,21]. Modulations in proline metabolism can affect heat tolerance [22]. Oxidized glutathione (GSSG) accumulated in ‘Akitakomachi’; the increased GSSG levels under oxidative stress [23] indicates reduced antioxidant control during heat stress.
4.2. Pathway-Level Responses to High Temperature
Pathway analysis revealed distinct metabolic strategies between cultivars in both organs. In ‘Fusaotome’ panicles (Table 4), tryptophan metabolism (providing precursors for melatonin), nicotinate/nicotinamide metabolism (supporting NAD⁺/NADP⁺ supply), and arginine/proline metabolism were prominent, facilitating simultaneous antioxidant responses and energy stability [20,21,24,25]. Glycolysis and the TCA cycle were also emphasized, providing a basal metabolic foundation for sustain grain filling under heat stress [4]. In ‘Akitakomachi’ panicles (Table 5), enrichment of secondary pathways (phenylpropanoid and isoquinoline alkaloid biosynthesis) reflected defense-oriented shifts that may be less directly supportive of basal metabolism and sustained grain filling [26].
In the roots, ‘Fusaotome’ exhibited prominent aromatic amino acid metabolism and phenylpropanoid biosynthesis (Table 6), promoting the synthesis of cell wall components (e.g., lignin) and antioxidant compounds [27]. Lysine and branched-chain amino acid degradation may remodel carbon and nitrogen to maintain metabolic homeostasis under stress [28,29]. Moreover, activation of glycerophospholipid metabolism and alkaloid biosynthesis may stabilize membranes and enhance chemical defense [30,31], thereby preserving root function. In ‘Akitakomachi’ (Table 7), nitrogen metabolism-related pathways were predominantly induced, whereas activation of aromatic amino acid metabolism and membrane lipid pathways was limited, indicating a more defensive but less integrative metabolic response at the whole-plant level.
5. Conclusions
This study compared the metabolic responses of the heat-tolerant cultivar “Fusaotome” and the conventional cultivar “Akitakomachi” under high-temperature conditions, revealing distinct metabolic strategies in panicles and roots. These results enhance our understanding of the molecular mechanisms underlying heat tolerance and highlight the potential for developing metabolic markers using specific metabolites or pathways as indicators. Our findings are expected to provide a foundation for breeding and cultivation strategies aimed at ensuring stable rice production under climate change. Future work should focus on quantitatively validating the key metabolites identified in this study and integrating them with transcriptome analysis to construct a more comprehensive model of heat tolerance.
Author Contributions
A.O., S.Y., and K.T. designed the study. A.O., S.Y., and K.T. performed the experiments. A.O. analyzed the data. A.O. wrote the manuscript with contributions from the other authors. All authors have read and agreed to the published version of the manuscript.
Funding
This study was supported by JSPS KAKENHI (Grant Number: JP23K23593).
Institutional Review Board Statement
Not applicable.
Data Availability Statement
The data presented in this study are available upon request from the Corresponding author.
Acknowledgments
We would like to thank Editage (www.editage.com) for English language editing.
Conflicts of Interest
No potential conflict of interest was reported by the authors.
Abbreviations
The following abbreviations are used in this manuscript:
| ROS | Reactive oxygen species |
| SOD | Superoxide dismutase |
| POD | Peroxidase |
| GSSG | Oxidized glutathione |
References
- Ishigooka, Y.; Kuwagata, T.; Nishimori, M.; Hasegawa, T.; Ohno, H. Spatial characterization of recent hot summers in Japan with agro-climatic indices related to rice production. Journal of Agricultural Meteorology 2011, 67, 209-224. [CrossRef]
- Morita, S.; Wada, H.; Matsue, Y. Countermeasures for heat damage in rice grain quality under climate change. Plant Prod. Sci. 2016, 19, 1-11. [CrossRef]
- Tashiro, T.; Wardlaw, I.F. The effect of high temperature at different stages of ripening on grain set, grain weight and grain dimensions in the semi-dwarf wheat ‘Banks’. Ann. Bot. 1990, 65, 51-61. [CrossRef]
- Yamakawa, H.; Hakata, M. Atlas of rice grain filling-related metabolism under high temperature: joint analysis of metabolome and transcriptome demonstrated inhibition of starch accumulation and induction of amino acid accumulation. Plant Cell Physiol. 2010, 51, 795-809. [CrossRef]
- Liao, J.-L.; Zhou, H.-W.; Zhang, H.-Y.; Zhong, P.-A.; Huang, Y.-J. Comparative proteomic analysis of differentially expressed proteins in the early milky stage of rice grains during high temperature stress. J. Exp. Bot. 2014, 65, 655-671. [CrossRef]
- Mitsui, T.; Yamakawa, H.; Kobata, T. Molecular physiological aspects of chalking mechanism in rice grains under high-temperature stress. Plant Prod. Sci. 2016, 19, 22-29. [CrossRef]
- Foyer, C.H.; Noctor, G. Redox homeostasis and antioxidant signaling: a metabolic interface between stress perception and physiological responses. The plant cell 2005, 17, 1866-1875. [CrossRef]
- Mei, W.; Chen, W.; Wang, Y.; Liu, Z.; Dong, Y.; Zhang, G.; Deng, H.; Liu, X.; Lu, X.; Wang, F. Exogenous kinetin modulates ROS homeostasis to affect heat tolerance in rice seedlings. Int J Mol Sci 2023, 24, 6252. [CrossRef]
- Mthiyane, P.; Aycan, M.; Mitsui, T. Strategic advancements in rice cultivation: Combating heat stress through genetic innovation and sustainable practices—A review. Stresses 2024, 4, 452-480. [CrossRef]
- Arai-Sanoh, Y.; Ishimaru, T.; Ohsumi, A.; Kondo, M. Effects of soil temperature on growth and root function in rice. Plant Prod. Sci. 2010, 13, 235-242. [CrossRef]
- Zhen, B.; Li, H.; Niu, Q.; Qiu, H.; Tian, G.; Lu, H.; Zhou, X. Effects of combined high temperature and waterlogging stress at booting stage on root anatomy of rice (Oryza sativa L.). Water 2020, 12, 2524. [CrossRef]
- Soga, T.; Ohashi, Y.; Ueno, Y.; Naraoka, H.; Tomita, M.; Nishioka, T. Quantitative metabolome analysis using capillary electrophoresis mass spectrometry. J. Proteome Res. 2003, 2, 488-494. [CrossRef]
- Pang, Z.; Lu, Y.; Zhou, G.; Hui, F.; Xu, L.; Viau, C.; Spigelman, A.F.; MacDonald, P.E.; Wishart, D.S.; Li, S. MetaboAnalyst 6.0: towards a unified platform for metabolomics data processing, analysis and interpretation. Nucleic Acids Res. 2024, 52, W398-W406. [CrossRef]
- Chen, D.; Shao, Q.; Yin, L.; Younis, A.; Zheng, B. Polyamine function in plants: metabolism, regulation on development, and roles in abiotic stress responses. Front. Plant Sci. 2019, 9, 1945. [CrossRef]
- Kusano, T.; Berberich, T.; Tateda, C.; Takahashi, Y. Polyamines: essential factors for growth and survival. Planta 2008, 228, 367-381. [CrossRef]
- Fu, Y.; Gu, Q.; Dong, Q.; Zhang, Z.; Lin, C.; Hu, W.; Pan, R.; Guan, Y.; Hu, J. Spermidine enhances heat tolerance of rice seeds by modulating endogenous starch and polyamine metabolism. Molecules 2019, 24, 1395. [CrossRef]
- Tang, S.; Zhang, H.; Li, L.; Liu, X.; Chen, L.; Chen, W.; Ding, Y. Exogenous spermidine enhances the photosynthetic and antioxidant capacity of rice under heat stress during early grain-filling period. Funct. Plant Biol. 2018, 45, 911-921. [CrossRef]
- Zhou, R.; Hu, Q.; Pu, Q.; Chen, M.; Zhu, X.; Gao, C.; Zhou, G.; Liu, L.; Wang, Z.; Yang, J. Spermidine enhanced free polyamine levels and expression of polyamine biosynthesis enzyme gene in rice spikelets under heat tolerance before heading. Sci. Rep. 2020, 10, 8976. [CrossRef]
- Noctor, G.; Mhamdi, A.; Chaouch, S.; Han, Y.; Neukermans, J.; Marquez-Garcia, B.; Queval, G.; Foyer, C.H. Glutathione in plants: an integrated overview. Plant, cell & environment 2012, 35, 454-484. [CrossRef]
- Kavi Kishor, P.B.; Suravajhala, P.; Rathnagiri, P.; Sreenivasulu, N. Intriguing role of proline in redox potential conferring high temperature stress tolerance. Front. Plant Sci. 2022, 13, 867531. [CrossRef]
- Renzetti, M.; Funck, D.; Trovato, M. Proline and ROS: A unified mechanism in plant development and stress response? Plants 2024, 14, 2. [CrossRef]
- Guo, M.; Zhang, X.; Liu, J.; Hou, L.; Liu, H.; Zhao, X. OsProDH negatively regulates thermotolerance in rice by modulating proline metabolism and reactive oxygen species scavenging. Rice 2020, 13, 61. [CrossRef]
- Francioso, A.; Baseggio Conrado, A.; Mosca, L.; Fontana, M. Chemistry and biochemistry of sulfur natural compounds: key intermediates of metabolism and redox biology. Oxid Med Cell Longev 2020, 2020, 8294158. [CrossRef]
- Arnao, M.B.; Hernández-Ruiz, J. Melatonin: a new plant hormone and/or a plant master regulator? Trends Plant Sci. 2019, 24, 38-48. [CrossRef]
- Zhao, D.; Yu, Y.; Shen, Y.; Liu, Q.; Zhao, Z.; Sharma, R.; Reiter, R.J. Melatonin synthesis and function: evolutionary history in animals and plants. Frontiers in endocrinology 2019, 10, 441357. [CrossRef]
- Sipari, N.; Lihavainen, J.; Keinänen, M. Metabolite Profiling of Paraquat Tolerant Arabidopsis thaliana Radical-induced Cell Death1 (rcd1)—A Mediator of Antioxidant Defence Mechanisms. Antioxidants 2022, 11, 2034. [CrossRef]
- El-Azaz, J.; Moore, B.; Takeda-Kimura, Y.; Yokoyama, R.; Wijesingha Ahchige, M.; Chen, X.; Schneider, M.; Maeda, H.A. Coordinated regulation of the entry and exit steps of aromatic amino acid biosynthesis supports the dual lignin pathway in grasses. Nature Communications 2023, 14, 7242. [CrossRef]
- Ingrisano, R.; Tosato, E.; Trost, P.; Gurrieri, L.; Sparla, F. Proline, cysteine and branched-chain amino acids in abiotic stress response of land plants and microalgae. Plants 2023, 12, 3410. [CrossRef]
- Kishor, P.K.; Suravajhala, R.; Rajasheker, G.; Marka, N.; Shridhar, K.K.; Dhulala, D.; Scinthia, K.P.; Divya, K.; Doma, M.; Edupuganti, S. Lysine, lysine-rich, serine, and serine-rich proteins: link between metabolism, development, and abiotic stress tolerance and the role of ncRNAs in their regulation. Front. Plant Sci. 2020, 11, 546213. [CrossRef]
- Tang, S.; Xian, Y.; Wang, F.; Luo, C.; Song, W.; Xie, S.; Chen, X.; Cao, A.; Li, H.; Liu, H. Comparative transcriptome analysis of leaves during early stages of chilling stress in two different chilling-tolerant brown-fiber cotton cultivars. PLOS ONE 2021, 16, e0246801. [CrossRef]
- Yang, X.; Kwon, H.; Kim, M.Y.; Lee, S.-H. RNA-seq profiling in leaf tissues of two soybean (Glycine max [L.] Merr.) cultivars that show contrasting responses to drought stress during early developmental stages. Mol. Breed. 2023, 43, 42. [CrossRef]
Figure 1.
Temporal changes in air temperature in high-temperature and control treatments during the cultivation period.
Figure 1.
Temporal changes in air temperature in high-temperature and control treatments during the cultivation period.
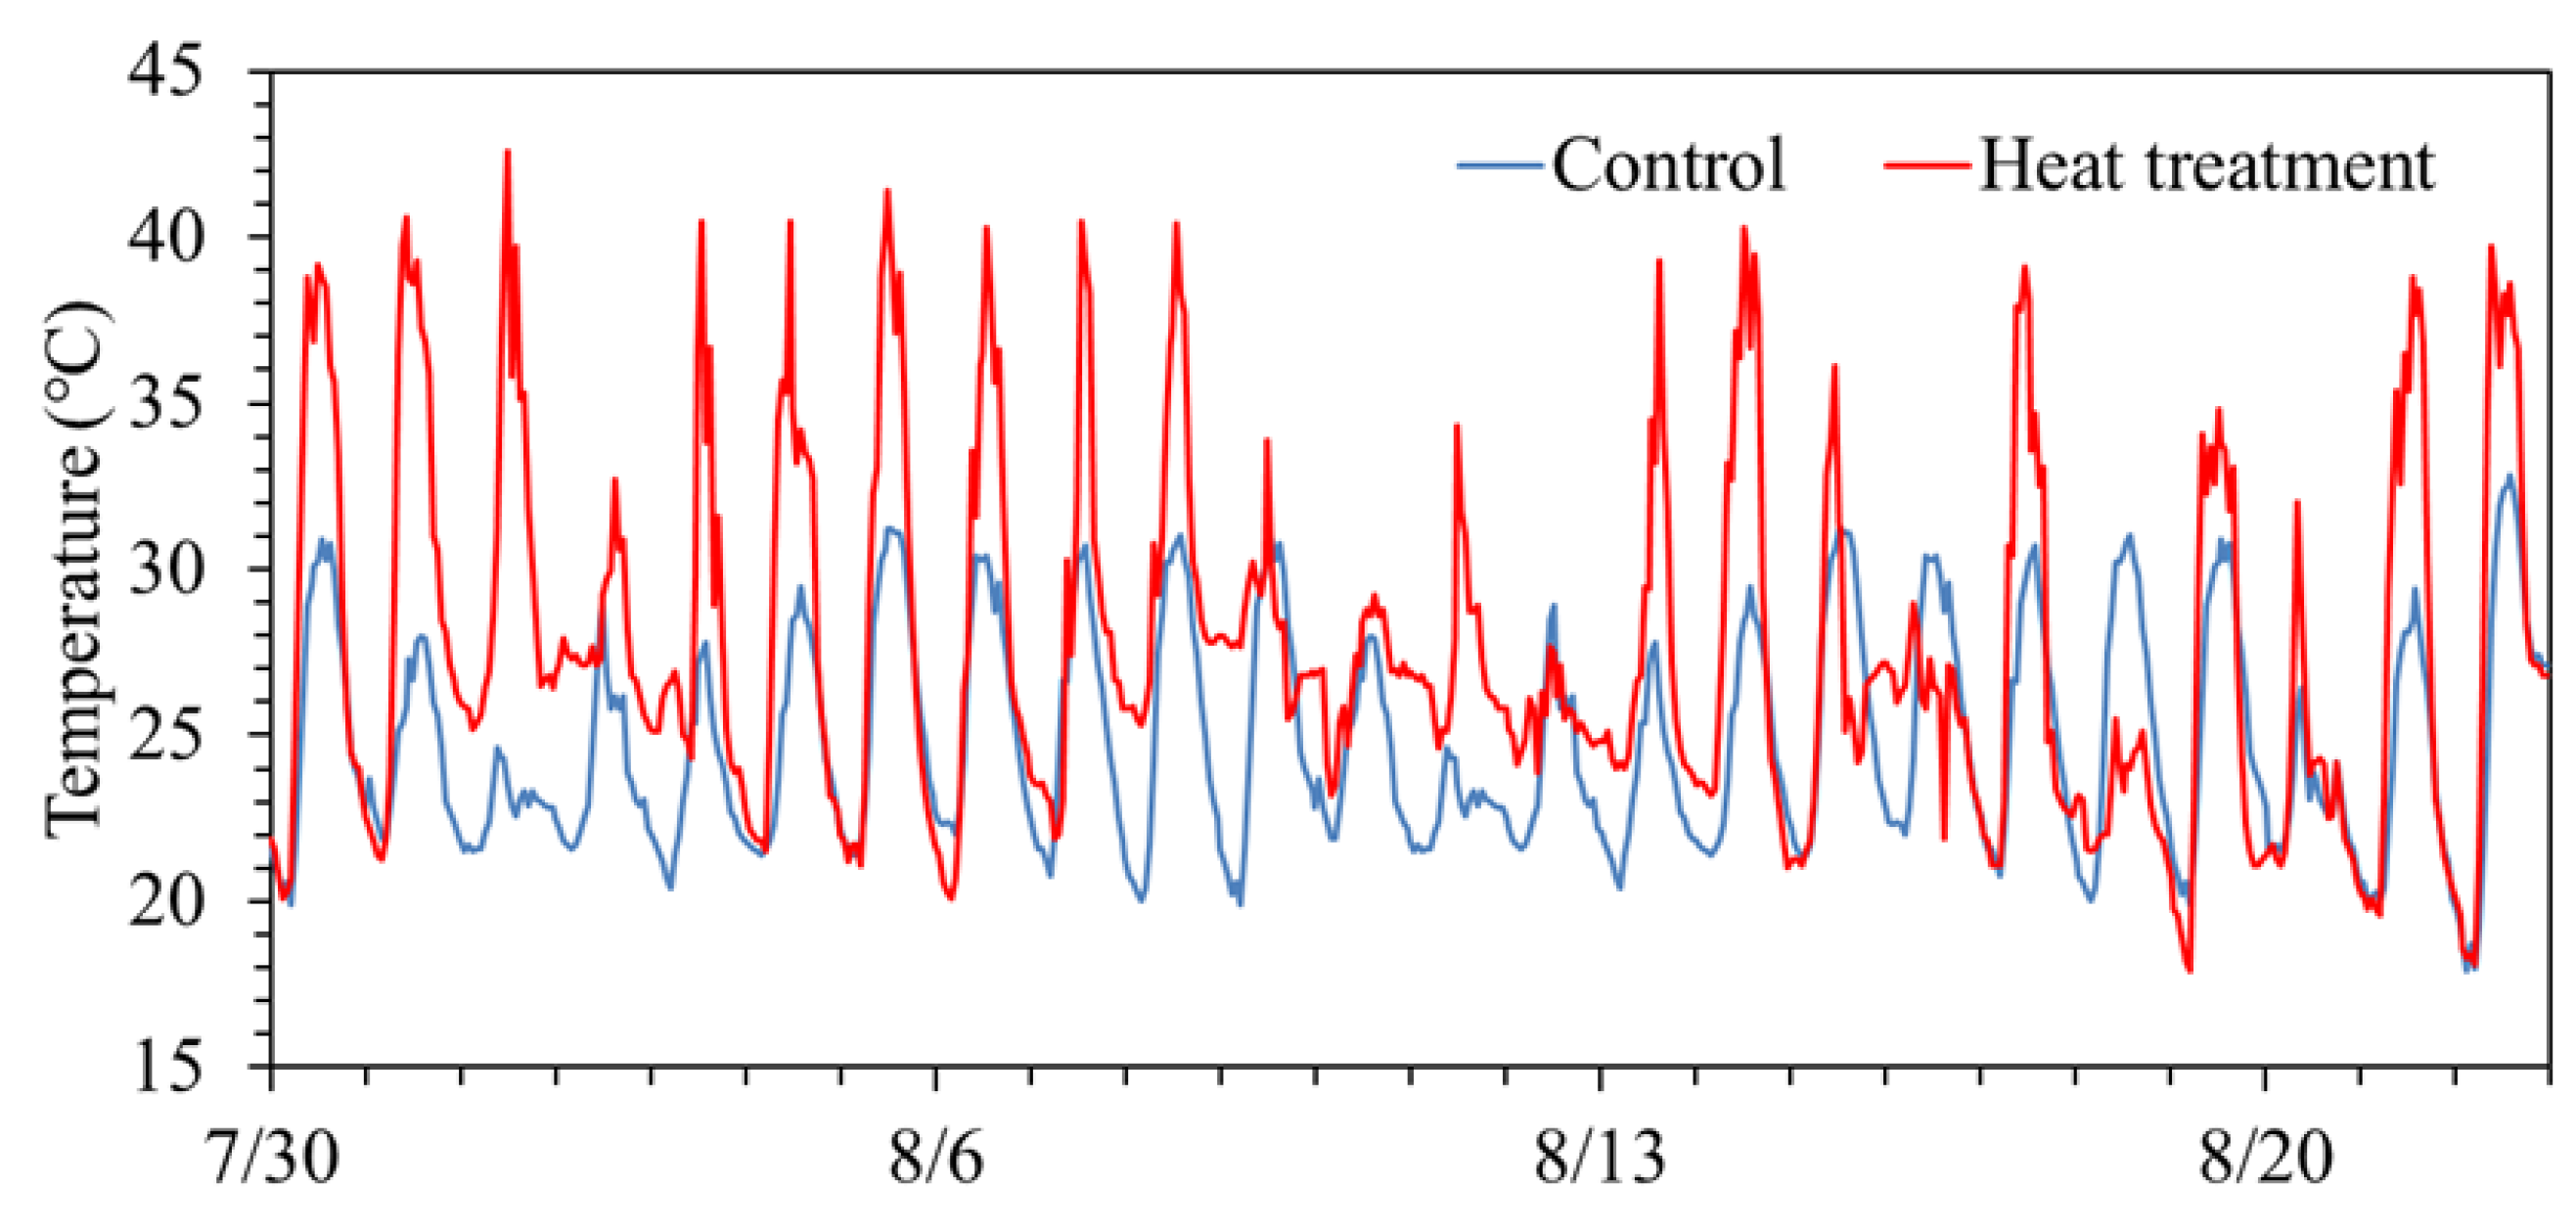
Figure 2.
PCA of metabolites in the panicles (A) and roots (B) of the two cultivars. PCA scores based on PC1 and PC2 are shown. Circles indicate ‘Akitakomachi’ and squares indicate ‘Fusaotome’. Open symbols indicate control and filled symbols indicate high temperature. Percent variance explained by each PC is shown in parentheses.
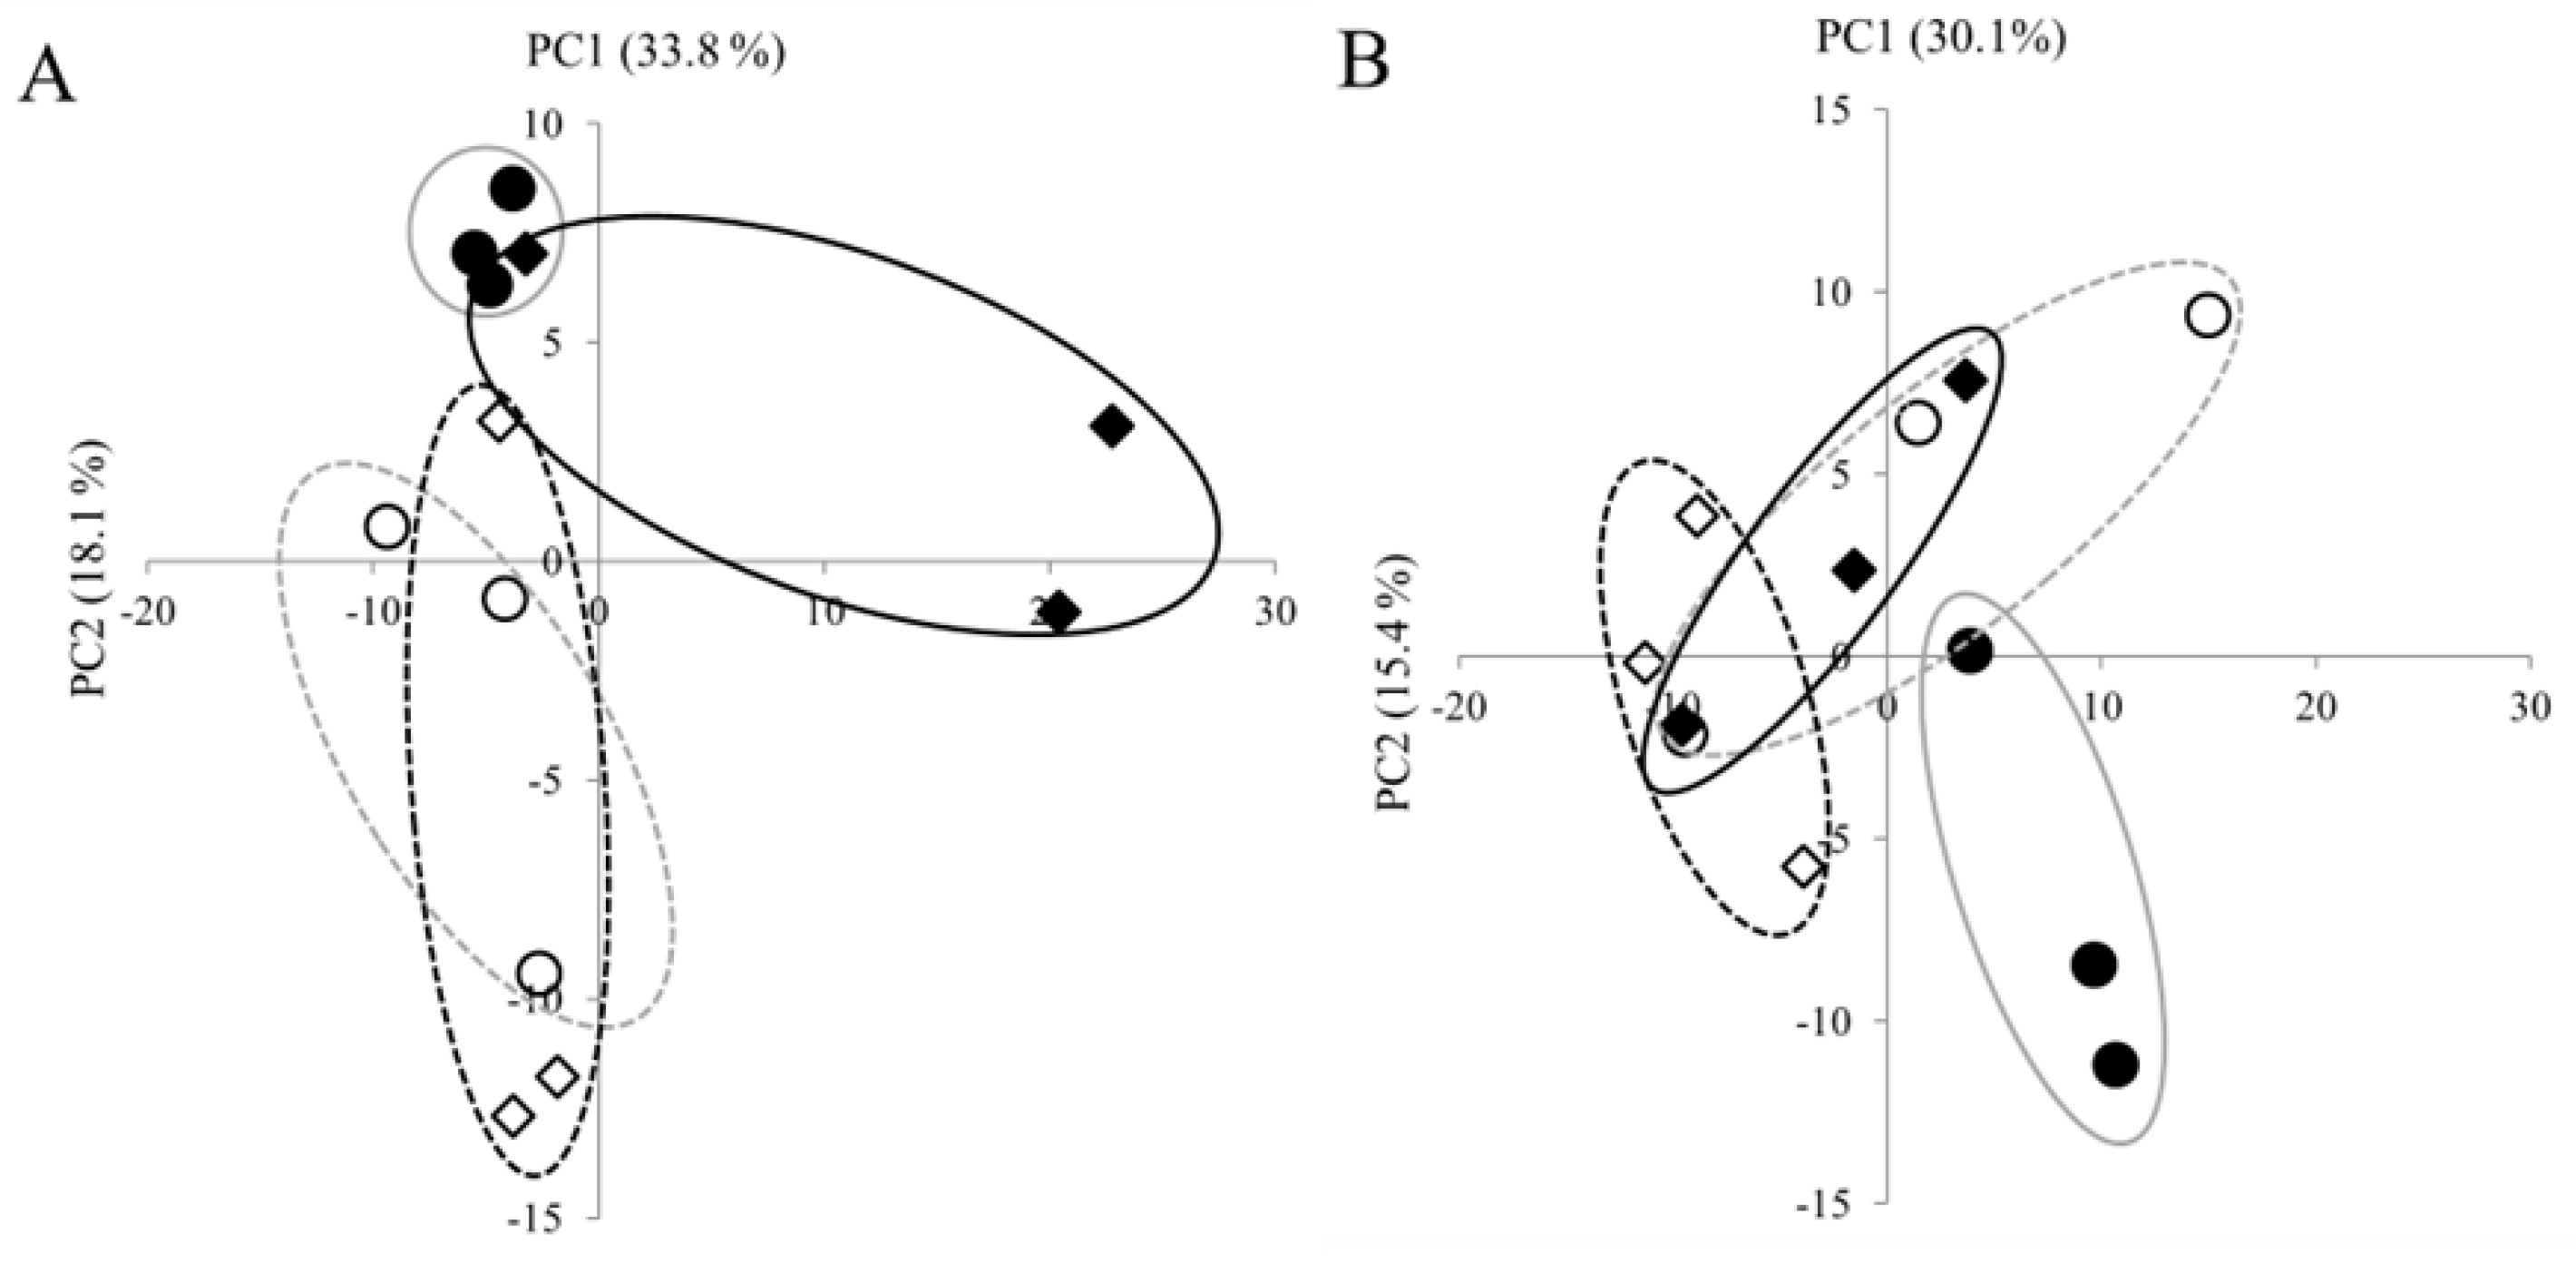
Figure 3.
Volcano plots comparing metabolite levels between control and high-temperature treatments for each cultivar and organ.(A) ‘Fusaotome’ panicles; (B) ‘Akitakomachi’ panicles; (C) ‘Fusaotome’ roots; (D) ‘Akitakomachi’ roots.● Substances showing a significant change at the 5% level (p < 0.05) compared to the control under the high-temperature treatment, with an increase of ≥1.5-fold.● Substances showing a significant change at the 5% level (p < 0.05) compared to the control under the high-temperature treatment, with a decrease to ≤1/1.5-fold.● Substances showing a significant change at the 5% level (p < 0.05) compared to the control under the high-temperature treatment, with either an increase of ≤1.5-fold or a decrease of ≥1/1.5-fold. ● Substances showing no significant change at the 5% level compared to the control under the high-temperature treatment (p > 0.05).
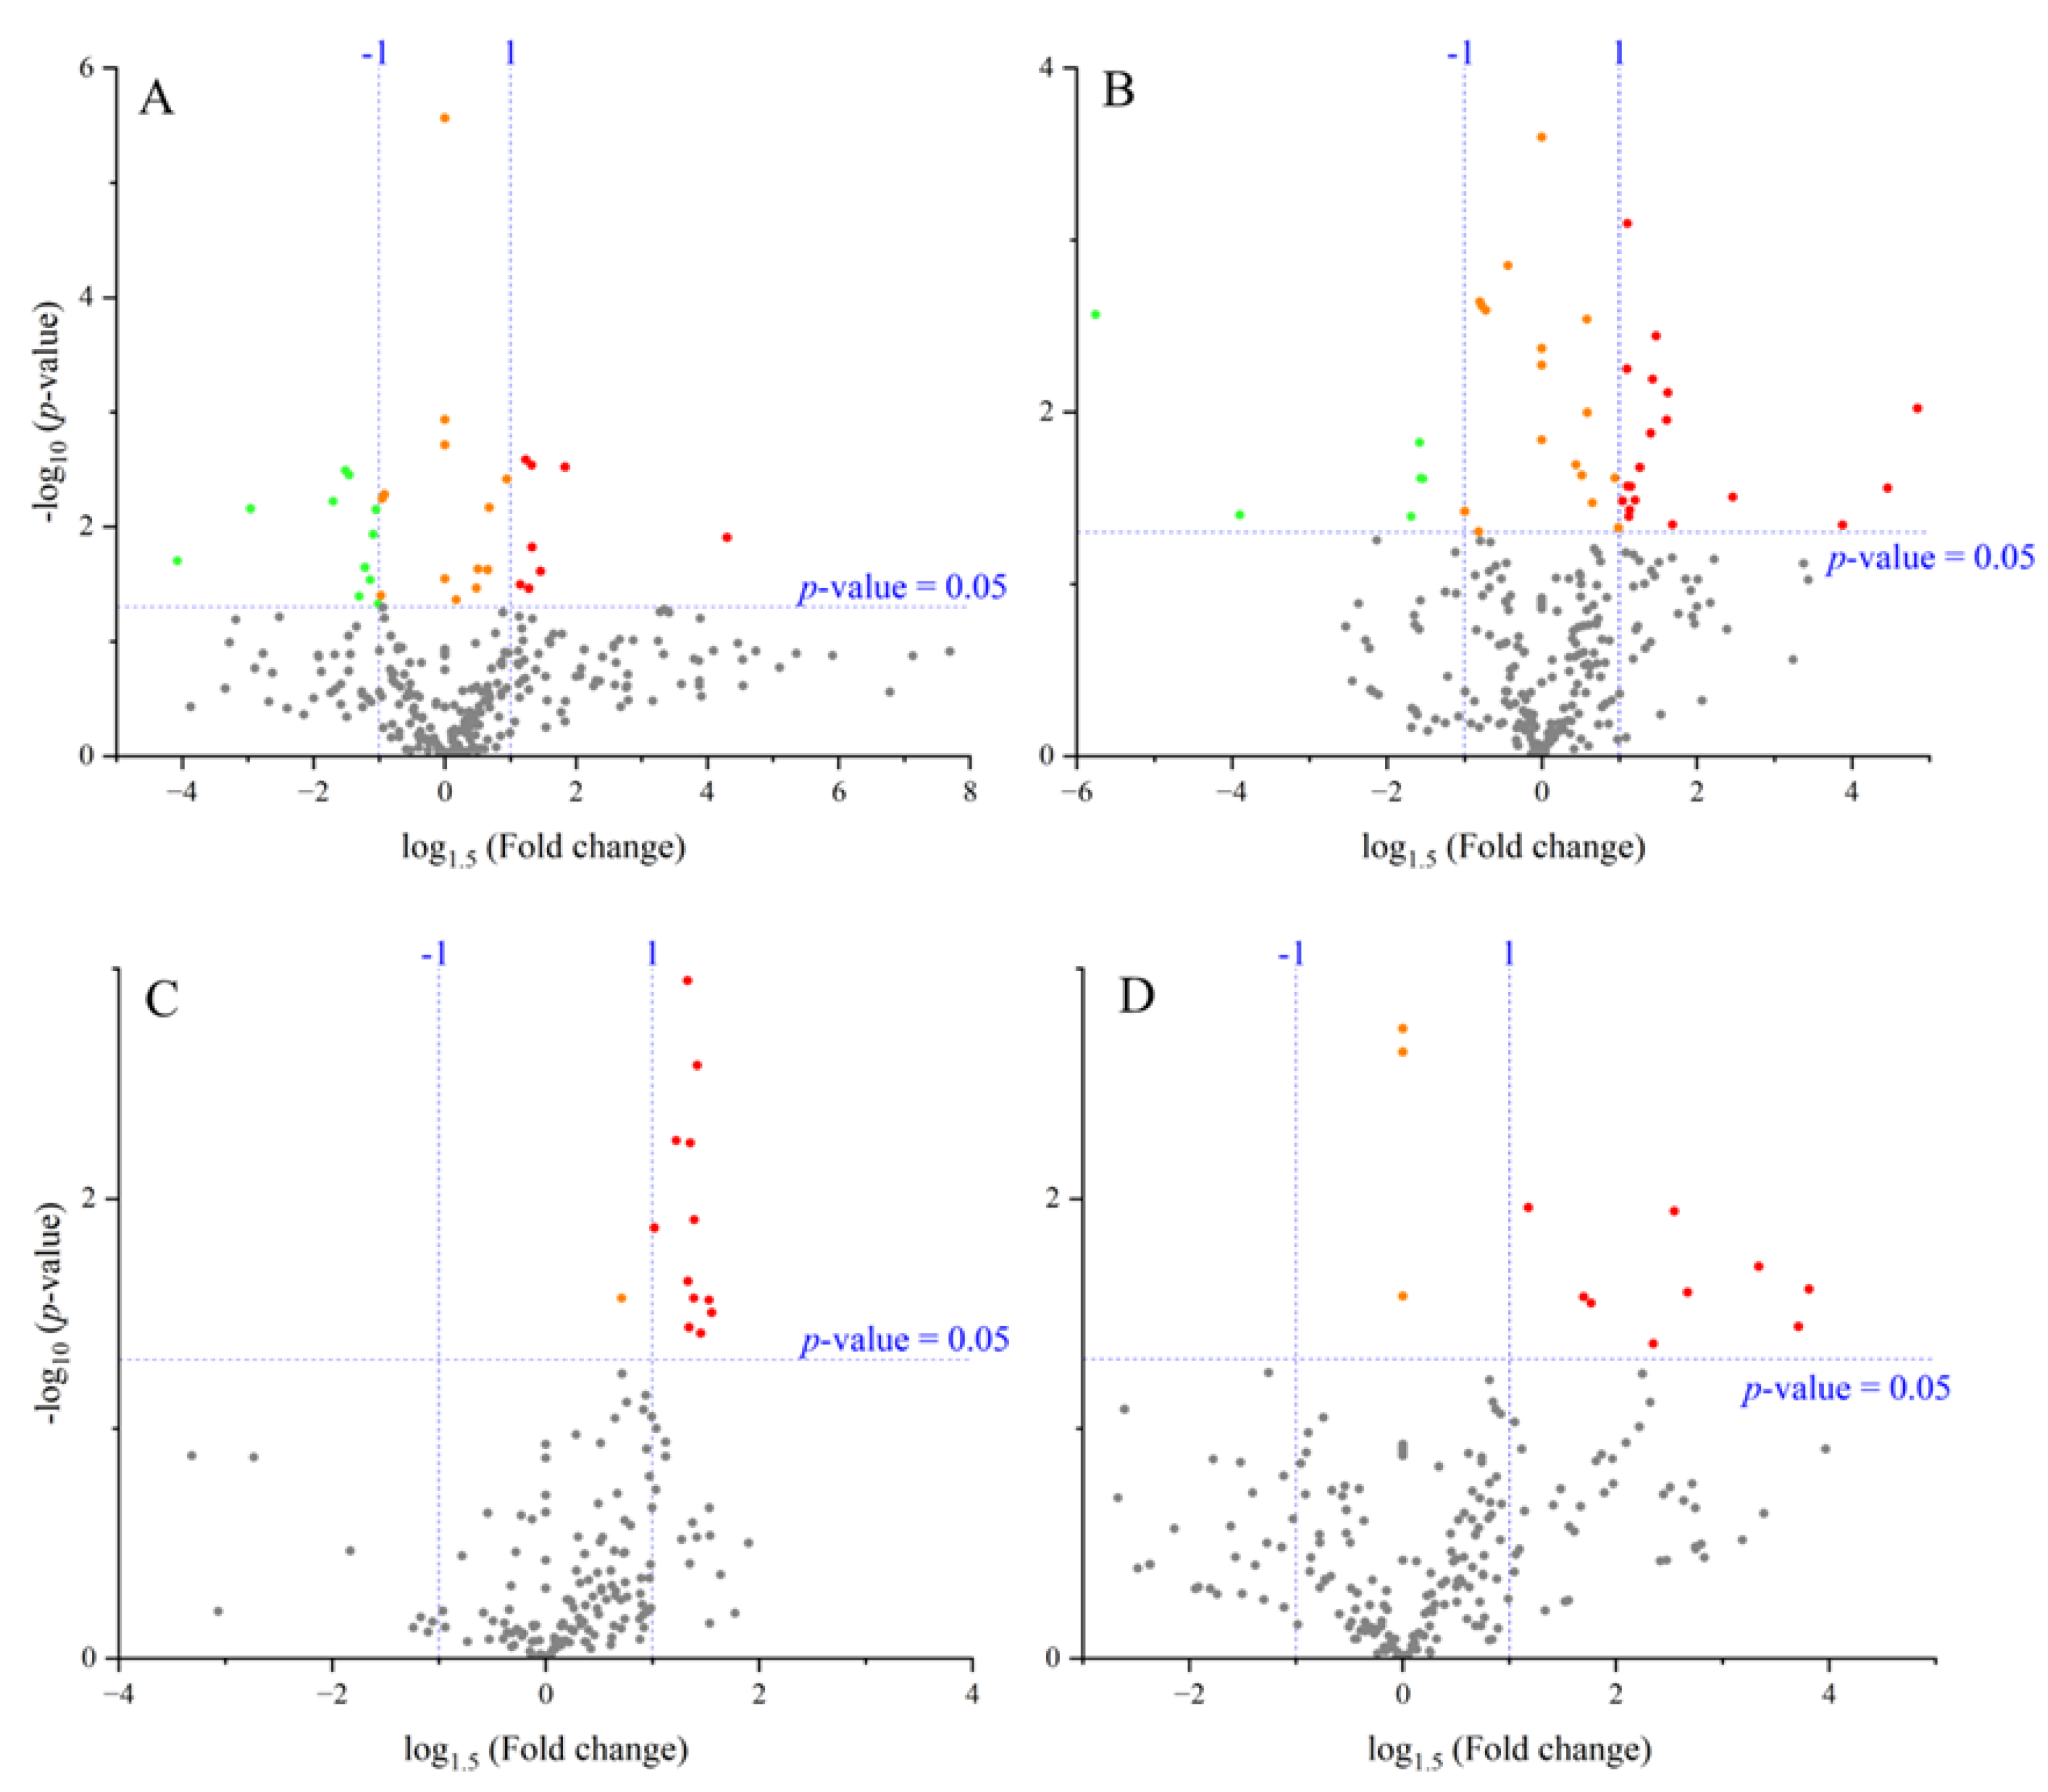
Figure 4.
Relationships between pathway impact and −log10 (p-value) when comparing control and high-temperature treatments for each cultivar and organ. Each point represents a KEGG pathway. (A) ‘Fusaotome’ panicles; (B) ‘Akitakomachi’ panicles; (C) ‘Fusaotome’ roots; (D) ‘Akitakomachi’ roots.
Figure 4.
Relationships between pathway impact and −log10 (p-value) when comparing control and high-temperature treatments for each cultivar and organ. Each point represents a KEGG pathway. (A) ‘Fusaotome’ panicles; (B) ‘Akitakomachi’ panicles; (C) ‘Fusaotome’ roots; (D) ‘Akitakomachi’ roots.
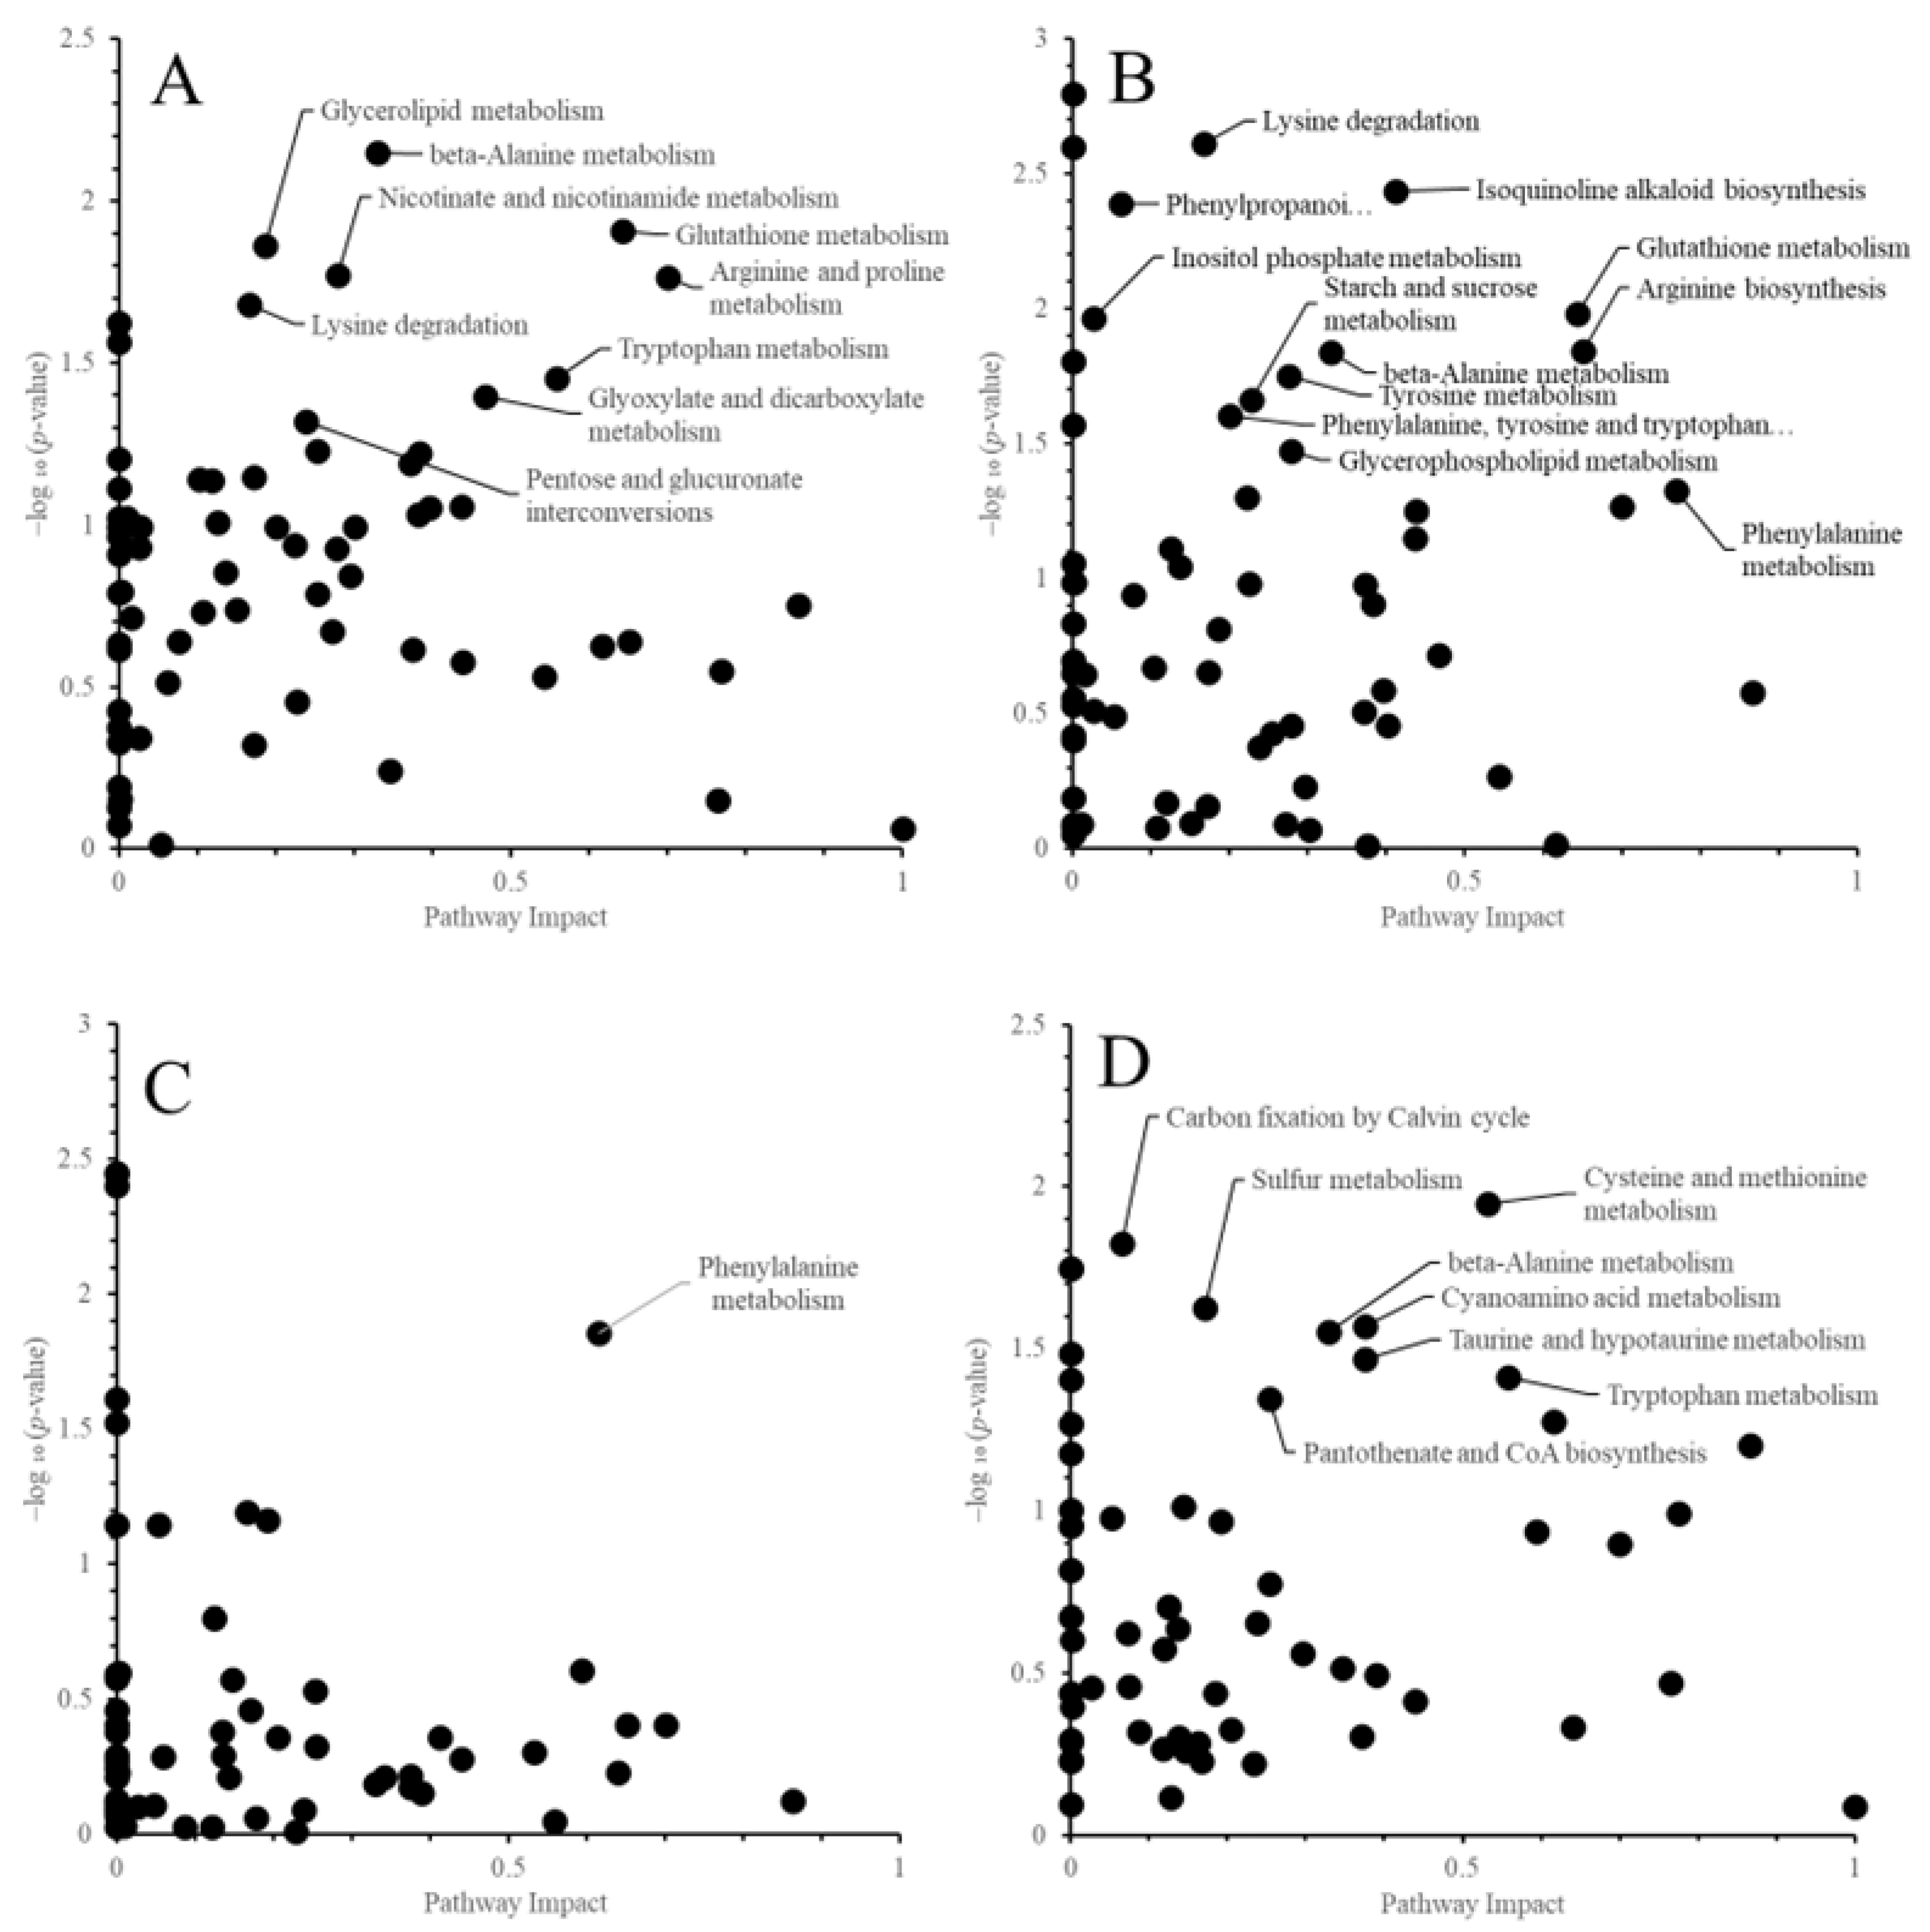

Table 1.
Temperatures for each treatment from the start of heat treatment to sampling.
| Control | Heat treatment | Temperature difference |
||
| Fusaotome | Day time | 26.7 | 30.5 | 3.8 |
| Night tine | 22.1 | 24.8 | 2.7 | |
| Aktakomachi | Day time | 26.5 | 31.8 | 5.3 |
| Night tine | 22.3 | 24.6 | 2.3 |
Mean temperatures were calculated from July 30 (start of heat treatment) to August 22 (control for ‘Fusaotome’) and August 16 (high temperature for ‘Fusaotome’); for ‘Akitakomachi’, to August 16 (control) and August 9 (high temperature). Daytime: 06:00–19:00; nighttime: 20:00–05:00.
Table 2.
Metabolites in panicles significantly altered by heat treatment.
| Fusaotome | Akitakomachi | |||||
|---|---|---|---|---|---|---|
| Substances | Heat / Control | p-value | Substances | Heat / Control | p-value | |
| Increase | ||||||
| Triethanolamine | 5.72 | 0.012 | Ornithine | 7.13 | 0.010 | |
| Spermidine | 2.10 | 0.003 | Pyroglutamine | 6.10 | 0.028 | |
| N-Acetylalanine | 1.81 | 0.025 | Anthranilic acid | 4.81 | 0.045 | |
| Alloisoleucine | 1.71 | 0.015 | N-(1-Deoxy-1-fructosyl)valine | 2.72 | 0.031 | |
| Glutamic acid gamma-methyl ester | 1.71 | 0.003 | Lys | 1.98 | 0.045 | |
| Val | 1.68 | 0.035 | N6-Methyllysine | 1.93 | 0.008 | |
| 2-Methylserine | 1.65 | 0.003 | Spermidine | 1.92 | 0.011 | |
| Citric acid | 1.59 | 0.032 | Theobromine | 1.82 | 0.004 | |
| Oxalic acid | 1.78 | 0.006 | ||||
| Citrulline | 1.77 | 0.013 | ||||
| Saccharopine | 1.67 | 0.021 | ||||
| Arg | 1.63 | 0.033 | ||||
| Asn | 1.59 | 0.027 | ||||
| Sinapic acid | 1.58 | 0.037 | ||||
| Dimethylaminoethanol | 1.58 | 0.040 | ||||
| N-Acetylornithine | 1.56 | 0.027 | ||||
| Gln | 1.56 | 0.001 | ||||
| Nω-Methylarginine | 1.56 | 0.006 | ||||
| Isocitric acid | 1.52 | 0.033 | ||||
| Decrease | ||||||
| Thiamine phosphate | 0.19 | 0.020 | Cadaverine | 0.10 | 0.003 | |
| Serotonin | 0.30 | 0.007 | γ-Glu-Cys | 0.21 | 0.040 | |
| Threonic acid | 0.50 | 0.006 | Quinic acid | 0.50 | 0.040 | |
| 2-Deoxyribonic acid | 0.54 | 0.003 | Shikimic acid | 0.53 | 0.015 | |
| Glyceric acid | 0.55 | 0.004 | Sedoheptulose 7-phosphate | 0.53 | 0.024 | |
| AMP | 0.59 | 0.040 | Galacturonic acid | 0.54 | 0.024 | |
| Phosphoenolpyruvic acid | 0.61 | 0.023 | ||||
| 3-Phosphoglyceric acid | 0.63 | 0.029 | ||||
| Tyrosine methyl ester | 0.64 | 0.012 | ||||
| Ribulose 5-phosphate | 0.65 | 0.007 | ||||
| Ascorbate 2-glucoside | 0.66 | 0.047 | ||||
Metabolites with p < 0.05 and ≥1.5-fold increase or ≤1/1.5-fold decrease relative to control.
Table 3.
Metabolites in roots significantly altered by heat treatment.
| Fusaotome | Akitakomachi | |||||
| Substances | Heat / Control | p-value | Substances | Heat / Control | p-value | |
| Increase | ||||||
| Lys | 1.88 | 0.031 | Glucuronic acid | 4.69 | 0.025 | |
| Arg | 1.86 | 0.028 | Ile-Pro-Pro | 4.51 | 0.036 | |
| Met | 1.80 | 0.038 | Thiaproline | 3.87 | 0.020 | |
| Val | 1.78 | 0.003 | 2-Methylthiazolidine-4-carboxylic acid | 2.96 | 0.026 | |
| Leu | 1.76 | 0.012 | Uric acid | 2.81 | 0.011 | |
| γ-Glu-Phe | 1.76 | 0.027 | Cysteine glutathione disulfide | 2.59 | 0.043 | |
| Ile | 1.73 | 0.006 | N-Acetylgalactosamine | 2.05 | 0.028 | |
| γ-Glu-Ile γ-Glu-Leu |
1.72 | 0.036 | N-Acetyllysine | 1.99 | 0.027 | |
| Phe | 1.72 | 0.023 | Oxalic acid | 1.61 | 0.011 | |
| Pro | 1.71 | 0.001 | ||||
| γ-Glu-Val | 1.64 | 0.006 | ||||
| Thr | 1.51 | 0.013 | ||||
Metabolites with p < 0.05 and ≥1.5-fold increase or ≤1/1.5-fold decrease relative to control.
Table 4.
Top 20 pathways with higher activity in ‘Fusaotome’ than in ‘Akitakomachi’ under heat treatment (panicles).
Table 4.
Top 20 pathways with higher activity in ‘Fusaotome’ than in ‘Akitakomachi’ under heat treatment (panicles).
| Fusaotome | Akitakomachi | |||||||
| Pathway | Pathway Impact |
–log ₁₀ (p-value) |
Score | Pathway Impact |
–log ₁₀ (p-value) |
Score | Score difference |
|
| Tryptophan metabolism | 0.56 | 1.45 | 0.81 | 0.37 | 0.98 | 0.36 | 0.45 | |
| Glycine, serine and threonine metabolism | 0.62 | 0.62 | 0.39 | 0.62 | 0.02 | 0.01 | 0.38 | |
| Nicotinate and nicotinamide metabolism | 0.28 | 1.77 | 0.49 | 0.28 | 0.46 | 0.13 | 0.37 | |
| Arginine and proline metabolism | 0.70 | 1.77 | 1.24 | 0.70 | 1.27 | 0.89 | 0.35 | |
| Glyoxylate and dicarboxylate metabolism | 0.47 | 1.40 | 0.65 | 0.47 | 0.72 | 0.34 | 0.32 | |
| Amino sugar and nucleotide sugar metabolism | 0.38 | 1.22 | 0.47 | 0.40 | 0.46 | 0.18 | 0.28 | |
| Pyruvate metabolism | 0.30 | 0.99 | 0.30 | 0.30 | 0.07 | 0.02 | 0.28 | |
| Citrate cycle (TCA cycle) | 0.37 | 1.19 | 0.44 | 0.37 | 0.51 | 0.19 | 0.25 | |
| Taurine and hypotaurine metabolism | 0.38 | 0.61 | 0.23 | 0.38 | 0.01 | 0.00 | 0.23 | |
| Pentose and glucuronate interconversions | 0.24 | 1.32 | 0.31 | 0.24 | 0.38 | 0.09 | 0.22 | |
| Pantothenate and CoA biosynthesis | 0.25 | 1.23 | 0.31 | 0.25 | 0.43 | 0.11 | 0.20 | |
| Glycerolipid metabolism | 0.19 | 1.86 | 0.35 | 0.19 | 0.81 | 0.15 | 0.20 | |
| Glycolysis or Gluconeogenesis | 0.40 | 1.05 | 0.42 | 0.40 | 0.59 | 0.23 | 0.19 | |
| Vitamin B6 metabolism | 0.30 | 0.84 | 0.25 | 0.30 | 0.23 | 0.07 | 0.18 | |
| Thiamine metabolism | 0.27 | 0.67 | 0.18 | 0.27 | 0.09 | 0.02 | 0.16 | |
| Alanine, aspartate and glutamate metabolism | 0.87 | 0.75 | 0.65 | 0.87 | 0.58 | 0.50 | 0.15 | |
| Cysteine and methionine metabolism | 0.54 | 0.53 | 0.29 | 0.54 | 0.27 | 0.14 | 0.14 | |
| Riboflavin metabolism | 0.12 | 1.14 | 0.13 | 0.12 | 0.17 | 0.02 | 0.11 | |
| beta-Alanine metabolism | 0.33 | 2.15 | 0.71 | 0.33 | 1.84 | 0.61 | 0.10 | |
| One carbon pool by folate | 0.15 | 0.74 | 0.11 | 0.15 | 0.10 | 0.01 | 0.10 | |
Score = (pathway impact) × [−log10(p-value)].Larger “Score difference” indicates stronger activation in ‘Fusaotome’ under heat treatment.
Table 5.
Top 20 pathways with higher activity in ‘Akitakomachi’ than in ‘Fusaotome’ under heat treatment (panicles).
Table 5.
Top 20 pathways with higher activity in ‘Akitakomachi’ than in ‘Fusaotome’ under heat treatment (panicles).
| Fusaotome | Akitakomachi | |||||||
| Pathway | Pathway Impact |
–log ₁₀ (p-value) |
Score | Pathway Impact |
–log ₁₀ (p-value) |
Score | Score difference |
|
| Isoquinoline alkaloid biosynthesis | 0.76 | 0.15 | 0.12 | 0.41 | 2.43 | 1.00 | -0.89 | |
| Arginine biosynthesis | 0.65 | 0.64 | 0.42 | 0.65 | 1.84 | 1.20 | -0.78 | |
| Phenylalanine metabolism | 0.77 | 0.55 | 0.42 | 0.77 | 1.33 | 1.02 | -0.60 | |
| Tyrosine metabolism | 0.35 | 0.24 | 0.08 | 0.28 | 1.75 | 0.48 | -0.40 | |
| Pyrimidine metabolism | 0.44 | 0.58 | 0.25 | 0.44 | 1.25 | 0.55 | -0.29 | |
| Starch and sucrose metabolism | 0.23 | 0.46 | 0.10 | 0.23 | 1.66 | 0.38 | -0.27 | |
| Lysine degradation | 0.17 | 1.68 | 0.28 | 0.17 | 2.61 | 0.43 | -0.15 | |
| Glycerophospholipid metabolism | 0.28 | 0.93 | 0.26 | 0.28 | 1.47 | 0.41 | -0.15 | |
| Phenylalanine, tyrosine and tryptophan biosynthesis | 0.20 | 0.99 | 0.20 | 0.20 | 1.60 | 0.32 | -0.12 | |
| Phenylpropanoid biosynthesis | 0.06 | 0.51 | 0.03 | 0.06 | 2.39 | 0.15 | -0.12 | |
| Purine metabolism | 0.25 | 0.79 | 0.20 | 0.22 | 1.30 | 0.29 | -0.09 | |
| Glutathione metabolism | 0.64 | 1.91 | 1.23 | 0.64 | 1.98 | 1.28 | -0.05 | |
| Inositol phosphate metabolism | 0.03 | 0.34 | 0.01 | 0.03 | 1.97 | 0.05 | -0.04 | |
| Pentose phosphate pathway | 0.44 | 1.06 | 0.46 | 0.44 | 1.15 | 0.50 | -0.04 | |
| Butanoate metabolism | 0.14 | 0.85 | 0.12 | 0.14 | 1.04 | 0.14 | -0.03 | |
| Terpenoid backbone biosynthesis | 0.05 | 0.01 | 0.00 | 0.05 | 0.49 | 0.03 | -0.03 | |
| Biotin metabolism | 0.08 | 0.64 | 0.05 | 0.08 | 0.94 | 0.07 | -0.02 | |
| Biosynthesis of various plant secondary metabolites | 0.13 | 1.01 | 0.13 | 0.13 | 1.11 | 0.14 | -0.01 | |
| Ascorbate and aldarate metabolism | 0.22 | 0.94 | 0.21 | 0.22 | 0.98 | 0.22 | -0.01 | |
| Lipoic acid metabolism | 0.00 | 0.15 | 0.00 | 0.00 | 0.67 | 0.00 | 0.00 | |
Score = (pathway impact) × [−log10(p-value)]. Smaller “Score difference” values indicate stronger activation in ‘Akitakomachi’ under heat treatment.
Table 6.
Top 20 pathways with higher activity in ‘Fusaotome’ than in ‘Akitakomachi’ under heat treatment (roots).
Table 6.
Top 20 pathways with higher activity in ‘Fusaotome’ than in ‘Akitakomachi’ under heat treatment (roots).
| Fusaotome | Akitakomachi | |||||||
| Pathway | Pathway Impact |
–log ₁₀ (p-value) |
Score | Pathway Impact |
–log ₁₀ (p-value) |
Score | Score difference |
|
| Phenylalanine metabolism | 0.62 | 1.86 | 1.14 | 0.62 | 1.28 | 0.78 | 0.36 | |
| Lysine degradation | 0.17 | 1.19 | 0.20 | 0.17 | 0.23 | 0.04 | 0.16 | |
| Phenylalanine, tyrosine and tryptophan biosynthesis | 0.19 | 1.16 | 0.22 | 0.19 | 0.97 | 0.19 | 0.04 | |
| Glycerophospholipid metabolism | 0.15 | 0.58 | 0.08 | 0.23 | 0.22 | 0.05 | 0.03 | |
| Biosynthesis of various plant secondary metabolites | 0.13 | 0.80 | 0.10 | 0.13 | 0.71 | 0.09 | 0.01 | |
| Starch and sucrose metabolism | 0.13 | 0.38 | 0.05 | 0.14 | 0.30 | 0.04 | 0.01 | |
| Phenylpropanoid biosynthesis | 0.05 | 1.15 | 0.06 | 0.05 | 0.98 | 0.05 | 0.01 | |
| Propanoate metabolism | 0.00 | 0.60 | 0.00 | 0.00 | 0.40 | 0.00 | 0.00 | |
| Glucosinolate biosynthesis | 0.00 | 2.45 | 0.00 | 0.00 | 1.75 | 0.00 | 0.00 | |
| Valine, leucine and isoleucine degradation | 0.00 | 2.45 | 0.00 | 0.00 | 1.75 | 0.00 | 0.00 | |
| Valine, leucine and isoleucine biosynthesis | 0.00 | 2.40 | 0.00 | 0.00 | 1.49 | 0.00 | 0.00 | |
| Tropane, piperidine and pyridine alkaloid biosynthesis | 0.00 | 1.61 | 0.00 | 0.00 | 0.95 | 0.00 | 0.00 | |
| D-Amino acid metabolism | 0.00 | 1.53 | 0.00 | 0.00 | 0.23 | 0.00 | 0.00 | |
| Sphingolipid metabolism | 0.00 | 1.15 | 0.00 | 0.00 | 0.82 | 0.00 | 0.00 | |
| Ubiquinone and other terpenoid-quinone biosynthesis | 0.00 | 0.58 | 0.00 | 0.00 | 0.44 | 0.00 | 0.00 | |
| Selenocompound metabolism | 0.00 | 0.46 | 0.00 | 0.00 | 1.40 | 0.00 | 0.00 | |
| Caffeine metabolism | 0.00 | 0.41 | 0.00 | 0.00 | 0.82 | 0.00 | 0.00 | |
| Inositol phosphate metabolism | 0.00 | 0.38 | 0.00 | 0.00 | 0.29 | 0.00 | 0.00 | |
| Monobactam biosynthesis | 0.00 | 0.29 | 0.00 | 0.00 | 1.27 | 0.00 | 0.00 | |
| Porphyrin metabolism | 0.00 | 0.27 | 0.00 | 0.00 | 0.67 | 0.00 | 0.00 | |
Score = (pathway impact) × [−log10(p-value)]. Larger “Score difference” indicates stronger activation in ‘Fusaotome’ under heat treatment.
Table 7.
Top 20 pathways with higher activity in ‘Akitakomachi’ than in ‘Fusaotome’ under heat treatment (roots).
Table 7.
Top 20 pathways with higher activity in ‘Akitakomachi’ than in ‘Fusaotome’ under heat treatment (roots).
| Fusaotome | Akitakomachi | |||||||
| Pathway | Pathway Impact |
–log ₁₀ (p-value) |
Score | Pathway Impact |
–log ₁₀ (p-value) |
Score | Score difference |
|
| Alanine, aspartate and glutamate metabolism | 0.863 | 0.125 | 0.108 | 0.867 | 1.202 | 1.042 | -0.934 | |
| Cysteine and methionine metabolism | 0.532 | 0.307 | 0.164 | 0.532 | 1.947 | 1.036 | -0.873 | |
| Tryptophan metabolism | 0.558 | 0.051 | 0.028 | 0.558 | 1.410 | 0.787 | -0.758 | |
| Cyanoamino acid metabolism | 0.375 | 0.220 | 0.083 | 0.375 | 1.570 | 0.589 | -0.506 | |
| Arginine biosynthesis | 0.651 | 0.407 | 0.265 | 0.775 | 0.992 | 0.769 | -0.504 | |
| Taurine and hypotaurine metabolism | 0.375 | 0.177 | 0.066 | 0.375 | 1.466 | 0.550 | -0.484 | |
| beta-Alanine metabolism | 0.329 | 0.191 | 0.063 | 0.329 | 1.551 | 0.511 | -0.448 | |
| Arginine and proline metabolism | 0.700 | 0.409 | 0.286 | 0.700 | 0.897 | 0.628 | -0.342 | |
| Isoquinoline alkaloid biosynthesis | 0.412 | 0.363 | 0.149 | 0.765 | 0.468 | 0.358 | -0.209 | |
| Pantothenate and CoA biosynthesis | 0.253 | 0.532 | 0.135 | 0.253 | 1.345 | 0.341 | -0.206 | |
| Sulfur metabolism | 0.171 | 0.464 | 0.079 | 0.171 | 1.626 | 0.278 | -0.199 | |
| Glycine, serine and threonine metabolism | 0.593 | 0.610 | 0.362 | 0.593 | 0.934 | 0.554 | -0.192 | |
| Vitamin B6 metabolism | 0.229 | 0.013 | 0.003 | 0.295 | 0.562 | 0.166 | -0.163 | |
| Nicotinate and nicotinamide metabolism | 0.238 | 0.094 | 0.022 | 0.238 | 0.656 | 0.156 | -0.134 | |
| Pyrimidine metabolism | 0.390 | 0.154 | 0.060 | 0.390 | 0.495 | 0.193 | -0.133 | |
| Pyruvate metabolism | 0.144 | 0.214 | 0.031 | 0.144 | 1.012 | 0.145 | -0.114 | |
| One carbon pool by folate | 0.254 | 0.326 | 0.083 | 0.254 | 0.773 | 0.196 | -0.113 | |
| Tyrosine metabolism | 0.205 | 0.363 | 0.075 | 0.346 | 0.514 | 0.178 | -0.103 | |
| Carbon fixation by Calvin cycle | 0.059 | 0.290 | 0.017 | 0.065 | 1.823 | 0.119 | -0.102 | |
| Purine metabolism | 0.179 | 0.065 | 0.012 | 0.184 | 0.436 | 0.080 | -0.069 | |
Score = (pathway impact) × [−log10(p-value)].Smaller “Score difference” values indicate stronger activation in ‘Akitakomachi’ under heat treatment.
Disclaimer/Publisher’s Note: The statements, opinions and data contained in all publications are solely those of the individual author(s) and contributor(s) and not of MDPI and/or the editor(s). MDPI and/or the editor(s) disclaim responsibility for any injury to people or property resulting from any ideas, methods, instructions or products referred to in the content. |
© 2025 by the authors. Licensee MDPI, Basel, Switzerland. This article is an open access article distributed under the terms and conditions of the Creative Commons Attribution (CC BY) license (http://creativecommons.org/licenses/by/4.0/).
Copyright: This open access article is published under a Creative Commons CC BY 4.0 license, which permit the free download, distribution, and reuse, provided that the author and preprint are cited in any reuse.


