
Submitted:
28 September 2025
Posted:
29 September 2025
You are already at the latest version
Abstract
Traditional valuation metrics such as the Price-to-Earnings (P/E) ratio are widely used but often misleading when comparing companies within the same sector. This paper demonstrates the irrelevance of the P/E ratio in such cross-company analyses by introducing a more comprehensive framework based on the Potential Payback Period (PPP) and its derivative, the Stock Internal Rate of Return Including Price Appreciation (SIRRIPA). Using the cases of Palantir Technologies, NVIDIA, and Micron Technology as of September 26, 2025, this study shows that while their P/E ratios vary by a factor of nearly 30, their SIRRIPA values converge within a narrow range (5.8%–7.4%), consistent with long-term equilibrium returns observed between stocks and bonds. This convergence reveals a hidden market rationality: once growth, discount rate, and risk are accounted for, companies in the same sector exhibit similar intrinsic, risk-adjusted returns. The analysis is further vindicated by market performance over the past year, during which all three stocks experienced substantial price increases broadly aligned with their previously estimated SIRRIPA-based intrinsic returns. The paper also highlights the plateau effect, where extremely high P/E ratios cease to influence implied returns, as illustrated by Palantir. Furthermore, it emphasizes the sensitivity of both PPP and SIRRIPA to earnings growth projections, underscoring the need for scenario analysis in valuation. Ultimately, SIRRIPA serves as the equity equivalent of a bond’s Yield to Maturity (YTM) — a universal, yield-based metric that restores rational comparability among stocks and bridges the analytical gap between equity and fixed-income valuation.
Keywords:
equity valuation
; P/E Ratio
; potential payback period (PPP)
; stock internal rate of return (SIRR)
; SIRRIPA
; earnings growth
; discount rate
; hidden market rationality
; Plateau effect
; yield to maturity (YTM)
1. Introduction: When the P/E Ratio Fails to Compare Like with Like
The Price-to-Earnings (P/E) ratio remains one of the most cited metrics in financial analysis, used by investors to gauge whether a stock is “cheap” or “expensive.” Yet when comparing multiple companies within the same sector—particularly fast-growing technology firms—the P/E ratio becomes misleading and economically irrelevant.
The reason lies in its static nature. The P/E ratio relates the market price of a stock only to its current earnings, without considering three fundamental valuation drivers:
- Earnings growth (g),
- Discount rate (r), and
- Risk (β) as captured by the cost of capital.
When these are ignored, comparisons across companies distort reality. Two firms may operate in the same industry but show vastly different P/E ratios—even if their intrinsic, risk-adjusted expected returns are nearly identical.
To uncover the hidden market rationality behind such apparent disparities, this paper uses the Potential Payback Period (PPP) and its derivative measure, the Stock Internal Rate of Return Including Price Appreciation (SIRRIPA). These metrics, which integrate growth, risk, and time, restore comparability and provide a coherent yield-based logic for equity valuation.
2. The Limitations of the P/E Ratio in Sectoral Comparison
The P/E ratio’s intuitive appeal hides several structural flaws:
- It ignores earnings growth. A company growing its profits at 40% annually cannot be meaningfully compared to one growing at 10%, even if both have the same P/E.
- It neglects the time value of money. The P/E assumes static earnings and implicitly discounts future income at zero interest.
- It omits risk. It offers no adjustment for the company’s beta or cost of equity capital.
As a result, comparing P/E ratios across peers often leads to false conclusions. What appears to be “overvaluation” or “undervaluation” under the P/E framework may actually reflect rational pricing differences once growth and risk are properly accounted for.
3. The PPP and SIRRIPA Framework: From Static Multiples to Dynamic Yields
The Potential Payback Period (PPP) generalizes the traditional P/E ratio by incorporating earnings growth and discounting into a single time-based measure. It answers the question: How many years of discounted earnings would be required to “repay” the stock price?
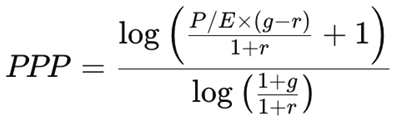
The PPP thus expresses the time dimension of valuation: the theoretical duration required for the sum of discounted future earnings to equal the current price.
From this foundation, three related return measures can be derived, expressing valuation in terms of annualized rates of return rather than static multiples.
3.1. The Stock Internal Rate of Return (SIRR)
The SIRR represents the internal rate of return based purely on the accumulation of discounted earnings over the PPP period.
It captures the stock’s intrinsic earning power and can be derived directly from the PPP through the Doubling Formula relationship:
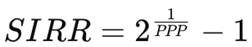
This formulation expresses the same conceptual relationship as an internal rate of return (IRR): it is the annualized rate at which cumulative earnings double the investment over the PPP horizon.A shorter PPP corresponds to a higher SIRR, reflecting stronger earning power.
3.2. The Stock Price Appreciation Rate of Return (SPARR)
The SPARR measures the annualized rate of capital appreciation implied by the expected exit price, discounted once by the rate r to reflect time value.
It links the end-of-period price (based on normalized earnings and a reduced exit multiple) to the present value framework of PPP.
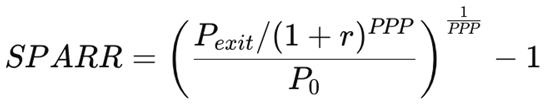
In the PPP methodology, Pexit is conservatively estimated by assuming the exit P/E ratio converges to the level of the PPP at maturity (i.e., P/Eexit = PPP).
This ensures internal consistency between the valuation horizon, the company’s long-term earnings normalization, and the assumed discounting of future prices.
3.3. The Stock Internal Rate of Return Including Price Appreciation (SIRRIPA)
Finally, the SIRRIPA integrates both sources of value creation—earnings accumulation (SIRR) and price appreciation (SPARR)—into a single compounded metric:

or equivalently,

This multiplicative relationship reflects the compounding nature of returns, ensuring mathematical and economic coherence.
It also allows SIRRIPA to be interpreted as the equity equivalent of a bond’s Yield to Maturity (YTM)—the total, annualized, risk-adjusted return implied by the market price.
Whereas the P/E ratio simply measures how many times earnings are capitalized, the PPP–SIRRIPA system measures what annualized internal return the market expects once growth, risk, and time value are integrated.
4. Comparative Valuation: Palantir, NVIDIA, and Micron Technology (Sept 26, 2025)
To demonstrate why the P/E ratio becomes irrelevant when comparing companies within the same sector, we analyze three major technology firms as of September 26, 2025:
- Palantir Technologies: a data intelligence firm with extreme valuation multiples and high perceived risk;
- NVIDIA: a mature high-growth company with sustained profitability;
- Micron Technology: a cyclical semiconductor manufacturer in a more stable growth phase.

Table 1.
– Valuation of Palantir, NVIDIA, and Micron Technology (Sept 26, 2025)
 |
Assumptions:
- 10-year U.S. Treasury yield (risk-free rate): 4.187 %
- Market risk premium: 4.00 %
- Discount rates (CAPM-based):
- o
- Palantir: r = 4.187 + (2.59 × 4.00) = 14.55%
- o
- NVIDIA: r = 4.187 + (2.10 × 4.00) = 12.59%
- o
- Micron: r = 4.187 + (1.47 × 4.00) = 10.67%
Interpretation: P/E Varies Thirtyfold — SIRRIPA Barely Changes
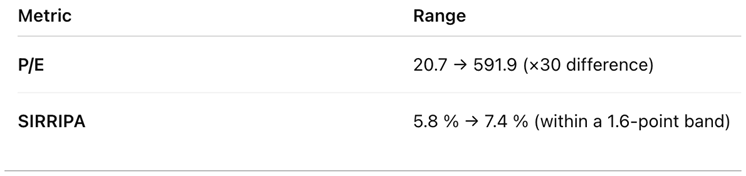
Despite belonging to the same sector, the three companies’ P/E ratios vary from 20.7 to 591.9—a difference of nearly 30 to 1.
Yet their SIRRIPA values, which represent total intrinsic, risk-adjusted annual returns, are remarkably similar, ranging only from 5.8 % to 7.4 %.
This striking convergence demonstrates that, once growth and risk are incorporated, the apparent valuation gap disappears: all three companies offer comparable intrinsic yields, consistent with the range of acceptable long-term returns for equities relative to bonds.
Palantir and the Plateau Effect
Palantir’s case highlights the plateau effect, where the P/E ratio loses relevance beyond extreme levels. At P/E ≈ 600, Palantir’s SIRRIPA still stabilizes around 5.8 %, nearly identical to Micron’s 5.9 %. This flattening means that once a stock’s price fully discounts its long-term growth and risk, further increases in P/E no longer affect its implied return.
Thus, the P/E becomes mathematically inflated but economically neutral, while the SIRRIPA remains stable and interpretable.
This plateau effect demonstrates that high valuations can coexist with rational market expectations—not speculative mania.
Sensitivity to Growth Projections and Scenario Analysis
Both the PPP and SIRRIPA are highly sensitive to earnings growth assumptions, just as the market itself is.
Small variations in projected growth rates can significantly alter PPP durations and implied intrinsic returns, mirroring how earnings surprises immediately affect share prices.
This sensitivity is amplified by the compound effect of growth, which is mathematically captured by the logarithmic structure of the PPP and its derivatives.
As a result, even marginal changes in growth expectations can generate disproportionate shifts in implied returns — precisely as observed in real markets when analysts revise forecasts.
This heightened responsiveness reflects the inherently forward-looking nature of financial markets, where expectations drive valuation.
Accordingly, analysts should conduct sensitivity analyses and scenario simulations when applying the PPP–SIRRIPA framework to assess how variations in growth and risk assumptions could affect valuation outcomes and investment decisions.
5. Why SIRRIPA Succeeds Where the P/E Fails
The convergence of SIRRIPA across Palantir, NVIDIA, and Micron proves that the P/E ratio is irrelevant as a comparative tool, even within a single sector.
While P/E spans a thirtyfold range, the market-implied internal return (SIRRIPA) remains roughly the same—within a narrow interval of about one and a half percentage points.
Such a small difference is economically significant, because in both equity and bond markets, a few basis points can reflect meaningful distinctions in risk or growth expectations.
This convergence highlights the rational efficiency of the market: despite vastly different P/E ratios, investors implicitly require similar risk-adjusted total returns, confirming that SIRRIPA captures the underlying equilibrium between expected growth, risk, and discounting far more accurately than the static P/E ratio ever could.
6. Market Vindication: Real-World Evidence of Rational Pricing
Recent market performance supports the predictive validity of the PPP–SIRRIPA framework. Over the twelve months ending September 26, 2025, the stock prices of the three companies increased as follows:

Despite vast differences in their P/E ratios, these performances align broadly with their SIRRIPA-implied returns. A year earlier, Palantir’s SIRRIPA was much higher, signaling undervaluation. Its subsequent 400% surge retrospectively validated that return signal, confirming SIRRIPA’s predictive relevance.
In short, the market’s behavior ex post has vindicated the logic of SIRRIPA ex ante. Investors appear to price stocks according to their risk-adjusted internal rates of return, not their raw P/E multiples — revealing the hidden rationality of market pricing once valuation is expressed through the time- and yield-based lens of PPP and SIRRIPA.
7. Conclusion: From Ratios to Returns — The Rational Foundation of Market Valuation
The analysis of Palantir, NVIDIA, and Micron Technology demonstrates that the P/E ratio loses its comparative meaning in cross-company analysis.
Although their P/Es differ by a factor of 30, their SIRRIPA values converge around 6 %, a range that corresponds to the rational equilibrium between stocks and bonds.
This finding reveals that:
- P/E-based comparisons distort reality by ignoring growth and risk;
- The PPP–SIRRIPA framework captures the market’s true valuation logic; and
- What appears as “irrational exuberance” under the P/E lens is, in fact, hidden rationality within a risk-adjusted, time-based equilibrium.
Ultimately, the SIRRIPA represents the equity equivalent of a bond’s yield to maturity—a universal measure of intrinsic return. By adopting it, analysts can move beyond the illusion of valuation disparity and perceive the deeper truth of financial markets:
Every stock, like every bond, is priced to deliver a return proportional to its risk.
References (with brief contributions)
- Williams, J. B. (1938). The Theory of Investment Value. Why/How: Laid the foundation for valuing equities as the present value of future cash flows (dividends/earnings). PPP inherits this core PV logic by summing discounted future earnings; SIRRIPA reframes the same PV identity as an implied internal rate of return.
- Gordon, M. J. (1962). The Investment, Financing, and Valuation of the Corporation. Why/How: The Gordon growth model formalized the growth–discount–value relationship. PPP generalizes this to finite horizons with explicit growth vs. discount interplay; SIRRIPA converts the valuation identity into a yield-like metric.
- Graham, B. , & Dodd, D. (1934/2009). Security Analysis. Why/How: Emphasized earnings power and marginof-safety thinking. PPP operationalizes “earning power over time,” while SIRRIPA translates that power into a risk-adjusted return comparable to bonds.
- Sharpe, W. F. (1964). “Capital Asset Prices: A Theory of Market Equilibrium under Conditions of Risk.” Journal of Finance. Why/How: CAPM provides the risk-adjusted discount rate used in PPP (via β). That same discount rate anchors SIRRIPA’s risk calibration and the stock–bond comparability.
- Fama, E. F. , & French, K. R. (1993). “Common Risk Factors in the Returns on Stocks and Bonds.” Journal of Financial Economics. Why/How: Extends CAPM to multi-factor risk. Validates the need to embed systematic risk properly in discount rates (r) for PPP and to interpret SIRRIPA as a risk-conditioned internal return.
- Merton, R. C. (1973). “An Intertemporal Capital Asset Pricing Model.” Econometrica. Why/How: Intertemporal risk and state variables justify time-varying discount rates. Strengthens the case for scenario analysis in PPP/SIRRIPA (sensitivity to g and r across states).
- Cochrane, J. H. (2011). Asset Pricing. Why/How: Unifies discounting via stochastic discount factors; clarifies that expected return is the price of risk. PPP/SIRRIPA implement this practically: r absorbs risk; SIRRIPA expresses the market-implied expected return.
- Campbell, J. Y. , & Shiller, R. J. (1988–1991). Various papers on dividends, earnings, and returns. Why/How: Show how valuation ratios link to expected returns and how growth expectations drive prices—supporting PPP/SIRRIPA’s emphasis on g-sensitivity and the observed impact of earnings surprises.
- Shiller, R. J. (2000/2015). Irrational Exuberance. Why/How: Documents valuation extremes and regime shifts. Motivates PPP/SIRRIPA’s move beyond static P/E to a forward-looking, discount-and-growth-aware intrinsic yield.
- Ilmanen, A. (2011/2023). Expected Returns; Investing Amid Low Expected Returns. Why/How: Cross-asset expected return frameworks and risk premia. SIRRIPA’s bond-like yield framing and benchmarking to risk-free YTM align with Ilmanen’s cross-asset comparability.
- Fabozzi, F. J. (various). Bond Markets, Analysis and Strategies. Why/How: Canonical treatment of YTM/IRR math and term-structure. Informs SIRRIPA’s mathematical symmetry with bond YTM and the stock–bond benchmarking logic.
- Koller, T. , Goedhart, M., & Wessels, D. (2020). Valuation (McKinsey). Why/How: Practical DCF, growth, and ROIC–growth–value mechanics. PPP/SIRRIPA extend these mechanics by turning valuation into time (PPP) and yield (SIRRIPA), enabling sector-level comparability.
- Damodaran, A. (2012/2023). Investment Valuation. Why/How: Empirical estimation of discount rates (CAPM, betas), cash flows, and growth. Direct input to r and g used in PPP; SIRRIPA then translates those inputs into total implied return.
- Penman, S. H. (2011). Accounting for Value; (2010) Financial Statement Analysis and Security Valuation. Why/How: Links accounting earnings to intrinsic value (residual income). Supports PPP’s use of earnings streams and cautions on forecast sensitivity—hence our scenario analyses.
- Mehra, R. , & Prescott, E. (1985). “The Equity Premium: A Puzzle.” Journal of Monetary Economics. Why/How: Justifies comparing SIRRIPA to risk-free rates and discussing risk premia explicitly; PPP/SIRRIPA quantify that premium per stock.
- Grinold, R. C. , & Kahn, R. N. (2000/2020). Active Portfolio Management. Why/How: Expected-return modeling and risk budgeting. SIRRIPA provides a clean expected-return input for cross-asset and cross-stock allocation decisions.
- Bodie, Z. , Kane, A., & Marcus, A. J. (2022). Investments. Why/How: Textbook baseline for IRR, discounting, CAPM, risk premia. Anchors PPP/SIRRIPA in standard theory and pedagogy.
- Brealey, R. A. , Myers, S. C., & Allen, F. (2020). Principles of Corporate Finance. Why/How: Comprehensive treatment of PV, IRR, WACC, and investment criteria. PPP/SIRRIPA are consistent with these principles, reframing equity value as time-to-payback and implied return.
- Kahn, M. N. , & Cornell, B. (1999/2013). The Equity Risk Premium (and related papers). Why/How: Estimation and interpretation of equity premia. SIRRIPA → stock-specific expected return; compare to rf to infer risk premium and relative attractiveness.
- Mauboussin, M. J. , & Rappaport, A. (2001/2021). Expectations Investing. Why/How: Reverse-engineering market expectations. SIRRIPA explicitly back-solves the market’s implied return from price—exactly the expectations-investing mindset.
Disclaimer/Publisher’s Note: The statements, opinions and data contained in all publications are solely those of the individual author(s) and contributor(s) and not of MDPI and/or the editor(s). MDPI and/or the editor(s) disclaim responsibility for any injury to people or property resulting from any ideas, methods, instructions or products referred to in the content. |
© 2025 by the authors. Licensee MDPI, Basel, Switzerland. This article is an open access article distributed under the terms and conditions of the Creative Commons Attribution (CC BY) license (http://creativecommons.org/licenses/by/4.0/).
Copyright: This open access article is published under a Creative Commons CC BY 4.0 license, which permit the free download, distribution, and reuse, provided that the author and preprint are cited in any reuse.


