1. Introduction
Pancreatic ductal adenocarcinoma (PDAC) has been recognized as a cancer with high mortality and limited durable benefit from available treatments [
1,
2]. The serum marker CA 19-9 has been used widely for monitoring, yet diagnostic and prognostic precision-particularly in early disease-has remained limited [
3]. Broader biomarker efforts, including proteomic and metabolomic panels and liquid-biopsy assays, have shown incremental advances but have not consistently supported treatment selection in practice [
4,
5,
6].
At the biological level, PDAC has been reported to rely on reprogrammed metabolism, with recurring roles for glutamine and lipid pathways that sustain growth under nutrient stress [
7,
8]. The tumor microenvironment has also been described as fibrotic and immunosuppressive, a state linked to weak antitumor immunity and modest clinical responses [
9,
10,
11]. Single-cell studies have further identified antigen-presenting cancer-associated fibroblasts that shape local immunity [
12].
Bulk RNA-seq permits these dimensions to be examined in parallel: immune-cell composition can be approximated by digital cytometry, and pathway activities can be summarized by gene-set scoring, yielding complementary views of tumor-intrinsic programs and microenvironmental context [13-16]. Findings from The Winter Lab have further shown that PDAC cells maintain survival under nutrient and redox stress, and that redox-support pathways influence treatment response; related mechanistic reports have highlighted links between glutamine use and antioxidant defenses in sustaining growth under hostile conditions [
8,
17,
18]. Yet, the broader clinical significance of these dependencies across large, heterogeneous patient cohorts has not been characterized.
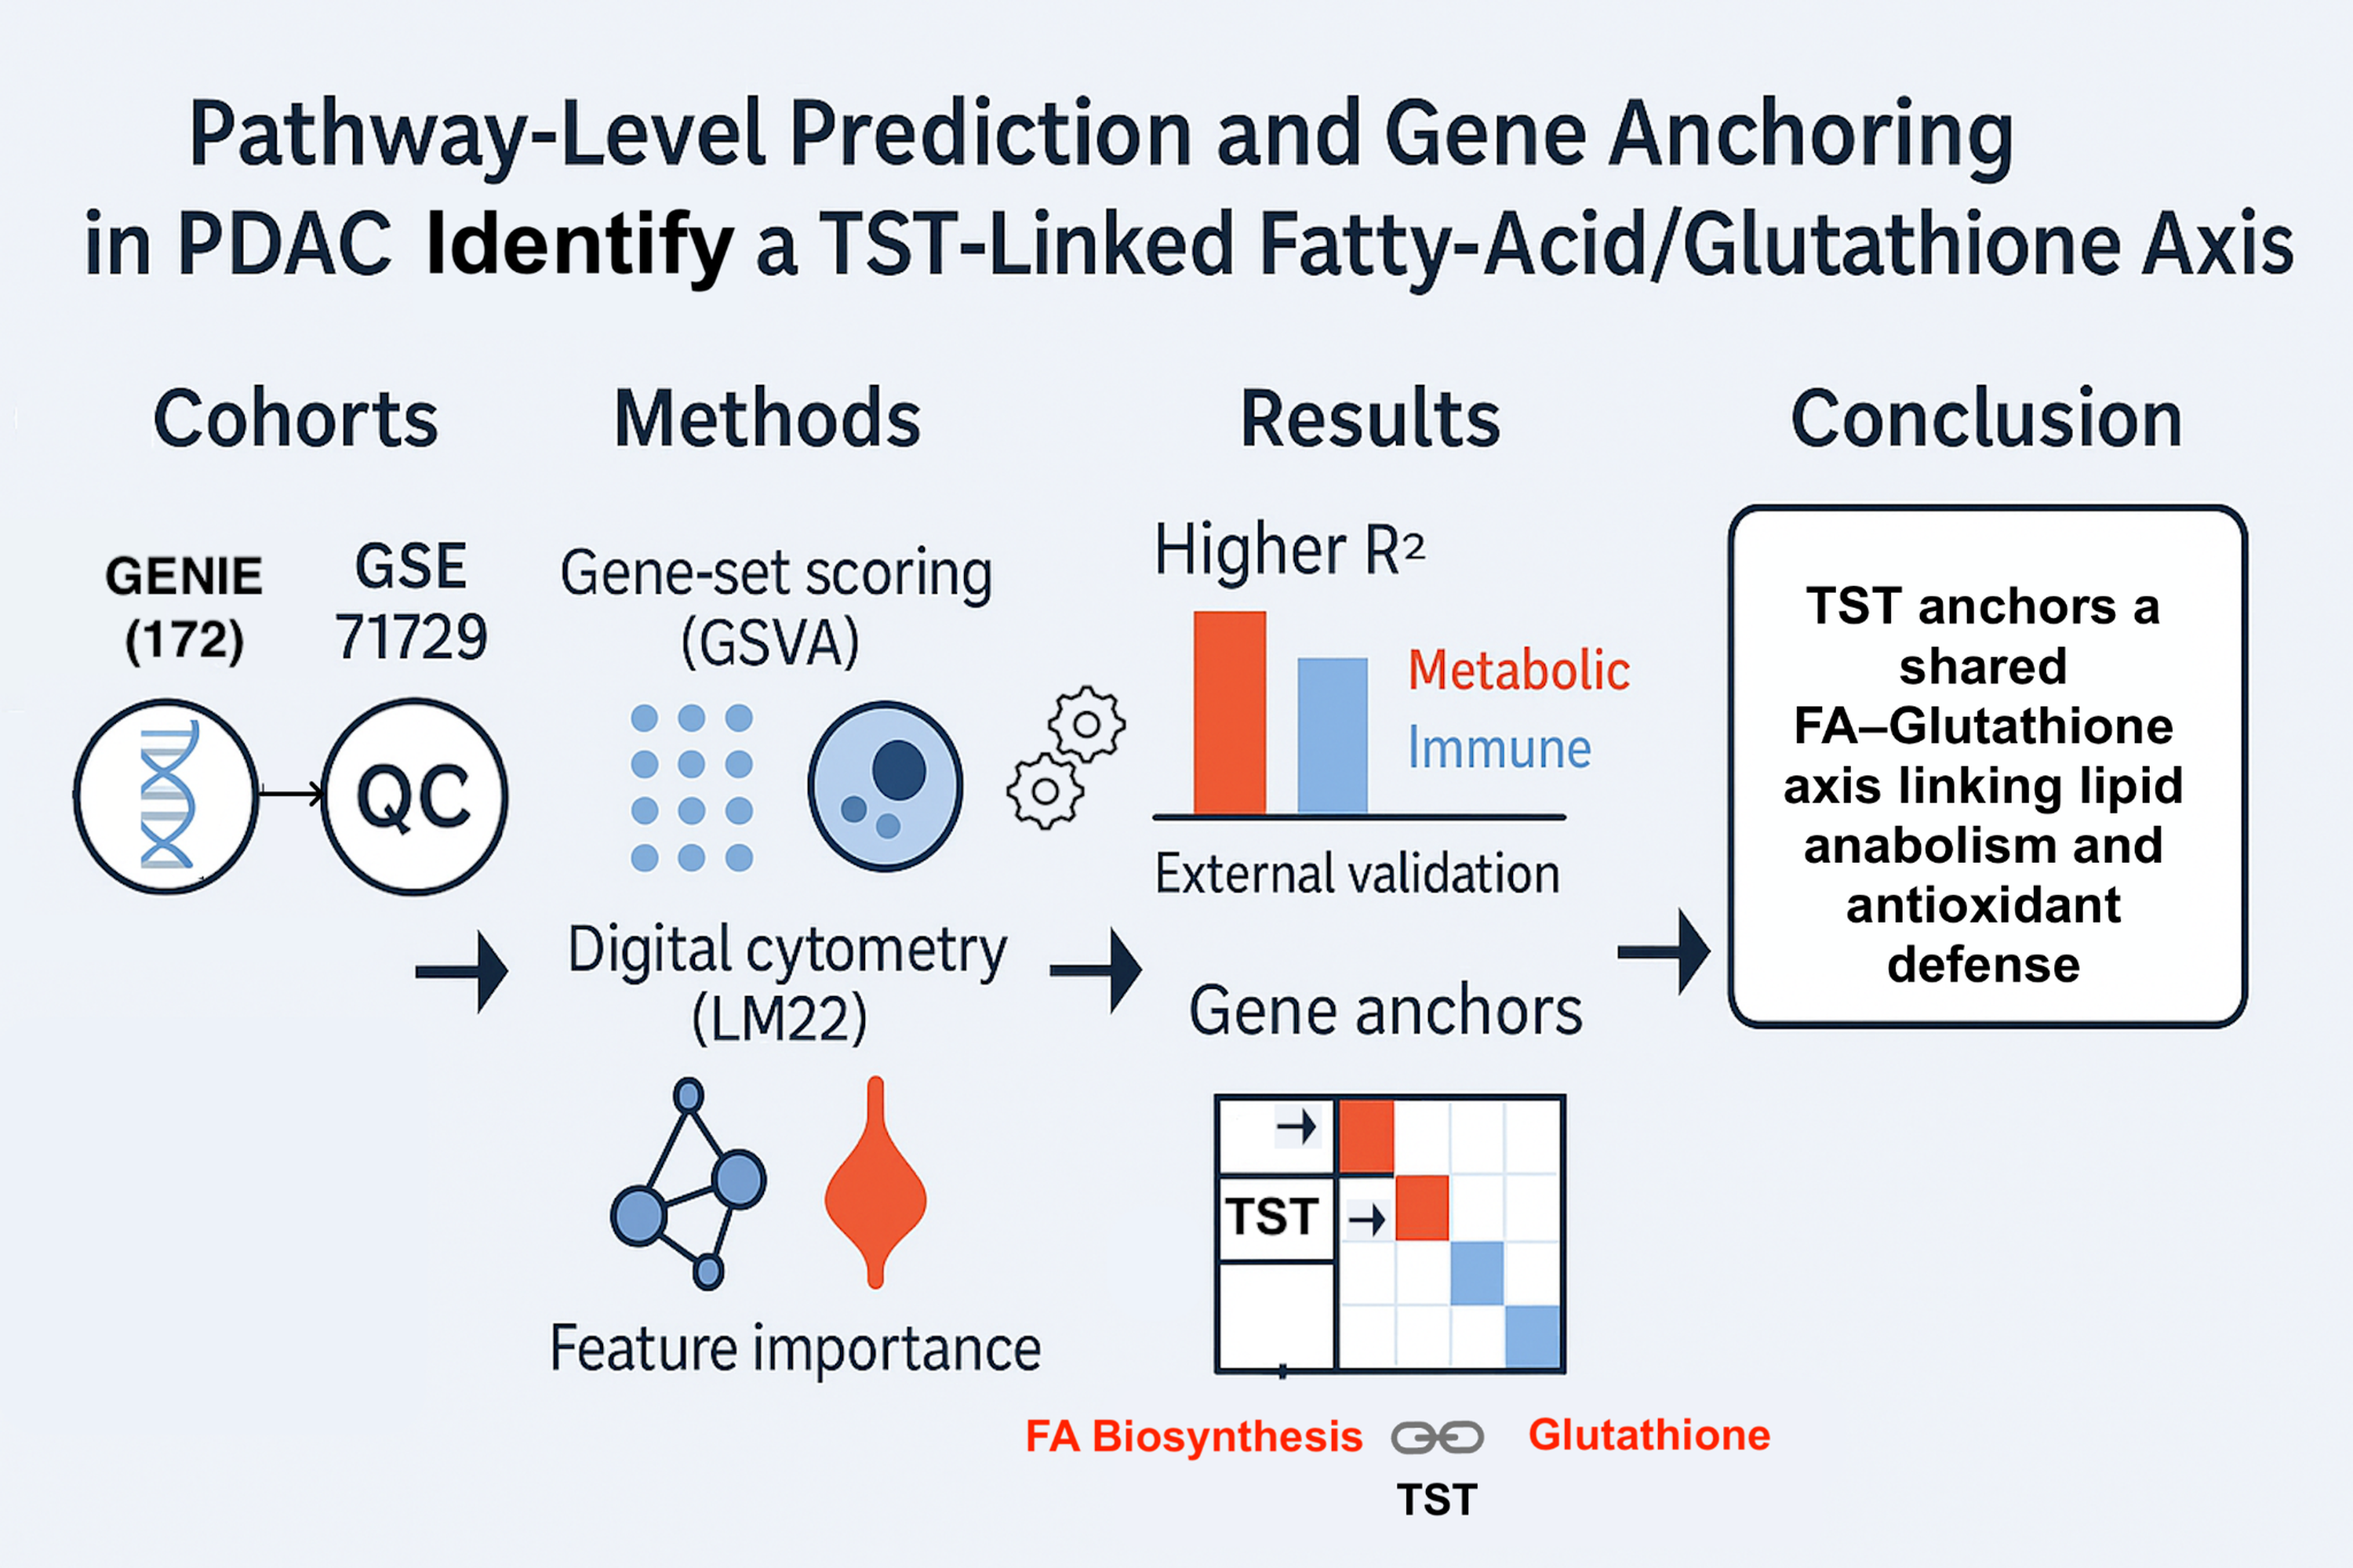
A practical question has remained open: which immunometabolic pathways in PDAC can be predicted consistently from routine transcriptomes, and how can those predictions be tied to specific genes in a way that is interpretable and transferable across cohorts? To address this, a compact, pathway-level map was produced that quantifies which pathways are recoverable from bulk expression, measures the added value of immune-composition context, and anchors each pathway to specific gene signals for transparent interpretation.
2. Materials and Methods
2.1. Data Acquisition and Quality Control
2.1.1. Primary Dataset
Bulk RNA-Seq data for 178 primary PDAC samples were downloaded from the AACR Project GENIE database [
19] and quantified with RSEM [
20]. Six outlier samples were removed based on interquartile-range criteria applied to total read counts and the fraction of zero counts per sample. Genes with missing or duplicate identifiers were collapsed or dropped, and expression values were transformed using log₂(x+1). To reduce noise, genes with zero counts in more than 50% of samples or with variance in the bottom 20
th percentile were filtered out, resulting in the main (GENIE) dataset for model training and analysis.
2.1.2. Validation Dataset
Bulk RNA-Seq count data for 357 primary PDAC samples were downloaded from the Gene Expression Omnibus under accession GEO:GSE71729 [
21]. To ensure equitable comparison of results, the GSE71729 cohort was processed through the same QC pipeline described above for GENIE (outlier removal by IQR on library size and zero-count fraction; log₂(x+1) transformation; removal of low-variance and sparsely expressed genes), resulting in the external validation (GSE71729) dataset.
2.1.3. Cross-Cohort Harmonization
For further like-to-like comparison of models’ results, both primary (GENIE) and external validation (GSE71729) datasets were intersected (6,432 common genes). Raw counts were then normalized and variance-stabilized in one step using DESeq2’s size-factor normalization and variance-stabilizing transformation [
22]. Finally, residual batch effects between cohorts were corrected with ComBat [
23,
24]. Post-QC cohort characteristics (sample/gene counts, library sizes, stage, and metastasis distributions) are summarized in
Table 1 (Results).
2.2. Tumor Microenvironment Estimation and Demographic Stratification
Immune cell fractions were inferred using CIBERSORTx [
14] with the LM22 signature matrix [
16] (LM22 models immune lineages and does not include fibroblasts/CAFs). Output scores were normalized across the 22 LM22 cell types to sum to 1.0 per sample. Eight cell types were prespecified for downstream stratification: naïve B cells, memory B cells, CD8⁺ T cells, CD4⁺ memory resting T cells, regulatory T cells (Tregs), resting NK cells, M1 macrophages, and M2 macrophages. Fractions were summarized as medians with interquartile ranges (IQRs) at the cohort level and across AJCC stage and sex; “predominance” refers to the cell type with the highest cohort-wide median estimated fraction (ties broken by the larger 75th percentile). As a sensitivity check, exploratory non-parametric comparisons across AJCC stage (Kruskal–Wallis) and by sex (Mann–Whitney U) were performed with Benjamini–Hochberg false discovery rate control (two-sided, q < 0.05) [
25,
26,
27].
2.3. Metabolic and Immune Pathway Activity
Pathway activity was quantified using GSVA [
15] on gene sets from Gene Ontology Biological Process (GO-BP) [
28], KEGG [
29], Reactome [
30], and the MSigDB Hallmark collection [
31]. Candidate pathways were ranked by between-tumor variance of GSVA scores. The five immune pathways with the highest variance were retained. Ten metabolic pathways for downstream analyses were then selected a priori according to three criteria: (1) robust between-tumor variability, (2) established relevance to PDAC progression or therapy resistance, and (3) evidence of crosstalk with immune programs (assessed via correlations with immune-pathway scores). Anchoring to prior PDAC literature on pathway relevance was used for justification of the selected metabolic set [
32,
33,
34,
35,
36,
37,
38,
39].
2.4. Machine Learning Framework
2.4.1. Model specification, training, and ensembling
Models were constructed to predict each of the 15 pathways. For each pathway, the response variable was defined as its GSVA score. Predictor sets were composed of: (1) GSVA scores of the remaining 14 pathways (the target excluded), (2) the 22 LM22 immune cell fractions estimated by CIBERSORTx, and (3) clinical covariates (AJCC stage, metastasis state, sex). After stratification by stage (and, where applicable, metastasis and sex), an 80/20 train/test split was applied. Hyperparameters for Elastic Net (EN), Random Forest (RF), and XGBoost (XGB) were tuned by five-fold cross-validation on the training set.
Predictions from the three base learners were also averaged to form an averaged ensemble; stacking was evaluated but did not surpass averaging and is not emphasized. For each pathway and cohort, the winner was defined as the single base learner achieving the highest held-out test R². For consistent comparison within and across cohorts, both the winner’s test R² and the averaged-ensemble test R² were reported, and per-model means across pathways (EN/RF/XGB) were summarized to contextualize pathway-specific winners. All modeling was implemented in Python using scikit-learn [
40] and XGBoost [
41].
2.4.2. Performance evaluation and benchmarking
Model accuracy was measured by the coefficient of determination (R²) on the held-out test set, with mean ± standard error reported across cross-validation folds.
2.4.3. External validation
Trained models were applied to the GSE71729 cohort for external validation [
21].
2.4.4. Controlled feature-set comparison (GSVA-only, TME-only, Integrated)
A controlled feature-set comparison was conducted to quantify the contribution of tumor microenvironment (TME) features to pathway-activity prediction. Three predictor configurations were evaluated per pathway: GSVA-only (the 14 non-target pathway GSVA scores), TME-only (the 22 LM22 immune fractions), and Integrated (GSVA-only ∪ TME-only), with the same clinical covariates (AJCC stage, metastasis state, sex) included in all configurations. The identical split, stratification, preprocessing (z-scoring within the training set and applying the parameters to the test set), learners (Elastic Net, Random Forest, XGBoost), and five-fold cross-validation (described in 2.4.1) were used without modification. For each configuration, models were trained and evaluated on the held-out test set; per-pathway test R² values were recorded for EN, RF, XGB, and the averaged ensemble, and summary statistics were computed across pathways within each configuration. The incremental benefit of integration was quantified as ΔR² = R²Integrated− max(R²GSVA-only, R²TME-only), calculated for both the per-pathway winner (the base learner with the highest held-out test R²) and the averaged ensemble.
2.5. Permutation Importance
In addition to permutation importance, model-internal importances were computed per learner (absolute coefficients for EN, mean decrease in impurity for RF, and gain for XGB), normalized within learner and pathway, and averaged across learners to produce consensus rankings used in downstream summaries. Permutation importance was used to quantify each feature’s contribution to out-of-sample performance [
42]. Within every 5-fold cross-validation split, models were fit on the training fold and a baseline R² was recorded on the held-out fold. For each predictor (pathway GSVA score, CIBERSORTx fraction, or clinical covariate), its values in the held-out fold were randomly permuted 10,000 times, the model was re-evaluated, and ΔR² = R²
perm − R²
base was stored (more negative ΔR² indicates greater importance). Mean ΔR² across permutations and folds with 95% CIs are reported, and two-sided empirical p-values are computed as the fraction of permutations with ΔR² ≥ 0, adjusted across features per pathway using Benjamini–Hochberg FDR control (q < 0.05) [
25].
Permutation importance was computed in two modes: (i) a single-feature mode, in which each predictor was permuted individually in the held-out fold to obtain its marginal ΔR²; and (ii) a groupwise mode for correlated predictors (|r| ≥ 0.7), in which the entire correlated set was permuted jointly to obtain a correlation-aware, joint ΔR², mitigating bias from multicollinearity.
2.6. Gene-level correlation analysis
For each pathway, Pearson correlations were computed between each gene’s log₂(x+1) expression and that pathway’s GSVA score across all samples. The top 10 genes per pathway were retained by the absolute correlation coefficient (|r|). Correlations were computed genome-wide and were not restricted to model features. This analysis was used to contextualize model-derived feature importance at the gene level; genes were not used as predictors in the models.
3. Results
3.1. Post-QC Cohort Characteristics
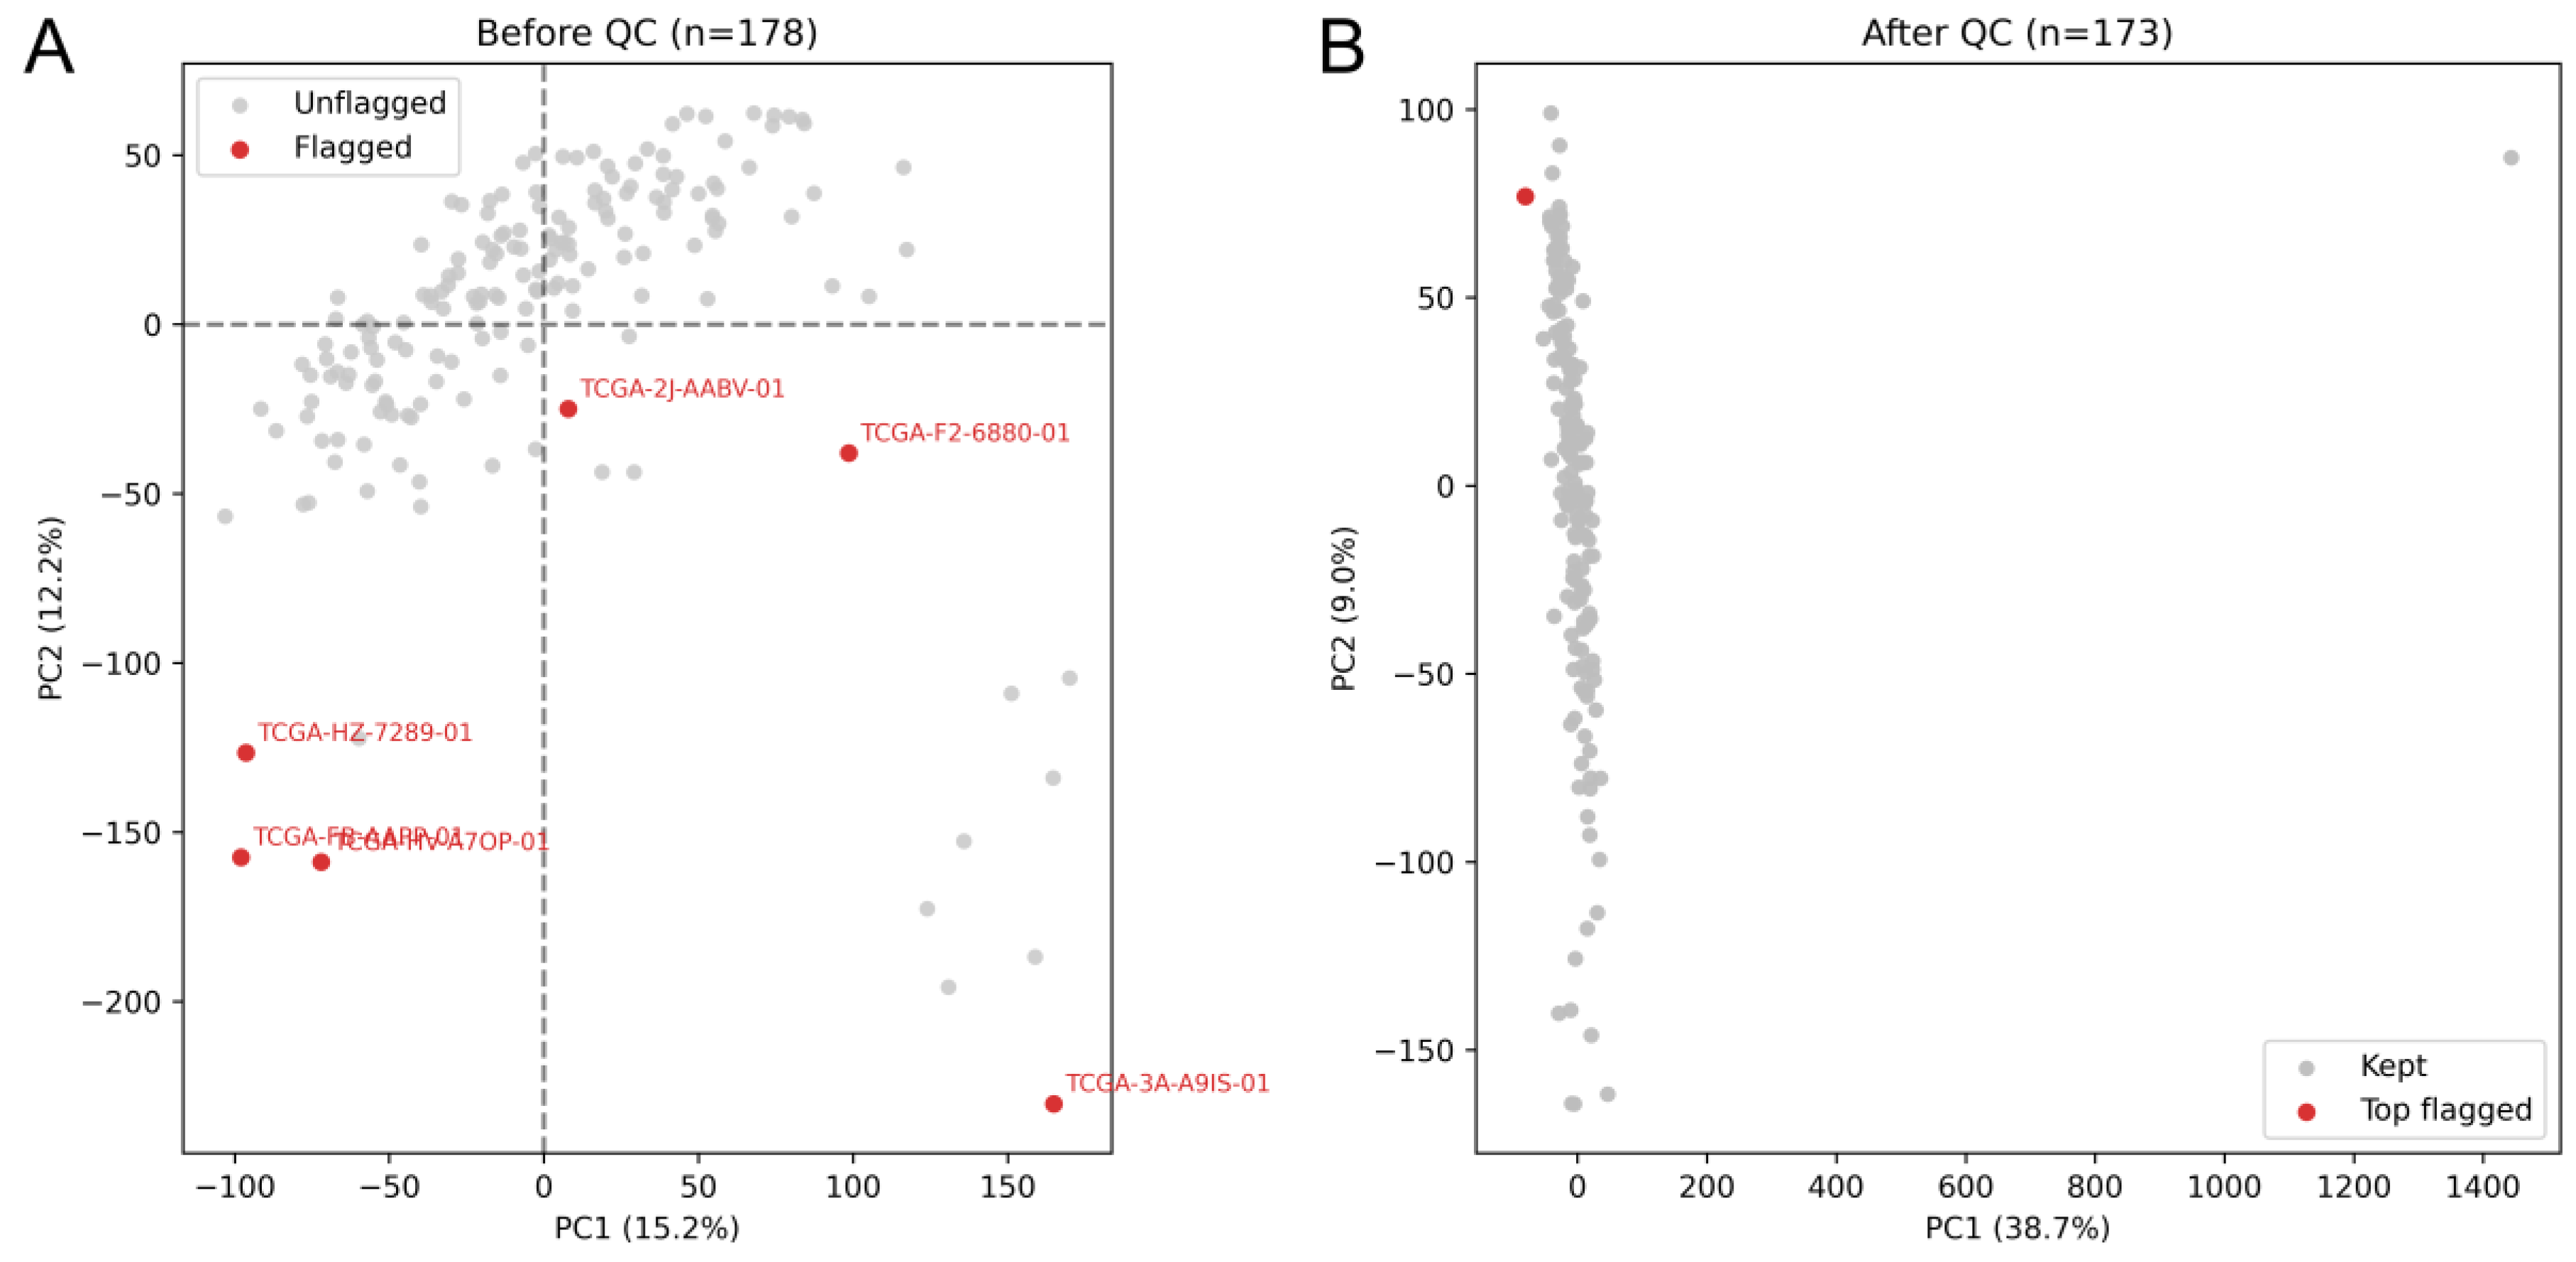
After QC, the GENIE expression matrix comprised 172 high-quality PDAC samples and 6,432 genes. Post-QC library sizes in GENIE averaged 1.38 × 10⁵ reads per sample (SD =1.34 × 10⁴; range, 1.26 × 10⁵–1.64 × 10⁵). Among GENIE patients, metastasis state was M0 (no distant metastasis) in 84 samples (45.7%), M1 (distant metastasis) in 5 samples (2.7%), and MX (unknown) in 95 samples (51.6%) (
Table 1).
Figure 1 shows the primary dataset (GENIE) before and after quality control. Multiple PCA outliers were identified; all extreme outliers were removed, while a single marginal outlier-located near the main cluster-was retained for downstream analyses.
3.2. Tumor Microenvironment Composition and Demographic Stratification
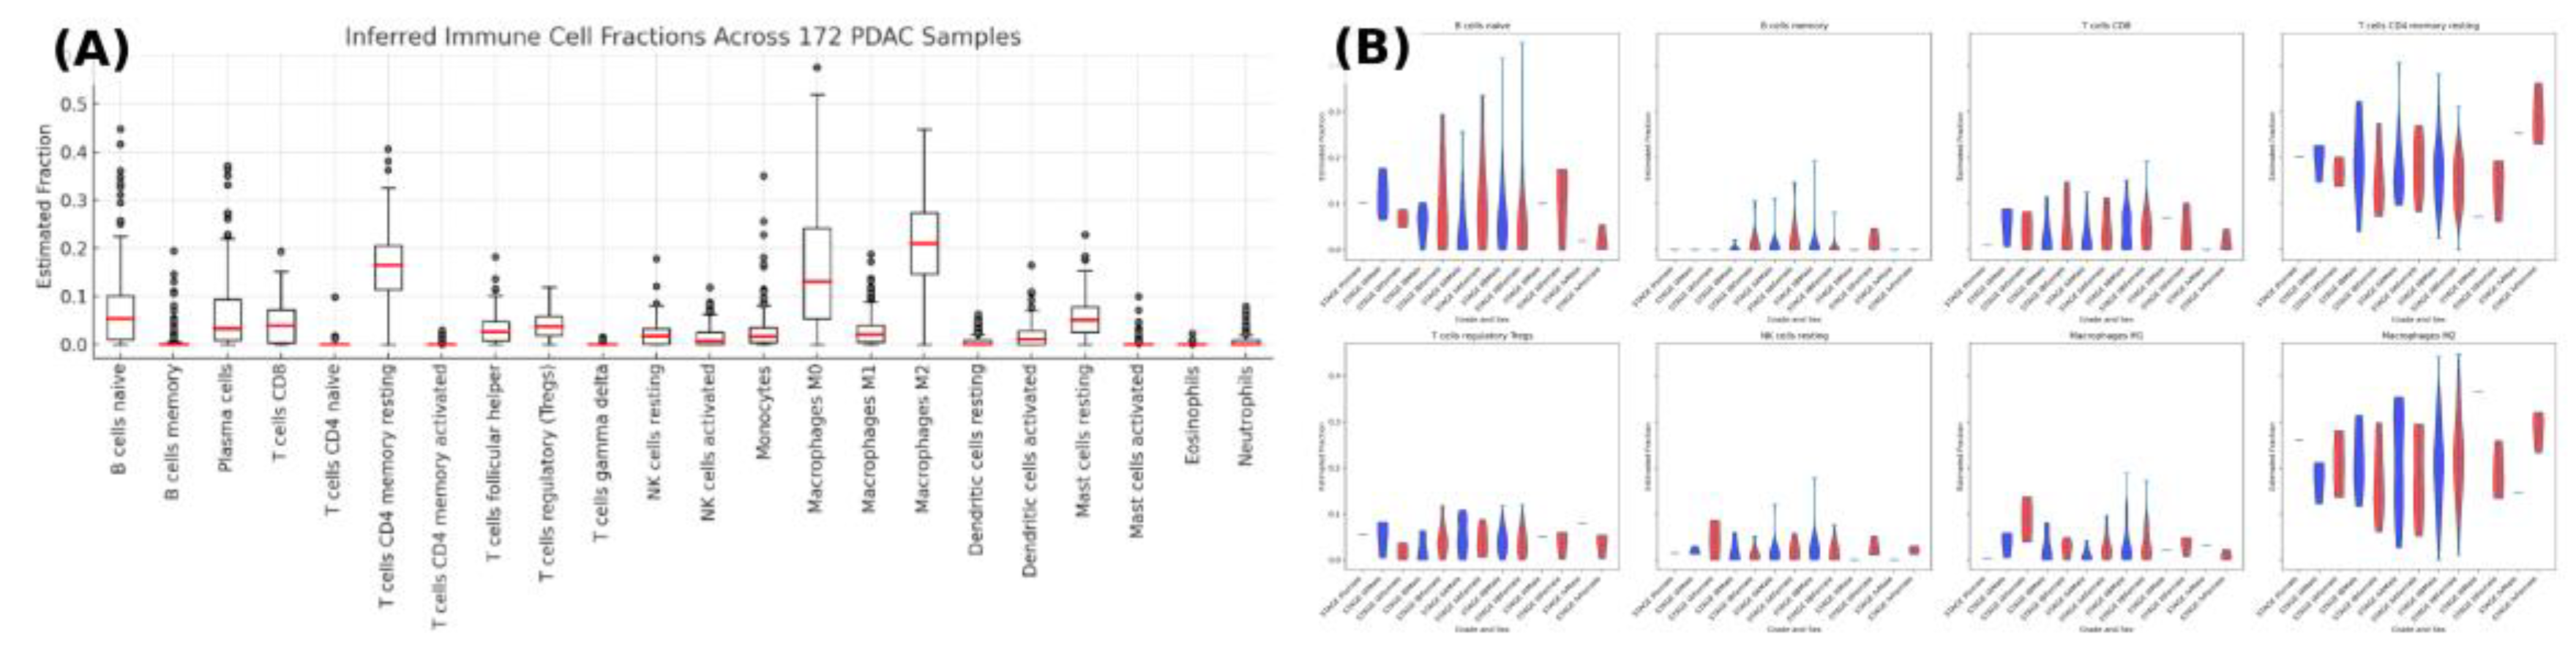
Digital cytometry (CIBERSORTx/LM22) across 172 PDAC tumors indicated M2 macrophages as the predominant immune population, while CD8⁺ T cells and regulatory T cells (Tregs) constituted the principal lymphoid compartments (
Figure 2A).
Figure 2B stratifies eight representative immune cell types by AJCC pathologic stage and sex; groupwise medians suggested CD8⁺ levels peak at stage IIB and Tregs increase with stage, with no material sex-specific differences. Exploratory stage- and sex-based comparisons did not remain significant after FDR control (all q >0.05).
3.3. Predicting pathway activity from gene expression
Pathway variability and selection were defined a priori as described in Methods (2.3); The accompanying rationale and figures are provided in Supplementary Text S1 and Supplementary
Figures S1–S3.
3.3.1. Within-cohort model performance (primary cohort)
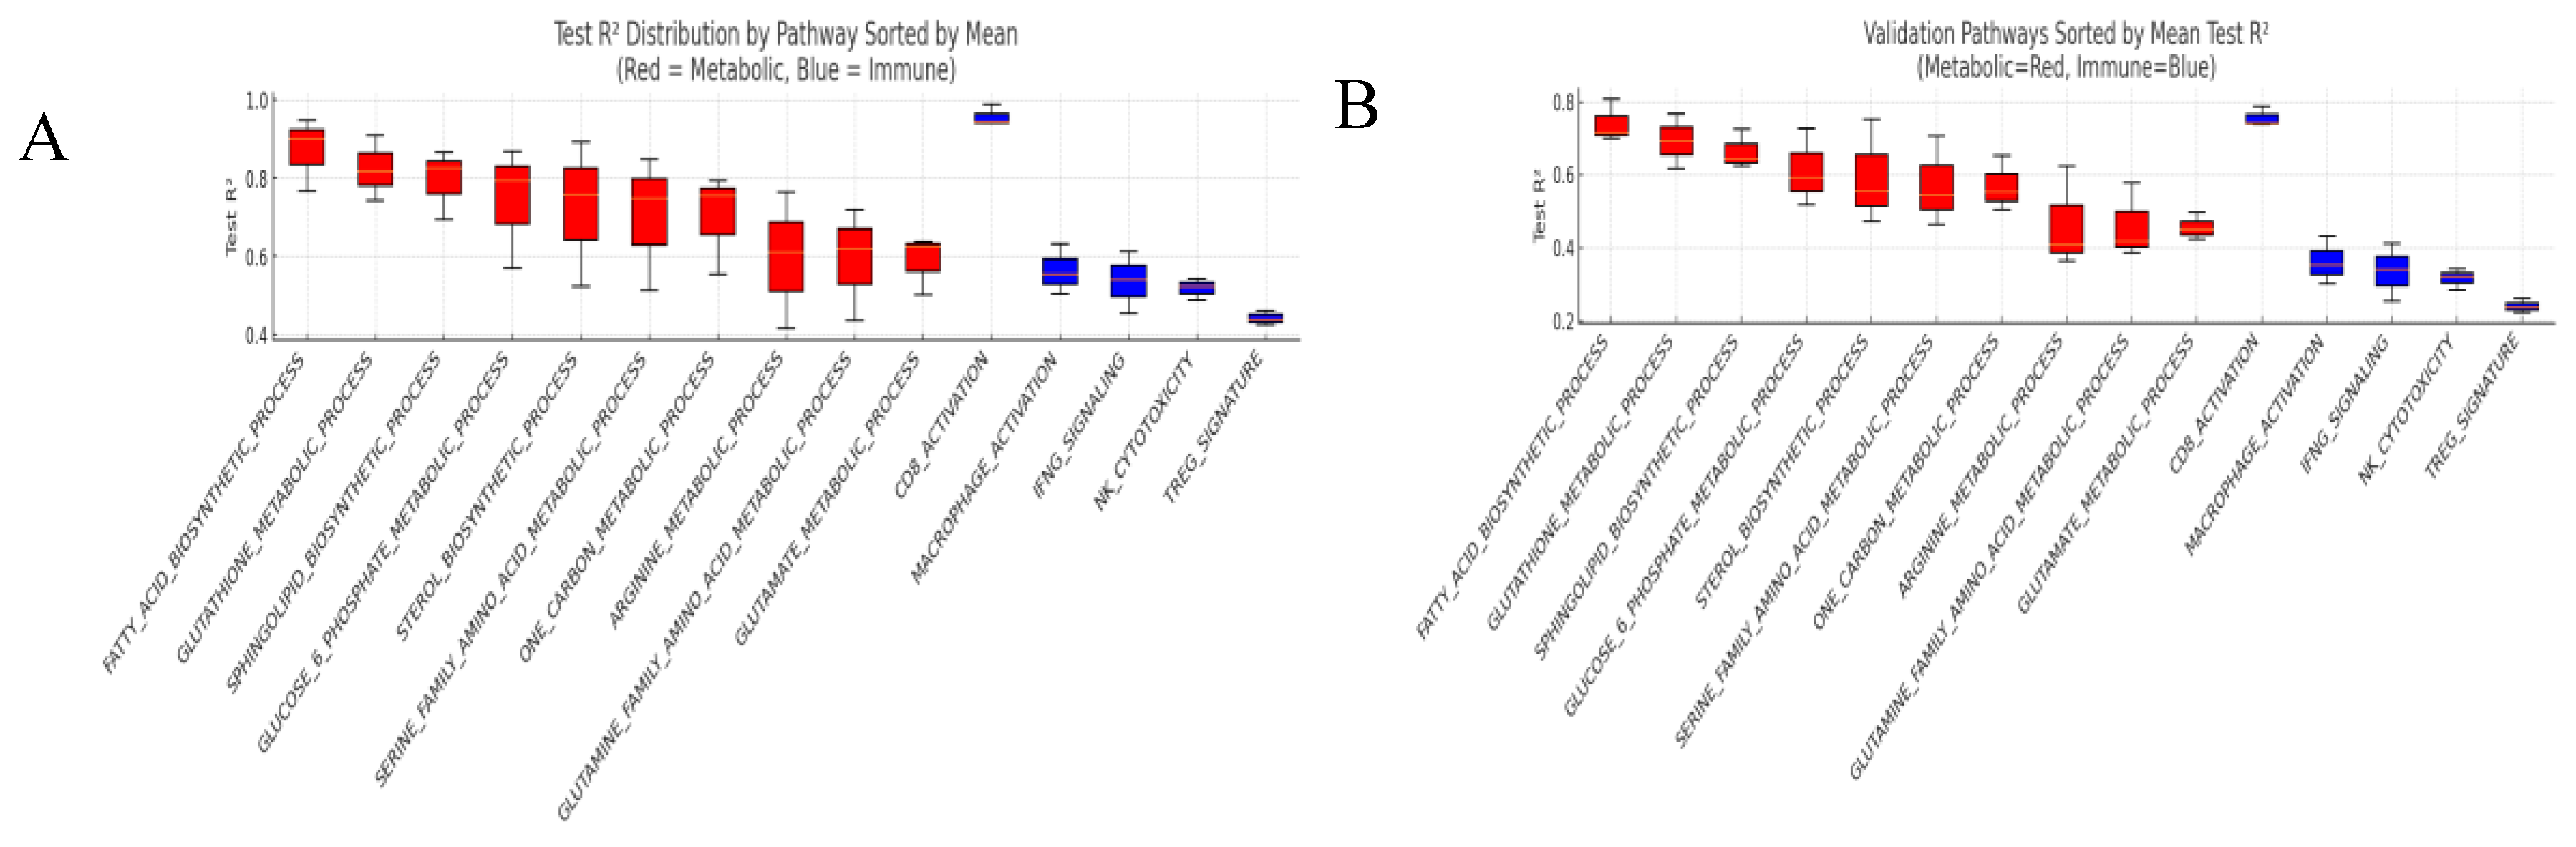
Higher accuracy was observed for metabolic targets than for immune targets.
Metabolic (n = 10): the winner mean test R² was 0.825 (EN was the per-pathway winner for 10/10 targets); the averaged-ensemble mean was 0.714 (Δ = 0.111). Per-model means (test R²) were: EN 0.825, XGB 0.744, RF 0.572.
Immune (n = 5): the winner mean test R² was 0.648 (winners distributed as XGB = 2, RF =2, EN = 1); the averaged-ensemble mean was 0.603 (Δ = 0.045). Per-model means were: XGB 0.622, RF 0.598, EN 0.589.
Pathway-level performance distributions are shown in
Figure 3A (boxplots for all 15 pathways, sorted by the mean test R² across base learners; metabolic = red; immune = blue). Model-by-model bar plots are provided in
Supplementary Figure S4.
3.3.2. External validation
Generalizability was assessed on the external validation cohort GSE71729 (n = 351) using identical preprocessing, feature construction, and the same winner rule; the metabolic-over-immune advantage was preserved.
Metabolic (n = 10): the winner mean test R² was 0.685 (EN remained the per-pathway winner for 10/10 targets); the averaged-ensemble mean was 0.584 (Δ = 0.101). Per-model means were: EN 0.685, XGB 0.544, RF 0.522.
Immune (n = 5): the winner mean test R² was 0.562 (winners mixed across models); the averaged-ensemble mean was 0.543 (Δ = 0.019). Per-model means were: XGB 0.562, RF 0.538, EN 0.529.
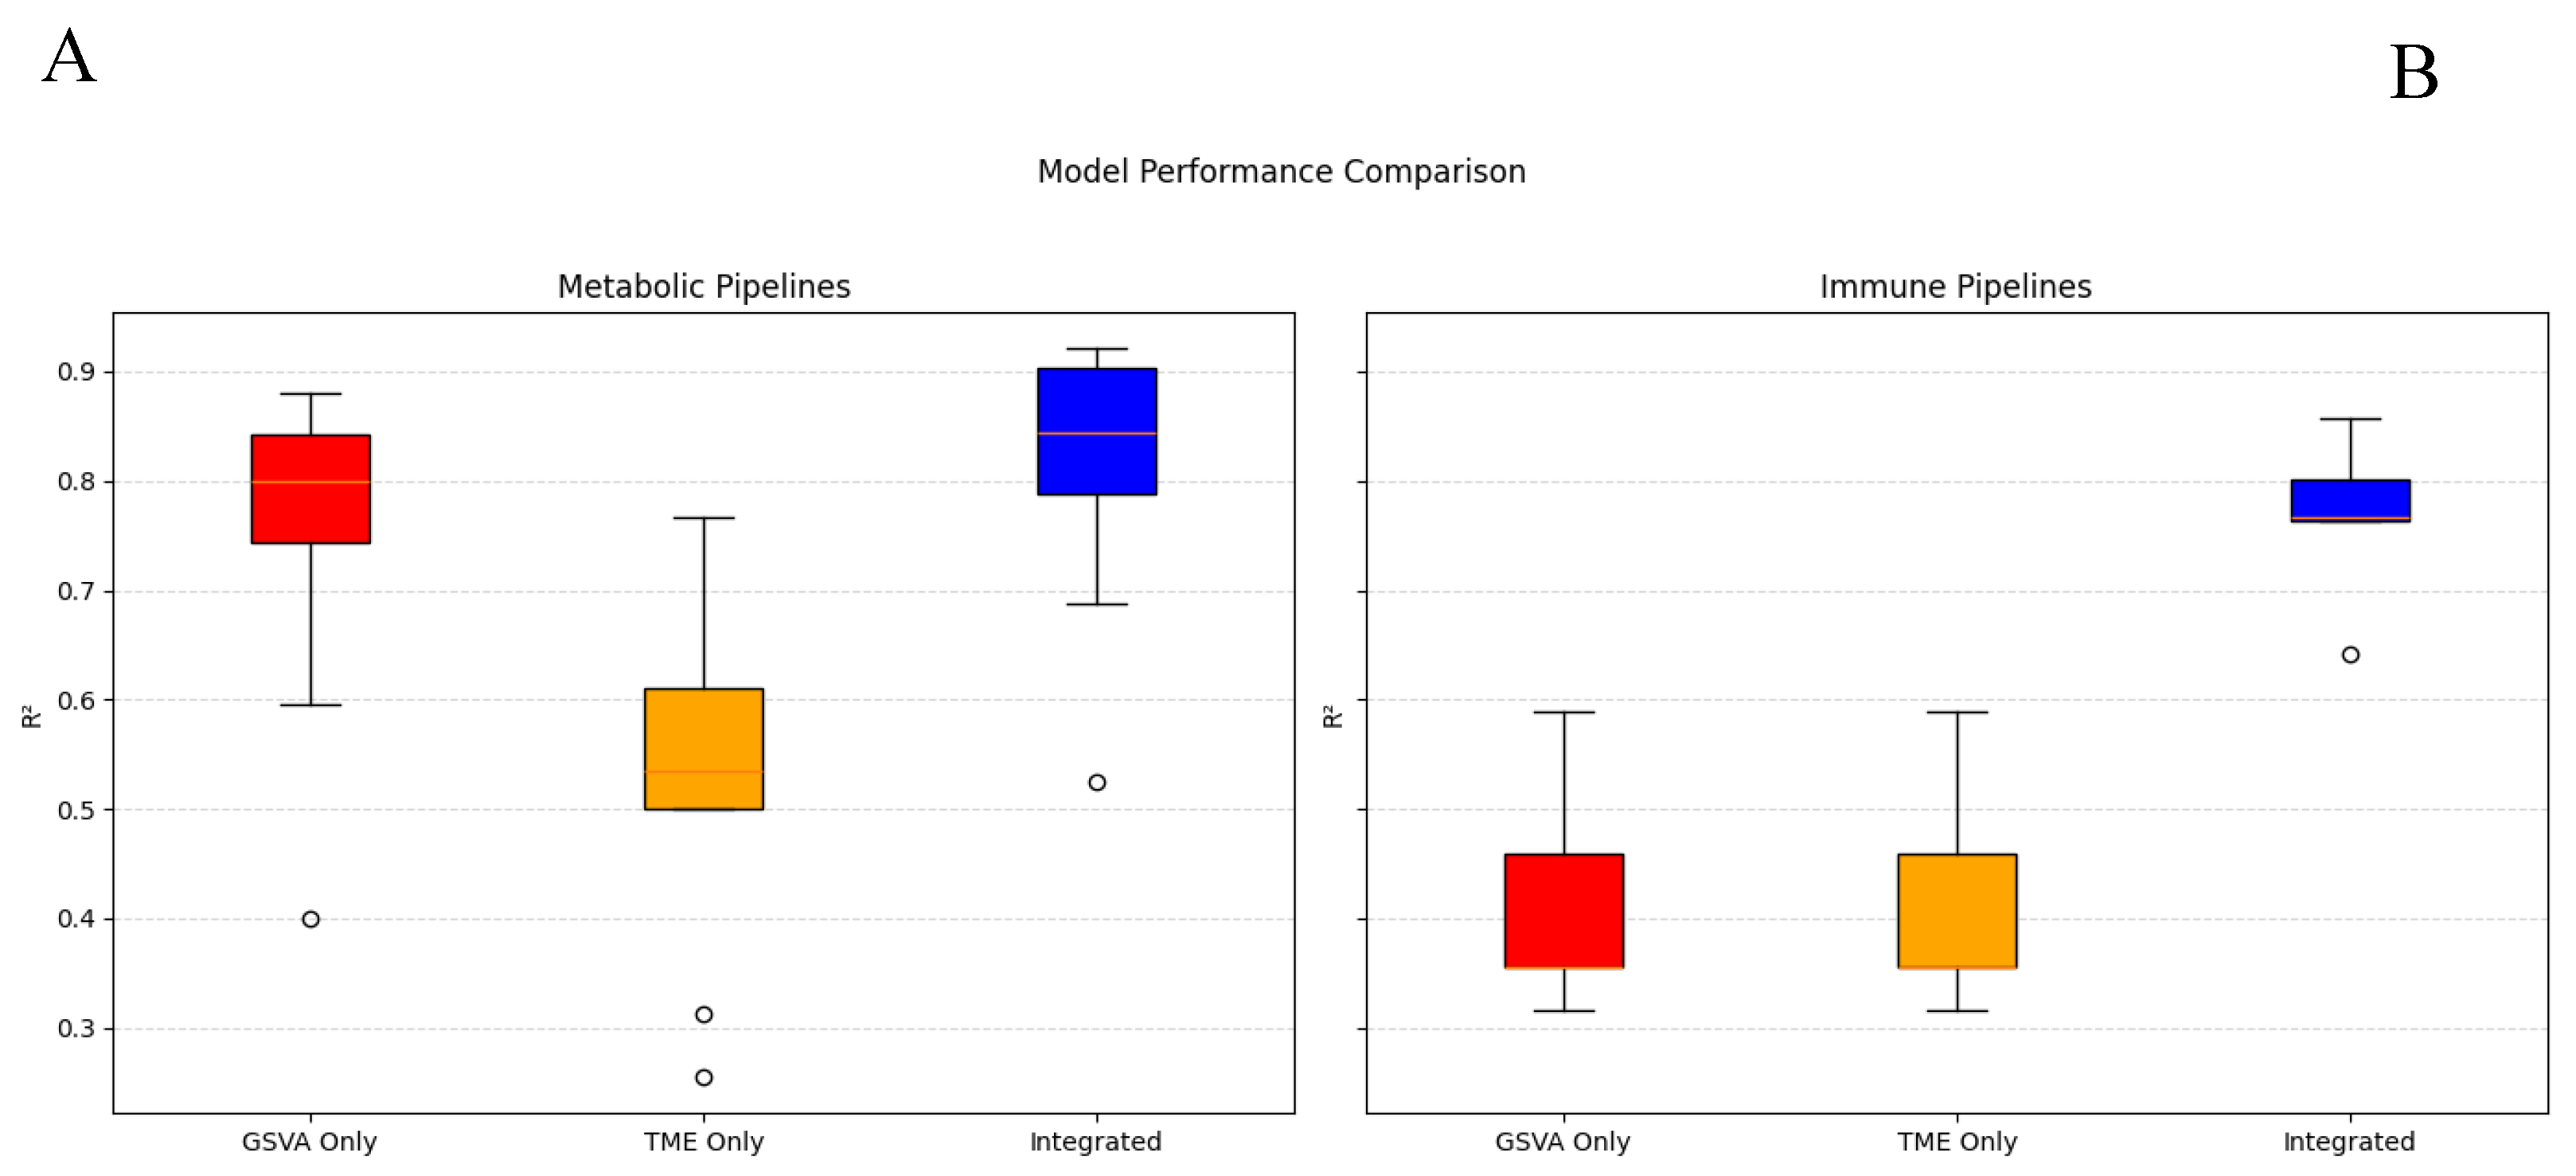
3.4. Integration of GSVA and TME features
Model performance was compared across GSVA-only, TME-only, and Integrated predictor sets using the identical pipeline. In
Figure 4, each panel (A) metabolic, (B) immune displays three box-and-whisker plots summarizing the distribution of test R² values for the corresponding configuration; model identities are not shown. For metabolic targets, the Integrated configuration shows a modest upward shift in median and upper quartile relative to GSVA-only and clearly exceeds TME-only. For immune targets, the Integrated configuration shows a marked upward shift compared with either single-source configuration, while the GSVA-only and TME-only distributions remain lower. These results indicate that combining GSVA and TME features yields higher predictive accuracy than using either feature set alone.
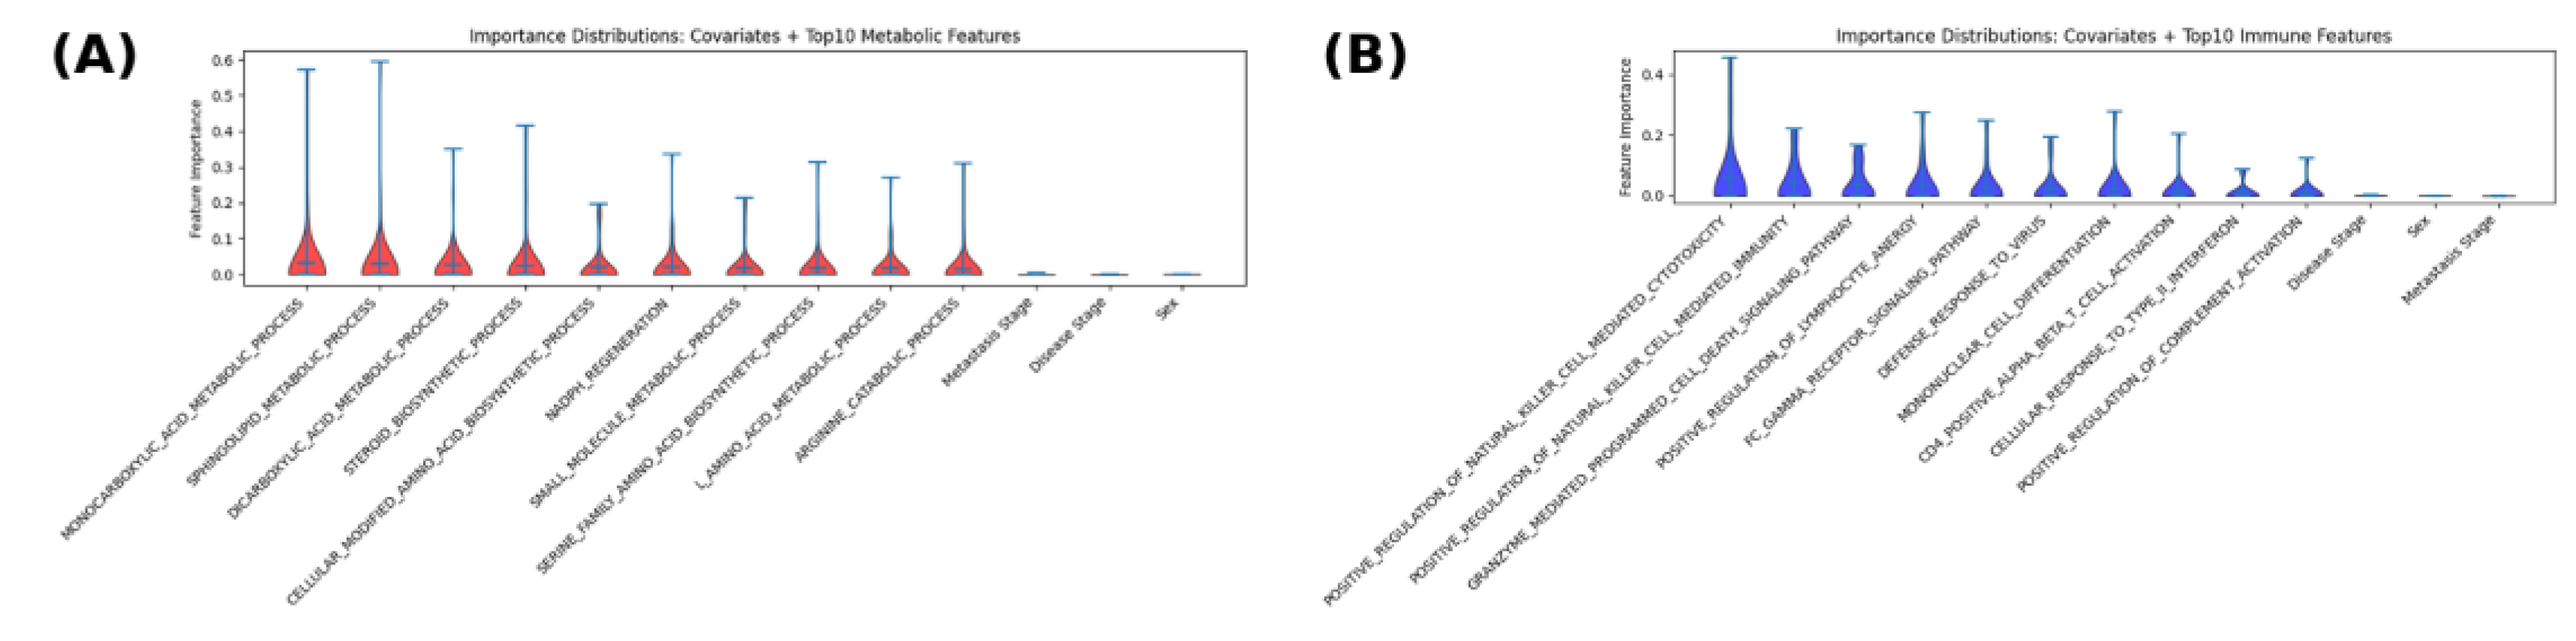
3.5. Feature Importance and Permutation Testing
Feature contributions were assessed by permutation importance (as described in Methods 2.5), with higher scores indicating larger performance loss when a feature was perturbed. In
Figure 5, metabolic features (
Figure 5A) are shown in red and immune features (
Figure 5B) in blue; clinical covariates appear at the right of each panel. Among metabolic terms, broad small-molecule and lipid programs dominated. Monocarboxylic-acid metabolic process and sphingolipid metabolic process exhibited the highest median importances with wide upper tails, followed by dicarboxylic-acid metabolic process, steroid biosynthetic process, and cellular modified amino-acid biosynthetic process. Redox and amino-acid–linked terms-including NADPH regeneration, L-amino-acid metabolic process, serine-family amino-acid biosynthetic process, and arginine catabolic process- showed consistent but slightly lower medians. Clinical covariates ranked near the bottom.
As for immune feature patterns, the largest and most consistent importances were observed for processes linked to cytotoxic and antiviral immunity, including positive regulation of natural killer (NK) cell–mediated cytotoxicity, positive regulation of NK cell–mediated immunity, and granzyme-mediated programmed cell death. Pathways reflecting antigen-clearance and inflammatory signaling, including Fc-gamma receptor signaling, defense response to virus, cellular response to type I interferon, and positive regulation of complement activation, also showed elevated median importances. T-cell context features such as CD4⁺ αβ T-cell activation and mononuclear cell differentiation contributed at intermediate levels. Clinical covariates (stage, sex, metastasis) displayed low median importances relative to immune pathway features.
Together, these patterns indicate that predictive signal for metabolic targets relied most on lipid handling and core small-molecule/amino-acid metabolism, whereas for immune targets it was concentrated in NK/cytotoxic and interferon/antiviral programs, with clinical covariates contributing minimally. These feature-level patterns were concordant with gene–pathway correlations (in 3.6; e.g., lipid and small-molecule metabolism for metabolic targets; cytotoxic/interferon programs for immune targets), while exact one-to-one correspondence was not expected due to aggregation and multicollinearity.
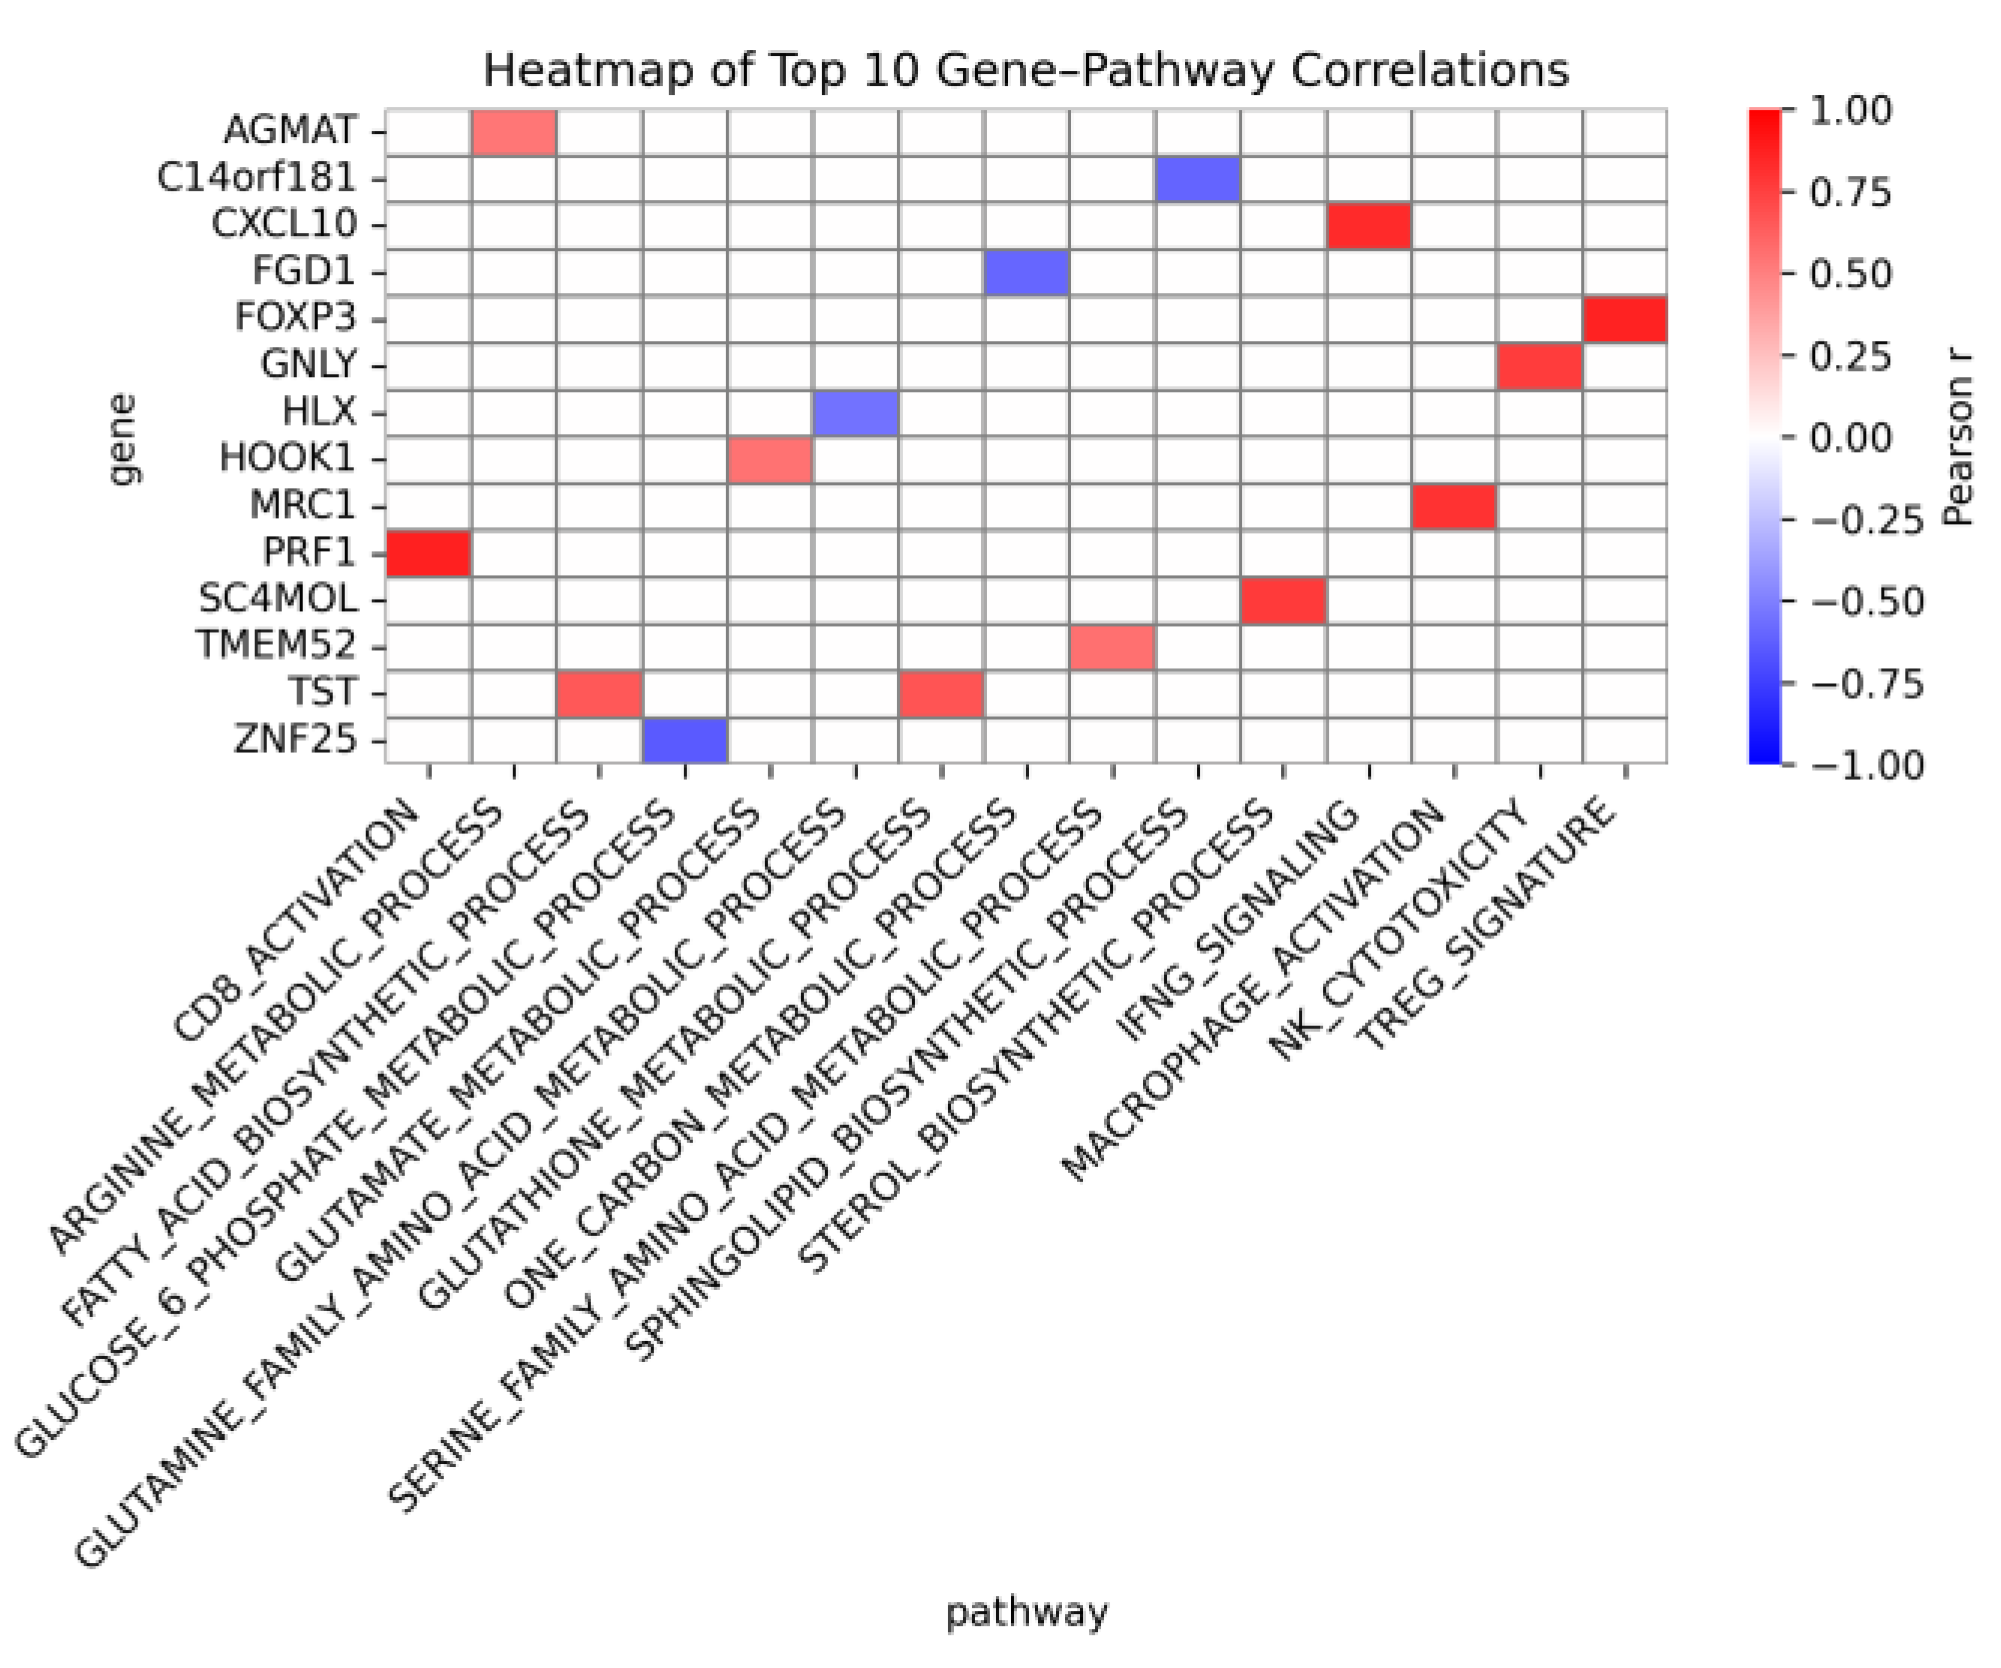
3.6. Gene-Level Correlations
Gene–pathway associations were summarized using Pearson correlations between gene expression and pathway GSVA scores (top 10 by |r| per pathway), with the heatmap shown in
Figure 6 (red = positive; blue = negative). Among metabolic pathways, the strongest association was observed for SC4MOL with the sterol biosynthetic process. TST then showed equally strong positive correlations with both the fatty-acid biosynthetic process and the glutathione metabolic process. Additional positive correlations were observed for AGMAT with the arginine metabolic process, HOOK1 with the glutamate metabolic process, and TMEM52 with the serine-family amino-acid metabolic process. Negative correlations included a strong association of ZNF25 with the glucose-6-phosphate metabolic process, as well as C14orf181 with the sphingolipid biosynthetic process, FGD1 with the one-carbon metabolic process, and HLX with the glutamine-family amino-acid metabolic process.
For immune pathways, pathway-concordant patterns were reproduced, and all correlations were positive: PRF1 with the CD8-activation signature, CXCL10 with IFNG signaling, MRC1 (CD206) with macrophage activation, GNLY with NK cytotoxicity, and FOXP3 with the Treg signature. These gene-level results were consistent with the feature-importance themes reported above and provided mechanistic anchors for the pathway readouts.
4. Discussion
A pathway-centered analysis of bulk tumor transcriptomes and immune-composition profiles was conducted to clarify which PDAC pathways are recoverable from routine data and how those signals can be anchored for interpretation. Three conclusions were supported. First, the ten preselected metabolic pathways were predicted accurately from expression in the primary cohort, most often by a sparse linear model, and this relative advantage over immune-pathway prediction was reproduced in external validation (
Figure 3). Second, the five immune pathways showed mixed difficulty, with improvements observed when immune-composition features were integrated with expression, indicating that context from the tumor microenvironment added information beyond expression alone (
Figure 4). Third, the cohort displayed diverse immune composition without cohort-level shifts by stage or sex (
Figure 2), reducing concern that broad composition differences explain the modeling contrasts between metabolic and immune targets.
Feature-importance profiles and permutation-based robustness checks supported these findings (
Figure 5). The gene-level analysis provided concrete anchors that connected model behavior to recognizable biology (
Figure 6). In particular, TST emerged as a cross-pathway signal linking fatty-acid biosynthesis and glutathione metabolism, consistent with coupling between lipid anabolism and antioxidant capacity in PDAC. This observation aligns with prior work indicating that survival under nutrient and redox stress is supported by metabolic programs with antioxidant components; such context helps interpret why redox-linked nodes may track with lipid-anabolic demands in tumors.
Limitations and future direction: Bulk RNA-seq infers pathway activity indirectly and does not measure flux or resolve cell-type–specific effects. Single-cell or spatial assays, together with metabolomic and flux measurements, would be expected to refine immune-pathway models and clarify mechanism. These constraints do not alter the central observations that metabolic pathway activities were recovered with high accuracy from bulk expression, that immune pathway activities were more context dependent, and that integration with immune-composition information improved immune-pathway prediction.
5. Conclusions
A compact, pathway-level map of PDAC was produced in which (i) metabolic pathways were predicted accurately and reproducibly across cohorts, (ii) immune pathways showed variable but informative performance that improved with immune-composition context, and (iii) feature-importance, permutation testing, and external validation supported robustness. Gene-level anchors-including TST as a top signal shared by fatty-acid biosynthesis and glutathione metabolism-provide concrete entry points for follow-up studies and potential translational use.
Supplementary Materials
The following supporting information can be downloaded at the website of this paper posted on Preprints.org.
Author Contributions
Conceptualization, S.F. and D.E.; methodology, S.F.; software, S.F.; validation, S.F. and D.E.; formal analysis, S.F.; investigation, S.F.; resources, S.F.; data curation, S.F.; writing—original draft preparation, S.F.; writing—review and editing, S.F.; visualization, S.F.; supervision, D.E.; project administration, S.F.; funding acquisition, S.F. All authors have read and agreed to the published version of the manuscript.
Funding
This research received no external funding.
Institutional Review Board Statement
Not applicable.
Informed Consent Statement
Not applicable.
Data Availability Statement
All data supporting the reported results are openly available. Processed expression matrices, analysis outputs, Supplementary Text S1, Supplementary
Figures S1–S5, and per-figure TSV source files have been deposited at Zenodo (version DOI:
https://doi.org/10.5281/zenodo.17167790; concept DOI:
10.5281/zenodo.17128333). Primary RNA-seq data were obtained from public repositories: AACR Project GENIE (processed counts as described in Methods) and GEO accession
GSE71729; both were reprocessed through the pipeline detailed in Methods. No new human sequencing data were generated.
Acknowledgments
I would like to thank Prof. Dr. Jordan Winter and The Winter Lab for support and guidance.
Conflicts of Interest
The authors declare no conflicts of interest.
References
- Rahib, L.; Smith, B.D.; Aizenberg, R.; Rosenzweig, A.B.; Fleshman, J.M.; Matrisian, L.M. Projecting cancer incidence and deaths to 2030: The unexpected burden of thyroid, liver, and pancreas cancers in the United States. Cancer Research 2014, 74, 2913–2921. [Google Scholar] [CrossRef]
- Siegel, R.L.; Miller, K.D.; Fuchs, H.E.; Jemal, A. Cancer statistics, 2024. CA: A Cancer Journal for Clinicians 2024, 74, 7–33. [Google Scholar] [CrossRef]
- Locker, G.Y.; Hamilton, S.; Harris, J.; Jessup, J.M.; Kemeny, N.; Macdonald, J.S.; Schilsky, R.L. ASCO 2022 update of recommendations for the use of tumor markers in gastrointestinal cancer. Journal of Clinical Oncology 2022, 40, 425–445. [Google Scholar]
- Halbrook, C.J.; Lyssiotis, C.A. Employing metabolism to improve the diagnosis and treatment of pancreatic cancer. Cancer Cell 2017, 31, 5–19. [Google Scholar] [CrossRef]
- Li, X.; Dai, D.; Chen, B.; Tang, H.; Xie, X.; Wei, W.; Li, Z. Circulating exosomal microRNAs as diagnostic and prognostic biomarkers for pancreatic cancer. Cancer Science 2023, 114, 543–555. [Google Scholar]
- Melo, S.A.; Luecke, L.B.; Kahlert, C.; Fernández, A.F.; Gammon, S.T.; Kaye, J.; Kalluri, R. Glypican-1 identifies cancer exosomes and detects early pancreatic cancer. Nature 2015, 523, 177–182. [Google Scholar] [CrossRef]
- Son, J.; Lyssiotis, C.A.; Ying, H.; Wang, X.; Hua, S.; Ligorio, M.; Kimmelman, A.C. Glutamine supports pancreatic cancer growth through a KRAS-regulated metabolic pathway. Nature 2013, 496, 101–105. [Google Scholar] [CrossRef]
- Winter, J.M.; Henderson, J.M.; Roche, M.; Gao, H.; Alazinas, C.; Marino, E.; Fendler, W. Metabolic reprogramming in pancreatic cancer: Therapeutic opportunities and clinical challenges. Cancer Metabolism 2022, 10, 12–25. [Google Scholar]
- Feig, C.; Gopinathan, A.; Neesse, A.; Chan, D.S.; Cook, N.; Tuveson, D.A. The pancreas cancer microenvironment. Clinical Cancer Research 2013, 18, 4266–4276. [Google Scholar] [CrossRef] [PubMed]
- Özdemir, B.C.; Pentcheva-Hoang, T.; Carstens, J.L.; Zheng, X.; Wu, C.C.; Simpson, T.R.; DeNardo, D.G. Depletion of carcinoma-associated fibroblasts and fibrosis induces immunosuppression and accelerates pancreas cancer with reduced survival. Cancer Cell 2014, 25, 719–734. [Google Scholar] [CrossRef]
- Pothula, S.P.; Xu, Z.; Goldstein, D.; Pirola, R.C. The role of the tumor microenvironment in pancreatic ductal adenocarcinoma. Cancers 2021, 13, 1398. [Google Scholar]
- Elyada, E.; Bolisetty, M.; Laise, P.; Flynn, W.F.; Courtois, E.T.; Burkhart, R.A.; Tuveson, D.A. Cross-species single-cell analysis of pancreatic ductal adenocarcinoma reveals antigen-presenting cancer-associated fibroblasts. Cancer Discovery 2019, 9, 1102–1123. [Google Scholar] [CrossRef]
- Becht, E.; Giraldo, N.A.; Lacroix, L.; Buttard, B.; Elarouci, N.; Petitprez, F.; de Reyniès, A. Estimating the population abundance of tissue-infiltrating immune and stromal cell populations using gene expression. Genome Biology 2016, 17, 218. [Google Scholar]
- Newman, A.M.; Steen, C.B.; Liu, C.L.; Gentles, A.J.; Chaudhuri, A.A.; Scherer, F.; Alizadeh, A.A. Determining cell type abundance and expression from bulk tissues with digital cytometry. Nature Biotechnology 2019, 37, 773–782. [Google Scholar] [CrossRef] [PubMed]
- Hänzelmann, S.; Castelo, R.; Guinney, J. GSVA: Gene set variation analysis for microarray and RNA-Seq data. BMC Bioinformatics 2013, 14, 7. [Google Scholar] [CrossRef]
- Newman, A.M.; Liu, C.L.; Green, M.R.; Gentles, A.J.; Feng, W.; Xu, Y.; Alizadeh, A.A. Robust enumeration of cell subsets from tissue expression profiles. Nature Methods 2015, 12, 453–457. [Google Scholar] [CrossRef]
- Biancur, D.E.; Paulo, J.A.; Malachowska, B.; Quiles del Rey, M.; Sousa, C.M.; Wang, X.; Kimmelman, A.C. Compensatory metabolic networks in pancreatic cancers upon perturbation of glutamine metabolism. Nature Communications 2017, 8, 15965. [Google Scholar] [CrossRef]
- Commisso, C.; Davidson, S.M.; Soydaner-Azeloglu, R.G.; Parker, S.J.; Kamphorst, J.J.; Hackett, S.; Bar-Sagi, D. Macropinocytosis of protein is an amino acid supply route in Ras-transformed cells. Nature 2013, 497, 633–637. [Google Scholar] [CrossRef]
- AACR Project GENIE Consortium. AACR Project GENIE: Powering precision medicine through an international consortium. Cancer Discovery 2017, 7, 818–831. [CrossRef] [PubMed]
- Li, B.; Dewey, C.N. RSEM: Accurate transcript quantification from RNA-Seq data with or without a reference genome. BMC Bioinformatics 2011, 12, 323. [Google Scholar] [CrossRef] [PubMed]
- Moffitt, R.A.; Marayati, R.; Flate, E.L.; Volmar, K.E.; Loeza, S.G.H.; Hoadley, K.A.; Yeh, J.J. Virtual microdissection identifies distinct tumor and stromal subtypes in pancreatic ductal adenocarcinoma. Nature Genetics 2015, 47, 1168–1178. [Google Scholar] [CrossRef]
- Love, M.I.; Huber, W.; Anders, S. Moderated estimation of fold change and dispersion for RNA-Seq data with DESeq2. Genome Biology 2014, 15, 550. [Google Scholar] [CrossRef]
- Leek, J.T.; Johnson, W.E.; Parker, H.S.; Jaffe, A.E.; Storey, J.D. The sva package for removing batch effects and other unwanted variation in high-throughput experiments. Bioinformatics 2012, 28, 882–883. [Google Scholar] [CrossRef]
- Johnson, W.E.; Li, C.; Rabinovic, A. Adjusting batch effects in microarray expression data using empirical Bayes methods. Biostatistics 2007, 8, 118–127. [Google Scholar] [CrossRef]
- Benjamini, Y.; Hochberg, Y. Controlling the false discovery rate: A practical and powerful approach to multiple testing. Journal of the Royal Statistical Society. Series B: Methodological 1995, 57, 289–300. [Google Scholar] [CrossRef]
- Kruskal, W.H.; Wallis, W.A. Use of ranks in one-criterion variance analysis. Journal of the American Statistical Association 1952, 47, 583–621. [Google Scholar] [CrossRef]
- Mann, H.B.; Whitney, D.R. On a test of whether one of two random variables is stochastically larger than the other. Annals of Mathematical Statistics 1947, 18, 50–60. [Google Scholar] [CrossRef]
- Ashburner, M.; Ball, C.A.; Blake, J.A.; Botstein, D.; Butler, H.; Cherry, J.M.; Sherlock, G. Gene ontology: Tool for the unification of biology. Nature Genetics 2000, 25, 25–29. [Google Scholar] [CrossRef] [PubMed]
- Kanehisa, M.; Goto, S. KEGG: Kyoto encyclopedia of genes and genomes. Nucleic Acids Research 2000, 28, 27–30. [Google Scholar] [CrossRef]
- Jassal, B.; Matthews, L.; Viteri, G.; Gong, C.; Lorente, P.; Fabregat, A.; D’Eustachio, P. The Reactome pathway knowledgebase. Nucleic Acids Research 2020, 48, D498–D503. [Google Scholar] [CrossRef]
- Liberzon, A.; Subramanian, A.; Pinchback, R.; Thorvaldsdóttir, H.; Tamayo, P.; Mesirov, J.P. The Molecular Signatures Database Hallmark gene set collection. Cell Systems 2015, 1, 417–425. [Google Scholar] [CrossRef]
- Rodríguez, P.C.; Quiceno, D.G.; Ochoa, A.C. Arginase I in cancer: Substrate depletion and immune suppression. Nature Reviews Immunology 2007, 7, 585–598. [Google Scholar]
- Li, J.; Condello, S.; Thomes-Pepin, J.; et al. Proteomic analysis identifies FASN and mevalonate pathway dependencies in pancreatic cancer stem-like cells. Cell Stem Cell 2017, 20, 428–443. [Google Scholar]
- Ying, H.; Kimmelman, A.C.; Lyssiotis, C.A.; et al. Oncogenic KRAS maintains pancreatic tumors through regulation of anabolic glucose metabolism. Cell 2012, 149, 656–670. [Google Scholar] [CrossRef] [PubMed]
- Vasseur, S.; Guillaumond, F.; et al. The antioxidant pathway in pancreatic cancer. Pancreatology 2019, 19, 762–771. [Google Scholar]
- Maddocks, O.D.K.; Berkers, C.R.; Mason, S.M.; et al. Serine starvation impairs one-carbon metabolism and nucleotide synthesis in cancer cells. Nature 2013, 497, 542–546. [Google Scholar] [CrossRef] [PubMed]
- Possemato, R.; Marks, K.M.; Shaul, Y.D.; et al. Functional genomics reveal that the serine synthesis pathway is essential in cancer. Nature 2011, 476, 346–350. [Google Scholar] [CrossRef] [PubMed]
- Ogretmen, B. Sphingolipid metabolism in cancer signalling and therapy. Nature Reviews Cancer 2018, 18, 33–50. [Google Scholar] [CrossRef]
- Karasinska, J.M.; Topham, J.T.; Kalloger, S.E.; et al. Altered gene expression of glycolysis and cholesterol synthesis is associated with poor survival in pancreatic cancer. Clinical Cancer Research 2020, 26, 135–146. [Google Scholar] [CrossRef]
- Pedregosa, F.; Varoquaux, G.; Gramfort, A.; Michel, V.; Thirion, B.; Grisel, O.; Duchesnay, É. Scikit-learn: Machine learning in Python. Journal of Machine Learning Research 2011, 12, 2825–2830. [Google Scholar]
- Chen, T.; Guestrin, C. XGBoost: A scalable tree boosting system. Proceedings of the 22nd ACM SIGKDD International Conference on Knowledge Discovery and Data Mining 2016, 785–794. [Google Scholar]
- Altmann, A.; Toloși, L.; Sander, O.; Lengauer, T. Permutation importance: A corrected feature importance measure. Bioinformatics 2010, 26, 1340–1347. [Google Scholar] [CrossRef] [PubMed]
|
Disclaimer/Publisher’s Note: The statements, opinions and data contained in all publications are solely those of the individual author(s) and contributor(s) and not of MDPI and/or the editor(s). MDPI and/or the editor(s) disclaim responsibility for any injury to people or property resulting from any ideas, methods, instructions or products referred to in the content. |
© 2025 by the authors. Licensee MDPI, Basel, Switzerland. This article is an open access article distributed under the terms and conditions of the Creative Commons Attribution (CC BY) license (http://creativecommons.org/licenses/by/4.0/).