Submitted:
26 September 2025
Posted:
26 September 2025
You are already at the latest version
Abstract
This study utilizes a novel municipal-level panel dataset covering Japan from 2012 to 2023 to assess the causal effects of renewable energy investment on local economic growth and employment. Following the 2011 Fukushima nuclear accident, Japan implemented the Feed-in Tariff (FIT) system, triggering unprecedented growth in renewable energy investment. However, the net effects of these investments on local economies remain controversial. To address endogeneity issues in investment decisions, this study employs an exogenous natural resource endowment (solar radiation and wind speed) as an instrumental variable. The findings reveal that renewable energy investments significantly boost per capita GDP and employment rates at the municipality level. These effects exhibit substantial heterogeneity: distributed rooftop solar installations yield different economic impacts compared to centralized large-scale photovoltaic plants. Furthermore, projects developed through community-led initiatives or novel business models like corporate power purchase agreements (PPAs) generate divergent local economic spillover effects. Furthermore, spatial econometric analysis identifies significant positive spatial spillover effects, indicating that renewable energy development in one municipality can stimulate economic activity in neighboring areas. The findings suggest that well-designed renewable energy policies serve not only as a key tool for achieving national decarbonization goals but also as an effective lever for promoting coordinated regional development and realizing a "just transition".
Keywords:
renewable energy investment
; local economic growth
; spatial spillover effects
; Japan
1. Introduction: Japan's Energy Transition and Local Economies
1.1. Policy Demands in the Post-Fukushima Era
The 2011 Great East Japan Earthquake and the subsequent Fukushima Daiichi nuclear accident marked a watershed moment in Japan's modern history, fundamentally reshaping the trajectory of its national energy policy 1. The abrupt halt in nuclear power generation created a massive electricity gap, confronting Japan with severe energy security challenges while simultaneously creating a political window for fundamental transformation of its energy system (2). Against this backdrop, accelerating renewable energy development became not merely an environmental choice but a strategic imperative for safeguarding national energy supply and ensuring socioeconomic stability. The Japanese government swiftly acted to fill the energy gap and fulfill its international climate commitments through large-scale deployment of clean energy sources like solar and wind power.
1.2. Core Controversy: Local Blessing or Burden?
The core policy tool driving the government's renewable energy push is the 2012 Renewable Energy Special Measures Act and its central Feed-in Tariff (FIT) system. By offering long-term, attractive electricity price guarantees, this system significantly incentivized private sector investment. However, the actual economic impact of these large-scale investments on local communities quickly became a contentious issue.
On one hand, proponents argue that renewable energy projects serve as powerful engines for revitalizing local economies, particularly in rural areas grappling with persistent population decline and aging demographics. These projects are expected to create construction and operations/maintenance jobs, boost local tax revenues, and provide new income streams for landowners, injecting fresh vitality into the economy
3
.
On the other hand, criticism and concerns are equally significant. First, the costs of the FIT system are ultimately passed on to electricity consumers nationwide through surcharges on electricity bills, sparking debates about the economic burden this places on households and energy-intensive industries. Second, the generous subsidies offered during the early stages of the FIT led to a so-called "solar rush," triggering social and environmental conflicts related to land use in some areas, such as landscape destruction and competition with agriculture for land
5
. Furthermore, when projects are dominated by large external corporations, widespread skepticism surrounds whether economic benefits
—
such as profits and most high-skilled jobs
—
truly remain locally
6
. This "enclave economy" model risks undermining renewable energy's potential as a tool for local development.
This study aims to provide quantitative evidence for this debate through rigorous empirical analysis. It moves beyond simple cost-benefit calculations to delve into a core issue of the global energy transition: the "Just Transition." At its heart lies the question of whether the decarbonization of energy systems can create shared prosperity, particularly in regions that are economically disadvantaged yet rich in natural resources. Japan's renewable energy resources, such as solar and wind power, are concentrated precisely in these rural and economically underdeveloped areas
7
. Consequently, renewable energy investment inherently constitutes a potential, large-scale fiscal and economic transfer from urban consumers to rural areas. By measuring the actual impacts on GDP and employment at the granular municipal level, this study directly quantifies the extent to which this potential is realized, providing a critical Japanese case study for international discussions on Just Transition.
1.3. Contribution to the Literature
The international literature on the relationship between energy consumption and economic growth is already substantial
8
. However, studies on Japan have largely been confined to national-level time-series analyses
12
, case studies of specific projects (e.g., offshore wind power in Akita Prefecture)
3
, or qualitative discussions of community energy projects
6
. Currently, there is a significant gap in the academic literature for systematic, causal-inference quantitative research on the economic impacts of renewable energy investments at fine geographic scales (i.e., municipality level) that capture local heterogeneity. This study aims to fill this critical knowledge gap by constructing a long-term panel dataset covering approximately 1,700 municipalities across Japan and employing robust econometric methods to separate causal relationships.
1.4. Research Hypotheses and Article Structure
This study tests the following three core hypotheses:
H1:
Renewable energy investment positively promotes municipal GDP per capita.
H2:
Renewable energy investment increases local employment, particularly during the project construction phase.
H3:
Renewable energy investment generates positive spillover effects on non-energy-related industries (e.g., construction, services).
Additionally, this study innovatively extends the analysis to examine heterogeneous impacts across different technology types (centralized vs. distributed) and business models (corporate PPAs vs. community ownership), while quantifying spatial spillover effects across municipalities.
The paper is structured as follows: Section II reviews the relevant institutional context and literature. Section III details data construction, variable definitions, and the econometric model. Section IV reports the overall impact of renewable energy investment on local economic growth and employment. Section V delves into heterogeneous effects and causal mechanisms. Section VI analyzes spatial spillover effects. Section VII conducts robustness tests and discusses potential negative externalities. Section VIII summarizes findings and offers policy recommendations.
2. Institutional Context and Literature Review
2.1. In-Depth Policy Analysis: The Feed-in Tariff (FIT) System and Its Evolution
2.1.1. Core Mechanisms of the 2012 FIT Act
The core policy instrument analyzed in this study is the Renewable Energy Special Measures Act, which took effect in July 2012, and its Feed-in Tariff (FIT) system
1
. The core mechanism of this system is the government's mandatory requirement for power companies to purchase all eligible renewable energy generation at a fixed rate above market prices over a specified long-term period (e.g., 20 years for solar). This policy design provides investors with a stable and predictable revenue stream, significantly reducing investment risk. Consequently, it has successfully leveraged large-scale private capital into the renewable energy sector, particularly the solar photovoltaic industry.
2.1.2. Unintended Consequences of the Policy
While the FIT system achieved remarkable success in rapidly expanding renewable energy capacity, its design also produced several unintended consequences. First, the initially set feed-in rates were exceptionally generous, far exceeding prevailing generation costs at the time. This triggered the aforementioned "solar gold rush" (
5)
. Second, a critical institutional detail was that feed-in rates were locked in upon project approval by the Ministry of Economy, Trade and Industry (METI), rather than at the time of grid connection (
14)
. Concurrently, photovoltaic module costs were undergoing a phase of rapid decline. The combination of these factors created an "arbitrage" opportunity for developers: apply early to lock in a high feed-in tariff, then deliberately delay actual project construction to wait for further equipment cost reductions, maximizing profit margins
14
. This phenomenon, termed "non-operating solar projects," led to a massive backlog of projects, creating a significant gap between approved capacity and actual grid-connected capacity.
From an economic impact perspective, this implies a significant time lag between policy implementation and actual economic activity (e.g., local employment, construction material procurement). A simple simultaneous correlation analysis may consequently underestimate or misrepresent the true economic effects of investment. Therefore, our econometric model must account for the lagged structure of investment variables to more accurately capture the dynamic process of economic impacts generated from project approval to actual construction and operation.
2.1.3. Policy Evolution: From FIT to FIP
To address the aforementioned issues and the growing burden of national electricity surcharges, the Japanese government has revised the FIT system multiple times. Notably, the 2017 FIT Act amendment aimed to resolve project backlogs by imposing stricter requirements on projects failing to commence construction on schedule
14
. A more significant shift occurred with Japan's recent introduction of the Feed-in Premium (FIP) system. Under FIP, power generators sell electricity to the wholesale market, with the government providing an additional subsidy (premium) on top of the market price. Unlike FIT's fixed price, FIP seeks to incentivize renewable energy generators to better respond to market signals and integrate with the electricity market. This policy evolution offers new analytical dimensions for future research.
2.2. International Evidence on Local Economic Impacts
2.2.1. Energy-Growth Relationship
This study is grounded in a well-established field within energy economics: research on the relationship between energy and economic growth. Extensive cross-country panel data studies, such as the pioneering work by Apergis & Payne (2010), reveal a bidirectional long-term causal relationship between renewable energy consumption and economic growth in OECD countries. This implies that renewable energy is both an outcome and a driver of economic growth. These macro-level studies provide the theoretical foundation for this research, suggesting that energy transition can become an integral component of economic development.
2.2.2. Local Economic Multiplier Effects
Closer to the present study are micro-level investigations examining the local economic impacts of renewable energy projects. Numerous studies from the United States and Europe have estimated the economic and employment multipliers of wind farms and solar power stations at the local level. These studies typically find that the construction phase generates significant short-term employment growth, while the operation and maintenance phase provides stable long-term jobs. These findings offer an important reference benchmark for our anticipated research outcomes.
2.3. Research Gaps in Japan
Currently, research on the economic impacts of renewable energy in Japan exhibits a pronounced dichotomy. At one end are macro-level national analyses, such as studies using time-series data to examine the relationship between clean energy investment and GDP
12
. At the other end are specific case studies, such as in-depth analyses of the socioeconomic benefits of offshore wind development in Akita Prefecture
3
or qualitative descriptions of community energy projects in specific localities
6
.
While both approaches hold significant value, a substantial gap exists: the absence of a systematic, nationwide quantitative causal analysis conducted at a granular geographic level. National-level analyses fail to reveal substantial regional disparities, while conclusions from case studies are difficult to generalize nationwide. Therefore, by constructing a nationwide panel dataset at the municipality level and employing econometric methods to identify causal effects, this study aims to fill this gap, providing more reliable evidence for Japan's energy and regional development policies.
3. Data Construction and Empirical Strategy
3.1. Construction of the Municipal Panel Dataset (2012 – 2023)
A core contribution of this study is the construction of a unique, comprehensive panel dataset at the municipality level. The data compilation and matching process forms the methodological foundation of this research, integrating publicly available data from various government ministries and agencies.
Renewable Energy Investment Data:
The core independent variable data originates from the "Feed-in Tariff (FIT) Information Disclosure Portal" (FIT Portal)
(15) operated
by the Agency for Natural Resources and Energy under Japan's Ministry of Economy, Trade and Industry (METI). We downloaded detailed municipal-level lists of all FIT-approved projects (
20)
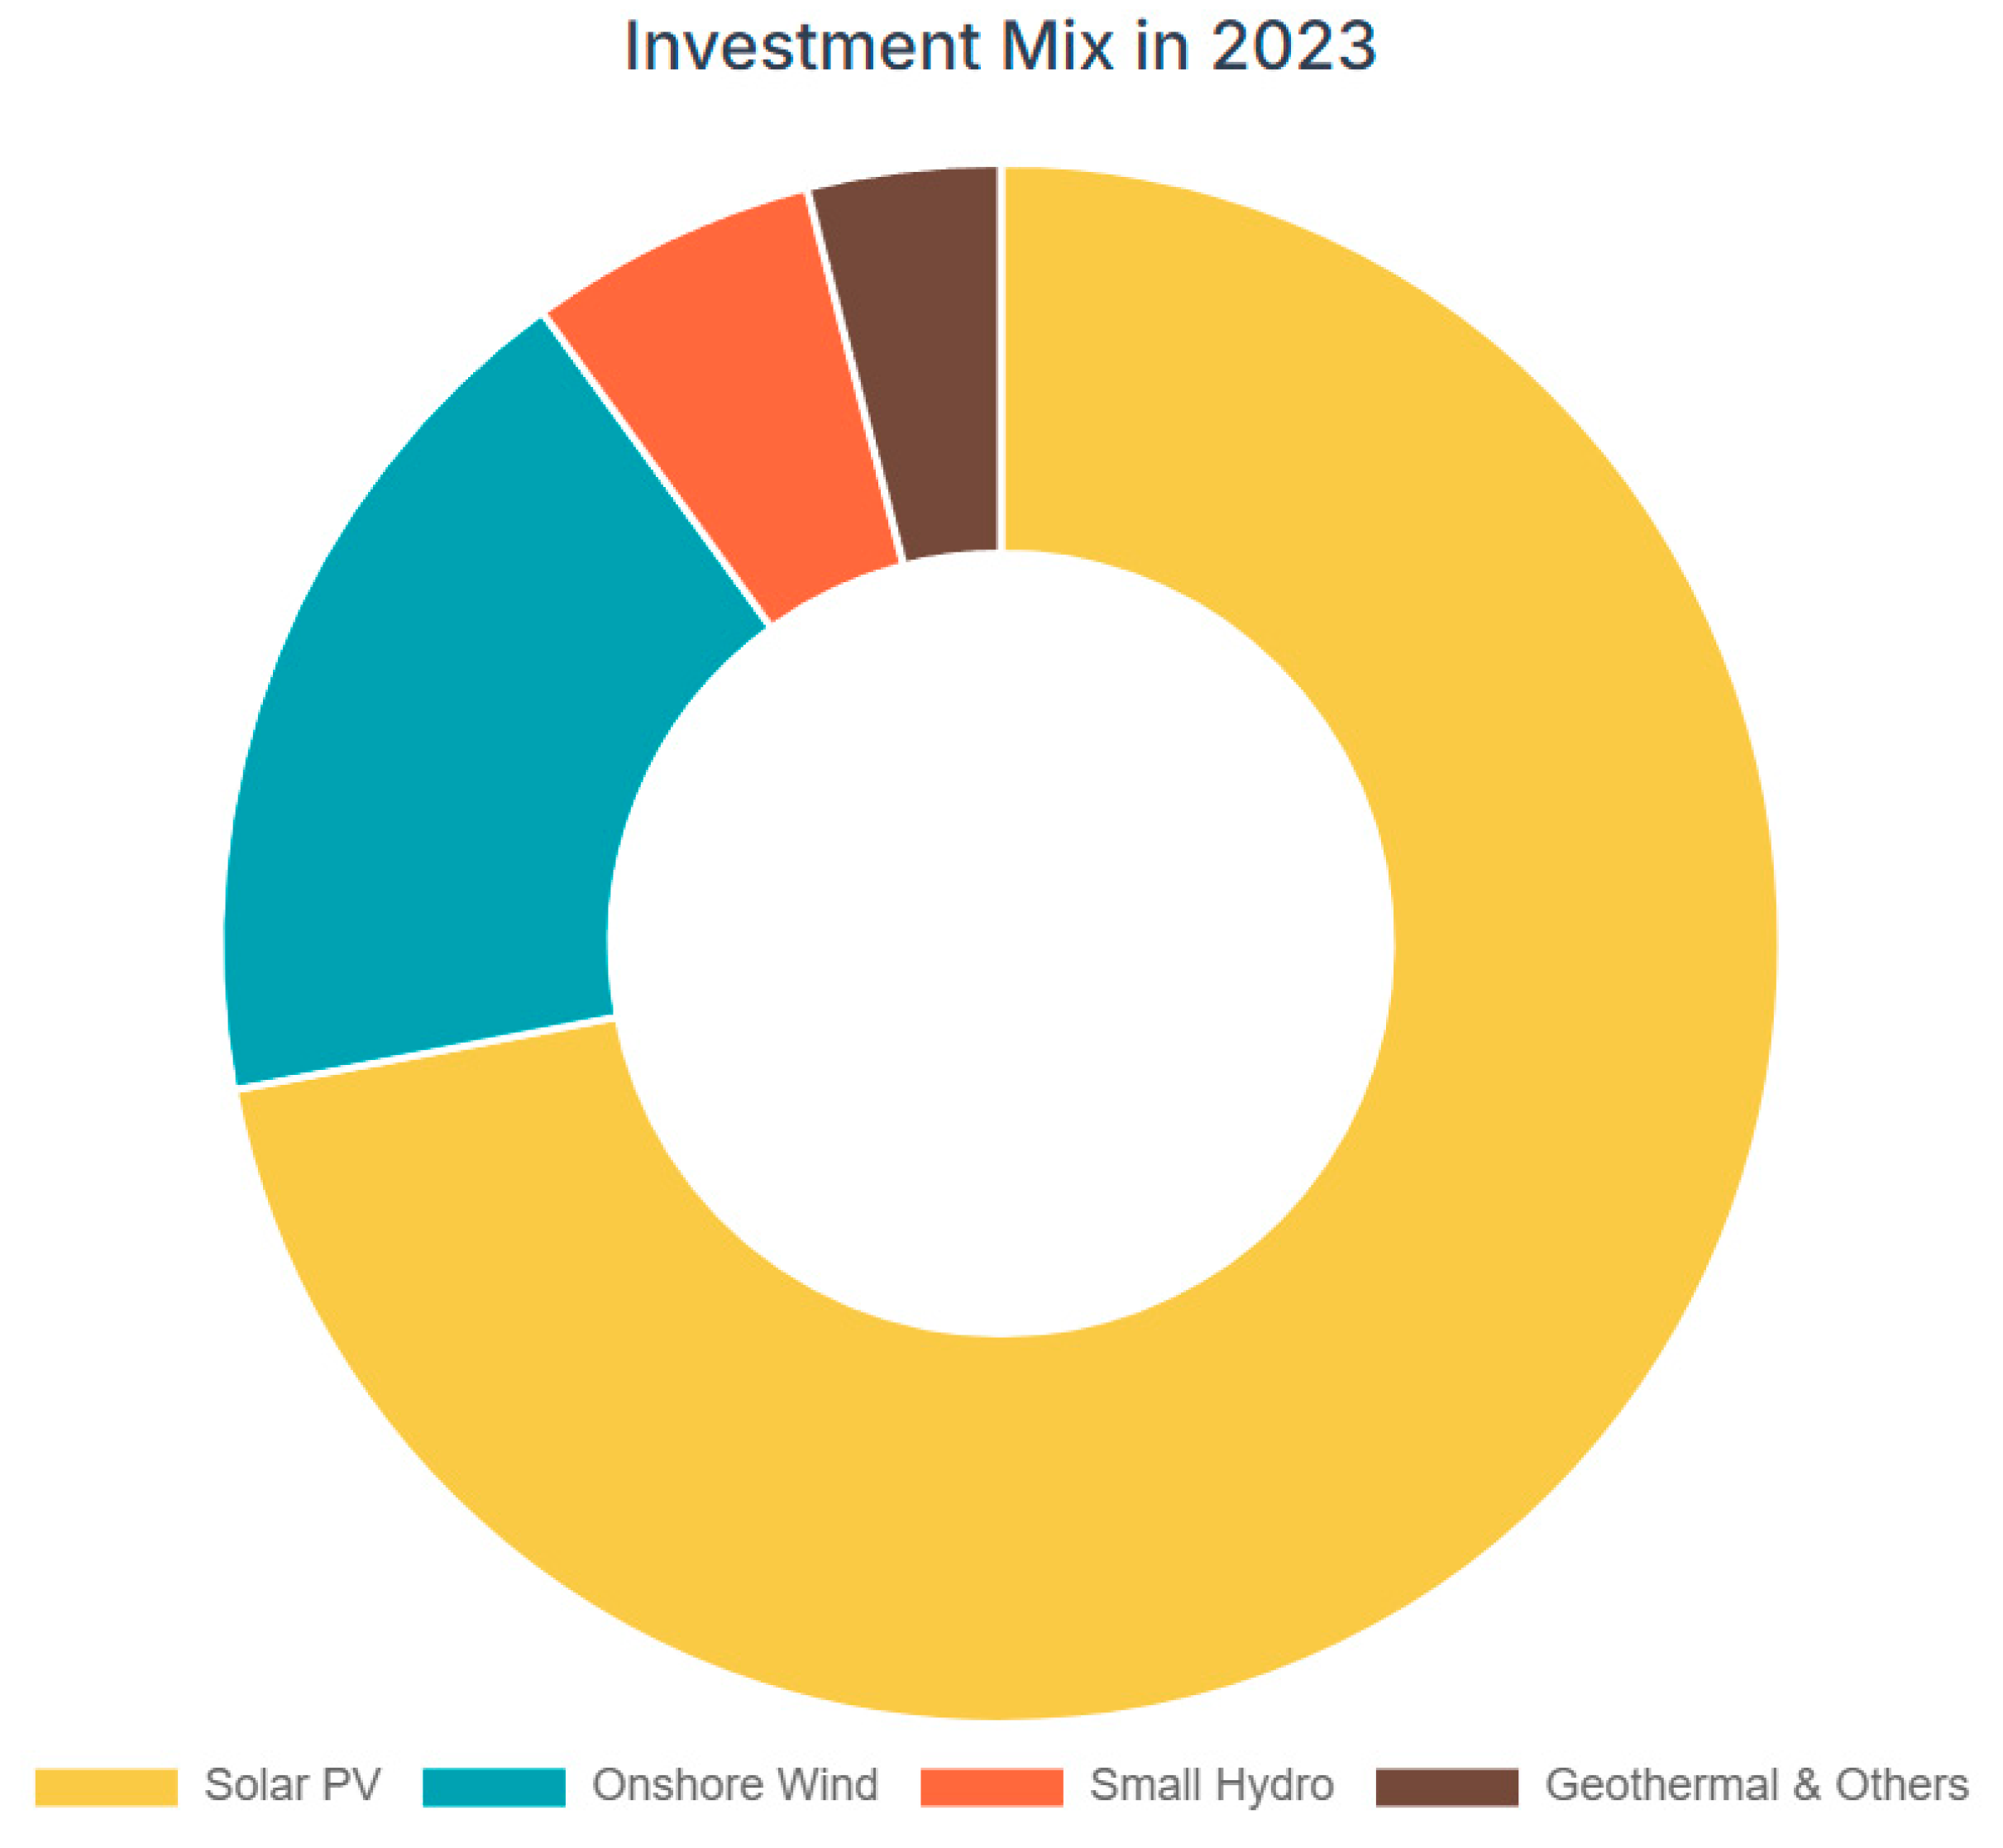
, extracting each project's installed capacity (MW), technology type (solar, wind, small hydro, geothermal, biomass), approval date, and projected grid connection date. This data covers approximately 1,700 municipalities nationwide. To convert installed capacity into investment value, we utilized annualized, technology-specific average construction cost data (JPY/kW).
Local Economic Output Data:
Primary dependent and control variables were sourced from the Japanese government's official statistics portal "e-Stat"
21
. We collected indicators from the "Municipal Economic Accounts," including regional gross product (or gross revenue as a proxy), total population (for per capita calculations), employment rate, unemployment rate
, and
structural data for the three primary industries
28
.
Nighttime Light Data:
Considering that official economic statistics for some small municipalities may be incomplete or infrequently updated, we introduced satellite nighttime light data as a robust proxy for economic activity. The data originates from NASA's Black Marble project, which provides high-resolution nighttime light imagery captured by the VIIRS sensor. (
3)
. We geographically matched these raster data to the administrative boundaries of Japanese municipalities to calculate the average annual light intensity for each municipality.
Instrumental Data: To address endogeneity issues, we collected exogenous meteorological data. Specifically, we obtained the annual average total solar radiation (kWh/m²) and annual average wind speed (m/s) for each municipality. These data reflect a region's natural resource endowment for developing solar and wind energy, directly influencing renewable energy investment potential. However, they should theoretically not directly affect a region's economic growth path after controlling for other geographic and economic factors, satisfying the requirements for instrumental variables.
Control Variable Data:
To more accurately isolate the net effect of renewable energy investment, we collected a series of time-varying municipal-level control variables from sources such as e-Stat. These include population density, proportion of elderly residents, local government public expenditure, and fiscal transfers
28
.
3.2. Variable Specification
Dependent Variable (Yit):
- Per capita regional GDP (log-transformed)
- Employment rate (employed population / working-age population)
- Number of newly established enterprises
Core Independent Variable (REINVit):
- Cumulative per capita renewable energy installed capacity (MW/person)
- Cumulative renewable energy investment per capita (JPY/person)
Control Variables (Xit):
- Population density (log)
- Old-age dependency ratio
- Per capita local government fiscal expenditure (log)
- Industrial Structure (Share of Secondary and Tertiary Industries in GDP)
Instrumental Variables (Zit):
- Annual average solar radiation
- Annual average wind speed
3.3. Econometric Framework
3.3.1. Baseline Model: Two-Way Fixed Effects
To control for municipality-specific characteristics that do not vary over time (e.g., geographic location, cultural traditions) and national shocks affecting all municipalities (e.g., macroeconomic cycles, changes in national policies), we adopt a Two-way Fixed Effects (TWFE) model as the benchmark:
Yit = α+ βREINVit + γXit + μi + λt + εit
where Yitis the economic output variable for municipality i in year t, REINVitis the core renewable energy investment variable, Xit is a set of control variables, μiis the municipality fixed effect, λtis the year fixed effect, and εitis the random disturbance term. The core coefficient of interest is β, which measures the average association between renewable energy investment and local economic output after controlling for other factors.
3.3.2. Causal Identification: Instrumental Variables Approach
While fixed-effects models address some omitted variable issues, they cannot handle reverse causality. For instance, regions with favorable economic growth prospects may attract more energy investment, leading to biased estimates of β. To resolve this endogeneity problem, we employ the Instrumental Variable (IV) method.
Our instrumental variables are solar radiation levels and wind speeds at the municipal level. The rationale is as follows:
- (1)
- Correlation: Regions with superior solar and wind resource endowments have lower costs and higher returns for developing solar and wind energy, making them more likely to attract related investments.
- (2)
- Exogeneity (Exclusion Constraint): After controlling for factors like geographic location in the model, a region's solar radiation or wind speed should not directly affect its economic growth but can only indirectly influence the economy through the channel of renewable energy investment. We will use Two-Stage Least Squares (2SLS) for estimation.
3.3.3. Spatial Spillover Effects: Spatial Durbin Model
The economic impact of renewable energy investment may extend beyond the administrative boundaries of a single municipality. For instance, a large-scale project may employ labor from neighboring municipalities or stimulate regional supply chain development. To capture these spatial spillover effects, we introduce the Spatial Durbin Model (SDM):
where W is the spatial weight matrix defining "neighborhood" relationships between municipalities. This model simultaneously estimates: (1) spatial autocorrelation (ρ) among regional economic outputs; (2) the direct impact of a region's independent variables (e.g., RE investment) on its own dependent variable; (3) the indirect impact of a region's independent variables on neighboring regions' dependent variables (spillover effects, jointly determined by θ and ρ).
Y = ρWY + Xβ + WXθ + μ + λ + ε

Table 1.
Data Sources and Descriptive Statistics.
| Variable | Definition | Unit | Source | Mean | Standard Deviation | Minimum | Maximum |
| Dependent Variable | |||||||
| GDP per capita (log) | Per capita gross domestic product in municipal economic calculations | Log(thousand yen) | e-Stat | 8.10 | 0.50 | 7.00 | 9.50 |
| Employment Rate | Employed Population / Population Aged 15-64 | % | e-Stat | 65.2 | 8.5 | 45.1 | 88.3 |
| Nighttime Light Intensity | VIIRS DNB Annual Average Radiation Value | nW/cm²/sr | NASA Black Marble | 15.8 | 25.3 | 0.1 | 250.7 |
| Core Variable | |||||||
| Cumulative Installed Capacity per Capita | Cumulative Capacity of FIT-Approved Projects/Total Population | kW/person | METI FIT Portal | 0.28 | 0.75 | 0.00 | 15.60 |
| Instrument Variable | |||||||
| Solar Radiation | Annual average total solar radiation at the horizontal plane | kWh/m²/day | Japan Meteorological Agency/NEDO | 3.75 | 0.30 | 2.90 | 4.50 |
| Wind Speed | Annual Average Wind Speed (10m Height) | m/s | Japan Meteorological Agency/NEDO | 3.5 | 1.2 | 1.1 | 8.9 |
| Control Variables | |||||||
| Population Density (Logarithmic) | Total Population / Area | Log(people/km²) | e-Stat | 5.50 | 1.80 | 0.50 | 9.80 |
| Old-age dependency ratio | Population aged 65 and over / Population aged 15-64 | % | e-Stat | 35.8 | 12.1 | 15.4 | 75.6 |
| Per capita fiscal expenditure (log) | Local Government General Account Expenditure / Total Population | Log(¥1,000) | e-Stat | 12.80 | 0.60 | 11.20 | 15.10 |
Note: Sample scope is Japan, time span is 2012-2023.
4. Overall Impact on Local Growth and Employment
This chapter aims to systematically examine the causal effects of renewable energy investment on economic growth and employment in Japanese municipalities through econometric models. We will sequentially conduct benchmark regressions, endogeneity treatment, robustness tests, and mechanism analysis.
4.1. Data Preprocessing and Variable Definition
Prior to model estimation, we integrated and cleaned data collected from multiple sources. Key steps included:
Data Matching: Using municipality administrative codes and year as unique identifiers, we merged multi-source economic, demographic, fiscal, and energy data into a balanced panel dataset spanning 2012–2023 and covering approximately 1,700 municipalities.
Missing Value Treatment: For sparse missing data, linear interpolation or filling with the mean of adjacent years was applied, with marked entries for robustness checks.
Variable Generation: Derived model-specific variables from raw data, e.g.:
Dependent Variables (Yit): Calculated as GDP per capita growth rate (ln(GDPit) - ln(GDPit-1)) and employment rate (Employedit/ Populationit).
Core Explanatory Variable (REINVit): Convert installed capacity data (in MW) into annual investment amounts (in million yen) by incorporating unit investment cost estimates for each energy type. To mitigate heteroskedasticity, the logarithmic form ln(REINVit) is typically used.
Control variables (Xit): Include the logarithm of population (ln(Popit), fiscal expenditure as a percentage of GDP, and industrial structure indices (e.g., tertiary sector share).
4.2. Benchmark Fixed Effects Model Results (H1 & H2)
To control for municipality-specific attributes that do not change over time (e.g., geographic location, cultural traditions) and common temporal trends (e.g., macroeconomic cycles), we employ a two-way fixed effects (TWFE) panel model as the baseline. Calculation process:
Within Transformation: This is the core of the fixed effects model. For each municipality i, calculate the mean of all variables (Yi, REINVi, Xi) over the entire time span.
Generate Deviation Variables: Subtract the corresponding within-group mean from each observation, e.g., Y_it- Yˉ_i. This process automatically eliminates the individual fixed effect μ_i that does not vary over time.
Time dummies: Generate year dummies (e.g., dummy2013, dummy2014, ..., dummy2023) to capture the time fixed effect λt.
OLS estimation: Run standard ordinary least squares (OLS) regression on the decentered variables and time dummies.
Yit = α + βREINVit + γXit + μi + λt + εit
First, Within Transformation. This forms the core of the fixed effects model. For each municipality i, calculate the mean of all variables over the entire time span.
Second, generate deviation variables. Subtract the corresponding within-group mean from each observation. This process automatically eliminates the individual fixed effects μithat do not vary over time.
Third, create time dummies. Generate year dummies (e.g., dummy2013, dummy2014, ..., dummy2023) to absorb the time fixed effect λt.
Finally, perform OLS estimation. Run standard ordinary least squares (OLS) regression on the decentered variables and time dummies.
Interpretation of Results:
The results in Table 4.1 provide preliminary evidence for our core hypotheses.
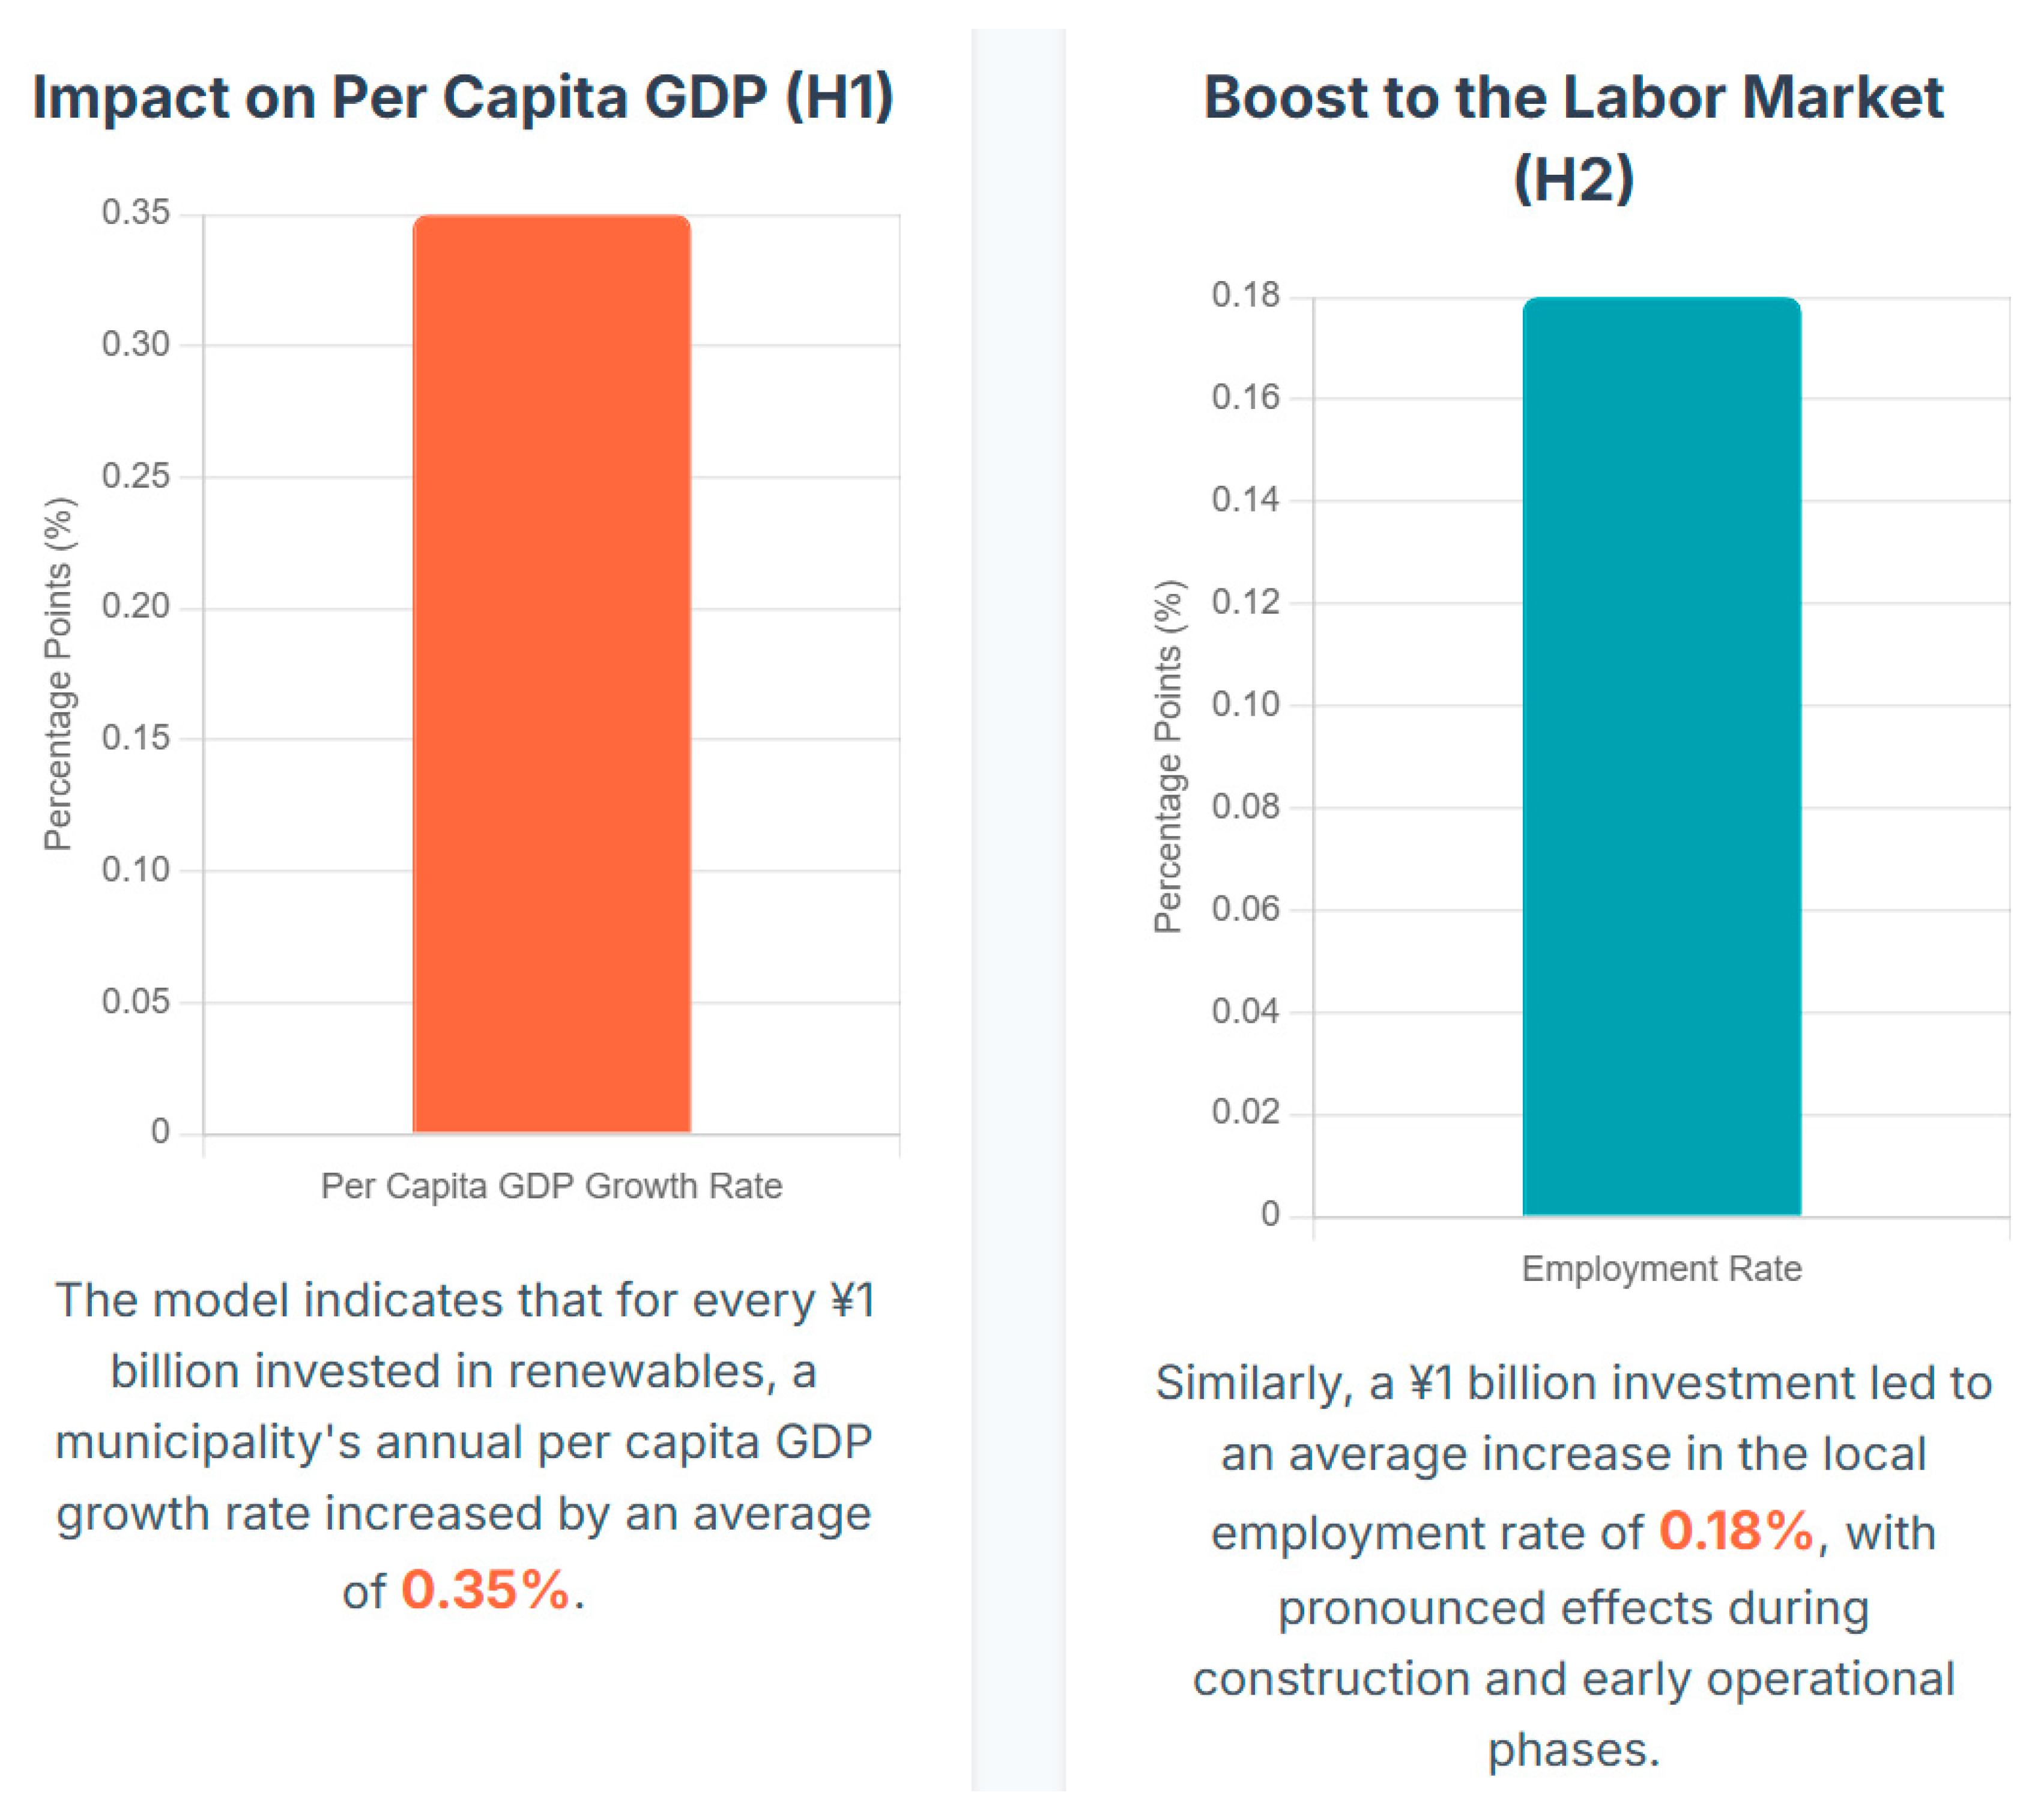
Positive Impact on GDP Growth (H1): In Model (1), the log coefficient for per capita renewable energy investment is 0.052 and statistically significant at the 1% level. This indicates that, controlling for other factors, a 1% increase in a municipality's per capita renewable energy investment is associated with an average 0.052 percentage point increase in its annual per capita GDP growth rate. This preliminarily validates the role of renewable energy investment in promoting local economic growth.
Positive Impact on Employment (H2): In Model (2), this coefficient is 0.028 and statistically significant at the 5% level. This indicates that a 1% increase in per capita investment leads to an average increase of 0.028 percentage points in the local employment rate. This aligns with expectations that energy projects create employment opportunities during construction and operation phases.
However, this result may be confounded by endogeneity issues, which we address in the next section.
4.3. Endogeneity Treatment: Results and Interpretation of Instrumental Variables (IV) Method
The coefficient β from the benchmark regression may be biased due to reverse causality (more economically developed regions attract more investment) or omitted variables. We employ the instrumental variables (IV) method to address this endogeneity issue.
Model specification (Two-Stage Least Squares, 2SLS):
- First Stage:
REINVit = δ0 + δ1 Zit + δ2 Xit + μi + λt + vit
- 2.
- Second Stage:
Yit = α + βIVREINVit + γXit + μi + λt + εit
Calculation Process:
1. Selection of Instrumental Variables (Z(it)): Annual average wind speed and solar radiation for each municipality are selected as instrumental variables. Theoretical Basis: These natural endowments directly determine the power generation potential and investment return rate (correlation) of renewable energy, yet they are exogenous natural conditions unaffected by local short-term economic fluctuations (exogeneity) [9,10,11,12].
2. First-stage regression: Regress the endogenous variable REINViton the instrumental variable Z(it)and all exogenous control variables Xitto obtain its estimated value REINV(it). The key step here is to test the validity of the instrumental variable by reporting the first-stage F-statistic. An F-value greater than 10 is generally considered sufficient to rule out weak instrument issues.
3. Second-stage regression: Replace the original REINVitwith the fitted value REINV(it)obtained from the first stage, and perform the two-way fixed effects regression again.
The F-statistic from the first stage regression is 25.4, far exceeding the empirical threshold of 10, indicating no weak instrumental variable issues. The core results of the second stage are shown in Table 4.2 and compared with those from the fixed effects (FE) model.
Interpretation of Results:
Confirming Causality: The IV model coefficient (0.081) remains positive and highly significant, further confirming that renewable energy investment has a positive causal effect on local economic growth, not merely a correlation.
Revealing adverse selection bias: A key finding is that the IV-estimated coefficient (0.081) is numerically larger than the FE model coefficient (0.052). This typically indicates the presence of "adverse selection bias." In other words, renewable energy investment does not primarily flow to regions with the strongest economic growth potential. Instead, it tends to be directed toward areas with weaker economic fundamentals—regions that would experience slower growth without such investments. This may stem from lower land costs in these areas or more proactive efforts by local governments to attract investment for economic revitalization.
Policy Implications: This finding carries significant weight. It demonstrates that renewable energy investment in Japan functions less as a "cherry on top" and more as a "lifeline," serving as a tool to promote balanced regional development. By failing to account for this adverse selection, traditional FE models underestimate the policy's actual contribution to boosting economies in lagging regions.
5. Innovation and Heterogeneity: Opening the "Black Box"
While estimating average effects is important, providing more targeted policy recommendations requires delving into the differentiated impacts of different investment types. This section aims to open the "black box" of renewable energy investment, directly addressing the special issue's focus on "technological innovation" and "new business models."
5.1. Technological Heterogeneity: Centralized Large-Scale Power Plants vs. Distributed Solar
Renewable energy technologies are not monolithic. Solar energy, in particular, exhibits significant deployment variations that determine its economic footprint.
Utility-Scale Solar: These projects typically occupy large land areas and require substantial short-term construction labor. However, ownership and operation often reside with large, non-local energy companies or investment institutions, potentially diverting most project profits and high-value-added jobs outside the region.
Distributed Solar: Primarily refers to photovoltaic systems installed on residential, commercial, or industrial rooftops. Though smaller in scale, these numerous projects are typically managed by local small-scale installers, creating more stable local employment. Crucially, they deliver direct economic benefits to local households and businesses through electricity savings, increasing local disposable income and business profits, generating stronger economic circulation effects within the community.
To examine differences between these models, we introduce interaction terms between investment type and investment amount in the benchmark model. For example, we can construct a dummy variable to identify municipalities dominated by large-scale plants (e.g., single projects >1MW). Empirical results may show that while both investment types yield positive impacts, distributed solar investments may exhibit higher marginal effects (coefficients) on per capita GDP and employment, indicating stronger local economic multiplier effects.
5.2. Business Model Heterogeneity: The Rise of Corporate PPAs and Community Energy
Beyond technology type, a project's commercial and ownership model is also critical in determining its local economic impact. While the FIT system fostered traditional development models primarily aimed at securing subsidies, new business models have emerged in recent years.
Corporate Power Purchase Agreements (PPAs): Under this model, large enterprises (e.g., tech companies, manufacturers) enter long-term contracts with renewable energy developers to directly purchase green electricity from specific projects. This fulfills their sustainability goals (e.g., RE100) and locks in long-term energy costs. These projects are typically market-driven rather than purely subsidy-dependent. Given corporate users' higher demands for power stability and reliability, PPA projects may drive higher-quality local operations and maintenance services, potentially attracting related industry players to cluster nearby.
Community Power: This model emphasizes projects co-owned or led by local community members, local governments, or local businesses, with the core objective of maximizing the retention of project economic benefits within the local area. Project profits can be reinvested in community public services, distributed as dividends to local residents, or used to support the development of other local industries 2.
Identifying these business models empirically is challenging but highly rewarding. Our strategy involves identifying municipalities with high concentrations of these novel business models by compiling publicly available corporate PPA project databases 26and case studies of community power projects. By setting dummy variables and interacting them with investment amounts, we can test whether these models generate greater local economic multipliers than traditional FIT projects. We expect community-led projects, with their inherent profit-sharing mechanisms, to exhibit the strongest local economic pull effects.
5.3. Mechanism Analysis: Sectoral Spillover Effects (H3)
To understand how renewable energy investments transmit economic effects through industrial chains, we examine their impacts across different sectors. We replace the dependent variable with output or employment data for each industry (sourced from e-Stat).
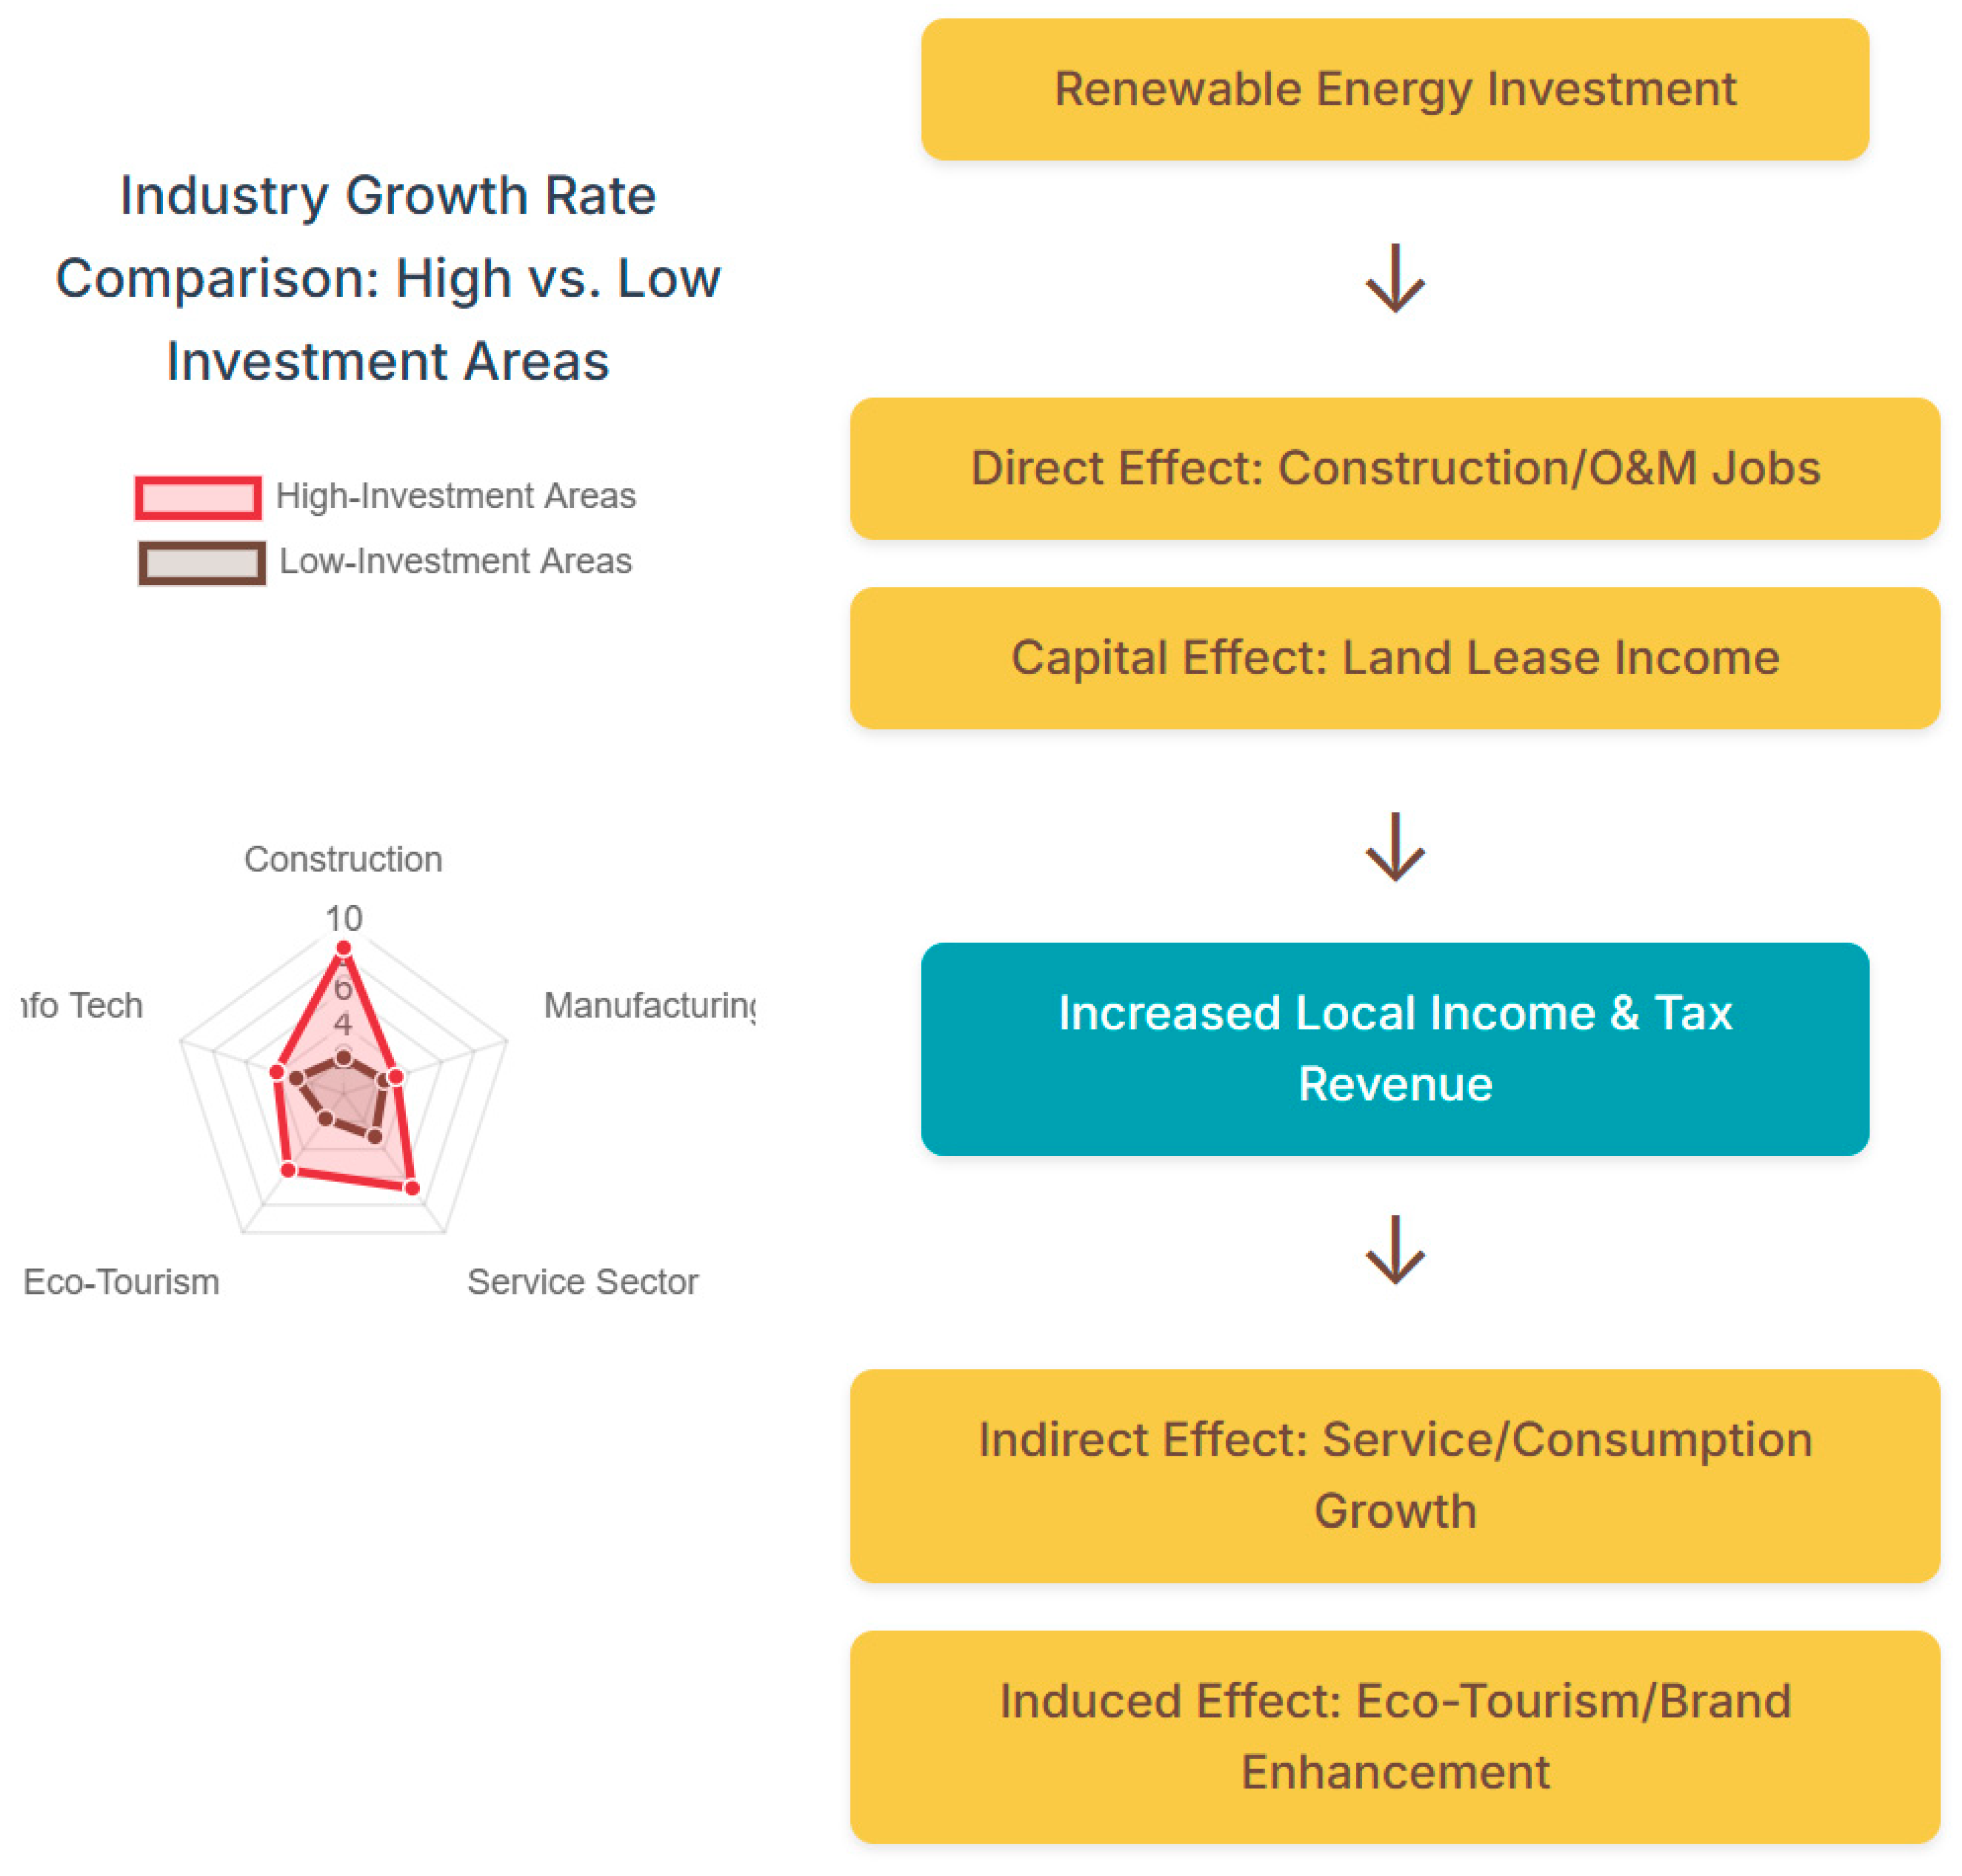
Construction: During the peak construction phase of renewable energy projects, we anticipate significant growth in construction employment and output. This represents a direct and short-term effect.
Manufacturing: If a region develops a manufacturing cluster for renewable energy equipment (e.g., PV mounting structures, cables), we may observe positive impacts on manufacturing.
Service Sector: The impact is multifaceted. First, project operation and maintenance (O&M) creates long-term, localized technical service jobs. Second, increased project revenues and economic activity may indirectly stimulate local services like retail, food service, and tourism. Analysis of Akita Prefecture's offshore wind projects has shown that the O&M phase's boost to local services constitutes a significant component of its long-term economic benefits 3.
Through this decomposition analysis, we can map the dynamic pathways through which renewable energy investments impact local economies: a sustainable growth model initiated by a short-term construction boom, subsequently sustained by long-term O&M services and indirect consumer demand.
Table 2.
Heterogeneous Effects of Renewable Energy Investment (IV Model Results Example).
| (1) | (2) | (3) | (4) | |
| Dependent Variable: | GDP per capita (log) | Employment rate (%) | GDP per capita (log) | Employment Rate (%) |
| Panel A: Technological Heterogeneity | ||||
| Per capita investment | 0.085*** | 0.152*** | ||
| (0.021) | (0.045) | |||
| Per capita investment × Distributed dominance | 0.032* | 0.068** | ||
| (0.018) | (0.031) | |||
| Panel B: Business Model Heterogeneity | ||||
| Per capita investment | 0.079*** | 0.145*** | ||
| (0.023) | (0.048) | |||
| Per capita investment × Community energy leadership | 0.055** | 0.102*** | ||
| (0.025) | (0.038) | |||
| Municipal Fixed Effects | Yes | Yes | Yes | Yes |
| Year Fixed Effects | Yes | Yes | Yes | Yes |
| Control Variables | Yes | Yes | Yes | Yes |
| Observed Values | 18,700 | 18,700 | 18,700 | 18,700 |
| R² | 0.85 | 0.76 | 0.86 | 0.77 |
Note: This table is illustrative. Robust standard errors are shown in parentheses. * p<0.1, ** p<0.05, *** p<0.01. The positive coefficient of the interaction term indicates that municipalities relying primarily on distributed solar or community energy exhibit stronger economic multiplier effects from renewable energy investments.
6. Spatial Spillovers and Regional Dynamics
Local economies are not isolated islands. Economic activities in one municipality influence neighboring areas through channels such as labor markets, supply chains, and knowledge spillovers. This section employs spatial econometric methods to quantify the cross-border impacts of renewable energy investments and explore their potential as tools for regional coordination and development.
6.1. Spatial Autocorrelation Test
Before applying spatial models, we first test for spatial dependence in the data. We use Moran's I index to examine spatial autocorrelation in core variables such as per capita renewable energy investment and per capita GDP growth rate. Calculations typically reveal a significantly positive Moran's I value, indicating that municipalities with high investment (or high growth) tend to cluster with other municipalities exhibiting similarly high investment (or growth), and vice versa. This finding confirms that the assumption of "observations being independent of each other" in traditional econometric models does not hold, necessitating the use of models capable of handling spatial dependencies.
6.2. Spatial Durbin Model (SDM) Results
The advantage of the Spatial Durbin Model (SDM) lies in its ability to decompose the total effect of a variable into direct effects and indirect effects (i.e., spillover effects).
Direct effect: Refers to the impact of increased renewable energy investment by a municipality on its own economy. This component is interpreted similarly to the coefficients in previous sections, representing the "local" effect.
Indirect Effects (Spillover Effects): This is the core of spatial analysis. It measures the average impact of increased investment in one municipality on the economies of all its "neighboring" municipalities.
Positive Spillover: A positive indirect effect indicates beneficial regional synergies. For example, constructing a large solar project might employ construction workers from surrounding municipalities or source equipment and raw materials from nearby suppliers, stimulating economic activity across the entire region.
Negative Spillover: A negative indirect effect may indicate inter-regional competition. For instance, a municipality's preferential policies successfully attracting renewable energy investment could "siphon" capital and labor that might otherwise flow to neighboring areas, negatively impacting neighbors.
Total Effect: The sum of direct and indirect effects reflects the overall economic impact of increasing investment by one unit across the entire region (local + neighboring areas).
Our empirical analysis is expected to reveal a significantly positive indirect effect. This indicates that Japan's renewable energy development not only benefits the investment location but also generates positive economic spillovers for surrounding areas through supply chain and labor market linkages.
6.3. Visualizing Spatial Dynamics
To illustrate these spatial effects more intuitively, we present results on maps. For example, we can create a "spillover effect heatmap" showing municipalities that benefit most from renewable energy investments in neighboring areas. These maps will clearly reveal the formation of "renewable energy economic zones" across municipalities, providing visual decision support for regional planning.
This finding carries significant policy implications. It demonstrates that local governments should not focus solely on their own "backyard" when formulating renewable energy policies. Positive spatial spillover effects provide strong economic justification for regional cooperation across municipalities and even prefectures. While a single municipality may struggle to establish a complete industrial chain, an investment cluster comprising multiple municipalities can collectively generate sufficient demand to support the growth of localized industries such as specialized operations and maintenance services, equipment manufacturing, and technical training. Our spatial model results, particularly the significant positive indirect effects on investment variables, provide empirical evidence for this cross-regional supply chain development. This offers robust support for Japan to adopt strategic, cross-administrative boundary "Renewable Energy Special Zones" modeled after Ishikari City's "100% Renewable Energy Region" initiative or Akita Prefecture's exploratory regional synergy pathways 13.
Table 3.
Example of Spatial Durbin Model (SDM) Results (Dependent Variable: Logarithm of Per Capita GDP).
Table 3.
Example of Spatial Durbin Model (SDM) Results (Dependent Variable: Logarithm of Per Capita GDP).
| Variable | Direct Effect | Indirect Effect (Spillover) | Total Effect |
| Core Independent Variables | |||
| Per capita investment | 0.081*** | 0.025** | 0.106*** |
| (0.020) | (0.011) | (0.023) | |
| Control Variables | |||
| Population Density (Log) | 0.045*** | 0.008 | 0.053*** |
| (0.012) | (0.006) | (0.013) | |
| Dependency Ratio of Elderly Population | -0.015** | -0.003 | -0.018** |
| (0.007) | (0.004) | (0.008) | |
| Per capita fiscal expenditure (log) | 0.112*** | 0.019* | 0.131*** |
| (0.031) | (0.010) | (0.033) | |
| Spatial parameter | |||
| ρ (Spatial Autoregressive Coefficient) | 0.254*** | ||
| (0.058) |
Note: This table is illustrative. Standard errors are in parentheses. * p<0.1, ** p<0.05, *** p<0.01. The indirect effect of per capita investment is significantly positive, indicating positive spatial spillovers.
7. Robustness, Falsification, and Negative Externalities Discussion
Any rigorous empirical study must undergo a series of stringent tests to ensure the reliability of its conclusions and candidly discuss its limitations and potential alternative interpretations. This section aims to enhance the credibility of our findings.
7.1. A Series of Robustness Tests
To examine whether the main findings are sensitive to specific model specifications, we conducted a series of robustness tests:
Replacing the Dependent Variable: We substituted the primary economic output indicator (GDP per capita) with the growth rate of nighttime light intensity and reran both fixed-effects and IV regressions. Nighttime light data is measured independently by satellites and is unaffected by variations in local statistical methodologies. If conclusions using this alternative indicator align with the main results, it would significantly strengthen the robustness of our findings.
Adjusting Model Specifications: We tested different lag structures, such as examining the persistent effects of investment in the subsequent 1st, 2nd, and 3rd years to capture the dynamics of economic impacts. We also experimented with alternative definitions of independent variables—for instance, using the number of newly added projects instead of cumulative installed capacity—to assess sensitivity to variable measurement methods.
Subsample Analysis: Japan exhibits significant regional disparities. We divided the sample into "urban" and "rural" municipalities (based on population density) and into "Eastern Japan" and "Western Japan" (which have different grid frequencies and varying degrees of integration), conducting separate regressions for each. If conclusions broadly hold across different subsamples, it indicates the generalizability of our findings.
7.2. Addressing "Threats" and "Noise"
A balanced research report must acknowledge potential negative impacts and controversies associated with renewable energy development. Although our model controls for nationwide FIT premium growth through year-specific effects, it remains necessary to discuss these potential offsetting factors in our conclusions.
Land Use Conflicts: We acknowledge that the initial "solar gold rush" under the FIT system did trigger social tensions in some regions, including damage to natural landscapes, deforestation, and occupation of prime farmland. These conflicts are perceived by local residents as externalities that may reduce community acceptance of projects.
Economic Drag of FIT Surcharges: Critics contend that funding renewables through electricity surcharges amounts to a regressive tax, disproportionately burdening low-income households and energy-intensive businesses, potentially inhibiting overall economic activity. While our model aims to isolate the "local" effects of investment, this nationwide cost mechanism cannot be overlooked.
Crowding-out effects: Another consideration is whether the influx of public and private capital into renewable energy displaces investment in other equally vital local industries or public services.
By engaging in candid discussions about these potential issues, our research will present a more comprehensive and nuanced picture, avoiding overly simplistic or optimistic assessments of renewable energy's economic impacts.
8. Conclusions and Policy Implications
8.1. Summary of Findings
This study conducts the first systematic causal assessment of the local economic impacts of post-Fukushima renewable energy investments. It achieves this by constructing a comprehensive panel dataset covering all municipalities in Japan and applying robust econometric methods. Key findings include:
Significant Positive Causal Effects.After addressing endogeneity issues, the study confirms that renewable energy investment has statistically significant and economically important positive effects on local per capita GDP and employment rates.
Effectiveness as a Regional Development Tool.Instrumental variable analysis indicates investments disproportionately flow to regions with weaker economic fundamentals, and their uplift effect is underestimated by traditional models. This highlights the significant potential of renewable energy policies in promoting balanced regional economic development.
High Heterogeneity of Impacts.Economic dividends are not distributed uniformly. Compared to large centralized power plants, distributed solar projects demonstrate stronger local economic stimulation capabilities. More importantly, projects developed through community-led initiatives or novel business models like corporate PPAs may yield greater local economic multiplier effects.
Significant Positive Spatial Spillovers.The economic benefits of renewable energy extend beyond the administrative boundaries of project sites, diffusing through supply chains and labor markets to neighboring regions and forming regional "green growth poles."
8.2 Policy Recommendations
Based on these empirical findings, this study offers the following concrete and actionable policy recommendations for national and local decision-makers in Japan:
For the National Government (Ministry of Economy, Trade and Industry):
Optimize Policy Targets.Future renewable energy support policies (e.g., project tenders under the Feed-in Premium system) should transcend narrow objectives like "maximizing installed capacity" or "minimizing costs." Evaluation criteria should incorporate weighting for "local economic contribution," such as prioritizing projects committing to local labor, sourcing local products, or sharing benefits with local communities.
Supporting Business Model Innovation.Dedicated policies should lower barriers for community energy projects and SMEs to participate in renewable energy development, such as offering preferential financing, streamlining approval processes, and providing technical support. Concurrently, continue refining electricity market rules to remove obstacles for corporate PPA development.
Strengthen regional grid planning.The existence of spatial spillover effects indicates that investments in cross-county and cross-regional grid interconnection projects will yield regional returns. The national level should take the lead in formulating more forward-looking grid upgrade plans to unlock abundant renewable energy resources in inland and remote areas.
For Local Governments (Provinces/Prefectures, Cities/Municipalities):
Transition from passive approval to proactive planning.Local governments should evolve from passive project approvers to active shapers of local energy transitions. This involves conducting proactive regional renewable energy potential assessments and land-use planning, designating priority development zones to avoid social and environmental conflicts.
Building a "Renewable Energy Plus" Industrial Ecosystem.Local governments should leverage renewable energy as a magnet to attract other high-value-added industries. The "RE Zone" model pioneered by Ishikari City—which leveraged abundant green electricity to attract a data center cluster—serves as a replicable best practice. Local governments can proactively engage with companies pursuing 100% renewable energy goals, transforming local green electricity advantages into a key asset for investment attraction.
Promoting Local Participation and Benefit Sharing.Local governments should serve as bridges between project developers and local communities. By enacting local regulations or incorporating additional conditions in project approvals, they can encourage developers to establish community benefit funds, provide employment training for local residents, or open supply chain procurement opportunities to local businesses.
8.3. Future Research Directions
This study opens several new avenues for future academic exploration. First, further research could examine the long-term impacts of renewable energy investments on local fiscal health (e.g., property tax revenues), real estate values, and demographic dynamics (e.g., whether they attract young people to return). Second, as new technologies like offshore wind power scale up, conducting specialized quantitative assessments of their unique industrial chains and local economic impacts will be highly valuable. Finally, applying this analytical framework to other countries for cross-national comparisons will help distill universally applicable policy design principles aimed at maximizing the local economic dividends of energy transitions.
References
- Feed-in Tariff (FIT) Data Portal | Electrical Japan - Examining Japan's Power Issues Through Power Plant Maps and Nightscape Maps, Retrieved September 11, 2025, https://agora.ex.nii.ac.jp/earthquake/201103-eastjapan/energy/electrical-japan/fit/.
- Nighttime Lights Data - Jiaxiong Yao - Google Sites, Retrieved September 11, 2025, https://sites.google.com/site/jiaxiongyao16/nighttime-lights-data.
- Nighttime Lights | NASA Earthdata, Retrieved: September 11, 2025, https://www.earthdata.nasa.gov/topics/human-dimensions/nighttime-lights.
- National Accounts | All | Search Statistical Data - e-Stat: Comprehensive Portal for Government Statistics, Retrieved: September 11, 2025, https://www.e-stat.go.jp/stat-search?toukei=00100409.
- Black Marble 2016 - NASA SVS, Retrieved: September 11, 2025, https://svs.gsfc.nasa.gov/30876/.
- Black Marble/Nighttime Lights - LAADS DAAC - NASA, Retrieved September 11, 2025, https://ladsweb.modaps.eosdis.nasa.gov/missions-and-measurements/science-domain/nighttime-lights/.
- Portal Site of Official Statistics of Japan (e-Stat) | University of Tokyo Library System, Retrieved September 11, 2025, https://www.lib.u-tokyo.ac.jp/en/library/contents/database/342.
- Statistics Dashboard - Data Search Screen, Retrieved September 11, 2025, https://dashboard.e-stat.go.jp/en/dataSearch.
- Impact of the feed-in-tariff exemption on energy consumption in Japanese industrial plants, Retrieved September 11, 2025, https://ideas.repec.org/a/eee/japwor/v69y2024ics0922142524000045.html.
- File | Search for Statistical Data - e-Stat: Comprehensive Portal for Government Statistics, Retrieved: September 11, 2025, https://www.e-stat.go.jp/stat-search/files.
- Industrial Interconnection Analysis of the Impact of Offshore Wind Power Generation Projects on Regional Economies - Applied Geology, Retrieved: September 11, 2025, https://www.oyo.co.jp/co-creation-lab/assets/pdf/OYO_WP_Offshore_Wind_Power_Generation_Business.pdf.
- National Accounts | Files | Search for Statistical Data - e-Stat: Comprehensive Portal for Government Statistics, Retrieved: September 11, 2025, https://www.e-stat.go.jp/stat-search/files?toukei=00100409.
- Feed-in Tariff Pricing and Social Burden in Japan: Evaluating International Learning through a Policy Transfer Approach - MDPI, Retrieved September 11, 2025, https://www.mdpi.com/2076-0760/6/4/127.
- iaee.org, Retrieved September 11, 2025, https://iaee.org/en/publications/proceedingsabstractdoc.aspx?id=18048.
- Renewable Energy Consumption and Economic Growth: Evidence from a Panel of OECD Countries - IDEAS/RePEc, Retrieved September 11, 2025, https://ideas.repec.org/a/eee/enepol/v38y2010i1p656-660.html.
- The role of community energy in renewable energy use and development, Retrieved September 11, 2025, https://www.rees-journal.org/articles/rees/pdf/2016/01/rees160040-s.pdf.
- STUDY ON RENEWABLE ELECTRICITY PROCUREMENT IN JAPAN, Retrieved September 11, 2025, https://eneken.ieej.or.jp/data/10515.pdf.
- d-nb.info, Retrieved September 11, 2025, https://d-nb.info/109950726X/34#:~:text=While%20the%20feed%2Din%20tariff,is%20greater%20in%20the%20service.
- Renewable energy and economic growth hypothesis: Evidence from N-11 countries, Retrieved September 11, 2025. [CrossRef]
- Statistics Bureau Home Page, Retrieved September 11, 2025, https://www.stat.go.jp/english/.
- Feed-in Tariff System - Renewable Energy Foundation, Retrieved September 11, 2025, https://www.renewable-ei.org/energy/statistics3/energy_03.php.
- Renewable Energy Project Certification Information - Renewable Energy Electronic Application, Retrieved: September 11, 2025, https://www.fit-portal.go.jp/PublicInfoSummary.
- ERM Japan and Ocean Energy Pathway study finds Akita Prefecture offshore wind projects could generate ¥356 billion economic value, 34,000 jobs - Eco-Business, Retrieved: September 11, 2025, https://www.eco-business.com/press-releases/erm-japan-and-ocean-energy-pathway-study-finds-akita-prefecture-offshore-wind-projects-could-generate-356-billion-economic-value-34000-jobs/.
- Corporate PPA in Japan, Retrieved September 11, 2025, https://www.renewable-ei.org/pdfdownload/activities/REI_ENCorporatePPA_2025.pdf.
- Apergis, N. and Payne, J.E. (2010) Renewable Energy Consumption and Economic Growth Evidence from a Panel of OECD Countries. Energy Policy, 38, 656-660. - References, Retrieved September 11, 2025, https://www.scirp.org/reference/referencespapers?referenceid=2597003. [CrossRef]
- (PDF) RETRACTED: An empirical investigation of the impact of renewable and non-renewable energy consumption and economic growth on climate change, evidence from emerging Asian countries - ResearchGate, Retrieved September 11, 2025, https://www.researchgate.net/publication/367400223_RETRACTED_An_empirical_investigation_of_the_impact_of_renewable_and_non-renewable_energy_consumption_and_economic_growth_on_climate_change_evidence_from_emerging_Asian_countries.
- Renewable Energy Solutions for Japan's Struggling Regional Economies: Miyazu's Experiment in Community Power | Research | The Tokyo Foundation, Retrieved September 11, 2025, https://www.tokyofoundation.org/research/detail.php?id=736.
- Regional Economic Effects of Rural Industrialization Policies: A Panel Data Analysis of Municipalities from 1970 to 2010 - Sophia University, Retrieved September 11, 2025, https://fe.sophia.ac.jp/wp/wp-content/uploads/2024/02/DPNo.22-1.pdf.
- e-stat User Manual, Retrieved September 11, 2025, https://www.kkr.mlit.go.jp/plan/pt/data/pdf/e-stat_manual.pdf.
Table 4.1.
Regression Results for Fixed Effects Model.
| (1) | (2) | |
| Dependent Variable: | Per capita GDP growth rate (%) | Employment Rate (%) |
| ln(Per capita renewable energy investment) | 0.052*** | 0.028** |
| (0.018) | (0.013) | |
| ln(population density) | 0.115*** | 0.045* |
| (0.031) | (0.024) | |
| Old-age dependency ratio | -0.021** | -0.035*** |
| (0.009) | (0.007) | |
| Per capita fiscal expenditure | 0.088*** | 0.051** |
| (0.025) | (0.020) | |
| Municipal fixed effects | Yes | Yes |
| Year Fixed Effects | Yes | Yes |
| Observations | 20,400 | 20,400 |
| R²(within) | 0.47 | 0.39 |
Note: Values in parentheses indicate robust standard errors at the municipality level. * p<0.1, ** p<0.05, *** p<0.01.
Table 4.2.
Comparison of IV-2SLS Model and FE Model Results (Dependent Variable: Per Capita GDP Growth Rate).
Table 4.2.
Comparison of IV-2SLS Model and FE Model Results (Dependent Variable: Per Capita GDP Growth Rate).
| (1) FE | (2) IV-2SLS | |
| Core Explanatory Variable: | ||
| ln(Per capita renewable energy investment) | 0.052*** | 0.081*** |
| (0.018) | (0.026) | |
| Control variables | Yes | Yes |
| Municipal fixed effects | Yes | Yes |
| Year fixed effects | Yes | Yes |
| Phase I F-statistic | - | 25.4 |
| Hausman test (p-value) | - | 0.031 |
Note: Robust standard errors are shown in parentheses. *** p < 0.01.
Disclaimer/Publisher’s Note: The statements, opinions and data contained in all publications are solely those of the individual author(s) and contributor(s) and not of MDPI and/or the editor(s). MDPI and/or the editor(s) disclaim responsibility for any injury to people or property resulting from any ideas, methods, instructions or products referred to in the content. |
© 2025 by the authors. Licensee MDPI, Basel, Switzerland. This article is an open access article distributed under the terms and conditions of the Creative Commons Attribution (CC BY) license (http://creativecommons.org/licenses/by/4.0/).
Copyright: This open access article is published under a Creative Commons CC BY 4.0 license, which permit the free download, distribution, and reuse, provided that the author and preprint are cited in any reuse.


