
Submitted:
02 September 2025
Posted:
03 September 2025
You are already at the latest version
Abstract
The article examined the asymmetric effect of renewable energy consumption transition on China’s economic prosperity using time series data from 1996 to 2022. Using maximum likelihood and threshold regression analysis, the findings revealed that the transition to renewable energy consumption can promote China’s economic prosperity. The findings were achieved through controlling the threshold effect of investment in R&D expenditure and labor force transformations in the nexus between the transition to renewable energy consumption and economic prosperity. Furthermore, the threshold effect investigations revealed a significant R&D threshold effect of 0.65% regarding the impact of transition to renewable energy consumption on economic prosperity and a significant LFP threshold effect of 4.34% regarding the impact of transition to renewable energy consumption on economic prosperity, respectively. Specifically, when the level of investment in R&D expenditure exceeds the estimated threshold value above, the facilitating effect of accelerated transition to renewable energy consumption on economic prosperity becomes stronger. Further investigation revealed that the transition to renewable energy consumption can significantly drive China’s “dual carbon” targets.
Keywords:
renewable energy
; economic prosperity
; maximum likelihood
; threshold effect test
; China
1. Introduction
Renewable energy sources, including solar, wind, hydro, and geothermal energy, are eco-friendly ways of generating energy and a solution to addressing the challenges associated with climate change [1]. Over the past few decades, these energy sources have grown tremendously and have become one of the most significant developments in the world’s energy system [2,3]. He and Huang [3], Nie et al. [4], Abdulqadir [5,6], and Olabi and Abdelkareem [7] revealed that to achieve the United Nations Sustainable Development Goals (SDGs) through mitigating the effects of climate change and environmental sustainability, critical renewable energy infrastructure is needed. In April 2025, China’s Renewable Energy Development Report indicated that wind and solar power generated in China’s energy mix increased by 26%, marking it the highest ever, surpassing previous records, with the solar energy trajectory tripling from 4.1% in 2020 to 12.4% in 2025 [3]. Such an effort represents a growth trajectory in the right direction for China’s economic prosperity, aligning with its “Dual Carbon” target to peak carbon dioxide emissions before 2030 and achieve carbon neutrality before 2060 [8]. Although a topic on the accelerated transition to renewables will be a significant debate to explore.
China’s prosperity miracle cannot be separated from the contribution of labor force transfer from the agricultural sector to the non-agricultural sector of the Chinese economy. [9]. Furthermore, China’s annual average growth has been declining from 9.92% in 1996 to 5.23% in 2023, which was precisely associated with large-scale labor transformations. [10,11]. On the other hand, the global investment in research and development has also accelerated recently, with China’s R&D expenditure growing approximately sixfold between 2007 and 2024, despite the COVID-19 pandemic, as compared with the financial crisis era. According to a World Bank report, China’s annual growth rate between the financial crisis era of 1997 and the COVID-19 pandemic is depicted in Figure 1 below.
Indeed, from the above growth trajectory, we can observe the sluggish movement along the renewable energy, which may likely come from the perspective of economic potentials of the Chinese energy sector growth, as envisaged in [12]. Severally, such potentials have been a topic of significant academic debate among economists and policymakers. Imran et al. [13] uncovered the detrimental effect of renewable energy in BRICS economies. Wu et al. [14] discovered a significant 80% labor force contribution to China’s economic growth. The fundamental question is whether the impact of the renewable energy transition on economic prosperity is significant enough to provide policymakers with an appropriate policy tool unless it has a prescribed inflection point within the nexuses investigated.
Conversely, most existing literature has focused on the causal effect, direct and indirect impact of renewable energy on economic growth, while only a few have delved into the important concept of “nonlinearity,” which is fundamentally appropriate [8,15,16]. Perhaps, the topic is still open to further debate as the effect of nonlinearity/asymmetry in the nexus between renewable energy transition and China’s economic prosperity has not given the scholarly attention it deserves, and has a limited coverage in the literature. However, the objective of this study is to explore this asymmetric effect of the investment in R&D expenditure and labor force transformation along the nexus between economic prosperity and renewable energy consumption transition in China. In this article, we have found significant threshold effects of the investment in R&D expenditure and labor force transformation along the nexus between renewable energy and China’s economic prosperity. This is achieved using the threshold regression analysis.
Specifically, this study presents three (3) contributions to the existing literature. First, the study examines the Chinese strategic investment-led prosperity through R&D expenditure across the entire sampled time dimension. Second, the study also uncovered the nonlinear effect of R&D expenditure in the nexus between renewable energy consumption and economic prosperity in China. Third, the study unveiled a significant threshold effect of labor force participation in the nexus between renewable energy transition and economic prosperity in China. Next, we present the theoretical underpinnings and hypothesis development in the subsection below.
2. Literature and Hypothesis Development
Han et al., [17], found that the challenges from environmental pollution and climate change have been the central debate in addressing the pursuit of global prosperity. However, addressing the issue of accelerated energy transition could go a long way to achieving sustainable development. In this subsection, the chapter will explore the literature from the perspective of global prosperity on one hand, and China’s perspective on the other.
2.1. Renewable Energy Consumption and the Global Prosperity
Abdulqadir [5], found that to achieve a sustainable green economy in sub-Saharan Africa, the economies would have to address the issue associated with the rising urban population. Using panel quantile regression to explore the nexus between urbanization, trade, renewable energy, carbon dioxide emissions, and economic prosperity. The author found strong evidence of the Kuznets curve in the region, and mitigating carbon emissions through the renewables transition as the solution. Similarly, Moutinho and Madaleno [18], Abdulqadir [19], have the same outlook on the OPEC member countries. Musah et al., [20], found a long-run relationship between renewable energy consumption on economic growth using panel data from West African countries over the period 1990-2020. Park et al.,[1], found evidence of a rising low-carbon energy transition in a sample of BRICS and OECD countries using exploratory data analysis and ARIMA-based statistical forecasting. Alfalih [21], discovered the impact of human capital in the renewable energy transition in TGC.
In another strand of literature on the impact of renewable energy consumption on economic growth. Xinyu et al. [22] attempted to explore the connection between technological advancements and renewable energy within the European Union. The findings indicate that technology significantly influences renewable energy in approximately one-third of the member states. Wang et al. [23] unveiled the effects of renewable energy, trade liberalization, innovation, emissions, urbanization, and growth, taking into account the panel of 122 countries over the period 1998 to 2018. Chen et al. [24] uncovered a significant effect of renewable energy consumption in six(6) energy transition countries for the period 1970 to 2021. Consistent with the current debate, the study introduces Hypothesis 1.
Hypothesis 1:
Renewable energy consumption promotes economic prosperity.
2.2. Renewable Energy Consumption and the Chinese Economic Prosperity
Rahman et al.,[11], discovered the causation between renewable energy, innovation and economic growth in China. Khan et al.,[25], uncovered the role of innovation in the nexus between green innovation and renewable energy using annual data from 1990 to 2023. Zho et al.,[9], utilized panel data from North China and unveiled the causal relationship between renewable energy and economic growth. Chen et al.,[26], found evidence of a significant relationship between renewable energy, green financing, and tourism development using panel data from 30 provinces of China from 2005 to 2023. Xia et al.,[27], unfolded the effect of renewable energy against the nonrenewable energy using the quantile correlation approach from China’s economic data from 1989 to 2022. Xie and Lin [12], found evidence of funding using microdata from 114 Chinese renewable energy companies from 2011 to 2022. He and Huang [3], discovered the significant causal effect of renewable energy consumption and economic growth in China from 1990 to 2020.
In another strand of literature, Shi and Shi[8], uncovered the significant impact of green finance on economic growth using panel data from China’s provincial-level regions from 2013 to 2022. Guo and Yan [28], found strong evidence of renewable energy transition using data from the Yangtze River Economic Belt and provided actionable insights for achieving the YREB’s low-carbon development in provinces from 2005 to 2021. Herrerias et al., [29], found strong evidence of a causal relationship between renewable energy consumption and economic growth using Chinese regions’ data from 1995 to 2009. Fei et al.,[30], discovered strong evidence of a significant causal relationship between renewable energy consumption and economic growth using panel data of 30 provinces in mainland China from 1985 to 2007. Consistent with the current debate highlighted above, none of the previous studies have explored the nonlinear/asymmetry effect of renewable energy and China’s economic prosperity, a gap in the literature. Complementing the current debate, the study introduces Hypothesis 2 and Hypothesis 2, respectively.
Hypothesis 2:
When investment in R&D expenditure level is below a certain threshold, its impact on the renewable energy transition and Chinese economic prosperity may change from positive to negative or vice versa.
Hypothesis 3:
When the labor force transformation level is above a certain threshold, its impact on the renewable energy transition and Chinese economic prosperity may change from positive to negative or vice versa.
Next, the data and empirical strategy supporting the findings of this article are presented in the forthcoming section.
3. Model Specification and Data
3.1. The Data
This study utilizes China’s economic time series data, sourced from the World Bank Development Indicators (WDI)[31], spanning the period 1996-2022. A detailed description of all variables is provided in Appendix Table A1.
3.2. Definition of Variables
3.2.1. Dependent Variable
3.2.2. Independent Variable
3.2.2. Threshold Variable
The study employs the R&D expenditure share of GDP and labor force participation rate as threshold variables supported by the gap in the literature.
3.2.3. Control Variable
3.2. Model Specification
To explore the asymmetric effect of the Chinese investment in R&D expenditure and labor force participation along the nexus between renewable energy and economic prosperity, the study utilized time series analysis with a model specified as follows.
 (1)
where t denotes year; α0
denotes constant; [α1,αj] denote estimated
coefficients; and ut random term. Introducing the threshold investigation in the
pertinent model above, we employ the threshold effect test following the
approach in Hansen [35].
(1)
where t denotes year; α0
denotes constant; [α1,αj] denote estimated
coefficients; and ut random term. Introducing the threshold investigation in the
pertinent model above, we employ the threshold effect test following the
approach in Hansen [35].
 (2)
where ϕ0
denotes constant; [ϕ1,ϕj] denote estimated
coefficients; and µt random term.
(2)
where ϕ0
denotes constant; [ϕ1,ϕj] denote estimated
coefficients; and µt random term.
 (3)
where η0 denotes constant; [η1,ηj]
denote estimated coefficients; below the threshold, γ1 while above the threshold γ2
and ut random term.
(3)
where η0 denotes constant; [η1,ηj]
denote estimated coefficients; below the threshold, γ1 while above the threshold γ2
and ut random term.
(1)
(2)
(3)
Conversely, the models (1-3) presented above are utilized as an empirical strategy modeling the nexuses between renewable energy consumption and China’s economic prosperity while controlling the threshold effect of the investment in R&D expenditure and labor force transformations. The next subsection will present the results from the above empirical models.
4. Results
Consistent with the context of equations (1-3), we have three cases: short run, long run, and threshold presence. To put the intuition above into perspective, the result presentation begins with the preliminary data analysis.
4.1. Preliminary Data Analysis
In this subsection, we present the preliminary data investigation on the time series analysis of the variables under study. This exercise will include, but not be limited to, the statistical data descriptions, unit root tests, cointegration tests, and pairwise correlation analysis. Table 1 presents the descriptive statistics, which include the mean, standard deviation, maximum, minimum, skewness, and kurtosis, respectively.
Furthermore, in Table 1, consistent with Figure 1-the renewable energy consumption and China’s economic prosperity trends presented in the introductory section of this article that their standard deviations, 0.370 and 0.699, did not come as of surprise. This outcome overwhelmingly corroborates China’s “Dual Carbon” goals, strongly supported by their estimated means of 2.847 and 29.454, respectively. Summarily, other variables also exhibit similar trends as TOP and FDI have the mean and standard deviations [3.759; 1.072] and [0.216; 0.409], respectively. The mean and standard deviations of GCF, LFP, and R&D of [3.659; 4.351; 0.344] and [0.114; 0.024; 0.444], respectively.
To avoid the problems associated with spurious regression results, long-run relationship, and multicollinearity, the study conducted unit root, cointegration, and multicollinearity tests are conducted. Table 2, Panel I, presents the Augmented Dickey Fuller (ADF) and Phillips-Perron (PP) tests. Panel II presents the Johansen and Juselius [36] Maximum-likelihood estimates, while Panel III presents the correlation matrix. First, the result from the unit root revealed that the variables are stationary in first difference. Second, the results from the cointegration tests revealed that at least one cointegration exists (trace and eigenvalue statistics with asterisk). Third, the pairwise correlation test results revealed positive and significant correlation between prosperity, GCF, and R&D, while negative and significant correlation between REW, FDI, and LFP, respectively.
4.2. Benchmark Model: Threshold Effect Tests and Estimations
Following the extant literature of Shi and Shi [8], He and Huang [3], and Hansen [16], the section will focus on the objective of the study through exploring the threshold effect of the investment in R&D expenditure and labor force participation in the nexus between renewable energy and the Chinese economic prosperity.
In Table 3, the threshold effect tests of the effect of investment in R&D expenditure and labor force participation are presented. It can be observed that there is overwhelming evidence in support of the presence of threshold effects in R&D expenditure and labor force participation, which are significant. In this study, investment in R&D expenditure and labor force participation are utilized as threshold variables.
Considering the critical mass of investment in R&D expenditure as a threshold variable, its impact on the level of renewable energy development can either be negative or positive on economic prosperity. In this study, the result from the threshold effect test revealed the existence of a significant threshold estimate of [R&D = 0.72%]. In Table 4, panel A presents the threshold impact estimations of the variables at regime 1 (Below the threshold) and regime 2 (Above the threshold), respectively. Below the threshold, the impact renewable energy transition on China’s economic prosperity is negative and statistically significant at -0.724, and the impact changes to a positive and statistically significant 1.593 above the threshold.
Considering the critical mass of labor force participation as a threshold variable. Its impact on the level of labor force transformation can either be negative or positive on economic prosperity. In this study, the result from the threshold effect test revealed the existence of a significant threshold estimate of [LFP = 4.34%]. In Table 4, panel B presents the threshold impact estimations of the variables at regime 1 (Below the threshold) and regime 2 (Above the threshold), respectively. Below the threshold, the impact of labor force transformation is positive 2.946 and statistically significant, while the impact changes to a negative and statistically significant -0.799 above the threshold at 1% level.
The R&D expenditure level is the threshold estimated at the point estimate of the estimated likelihood ratio intersects t at zero-point on the horizontal axis in Figure 2(b), corresponding to the threshold parameter at 0.65%.
Similarly, Figure 3 The graph depicting the likelihood ratio function for the level of labor force transformation in the nexus between renewable energy consumption transition and economic prosperity. Similarly, Figure 3(a) graph also shows the F-statistic test for threshold reject linearity if the sequence exceeds the critical value. In Figure 3(b), the graph shows the exact confidence interval construction for the estimated threshold. The process is utilized to establish the consistency in the investigation of the true estimates for the best fit.
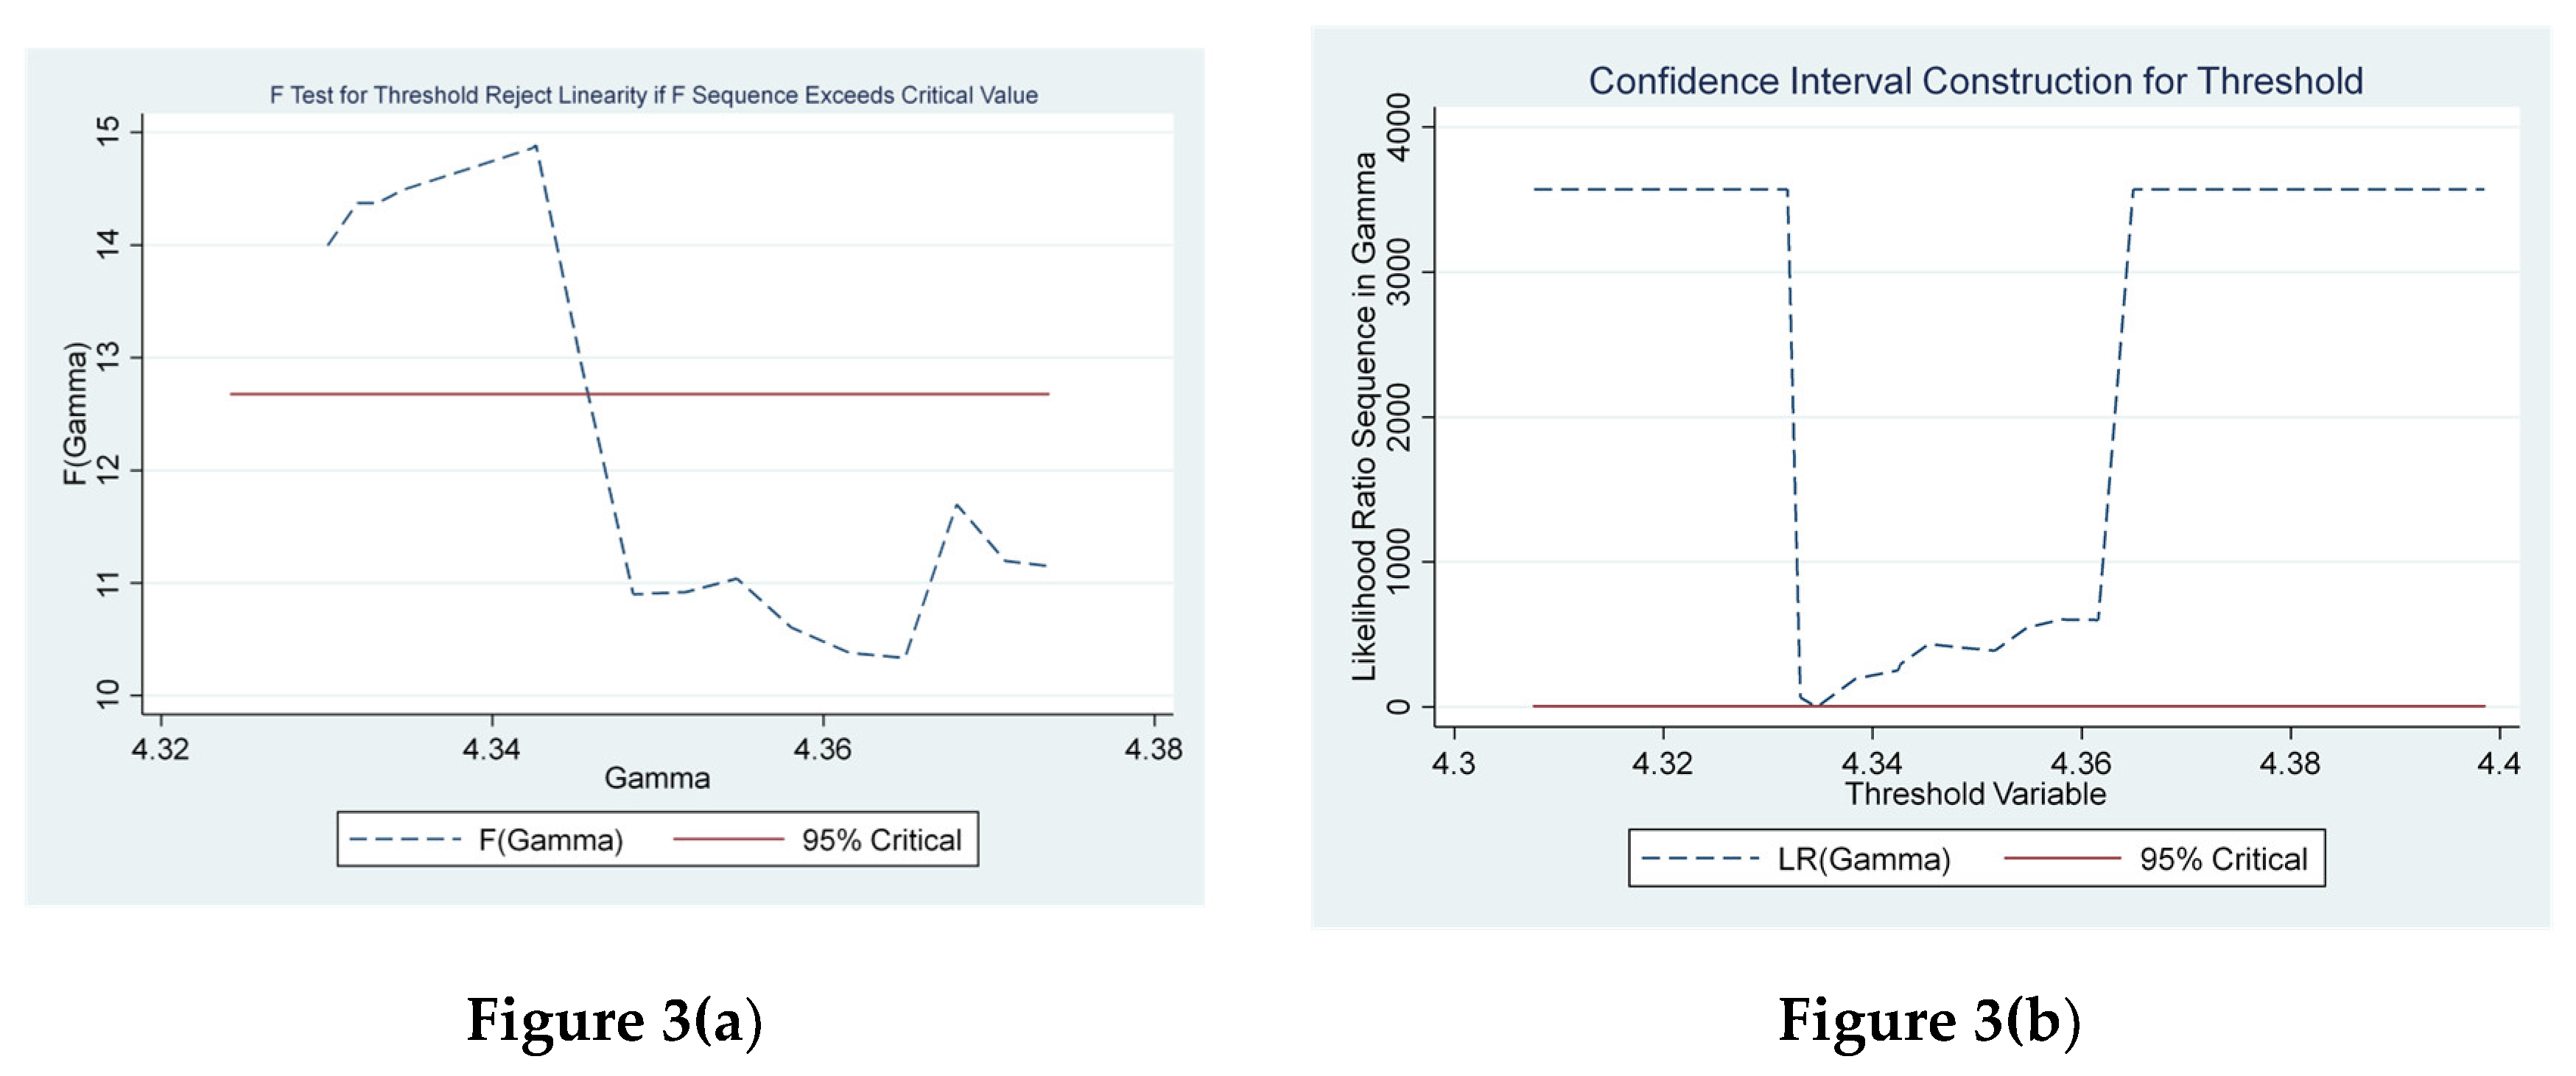
The labor force transformation level is the threshold estimated at the point estimate of the estimated likelihood ratio intersects t at zero-point on the horizontal axis in Figure 3(b), corresponding to the threshold parameter at 4.34%, which also corroborates the threshold estimation presented in Table 4, below.
5. Discussion
In this section, we discuss the major findings of the article. Using the maximum-likelihood approach to investigate the nexus between the transition to renewable energy consumption and China’s economic prosperity. The finding revealed a long-run relationship between the transition to renewable energy consumption and China’s economic prosperity. Consequently, Hypothesis 1 is confirmed.
When the R&D critical level is below 0.65% the impact of the estimated coefficient of renewable energy consumption transition is -0.724, and the effect on China’s prosperity is negative and statistically significant at the 1% level. However, when this critical level of R&D expenditure exceeds 0.65%, the impact of the estimated coefficient of renewable energy consumption transition rises to a positive 1.593, and is statistically significant at a 1% level. Consequently, Hypothesis 2 is confirmed.
When the LFP critical level is below 4.34% the impact of the estimated coefficient of renewable energy consumption transition is 2.946, and the effect on China’s prosperity is positive and statistically significant at a 1% level. However, when the critical level of R&D expenditure exceeds 4.34%, the impact of the estimated coefficient of renewable energy consumption transition declines to a negative 1.593, and is statistically significant at a 1% level. Consequently, Hypothesis 3 is confirmed.
6. Conclusions
In conclusion, this article investigates the asymmetric effect of renewable energy on China’s economic prosperity using time series analysis over the period 1996-2022. Using the maximum-likelihood estimation and the threshold regression analysis as an empirical strategy, we have found overwhelming evidence to support and respond to the fundamental research questions in this article.
To achieve China’s dual target goal in the pursuit of its economic prosperity through accelerating the transition to renewable energy consumption often results not without certain cost implications. Rarely, an accelerated transition to renewable energy may likely result to have a negative impact on the Chinese economic prosperity when some growth factors are below a certain threshold, as predicted from the outcome of this article.
The policy implications of accelerated transition to renewable energy consumption, promoting a sustained investment in R&D expenditure and labor force transformation, China’s future share of its GDP on R&D and LFP will be maintained at least above 0.68% and 4.34%, respectively. Considering the findings from this article, we believe that promoting investment in R&D and LFP would have a positive impact on China’s economic prosperity in the long run. In the short run, revisiting some of China’s existing policies could possibly distort the optimal allocation of resources to achieve its desired dual carbon target trajectory before 2030.
Future research direction should focus on other fundamental factors that could likely promote accelerated transition to renewable energy consumption transformation. Given much concern on exploring the asymmetric impact of FDI and TOP in the nexus between renewable energy consumption and China’s economic prosperity will be a significant topic for future research.
Author Contributions
Conceptualization, I.A.A. and M.M.; methodology, I.A.A.; software, I.A.A.; validation, I.A.A. and M.M.; investigation, I.A.A.; resources, M.M.; data curation, I.A.A.; writing—original draft preparation, I.A.A.; writing—review and editing, M.M.; visualization, I.A.A.; supervision, M.M.; project administration, I.A.A.; funding acquisition, M.M. All authors have read and agreed to the published version of the manuscript.
Funding
This research was funded by the projects of talent recruitment of GDUPT under the Grant no XJ2022000901.
Institutional Review Board Statement
Not applicable.
Informed Consent Statement
Not applicable.
Data Availability Statement
The raw data supporting the conclusions of this article will be made available by the authors on request.
Acknowledgments
The authors would like to acknowledge the support provided by the projects of talent recruitment of GDUPT under Grant Number XJ2022000901
Conflicts of Interest
The authors declare no conflicts of interest.
Abbreviations
The following abbreviations are used in this manuscript:
| TOP | Trade openness |
| GCF | Gross capital formations |
| R&D | Research and Development |
| SDGs | Sustainable Development Goals |
| LFP | Labor force participation |
| FDI | Foreign direct investment |
| REW | Renewable energy consumption |
| ADF | Augmented Dickey Fuller |
| PP | Phillip Parron |
| OPEC | Organization of the Petroleum Exporting Countries |
| BRICS | Brazil, Russia, India, China, and South Africa |
| OECD | Organisation for Economic Co-operation and Development |
Appendix A
Appendix A.1

Table A1.
Data description.
| Variables | Symbols | Definition | Source |
| Economic growth | prosperity | Annual % growth rate of GDP constant 2015 | WDI |
| Renewable energy consumption | rew | Renewable energy consumption is the share of renewable energy in total final energy consumption. | WDI |
| Trade openness | top | Trade (% of GDP) | WDI |
| Foreign direct investment | fdi | Net inflows (% of GDP) | WDI |
| Gross capital formation | gcf | Gross capital formation (% of GDP) | WDI |
| Labor force | lfp | Labor force participation rate, total (% of total population ages 15–64) | WDI |
| Research and development expenditure | r&d | Research and development expenditure (% of GDP) | WDI |
References
- K. M. Park, N. Liew, S. Pattnaik, A. O. Kures, and E. Pinsky, “Exploring the Transition to Low-Carbon Energy: A Comparative Analysis of Population, Economic Growth, and Energy Consumption in Oil-Producing OECD and BRICS Nations,”. Sustain., 2025, 17, 1–24.
- Q. Jia et al., “Harnessing hydrogen energy storage for renewable energy stability in China: A path to carbon neutrality,”. Int. J. Hydrogen Energy, 2025, 118, 93–101. [CrossRef]
- Y. He and P. Huang, “Exploring the Forms of the Economic Effects of Renewable Energy Consumption: Evidence from China,”. Sustain., 2022, 14, 1–16.
- J. Nie, J. Shen, and X. Ren, “Digital Infrastructure, New Digital Infrastructure, and Urban Carbon Emissions: Evidence from China,” Atmosphere (Basel)., vol. 16, no. 2, 2025.
- I. A. Abdulqadir, “Urbanization, renewable energy, and carbon dioxide emissions: a pathway to achieving sustainable development goals (SDGs) in sub-Saharan Africa,”. Int. J. Energy Sect. Manag., 2024, 18, 248–270. [CrossRef]
- A. Abdulqadir, “CO2 emissions policy thresholds for renewable energy consumption on economic growth in OPEC member countries,”. Int. J. Energy Sect. Manag., 2023, 17, 1074–1091. [CrossRef]
- A. G. Olabi and M. A. Abdelkareem, “Renewable energy and climate change,”. Renew. Sustain. Energy Rev., 2022, 158, 112111. [CrossRef]
- X. Shi and D. Shi, “Impact of Green Finance on Renewable Energy Technology Innovation: Empirical Evidence from China,” Sustain., vol. 17, no. 5, pp. 1–19, 2025.
- H. Zhao, H. Zhao, X. Han, Z. He, and S. Guo, “Economic growth, electricity consumption, labor force and capital input: A more comprehensive analysis on North China using panel data,” Energies, vol. 9, no. 11, pp. 1–21, 2016.
- macrotrends, “China’s GDP Growth Rate,” 2025. [Online]. Available: https://www.macrotrends.net/global-metrics/countries/chn/china/gdp-growth-rate. [Accessed: 06-Aug-2025].
- Z. U. Rahman, Y. Chen, and A. Ullah, “Assessment of the causal links between energy, technologies, and economic growth in China: An applicatiaon of wavelet coherence and hybrid quantile causality approaches,”. Appl. Energy, 2025, 377, 124469. [CrossRef]
- Y. Xie and B. Lin, “Financial leasing and China’s renewable energy firms’ investment behavior: In the context of government subsidy reduction,”. Renew. Sustain. Energy Rev., 2025, 214, 115547. [CrossRef]
- M. Imran, M. S. Alam, Z. Jijian, I. Ozturk, S. Wahab, and M. Doğan, “From resource curse to green growth: Exploring the role of energy utilization and natural resource abundance in economic development,” Nat. Resour. Forum, vol. 49, no. 2, pp. 2025–2047, May 2025.
- S. Wu et al., “The Effect of Labor Reallocation and Economic Growth in China,” Sustain., vol. 14, no. 7, 2022.
- S. Qi and Y. Li, “Threshold effects of renewable energy consumption on economic growth under energy transformation,” Chinese J. Popul. Resour. Environ., vol. 15, no. 4, pp. 312–321, 2017.
- C. Chen, M. Pinar, and T. Stengos, “Renewable energy consumption and economic growth nexus: Evidence from a threshold model,” Energy Policy, vol. 139, no. December 2019, p. 111295, 2020.
- S. Han, D. Peng, Y. Guo, M. U. Aslam, and R. Xu, “Harnessing technological innovation and renewable energy and their impact on environmental pollution in G-20 countries,” Sci. Rep., vol. 15, no. 1, pp. 1–16, 2025.
- V. Moutinho and M. Madaleno, “Does economic sectorial diversification affect the relationship between carbon emissions, economic growth, energy consumption, coal and gas consumption? Evidence from OPEC countries using panel cointegration analysis,”. Energy Reports, 2022, 8, 23–28. [CrossRef]
- I. A. Abdulqadir, “Growth threshold-effect on renewable energy consumption in major oil-producing countries in sub-Saharan Africa: a dynamic panel threshold regression estimation,”. Int. J. Energy Sect. Manag., 2021, 15, 496–522. [CrossRef]
- M. Musah, Y. Kong, I. A. Mensah, S. K. Antwi, and M. Donkor, “The link between carbon emissions, renewable energy consumption, and economic growth: a heterogeneous panel evidence from West Africa,” Environ. Sci. Pollut. Res., no. 2017, 2020.
- A. A. Alfalih, “Assessing the impact of green technological innovation and human capabilities on renewable energy supply: Evidence from the top-greenest countries,” Sustain. Energy Technol. Assessments, vol. 73, no. November 2024, 2025.
- W. Xinyu, L. Haoran, and K. Khan, “Innovation in technology: A game changer for renewable energy in the European Union?,”. Nat. Resour. Forum, 2025, 49, 1462–1477. [CrossRef]
- Q. Wang, C. Li, and R. Li, “How does renewable energy consumption and trade openness affect economic growth and carbon emissions? International evidence of 122 countries,” Energy \& Environ., vol. 36, no. 1, pp. 187–211, 2025.
- T. H. Chen, H. W. Chang, A. Mikhaylov, and T. Chang, “Revisit energy consumption, economic growth and carbon dioxide emissions links in transition countries using a new developed Quantile_on_Quantile approach,”. Appl. Econ., 2025, 57, 583–599. [CrossRef]
- A. Khan, T. Khan, and M. Ahmad, “The role of technological innovation in sustainable growth: Exploring the economic impact of green innovation and renewable energy,” Environ. Challenges, vol. 18, no. November 2024, p. 101109, 2025.
- S. Chen, C. Paramaiah, P. Kumar, S. Khan, and Q. Haomu, “Toward sustainable tourism: Insights from green financing and renewable energy,” Energy Strateg. Rev., vol. 57, no. January, p. 101618, 2025.
- C. Xia, D. Balsalobre-Lorente, and Q. Raza Syed, “Electricity generation from renewable and non-renewable energy sources in China: The role of environmental policy stringency, FDI, and economic growth,” Energy, vol. 318, no. June 2024, p. 134695, 2025.
- S. Guo and X. Yan, “Investigation of Industrial Structure Upgrading, Energy Consumption Transition, and Carbon Emissions: Evidence from the Yangtze River Economic Belt in China,” Sustain., vol. 17, no. 10, 2025.
- M. J. Herrerias, R. Joyeux, and E. Girardin, “Short- and long-run causality between energy consumption and economic growth: Evidence across regions in China,”. Appl. Energy, 2013, 112, 1483–1492. [CrossRef]
- L. Fei, S. Dong, L. Xue, Q. Liang, and W. Yang, “Energy consumption-economic growth relationship and carbon dioxide emissions in China,”. Energy Policy, 2011, 39, 568–574. [CrossRef]
- World Bank, “World Development Indicators,” WDI, 2023.
- J. Wang, Z. Tan, and Y. Zuo, “Digital inclusive finance and common prosperity: The threshold effect based on rural revitalization,” Int. Rev. Econ. Financ., vol. 100, no. March, pp. 1–9, 2025.
- C. Wen, Y. Xiao, and B. Hu, “Digital financial inclusion, industrial structure and urban–Rural income disparity: Evidence from Zhejiang Province, China,” PLoS One, vol. 19, no. 6 June, pp. 1–24, 2024.
- Y. Zhang, K. Li, Y. Pang, and P. C. Coyte, “The role of digital financial inclusion in China on urban—rural disparities in healthcare expenditures,” Front. Public Heal., vol. 12, no. August, 2024.
- B. Hansen, “Sample Splitting and Threshold Estimation,”. Econometrica, 2000, 68, 575–603. [CrossRef]
- S. Johamen and K. Jtiselius, “Maximum likelihood estimation and inference on cointegration-with applications to the demand for money,”. Oxf. Bull. Econ. Stat., 1990, 52, 169–210. [CrossRef]
Figure 1.
Renewable Energy Consumption and China’s Economic Prosperity 1996-2022.
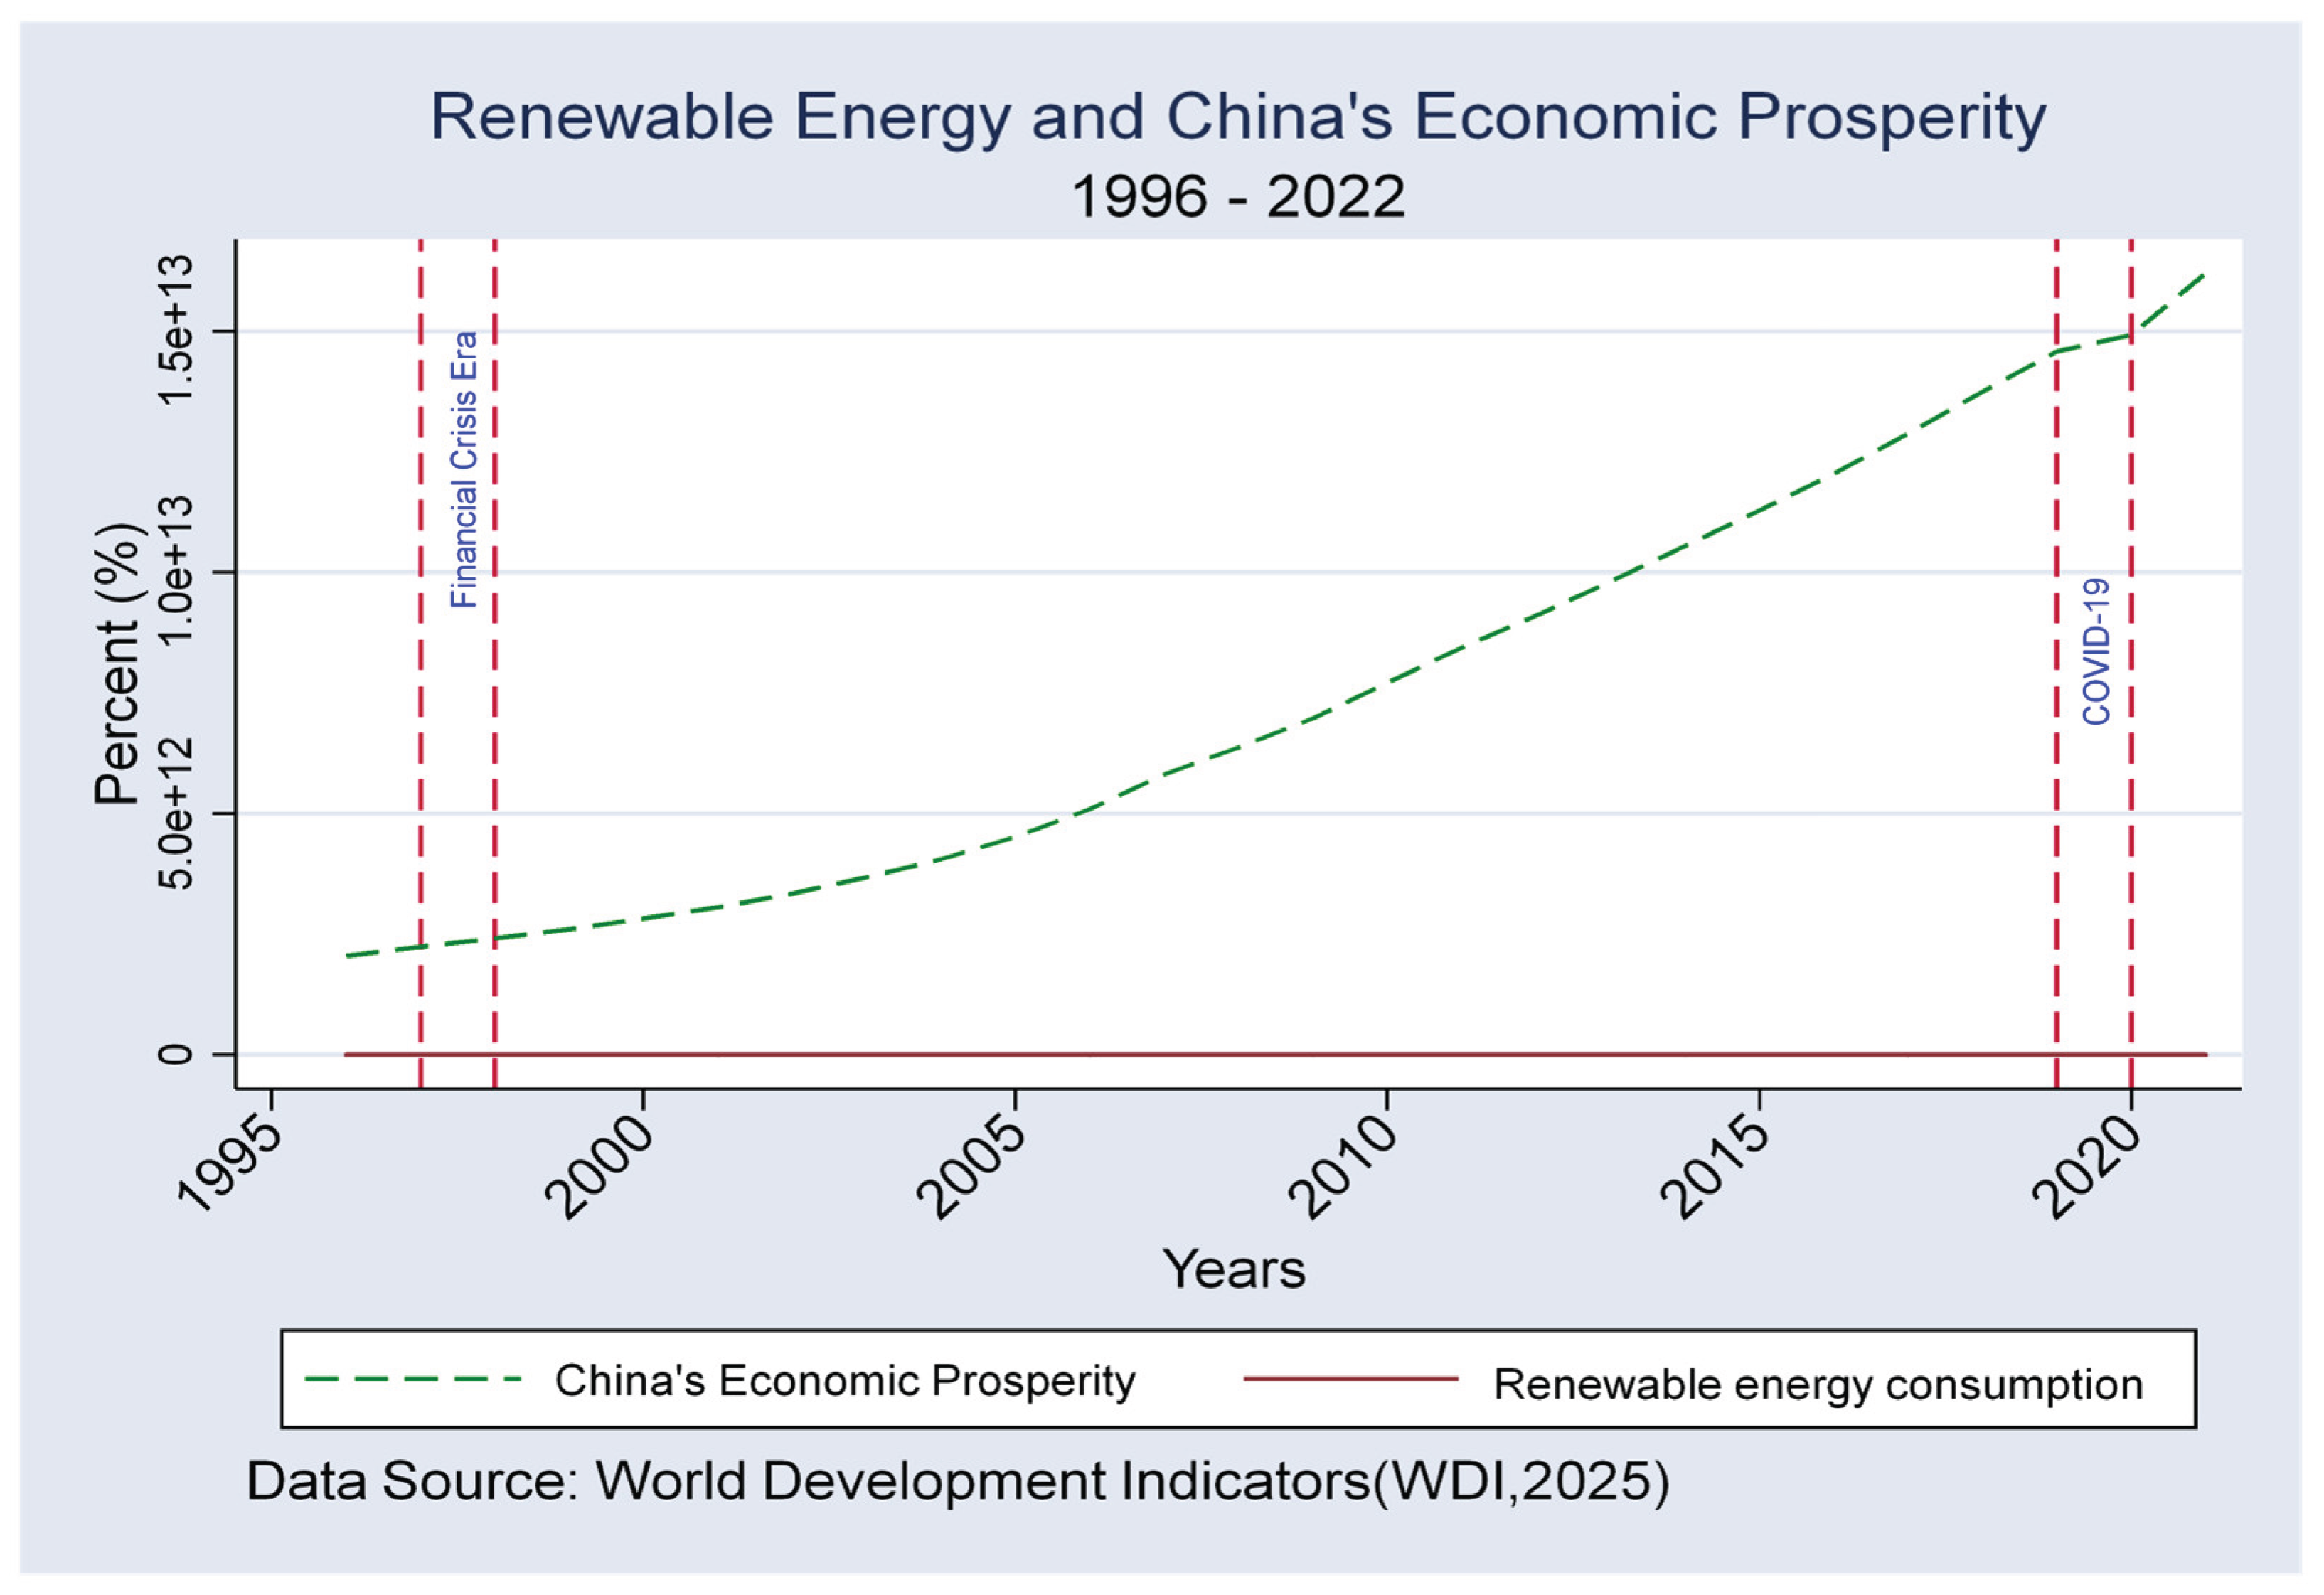
Figure 2.
The graph depicts the likelihood ratio function for the level of investment in R&D expenditure in the nexus between renewable energy consumption transition and economic prosperity. In Figure 2(a), the graph shows the F-statistic test for threshold reject linearity if the sequence exceeds the critical value. In Figure 2(b), the graph shows the meticulous confidence interval construction for the estimated threshold.
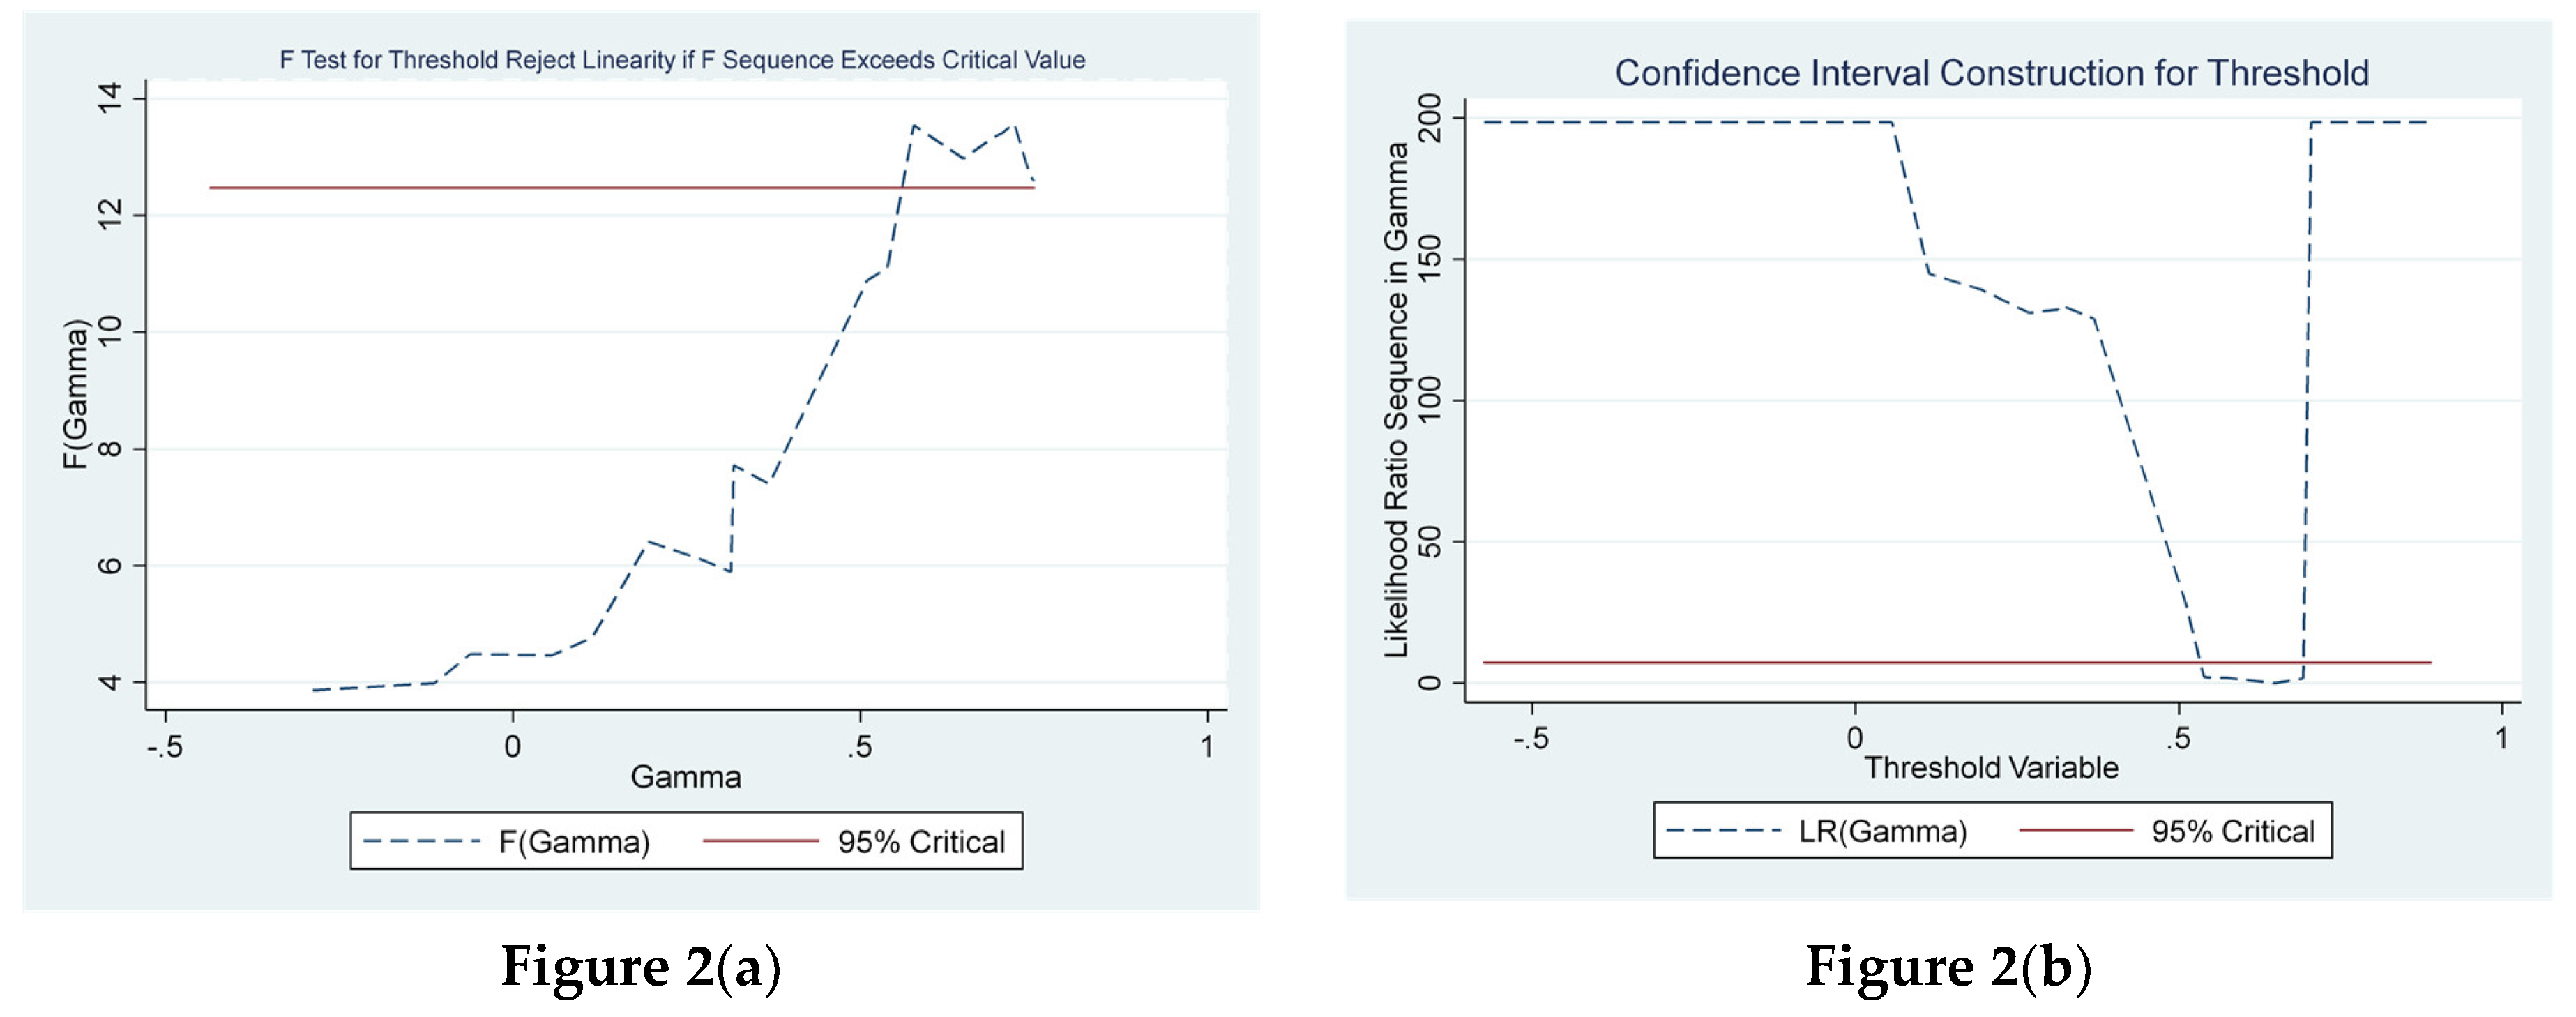
Table 1.
Descriptive statistics. Note: Std Dev. Standard deviation, Min. minimum, Max. maximum, Skew. Skewness, Kurt. kurtosis.
Table 1.
Descriptive statistics. Note: Std Dev. Standard deviation, Min. minimum, Max. maximum, Skew. Skewness, Kurt. kurtosis.
| Variables | Mean | Std. Dev. | Min | Max | Skew. | Kurt. |
| prosperity | 29.454 | 0.669 | 28.348 | 30.416 | -0.171 | 1.656 |
| rew | 2.847 | 0.370 | 2.425 | 3.418 | 0.535 | 1.652 |
| top | 3.759 | 0.216 | 3.471 | 4.152 | 0.455 | 1.897 |
| fdi | 1.072 | 0.409 | 0.251 | 1.547 | -0.717 | 2.214 |
| gcf | 3.659 | 0.114 | 3.442 | 3.786 | -0.668 | 1.998 |
| lfp | 4.351 | 0.024 | 4.308 | 4.399 | 0.346 | 2.283 |
| r&d | 0.344 | 0.444 | -0.574 | 0.889 | -0.645 | 2.232 |
Table 2.
Results of preliminary statistical estimation.
| Variables | prosperity | rew | top | fdi | gcf | lfp | r&d | |
| Panel I: Unit root test | ||||||||
| ADF test (level) | -2.617 (0.089) |
-1.888 (0.338) |
-1.257 (0.649) |
-1.223 (0.663) |
-1.711 (0.425) |
-2.157 (0.222) |
-3.683 (0.004) |
|
| PP test (level) | -1.917 (0.323) |
-1.573 (0.497) |
-1.446 (0.559) |
-1.116 (0.708) |
-1.695 (0.433) |
-2.653 (0.082) |
-4.849 (0.000) |
|
| ADF test (first difference) |
-3.174 (0.026) |
-3.483 (0.041) |
-3.530 (0.007) |
-5.580 (0.000) |
-3.657 (0.004) |
-7.952 (0.000) |
-4.079 (0.001) |
|
| PP test (first difference) |
-3.110 (0.041) |
-3.487 (0.040) | -3.517 (0.007) |
-5.645 (0.000) |
-3.670 (0.004) |
-7.896 (0.000) |
-4.084 (0.001) |
|
| Panel II: Cointegration test | ||||||||
| Trace statistics | Critical values 5% | Max-eigen value | Critical values 5% | |||||
| R=0 | 347.948 | 124.24 | 175.489 | 45.28 | ||||
| R≤1 | 172.459 | 94.15 | 81.866 | 39.37 | ||||
| R≤2 | 90.593 | 68.52 | 35.116 | 33.46 | ||||
| R≤3 | 55.477 | 47.21 | 26.679* | 27.07 | ||||
| R≤4 | 28.798* | 29.68 | 14.668* | 20.97 | ||||
| R≤5 | 14.131* | 15.41 | 9.897* | 14.07 | ||||
| R≤6 | 4.233 | 3.76 | 4.233 | 3.76 | ||||
| Panel III: Pairwise Correlation Matrix | ||||||||
| prosperity | 1.000 | -0.883* | -0.009 | -0.813* | 0.883* | -0.979* | 0.978* | |
| rew | 1.000 | -0.322* | 0.519* | -0.951* | 0.867* | -0.907* | ||
| top | 1.000 | 0.425* | 0.312* | -0.057 | 0.149* | |||
| fdi | 1.000 | -0.566* | 0.794* | -0.749* | ||||
| gcf | 1.000 | -0.887* | 0.928* | |||||
| lfp | 1.000 | -0.984* | ||||||
| r&d | 1.000 | |||||||
Note: p-value shown in parentheses; ∆ difference operator.
Table 3.
Results threshold effect test.
| Threshold effect test | Research & Development Expenditure (R&D) | Labor Force Participation (LFP) |
|---|---|---|
| Test of Null of No Threshold Against Alternative of Threshold. | ||
| Number of Bootstrap Replications: | 5000 | 5000 |
| Trimming Percentage: | 0.15 | 0.15 |
| Threshold Estimate: | 0.648 | 4.342 |
| LM-test for no threshold: | 13.586 | 14.887 |
| Bootstrap P-Value: | 0.017 | 0.005 |
Table 4.
Result threshold estimation.
| Threshold estimation | Research & Development Expenditure (R&D) | Labor Force Participation (LFP) | ||
| Panel A | Panel B | |||
| DV: prosperity | Regime1 
|
Regime2
|
Regime1
|
Regime2
|
| Threshold parameter | 0.65% | 0.65% | 4.34% | 4.34% |
| Intercept |
93.460*** (5.242) |
10.205** (7.562) |
28.355*** (0.653) |
33.969*** (1.044) |
| rew |
-0.724*** (0.067) |
1.593*** (0.051) |
2.946*** (0.208) |
-0.779*** (0.073) |
| top |
-0.183*** (0.032) |
-0.343*** (0.306) |
0.139*** (0.082) |
-0.237*** (0.038) |
| fdi |
-0.039*** (0.068) |
-0.0311*** (0.0235) |
0.065*** (0.030) |
-0.029*** (0.076) |
| gcf |
-14.012*** (1.219) |
3.646*** (1.348) |
-1.332*** (0.161) |
-0.474*** (0.226) |
| lfp |
-0.092*** (0.150) |
0.361 (0.785) |
--- | --- |
| r&d | --- | --- |
-1.737*** (0.262) |
0.755*** (0.225) |
| Observations: | 26 | 11 | 22 | 20 |
| R2 | 0.9977 | 0.9930 | 0.9981 | 0.9971 |
1Note: ***, **, * significance levels of 1%, 5%, and 10% respectively. Data in parentheses in the above table are standard error values.
Disclaimer/Publisher’s Note: The statements, opinions and data contained in all publications are solely those of the individual author(s) and contributor(s) and not of MDPI and/or the editor(s). MDPI and/or the editor(s) disclaim responsibility for any injury to people or property resulting from any ideas, methods, instructions or products referred to in the content. |
© 2025 by the authors. Licensee MDPI, Basel, Switzerland. This article is an open access article distributed under the terms and conditions of the Creative Commons Attribution (CC BY) license (http://creativecommons.org/licenses/by/4.0/).
Copyright: This open access article is published under a Creative Commons CC BY 4.0 license, which permit the free download, distribution, and reuse, provided that the author and preprint are cited in any reuse.


