
Submitted:
02 September 2025
Posted:
03 September 2025
You are already at the latest version
Abstract
This paper investigates the nonlinear/asymmetric effects of renewable energy transition on sustainable growth in South Asian countries using panel data from 2000 to 2023. The paper utilized a panel threshold regression approach as an empirical strategy. The findings revealed that the renewable energy transition can promote sustainable growth in South Asian countries. The findings also found a significant threshold effect of CO2 emissions 2.38% critical mass, in the nexus between renewable energy transition and sustainable economic growth in South Asian countries. Furthermore, the study revealed complementary threshold effects of access to clean energy and the innovation and urbanization thresholds of 3.37% and 3.21% respectively, in the nexus between renewable energy transition and sustainable economic growth, respectively. Further investigations revealed that the connection between renewable energy transition can significantly drive sustainable development goals (SDGs-8) in South Asian countries.
Keywords:
renewable energy transition
; sustainable growth
; CO2 emissions
; energy access
; SDGs-8
; South Asian economies
1. Introduction
The world has witnessed the accelerated transition to renewable energy and environmental sustainability, but this development has been a mirage for South Asian economies for decades [1,2,3]. However, the renewable energy transition involves shifting from traditional non-renewable energy to renewable energy like wind and solar, driven by rapid transformation and increasing energy security, coupled with regional vulnerability to climate change. Conversely, the region’s energy system is still dependent on traditional fuels, with coal and hydropower accounting for approximately 44% of all energy generation in South Asia, except for India’s recent renewable energy transition landmark[3]. According to the International Energy Agency (IEA) report for 2025, it was revealed that global energy demand in 2024 grew by 2.2%, exceeding the demand for all fuels and innovations [4]. Furthermore, the report also revealed that the growth in energy-related emissions continues to decouple, resulting from global economic growth and rising urbanization are increasing energy demand in general, across South Asian economies in particular, thereby putting more pressure on energy infrastructure. The global increase in carbon dioxide emissions (CO2) has influenced the recent record of global high temperatures. However, a topic on the CO2 emission policy threshold to renewables will be a momentous debate to explore.
Recently, President Donald Trump's tariff policies have exacerbated the challenges as the policy affects Indian’s imports of natural gas (uncompetitive pricing resulted in putting gas out of the power mix), leaving the economy with economic loss from unutilized gas-fired power plants. Perhaps, Trump’s announcement can motivate the governments of these countries to pursue a transition to renewable energy consumption. The fundamental question to ask is: Can renewable energy transitions have the potential to promote sustainable growth in South Asian countries? Qudrat-Ullah [2] discovered the impact of renewable energy targets and policy syndrome in South Asian economies. Murshed et al.[1], unveiled the impact of trade and tourism development on the pathways of transition to renewable energy infrastructures in South Asian economies. Similarly, Rana et al.,[5] found strong evidence of the transition from traditional fuels to the new renewable energy in South Asian countries. Noor et al.[6], discovered the impact of renewable and nonrenewable energy on sustainable development in South Asian countries using autoregressive distributed lag (ARDL) models over the period 1995–2019.
In another strand of literature, Zeb et al. [7] uncovered the impact of renewable energy on deteriorating ecological footprint using a panel quantile regression approach on South Asian countries over the period 1991 to 2022. Miao et al. [8] uncovered the impact of fossil fuels, not only harming sustainable growth but also exhibiting negative spatial spillover effects on panel data of South Asian countries over the period 2000–2020. Rahman et al. [9] unveiled the effect of population growth and economic growth on renewable energy and environmental sustainability using the STIRPAT model on panel data of South Asian countries over the period 1972–2021. Hassan et al. [10] revealed the influence of urbanization and trade openness on renewable energy consumption in South Asia using panel data from 1990 to 2018. Zulfiqar et al. [11] uncovered the impact of FDI and innovation on renewable energy in South Asian countries using Fully Modified and Dynamic Ordinary Least Squares models on panel data over the period 2000 to 2021. Given the divergent views presented above, it is worthwhile investigating the renewable energy transition and sustainable growth in South Asian countries.
Considering studies beyond South Asian countries, Triki et al. [12] discovered the link between renewable energy transition and sustainable development of the Ha’il region using time series analysis from 2002 to 2023. Raihan et al. [13]unveiled the impact of FDI and globalization on the renewable transition in Mexico using time series analysis spanning from 1970 to 2022. Wang et al. [14] uncovered the impact of renewable energy, urbanization, and trade on CO2 emissions and economic growth in a panel of 122 countries over the period 1998 to 2018. Imran et al. [15] found strong evidence of energy transition, resource curse, and economic development in Brazil, Russia, India, China, and South Africa (BRICS) countries over the period from 1991 to 2022. Chen et al. [16] uncovered the nexus between green finance and renewable energy and sustainable tourism using panel data from 30 provinces in China from 2005–2023. In another similar study, Rahman et al. [17] found strong evidence supporting the long-run relationship between energy transition, innovation, and economic growth in China. Shi and Shi[18] discovered the significant threshold effect of innovation and green finance on renewable energy transition in a Chinese province from 2013-2022. Almulhim et al. [19] discovered the institutional impact of renewable energy on carbon emissions in BRICS from 1996-2022. It is apparent and glaring to observe that the impact of the renewable energy transition on economic growth has diverged beyond the South Asian economies.
Conversely, the renewable energy transition does affect South Asian sustainable growth. Whether this impact was observed or not, it would not provide the policymakers and economists with appropriate policy tools unless they prescribe an inflection point in the nexuses investigated. In this article, we have found overwhelming evidence of the presence of an inflection point along the nexus between renewable energy transition on sustainable economic growth in South Asian countries using a dynamic threshold regression approach, and a gap in the literature. Considering the literature gap, the study presents the testable hypotheses supporting the major study findings as follows:
Hypothesis 1: The renewable energy transition can promote sustainable economic growth.
Hypothesis 2: When the impact of the CO2 emissions level is below or above a certain threshold, its effect on the renewable energy transition in South Asia may change from positive to negative or vice versa.
Hypothesis 3: When the impact of access to clean energy and technology is below or above a certain threshold, its effect on the renewable energy transition in South Asia may change from positive to negative or vice versa.
Hypothesis 4: When the impact of urban population growth is below or above a certain threshold, its effect on the renewable energy transition in South Asia may change from positive to negative or vice versa.
Departing from the perspective advanced in the above debate, it is pertinent to observe that the present study is not the same as the previous studies in terms of views, perspectives, periodicity, and methods, considering the nexus between renewable energy transition and sustainable economic growth in South Asian economies. The topic is still open to further debate as the effect of asymmetry information in the nexus between renewable energy transition and sustainable economic growth has not received the exhaustive scholarly attention it deserves, and has limited coverage in the literature. However, the objective of this study is to explore the asymmetric/threshold effect of CO2 emissions on the nexus between renewable energy transition and sustainable growth in South Asian countries. Next, the data and empirical strategy supporting the findings of this article are presented in the forthcoming section.
2. Data and Methods
2.1. The Data
This study utilizes panel data on South Asian countries (including Bangladesh, Bhutan, India, Maldives, Nepal, and Sri Lanka ) spanning from 2000 to 2023, sourced from the World Bank Development Indicators (WDI)[20], spanning the period 2000-2023. A detailed description of all variables is provided in Appendix Table A1.
2.2. Definition of Variables
2.2.1. Dependent variable
Sustainable growth (sustainability), the study utilized an annual growth rate of gross domestic product, an indicator of inclusive and sustainable growth. This variable is supported by the Sustainable Development Goals (SDGs-8).
2.2.2. Independent variable
2.2.3. Threshold variable
The study utilized the following variables: CO2 emissions, access to clean energy, and urban population growth, as threshold variables supported by the literature gap and hypothesis development.
2.2.4. Control Variable
2.2. Model specification
To examine the premise of the testable hypotheses, the study investigates the asymmetric effect of the renewable energy transition on sustainable economic growth in South Asian countries over the period 2000-2023. The study utilized panel data with a model specified as follows.
Where t denotes year; denotes constant; [,] denote estimated coefficients; and random term.
Introducing the threshold investigation in the pertinent model above, we employ the threshold effect test following the approach in Hansen [22,15],[16].
Where denotes constant; [,] denote estimated coefficients; and random term.
Where denotes constant; [,] denote estimated coefficients; below the threshold, while above the threshold and random term.
Where denotes constant; [,] denote estimated coefficients; below the threshold, while above the threshold and random term.
Equally, the models (1-4) presented above are utilized as an empirical strategy modeling the nexuses between renewable energy transition and sustainable growth in South Asia. The next subsection will present the results from the above testable empirical models.
3. Results
Considering the structure of the hypothesis and the models discussed in the preceding sections, this section will explore and present the major findings therein. First, we present the preliminary data analysis to address the statistical prerequisite. Second, we present the short and long-run analysis. Third, the presentation of the benchmark models' results of the dynamic panel threshold effect test and threshold estimation, respectively.
3.1. Stylized facts
Figure 1 presents the visualization of the sustainable growth outcome variables. The quintile distribution of sustainable growth revealed the highest and lowest quintile distribution within the framework of the mean, maximum, and minimum distributive statistics in our sample panel data of South Asian economies. A glossary looks at the box and the whisker plot of renewable energy transition shows the spread of the distributions with Bhutan and Nepal belonging to the highest quintile distribution in renewable energy potentials, followed by Sri Lanka, then Bangladesh and India, while the least is the Maldives. On the other hand, the spread of renewable energy compared to the sustainable growth revealed that India has the highest growth potential, followed by Bangladesh, then Sri Lanka, and others, as renewable energy transformation comes along with an economic cost. This insinuation makes economic sense in light of India’s recent renewable energy transition landmark.
Conversely, access to clean energy and technology boxplot of the quintile distribution revealed the spread of access to clean energy across the region; there is a presence of outliers in the observations. Although the presence of an outlier may likely distort the exact structure of the distributions. Meanwhile, the carbon emissions boxplot shows India has the highest quintile distribution, and Bhutan comes with the lowest quintile distribution of CO2 emissions, a question that calls for a significant policy threshold.
3.2. Preliminary data analysis
3.2.1. Descriptive statistics
Table 1 Panel A, consistent with Figure 1, shows the renewable energy transition and sustainable economic growth in South Asian countries. The trend presentation was strongly supported by their estimated means and standard deviations [3.334; 24.293] and [2.368; 1.412], respectively. Summarily, other variables also exhibit parallel trends as CO2 emissions, Access, Urbanization, and FDI have mean and standard deviations [2.745; 3.725; 3.302, & 3.972] and [2.617; 1.139; 0.328, & 0.955], respectively. The mean and standard deviations of Trade, GCF, and LFP of [3.380; 3.380; 4.000] and [1.553; 1.553; 0.157], respectively.
Table 1, Panel B, the pairwise correlation test results revealed a negative and significant correlation between Sustainability, renewable energy, labor force, and urbanization, while a positive and significant correlation between CO2 emissions, trade, FDI, and GCF, respectively.
3.3. Benchmark model: threshold effect tests and estimations
Following the existing literature by Shi and Shi [8] and Hansen [16], this section will focus on the primary objective of the article by investigating the asymmetric/threshold effect of CO2 emissions along the nexus between renewable energy transition and sustainable growth in South Asian countries.
In Table 3, the threshold effect test for CO2 emissions alongside other complementary variables is presented. It is observed that there is strong evidence of a significant threshold effect test on the following variables: CO2 emissions [CO2=2.38%], access to clean energy[Access=3.37%], and urbanization [urban=3.21%], respectively.
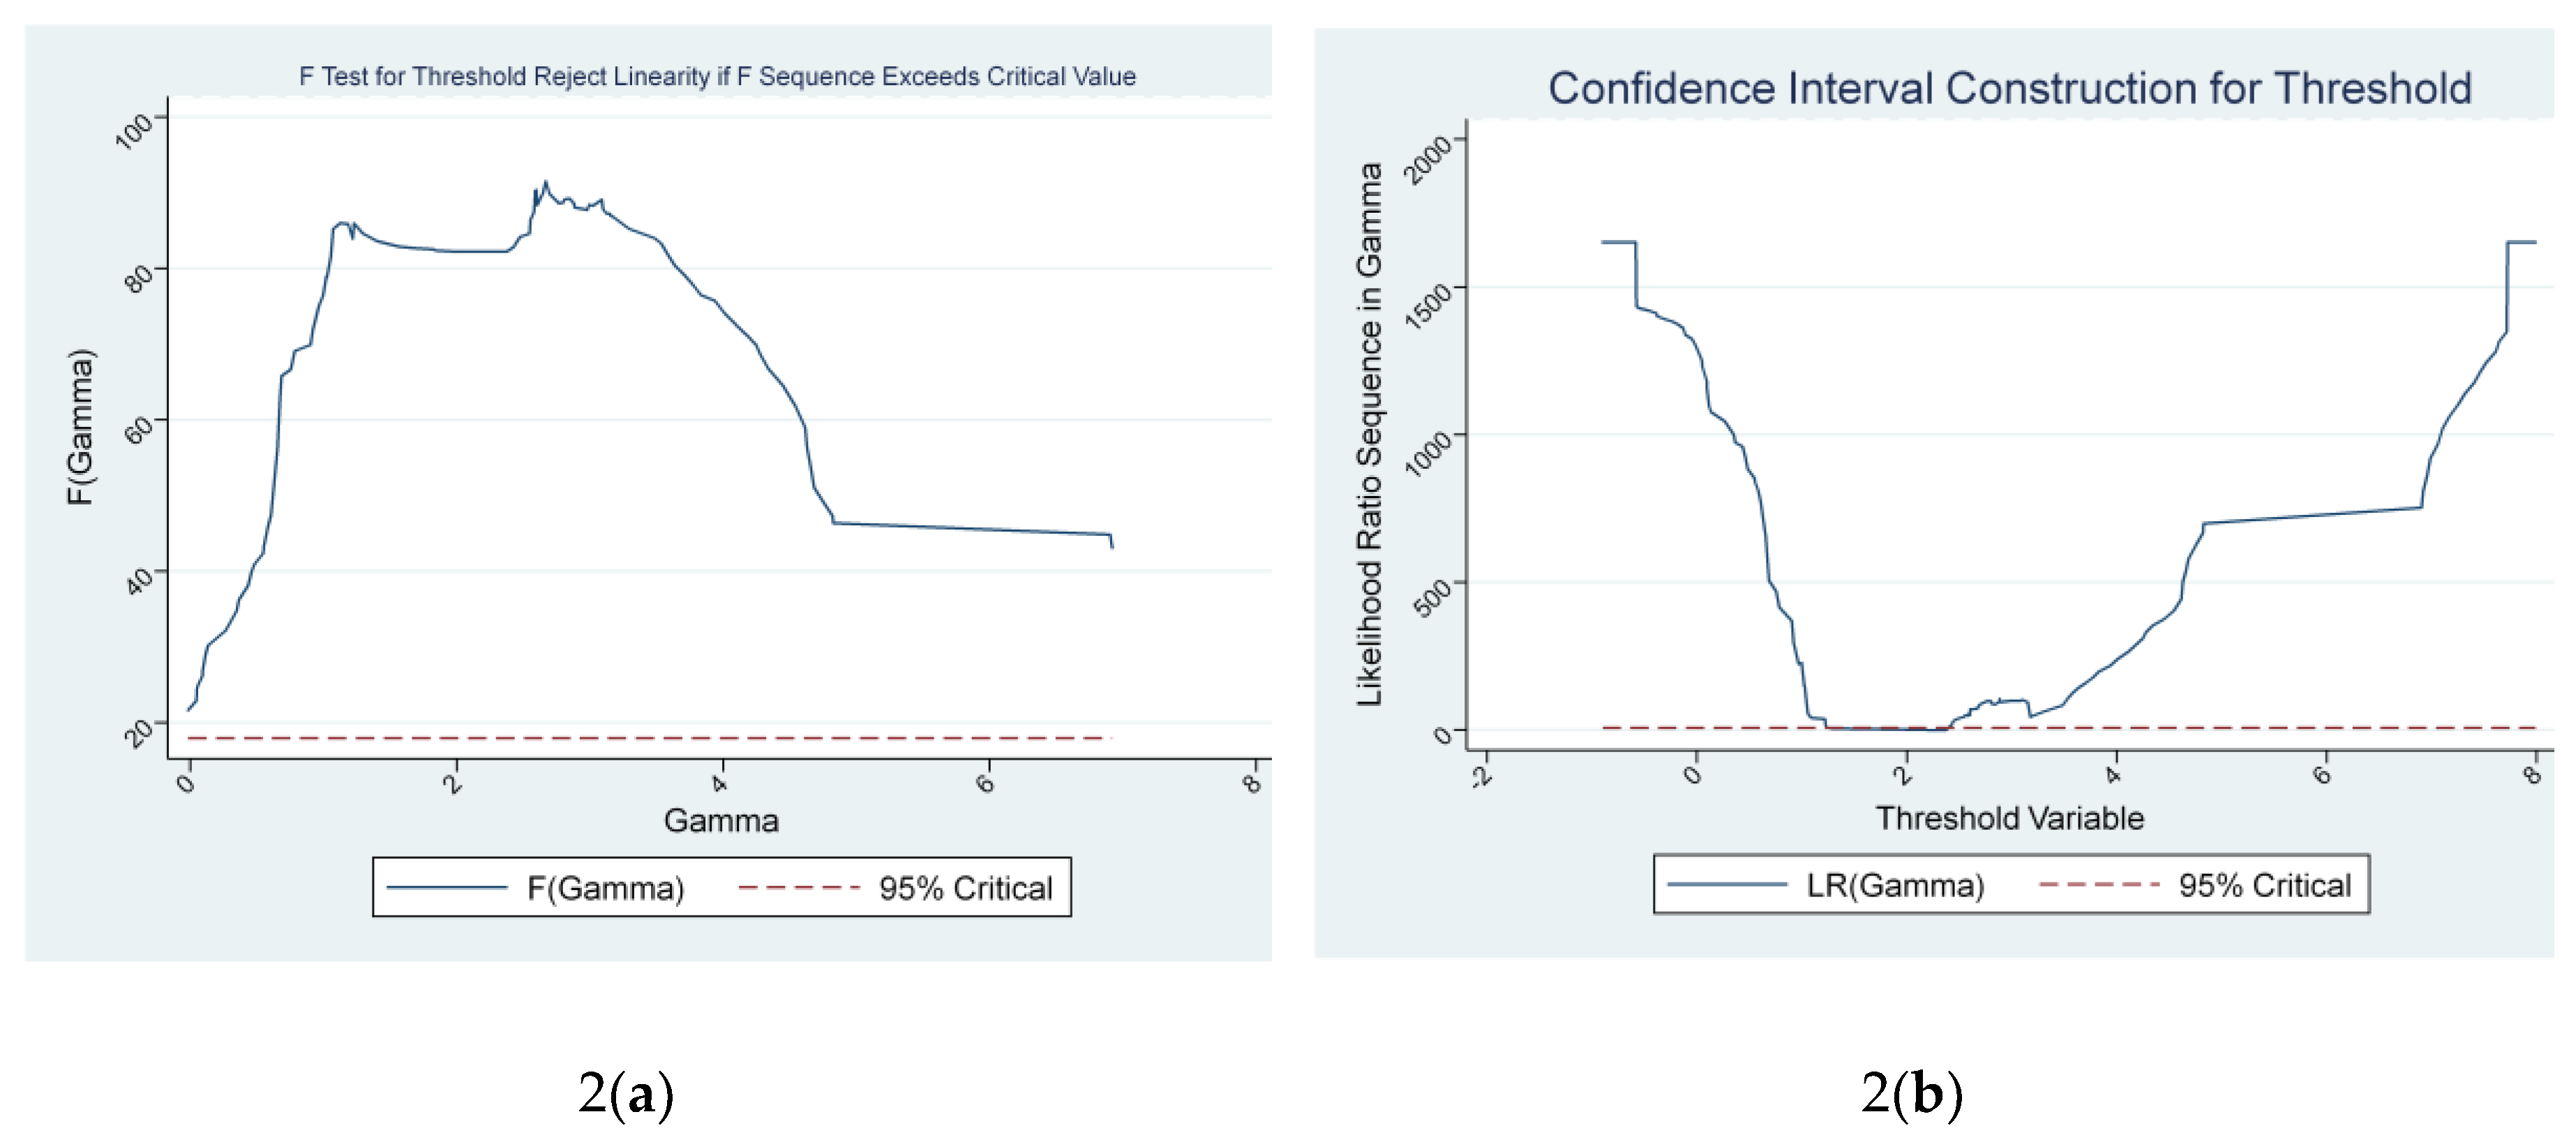
Considering the level of CO2 emissions as a threshold variable, its impact on the level of renewable energy development can either be negative or positive on sustainable growth. In this study, the result from the threshold effect test revealed the existence of a significant threshold estimate of [CO2=2.38%]. Table 4, Panel A, presents the threshold impact estimations of the variables at regime 1 (Below the threshold) and regime 2 (Above the threshold), respectively. Below the threshold, the impact of renewable energy transition on South Asian countries is negative and statistically significant at -0.164, and the impact further declines to a negative and statistically significant -0.217 above the threshold at 1% level.
Figure 2.
The graph depicts the likelihood ratio function for the level of CO2 emissions in the nexus between renewable energy consumption transition and sustainable growth. In Figure 2(a), the graph shows the F-statistic test for threshold reject linearity if the sequence exceeds the critical value. In Figure 2(b), the graph shows the meticulous confidence interval construction for the estimated threshold, and is presented in Panel A, Table 4, below.
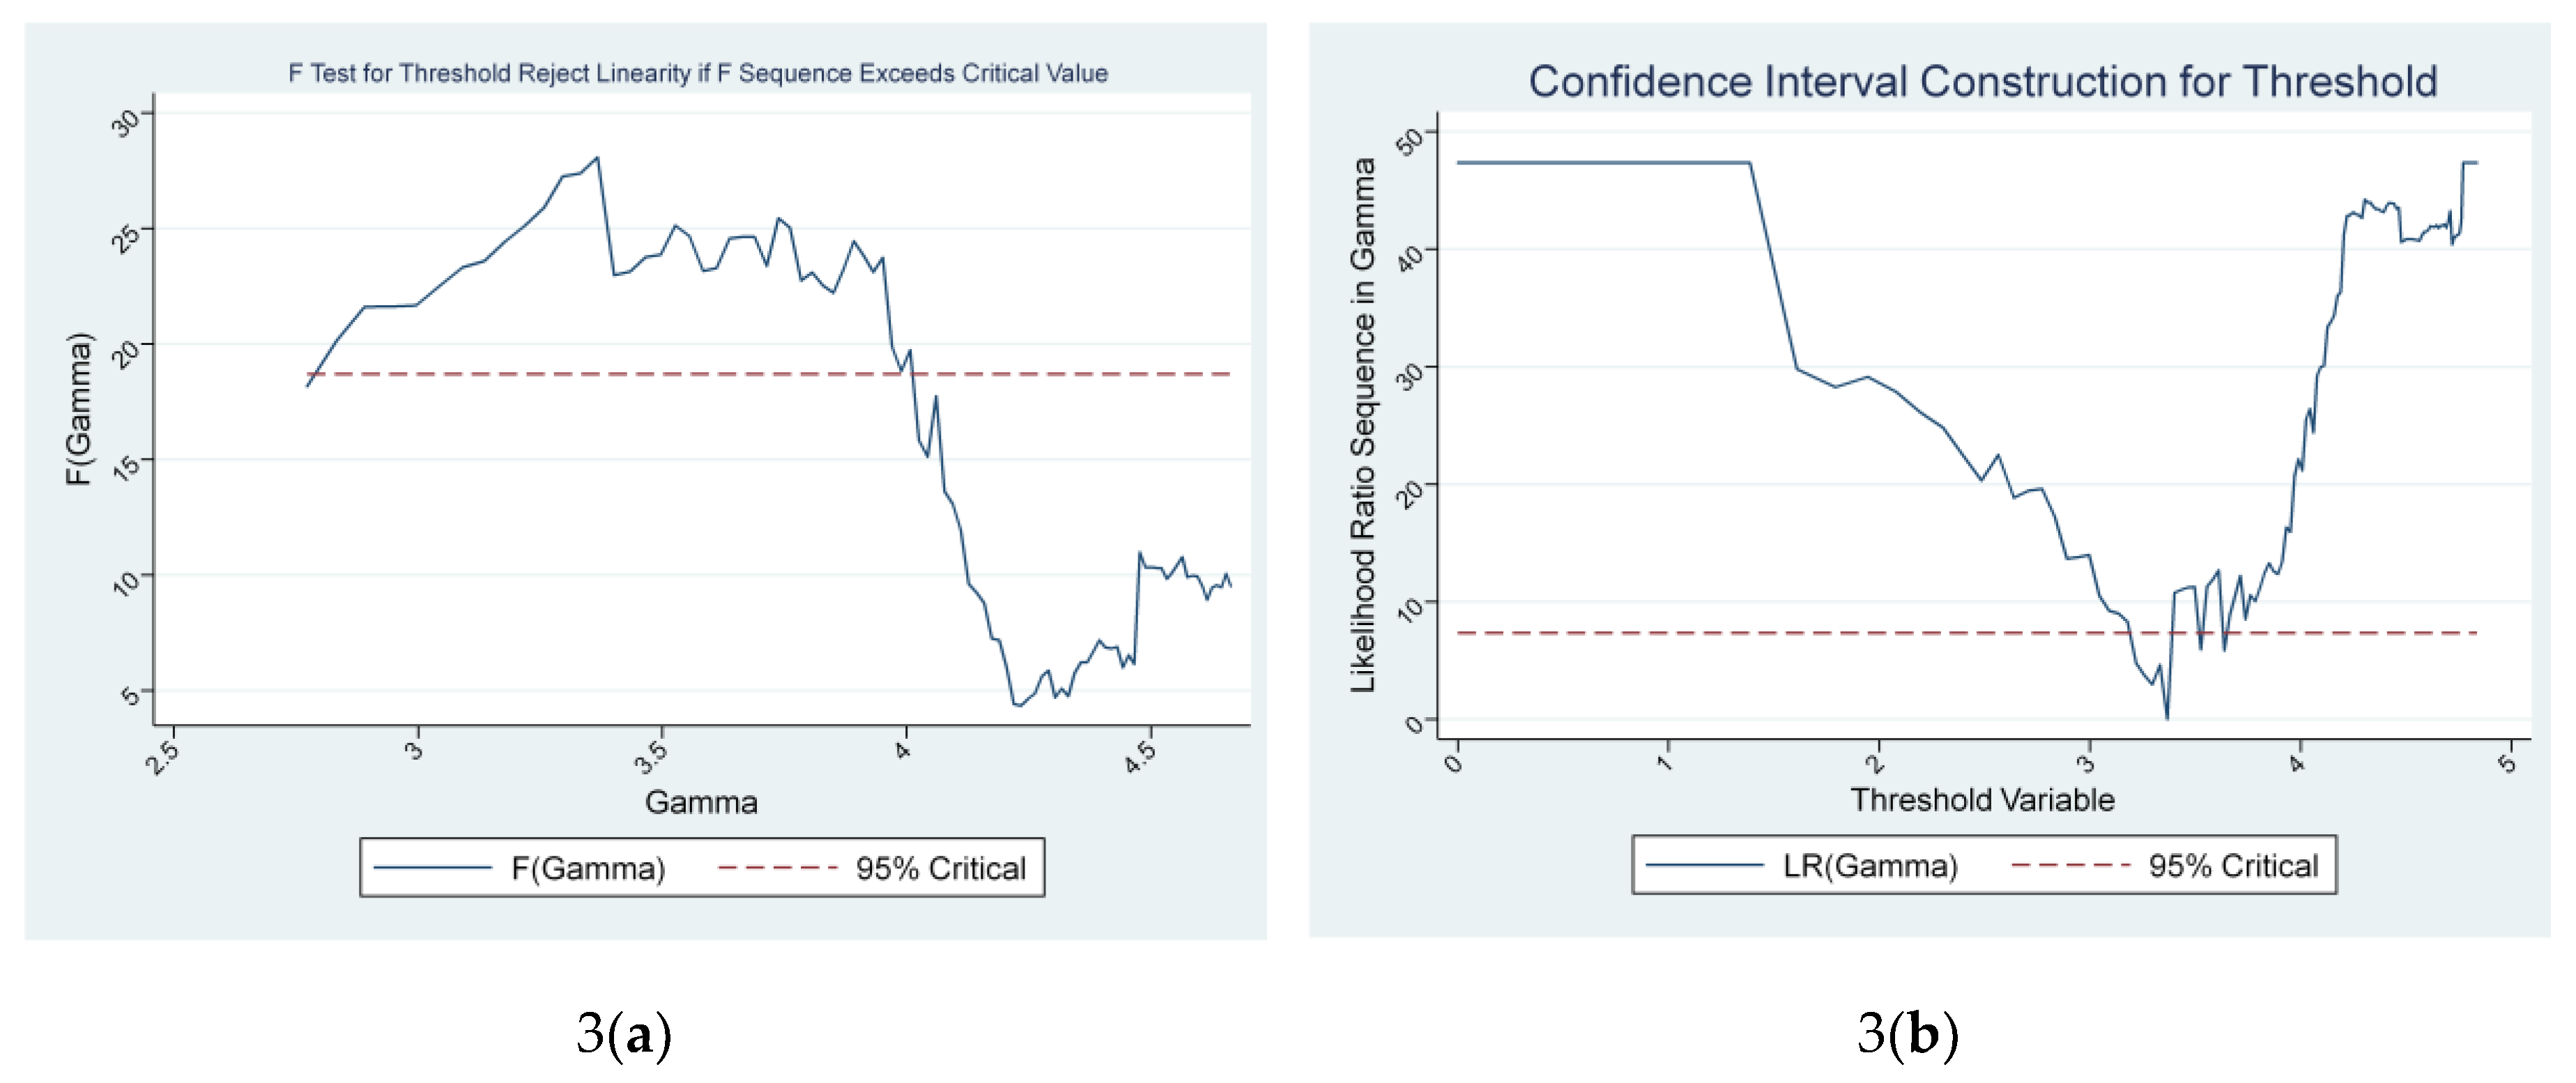
Considering the critical mass of access to clean energy and innovation as a threshold variable. Its impact on the level of renewable energy transition can either be negative or positive on sustainable growth. In this study, the result from the threshold effect test revealed the existence of a significant threshold estimate of [Access=3.37%]. In Table 4, panel B presents the threshold impact estimations of the variables at regime 1 (Below the threshold) and regime 2 (Above the threshold), respectively. Below the threshold, the impact of access to clean energy and innovation is positive 0.062 and not statistically significant, while the impact changes to a negative and statistically significant -0.112 above the threshold at 1% level.
Figure 3.
The graph depicts the likelihood ratio function for the level of access to clean energy and innovation in the nexus between renewable energy consumption transition and sustainable growth. In Figure 3(a), the graph shows the F-statistic test for threshold reject linearity if the sequence exceeds the critical value. In Figure 3(b), the graph shows the exact confidence interval construction for the estimated threshold, and is presented in Panel B, Table 4, below.
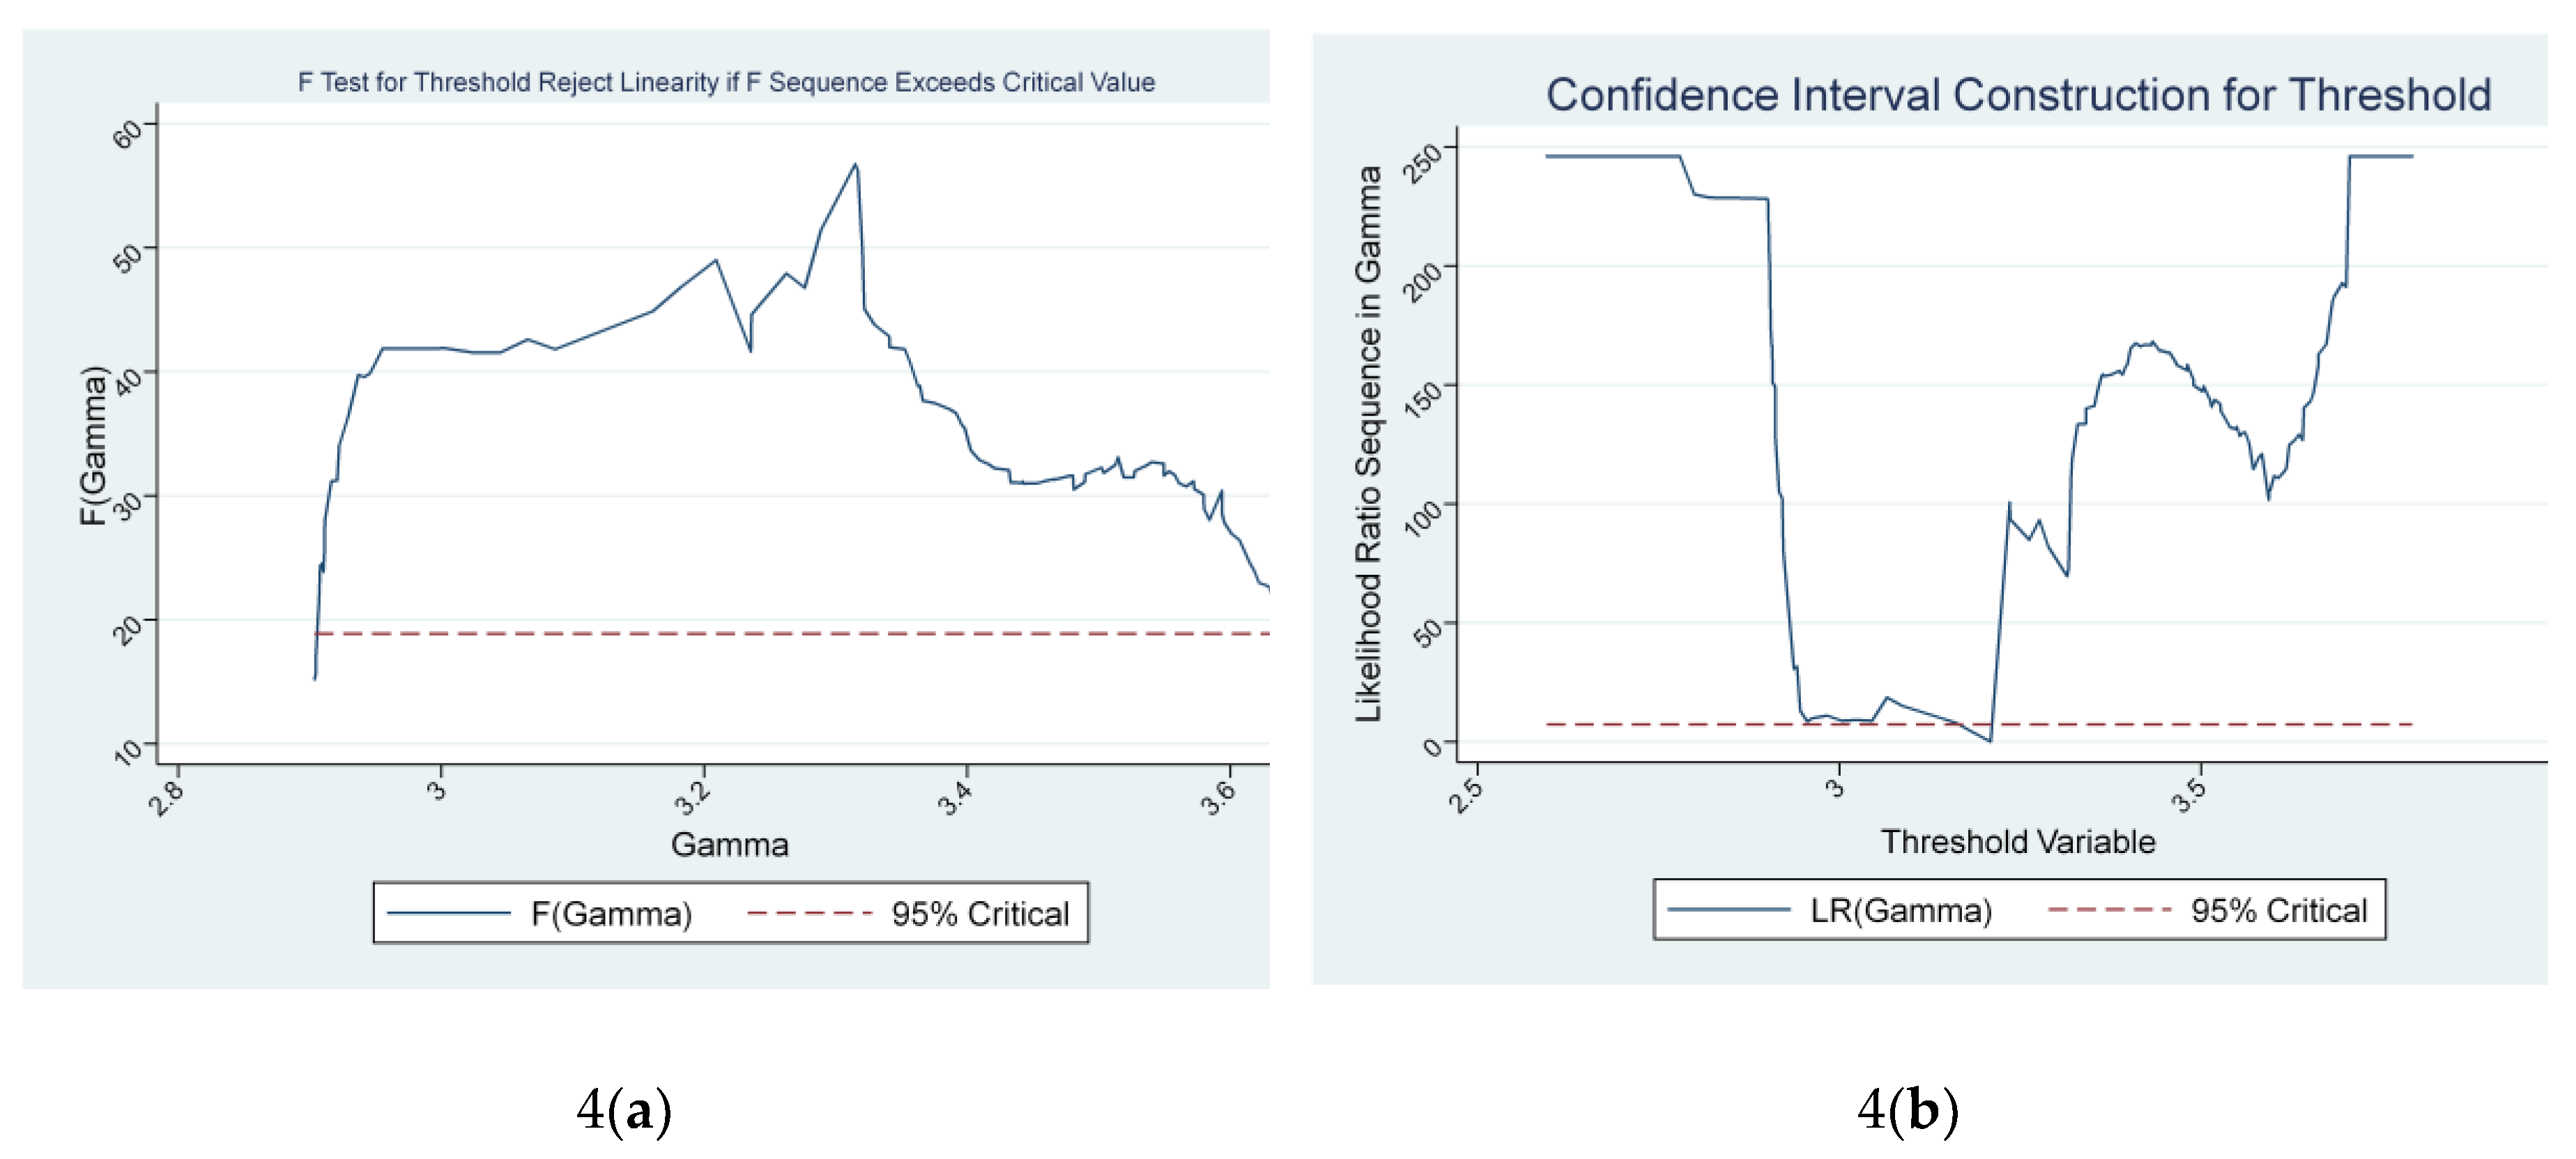
Considering the critical mass of urbanization as a threshold variable. Its impact on the level of renewable energy transition can either be negative or positive on sustainable growth. In this study, the result from the threshold effect test revealed the existence of a significant threshold estimate of [urbanization=3.21%]. In Table 4, Panel C presents the threshold impact estimations of the variables at regime 1 (Below the threshold) and regime 2 (Above the threshold), respectively. Below the threshold, the impact of urbanization is negative -0.096 significant at 1% level, while the impact rises negatively -0.0076, but not statistically significant at above the threshold.
Figure 4.
The graph depicts the likelihood ratio function for the level of urbanization in the nexus between renewable energy consumption transition and sustainable growth. In Figure 4(a), the graph shows the F-statistic test for threshold reject linearity if the sequence exceeds the critical value. In Figure 4(b), the graph shows the exact confidence interval construction for the estimated threshold, and is presented in Panel C, Table 4, below.
4. Discussion
In this section, the major findings of this article are discussed. Using the jointly panel unit root test and dynamic panel threshold regression approach to investigate the long-run relationship between the transition to renewable energy consumption and sustainable growth in South Asian countries. The corroborated findings from the panel unit test and the significant impact of the dynamic panel threshold regression estimates revealed a long-run relationship between the transition to renewable energy consumption and sustainable growth in South Asian countries. Consequently, Hypothesis 1 is confirmed.
When the CO2 emissions critical threshold is below 2.38% the impact of the estimated coefficient of renewable energy consumption transition is -0.164, and the effect on sustainable growth in South Asia is negative and statistically significant at the 1% level. However, when this critical level of CO2 emissions exceeds 2.38%, the impact of the estimated coefficient of renewable energy consumption transition declines to -0.217, and is statistically significant at a 1% level. Consequently, Hypothesis 2 is confirmed.
When the critical level of access to clean energy and innovation is below the threshold of 3.37%, the impact of the estimated coefficient of renewable energy consumption transition is 0.062, and the effect on sustainable growth in South Asia is positive but not statistically significant. However, when the critical level of access to clean energy and innovation exceeds the threshold of 3.37%, the impact of the estimated coefficient of renewable energy consumption transition declines to a negative -0.112, and is statistically significant at a 1% level. Consequently, Hypothesis 3 is confirmed.
When the critical level urban population is below the threshold of 3.21%, the impact of the estimated coefficient of renewable energy consumption transition is -0.096, and the effect on sustainable growth in South Asia is positive and statistically significant at a 1% level. However, when the critical level of urban population exceeds the threshold of 3.21%, the impact of the estimated coefficient of renewable energy consumption transition changes to -0.0076, but is not statistically significant. Consequently, Hypothesis 4 is confirmed.
5. Conclusions
In conclusion, this article investigates the asymmetric effect of renewable energy on sustainable economic growth in six South Asian countries, using panel data analysis over the period 2000-2023. Using panel data and the threshold regression analysis as an empirical strategy, we have found overwhelming evidence to support and respond to the fundamental testable research hypotheses in this article.
To achieve the SDGs in the pursuit of inclusive and sustainable economic growth in South Asian countries, through transition to renewable energy often results not without certain economic cost implications. Rarely, an enhanced transition to renewable energy may likely result in a negative impact on these economies when some fundamental growth indicators are below a certain threshold, as predicted from the outcome of this article.
The policy implications of accelerated transition to renewable energy, promoting sustained growth, the GCF, trade, and FDI shares of gross domestic product will be maintained at least above certain thresholds. Considering the findings from this article, we believe that promoting investment in GCF, trade, and FDI would have a positive impact on the region in the long run. In the short run, revisiting some of the existing policies could possibly distort the optimal allocation of resources to achieve its desired SDGs trajectory before the deadline, 2030.
Future research direction should focus on other fundamental factors that could likely promote sustained transition to renewable energy transformation. Given considerable concern on exploring the asymmetric impact of CO2 emissions, access to clean energy, FDI, and trade in the nexus between renewable energy transition and inclusive economic growth in South Asian countries beyond will be a significant topic for future research.
Author Contributions
Conceptualization, I.A.A., H.S.A., and M.M.; methodology, I.A.A.; software, I.A.A. and H.S.A.; validation, I.A.A. and M.M.; investigation, I.A.A.; resources, M.M. and H.S.A.; data curation, I.A.A.; writing—original draft preparation, I.A.A.; writing—review and editing, M.M. and H.S.A.; visualization, I.A.A. and H.S.A.; supervision, M.M.; project administration, I.A.A.; funding acquisition, M.M. All authors have read and agreed to the published version of the manuscript.
Funding
This research was funded by the projects of talent recruitment of GDUPT under the Grant no XJ2022000901.
Institutional Review Board Statement
Not applicable.
Informed Consent Statement
Not applicable.
Data Availability Statement
The raw data supporting the conclusions of this article will be made available by the authors on request.
Acknowledgments
The authors would like to acknowledge the support provided by the projects of talent recruitment of GDUPT under Grant Number XJ2022000901.
Conflicts of Interest
The authors declare no conflicts of interest.
Abbreviations
The following abbreviations are used in this manuscript:
| SDGs | Sustainable Development Goals |
| BRICS | Brazil, Russia, India, China, and South Africa |
| ARDL | Autoregressive distributed lag |
| IEA | International Energy Agency |
| STIRPAT | Stochastic Impacts by Regression on Population, Affluence, and Technology |
Appendix A
Appendix A.1

Table A1.
Data definition and source.
| Variables | Symbols | Definition | Source |
| Economic growth | sustainability | Annual % growth rate of GDP constant 2015 | WDI |
| Renewable energy consumption | energy | Renewable energy consumption is the share of renewable energy in total final energy consumption. | WDI |
| Access to clean energy | access | Access to clean fuels and technologies for cooking (% of population) | WDI |
| CO2 emissions | emissions | Carbon dioxide (CO2) emissions (total) excluding LULUCF (Mt CO2e) | WDI |
| Urbanization | urban | Urban population (% of people living in urban areas) | |
| Trade openness | trade | Trade (% of GDP) | WDI |
| Foreign direct investment | fdi | Net inflows (% of GDP) | WDI |
| Gross capital formation | gcf | Gross capital formation (% of GDP) | WDI |
| Labor force | labor | Labor force participation rate, total (% of total population ages 15–64) | WDI |
References
- M. Murshed, H. Mahmood, T. T. Y. Alkhateeb, and S. Banerjee, “Calibrating the impacts of regional trade integration and renewable energy transition on the sustainability of international inbound tourism demand in South Asia,” Sustain., vol. 12, no. 20, pp. 1–17, 2020.
- H. Qudrat-Ullah, “A Review and Analysis of Green Energy and the Environmental Policies in South Asia,” Energies, vol. 16, no. 22, 2023.
- S. Lal S R, J. Herbert G M, P. Arjunan, and A. Suryan, “Advancements in renewable energy transition in India: A review,” Energy Sources, Part A Recover. Util. Environ. Eff., vol. 47, no. 2, p. 2024921, Dec. 2025.
- Laura Cozzi, Alex Martinos, and Thomas Spencer, “Global Energy Review 2025,” 2025.
- A. Rana and G. Gróf, “Assessment of the Electricity System Transition towards High Share of Renewable Energy Sources in South Asian Countries,” Energies, vol. 15, no. 3, 2022.
- M. Noor, D. Khan, A. Khan, and N. Rasheed, “The impact of renewable and non-renewable energy on sustainable development in South Asia,” Environ. Dev. Sustain., vol. 26, no. 6, pp. 14621–14638, 2024.
- A. Zeb, N. Shuhai, and O. Ullah, “Navigating sustainability and economic growth: the dual influence of green economic growth and technological innovation on environmental outcomes in South Asia,” Environ. Dev. Sustain., 2025.
- Y. Miao, A. A. Ather Bukhari, W. A. A. Bukhari, S. Ahmad, and N. Hayat, “Why fossil fuels stifle green economic growth? An environmental management perspective in assessing the spatial spillover impact of energy consumption in South Asia,” J. Environ. Manage., vol. 373, p. 123471, 2025.
- M. H. Rahman, L. C. Voumik, S. Akter, and M. Radulescu, “New insights from selected South Asian countries on the determinants of GHG emissions,” Energy Environ., vol. 36, no. 2, pp. 958–978, 2025.
- M. ul Hassan, H. M. A. Siddique, Sumaira, and S. Alvi, “Impacts of industrialization, trade openness, renewable energy consumption, and urbanization on the environment in South Asia,” Environ. Dev. Sustain., 2025.
- M. Zulfiqar, A. Fatima, M. R. Ullah, W. Huo, A. Pervaiz, and S. Ghafoor, “The triple threat: How green technology innovation, green energy production, and financial development impact environmental quality?,” Nat. Resour. Forum, vol. 49, no. 1, pp. 160–176, 2025.
- R. Triki, S. M. Mahmoud, Y. Bahou, and M. M. Boudabous, “Assessing Renewable Energy Adoption to Achieve Sustainable Development Goals in Ha’il Region,” Sustain., vol. 17, no. 13, pp. 1–15, 2025.
- A. Raihan et al., “Dynamic effects of foreign direct investment, globalization, economic growth, and energy consumption on carbon emissions in Mexico: An ARDL approach,” Innov. Green Dev., vol. 4, no. 2, p. 100207, 2025.
- Q. Wang, C. Li, and R. Li, “How does renewable energy consumption and trade openness affect economic growth and carbon emissions? International evidence of 122 countries,” Energy \& Environ., vol. 36, no. 1, pp. 187–211, 2025.
- M. Imran, M. S. Alam, Z. Jijian, I. Ozturk, S. Wahab, and M. Doğan, “From resource curse to green growth: Exploring the role of energy utilization and natural resource abundance in economic development,” Nat. Resour. Forum, vol. 49, no. 2, pp. 2025–2047, May 2025.
- S. Chen, C. Paramaiah, P. Kumar, S. Khan, and Q. Haomu, “Toward sustainable tourism: Insights from green financing and renewable energy,” Energy Strateg. Rev., vol. 57, no. January, p. 101618, 2025.
- Z. U. Rahman, Y. Chen, and A. Ullah, “Assessment of the causal links between energy, technologies, and economic growth in China: An applicatiaon of wavelet coherence and hybrid quantile causality approaches,” Appl. Energy, vol. 377, p. 124469, 2025.
- X. Shi and D. Shi, “Impact of Green Finance on Renewable Energy Technology Innovation: Empirical Evidence from China,” Sustain., vol. 17, no. 5, pp. 1–19, 2025.
- A. A. Almulhim, N. Inuwa, M. Chaouachi, and A. Samour, “Testing the Impact of Renewable Energy and Institutional Quality on Consumption-Based CO2 Emissions: Fresh Insights from MMQR Approach,” Sustain., vol. 17, no. 2, pp. 1–17, 2025.
- World Bank, “World Development Indicators,” WDI, 2023.
- A. Abdulqadir, “Urbanization, renewable energy, and carbon dioxide emissions: a pathway to achieving sustainable development goals (SDGs) in sub-Saharan Africa,” Int. J. Energy Sect. Manag., vol. 18, no. 2, pp. 248–270, 2024.
- B. Hansen, “Sample Splitting and Threshold Estimation,” Econometrica, vol. 68, no. 3, pp. 575–603, 2000.
- A. Abdulqadir, “Growth threshold-effect on renewable energy consumption in major oil-producing countries in sub-Saharan Africa: a dynamic panel threshold regression estimation,” Int. J. Energy Sect. Manag., vol. 15, no. 3, pp. 496–522, 2021.
- A. Abdulqadir, “CO2 emissions policy thresholds for renewable energy consumption on economic growth in OPEC member countries,” Int. J. Energy Sect. Manag., vol. 17, no. 6, pp. 1074–1091, 2023.
- S. Im, M. H. Pesaran, and Y. Shin, “Testing for unit roots in heterogeneous panels,” J. Econom., vol. 115, no. 1, pp. 53–74, 2003.
Figure 1.
The box plot of the determinants across the sampled countries.
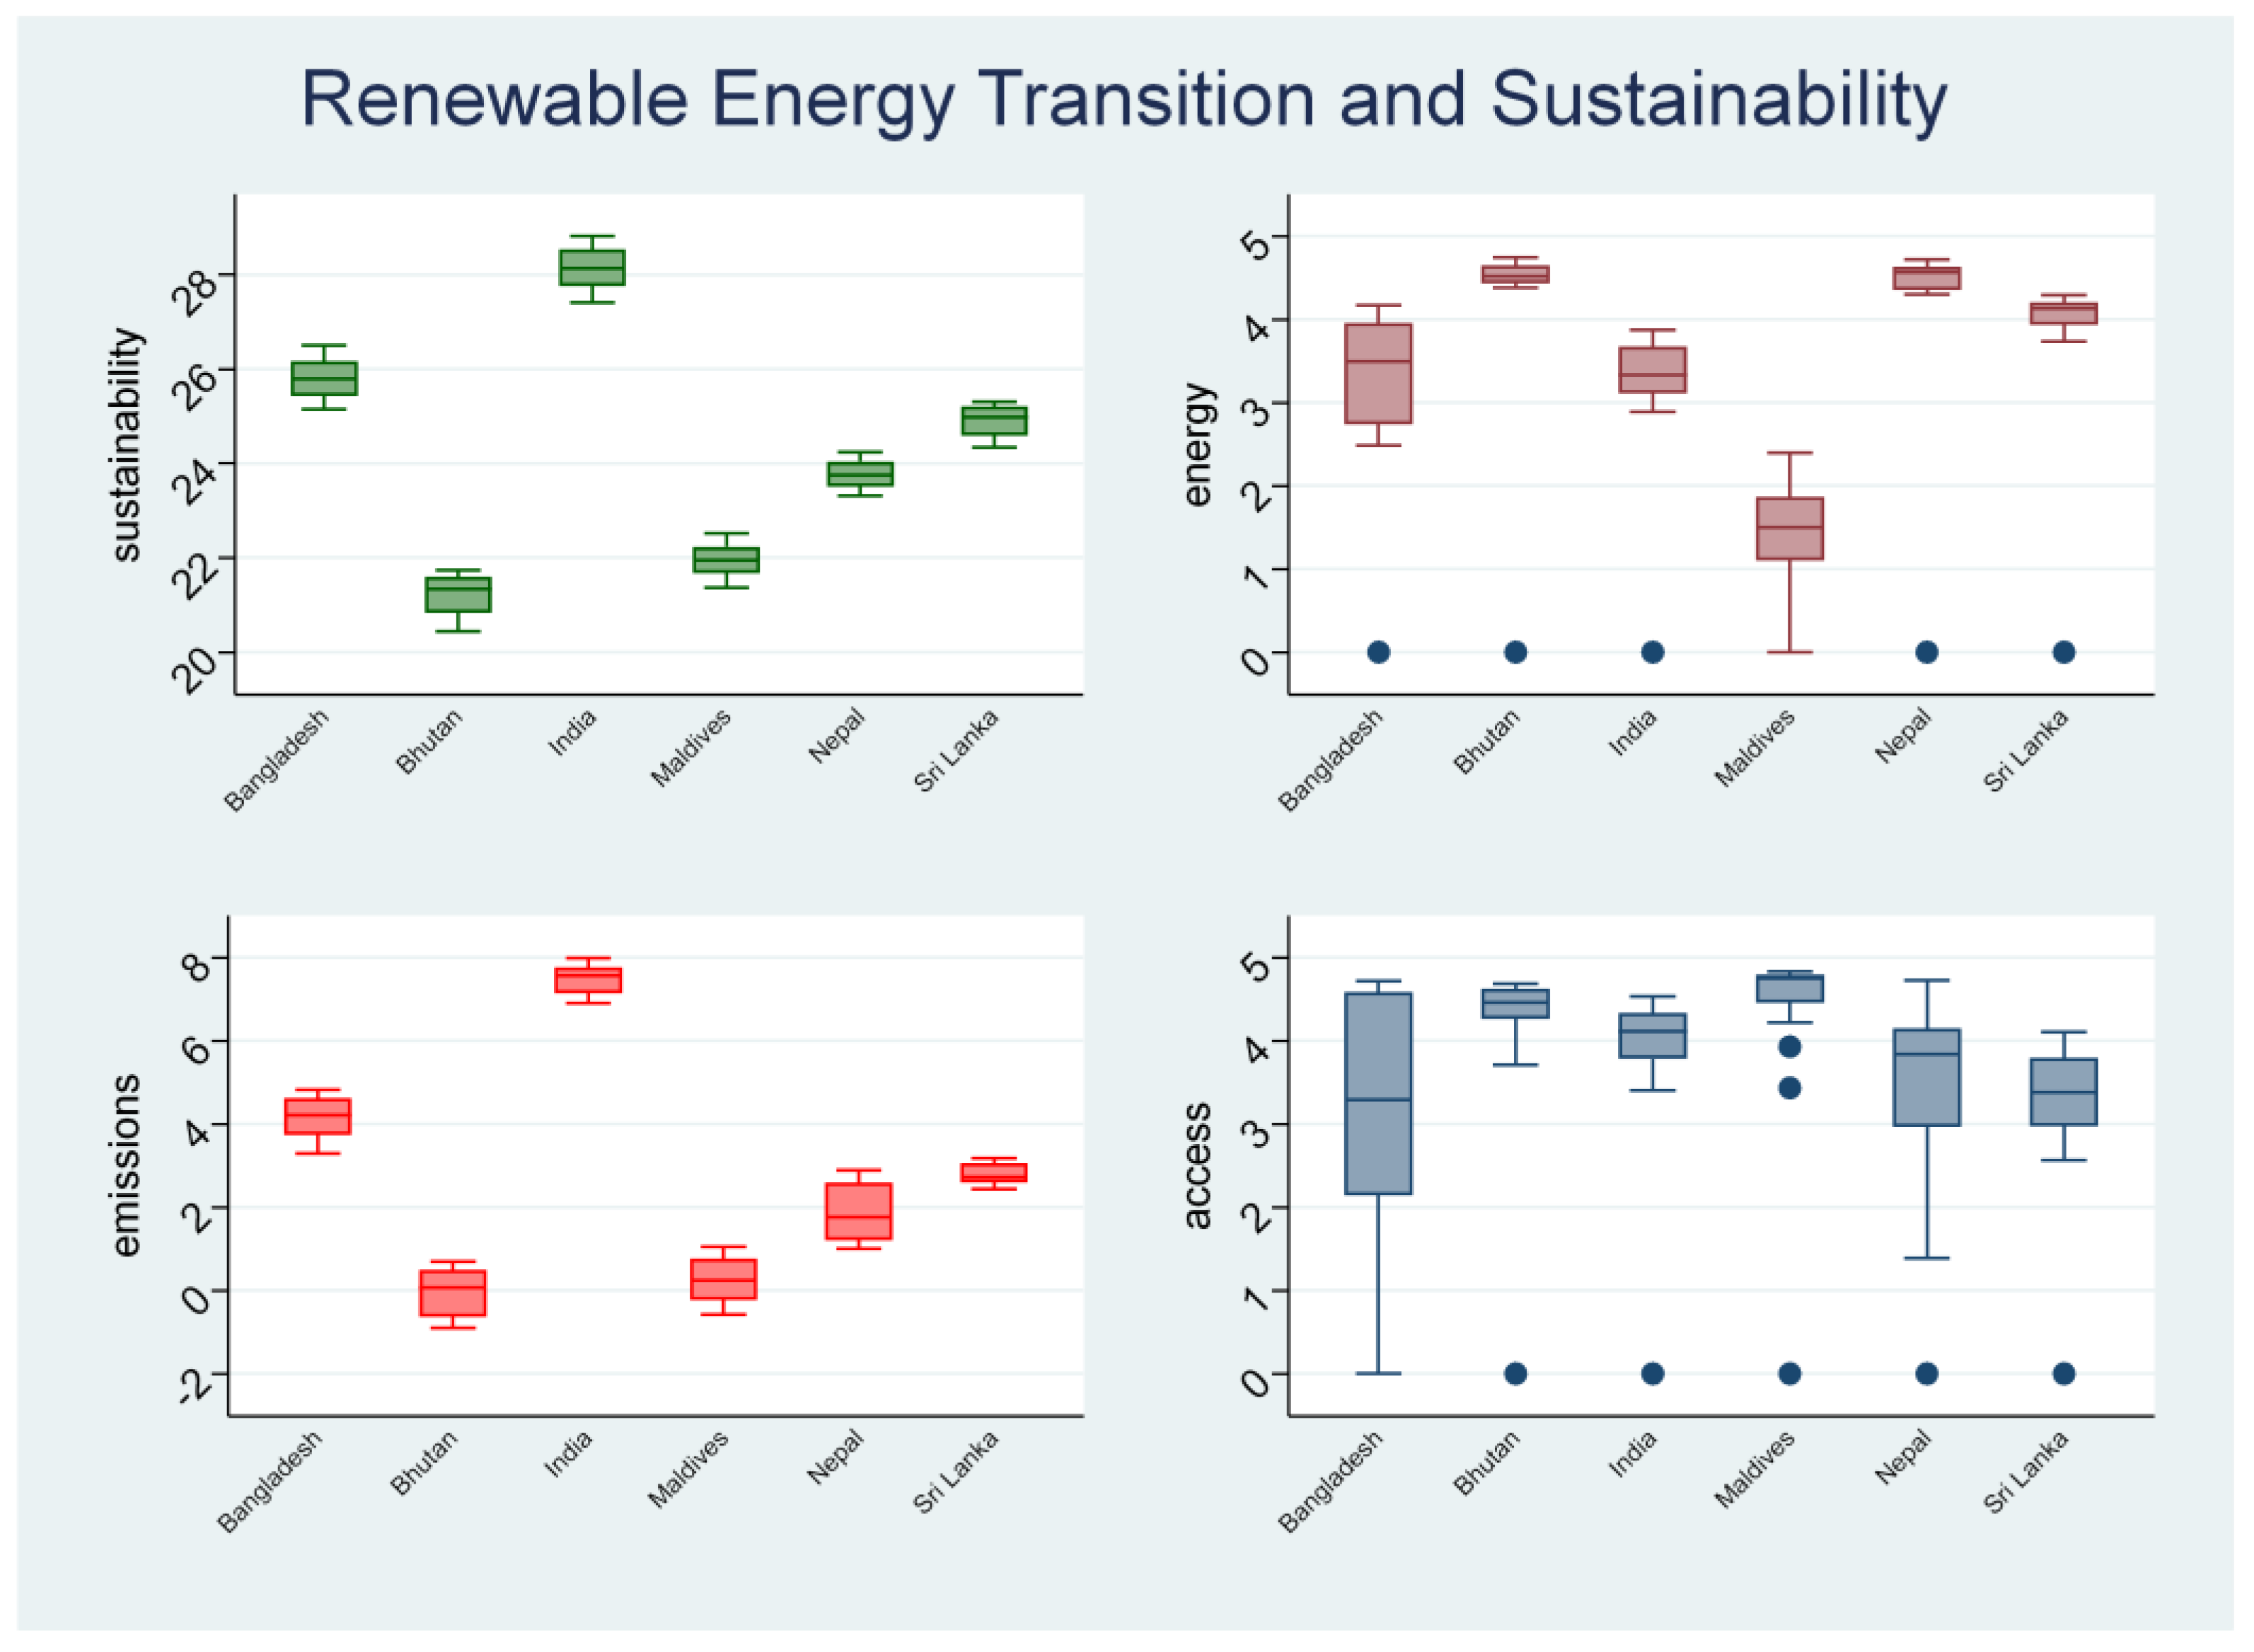
Table 1.
This is a table. Tables should be placed in the main text near to the first time they are cited.
Table 1.
This is a table. Tables should be placed in the main text near to the first time they are cited.
| Variables | Obs | Mean | Std. Dev. | Min | Max | ||||
| Summary descriptive statistics Panel A | |||||||||
| sustainability | 144 | 24.293 | 2.368 | 20.438 | 28.815 | ||||
| energy | 144 | 3.334 | 1.412 | 0 | 4.745 | ||||
| emissions | 144 | 2.745 | 2.617 | -0.898 | 7.991 | ||||
| access | 144 | 3.725 | 1.139 | 0 | 4.836 | ||||
| trade | 144 | 3.380 | 1.553 | 0 | 4.836 | ||||
| fdi | 144 | 3.972 | 0.955 | 0 | 4.963 | ||||
| gcf | 144 | 3.380 | 1.553 | 0 | 4.836 | ||||
| labor force | 144 | 4.000 | 0.157 | 3.674 | 4.246 | ||||
| urbanization | 144 | 3.302 | 0.328 | 2.595 | 3.792 | ||||
| Pairwise correlations Panel B | |||||||||
| (1) | (2) | (3) | (4) | (5) | (6) | (7) | (8) | (9) | |
| (1)sustainability | 1.000 | -0.062* | 0.983* | -0.227* | 0.303* | 0.177* | 0.163* | -0.198* | -0.094* |
| (2)energy | 1.000 | -0.079* | 0.150* | 0.346* | -0.368* | 0.176* | -0.087* | -0.472* | |
| (3)emissions | 1.000 | -0.169* | 0.320* | 0.206* | 0.242* | -0.101* | 0.038 | ||
| (4)access | 1.000 | -0.224* | 0.153* | -0.042 | 0.141* | 0.215* | |||
| (5)trade | 1.000 | -0.382* | 0.705* | -0.103* | -0.220* | ||||
| (6)fdi | 1.000 | -0.165* | 0.311* | 0.381* | |||||
| (7)gcf | 1.000 | 0.221* | 0.202* | ||||||
| (8)labor force | 1.000 | 0.706* | |||||||
| (9)urbanization | 1.000 | ||||||||
| *** p<0.01, ** p<0.05, * p<0.1 | |||||||||
1 Tables may have a footer.
Table 2.
Panel unit root test
| Title 1 | Statistics | P-values | Fixed-N exact critical values | Signs |
| Im, Pesaran & Shin(2003) test | 1% 5% 10% | |||
| sustainability | 2.5909 | 0.9952 | -2.320 -2.080 -1.950 | level |
| -5.4330 | 0.0000 | -2.320 -2.080 -1.950 | ∆ | |
| energy | 4.3742 | 1.0000 | -2.320 -2.080 -1.950 | level |
| -4.9934 | 0.0000 | -2.320 -2.080 -1.950 | ∆ | |
| emissions | 2.0445 | 0.9795 | -2.320 -2.080 -1.950 | level |
| -6.4537 | 0.0000 | -2.320 -2.080 -1.950 | ∆ | |
| access | -0.3173 | 0.3755 | -2.320 -2.080 -1.950 | level |
| -4.9751 | 0.0000 | -2.940 -2.700 -2.580 | ∆ | |
| trade | -1.1088 | 0.1338 | -2.320 -2.080 -1.950 | level |
| -5.8633 | 0.0000 | -2.320 -2.080 -1.950 | ∆ | |
| fdi | -3.4550 | 0.0003 | -2.320 -2.080 -1.950 | level |
| -7.3049 | 0.0000 | -2.320 -2.080 -1.950 | ∆ | |
| gcf | -1.6751 | 0.0470 | -2.320 -2.080 -1.950 | level |
| -5.4439 | 0.0000 | -2.320 -2.080 -1.950 | ∆ | |
| labor force | 2.6363 | 0.9958 | -2.320 -2.080 -1.950 | level |
| -4.2017 | 0.0000 | -2.320 -2.080 -1.950 | ∆ | |
| urbanization | 1.2139 | 0.8876 | -2.320 -2.080 -1.950 | level |
| -4.3541 | 0.0000 | -2.320 -2.080 -1.950 | ∆ | |
* Tables may have a footer.
Table 3.
Results threshold effect test.
| Threshold effect test | CO2 emissions | Access to clean energy | Urbanization |
| Number of Bootstrap Replications: | 5000 | 5000 | 5000 |
| Trimming Percentage: | 0.15 | 0.15 | 0.15 |
| Threshold Estimate: | 2.376 | 3.367 | 3.214 |
| LM-test for no threshold: | 85.355 | 28.084 | 56.750 |
| Bootstrap P-Value: | 0.017 | 0.0004 | 0.037 |
Table 4.
Result threshold estimations.
| Threshold estimation | CO2 emissions | Access to clean energy | Urbanization | |||
| Panel A | Panel B | Panel C | ||||
| DV: Sustainable Growth | Regime1 | Regime2 | Regime1 | Regime2 | Regime1 | Regime2 |
| Threshold parameter | 2.38% | 2.38% | 3.37% | 3.37% | 3.21% | 3.21% |
| Intercept | 45.485*** (0.845) |
7.612** (3.000) |
22.781*** (2.093) |
24.949*** (0.738) |
12.837*** (0.897) |
26.816*** (3.178) |
| Renewable energy | -0.164*** (0.045) |
-0.217*** (0.091) |
0.062 (0.046) |
-0.112*** (0.029) |
-0.096*** (0.035) |
-0.0076 (0.0305) |
| CO2 emissions | --- | --- | 0.963*** (0.035) |
0.896*** (0.011) |
0.295*** (0.050) |
0.893*** (0.0209) |
| Access to clean energy | 0.0549 (0.056) |
-0.286*** (0.091) |
--- | --- | 0.0471 (0.032) |
-0.100** (0.0329) |
| Urbanization | 0.372 (0.260) |
2.922*** (0.403) |
-0.947*** (0.278) |
-1.283*** (0.129) |
--- | --- |
| FDI | -0.064* (0.036) |
1.107*** (0.180) |
-0.069** (0.047) |
0.001 (0.045) |
-0.002 (0.024) |
-0.0189 (0.0443) |
| Trade | -0.009 (0.031) |
-0.241** (0.085) |
-0.120*** (0.036) |
-0.028 (0.025) |
-0.179*** (0.021) |
-0.038* (0.0297) |
| GCF | 0.252*** (0.029) |
0.303** (0.102) |
0.072* (0.040) |
-0.036* (0.022) |
0.159*** (0.026) |
-0.039 (0.0448) |
| Labor force | -6.190*** (0.391) |
0.990 (0.937) |
0.623 (0.665) |
0.413* (0.237) |
2.928*** (0.235) |
-1.091* (0.7861) |
| Degrees of Freedom | 57 | 71 | 28 | 100 | 43 | 85 |
| Observations: | 65 | 79 | 36 | 108 | 51 | 93 |
| R2 | 0.9408 | 0.9930 | 0.9857 | 0.9912 | 0.9502 | 0.9923 |
1Note: ***, **, * significance levels of 1%, 5%, and 10% respectively. Data in parentheses in the above table are standard error values.
Disclaimer/Publisher’s Note: The statements, opinions and data contained in all publications are solely those of the individual author(s) and contributor(s) and not of MDPI and/or the editor(s). MDPI and/or the editor(s) disclaim responsibility for any injury to people or property resulting from any ideas, methods, instructions or products referred to in the content. |
© 2025 by the authors. Licensee MDPI, Basel, Switzerland. This article is an open access article distributed under the terms and conditions of the Creative Commons Attribution (CC BY) license (http://creativecommons.org/licenses/by/4.0/).
Copyright: This open access article is published under a Creative Commons CC BY 4.0 license, which permit the free download, distribution, and reuse, provided that the author and preprint are cited in any reuse.


