
Submitted:
05 February 2025
Posted:
06 February 2025
You are already at the latest version
Abstract
Renewable energy sources are becoming increasingly popular due to their advantages over fossil fuels, their economic benefits, and the growing environmental concerns. Researchers are particularly focused on understanding the factors that affect the efficiency of various energy sources. This paper explores the relationship between renewable energy consumption and trade openness from 1990 to 2018 among the top 15 countries that consume the most renewable energy. The study also considers economic growth, natural resources, capital, and financial globalization as additional factors influencing renewable energy use. To analyze the data, the paper utilizes advanced panel data techniques, including the dynamic Seemingly Unrelated Regression (DSUR) and Dimutrescu-Hurlin panel bootstrap causality methods. The findings reveal cross-sectional dependence and slope heterogeneity in the model. The results show that trade openness, economic growth, and capital investment promote renewable energy consumption, while financial globalization tends to reduce it. Additionally, the study finds one-way causality from trade openness, economic growth, natural resources, capital, and financial globalization to renewable energy consumption. These insights can inform the development of renewable energy policies in the countries examined.
Keywords:
trade openness
; renewable energy consumption
; dynamic SUR
; panel bootstrap causality
1. Introduction
Achieving sustainability across various domains presents a significant challenge for contemporary society. Environmental sustainability is a critical aspect of the Sustainable Development Goals (SDGs) and has increasingly garnered scientific interest in recent year [1]. Globally, nations are integrating efforts to develop sustainable industrial practices and enhance living standards, given that environmental degradation poses a substantial threat to human well-being. Effective management of carbon emissions, in particular, is vital for improving public health and advancing the SDGs [2].
Combatting climate change is a central challenge in attaining sustainable development objectives, impacting both developing and developed nations. Recent statistics indicate that carbon dioxide (CO2) emissions contribute approximately one-third of global greenhouse gas emissions [3]. Remarkably, energy consumption in developed countries has resulted in a 2.5% increase in CO2 emissions. The Paris Agreement mandates reductions in CO2 emissions by transitioning to cleaner and more reliable energy sources, as energy plays a fundamental role in ecological sustainability and long-term development.
The global demand for energy is rising due to population growth, economic expansion, financial system changes, and rapid industrialization. To meet the SDGs, progress in the use of renewable energy is imperative. Green energy sources such as hydro, wind, and geothermal energy are essential for achieving sustainable development. Additionally, renewable energy sources offer several benefits, including widespread availability, fair energy costs, enhanced energy efficiency, resource conservation, and reduced dependence on imported energy.
Countries can meet their energy needs from different sources of energy. For instance, fossil fuels meet a large part of the energy needs of countries and are at imminent risk of becoming depleted in the coming decades. These energy sources are also at the basis of environmental degradation. Because of these factors, governments are rapidly shifting their energy policies to prioritize the use of renewable energy sources. Renewable energy continues to be the main concentration of researchers. Due to their environmental sensitivity, such energy sources can serve the sustainable development of a country by preventing environmental degradation [4]. The use of clean energy sources accelerates growth; encourages technological innovations; and supports financial development [5,6,7]. Due to the decoupling functions from fossil energy sources and macroeconomic effects clean energy sources, many researches intensify on analyzing the key factors underlying renewable energy consumption [8,9,10,11,12].
In this context, an improved financial system could allocate funds for the renewable energy sector at a lower cost, thereby, encouraging the use of clean energy sources. With financial globalization affecting the financial sector, extra funds may turn to renewable energy investments, and the development of this sector may gain momentum [13] . In addition to these variables, some studies present findings that increases in natural resource rents and fixed capital investments positively affect renewable energy consumption [14] .
In the literature, the significance of the environmental effect of economic sustainability has been widely discussed. The fundamental objective of government policy is to promote production and prosperity. However, fast economic expansion always leads to increased exploitation of natural resources. As a consequence, rising global production necessitates more energy, which poses new difficulties for the climate. The reduction of ecological deterioration is generally acknowledged as a critical aspect of attaining sustainable development. In addition, the utilization of natural resources has a considerable impact on environmental quality [15]. The consumption of natural resources may deteriorate the atmosphere and hinder economic growth [14] . Thus, environmemtal quality contributes to achieving sustainability in a country.
Economic growth and advancements in foreign trade are recognized as significant drivers of increased demand for (renewable) energy through the expansion of economic activities. Trade openness plays a crucial role in sustaining production and achieving economic development [16]. Grossman and Krueger [17] elaborate on the effects of trade openness, highlighting its impact on the scale, composition, and technological aspects of production. The scale effect, in particular, suggests that trade openness can boost domestic production and economic growth, leading to higher energy demands. Empirical studies indicate that trade openness may promote the use of renewable energy [18]. Nonetheless, the results from empirical research are often complex and inconsistent. For example, Lin et al. [19] find that trade openness can lead to a reduction in renewable energy consumption, whereas Lu et al. [11] identify a direct positive relationship between trade openness and renewable energy use. These differing findings underscore the need for further research to clarify the relationship between trade openness and renewable energy consumption.
The above panel studies discuss the association among trade openness and renewable energy consumption generally benefit from panel OLS, DOLS, FMOLS, system GMM, PMG, MG and corrected LSDVC estimators, as well as panel Granger and Dumitrescu-Hurlin classical causality test. In empirical analyses, it is seen that dynamic SUR (DSUR) estimators and panel bootstrapping causality tests are not preferred. The most important aspect of our study that differs from the literature is the DSUR estimator, which has privileged characteristics over other techniques, and the Dumitrescu-Hurlin panel bootstrapped causality approach.
The top 15 countries that consume more renewable energy worldwide have been discussed in this study. From 1990 to 2018, the worldwide use of renewable energy increased significantly (Table 1). The best performances are China, USA and Germany with values of 143.50, 103.80 and 47.33 (millione tone of oil equavilant). The consumption of clean energy has remarkably increased in these economies from 1990 to 2018. In 2018, the worldwide use of clean energy was 561.30 (million tons of oil equivalent), while the total value of 15 countries was 466.07 (million tons of oil equivalent). This figure corresponds to 83% of the global total.
Table 1 also shows the total GDP (constant 2015 billions of dollars) figures for the countries sampled in this study. While the total GDP value of 15 countries was 60318 (constant 2015 billion US$) in 2018, the world’s total GDP value was 82510 (constant 2015 billion US$). In parallel with renewable energy consumption and total GDP figures, the total foreign trade figures of 15 countries constitute an important part of the world total. Similarly, renewable energy usage in these nations increased between 1990 and 2018, and the same trend is felt in total GDP and total foreign trade. These developments provide an important motivation for our work. In this context, it also emphasizes the need for further empirical research on the connection among economic growth, foreign trade, and clean energy in these countries.
Based on the aforementioned arguments, this paper raises the following research questions: 1) What is the causal relationship between trade openness and renewable energy consumption (in the top renewable energy-consuming countries)? 2) How do economic growth, natural resources, capital, and financial globalization influence renewable energy consumption? 3) Does financial globalization hinder or promote renewable energy consumption? 4) What policy proposals can be developed in these countries to support the renewable energy sector?
This research makes several notable contributions to the literature. First, it specifically examines the top 15 economies with the highest renewable energy consumption. Second, the study explores the trade-energy relationship by incorporating natural resources, economic growth, capital, and financial globalization as explanatory variables in the model. This comprehensive approach allows for a nuanced assessment of how these factors influence renewable energy use, enabling more informed recommendations for policymakers. Third, the research employs the dynamic Seemingly Unrelated Regression approach for empirical analysis. This method is particularly effective when cross-sectional units are interdependent and the time dimension of the panel exceeds the number of countries, providing robust estimates. Fourth, while the Dumitrescu-Hurlin panel bootstrap causality test is commonly used in empirical research [20], its bootstrap variant is seldom applied. This study includes this advanced version of the test, adding a novel methodological perspective. Finally, the findings confirm that trade openness, economic growth, and capital investment positively impact renewable energy consumption, whereas financial globalization has a negative effect. These insights can help policymakers design more effective and sustainable renewable energy policies in the long term.
The rest of this study is presented as follows: Section 2 discusses the literature review. Section 3 reveals a methodological framework, an empirical model, and data. Section 4 exhibits empirical results. Section 5 dwells on the discussion. Section 6 presents the conclusion, policy implications, limitations, and future research directions.
2. Literature Review
Previous research has shown a significant interest in renewable energy sources. Salim and Rafiq [21] demonstrate that economic growth fosters increased renewable energy consumption. Building on this, Okada and Semreth [22] find that the availability of natural resources enhances the use of renewable energy. Sharma et al. [23] provide evidence that capital formation supports the demand for renewable energy within BRICS economies. Additionally, Ozcan et al. [24] show that globalization promotes renewable energy use in Turkey. Collectively, these studies highlight that factors such as economic growth, trade openness, capital investment, natural resources, and globalization play crucial roles in influencing renewable energy consumption.
2.1. Trade Openness and Renewable Energy Consumption
Trade openness can accelerate economic growth by causing additional resource and capital accumulation [25]. Energy consumption is affected by trade liberalization in a variety of ways, including scale economies and manufacturing variables. In particular, an increase in export demand accelerates energy consumption by stimulating production growth and economies of scale [16]. Developments in trade openness may cause advanced technologies with high energy efficiency to shift from developed countries to developing countries, affecting both economic activities and energy consumption. In addition, when used as fuel in the energy transportation sector, it can also affect the export and import of raw materials and manufactured goods.
Also, research conducted by Jóźwik, Topcu and Dogan [26] confirms these relationships. The study confirms a bidirectional relationship between trade openness and environmental quality. This suggests that while trade openness can lead to increased industrial activities and emissions, it also has the potential to improve environmental outcomes by promoting renewable energy consumption through enhanced technology and standards. Furthermore, Lu et al. [11] conclude that trade openness significantly promotes renewable energy consumption. Contrary to these findings, Lin et al. [19] note that trade openness reduces the consumption of renewable electricity. Jebli and Youssef [27] discover a bidirectional relationship among variables.
2.2. The Other Determinants of Renewable Energy Consumption
Literature shows that economic growth can affect renewable energy consumption. The importance of energy use in the manufacturing of commodities and services is clarified by the growth-hypothesis. This indicates a causal linkage from energy utilization to growth. The conservation hypothesis notes that economic growth causes energy, while the neutrality-hypothesis shows no causality [6].
Natural resources are a crucial factor influencing the utilization of renewable energy. Hossain [28] identifies a significant relationship between renewable energy production and the sustainability of natural resources, noting that revenues derived from natural resources can support renewable energy sustainability. Al-Marhubi [29] contends that renewable energy is primarily produced from natural resources, thereby contributing to natural resource rent. However, Shinwari et al. [30], using quantile regression analysis for China, find that natural resources may actually reduce investments in renewable energy. Conversely, Awijen et al. [31] report an indirect relationship between natural resources and clean energy, while Belaid et al. [32] establish a positive link between these variables. These varied findings underscore the complex interplay between natural resources and renewable energy production.
Domestic investments contribute to the consumption of energy goods. They are being leveraged to generate energy infrastructure. Thus, domestic investments directly and indirectly trigger energy consumption [33]. The significant feature of the renewable energy sector is that it needs more capital due to higher installation and development costs compared to the energy sector using fossil fuels [34] . A capital increase in an economy rises the production and consumption of green energy and also contributes to energy efficiency [23]. Rafindadi and Mikai'lu [35] conclude that capital formation improves clean energy use. Sharma et al. [23] for the UK indicate a direct association among variables that runs from capital formation and growth to energy use.
Foreign direct investments also aid in the consumption of renewable energy. In regions with stringent environmental regulations, FDI tends to support renewable energy consumption by aligning with local standards that favor sustainable practices. This is particularly evident in European countries where FDI is directed towards environmentally friendly projects, supporting the pollution halo hypothesis [36] .
Shahbaz et al. [37] discuss globalization and energy usage in the context of the structure and balance effect. According to the scale effect, globalization provides access to large markets in some economies, causing economies of scale, which increase energy consumption. Whereas, the compositional effect argues that globalization reduces energy consumption because of its effects on the economy. Akadiri et al. [38] reveal no causality between the variables. Ozcan et al. [24] for Turkey conclude that globalization encourages the consumption of clean energy.
3. Methods and Data
3.1. Methodological Famework
This paper intensifies the trade openness-renewable energy link, a four-step panel data strategy is preferred. Figure 1 summarizes the methodological process employed in this paper. In the first step, cross-sectional denepdence (CSD), slope homogeneity, and unit root analyses are carried out. This paper employs Pesaran’s [39] CD test to detect if CSD exists. This test, which is often used in many panel data studies, and fits all models related to panel data. The existence of CSD as an alternate hypothesis is evaluated versus the null hypothesis of no CSD.
After the investigation of the CSD, it is tested for the homogeneity of the slope. Because the economic, social, and demographic structures differ in panel data studies, a heterogeneous structure can appear in cross-sectional units. This means that the corresponding parameters change between cross-sectional units. In this context, the assumption that the panel data has a homogeneous slope parameter is not valid and may lead to misleading and inconsistent estimation results [15]. It is investigated whether the slope coefficients are homogeneous or heterogeneous by Δ tests offered by Pesaran and Yamagata [40]. Usman et al. [41] indicate that panel estimates can have deviations and inconsistencies when CSD and heterogeneity are present. Pesaran [42] introduces the cross-sectionally augmented ADF (CADF), which is employed to see if the variables are stationary or not.
The next stage is to employ the cointegration approaches proposed by Kao [43], Pedroni [44], and Westerlund [45,46]. Although these approaches are called residual-based techniques, in practice they can be given prediction results to consider cross-sectional means. Westerlund [46] suggests two well-defined statistics, as and which are very simple tests to apply. These are expressed as follows:
After cointegration, long-term estimates of coefficients are started in the third step. Here, the DSUR estimator is consulted for long-term forecasts. Since this estimator takes CSD into account, it can offer more effective results than forecasters such as DOLS and FMOLS [47]. This technique can be used in both homogeneous and heterogeneous panels [48]. Mark et al. [48] initially accredit a regression equation as follows:
The covariance matrix of is indicated by . This estimator is expressed as follows:
In applications, is replaced with a consistent estimator, . Since degrees of freedom are taken into account by the parametric control for endogeneity, DSUR can be applied where N is much less than T [48].
In the final step, we apply a bootstrap causality procedure proposed by Demutrescu and Hurlin [49] for causality analysis. This causality method is highly compatible in case of CSD and hetoregeneity [50]. This test is a very flexible approach, as it can be used not only in unbalanced panels, but also in T>N, and N>T cases [51]. Wald statistics () and Z statistics () are used to evaluate if a causal relationship exists or not in the panel against the null hypothesis. They are expressed as follows:
Here, is individual Wald statistics; sample size is shown by N, while K is the lag length. This technique employs bootstrapped critical values because CSD is considered.
3.2. Empirical Modeling and Data
When the empirical literature is evaluated, Bayar et al. [52] focus on the influence of trade openness and financial globalization on clean energy. Vural [53] includes growth and trade openness in regression equation in his research on selected Latin American countries. Analyzing the links among technological innovation, human capital, and renewable energy, Khan et al. [54] model the variables of fixed capital, economic growth, and trade openness as regressors in their empirical equation for the G-7 countries. Finally, Ahmadov and van der Borg [55] employ natural resources as a main variable that affects renewable energy production in panel data analysis for the EU.
In addition to the above literature, this study also makes use of the regression equations offered by Lin et al. [19], Churchill et al. [56], and Baye et al. [18]. Thus, in the analysis of the relationships between variables from 1990-2018, a linear regression model is constructed as follows:
where cross-sectional units (), time duration (), and indicates the error terms. show the coefficients that estimates the influence of regressors on clean energy use. REN is an independent variable and indicates aggregate energy consumption expressed as a million tons of oil equivalent. GDP represents total real GDP at constant $2010 prices, TR is trade openness (cumulative foreign trade as a percentage of GDP), NR is total natural resource rents (as a percent of GDP), CAP is gross capital formation (as a percentage of GDP), and FGL is the KOF index of financial globalization. Each variable is transformed into a natural log. The natural-log transformation enables us to realize more efficient long-term estimations and to offer healthier interpretations and policy proposals. The data on financial globalization is obtained from the KOF Swiss Economic Institute. The sources for clean energy are taken from the BP database. All the other data is gained from the WB database.
Table 2 illustrates the definitions of all variables in terms of resources and expected signs.
4. Results
4.1. Summary Statistics
The descriptive statistics are presented in Table 3. The findings suggest that the series with the higher and lower means are lnGDP (28.215) and lnNR (-0.713), respectively. The mean value of lnREN (0.845) is less than the mean value of lnTR (3.775). lnCAP (0.215) has the lowest standard deviation, while the series with the highest is lnNR (1.794). When the maximum values are taken into account; lnREN (4.966) exhibits a higher maximum value than lnTR (4.527). In addition, the series with the highest kurtosis value is lnFGL (7.007), while the series with the lowest is lnNR (1.828).
Table 3 provides the correlation-matrix for the series. The findings reveal a direct association among trade openness, economic growth, financial globalization, and clean energy. Whereas natural resources and capital demonstrate a negative correlation with clean energy. The correlation matrix includes some other important correlation results among the series.
4.2. CSD, Slope-Homogeneity and Unit Root Analyses
As Majeed et al. [15] pointed out, the vast majority of panel data studies apply CSD and slope-homogeneity tests as preliminary tests to determine the long-term estimator and causality approach.
Table 4 implies that the Pesaran CD test is applied in determining CSD. The null hypothesis, which refers to no CSD between countries, can be rejected. This shows that a shock in any cross-sectional unit included in the analysis may expand to other cross-sectional units. Table 4 also reveals the findings of CADF test. The outcomes indicate that the indicators are non-stationary at their level. Furthermore, all the series are stationary at the first difference. This result plays an important role in selecting cointegration, estimation, and causality methods.
On the contrary, Table 5 lists the outcomes of the delta tests, which were carried out to determine if slope-homogeneity existed. According to the results, the null hypothesis that there exists slope-homogeneity can be rejected, so it can be said that our model has heterogeneous panel data.
4.3. Cointegration Analysis
According to the CADF results, since the series are stationary in their first differences means, that the Pedroni, Kao, and Westerlund tests can be employed to explore the cointegration among variables. Due to the CSD in the series, the results are obtained in a way to reduce the impact of the CSD structure. The outcome, presented in Table 6, demonstrates that the null hypothesis is rejected at various significance levels, which indicates the existence of co-integration among variables.
4.4. Long-Run Estimates
The long-run coefficients are analyzed in the panel data model by employing the DSUR approach. The results from DSUR estimations are given in Table 7. Initially, the statistical significance of the Wald χ2 values indicates the suitability of each model (see Figure 2 for a summary of the estimation results).
Long-term forecast results can be evaluated by considering the broadest model. According to the long-run estimates, as depicts in Figure 2, the coefficient of economic growth (0.069) implies a positive link among economic growth and clean energy. It can be interpreted as a 1% surge in growth contributes to a 0.069% surge in clean energy usage in the long term. Trade openness coefficient (0.143) shows that trade openness has a direct linkage with clean energy usage. It can be expressed as a 1% rise in trade openness will boost renewable energy by 0.143% in the long term. It is detected that the natural resources coefficient (0.005) is not statistically significant. This points to a statistically insignificant association among variables.
The long-run outcomes imply that the capital encourages renewable energy consumption. This indicates that a 1% rise in capital contributes to a 0.090% rise in renewable energy. The results also suggest that the coefficient of financial globalization (-0.173) shows an indirect association among financial globalization and clean energy. This indicates that a 1% surge in financial globalization contributes to a 0.173% reduction in clean energy usage.
4.5. Bootstrap Causality Analysis
The causal relations between variables are detected by utilizing the Demutrescu-Hurlin panel bootstrap causality technique and are exhibited in Table 8 as well as Figure 3 The outcome shows that the null hypothesis is rejected, which demonstrates that economic growth does not cause increased clean energy usage. However, the null hypothesis that the use of green energy does not cause economic growth cannot be rejected. This means that the causality exists from economic growth to the use of clean energy.
The null-hypothesis that trade openness does not cause increased renewable energy use can be rejected. This suggests the existence of causal linkage from trade to renewable energy use. We also find that the null hypothesis that natural resources are not the cause of renewable energy use can be rejected, which indicates a causal association from natural resources to renewable energy use.
The empirical results show a causality from capital to clean energy use, because the null hypothesis that capital is not a cause of clean energy use can be rejected. Finally, the null hypothesis that financial globalization is not a cause of increased renewable energy use can be rejected. Thus, according to the causality findings, all independent variables cause renewable energy consumption.
5. Discussion
The long-run outcomes of our study indicate that economic growth stimulates the consumption of clean energy. In this context, Vural [53] emphasizes that real GDP is a crucial indicator of clean energy consumption, highlighting its role as an economic driver. Similarly, Sadorsky [59] finds that real GDP per capita is a significant determinant of long-term energy consumption, suggesting that economic growth influences energy demand.
Economic growth tends to increase energy demand by boosting production and consumption activities. This rising demand underscores the need to invest in renewable energy to meet energy requirements sustainably. However, rapid economic growth can also lead to higher levels of energy consumption, which may contribute to environmental pollution and climate change pressures. Thus, while economic growth promotes clean energy consumption by expanding the energy market, it also necessitates a balanced approach to ensure that growth does not exacerbate environmental challenges. Supporting renewable energy investments becomes crucial in managing the increased energy demand resulting from economic expansion while mitigating adverse environmental impacts.
Our findings, which indicate that trade promotes clean energy, align with the work of Jebli and Youssef [27], who suggested that trade liberalization fosters the growth of green energy. Similarly, Baye et al. [18] demonstrate that trade increases green energy output in Sub-Saharan Africa, reinforcing the idea that trade openness significantly influences renewable energy consumption. These results support the notion that trade openness is a crucial factor in assessing countries' economic interactions, given the flow of commodities [64]. Omri and Nguyen [60] argue that the movement of goods and services facilitates access to green technologies, thereby boosting the demand for renewable energy. Furthermore, trade openness is widely recognized as a key channel for the international transfer of clean technologies [65]. This perspective underscores the importance of trade in advancing the adoption and development of green energy technologies on a global scale.
The findings indicate no significant linkage between natural resources and clean energy use. Dunning [66] suggests that natural resource rents are a factor in renewable energy investments, noting that extremely high levels of these rents can potentially hinder investments in renewable energy. This is because substantial revenues from natural resources might reduce the immediate economic incentives to invest in cleaner alternatives. Sadorsky [67] argues that the decline in biodiversity and the risk of resource depletion highlight the need to transition from non-renewable to renewable energy sources. The urgency to switch to clean energy is driven by the adverse environmental impacts associated with the depletion of natural resources.
Canh [68] supports the notion that wealth, which is often linked to natural resources, can enhance the use of renewable energy. By facilitating access to capital for investments, wealth derived from natural resources can potentially promote the expansion of renewable energy usage. These perspectives highlight the complex relationship between natural resources and renewable energy, suggesting that while natural resource wealth might offer capital for investment, it can also present barriers if not managed with a focus on sustainability.
In the long run, we determine a direct correlation among capital and green energy. Discussing the situation where environmental factors exceed the cost of consumption in the preference of energy sources, Damette et al. [69] emphasize that relative capital costs and income level are critical in choosing renewable energy consumption. As a matter of fact, it is certain that directing and encouraging a significant part of capital investments in the renewable energy sector and projects will develop this sector faster [30].
We also determine that financial globalization decreases the utilization of green energy. This demonstrates that the share of fossil fuels in investments is considerably higher than the share of clean energy sources [18]. It can be interpreted as a large part of the financial investments and capital arising from globalization flowing into the fossil fuel sector.
Our DSUR findings, which indicate that economic growth enhances clean energy usage, are consistent with the results of Mohamed et al. [70]. Using the ARDL model for France, they demonstrate that long-term economic growth positively influences clean energy consumption.
In contrast, our findings diverge from those of Uzar [9], who identified an indirect linkage between economic growth and clean energy usage across 43 countries. Similarly, Shahbaz et al. [10] suggest that economic growth may actually reduce clean energy usage, highlighting a more complex relationship than that observed in our study. These variations underscore the nuanced nature of the relationship between economic growth and clean energy consumption, suggesting that the impact of economic growth on renewable energy use can vary depending on regional, methodological, and contextual factors.
The positive link determined among trade openness and clean energy usage is similar to the findings of Vural [53], who focused on selected Latin American countries. In this study, FMOLS estimate results show evidence that trade openness positively affects clean energy use. This study’s outcomes coincide with the results provided by Alam and Murad [8]. On the other hand, contrary to these studies, our analysis does not match the outcomes of Baye et al. [18] for 32 SSA regions. The aforementioined studies indicated that trade openness decreases renewable energy use.
Our findings, which show a direct association between capital investment and clean energy use, are consistent with the results of Paramati et al. [71]. Their study investigates how both domestic and foreign capital influence clean energy consumption in developed countries using a panel ARDL approach. They find that both types of capital contribute to an increase in renewable energy use. Similarly, Islam et al. [33] reach comparable conclusions in their analysis of renewable and non-renewable energy use in Bangladesh. Their dynamic ARDL analyses reveal a direct association between capital and clean energy use.
In contrast, Gyimah et al. [6] find no statistically significant link between capital and clean energy use in Ghana. Conversely, Rahman and Sultana [34] observe a positive relationship between capital investment and clean energy consumption in emerging economies. These variations underscore the context-dependent nature of the relationship between capital investment and clean energy use.
Finally, our finding of a negative relationship between financial globalization and clean energy use is consistent with the results of Majeed et al. [15], who investigated the connections among natural resources, globalization, renewable energy, and climate change in Gulf Cooperation Council economies. Their study, employing the cross-sectionally ARDL and AMG (Average Marginal Gains) estimation techniques, also finds that economic globalization adversely affects clean energy consumption. In contrast, Koengkan et al. [72] demonstrate a direct positive relationship between globalization and the use of clean energy in Latin American countries. Similarly, Ozcan et al. [24] explore the linkages between globalization, human capital, and clean energy use in Turkey using a dynamic ARDL approach. Their study indicates that social, political, and economic globalization have a direct positive effect on clean energy consumption.
These differing results highlight the complexity of the relationship between globalization and clean energy use, suggesting that the impact of financial globalization on renewable energy can vary significantly depending on regional and contextual factors.
Our estimation ouitcome shows that natural resources cause clean energy use is proved by Bekun et al. [58], who studied how natural resources, renewable/non-renewable enery affect carbon emissions for European Union regions. Applying the Dumitrescu-Hurlin panel causality approach for BRIC countries, Nathaniel et al. [73] indicate a causality from natural resources to green energy. This results is endorsed by Shinwari et al. [30] by carrying out frequency domain causality analysis. Danish et al. [74] reveal that natural resources and renewable energy consumption cause each other in BRICS economies.
The findings of this study, which show that capital investment increases the use of clean energy, align with the results of Riti et al. [75]. Riti et al. explore the relationship between renewable energy consumption and its determinants in Sub-Saharan African (SSA) countries and find that capital investment positively influences clean energy use, as identified using the Dumitrescu-Hurlin panel causality technique.
In contrast, Gyimah [6] examines the relationship between economic growth and clean energy use in Ghana using time-series techniques and finds no causal linkage between these variables, which differs from our findings. Moreover, Rahman and Sultana [34], who analyzed emerging economies, report that the variables under consideration are interconnected. Their results suggest a more complex relationship than our study's findings, indicating that different contexts and methodologies may yield varying insights into the dynamics between capital investment, economic growth, and clean energy consumption.
6. Conclusions and Policy Recommendations
6.1. Conclusions
The inclusion of many of the world's leading renewable energy-capacity economies in our analysis underscores the significance of investing in and supporting the renewable energy sector. Increasing investment in this area not only bolsters the production of green energy but also highlights the need to understand the macroeconomic variables that influence renewable energy consumption. This focus on macroeconomic factors is crucial for developing effective policies and strategies to enhance renewable energy use and achieve sustainable energy goals.
In this context, the paper explores the relationship between trade openness and green energy consumption among the top 15 renewable energy consumers, incorporating additional factors such as economic growth, natural resources, capital, and financial globalization. The long-run estimates are derived using the DSUR estimation technique, while causality is analyzed using a panel bootstrap causality test.
The DSUR results reveal that economic growth positively influences the use of green energy sources. Additionally, there is a direct linkage between trade openness and the consumption of clean energy. Capital investment also shows a direct correlation with the utilization of clean energy. In contrast, financial globalization appears to discourage the use of green energy. The relationship between natural resources and green energy consumption is found to be statistically insignificant. Overall, the DSUR forecasts indicate that green energy consumption is influenced by trade openness, economic growth, capital investment, and financial globalization. The causality analysis identifies uni-directional causal linkages from all the regressors to green energy consumption, suggesting that these factors play a significant role in shaping the use of renewable energy.
6.2. Policy Recommendations
Based on the empirical findings of the study, several recommendations can be made to advance the renewable energy sector in the sampled economies.
Our finding that trade openness promotes renewable energy usage underscores the benefits these countries gain from the exchange of green technologies through international trade. Expanding trade openness can enhance energy efficiency policies by fostering the production and adoption of renewable energy technologies and facilitating access to advanced technological products. Moreover, strengthening trade relationships with countries that excel in renewable energy can help reduce dependence on imported fossil fuels, such as oil and gas, thereby contributing to a more sustainable and self-reliant energy strategy.
Given the finding that financial globalization appears to diminish the use of green energy, several policy recommendations can be made. Padhan et al. [63] suggest that globalization can enhance a country's economic performance and influence energy consumption in diverse ways. According to the Pollution Haven Hypothesis, the impact of globalization on energy use is often mediated through direct investments. If foreign capital, channeled through multinational companies, preferentially supports traditional energy sectors rather than renewable energy, it could negatively impact the latter. To address this, it is recommended that governments refocus efforts on the renewable energy sector by implementing more effective incentives to attract foreign direct investment into green energy projects. Additionally, the empirical evidence indicates that the financial sector, which has expanded through financial globalization, has largely allocated its investments to fossil fuel-based energy production rather than renewable energy. To counter this trend, policymakers should consider strategies to encourage the financial sector to redirect its investments towards renewable energy initiatives, thereby supporting the transition to a more sustainable energy system.
The study's results indicate that economic growth is a significant factor influencing the adoption of clean energy sources. Thus, fostering economic development can enhance environmental awareness and positively impact the use of renewable energy. Policies aimed at stimulating economic growth should therefore be a central component of strategies to increase renewable energy utilization.
Considering our empirical finding that capital encourages the use of renewable energy in the long term, it is possible to offer a few policy recommendations. Capital investments, particularly in technologies and infrastructure for renewable energy, are crucial. Governments and financial institutions should create favorable conditions for investment in the renewable energy sector, including incentives and supportive regulatory frameworks.
6.3. Limitations of the Study and Future Guidelines
The study acknowledges several limitations. Firstly, it primarily examines total trade openness without a detailed analysis of the effects of exports and imports on renewable energy consumption. Secondly, it lacks comparative empirical findings as it does not include economies with minimal renewable energy use in the analysis. Thirdly, the study does not differentiate between specific types of renewable energy sources, such as solar, wind, and bioenergy. Lastly, the research does not provide country-specific insights as it does not utilize estimation techniques like AMG and CCEMG (Common Correlated Effects Mean Group). Addressing these limitations in future research could lead to more nuanced policy recommendations and a deeper understanding of the factors influencing renewable energy consumption.
Author Contributions
conceptualisation, B.J.; S.S.S., B.A.T., M.Ç., M.D.; methodology, M.Ç, B.A.T.; software, B.A.T.; validation, M.Ç.; formal analysis, M.Ç.; resources, B.A.T, M.D.; data curation, B.A.T, M.D.; writing—original draft preparation, B.J., S.S.S.; writing—review and editing, B.J., S.S.S.; visualization, B.J.; supervision, B.J., M.D.; and project administration, M. Ç, S.S.S, B.A.T. All authors have read and agreed to the published version of the manuscript.
Funding
The APC was funded by The John Paul II Catholic University of Lublin, Poland.
Data Availability Statement
The data (variables) can be found at: World Bank Open Data, https://data.worldbank.org, date of access: 10 September 2024; British Petroleum BP, https://www.bp.com/en/global/corporate/sustainability/data-and-how-we-report.html, date of access: 10 September 2024; KOF Swiss Economic Institute, https://kof.ethz.ch/en/forecasts-and-indicators/indicators/kof-globalisation-index.html, date of access: 10 September 2024.
Conflicts of Interest
The authors declare no conflicts of interest.
Abbreviations
The following abbreviations are used in this manuscript:
| AMG | Average Marginal Gains |
| CADF | Cross-Sectionally Augmented Dickey-Fuller |
| CCEMG | Common Correlated Effects Mean Group |
| CSD | Cross-Sectional Dependence |
| DOLS | Dynamic Ordinary Least Squares |
| FMOLS | Fully Modified Ordinary Least Squares |
| GMM | Generalized Method of Moments |
| LSDVC | Least Squares Dummy Variable |
| OLS | Ordinary Least Squares |
| PMG | Pooled Mean Group |
| SDG | Sustainable Development Goals |
| SUR | Seemingly Unrelated Regression |
References
- Mishra, M.; Desul, S.; Santos, C.A.G.; Mishra, S.K.; Kamal, A.H.M.; Goswami, S.; Kalumba, A.M.; Biswal, R.; Silva, R.M. da; Santos, C.A.C.D.; et al. A Bibliometric Analysis of Sustainable Development Goals (SDGs): A Review of Progress, Challenges, and Opportunities. Environ., Dev. Sustain. 2023, 26, 1–43. [Google Scholar] [CrossRef]
- Mensah, J. Sustainable Development: Meaning, History, Principles, Pillars, and Implications for Human Action: Literature Review. Cogent Soc. Sci. 2019, 5, 1653531. [Google Scholar] [CrossRef]
- Figueres, C.; Quéré, C.L.; Mahindra, A.; Bäte, O.; Whiteman, G.; Peters, G.; Guan, D. Emissions Are Still Rising: Ramp up the Cuts. Nature 2018, 564, 27–30. [Google Scholar] [CrossRef] [PubMed]
- Hassan, Q.; Viktor, P.; Al-Musawi, T.J.; Ali, B.M.; Algburi, S.; Alzoubi, H.M.; Al-Jiboory, A.K.; Sameen, A.Z.; Salman, H.M.; Jaszczur, M. The Renewable Energy Role in the Global Energy Transformations. Renew. Energy Focus 2024, 48, 100545. [Google Scholar] [CrossRef]
- Johnstone, N.; Haščič, I.; Popp, D. Renewable Energy Policies and Technological Innovation: Evidence Based on Patent Counts. Environ. Resour. Econ. 2009, 45, 133–155. [Google Scholar] [CrossRef]
- Gyimah, J.; Yao, X.; Tachega, M.A.; Hayford, I.S.; Opoku-Mensah, E. Renewable Energy Consumption and Economic Growth: New Evidence from Ghana. Energy 2022, 248, 123559. [Google Scholar] [CrossRef]
- Vo, D.H.; Tran, Q.; Tran, T. Economic Growth, Renewable Energy and Financial Development in the CPTPP Countries. PLoS ONE 2022, 17, e0268631. [Google Scholar] [CrossRef] [PubMed]
- Alam, M.M.; Murad, M.W. The Impacts of Economic Growth, Trade Openness and Technological Progress on Renewable Energy Use in Organization for Economic Co-Operation and Development Countries. Renew. Energy 2020, 145, 382–390. [Google Scholar] [CrossRef]
- Uzar, U. Political Economy of Renewable Energy: Does Institutional Quality Make a Difference in Renewable Energy Consumption? Renew. Energy 2020, 155, 591–603. [Google Scholar] [CrossRef]
- Shahbaz, M.; Topcu, B.A.; Sarıgül, S.S.; Vo, X.V. The Effect of Financial Development on Renewable Energy Demand: The Case of Developing Countries. Renew Energ 2021, 178, 1370–1380. [Google Scholar] [CrossRef]
- Lu, Z.; Gozgor, G.; Mahalik, M.K.; Padhan, H.; Yan, C. Welfare Gains from International Trade and Renewable Energy Demand: Evidence from the OECD Countries. Energy Econ. 2022, 112, 106153. [Google Scholar] [CrossRef]
- Hoa, P.X.; Xuan, V.N.; Thu, N.T.P. Determinants of the Renewable Energy Consumption: The Case of Asian Countries. Heliyon 2023, 9, e22696. [Google Scholar] [CrossRef]
- Chen, Y.; Zhang, X. Does Financial Globalization Promote Renewable Energy Investment? Empirical Insights from China. Environ. Sci. Pollut. Res. 2023, 30, 101366–101378. [Google Scholar] [CrossRef] [PubMed]
- Han, Z.; Zakari, A.; Youn, I.J.; Tawiah, V. The Impact of Natural Resources on Renewable Energy Consumption. Resour. Polic. 2023, 83, 103692. [Google Scholar] [CrossRef]
- Majeed, A.; Wang, L.; Zhang, X.; Muniba; Kirikkaleli, D. Modeling the Dynamic Links among Natural Resources, Economic Globalization, Disaggregated Energy Consumption, and Environmental Quality: Fresh Evidence from GCC Economies. Resour. Polic. 2021, 73, 102204. [Google Scholar] [CrossRef]
- Cole, M.A. Does Trade Liberalization Increase National Energy Use? Econ. Lett. 2006, 92, 108–112. [Google Scholar] [CrossRef]
- Grossman, G.M.; Krueger, A.B. Environmental Impacts of a North American Free Trade Agreement. NBER Working Paper Series 1991, 39. [Google Scholar]
- Baye, R.S.; Olper, A.; Ahenkan, A.; Musah-Surugu, I.J.; Anuga, S.W.; Darkwah, S. Renewable Energy Consumption in Africa: Evidence from a Bias Corrected Dynamic Panel. Sci. Total Environ. 2021, 766, 142583. [Google Scholar] [CrossRef]
- Lin, B.; Omoju, O.E.; Okonkwo, J.U. Factors Influencing Renewable Electricity Consumption in China. Renew. Sustain. Energy Rev. 2016, 55, 687–696. [Google Scholar] [CrossRef]
- Li, R.; Leung, G.C.K. The Relationship between Energy Prices, Economic Growth and Renewable Energy Consumption: Evidence from Europe. Energy Rep. 2021, 7, 1712–1719. [Google Scholar] [CrossRef]
- Salim, R.A.; Rafiq, S. Why Do Some Emerging Economies Proactively Accelerate the Adoption of Renewable Energy? Energy Econ. 2012, 34, 1051–1057. [Google Scholar] [CrossRef]
- Okada, K.; Samreth, S. Corruption and Natural Resource Rents: Evidence from Quantile Regression. Appl. Econ. Lett. 2017, 24, 1490–1493. [Google Scholar] [CrossRef]
- Sharma, R.; Shahbaz, M.; Kautish, P.; Vo, X.V. Analyzing the Impact of Export Diversification and Technological Innovation on Renewable Energy Consumption: Evidences from BRICS Nations. Renew Energ 2021. [Google Scholar] [CrossRef]
- Ozcan, B.; Danish; Temiz, M. An Empirical Investigation between Renewable Energy Consumption, Globalization and Human Capital: A Dynamic Auto-Regressive Distributive Lag Simulation. Renew. Energy 2022, 193, 195–203. [Google Scholar] [CrossRef]
- Bahmani-Oskooee, M.; Niroomand, F. Openness and Economic Growth: An Empirical Investigation. Appl. Econ. Lett. 1999, 6, 557–561. [Google Scholar] [CrossRef]
- Jóźwik, B.; Topcu, B.A.; Doğan, M. The Impact of Nuclear Energy Consumption, Green Technological Innovation, and Trade Openness on the Sustainable Environment in the USA. Energies 2024, 17, 3810. [Google Scholar] [CrossRef]
- Jebli, M.B.; Youssef, S.B. Output, Renewable and Non-Renewable Energy Consumption and International Trade: Evidence from a Panel of 69 Countries. Renewable Energy 2015, 83, 1–10. [Google Scholar] [CrossRef]
- Hossain, F. Production of Clean Energy from Cyanobacterial Biochemical Products. Strat. Plan. Energy Environ. 2016, 36, 6–23. [Google Scholar] [CrossRef]
- Al-Marhubi, F. Do Natural Resource Rents Reduce Labour Shares? Evidence from Panel Data. Appl. Econ. Lett. 2021, 28, 1754–1757. [Google Scholar] [CrossRef]
- Shinwari, R.; Yangjie, W.; Payab, A.H.; Kubiczek, J.; Dördüncü, H. What Drives Investment in Renewable Energy Resources? Evaluating the Role of Natural Resources Volatility and Economic Performance for China. Resour. Polic. 2022, 77, 102712. [Google Scholar] [CrossRef]
- Awijen, H.; Belaïd, F.; Zaied, Y.B.; Hussain, N.; Lahouel, B.B. Renewable Energy Deployment in the MENA Region: Does Innovation Matter? Technol. Forecast. Soc. Chang. 2022, 179, 121633. [Google Scholar] [CrossRef]
- Belaïd, F.; Elsayed, A.H.; Omri, A. Key Drivers of Renewable Energy Deployment in the MENA Region: Empirical Evidence Using Panel Quantile Regression. Struct. Chang. Econ. Dyn. 2021, 57, 225–238. [Google Scholar] [CrossRef]
- Islam, M.M.; Irfan, M.; Shahbaz, M.; Vo, X.V. Renewable and Non-Renewable Energy Consumption in Bangladesh: The Relative Influencing Profiles of Economic Factors, Urbanization, Physical Infrastructure and Institutional Quality. Renew. Energy 2022, 184, 1130–1149. [Google Scholar] [CrossRef]
- Rahman, M.M.; Sultana, N. Impacts of Institutional Quality, Economic Growth, and Exports on Renewable Energy: Emerging Countries Perspective. Renew. Energy 2022, 189, 938–951. [Google Scholar] [CrossRef]
- Rafindadi, A.A.; Mika’Ilu, A.S. Sustainable Energy Consumption and Capital Formation: Empirical Evidence from the Developed Financial Market of the United Kingdom. Sustain. Energy Technol. Assess. 2019, 35, 265–277. [Google Scholar] [CrossRef]
- Liu, P.; Rahman, Z.U.; Jóźwik, B.; Doğan, M. Determining the Environmental Effect of Chinese FDI on the Belt and Road Countries CO2 Emissions: An EKC-Based Assessment in the Context of Pollution Haven and Halo Hypotheses. Environ. Sci. Eur. 2024, 36, 48. [Google Scholar] [CrossRef]
- Shahbaz, M.; Lahiani, A.; Abosedra, S.; Hammoudeh, S. The Role of Globalization in Energy Consumption: A Quantile Cointegrating Regression Approach. Energy Econ. 2018, 71, 161–170. [Google Scholar] [CrossRef]
- Akadiri, S.S.; Alkawfi, M.M.; Uğural, S.; Akadiri, A.C. Towards Achieving Environmental Sustainability Target in Italy. The Role of Energy, Real Income and Globalization. Sci. Total Environ. 2019, 671, 1293–1301. [Google Scholar] [CrossRef]
- Pesaran, M.H. General Diagnostic Tests for Cross Section Dependence in Panels. SSRN Electron. J. 2004. [Google Scholar] [CrossRef]
- Pesaran, M.H.; Yamagata, T. Testing Slope Homogeneity in Large Panels. J. Econ. 2008, 142, 50–93. [Google Scholar] [CrossRef]
- Usman, M.; Khalid, K.; Mehdi, M.A. What Determines Environmental Deficit in Asia? Embossing the Role of Renewable and Non-Renewable Energy Utilization. Renew. Energy 2021, 168, 1165–1176. [Google Scholar] [CrossRef]
- Pesaran, M.H. A Simple Panel Unit Root Test in the Presence of Cross-section Dependence. J Appl Econ 2007, 22, 265–312. [Google Scholar] [CrossRef]
- Kao, C. Spurious Regression and Residual-Based Tests for Cointegration in Panel Data. J. Econ. 1999, 90, 1–44. [Google Scholar] [CrossRef]
- Pedroni, P. PANEL COINTEGRATION: ASYMPTOTIC AND FINITE SAMPLE PROPERTIES OF POOLED TIME SERIES TESTS WITH AN APPLICATION TO THE PPP HYPOTHESIS. Econ. Theory 2004, 20, 597–625. [Google Scholar] [CrossRef]
- Westerlund, J.; Edgerton, D.L. A Panel Bootstrap Cointegration Test. Econ Lett 2007, 97, 185–190. [Google Scholar] [CrossRef]
- Westerlund, J. New Simple Tests for Panel Cointegration. Econ. Rev. 2005, 24, 297–316. [Google Scholar] [CrossRef]
- Kim, J. Real Exchange Rates and Real Interest Differentials for Sectoral Data: A Dynamic SUR Approach. Econ. Lett. 2007, 97, 247–252. [Google Scholar] [CrossRef]
- Mark, N.C.; Ogaki, M.; Sul, D. Dynamic Seemingly Unrelated Cointegrating Regressions. Rev. Econ. Stud. 2005, 72, 797–820. [Google Scholar] [CrossRef]
- Dumitrescu, E.-I.; Hurlin, C. Testing for Granger Non-Causality in Heterogeneous Panels. Econ Model 2012, 29, 1450–1460. [Google Scholar] [CrossRef]
- Danish; Baloch, M. A.; Mahmood, N.; Zhang, J.W. Effect of Natural Resources, Renewable Energy and Economic Development on CO2 Emissions in BRICS Countries. Sci. Total Environ. 2019, 678, 632–638. [Google Scholar] [CrossRef]
- Wang, Z.; Bui, Q.; Zhang, B. The Relationship between Biomass Energy Consumption and Human Development: Empirical Evidence from BRICS Countries. Energy 2020, 194, 116906. [Google Scholar] [CrossRef]
- Bayar, Y.; Sasmaz, M.U.; Ozkaya, M.H. Impact of Trade and Financial Globalization on Renewable Energy in EU Transition Economies: A Bootstrap Panel Granger Causality Test. Energies 2020, 14, 19. [Google Scholar] [CrossRef]
- Vural, G. Analyzing the Impacts of Economic Growth, Pollution, Technological Innovation and Trade on Renewable Energy Production in Selected Latin American Countries. Renew. Energy 2021, 171, 210–216. [Google Scholar] [CrossRef]
- Khan, Z.; Malik, M.Y.; Latif, K.; Jiao, Z. Heterogeneous Effect of Eco-Innovation and Human Capital on Renewable & Non-Renewable Energy Consumption: Disaggregate Analysis for G-7 Countries. Energy 2020, 209, 118405. [Google Scholar] [CrossRef]
- Ahmadov, A.K.; Borg, C. van der Do Natural Resources Impede Renewable Energy Production in the EU? A Mixed-Methods Analysis. Energy Polic. 2019, 126, 361–369. [Google Scholar] [CrossRef]
- Churchill, S.A.; Inekwe, J.; Ivanovski, K.; Smyth, R. The Environmental Kuznets Curve in the OECD: 1870-2014. Energy Economics 2018, 75, 389–399. [Google Scholar] [CrossRef]
- Ulucak, R.; Danish; Ozcan, B. Relationship between Energy Consumption and Environmental Sustainability in OECD Countries: The Role of Natural Resources Rents. Resour. Polic. 2020, 69, 101803. [Google Scholar] [CrossRef]
- Bekun, F.V.; Alola, A.A.; Sarkodie, S.A. Toward a Sustainable Environment: Nexus between CO2 Emissions, Resource Rent, Renewable and Nonrenewable Energy in 16-EU Countries. Sci. Total Environ. 2019, 657, 1023–1029. [Google Scholar] [CrossRef]
- Sadorsky, P. Renewable Energy Consumption and Income in Emerging Economies. Energy Polic. 2009, 37, 4021–4028. [Google Scholar] [CrossRef]
- Omri, A.; Nguyen, D.K. On the Determinants of Renewable Energy Consumption: International Evidence. Energy 2014, 72, 554–560. [Google Scholar] [CrossRef]
- Topcu, E.; Altinoz, B.; Aslan, A. Global Evidence from the Link between Economic Growth, Natural Resources, Energy Consumption, and Gross Capital Formation. Resour. Polic. 2020, 66, 101622. [Google Scholar] [CrossRef]
- Amri, F. Renewable and Non-Renewable Categories of Energy Consumption and Trade: Do the Development Degree and the Industrialization Degree Matter? Energy 2019, 173, 374–383. [Google Scholar] [CrossRef]
- Padhan, H.; Padhang, P.C.; Tiwari, A.K.; Ahmed, R.; Hammoudeh, S. Renewable Energy Consumption and Robust Globalization(s) in OECD Countries: Do Oil, Carbon Emissions and Economic Activity Matter? Energy Strat. Rev. 2020, 32, 100535. [Google Scholar] [CrossRef]
- Lean, H.H.; Smyth, R. CO2 Emissions, Electricity Consumption and Output in ASEAN. Appl. Energy 2010, 87, 1858–1864. [Google Scholar] [CrossRef]
- Hussain, J.; Khan, A.; Zhou, K. The Impact of Natural Resource Depletion on Energy Use and CO2 Emission in Belt & Road Initiative Countries: A Cross-Country Analysis. Energy 2020, 199, 117409. [Google Scholar] [CrossRef]
- Dunning, T. Resource Dependence, Economic Performance, and Political Stability. J. Confl. Resolut. 2005, 49, 451–482. [Google Scholar] [CrossRef]
- Sadorsky, P. Do Urbanization and Industrialization Affect Energy Intensity in Developing Countries? Energy Econ. 2013, 37, 52–59. [Google Scholar] [CrossRef]
- Canh, N.P.; Schinckus, C.; Thanh, S.D. The Natural Resources Rents: Is Economic Complexity a Solution for Resource Curse? Resour. Polic. 2020, 69, 101800. [Google Scholar] [CrossRef]
- Damette, O.; Delacote, P.; Lo, G.D. Households Energy Consumption and Transition toward Cleaner Energy Sources. Energy Polic. 2018, 113, 751–764. [Google Scholar] [CrossRef]
- Mohamed, H.; Jebli, M.B.; Youssef, S.B. Renewable and Fossil Energy, Terrorism, Economic Growth, and Trade: Evidence from France. Renew. Energy 2019, 139, 459–467. [Google Scholar] [CrossRef]
- Paramati, S.R.; Apergis, N.; Ummalla, M. Financing Clean Energy Projects through Domestic and Foreign Capital: The Role of Political Cooperation among the EU, the G20 and OECD Countries. Energy Econ. 2017, 61, 62–71. [Google Scholar] [CrossRef]
- Koengkan, M.; Poveda, Y.E.; Fuinhas, J.A. Globalisation as a Motor of Renewable Energy Development in Latin America Countries. GeoJournal 2019, 85, 1591–1602. [Google Scholar] [CrossRef]
- Nathaniel, S.P.; Yalçiner, K.; Bekun, F.V. Assessing the Environmental Sustainability Corridor: Linking Natural Resources, Renewable Energy, Human Capital, and Ecological Footprint in BRICS. Resour. Polic. 2021, 70, 101924. [Google Scholar] [CrossRef]
- Danish; Ulucak, R. ; Khan, S.U.-D. Determinants of the Ecological Footprint: Role of Renewable Energy, Natural Resources, and Urbanization. Sustain. Cities Soc. 2020, 54, 101996. [Google Scholar] [CrossRef]
- Riti, J.S.; Riti, M.-K.J.; Oji-Okoro, I. Renewable Energy Consumption in Sub-Saharan Africa (SSA): Implications on Economic and Environmental Sustainability. Curr. Res. Environ. Sustain. 2022, 4, 100129. [Google Scholar] [CrossRef]
Figure 1.
Flow chart of econometric modelling approach.
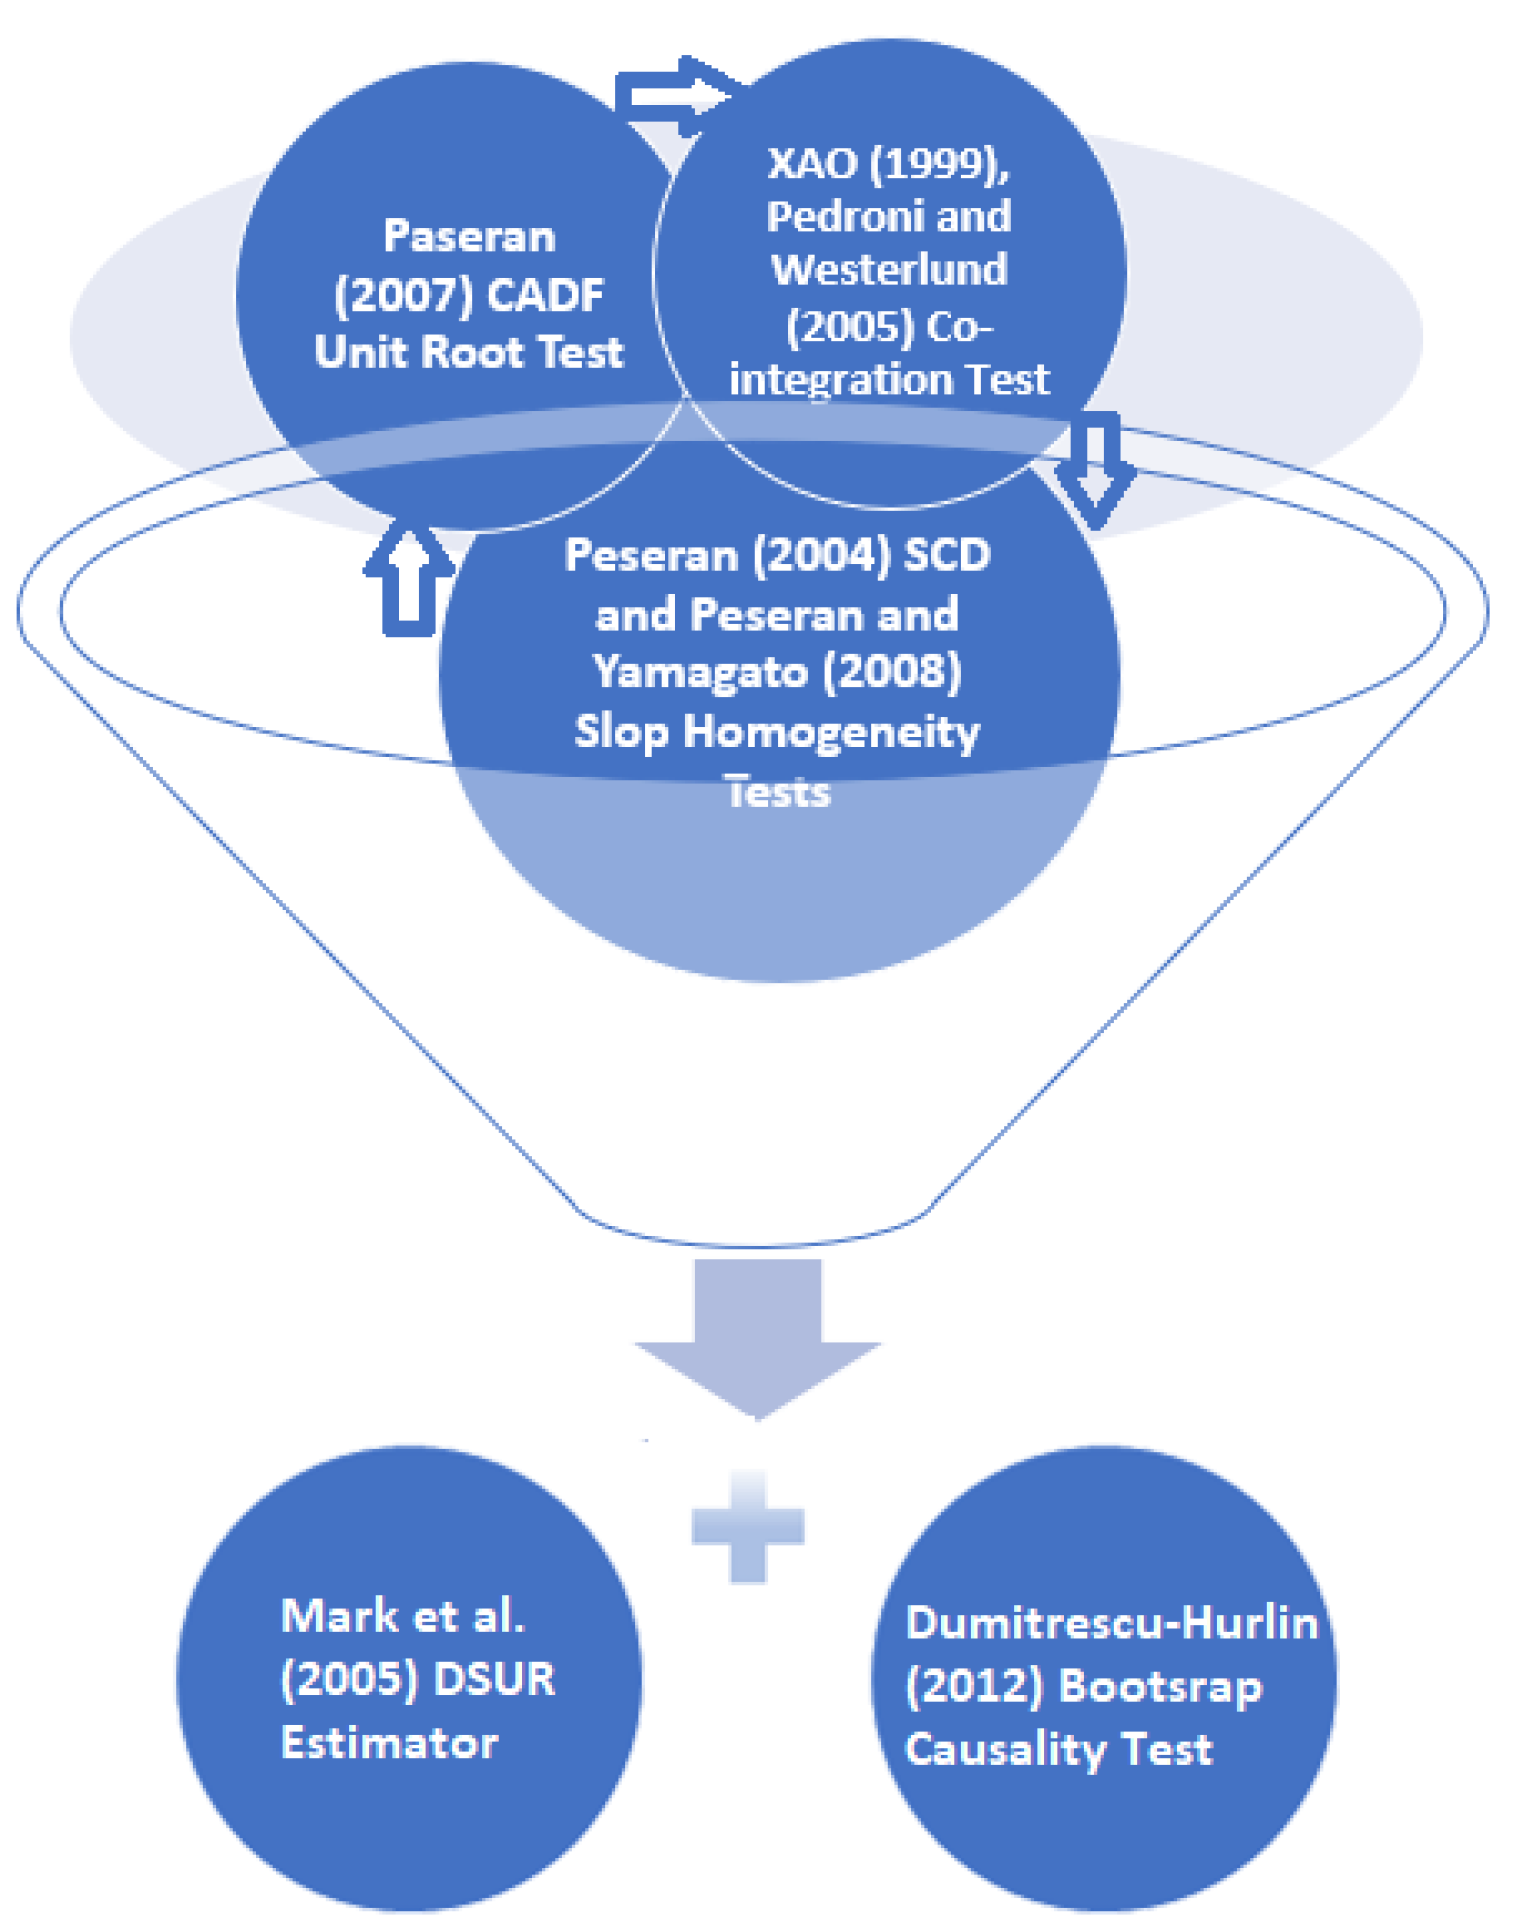
Figure 2.
Graphical demonstrations of summary of DSUR findings. Note: ✓ shows statistical significance, (-) / (+) denote the sign negative or positive impact of explanotary variables.
Figure 2.
Graphical demonstrations of summary of DSUR findings. Note: ✓ shows statistical significance, (-) / (+) denote the sign negative or positive impact of explanotary variables.
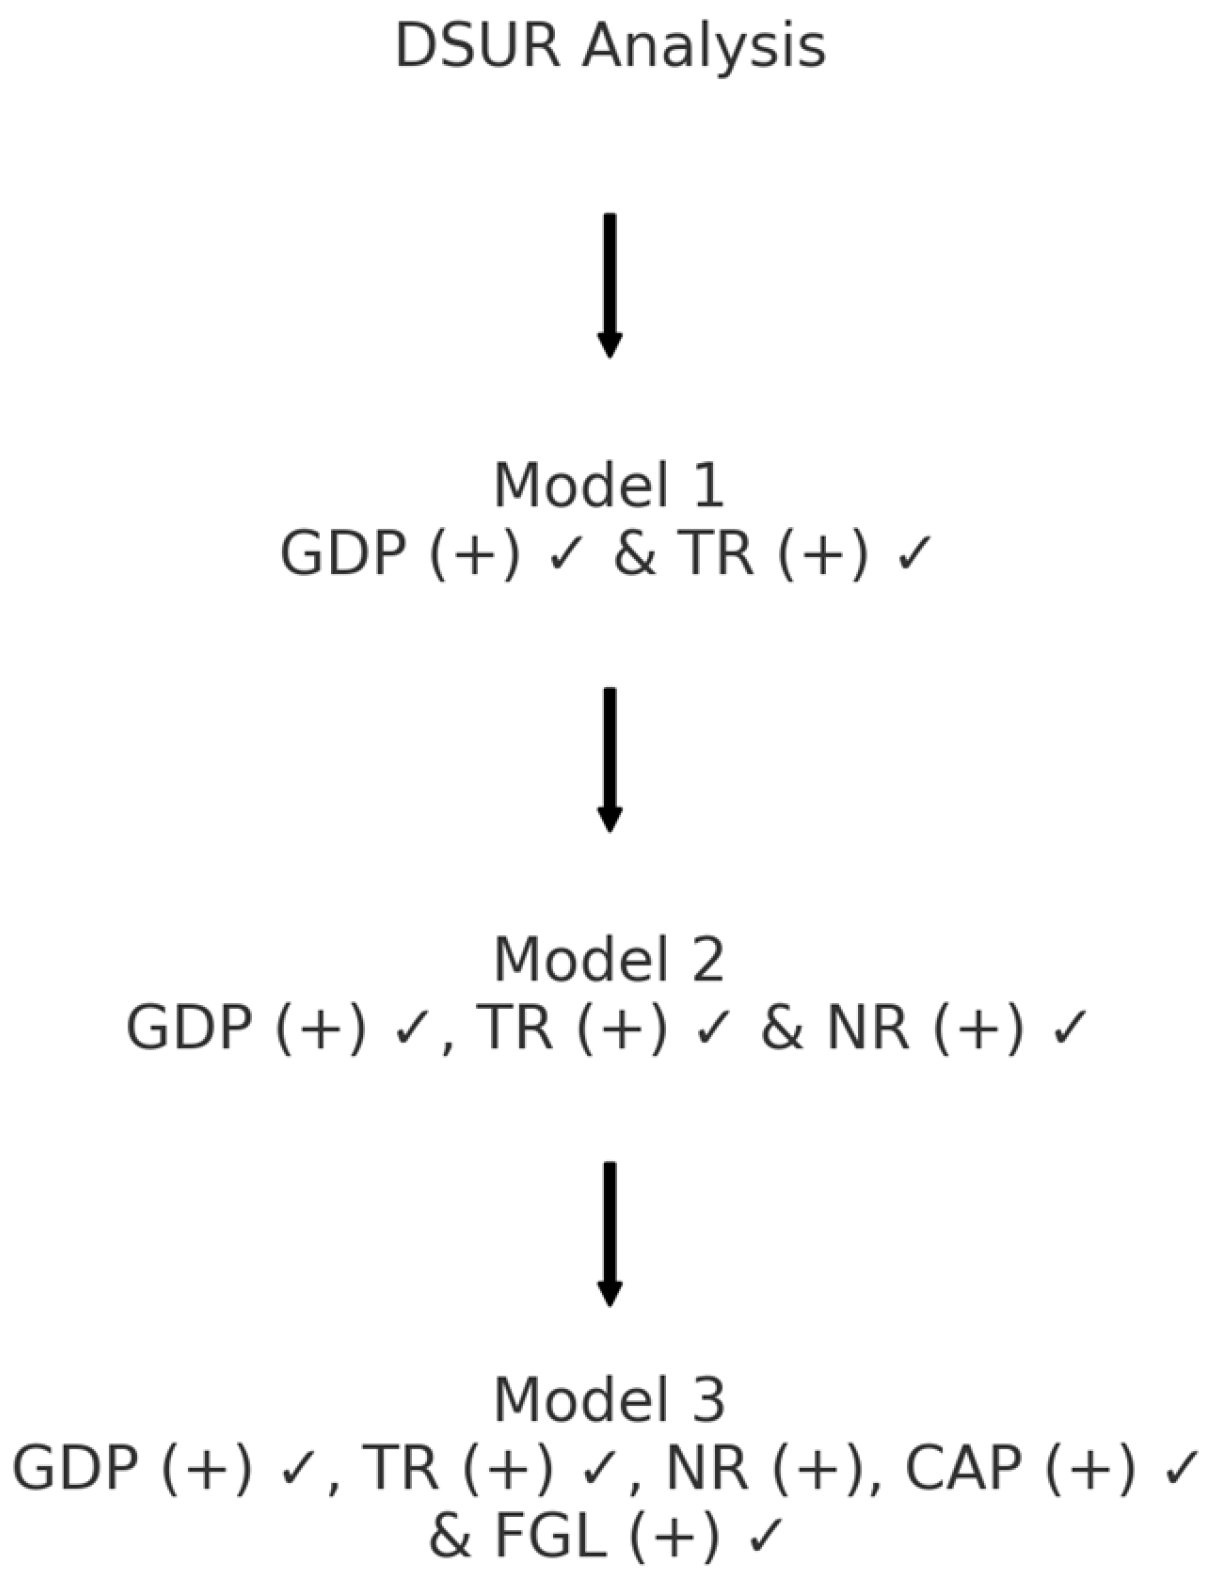
Figure 3.
Graphical demonstrations of empirical findings.
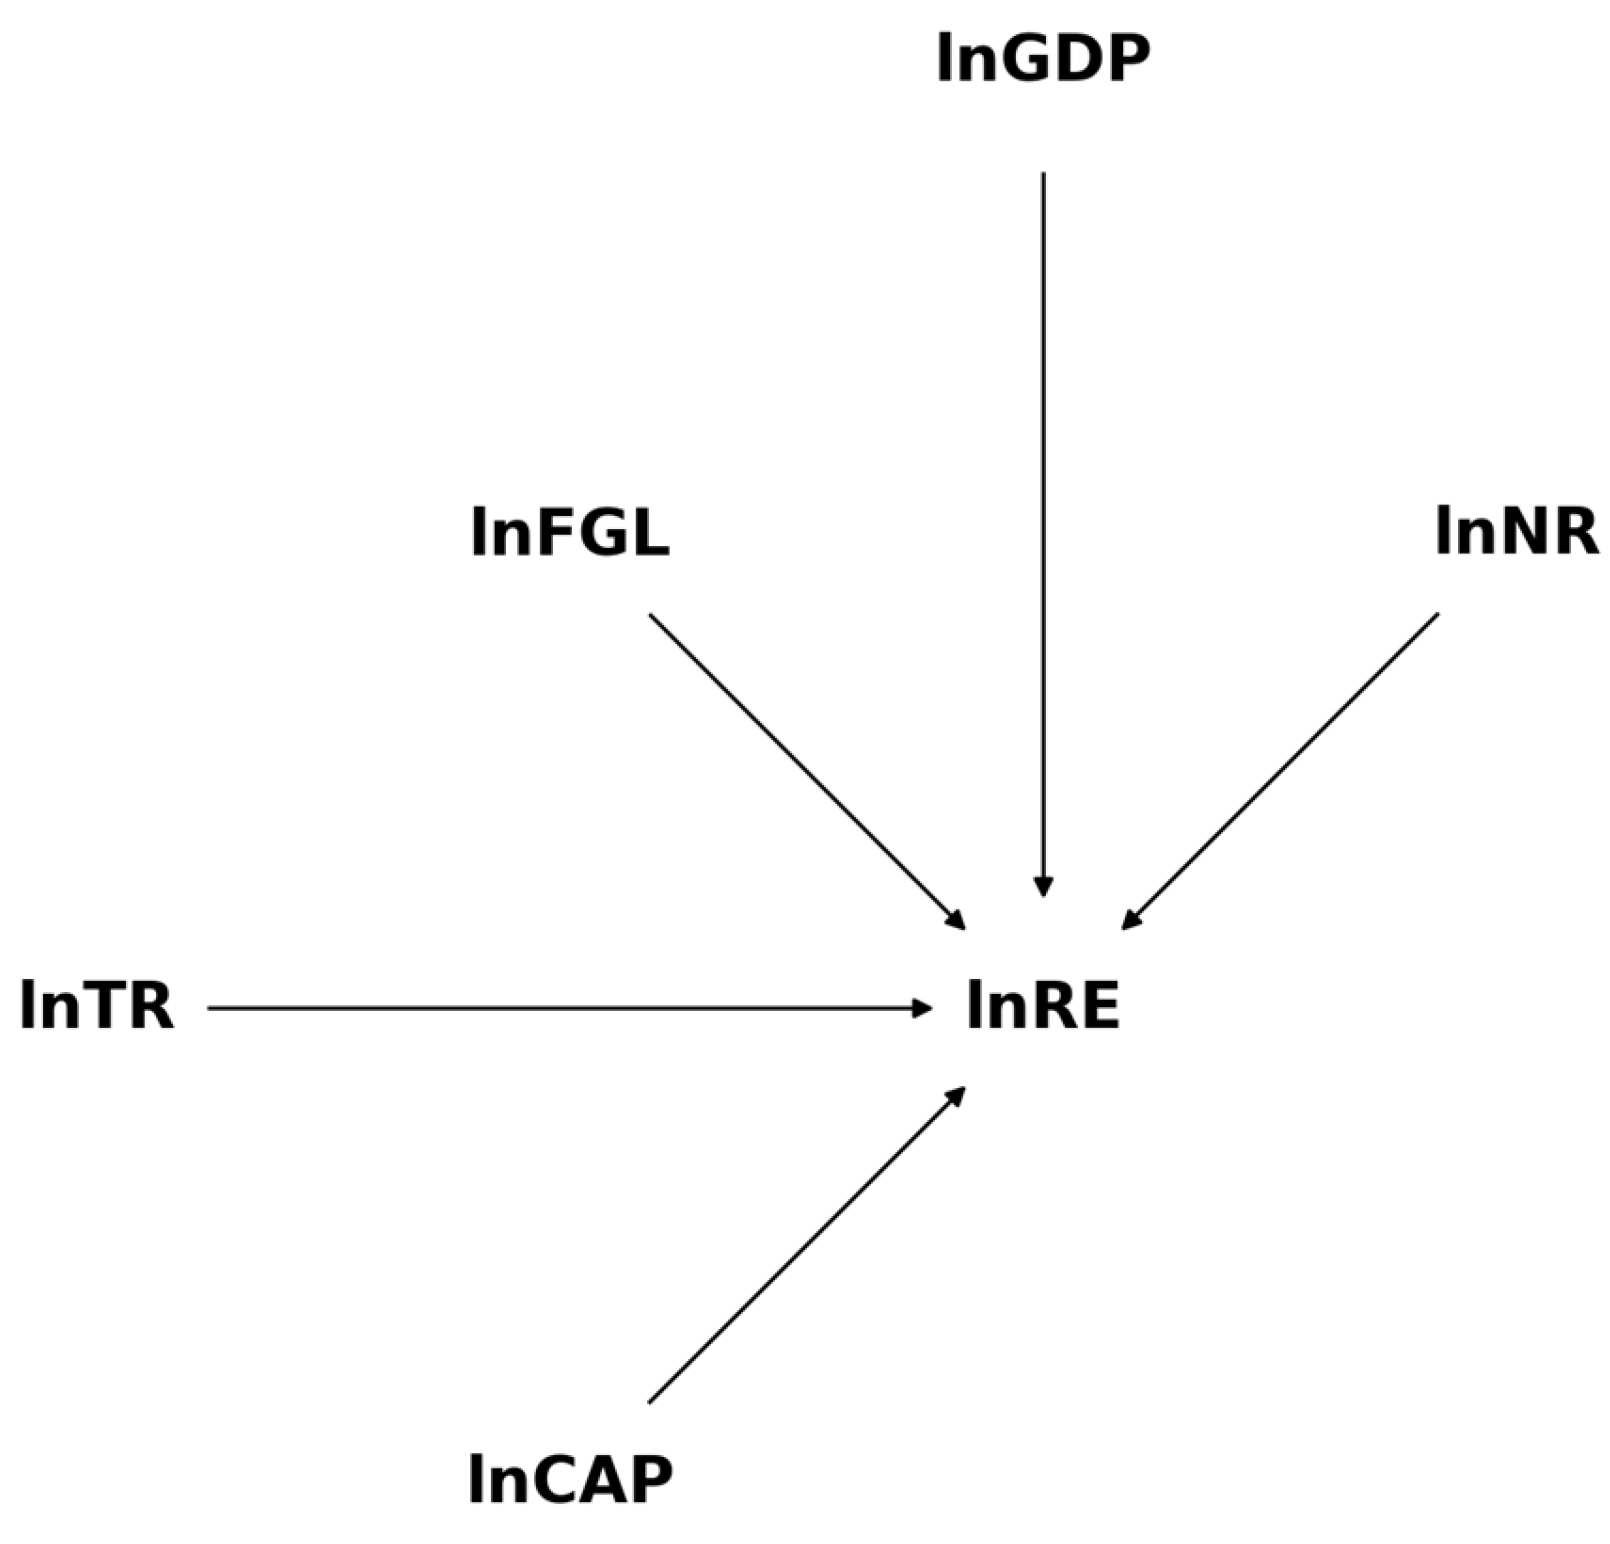

Table 1.
Macroeconomic profile in OECD countries (1990-2018).
| Cauntries/Years | 1990 | 2000 | 2018 | ||||||
|---|---|---|---|---|---|---|---|---|---|
| (1) | (2) | (3) | (1) | (2) | (3) | (1) | (2) | (3) | |
| China | 0.02 | 1027 | 157 | 0.71 | 2770 | 822 | 143.50 | 13493 | 5121 |
| United States | 13.72 | 9811 | 1378 | 16.50 | 13754 | 3065 | 103.80 | 19479 | 5520 |
| Germany | 0.34 | 2342 | 825 | 3.23 | 2835 | 1521 | 47.33 | 3562 | 3240 |
| United Kingdom | 0.14 | 1801 | 345 | 1.10 | 2310 | 1053 | 23.90 | 3139 | 1834 |
| Sweden | 0.44 | 295 | 136 | 1.03 | 364 | 261 | 6.60 | 539 | 474 |
| Brazil | 0.87 | 917 | 109 | 1.80 | 1186 | 230 | 23.64 | 1797 | 517 |
| India | 0.02 | 465 | 58 | 0.74 | 800 | 194 | 27.50 | 2588 | 1132 |
| Japan | 2.57 | 3509 | 641 | 3.74 | 3986 | 953 | 23.40 | 4580 | 1718 |
| Spain | 0.13 | 737 | 212 | 1.41 | 971 | 528 | 16.00 | 1297 | 871 |
| Italy | 0.74 | 1559 | 511 | 1.51 | 1842 | 842 | 14.93 | 1908 | 1158 |
| France | 0.43 | 1661 | 514 | 0.70 | 2046 | 985 | 10.60 | 2569 | 1671 |
| Canada | 0.90 | 877 | 369 | 2.10 | 1047 | 784 | 10.30 | 1664 | 1106 |
| Australia | 0.17 | 630 | 133 | 0.24 | 872 | 274 | 7.21 | 1460 | 643 |
| Turkiye | 0.02 | 288 | 68 | 0.10 | 413 | 181 | 8.53 | 988 | 500 |
| Mexico | 1.16 | 626 | 174 | 1.44 | 876 | 463 | 4.83 | 1255 | 961 |
| Total | 20.67 | 26545 | 5630 | 36.35 | 36072 | 12156 | 466.07 | 60318 | 26466 |
| World | 27.30 | 35870 | 12330 | 49.32 | 48220 | 22820 | 561.30 | 82510 | 47360 |
| EU | 4.24 | 7973 | 3194 | 14.10 | 9961 | 6121 | 159.60 | 12427 | 11582 |
Note: It was created by the authors using the British Oil database and World Bank database. (1), (2) and (3) denote total reneable energy consumption (millione tone of oil equivalent, total GDP (constant 2015 billion USD) and total trade (constant 2015 billion USD), respectively.
Table 2.
Basic properties of variables.
| Variables | Descriptions | Source | Expected sign |
|---|---|---|---|
| REN | Renewable Energy Consumption(million tons of oil equivalent) [57] | BP | |
| GDP | Gross Domestic Product (constant 2010 US$) [58] | WB | (+) [59] |
| TR | Trade Openness (% of GDP) [53] | WB | (+) (–) [60] |
| NR | Natural Resource Rents (% of GDP) [30] | WB | (+) [30] |
| CAP | Gross Capital Formation (% of GDP) [61] | WB | (+) [62] |
| FGL | KOF Index of Financial Globalization [52] | KOF Swiss Economic Institute | (+) (–) [63] |
Table 3.
Summary statistics.
| Statistics/Variables | lnREN | lnGDP | lnTR | lnNR | lnCAP | lnFGL |
|---|---|---|---|---|---|---|
| Mean | 0.845 | 28.215 | 3.775 | -0.713 | 3.126 | 4.140 |
| Median | 0.916 | 28.191 | 3.868 | -0.457 | 3.103 | 4.265 |
| Std. dev. | 1.741 | 0.891 | 0.420 | 1.794 | 0.215 | 0.342 |
| Min. | -4.175 | 26.458 | 2.718 | -4.520 | 2.683 | 2.411 |
| Max. | 4.966 | 30.516 | 4.527 | 2.272 | 3.842 | 4.519 |
| Skewness | -0.390 | 0.476 | -0.542 | -0.291 | 1.080 | -1.721 |
| Kurtosis | 3.073 | 3.025 | 2.580 | 1.828 | 4.739 | 7.007 |
| Obs. | 435 | 435 | 435 | 435 | 435 | 435 |
| Correlation matrix | ||||||
| lnREN | 1.000 | |||||
| lnGDP | 0.688 | 1.000 | ||||
| lnTR | 0.100 | -0.318 | 1.000 | |||
| lnNR | -0.073 | -0.220 | -0.047 | 1.000 | ||
| lnCAP | -0.095 | 0.079 | -0.018 | 0.056 | 1.000 | |
| lnFGL | 0.338 | 0.169 | 0.586 | -0.366 | -0.156 | 1.000 |
Table 4.
CD and CADF tests results.
| Variables | CD-test | P- Value | Corr | Abs (corr) | CADF test statistic | |
| L | Δ | |||||
| lnREN | 51.91*** | 0.000 | 0.941 | 0.941 | 0.657 | -3.066*** |
| lnGDP | 52.65*** | 0.000 | 0.954 | 0.954 | -1.207 | -3.096*** |
| lnTR | 39.66*** | 0.000 | 0.719 | 0.720 | -1.106 | -1.930** |
| lnNR | 25.29*** | 0.000 | 0.458 | 0.488 | -0.332 | -9.495*** |
| lnCAP | 4.17*** | 0.000 | 0.076 | 0.313 | -0.391 | -7.072*** |
| lnFGL | 40.24*** | 0.000 | 0.729 | 0.732 | -0.591 | -4.382*** |
Note: *** denotes significance at 1% level.
Table 5.
Slope homogeneity analysis.
| Tests | Statistics | p-value |
|---|---|---|
| Δ | 20.355*** | 0.000 |
| Δ-adjusted | 23.370*** | 0.000 |
Note: *** denotes significance at 1% level.
Table 6.
Co-integration analysis.
| Cointegration tests | Statistic | P- Value |
|---|---|---|
| Pedroni | ||
| Modified Phillips&Perron t | 4.390*** | 0.000 |
| Phillips&Perron t | 1.120 | 0.131 |
| Augmented Dickey&Fuller t | 2.008** | 0.022 |
| Kao | ||
| Modified Dickey&Fuller t | -0.486 | 0.313 |
| Dickey Fuller t | -1.799** | 0.035 |
| Augmented Dickey&Fuller t | -2.033** | 0.021 |
| Unadjusted modified Dickey&Fuller t | 0.547 | 0.291 |
| Unadjusted Dickey&Fuller t | -1.163 | 0.122 |
| Westerlund | ||
| Variance-Ratio | 2.763*** | 0.002 |
Note: *** and ** denote significance at 1% and 5% level, respectively.
Table 7.
DSUR analysis.
| Regressors | Model 1 | Model 2 | Model 3 | Model 4 |
| lnGDP | 0.049*** (03.12) |
0.064*** (3.92) |
0.048*** (2.86) |
0.069*** (4.04) |
| lnTR | 0.049** (2.00) |
0.064** (2.57) |
0.050** (2.03) |
0.143*** (4.53) |
| lnNR | 0.015*** (3.13) |
0.013*** (2.69) |
0.005 (0.99) |
|
| lnCAP | 0.135*** (3.28) |
0.091** (2.19) |
||
| lnFGL | -0.173*** (-4.60) |
|||
| Constant | -1.414*** (-2.82) |
-1.871***(-3.62) | -1.801*** (-3.52) |
-1.889*** (-3.78) |
| R2 | 0.988 | 0.989 | 0.989 | 0.989 |
| χ2-statistic | 37133.71 | 38011.72 | 38993.57 | 40975.63 |
| Prob | 0.000 | 0.000 | 0.000 | 0.000 |
| RMSE | 0.178 | 0.176 | 0.174 | 0.170 |
| Countries | 15 | 15 | 15 | 15 |
| Observation | 420 | 420 | 420 | 420 |
Note: *** and ** denote significance at 1% and 5% level, respectively.
Table 8.
Bootstrap causality analysis.
| Hypotheses | W-Stat. | Zbar-Stat. | p-value | Causality |
| lnGDP ≠> lnREN | 4.472 | 9.510 | 0.026** | Unidirectional |
| lnREN ≠> lnGDP | 2.160 | 3.178 | 0.576 | |
| lnTR ≠> lnREN | 2.126 | 3.083 | 0.068* | Unidirectional |
| lnREN ≠> lnTR | 2.679 | 4.600 | 0.350 | |
| lnNR ≠> lnREN | 2.140 | 3.124 | 0.024** | Unidirectional |
| lnREN ≠> lnNR | 2.614 | 4.422 | 0.198 | |
| lnCAP ≠> lnREN | 2.118 | 3.062 | 0.024** | Unidirectional |
| lnREN ≠> lnCAP | 2.650 | 4.519 | 0.164 | |
| lnFGL ≠> lnREN | 5.039 | 11.062 | 0.000*** | Unidirectional |
| lnREN ≠> lnFGL | 1.322 | 0.882 | 0.842 |
Note: ***, ** and * denote significance at 1%, 5% and 10% level, respectively.
Disclaimer/Publisher’s Note: The statements, opinions and data contained in all publications are solely those of the individual author(s) and contributor(s) and not of MDPI and/or the editor(s). MDPI and/or the editor(s) disclaim responsibility for any injury to people or property resulting from any ideas, methods, instructions or products referred to in the content. |
© 2025 by the authors. Licensee MDPI, Basel, Switzerland. This article is an open access article distributed under the terms and conditions of the Creative Commons Attribution (CC BY) license (http://creativecommons.org/licenses/by/4.0/).
Copyright: This open access article is published under a Creative Commons CC BY 4.0 license, which permit the free download, distribution, and reuse, provided that the author and preprint are cited in any reuse.


