
Submitted:
18 November 2024
Posted:
18 November 2024
You are already at the latest version
Abstract
This study explores the long-run relationship between environmental footprint (EnF), renewable energy consumption, energy use, industrial growth, and urbanization in Saudi Arabia from 1990 to 2023, employing the Autoregressive Distributed Lag (ARDL) model, alongside Fully Modified Ordinary Least Squares (FMOLS), Dynamic Ordinary Least Squares (DOLS), and Canonical Cointegrating Regression (CCR) for robustness checks. Results indicate a significant long-term relationship among the variables, with renewable energy adoption emerging as a crucial factor in reducing carbon emissions. The ARDL bounds test confirms the existence of cointegration, re-vealing the dynamic interplay between renewable energy, economic growth, and environmental sustainability. The findings show that renewable energy consumption significantly reduces en-vironmental footprint (CO2 emissions), supporting Saudi Arabia's Vision 2030 goals for economic diversification and sustainable development. However, industrial expansion, while critical for economic growth, still contributes to increased emissions, underscoring the need for further in-vestment in clean technologies. The study also highlights the role of urbanization, which, while essential for development, poses challenges for environmental sustainability. Short-term dynamics, represented by the Error Correction Model, indicate a fast adjustment speed toward equilibrium, with deviations corrected by approximately 52% each period. The study offers valuable insights for policymakers aiming to balance industrial growth with environmental protection, emphasizing the need for strategic investments in renewable energy and energy efficiency. This research contributes to the understanding of energy-economy-environment interactions in oil-rich economies, providing a foundation for future studies to explore the impact of advanced technologies and policy interventions on sustainable development
Keywords: Environmental Footprint; Co-integration; Renewable energy; Industrialization; Energy
Keywords:
Keywords: Environmental Footprint
; Co-integration
; Renewable energy
; Industrialization
; Energy
1. Introduction
The Kingdom of Saudi Arabia, historically recognized as a leading global oil producer, is undergoing a significant transformation in its economic and environmental strategies. Traditionally, the nation's prosperity has been closely tied to its vast oil reserves, establishing it as a central figure in the global energy market. As the largest country in the Middle East by land area and the second-largest producer within the Organization of the Petroleum Exporting Countries (OPEC), Saudi Arabia has wielded considerable influence over global energy dynamics. However, increasing global awareness of climate change and a collective commitment to reducing carbon emissions have prompted the Kingdom to reassess its development strategies, recognizing that continued reliance on fossil fuels is unsustainable both environmentally and economically.
In response, Saudi Arabia has embarked on an ambitious path to diversify its economy and reduce its carbon footprint, as outlined in its Vision 2030 framework. This transformative blueprint aims to decrease the Kingdom's dependence on oil, diversify its economic activities, and promote sustainable development. A central pillar of this vision is the transition to renewable energy, deemed essential for reducing carbon emissions and ensuring long-term energy security and economic stability. The Kingdom has made significant investments in renewable energy projects, particularly in solar and wind energy, to increase the share of renewables in its energy mix. For instance, the National Renewable Energy Program aims to have renewables contribute approximately 50% to the energy mix used for electricity production by [1]
Alongside these efforts, Saudi Arabia is focusing on industrial growth to diversify its economy, aiming to become a global hub for manufacturing and technology. However, this industrial expansion, coupled with the Kingdom’s energy consumption patterns, raises critical questions about the overall impact on carbon emissions. Studies have shown that rapid industrialization and increasing energy consumption, primarily derived from fossil fuels, have led to heightened greenhouse gas emissions, notably carbon dioxide (CO₂), [2]
This study explores the complex interplay between renewable energy adoption, energy consumption, and industrial growth in Saudi Arabia, and their collective impact on the nation’s carbon footprint. The Autoregressive Distributed Lag (ARDL) model is employed to analyze the relationships between these variables, providing a robust framework for understanding both short-term and long-term effects. The ARDL approach is particularly well-suited for this analysis, given its ability to handle variables that are integrated of different orders, and its effectiveness in examining the dynamics of economic and environmental relationships over time.
Utilizing a comprehensive dataset spanning a 33-year period from 1990 to 2023, this research employs advanced econometric techniques—including ARDL, Dynamic Ordinary Least Squares (DOLS), Fully Modified Ordinary Least Squares (FMOLS), and Canonical Cointegrating Regression (CCR)—to ensure the robustness of the results. The findings of this study hold substantial implications for policymakers and regulatory bodies responsible for environmental protection, offering evidence-based insights to guide the Kingdom’s transition towards a greener economy.
By focusing on Saudi Arabia, this study contributes to the growing body of literature on the environmental implications of energy and industrial policies in oil-rich economies. It addresses the crucial question of whether the Kingdom’s shift towards renewable energy is sufficient to offset the carbon emissions associated with its growing industrial sector and high levels of energy consumption. Moreover, the study offers insights into the potential trade-offs and synergies between economic growth and environmental sustainability, providing policymakers with evidence-based recommendations to guide the Kingdom’s transition towards a greener economy.
Through this analysis, the paper aims to shed light on the effectiveness of Saudi Arabia’s current energy and industrial policies in achieving its environmental goals, as well as to identify areas where further action is needed. The findings of this study will have important implications not only for Saudi Arabia but also for other oil-dependent nations facing similar challenges as they navigate the complex process of economic diversification and environmental stewardship. Ultimately, the study underscores the importance of a balanced approach that integrates economic development with environmental responsibility, paving the way for a sustainable and resilient future for Saudi Arabia.
2. Literature Review
The relationship between renewable energy, economic growth, urbanization, industrialization, and energy consumption with carbon dioxide emissions in Saudi Arabia is complex, as each factor influences CO2 emissions differently. Renewable energy reduces emissions, especially at higher energy consumption levels [3-4], and the Saudi Vision 2030 aims to generate 58.7 GW from renewable sources to cut emissions [5]. Economic growth often leads to increased emissions, necessitating sustainable policies [6-7]. Urbanization contributes to emissions but offers opportunities for reduction through sustainable planning. Industrialization is a major emission source, and decoupling growth from emissions requires adopting cleaner technologies and energy-efficient practices.
2.1. Environmental Footprints and the Impact of Renewable Energy
The shift to renewable energy in Saudi Arabia plays a crucial role in reducing its carbon footprint, as illustrated by various studies using ARDL analysis. This method uncovers significant relationships between renewable energy adoption and CO₂ emissions, indicating both short- and long-term impacts. According to [8], industrial sector growth is associated with a decrease in CO₂ emissions, showing reductions of 0.88 in the short term and 0.55 in the long term for each unit increase in industrial output when renewable energy is utilized. Economically, the transition is advantageous, as hybrid energy systems show a lower levelized cost of electricity (LCOE) than traditional sources, leading to meaningful emissions reductions [9].
In his study on the impact of renewable energy consumption on environmental quality in Saudi Arabia, [4] underscores the role of renewable energy in reducing CO₂ emissions, with its impact growing at higher quantiles. Additionally, renewable energy utilization, alongside strategic policies such as those in Vision 2030, is key to managing natural resources, reducing the ecological footprint, and achieving environmental [10-11]. The empirical validity of the Environmental Kuznets Curve (EKC) is also confirmed, suggesting that as economic growth advances, environmental quality improves, underscoring the importance of renewable energy in further diminishing the ecological footprint [12]. These findings collectively affirm the role of renewable energy in mitigating carbon footprints and fostering sustainable development in Saudi Arabia.
Furthermore, the adoption of renewable energy has been shown to reduce the material footprint, thus supporting a more sustainable environment [13]. However, integrating renewable energy within Saudi Arabia’s oil and gas-dominated infrastructure poses challenges, particularly in updating grids and establishing energy storage solutions to handle renewable intermittency. [14] highlight the importance of green hydrogen in this transition, emphasizing the need for supportive policies and technological advancements. Balancing economic diversification with Saudi Arabia’s status as a major energy exporter remains a crucial challenge as the Kingdom pursues its ambitious energy goals.
Internationally, [15] used the ARDL model to find a negative relationship between renewable energy and carbon emissions in China. Similarly, [16] demonstrated a negative relationship between technological factors and environmental emissions in Pakistan. Meanwhile, [17] applied panel long-run regression models, revealing a significant link between renewable energy consumption and environmental pollution reduction.
The integration of renewable energy, efficient consumption, and industrial growth significantly impacts environmental sustainability. As industries expand, energy demands rise, often increasing greenhouse gas (GHG) emissions when fossil fuels are used. Renewable sources like wind, solar, and biomass offer a sustainable solution, reducing emissions and environmental strain by replacing non-renewable energy [18]. This shift enables “green growth,” where economic development progresses without compromising environmental health [19].
Investing in renewables allows industries to lower carbon footprints, improve air and water quality, and protect biodiversity [20]. Energy efficiency also plays a crucial role by reducing waste and emissions, positioning industries as leaders in sustainable practices [21]. However, renewables come with challenges like supply variability and higher initial costs, which can impact productivity. Despite these, the long-term benefits—including energy security and “green jobs”—underscore the need for strategic investment and policy support for sustainable industrial growth [22].
Furthermore, Figure 1 shows that as renewable energy adoption rises, energy consumption and environmental footprint decrease, while industrial growth benefits. This highlights renewable energy’s role in supporting sustainable industrial expansion. The relationship between renewable energy, energy consumption, and industrial growth is essential for reducing industrial environmental impacts and aligning economic growth with global sustainability goals, like the Paris Agreement and the SDGs [23].
2.2. Influence of Urbanization on Environmental Footprints
Urbanization has a profound impact on the environmental footprint by modifying resource consumption patterns and contributing to ecological degradation. The rapid expansion of urban areas leads to increased resource demand, which adversely affects environmental quality and sustainability. Urbanization is linked to deforestation, increased energy use, and pollution, all of which contribute to a larger ecological footprint. Achieving sustainable urbanization requires a transition towards more resource-efficient and equitable development practices [24-25].
In Asian countries, [17] examined the fundamental connection between urbanization, energy use, and carbon emissions, finding a strong positive correlation between urbanization and carbon emissions. In Southeast Asia, [26] investigated the relationship between energy use, carbon emissions, and urbanization, concluding that urbanization is a source of environmental emissions. Studies on urbanization's impact on carbon emissions suggest that urbanization can be beneficial for environmental development when robust economic growth propels the nation to a specific level. For example, [27-28] found a significant negative relationship between urbanization and carbon emissions when analysing data from sub-Saharan African nations. [29] found similar results in East Asian countries, while [30] presented consistent findings.
In Turkey, urbanization has been shown to negatively impact the ecological footprint, with economic growth and biological capacity further exacerbating this effect [31]. In some MENA countries, urbanization has been associated with a reduction in the ecological footprint (EFP), as observed in Algeria, Bahrain, Tunisia, and Morocco, where urbanization does not significantly harm environmental quality [32].
The relationship between urbanization and the environmental footprint in Gulf Cooperation Council (GCC) countries is complex, influenced by factors such as economic growth, energy consumption, and natural resource rents. While urbanization often contributes to increased ecological footprints, the GCC countries present a more nuanced picture. In some instances, urbanization has been linked to a reduction in the ecological footprint, suggesting that urban development may incorporate sustainable practices or efficient resource use [33]. However, other studies indicate that urbanization contributes to increased CO2 emissions and reduced carbon productivity, highlighting the environmental challenges associated with rapid urban growth [34-35].
Urbanization in the GCC has been shown to decrease the ecological footprint by 1.5327% for every 1% increase in urbanization, indicating potential efficiencies in urban areas [33]. Conversely, urbanization is also linked to increased CO2 emissions in countries like Bahrain, Oman, Qatar, and the UAE, suggesting a mixed impact on environmental sustainability [34]
2.3. Industrialization and Environmental Footprints
Industrialization has significantly contributed to the environmental footprint, affecting ecosystems and exacerbating climate change. While industrialization has boosted economic growth, it has also led to increased energy consumption and the use of fossil fuels, which are major contributors to environmental degradation [35]. The ecological footprint, which measures human demand on Earth's ecosystems, is heavily influenced by industrial activities, particularly in newly industrialized countries (NICs) where energy use and fossil fuel consumption are prevalent [36]. A shift towards green technologies and renewable energy sources is essential to mitigate these adverse effects [37].
The global ecological footprint is impacted by industrialization, with considerable negative effects observed in countries at lower levels of economic development [38]. Industrialization in the MENA region has significantly affected environmental footprints, leading to increased ecological footprints and CO2 emissions. The region's reliance on non-renewable energy sources and rapid urbanization has exacerbated these environmental challenges. However, there is potential for improvement through the adoption of renewable energy and sustainable practices.
In the MENA region, industrial production is directly linked to environmental degradation, with notable spatial autocorrelation in ecological footprint levels across countries [39]. Moreover, economic growth and industrialization are positively correlated with CO2 emissions, indicating that as economic growth progresses, environmental degradation worsens [40].
In the Gulf Cooperation Council (GCC) countries, industrialization has significantly contributed to environmental footprints, mainly through increased ecological and carbon footprints. The reliance on fossil fuels for energy and industrial activities has exacerbated environmental degradation, making industrialization a major driver of this trend. Despite having a relatively small population, the GCC countries have high per capita oil consumption, resulting in substantial ecological impacts [41-42]. Additionally, industrialization, coupled with financial development, has been shown to have long-term detrimental effects on the environment [41].
2.4. Energy Consumption and Environmental Footprints
Energy consumption significantly affects environmental footprints, with multiple factors shaping this relationship across different regions. The Environmental Kuznets Curve (EKC) framework is frequently employed to explore these dynamics, indicating that economic growth initially leads to increased environmental degradation, which subsequently declines as income levels rise and environmental awareness improves [43-44]. In Europe, renewable energy consumption and R&D investments have been shown to reduce ecological footprints, underscoring the role of green energy and innovation in lessening environmental impacts [43].
In the MENA region, energy consumption and environmental footprints are closely interlinked, with various factors influencing both positively and negatively. The region faces significant environmental challenges due to its dependence on fossil fuels and rapid urbanization, which contribute to high carbon dioxide emissions and ecological footprints. However, adopting renewable energy sources and energy efficiency measures can help mitigate these effects.
Economic growth in the MENA region has a positive effect on CO2 emissions, suggesting that environmental degradation tends to rise as economies expand [45]. In the GCC countries, energy consumption is positively correlated with economic growth, supporting industrial activities and economic development [46-47]. The bidirectional causal relationship between energy consumption and economic growth implies that energy policies can have a significant impact on economic outcomes [47].
Economic growth in Saudi Arabia directly affects the ecological footprint, with a 1% increase in growth resulting in a 0.02828% increase in the footprint [48].
2.5. Economic Growth and Environmental Footprints
Economic growth and environmental footprints are intricately related, with economic expansion often leading to increased ecological impacts. However, this relationship is complex and varies across different regions and economic contexts. Research suggests that while economic growth can improve quality of life, it frequently contributes to environmental degradation through higher energy consumption and increased greenhouse gas emissions. This dynamic necessitates a careful balance between economic development and environmental sustainability.
In the MENA region, economic growth is closely linked to environmental footprints, as numerous studies have shown. The region's economic activities, particularly industrialization and urbanization, have significantly increased CO2 emissions and ecological footprints. While financial inclusion supports economic growth, it has been found to negatively impact environmental quality unless moderated by high institutional quality [49]. The relationship between economic growth and environmental degradation in the MENA region is further complicated by the reliance on fossil fuels and the challenges posed by water scarcity and energy consumption [50].
In the Gulf Cooperation Council (GCC) countries, economic growth is also closely associated with environmental footprints, influenced by various factors. The GCC's dependence on natural resources and energy consumption has led to significant environmental degradation, though opportunities for sustainable development still exist. According to the Environmental Kuznets Curve hypothesis, environmental degradation initially increases with rising income but eventually decreases—a trend observed in the GCC countries [51].
The relationship between economic growth and CO2 emissions in Saudi Arabia is a significant concern, given the nation's reliance on fossil fuels and its position as a leading oil producer globally. Study [52] explored this dynamic and found that economic expansion in Saudi Arabia has historically led to higher CO2 emissions, driven primarily by the energy-intensive nature of its industrial and transportation sectors. This research emphasizes the challenges Saudi Arabia faces in reconciling economic progress with environmental sustainability, as ongoing GDP growth is expected to increase carbon emissions unless significant reforms are enacted. Moreover, research [53] found that although economic growth typically results in higher emissions, incorporating renewable energy into the national grid can mitigate this effect. Osman suggests that a diversified energy mix, with a substantial share of renewable sources, is crucial for Saudi Arabia to decouple economic growth from environmental damage.
Study [54] further demonstrated that increasing the proportion of green energy in Saudi Arabia's energy framework could significantly reduce carbon emissions without hindering economic growth. This study aligns with the broader global dialogue on sustainable development, advocating for economic growth that is environmentally responsible. Additionally, another work [55] found that improving energy efficiency, particularly in air-conditioning systems, could lead to substantial reductions in energy consumption and carbon emissions, thereby contributing to a more sustainable economic model.
3. Data, Methodology, and Estimation Strategies
3.1. Data
Annual data from 1990 to 2023 is utilized for this empirical analysis. The dependent variable is the environmental footprint (EF), while the independent variables include economic growth (PGDP), renewable energy (REN), energy consumption (ENERG), industrial value-added (INVAD), and urbanization (URB). EF serves as a proxy for CO2 emissions. Economic growth is represented by per capita GDP in constant 2010 US dollars. Renewable energy, energy consumption, and industrial value-added are expressed as percentages of GDP, while urbanization is measured as the ratio of the urban population to the total population. Data for all variables are obtained from the World Bank's World Development Indicators (2023), and all data have been transformed into their natural logarithms to mitigate fluctuations in the dataset.
The Figure 2, Figure 3, Figure 4, Figure 5 and Figure 6 presented below illustrate the relationships between various economic and environmental factors and CO2 emissions, providing insightful visual representations of how these factors interact. Figure 2 demonstrates the correlation between urbanization (Ln URB) and CO2 emissions (LnEnF. It indicates that as urbanization increases, CO2 emissions also tend to rise, likely reflecting the increased energy demands and infrastructural growth associated with expanding urban areas. Similarly, Figure 3 shows the relationship between energy consumption (Ln ENERG) and CO2 emissions, highlighting the direct link between increased energy use and higher emissions, which aligns with the understanding that energy-intensive activities are a major contributor to carbon emissions.
Figure 4, which explores the impact of renewable energy (Ln REN) on CO2 emissions, likely provides a contrast to the previous figures by illustrating a potential mitigating effect, where greater adoption of renewable energy sources may contribute to reduced emissions. Figure 5 examines the relationship between industrial value added (Ln INDVAD) and CO2 emissions, suggesting that as industrial activities contribute more to the economy, they also increase the emissions footprint. Finally, Figure 6 captures the relationship between GDP per capita (Ln GDPc) and CO2 emissions, reflecting the tension between economic growth and environmental sustainability. While higher GDP per capita is often associated with increased emissions, it also provides the financial resources needed to invest in cleaner technologies. The challenge, therefore, lies in decoupling economic growth from carbon emissions to achieve sustainable development. Overall, the figures collectively underscore the complexities involved in balancing economic development, energy use, and environmental impacts, with renewable energy emerging as a key factor in mitigating CO2 emissions3.2. Data Collection
The study conducted an extensive search of Scopus-indexed, peer-reviewed journal articles, conference papers, and industry reports published between 2013 and 2023. The Scopus database was chosen for its comprehensive coverage of high-quality academic literature. Keywords and phrases such as “Big Data in Accounting,” “Artificial Intelligence in Accounting,” “BD and AI Synergy,” “Automation in Accounting,” “AI-Driven Decision Making,” and “Challenges of BD and AI in Accounting” were employed to identify relevant studies.
3.2. Model Specification
To examine the impact of per capita income, renewable energy, energy consumption, industrial growth, and urbanization on environmental footprint, a model can be developed by drawing on methodologies from multiple studies [56-59]. These studies emphasize the intricate relationships among economic and energy variables and their combined influence on environmental degradation. The model seeks to encapsulate these dynamics through a functional framework that accounts for both the direct and indirect effects of the identified factors, as shown in Equation (1).
Where:
EnFit = F( RENit , ENERGit, PGDPit, INDAVDit, URBit)
EnFti is the Environmental footprint,
REN is renewable energy,
ENERGti is an energy consumption ,
GDP is per capita income
LINDAVD is an industrial value-added and
URBit is urbanization.
In explicit terms, the model is expressed as
Ln EnFti = α0 + α1Ln RENti + α2Ln ENERGit + α3 Ln PGDP it +α4 Ln INDAVDit + α5 Ln URBit + εit
The given Equation (2) illustrates the relationship between the environmental footprint (Ln EnF) and several economic and energy-related factors for country iii at time t. The variables include renewable energy consumption (Ln REN), total energy consumption (Ln ENERG), per capita GDP (Ln PGDP), industrial value added (LINDAVD), and urbanization (URB). The expected parameter signs indicate that renewable energy (α1) is likely to reduce the environmental footprint, reflecting its positive impact on sustainability. Conversely, total energy consumption (α2) and industrial value added (α4) are expected to have a positive impact on the environmental footprint, suggesting that increased energy use and industrial activities contribute to higher emissions. Urbanization (α5) is also anticipated to increase the environmental footprint due to the greater energy demand and economic activity in urban areas. The effect of per capita GDP (α3) is ambiguous—it may either increase emissions due to economic growth or reduce them if the country has reached a stage where economic growth leads to environmental improvements, as suggested by the Environmental Kuznets Curve hypothesis.
3.3. Estimation Strategies
3.3.1. ARDL Model
The current paper employs the Autoregressive Distributed Lag (ARDL) bounds testing approach to explore the long-run equilibrium relationships and short-term dynamics between carbon emissions, real GDP, energy consumption, urbanization, and industrial growth in Saudi Arabia. The ARDL cointegration approach, developed by [60], is highly suitable for addressing research questions involving both long-term and short-term interactions between variables, particularly when these variables have different integration orders.
The ARDL approach was selected due to several compelling reasons. First, it can be applied irrespective of whether the underlying regressors are purely I(0), purely I(1), or a mix of both. This feature provides significant flexibility compared to traditional cointegration techniques, such as the Engle-Granger or Johansen methods, which require that all variables be integrated in the same order. Since the study variables may have mixed integration orders, the ARDL bounds testing approach is particularly advantageous, as it avoids the pre-testing biases associated with traditional methods.
Second, the ARDL model allows for the estimation of both long-run and short-run relationships in a single reduced-form equation. This feature is highly beneficial for understanding the dynamic behavior of carbon emissions in response to changes in renewable energy use, energy consumption, urbanization, and industrial growth. The ability to model both short-term adjustments and long-term equilibria makes ARDL a powerful tool for capturing the complexity of economic and environmental interactions in Saudi Arabia. The ARDL approach also provides flexibility in selecting the appropriate lag length for each variable, which ensures that the model adequately captures the time dynamics of each relationship.
Furthermore, the ARDL bounds test provides an efficient means to test for the existence of a cointegrating relationship even in small sample sizes, making it an appropriate choice given the data limitations often encountered in studies focused on the Saudi Arabian context. The bounds testing procedure uses an F-statistic to determine whether a long-run relationship exists between the variables, regardless of whether the regressors are I(0) or I(1), allowing for more robust and valid inferences.
To validate the long-run estimation results obtained from the ARDL approach, this study also utilizes Fully Modified Ordinary Least Squares (FMOLS), Dynamic Ordinary Least Squares (DOLS), and Canonical Cointegrating Regression (CCR). These methods were used to provide robustness checks and to ensure the consistency and reliability of the results, as recommended by [61]. FMOLS, DOLS, and CCR are cointegration estimation techniques that correct for endogeneity and serial correlation, thereby enhancing the reliability of long-run coefficient estimates and providing a comprehensive understanding of the underlying dynamics.
The ARDL model's error correction representation also allows the identification of the speed of adjustment to equilibrium, which provides insights into how quickly carbon emissions adjust in response to shocks in economic growth, energy consumption, and other explanatory variables. The error correction term is expected to be negative and statistically significant, indicating that any deviation from the long-run equilibrium is corrected over time, thus confirming the presence of a stable relationship between the variables.
Overall, the ARDL bounds testing approach, along with robustness checks using FMOLS, DOLS, and CCR, provides a comprehensive and reliable framework for analyzing the effects of renewable energy, energy consumption, and industrial growth on Saudi Arabia's environmental footprint. This methodology ensures that both short-run dynamics and long-run equilibrium relationships are adequately addressed, thereby providing a thorough understanding of the economic and environmental challenges facing Saudi Arabia in its transition towards sustainability.
The following models (3) are used to examine this interconnected relationship:
where Δ and q are the first difference operator and optimal lag length, respectively.
The ARDL bounds test, originally proposed by Pesaran and Timmermann, uses the F-statistic to determine the presence of a long-run relationship between variables. The procedure begins by estimating an ARDL model using ordinary least squares (OLS) and applying the F-test to evaluate the significance of the lagged coefficients. The ARDL Hypothesis Testing Steps are summarized below:
- o
- Null (H₀): No long-run relationship among variables.
H0: δ1= δ2=⋯=δ k= 0
- o
- Alternative (H₁): Long-run relationship exists.
H1: δ1 ≠0, δ2≠0,⋯ ,δk≠0
Next step: Compare F-Statistic with Critical Bounds:
- Greater than Upper Bound: Reject H₀ (long-run relationship exists).
- Less than Lower Bound: Fail to reject H₀ (no long-run relationship).
- Between Bounds: Inconclusive; further testing needed.
Moreover, the analysis examines both short- and long-term relationships between the variables. Once cointegration is confirmed, long-run coefficients are estimated using Equation (3), followed by calculating the error correction term (ECT) to evaluate short-term dynamics and convergence to long-term equilibrium, as shown in Equation (4).
The parameter θ, referred to as the speed of adjustment, characterizes the rate at which adjustments take place. The initial lag of the error term, represented as ECTt-1, serves as an indicator of the error correction model. The anticipated value of ECT frequently lies between the numerical interval of 0 to 1. The inclusion of the ECT in the model provides valuable insights by demonstrating that although variables may exhibit non-stationarity in their levels, their fluctuations do not follow random walks. Moreover, the ECT establishes a connection between these variables through a long-term equilibrium relationship. The potential for reducing variance emerges in scenarios where ECT has both statistical significance and a detrimental impact
3.3.2. Unit Root Tests
Unit root tests are conducted to determine the stationarity of variables before applying the ARDL bounds testing approach. Stationarity is assessed using the Augmented Dickey-Fuller (ADF) test and the Phillips-Perron (PP) test, which help identify whether the variables are integrated of order zero, I(0), or order one, I(1). The ARDL model is suitable when variables are either I(0) or I(1), but not I(2) or higher. The results of these tests guide the appropriate specification of the ARDL model and ensure the robustness of the analysis.
The unit root test equation (5) can be written as follows:
ΔYt = α + βt + γYt-1 + δΔYt-1+ εit
Where: ΔYt represents the first difference of the variable Y at time t, α is the constant term, β represents the coefficient of the time trend, γ is the coefficient on the lagged level of the variable (which indicates the presence of a unit root if equal to zero), and δΔYt-1 captures the lagged difference terms to account for serial correlation. The null hypothesis of a unit root is tested by checking whether γ = 0, indicating non-stationarity.
3.3.3. Robustness Check
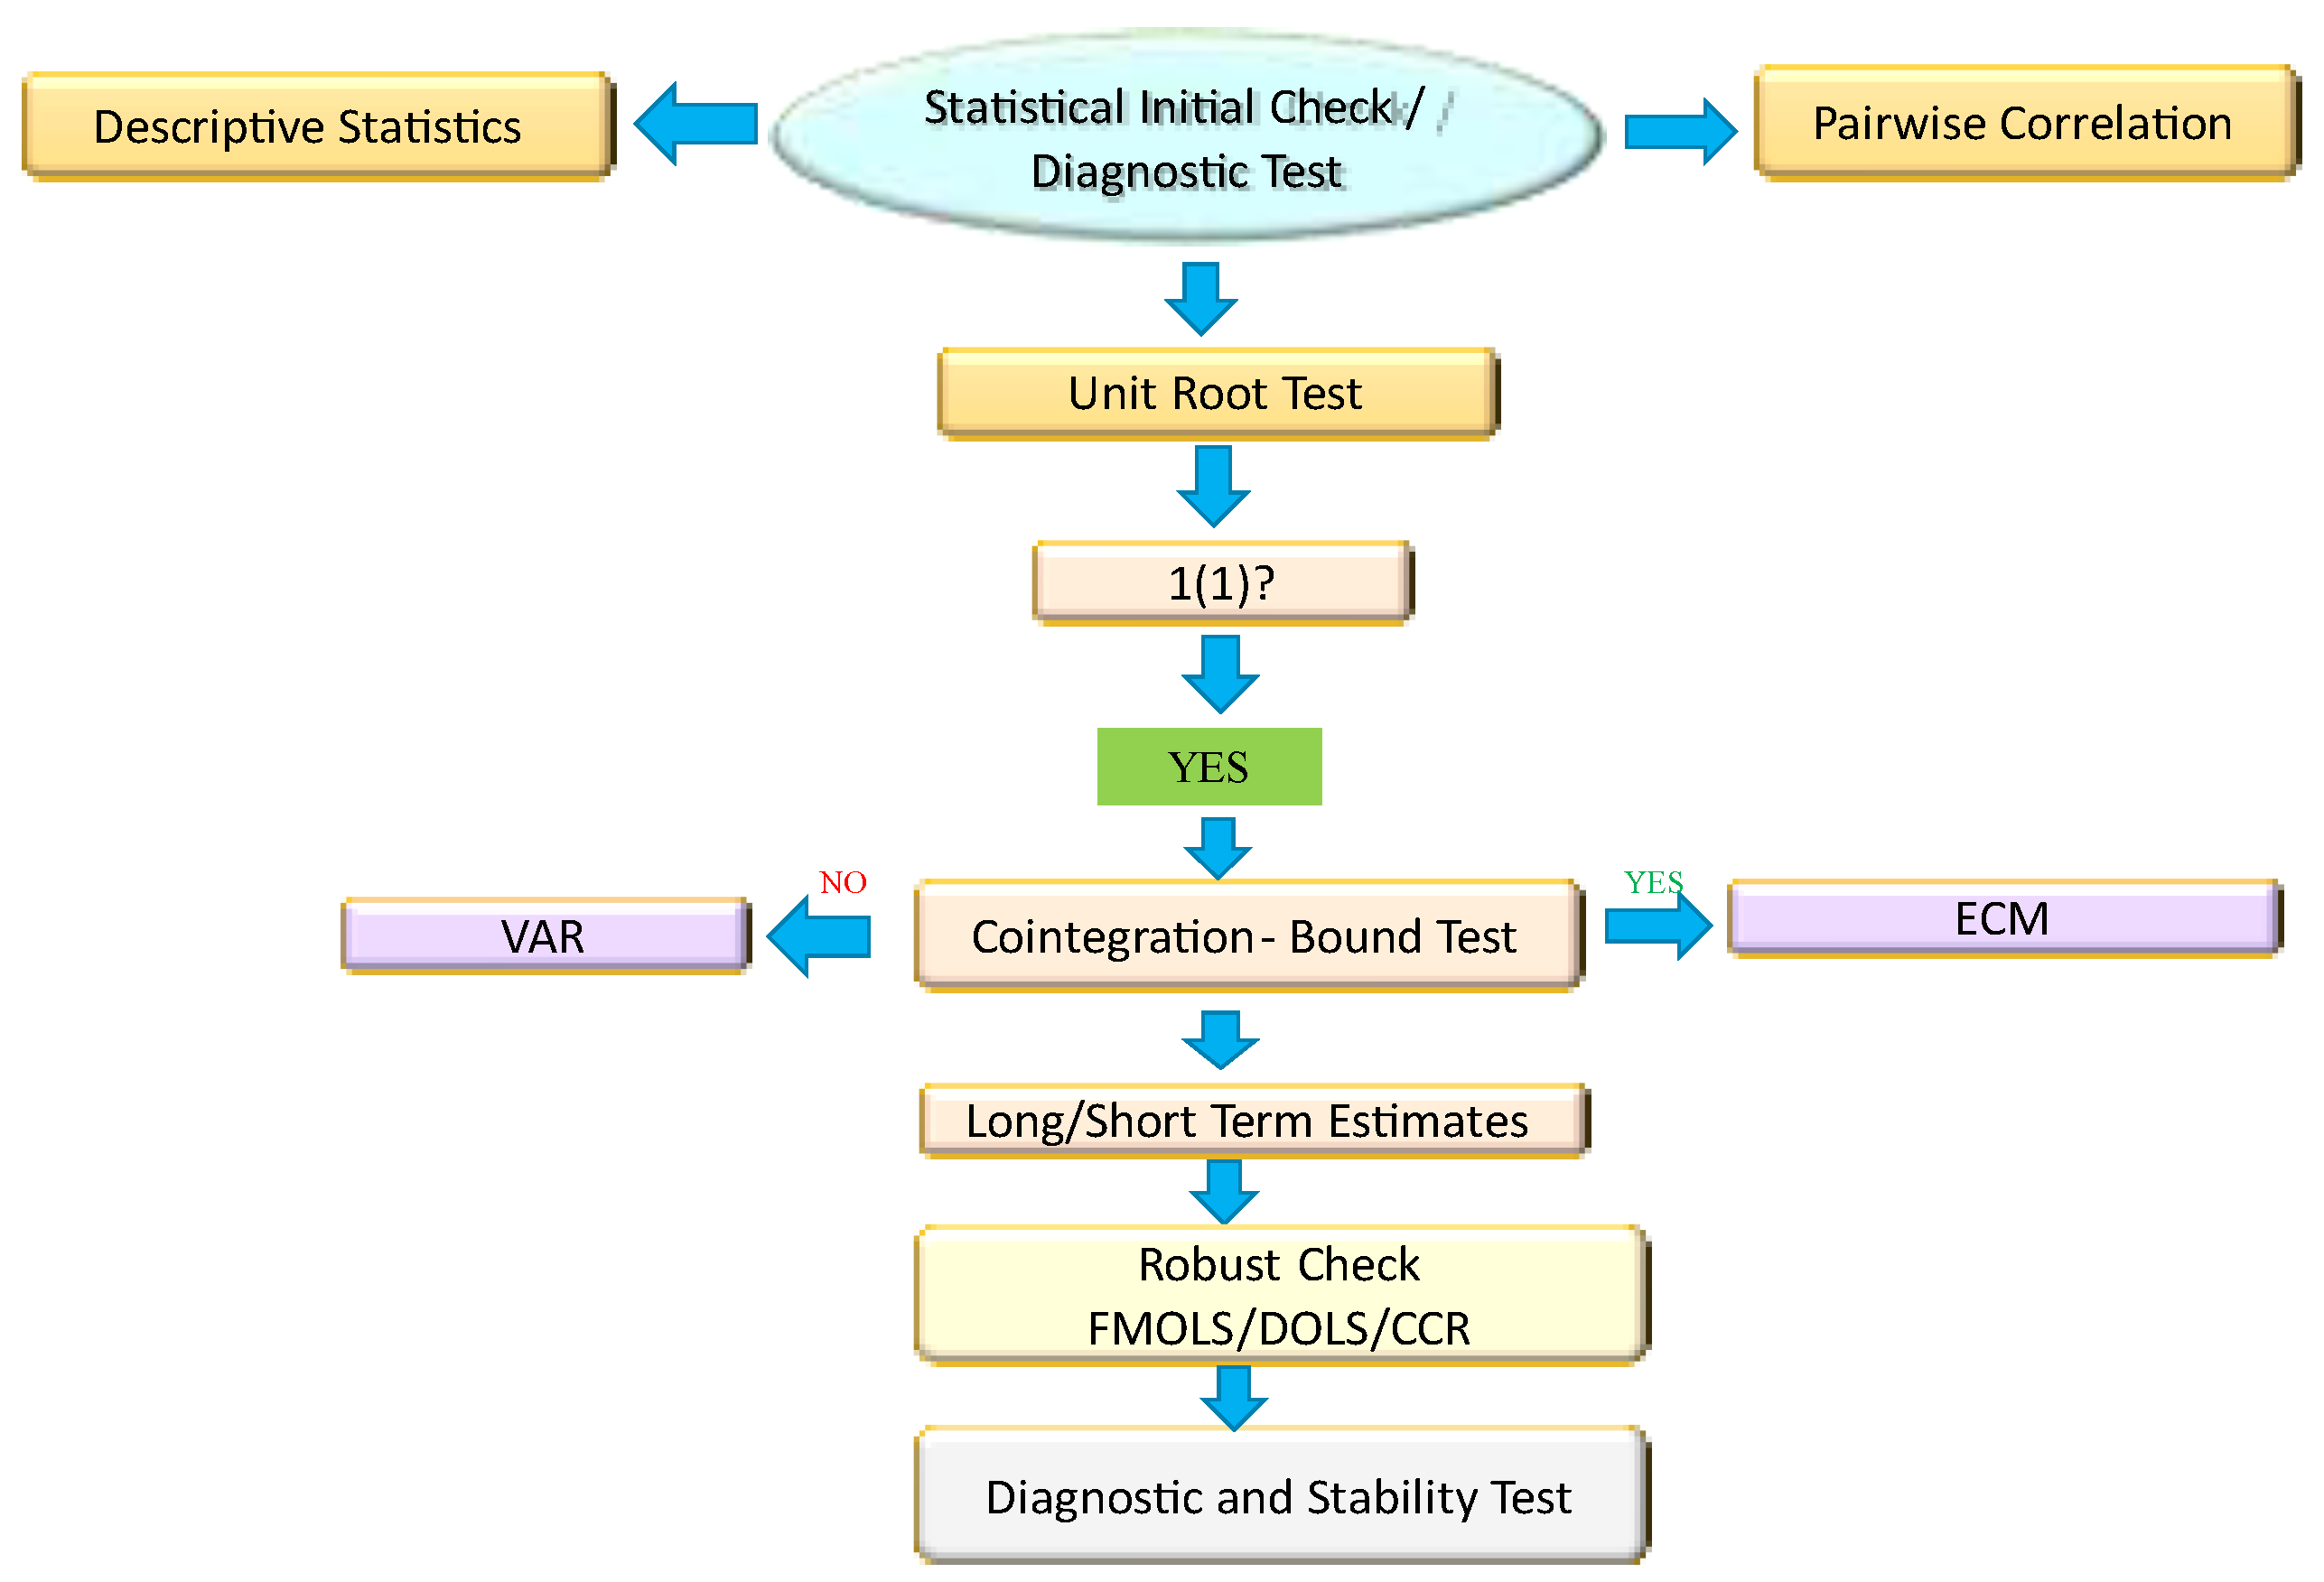
Evaluating the robustness of long-term coefficients in ARDL models can be effectively achieved through Fully Modified Ordinary Least Squares (FMOLS), Dynamic Ordinary Least Squares (DOLS), and Canonical Cointegrating Regression (CCR) techniques. These methods address common time series challenges, such as serial correlation and heteroscedasticity, ensuring reliable and consistent estimates of long-term relationships. FMOLS and DOLS are widely recognized for producing statistically significant results, as shown in studies such as [62], which examined bank performance in Cambodia. CCR further provides a robust framework for cointegration analysis, making it suitable for verifying ARDL outcomes. Additionally, these methods are valuable in panel data contexts where cross-sectional dependence and structural breaks may affect estimates, as noted by [63]. Together, FMOLS, DOLS, and CCR offer robust techniques for enhancing the validity of long-term ARDL estimates. The flowchart below summarizes the methodological scheme:
Scheme 1.
Data Analysis Procedure Flowchart.
4. Results and Discussion
4.1. Descriptive Analysis
The descriptive analysis reveals that Ln INDVAD (industrial value-added) exhibits the highest variation, with a standard deviation of 1.498, indicating significant fluctuations in the industrial sector, as shown in Table 1. In contrast, Ln URB (urbanization) is the most stable variable, with minimal variation (standard deviation of 0.028). The maximum value is observed in Ln INDVAD (3.123), highlighting a significant peak, while it also has the lowest minimum value (-1.940), showing considerable variability. LnREN (renewable energy use) also has a notable minimum value of -4.707, reflecting periods of low renewable energy usage.
Regarding normality, most variables—LnENF, LnENERG, LnPGDP, Ln INDVAD, and Ln URB—are approximately normally distributed based on the Jarque-Bera test (p-values > 0.05). However, LNREN has a p-value of 0.063, slightly above the 5% threshold, and displays positive skewness, suggesting some deviation from normality. This indicates that Ln REN might require further examination or transformation to meet normality assumptions in certain analyses.
The coefficient of variation (CV) indicates that LnINDVAD (industrial value-added) has extremely high relative variability (306.34%), reflecting significant fluctuations. Ln REN (renewable energy use) also has notable variability (13.17%), suggesting inconsistent adoption. LNENF and Ln ENERG have moderate CVs, indicating some stability. In contrast, Ln GDPC (GDP per capita) and Ln URB (urbanization) have very low CVs (both under 1%), indicating high stability with minimal fluctuations. Overall, industrial value-added and renewable energy use show the most variability, while GDP per capita and urbanization are the most stable.
Table 2 shows the correlation matrix of CO2 emissions (LNENF) which are strongly correlated with energy consumption (Ln ENERG, 0.900) and urbanization (Ln URB, 0.815), suggesting that both are key drivers of emissions. Urbanization is also highly correlated with energy consumption (0.965). There is a moderate positive correlation between GDPs per capita (LNPGDP) and both CO2 emissions (0.701) and energy consumption (0.596), linking economic growth to higher emissions. Industrial value-added (Ln INDVAD) and renewable energy use (LNREN) show weak or no significant correlations with most variables, indicating limited direct influence on emissions or energy consumption in this dataset.
4.2. Detecting Outliers and Assessing Multicollinearity
4.2.1. Outliers
The six box plots for various variables reveal distinct patterns across Oman, offering insights into the distribution and variability of key economic and environmental indicators. The box plots for Ln EnF, Ln ENERG, Ln PGDP, Ln INDVAD, Ln REN, and Ln URB depict how these variables are distributed across the dataset. Generally, moderate to low variability is observed, with relatively compact interquartile ranges for most variables, indicating consistent trends. Ln EnF, Ln INDVAD, and Ln REN show stable distributions with minimal skewness or outliers, suggesting steady patterns in emissions, industrial activity, and renewable energy adoption.
On the other hand, Ln ENERG and Ln URB display wider spreads, indicating variability in energy consumption and urbanization levels. Ln URB is skewed towards lower values, highlighting disparities in urbanization across different observations. Ln GDPC has a slight skew towards higher values, reflecting instances of elevated economic growth. These variations emphasize the need to consider regional disparities in energy consumption and urbanization when analyzing the dataset. Figure 7 effectively illustrates these trends, providing a visual summary of the distribution for the model variables.
4.2.2. Multicollinearity
The Variance Inflation Factor (VIF) results indicate that multicollinearity is not a major concern for the model, as all VIF values are below 5, as illustrated in Table 3. The highest VIF is 3.02 for Ln INDVAD, suggesting moderate correlation, but it is still within an acceptable range. Other variables, such as Ln ENERG, Ln PGDP, Ln EnF, Ln REN, and LnURPN, have VIF values below 3, indicating minimal multicollinearity. Overall, these results suggest that the independent variables are sufficiently distinct, allowing for a reliable interpretation of their effects in the model.
4.2. Unit Root Results
The results in Table 4 indicate that most variables are integrated of order I(1), becoming stationary only after first differencing, which implies the presence of long-term stochastic trends. This finding suggests that variables such as Ln PGDP, Ln REN, Ln ENERG, and Ln URB contain unit roots at the level, but become stationary when differenced. However, Ln Ind stands out as stationary at level (I(0)), indicating no unit root and a stable trend over time. The low probability values at the first difference for most variables confirm strong evidence against the null hypothesis of a unit root, reinforcing their I(1) status. Ln Enf shows a higher probability at the first difference, suggesting a weaker rejection of the unit root hypothesis. This combination of I(0) and I(1) variables is suitable for an ARDL model, which allows for variables with different integration orders and can explore both short- and long-term relationships. The I(1) variables contribute to the model’s long-run dynamics, while the I(0) variable can affect short-term adjustments, offering a comprehensive approach to studying potential cointegration among these factors. Results are summarized in Table 4 below:
4.3. ARDL Result
Based on Table 5, there is a clear long-run cointegration among variables under study, because the F-statistic value is greater than the lower and upper values, indicating the existence of cointegration in the model. Table 6 presents the ARDL Long-Run Form and Bound Test results, with an F-statistic of 26.36. This value exceeds the upper critical bounds at all significance levels (e.g., 5.23 at 1%), providing strong evidence of a long-run relationship between the dependent variable and the five explanatory variables (K = 5). Thus, the null hypothesis of no levels relationship is rejected, confirming cointegration among the variables.
The results from the ARDL Error Correction Regression in Table 5 reveal key insights into the short-term dynamics and long-term adjustment of the model. The coefficients for current and lagged energy consumption (Ln Energ) are 0.57 and 0.16, respectively, both highly significant (p-value = 0.00). This suggests that energy consumption has a positive and significant impact on the dependent variable in the short run, with a stronger influence from the current period compared to the previous one.
The coefficient for current GDP per capita (Ln PGDP) is -0.01 and insignificant (p-value = 0.87), indicating no immediate short-term impact. However, the lagged value (0.53) is positive and significant (p-value = 0.00), implying a delayed positive effect of GDP per capita changes on the dependent variable.
Renewable energy consumption (Ln REN) has a significant negative impact in the short term (-2.95, p-value = 0.00), suggesting that increased renewable energy consumption reduces the dependent variable. However, the lagged value (1.60, p-value = 0.00) is positive and significant, indicating a rebound or delayed positive effect of renewable energy on the dependent variable.
The coefficient for urbanization (Ln Urb) is -0.56 and not statistically significant (p-value = 0.19), suggesting that changes in urbanization do not have a notable short-term effect. Meanwhile, industrial value-added (Ln INDVD) shows a positive and significant impact (0.01, p-value = 0.00), indicating that increases in value-added contribute positively to the dependent variable in the short term.
For the Error Correction Term (Coint Eq(-1)), the coefficient is -0.52, significant (p-value = 0.000 < 0.05), and negative, indicating that approximately 52% of any deviation from the long-term equilibrium is corrected in each period. This reflects a relatively fast adjustment speed toward long-term equilibrium, demonstrating the model’s ability to quickly address short-term imbalances.
Table 6 shows the coefficients of the short-run model, besides indicating the long-run adjustment which explicitly in the negative sign of cointegration equation level (-0.52) the model will adjust monotonically at significance level 5% (p-value = 0.000 < 0.05).
4.4. Robustness Test Results
The robustness tests presented in Table 6, including FMOLS, DOLS, ROLS, and CCR methods, indicate consistent results across most variables, suggesting the stability of the estimated relationships. The coefficient for LnENERG remains positive and highly significant across all methods, with t-statistics well above the conventional significance levels, indicating a robust positive impact of energy consumption on the dependent variable. Similarly, Ln PGDP shows positive and significant coefficients across all models, further supporting a positive relationship with the outcome variable.
In contrast, Ln REN shows a negative coefficient in the FMOLS and ROLS estimates, suggesting a negative relationship with the dependent variable, but this effect is less consistent in the DOLS and CCR models, where it loses significance. This discrepancy may indicate some sensitivity in the renewable energy variable’s impact, which could benefit from further investigation. The Ln URB coefficient is negative and significant in most models, suggesting a negative influence of urbanization on the dependent variable. The high R-squared and adjusted R-squared values in FMOLS, DOLS, and CCR models imply strong explanatory power, with DOLS achieving the highest fit. Overall, the robustness checks confirm the stability of most relationships, though slight variations in certain variables warrant further scrutiny.

Table 6.
Robustness test results.
| FMOLS | DOLS | ROLS | CCR | |||||
| Coeff | t-Stats | Coeff | t-Stats | Coeff | z-Stats | Coeff | t-Stats | |
| LNENERG | 0.82483 | 7.487409 | 0.7289 | 7.9331 | 0.846709 | 5.876167 | 0.86977 | 6.19835 |
| LNPGDP | 4.45792 | 4.186441 | 5.6018 | 6.8802 | 3.362555 | 2.470193 | 4.967898 | 4.52174 |
| LNINDVAD | 0.005393 | 1.567901 | 0.0134 | 2.2417 | 0.001822 | 0.426336 | -96.9674 | -4.4889 |
| LNREN | -0.08078 | -8.68756 | -0.024 | -0.8292 | -0.08694 | -7.68205 | 0.00377 | 0.67328 |
| LNURB | -1.47342 | -2.13669 | -5.549 | -4.6332 | -1.37821 | -1.52492 | -0.07922 | -8.4917 |
| C | 425.2653 | 4.131107 | 552.74 | 6.6977 | 318.9391 | 2.424705 | -1.90459 | 0.0257 |
| R-squared | 0.963997 | 0.999433 | 0.792008 | 0.9611 | ||||
| Adjusted R2 | 0.955357 | 0.99671 | 0.744009 | 0.9518 | ||||
| S.E. of Regre | 0.033137 | 0.009017 | 0.045505 | 0.0344 | ||||
| DW stat | 2.796668 | 2.747657 | 1.7228 | |||||
| Mean dep.V | 2.617559 | 2.626124 | 2.609662 | 2.6175 | ||||
| S.D. dep.var | 0.156832 | 0.157204 | 0.045505 | 0.1568 | ||||
| SS resid | 0.027452 | 0.000407 | 0.053839 | 0.0296 | ||||
*, **, and *** denote the significance level at 1%, 5%, and 10% levels respectively
4.4. Diagnostic Tests
Table 7 summarizes the results of the ARDL model's diagnostic tests. First, the Breusch-Godfrey Serial Correlation LM Test checks for serial correlation in the residuals. The null hypothesis is that there is no serial correlation. The F-statistic is 0.1408 (p-value = 0.8699) and the χ² statistic is 0.611 (p-value = 0.7367). Since both p-values exceed 0.05, we fail to reject the null hypothesis, indicating no evidence of serial correlation in the residuals.
Second, the ARCH Heteroscedasticity Test evaluates the presence of autoregressive conditional heteroscedasticity (ARCH) in the residuals. The null hypothesis states that there is no ARCH effect. With p-values of 0.2800 (F-statistic) and 0.2342 (χ² statistic), which are both greater than 0.05, we fail to reject the null hypothesis, indicating no evidence of ARCH heteroscedasticity in the residuals.
Third, the Ramsey RESET Test assesses model misspecification, such as omitted variables or incorrect functional form. The null hypothesis is that the model is correctly specified. Here, the p-value is 0.0277, which is less than 0.05, leading to a rejection of the null hypothesis. This suggests potential model misspecification, such as the omission of relevant variables.
Lastly, the Jarque-Bera Normality Test checks whether the residuals follow a normal distribution. The null hypothesis states that the residuals are normally distributed. With a p-value of 0.8761, which is greater than 0.05, we fail to reject the null hypothesis. Therefore, the residuals are normally distributed.
4.4. Stability Test: The CUSUM and CUSUMSQ
The CUSUM test tracks the cumulative sum of the model's residuals over time, allowing for the detection of systematic departures from zero. The CUSUM of Squares (CUSUMSQ) further assesses stability by examining squared residuals, which amplifies larger deviations and highlights periods with increased variance, offering a more sensitive detection of instability. Both CUSUM and CUSUMSQ plots include 5% significance bounds, providing a visual test for structural stability. If the cumulative sums cross these bounds, this would suggest that there has been a significant structural change in the data or model, questioning the validity of parameters over time.
In Figure 8 (a) and (b), the plotted CUSUM and CUSUMSQ lines lie within the 5% significance bounds. This stability confirms that the model's coefficients are consistent and reliable over the sample period, adding robustness to the analysis. It suggests that despite potential changes in the underlying data, the model parameters have adapted without structural shifts. Studies (such as Brown, Durbin, and Evans, 1975) validate the CUSUM and CUSUMSQ methods for detecting shifts and enhancing model diagnostics. Studies like [64] affirm the sensitivity of these tests in econometric applications for monitoring parameter constancy, confirming the relevance of these diagnostics in this analysis.
5. Conclusions and Policy Implications
5.1. Conclusions
This study investigates the relationship between Enf, renewable energy consumption, energy use, industrial growth, and urbanization in Saudi Arabia from 1990 to 2023. Using advanced econometric models such as ARDL, FMOLS, DOLS, and CCR, the research confirms a significant long-term connection among these variables. Renewable energy consumption is found to be an effective tool for reducing CO2 emissions, aligning with Saudi Arabia's Vision 2030 for sustainable development. However, industrial growth and urbanization continue to present challenges for environmental sustainability due to their contributions to emissions. The study emphasizes the importance of strategic investments in renewable energy, clean technologies, and energy efficiency programs to balance economic growth with environmental protection. Policymakers are encouraged to focus on urban planning, public awareness, and renewable energy investments to ensure a sustainable future for the Kingdom. Limitations include the use of historical data, which may not capture future technological advances, and the study's focus on Saudi Arabia, which limits generalizability. Future research should examine emerging technologies and compare results across other GCC countries.
5.2. Policy Recommendations
To achieve a sustainable balance between economic growth and environmental protection, several policy measures are recommended:
1. Increase Investments in Renewable Energy: Expand financial support for renewable energy projects, particularly solar and wind energy, to enhance their share in the energy mix.
2. Promote Clean Industrial Technologies: Encourage the adoption of energy-efficient and low-carbon technologies in the industrial sector to reduce emissions without compromising economic growth.
3. Urban Sustainability Initiatives: Implement urban planning strategies that incorporate green spaces, energy-efficient infrastructure, and public transportation to mitigate the environmental impact of urbanization.
4. Energy Efficiency Programs: Launch nationwide energy efficiency programs aimed at reducing overall energy consumption, particularly in residential and industrial sectors.
5. Public Awareness Campaigns: Increase public awareness about the importance of renewable energy and energy conservation through education and community initiative
5.3. Limitations and Future Research
One primary limitation of this study is the absence of data on other critical factors, such as technological advancements and the integration of artificial intelligence, both of which may significantly influence environmental impacts and energy dynamics. Without incorporating these variables, the study may not fully capture the broader trajectory of renewable energy adoption or account for potential technological leaps that could shape future environmental outcomes. Another limitation is the study’s geographic focus on Saudi Arabia, which may restrict the applicability of findings to other regions or countries with different economic, regulatory, and environmental contexts. This narrower scope limits the generalizability of the results and may overlook varying factors influencing renewable energy trends in other parts of the world.
Future research should consider examining the role of emerging technologies, such as artificial intelligence and smart grid systems, in optimizing renewable energy efficiency and minimizing emissions. Additionally, conducting comparative studies across the Gulf Cooperation Council (GCC) countries or similar regions would offer valuable insights into shared and unique sustainability efforts, enabling a broader understanding of regional challenges and innovations in renewable energy initiatives. Such an approach would help build a more comprehensive picture of the transition toward sustainable energy across different geographic and technological landscapes.
Author Contributions
The conceptualization, methodology, and data analysis for the research paper were conducted by S.E.M.A.-G., while the literature review and reference editing were handled by M.G.A.M, S. M and F.A and . The original draft was written by S.E.M.A.-G. and M. Alsafy .Rechecking and editing, L. arfaoui, K. A and A. Q. All authors have read and agreed to the published version of the manuscript.
Funding
This research received no external funding.
Institutional Review Board Statement
Not applicable.
Informed Consent Statement
Not applicable.
Data Availability Statement
The data presented in this study are available on request from the corresponding author.
Conflicts of Interest
The authors declare there are no conflicts of interest.
References
- https://moenergy.gov.sa/en/OurPrograms/RenewableEnergy/Pages/default.aspx, Accessed 1/September 20242030 ( Ministry of Energy).
- Alajmi, R.G. Carbon emissions and electricity generation modeling in Saudi Arabia. Environ Sci Pollut Res 29, 23169–23179 (2022). [CrossRef]
- Abdel-Gadir, S.E.M.; Mohammed, M.G.A (2024). Oman’s Green Horizon: Steering Towards Sustainability Through Decarbonization and Energy Transition. Sustainability 2024, 16, 9375. [CrossRef]
- Mehdi, Abid. (2023). How Does Renewable Energy Consumption Affect Environmental Quality in Saudi Arabia? Evidence from Quantile Regressions. International Journal of Energy Economics and Policy. [CrossRef]
- Md., Shafiul, Alam. (2023). 5. Impacts of Renewable Energy Generation on Greenhouse Gas Emissions in Saudi Arabia: A Comprehensive Review. Sustainability. [CrossRef]
- Abdulaziz, Aldegheishem. (2024). 2. The Relationship between Urbanization, Energy Consumption, Economic Growth, and Carbon Dioxide Emissions in Middle Eastern Countries: Jordan, Saudi Arabia and Egypt. Environmental research communications. [CrossRef]
- Amjad, Ali., Sumaira., Hafiz, Muhammad., Abubakar, Siddique., Saima, Ashiq. (2023). 3. Impact of Econ Md., Shafiul, Alam. (2023). omic Growth, Energy Consumption and Urbanization on Carbon Dioxide Emissions in the Kingdom of Saudi Arabia. Journal of policy research. [CrossRef]
- Yousif Osman. "The Correlation among Industrial Economic Growth, Renewable Energy Provision and CO₂ Emissions in Saudi Arabia." WSEAS Transactions on Environment and Development, 2024.
- Furqan, Asghar., Fahad, Abdullah, Alshahrani., Muhammad, Imran, Akhtar., Waseem, Amjad., Muhammad, Shahzad., Syed, Nabeel, Husnain., Gwi, Hyun, Lee. (2024). (3) Technoeconomic analysis of standalone hybrid renewable energy systems for telecommunication sector under different climatic conditions in Saudi Arabia. Energy Reports. [CrossRef]
- Ghazala, Aziz., Rida, Waheed., Majid, Ibrahim, Alsaggaf. (2023). Investigating the Impact of Green Natural Resources and Green Activities on Ecological Footprint: A Perspective of Saudi Vision 2030. Sustainability. [CrossRef]
- Saad, F., Al-Gahtani. (2024). 3. Saudi Arabia’s Journey toward a Renewable Future. Energies. [CrossRef]
- Faris Alruweili (2023). Impact of GDP growth on the ecological footprint: Theoretical and empirical evidence from Saudi Arabia. International Journal of Advanced and Applied Sciences. [CrossRef]
- James, Temitope, Dada., Mamdouh, Abdulaziz, Saleh, Al-Faryan. (2024). 4. Linking per capita income, renewable energy, natural resources, trade, and Urbanisation to material footprint: insights from Saudi Arabia. Energy nexus. [CrossRef]
- Ellaythy, I., Osman, Y., & Elmotkassi, T. (2024). Assessment of Economic and Environmental Impacts of using Green Hydrogen Gas for Generating Electricity in the KSA. WSEAS Transactions on Environment and Development. Available at: WSEAS.
- Emre Caglar, A., 2020. The importance of renewable energy consumption and FDI inflows in reducing environmental degradation: bootstrap ARDL bound test in selected 9 countries. J. Clean. Prod. 264 . [CrossRef]
- Abid, N., Ceci, F., Ahmad, F., Aftab, J., 2022. Financial development and green innovation, the ultimate solutions to an environmentally sustainable society: evidence from leading economies. J. Clean. Prod. 369 . [CrossRef]
- Sahoo, B., Behera, D.K., Rahut, D., 2022. Decarbonization: examining the role of environmental innovation versus renewable energy use. Environ. Sci. Pollut. Control Ser. 29 (32), 48704–48719. [CrossRef]
- International Energy Agency (2020). World Energy Outlook 2020. Paris: IEA.
- Dincer, I. (2011). "Renewable energy and sustainable development: A crucial review." Renewable and Sustainable Energy Reviews, 15(2), 1513-1524.
- REN21 (2022). Renewables 2022 Global Status Report. Paris: REN21 Secretariat.
- Panwar, N. L., Kaushik, S. C., & Kothari, S. (2011). "Role of renewable energy sources in environmental protection: A review." Renewable and Sustainable Energy Reviews, 15(3), 1513-1524.
- World Bank (2023). Toward Green Growth: World Bank Strategies for Sustainability. Washington, DC: World Bank Group.
- United Nations Environment Programme (UNEP) (2019). Emissions Gap Report 2019. Nairobi: UNEP.
- Jyotsana, Pandit., Anil, Kumar, Sharma. (2022). 1. Urbanization’s environmental imprint: A review. Environment Conservation Journal. [CrossRef]
- Edmund, Ntom, Udemba., Nazakat, Ullah, Khan., Syed, Ale, Raza, Shah. (2024). 2. Demographic change effect on ecological footprint: A tripartite study of urbanization, aging population, and environmental mitigation technology. Journal of Cleaner Production. [CrossRef]
- Behera, S. R., & Dash, D. P. (2017). The effect of urbanization, energy consumption, and foreign direct investment on the carbon dioxide emission in the SSEA (South and Southeast Asian) region. Renewable and Sustainable Energy Reviews, 70, 96-106..
- Salahuddin, M., Ali, M. I., Vink, N., & Gow, J. (2019). The effects of urbanization and globalization on CO 2 emissions: evidence from the Sub-Saharan Africa (SSA) countries. Environmental Science and Pollution Research, 26, 2699-2709..
- Salahuddin, M., Gow, J., Ali, M. I., Hossain, M. R., Al-Azami, K. S., Akbar, D., & Gedikli, A. (2019). Urbanization-globalization-CO2 emissions nexus revisited: empirical evidence from South Africa. Heliyon, 5(6)..
- Yasmeen, H., Tan, Q., Zameer, H., Vo, X. V., & Shahbaz, M. (2021). Discovering the relationship between natural resources, energy consumption, gross capital formation with economic growth: can lower financial openness change the curse into blessing. Resources Policy, 71, 102013..
- Chen, F., Liu, A., Lu, X., Zhe, R., Tong, J., & Akram, R. (2022). Evaluation of the effects of urbanization on carbon emissions: the transformative role of government effectiveness. Frontiers in Energy Research, 10, 848800..
- Adebayo, T. S., Ullah, S., Kartal, M. T., Ali, K., Pata, U. K., & Ağa, M. (2023). Endorsing sustainable development in BRICS: The role of technological innovation, renewable energy consumption, and natural resources in limiting carbon emission. Science of the Total Environment, 859, 160181.
- Nathaniel, S. P., Adeleye, N., & Adedoyin, F. F. (2021). Natural resource abundance, renewable energy, and ecological footprint linkage in MENA countries. Estudios de economía aplicada, 39(2)..
- Ebrahim, Amer., E., Meyad., Yigong, Gao., Xiaxia, Niu., Nanxu, Chen., Huiyong, Xu., Da-Wei, Zhang. (2022). 1. Exploring the link between natural resources, urbanization, human capital, and ecological footprint: A case of GCC countries. Ecological Indicators. [CrossRef]
- Haider, Ali, Mahmood., Alam, Asadov., Muhammad, Tanveer., Maham, Furqan., Zhang, Yu. (2022). 2. Impact of Oil Price, Economic Growth and Urbanization on CO2 Emissions in GCC Countries: Asymmetry Analysis. Sustainability. [CrossRef]
- Mehmood, U., Tariq, S., Haq, Z. U., Nawaz, H., Ali, S., Murshed, M., & Iqbal, M. (2023). Evaluating the role of renewable energy and technology innovations in lowering CO2 emission: a wavelet coherence approach. Environmental Science and Pollution Research, 30(15), 44914-44927..
- Christine, Schliesser. (2023). Industrialization Impact on Climate Change. Advances in business strategy and competitive advantage book series. [CrossRef]
- Ghazala, Aziz., Suleman, Sarwar., Kishwar, Nawaz., Rida, Waheed., Mohd, Saeed, Khan. (2023). 2. Influence of tech-industry, natural resources, renewable energy and urbanization towards environment footprints: A fresh evidence of Saudi Arabia. Resources Policy. [CrossRef]
- Byron, Quito., María, del, Río-Rama., José, Álvarez-García., Amador, Durán-Sánchez. (2022). 4. Impacts of industrialization, renewable energy and urbanization on the global ecological footprint: A quantile regression approach. Business Strategy and The Environment. [CrossRef]
- Wided, Mohamed, Ragmoun. (2023). 1. Ecological footprint, natural resource rent, and industrial production in MENA region: Empirical evidence using the SDM model. Heliyon. [CrossRef]
- M., D., A., Hossain., M., D., Eleais., Afrida, Jinnurain, Urbee., M., D., A., Hasan., Farian, Tahrim. (2024). 5. Assessing the Intensity of Economic Progress, Industrialization,Energy Use on Environmental Degradation. South Asian Journal of Social Sciences and Humanities. [CrossRef]
- Kamel, Touati., Ousama, Ben-Salha. (2024). 1. Reconsidering the Long-Term Impacts of Digitalization, Industrialization, and Financial Development on Environmental Sustainability in GCC Countries. Sustainability. [CrossRef]
- Hilmi, S., Salem., Musa, Yahaya, Pudza., Yohannes, Yihdego. (2023). 2. Harnessing the energy transition from total dependence on fossil to renewable energy in the Arabian Gulf region, considering population, climate change impacts, ecological and carbon footprints, and United Nations’ Sustainable Development Goals. [CrossRef]
- Gheorghe, H., Popescu., Elvira, Nica., Tomáš, Klieštik., Katarína, Zvaríková., Eleodor-Alin, Mihai., Kriselda, Gura. (2023). 1. Exploring the Environmental Impact of Energy Consumption, Globalization, and Research & Development in Europe: Insights from the STIRPAT-EKC Framework. [CrossRef]
- Atif, Jahanger., A, Awan., Ahsani, Amalia, Anwar., Tomiwa, Sunday, Adebayo. (2023). 2. Greening the Brazil, Russia, India, China and South Africa (BRICS) economies: Assessing the impact of electricity consumption, natural resources, and renewable energy on environmental footprint. Natural Resources Forum. [CrossRef]
- Saeid, Satari, Yuzbashkandi., Amir, Mehrjo., Mohammad, Hadi, Eskandari, Nasab. (2023). 2. Exploring the dynamic nexus between urbanization, energy efficiency, renewable energies, economic growth, with ecological footprint: A panel cross-sectional autoregressive distributed lag evidence along Middle East and North Africa countries. Energy & environment. [CrossRef]
- Bassem, Kahouli., Nahla, Chaaben. (2022). Investigate the Link among Energy Consumption, Environmental Pollution, Foreign Trade, Foreign Direct Investment, and Economic Growth: Empirical Evidence from GCC countries. Energy and Buildings. [CrossRef]
- Jammazi, R., & Aloui, C. (2015). Environment degradation, economic growth and energy consumption nexus: A wavelet-windowed cross correlation approach. Physica A: Statistical Mechanics and Its Applications, 436, 110-125..
- Eyüp, Çakmak., Samet, Acar. (2022). 5. The nexus between economic growth, renewable energy and ecological footprint: An empirical evidence from most oil-producing countries. Journal of Cleaner Production. [CrossRef]
- Ramzi, Boussaidi., Abdelaziz, Hakimi. (2024). 1. Financial inclusion, economic growth, and environmental quality in the MENA region: What role does institution quality play?. [CrossRef]
- Lamy, Mamdoh, Mohamed, Hamed., Latifa, Dhaouadi., Fatma, Zehri., Sofien, Tiba., Houda, Besser., Nissaf, Karbout., Eman, I., R., Emara. (2024). 2. Examining the relationship between the economic growth, energy use, CO2 emissions, and water resources: Evidence from selected MENA countries. Journal of the Saudi Society of Agricultural Sciences. [CrossRef]
- Al Hattali, Noor Ulhuda Mohammed and Saboori, Dr. Behnaz and Zekri, Prof. Slim and Gulsevin, Dr. Osman, Towards Ecological Sustainability in GCC Countries, the Role of Trade Market Diversification, Economic Growth, Energy Consumption, and Foreign Direct Investment. Available at SSRN: https://ssrn.com/abstract=4711944. [CrossRef]
- Hussain, A., Khan, F., & Albalawi, O. (2024). Modeling and Monitoring CO2 Emissions in G20 Countries: A Comparative Analysis of Multiple Statistical Models. Sustainability. Available at: ResearchGate.
- Osman, Y. (2024). The Correlation among Industrial Economic Growth, Renewable Energy Provision and CO2 Emissions in Saudi Arabia. WSEAS Transactions on Environment and Development. Available at: WSEAS.
- Rehman, S., Kotb, K. M., Zayed, M. E., & Menesy, A. S. (2024). Techno-economic evaluation and improved sizing optimization of green hydrogen production and storage under higher wind penetration in Aqaba Gulf. Journal of Energy Storage. Available at: ScienceDirect.
- Alotaibi, A. M., Makhdoom, T. K., & Al-Khayyat, S. H. (2024). Pathways Toward Improving the Energy Efficiency of Residential Air-Conditioning Systems in Saudi Arabia. Journal of Solar Energy Engineering. Available at: ASME Digital Collection.
- Hazrat, Yousaf., Azka, Amin., Waqar, Ameer., Muhammad, Rais, Akbar. (2022). Investigating the determinants of ecological and carbon footprints. Evidence from high-income countries. AIMS energy. [CrossRef]
- Qian, Chen., Ghulam, Rasool, Madni., Adnan, Ali, Shahzad. (2023). The usage of spatial econometric approach to explore the determinants of ecological footprint in BRI countries. PLOS ONE. [CrossRef]
- Syed, Asif, Ali, Naqvi., Syed, Ale, Raza, Shah., Syed, Ale, Raza, Shah., Sofia, Anwar., Hassan, Raza. (2021). Renewable energy, economic development, and ecological footprint nexus: fresh evidence of renewable energy environment Kuznets curve (RKC) from income groups. Environmental Science and Pollution Research. [CrossRef]
- Umar, M., Ji, X., Mirza, N., & Naqvi, B. (2021). Carbon neutrality, bank lending, and credit risk: Evidence from the Eurozone. Journal of Environmental Management, 296, 113156.).
- Pesaran, M. H., Shin, Y., & Smith, R. J. (2001). Bounds Testing Approaches to the Analysis of Level Relationships. Journal of Applied Econometrics, 16(3), 289-326. [CrossRef]
- Abumunshar, M., Aga, M., & Samour, A. (2020). Oil price, energy consumption, and CO2 emissions in Turkey. New evidence analysis of level relationships. Journal of applied econometrics, 16(3), 289-326.
- Sereyvath, Ky., Siphat, Lim. (2024). 2. Examination of Banks' Performance and Intellectual Capital in Cambodia: Utilizing FMOLS and DOLS Methods. Journal of ecohumanism. [CrossRef]
- Anindya, Banerjee., Josep, Lluís, Carrión, i, Silvestre. (2024). 3. Panel data cointegration testing with structural instabilities. [CrossRef]
- Gujarati, D. N., & Porter, D. C. (2009). Basic Econometrics (5th ed.). New York, NY: McGraw-Hill Education.
- Jordaan, A. C., & Eita, J. H. (2007). Testing for stability and structural change in an import demand function: The case of Namibia. South African Journal of Economics, 75(2), 258-2.
Figure 1.
Relationship between Renewable Energy, Energy Consumption, Industrial Growth, and Environmental Footprint.
Figure 1.
Relationship between Renewable Energy, Energy Consumption, Industrial Growth, and Environmental Footprint.
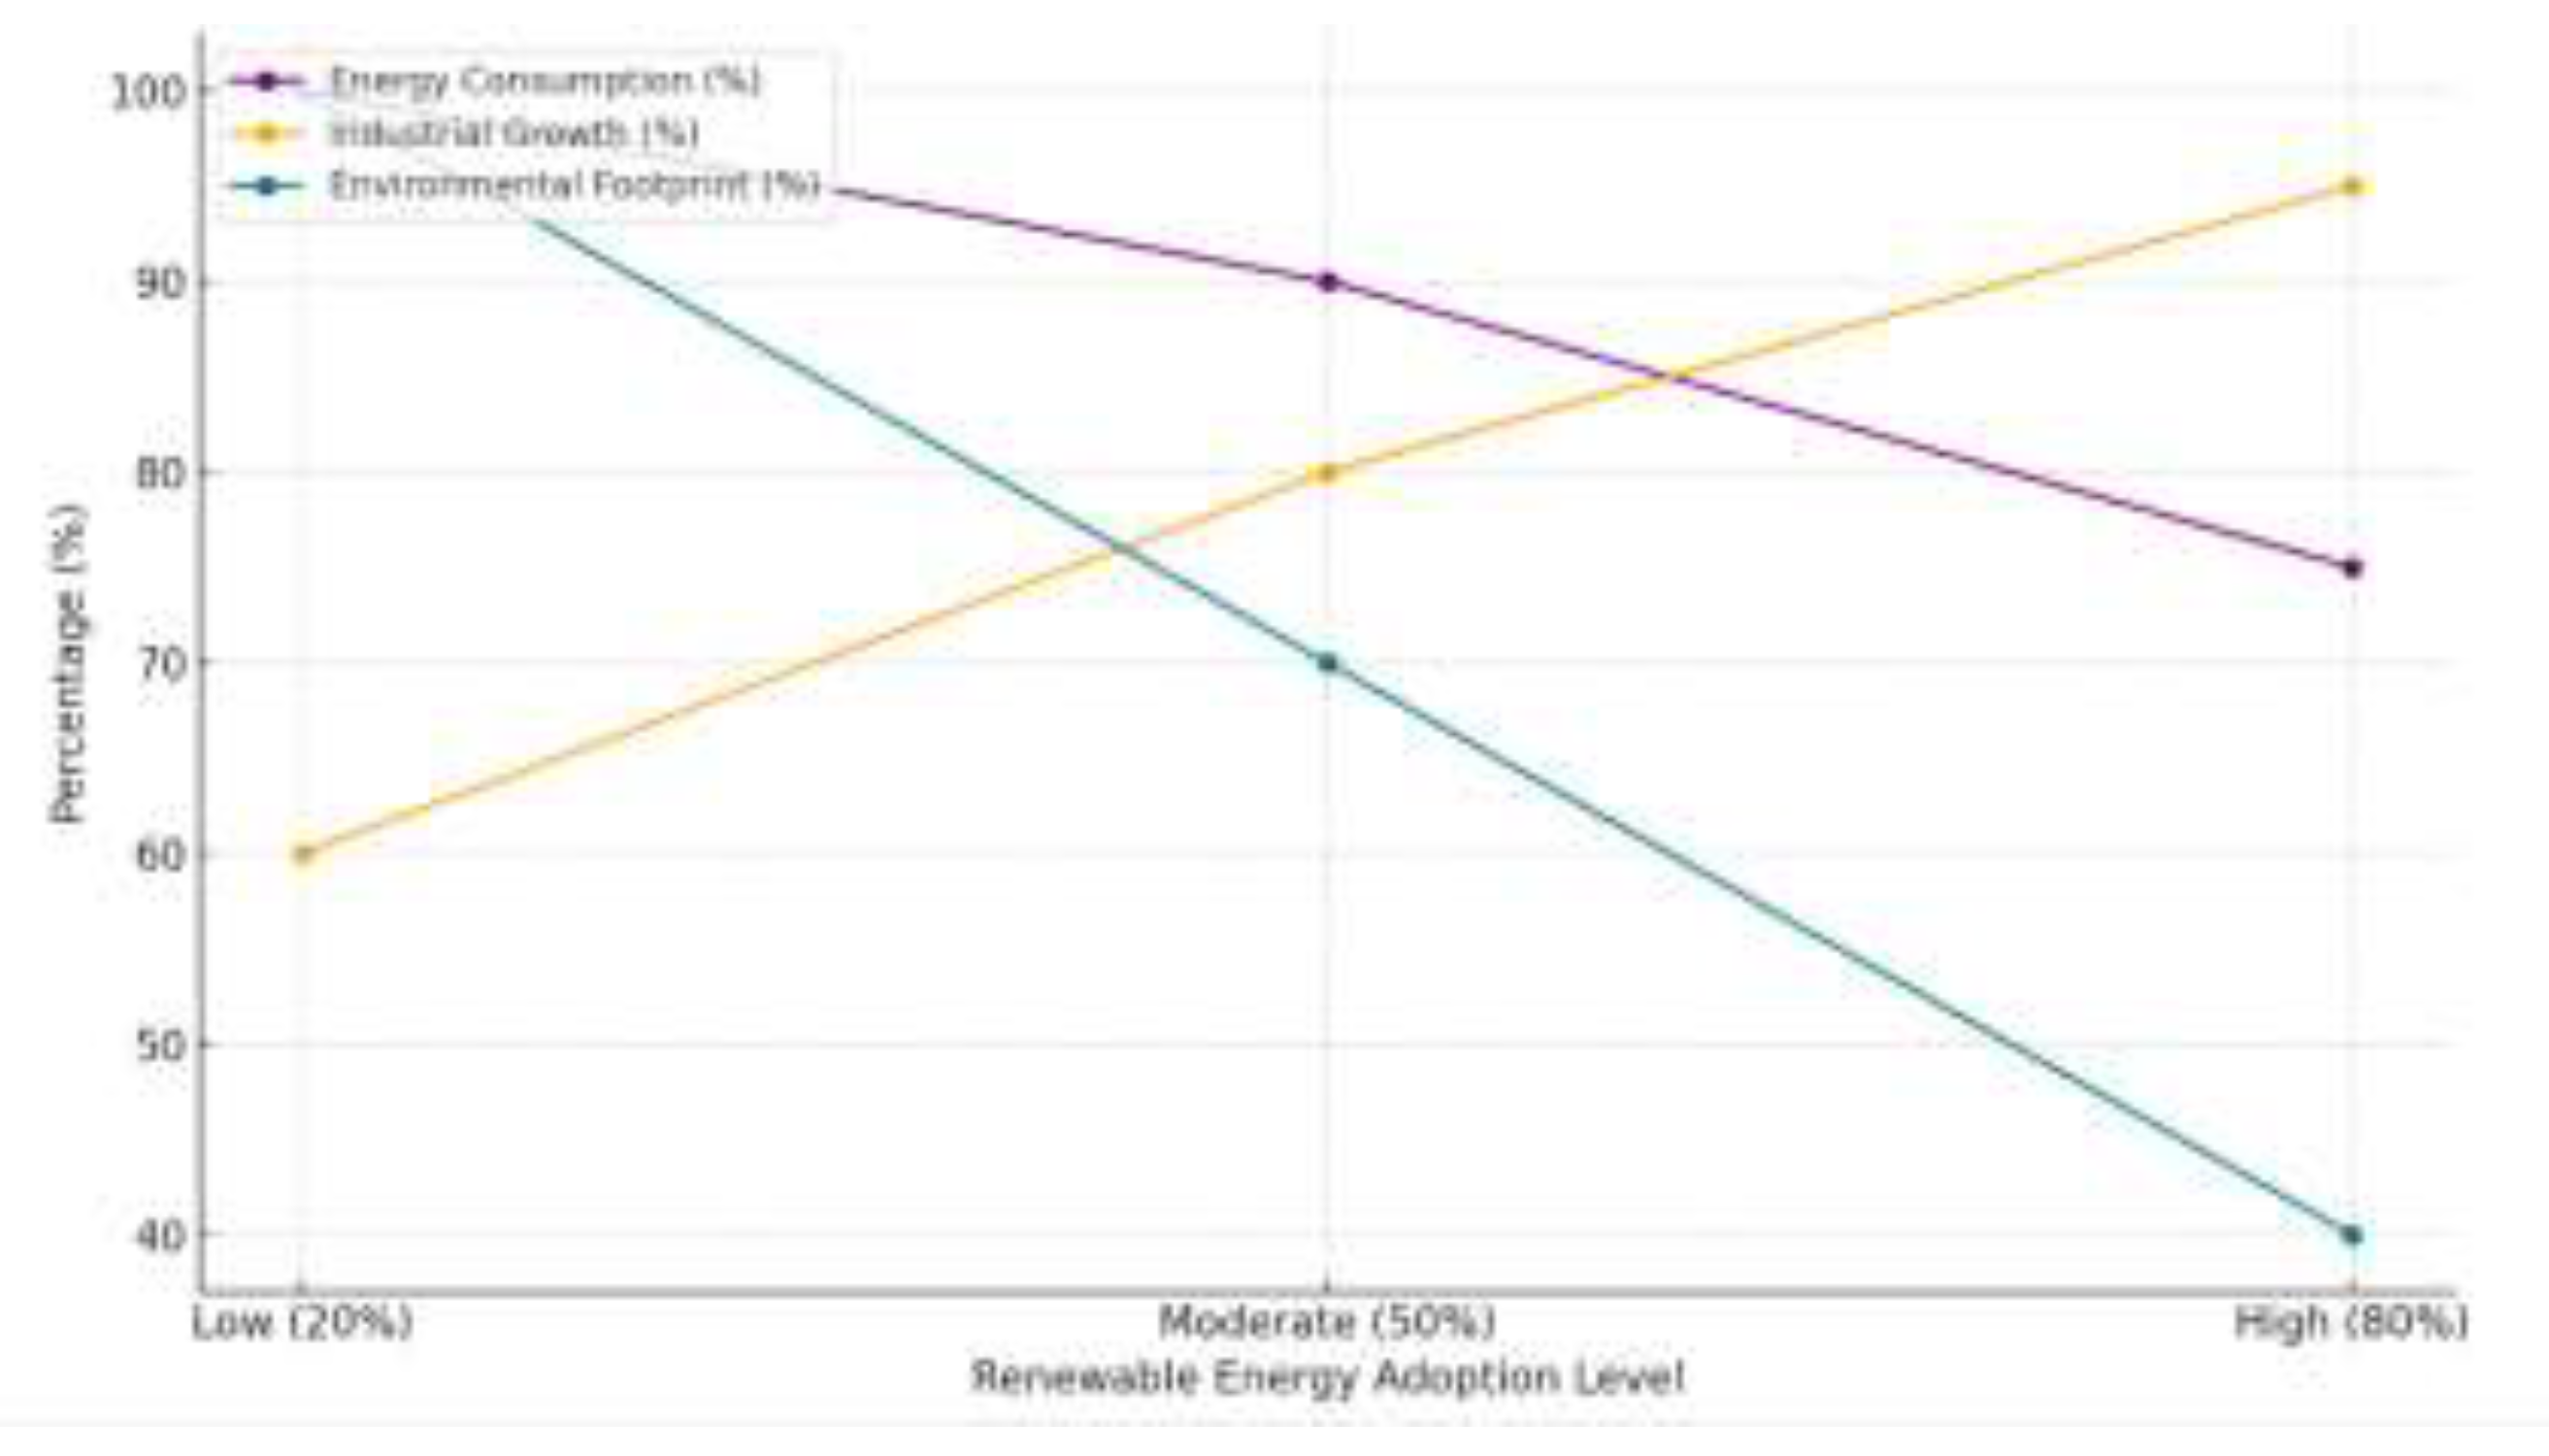
Figure 2.
The relationship between urbanization (LnURB) and environmental footprint (LnEnF) .

Figure 3.
the relationship between Energy consumption Ln ENERG) and environmental footprint (Ln EnF).
Figure 3.
the relationship between Energy consumption Ln ENERG) and environmental footprint (Ln EnF).
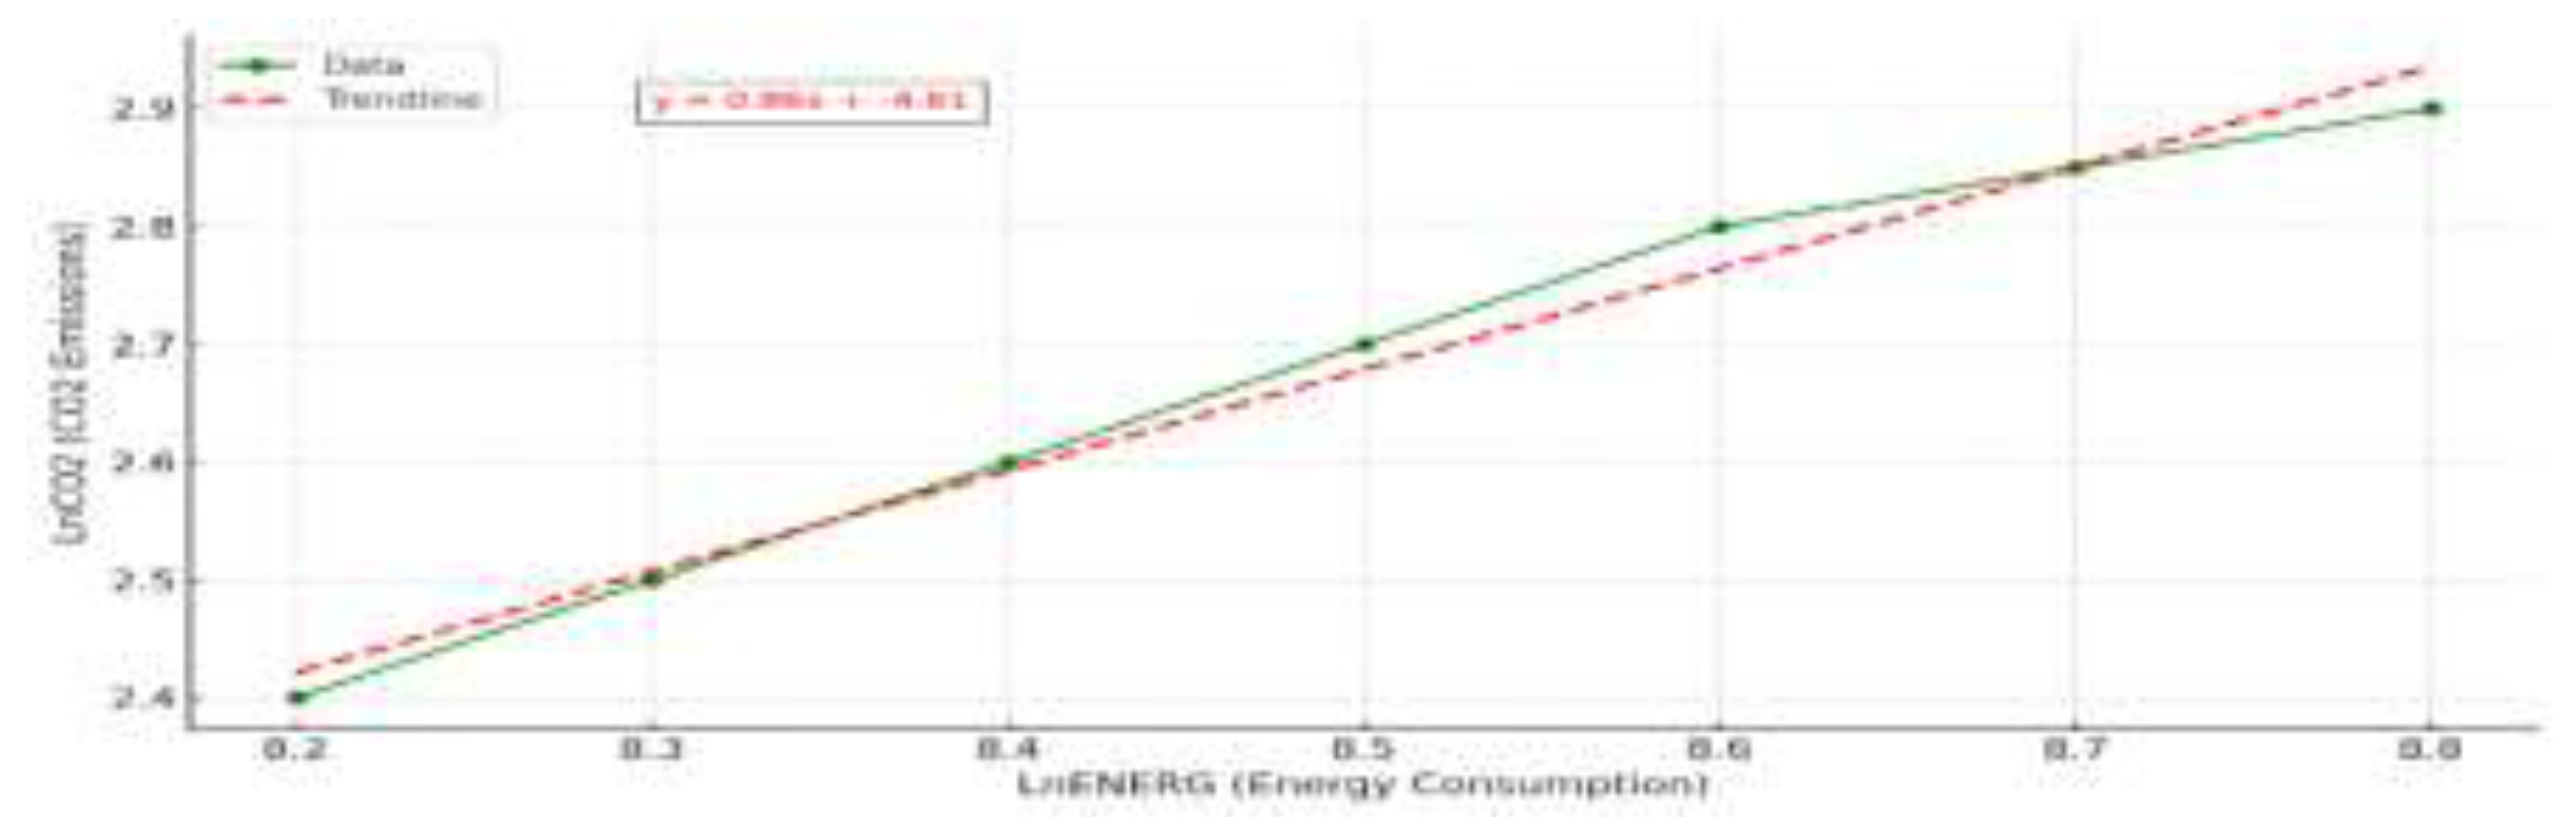
Figure 4.
The relationship between renewable energy (Ln REN) and environmental footprint (Ln EnF).
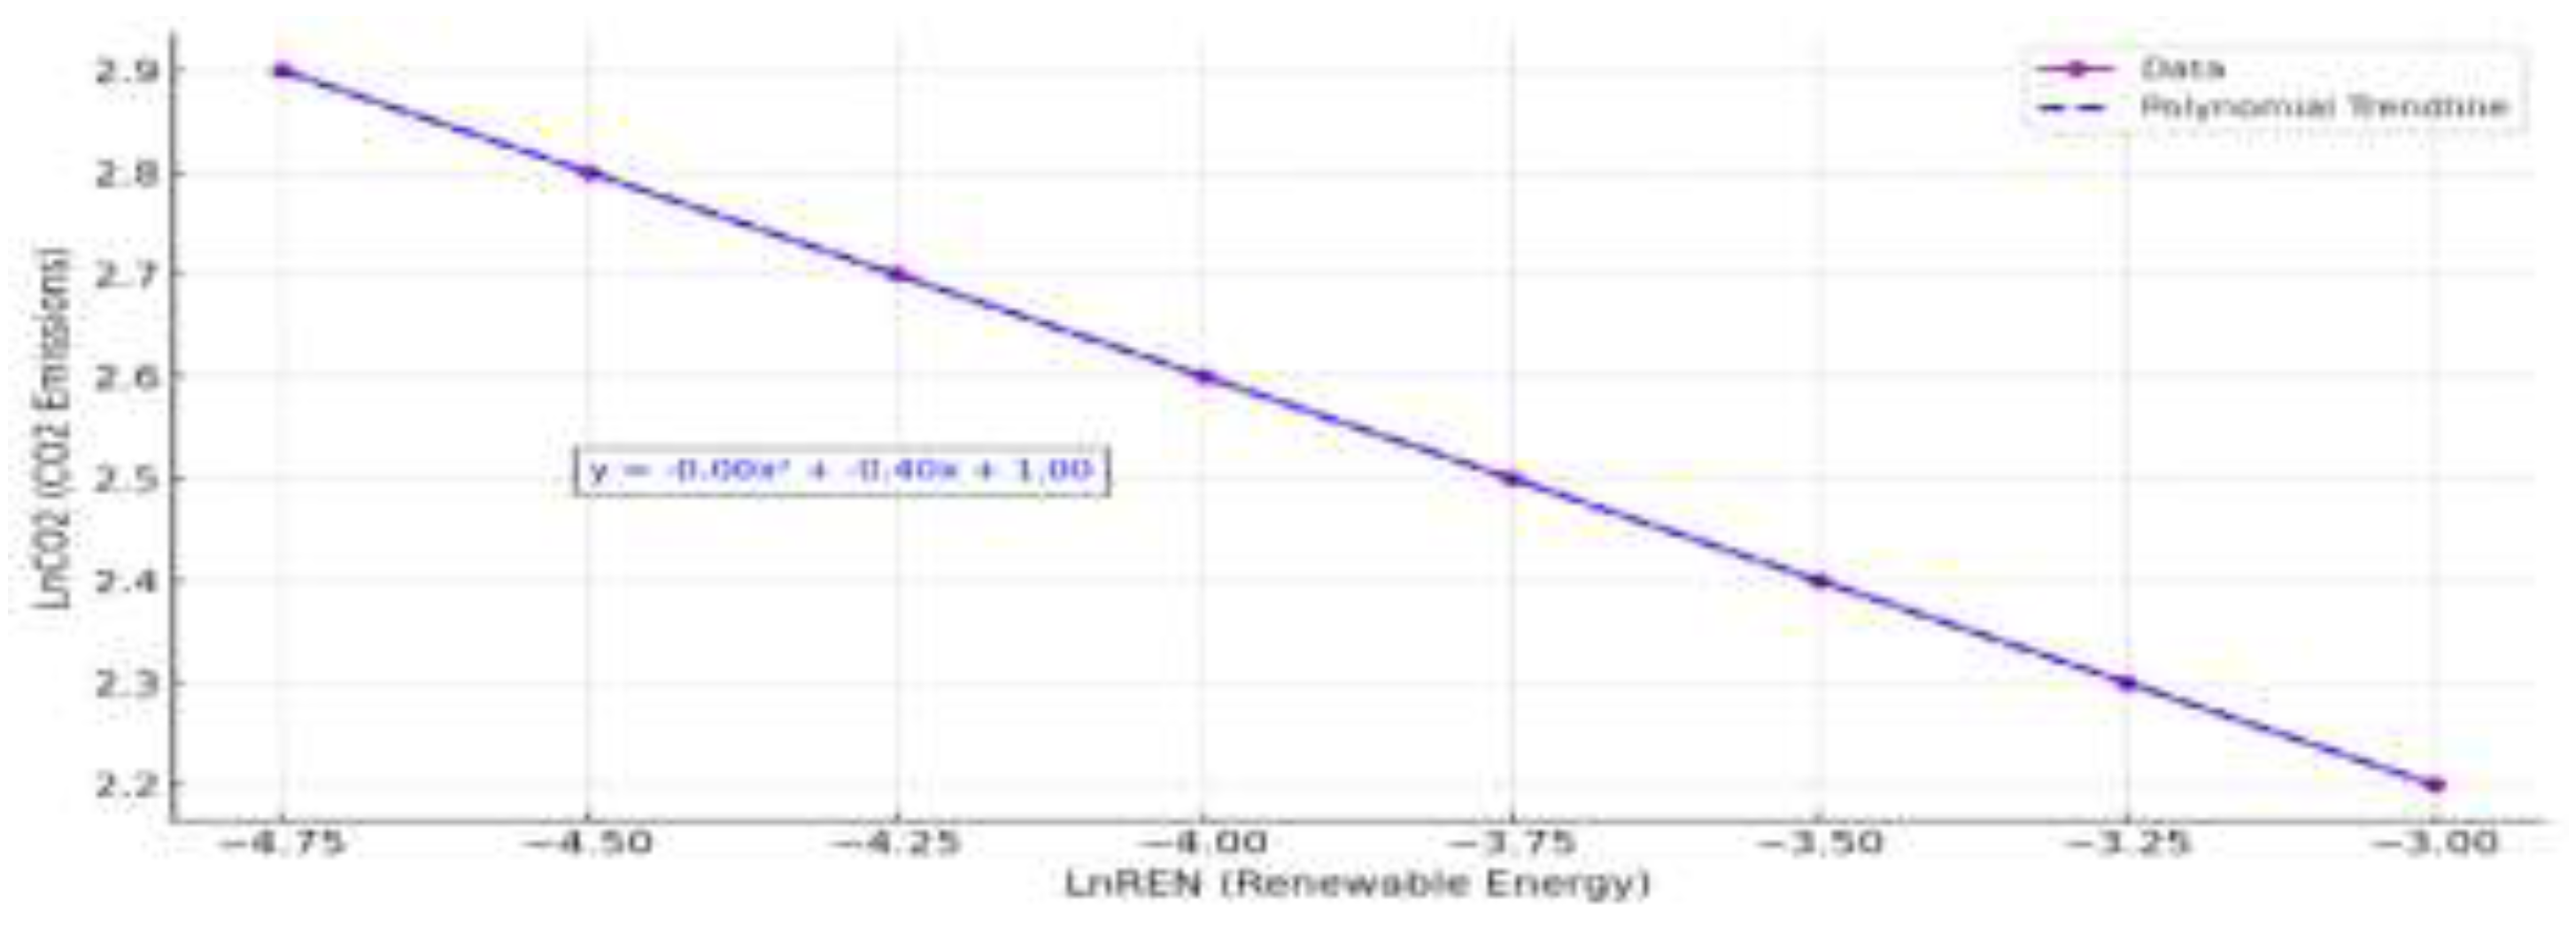
Figure 5.
The relationship between industrial value added (Ln INDVAD) and environmental footprint (Ln EnF).
Figure 5.
The relationship between industrial value added (Ln INDVAD) and environmental footprint (Ln EnF).
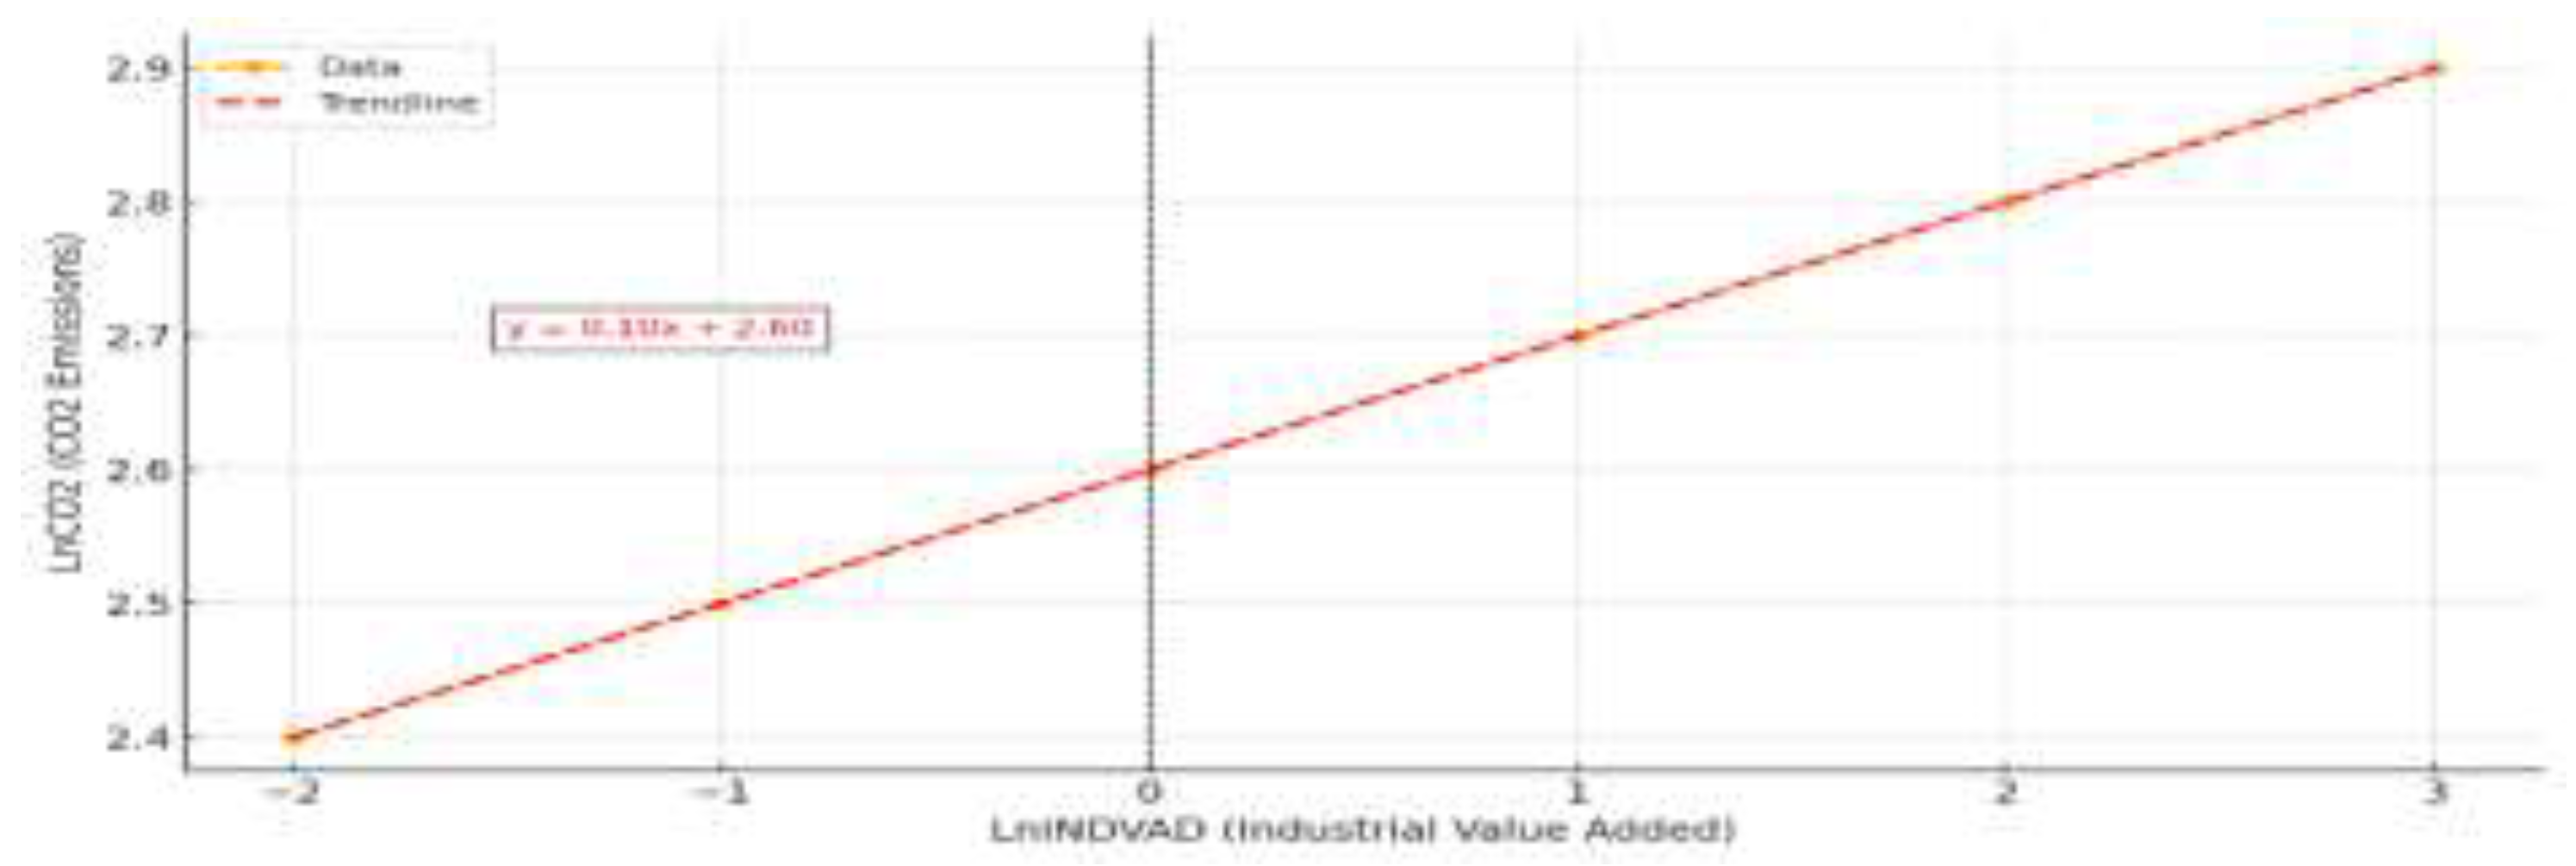
Figure 6.
the relationship between GDP per capita (Ln PGDP) and environmental foot print (Ln EnF).
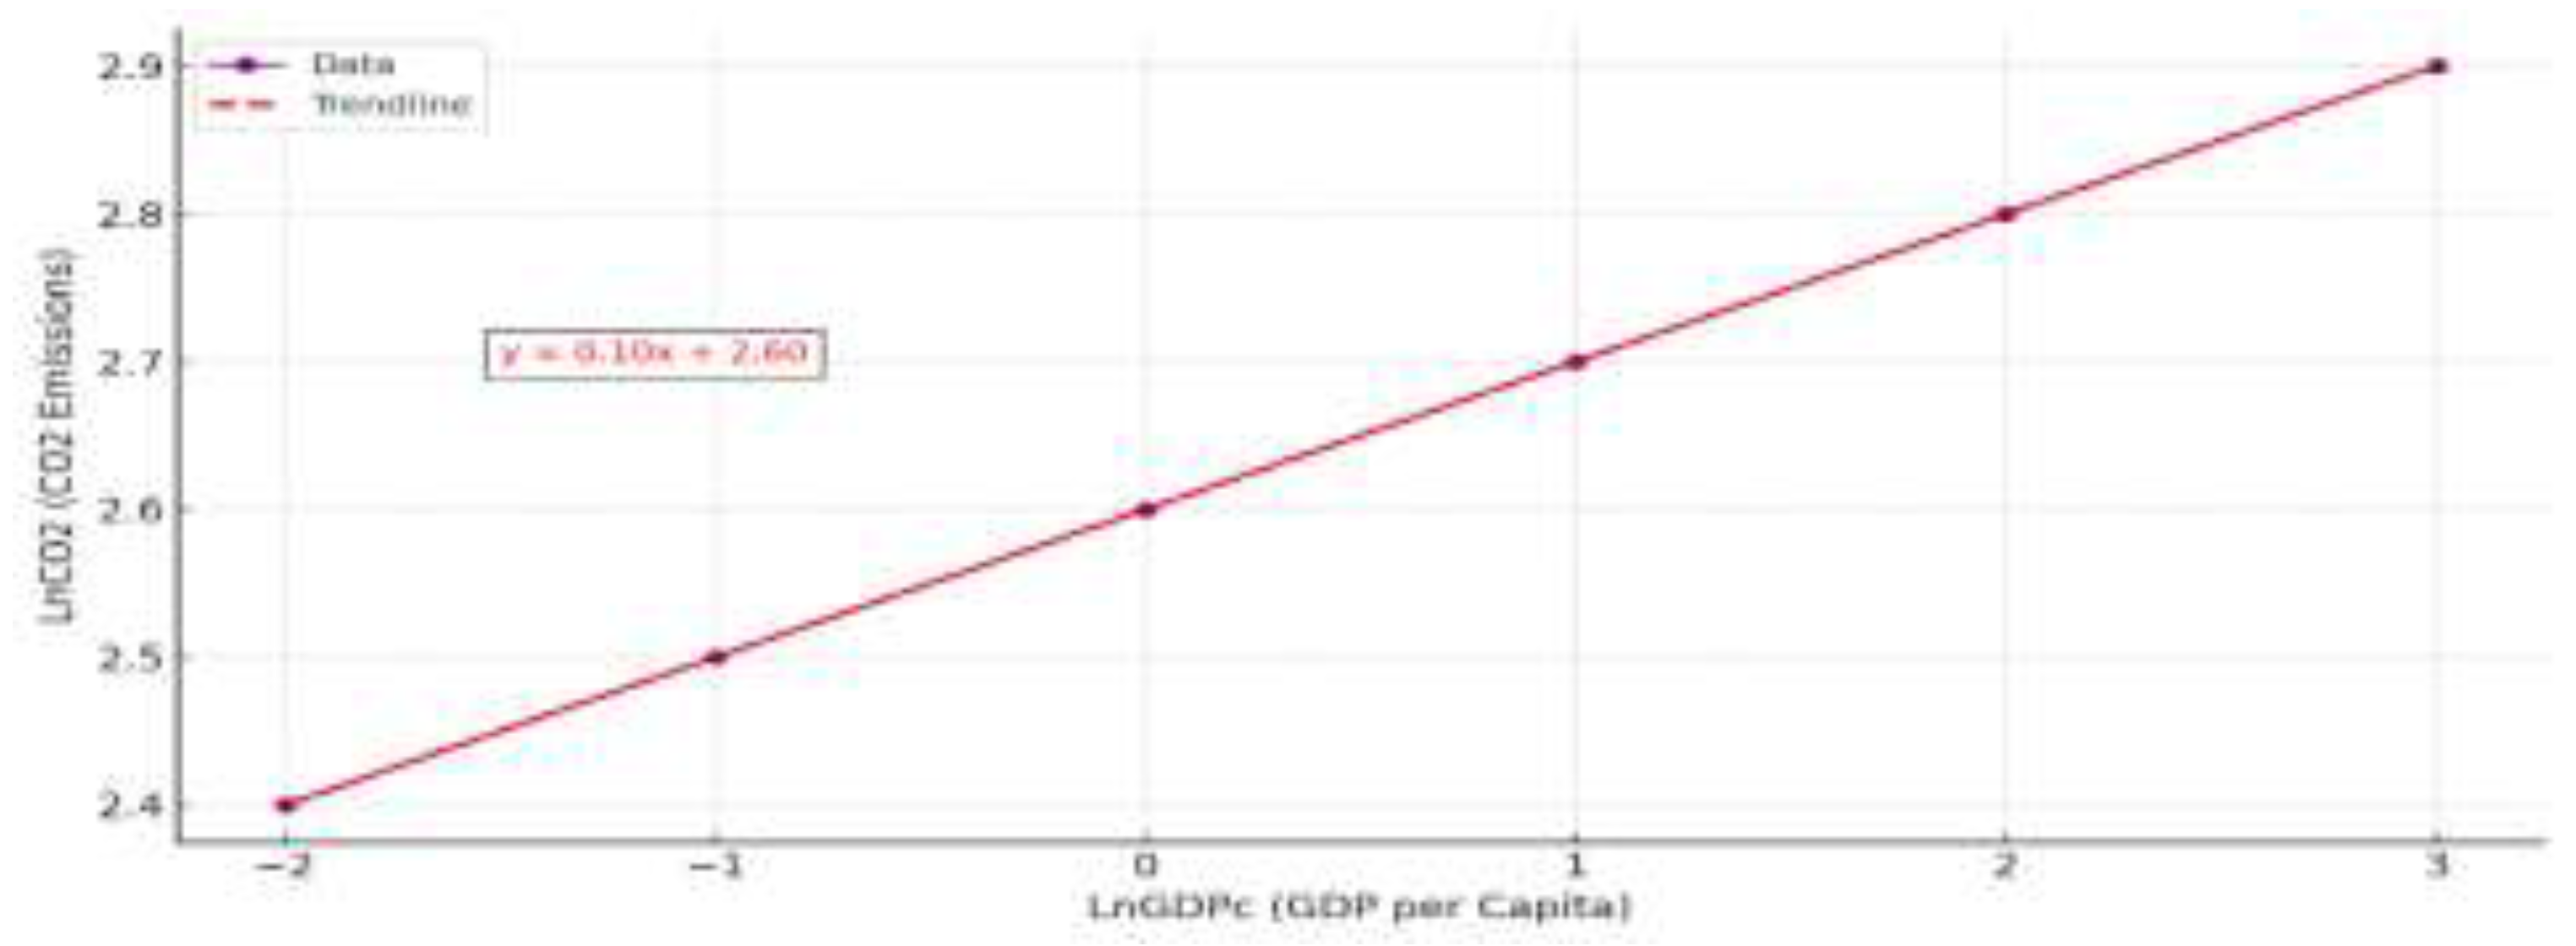
Figure 7.
The box plots for Model variables.
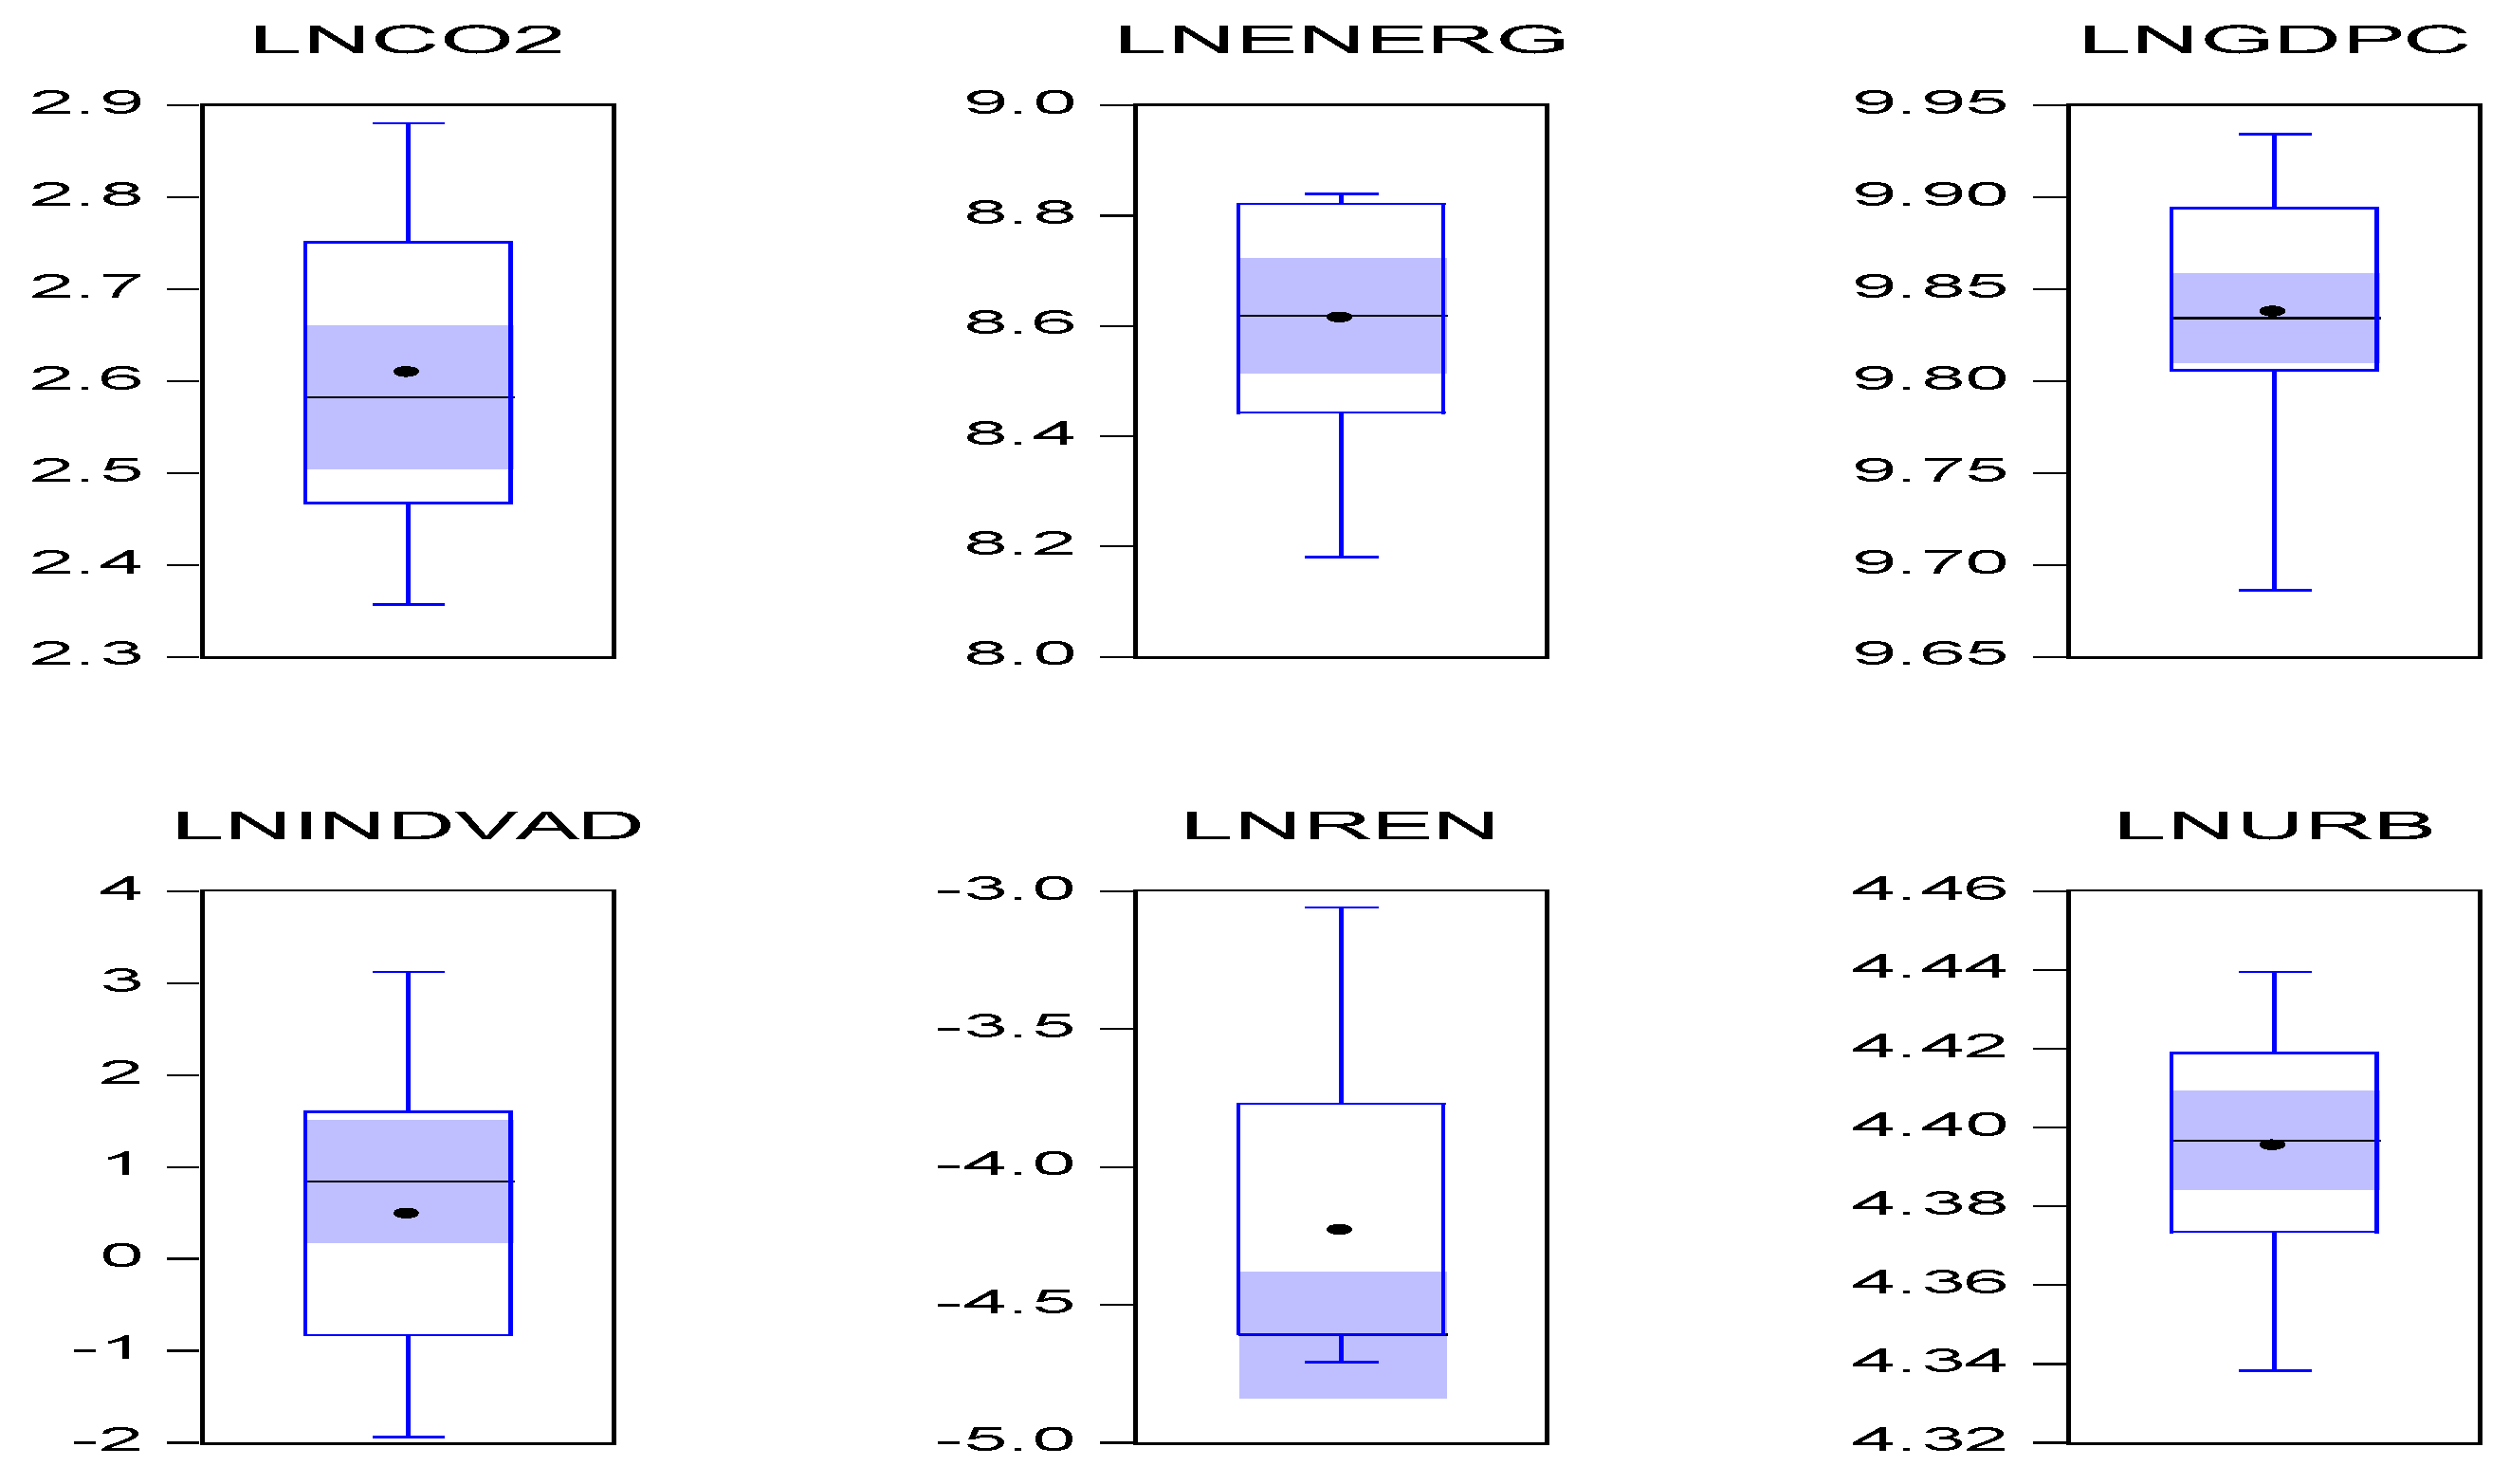
Figure 8.
(a) Results of CUSUM and (b) CUSUM square tests.
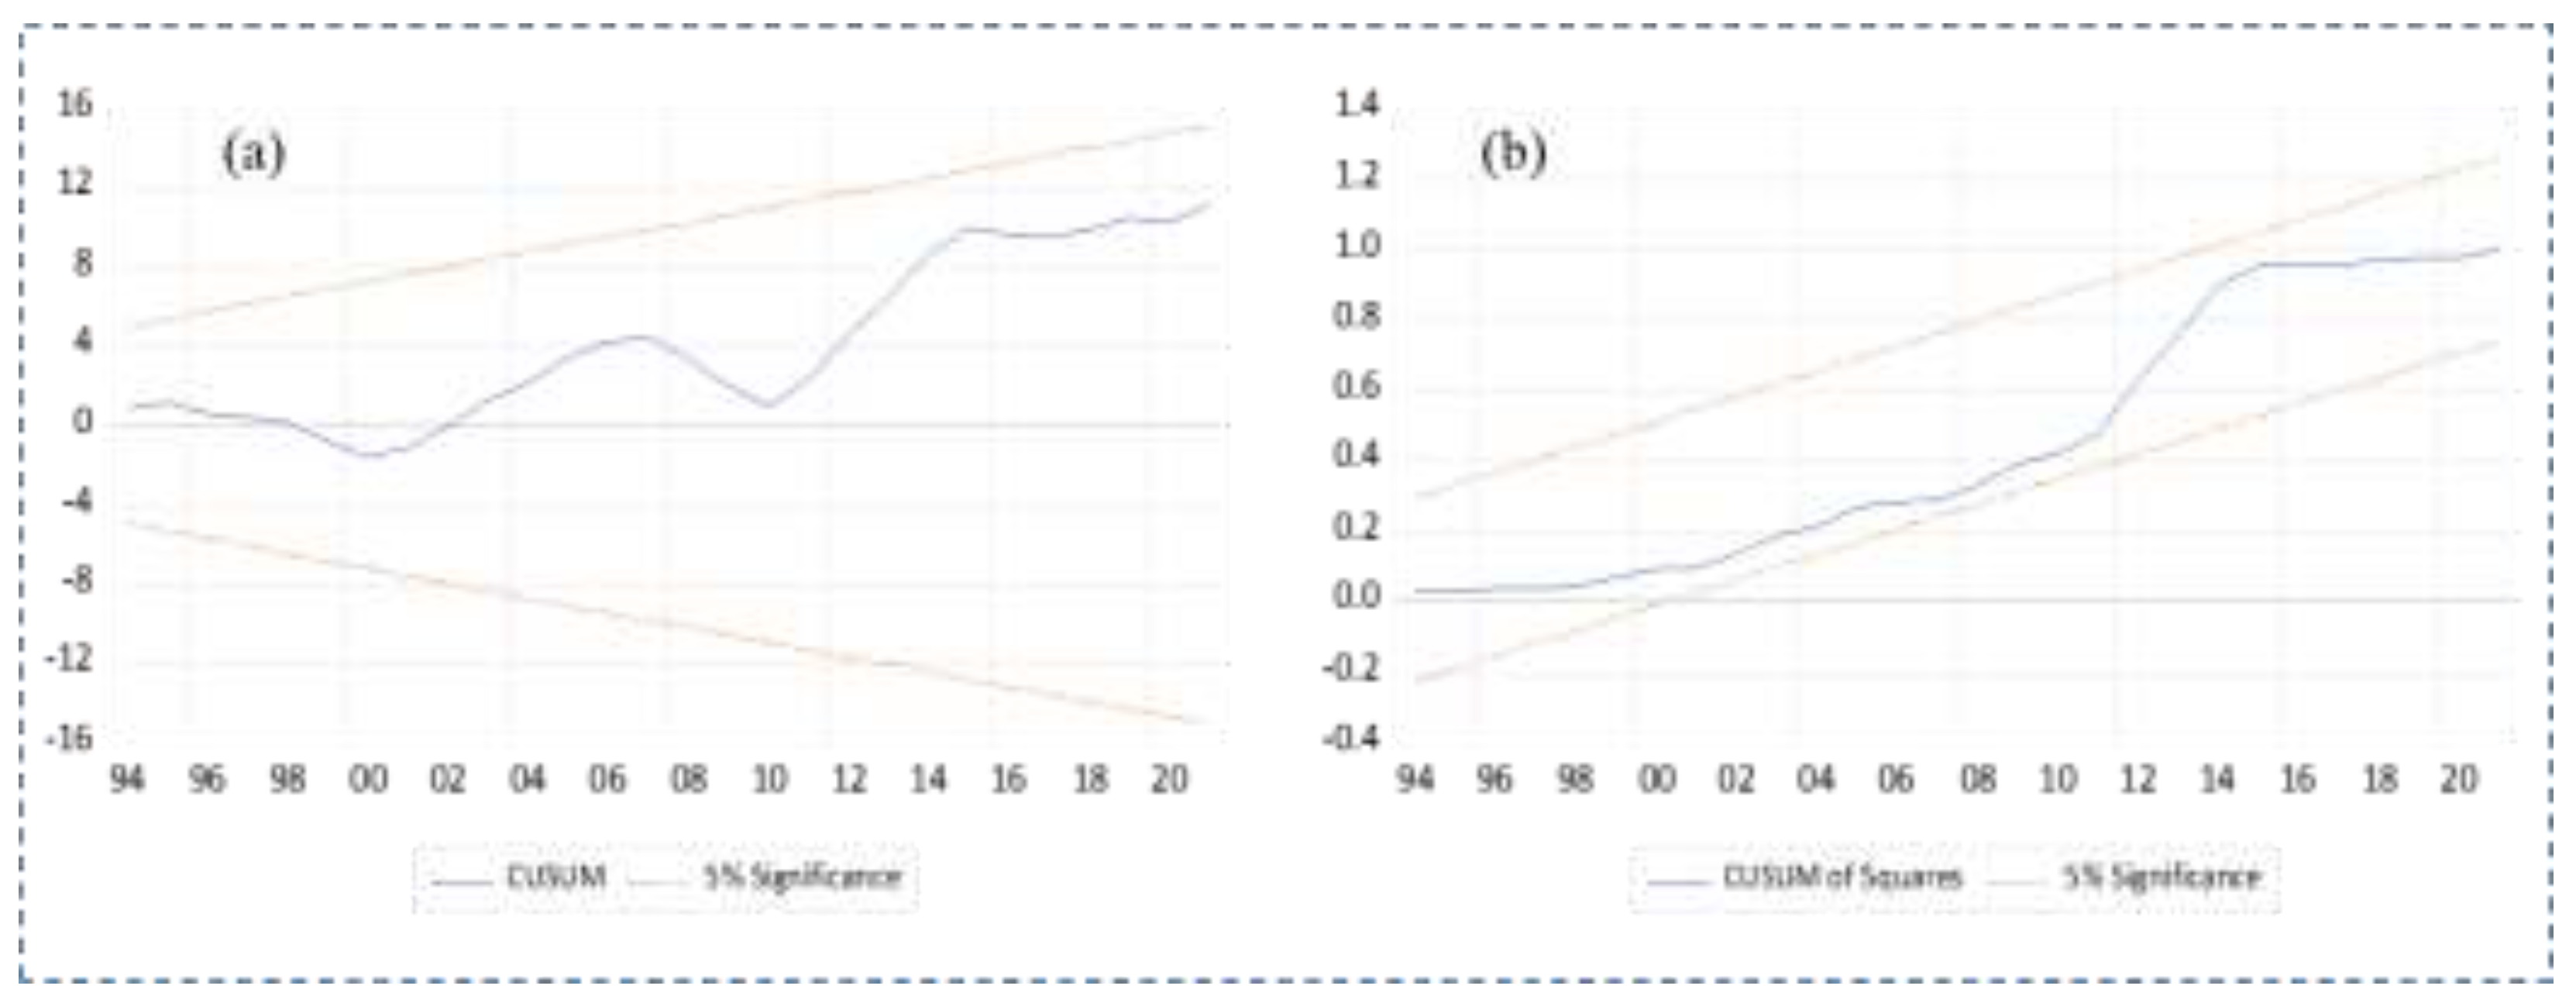
Table 1.
Summary Statistics for the Model Variables.
| Series | Ln ENF | Ln ENERG | Ln PGDP | LN INDVAD | LN REN | LN URB |
| Mean | 2.610 | 8.615 | 9.838 | 0.489 | -4.229 | 4.396 |
| Median | 2.583 | 8.620 | 9.835 | 0.853 | -4.605 | 4.397 |
| Maximum | 2.880 | 8.840 | 9.934 | 3.123 | -3.058 | 4.439 |
| Minimum | 2.357 | 8.181 | 9.686 | -1.940 | -4.707 | 4.338 |
| Std. Dev. | 0.161 | 0.194 | 0.060 | 1.498 | 0.557 | 0.028 |
| Skewness | 0.200 | -0.266 | -0.293 | -0.065 | 0.908 | -0.207 |
| Kurtosis | 1.660 | 1.836 | 2.648 | 1.983 | 2.147 | 2.033 |
| Jarque-Bera | 2.688 | 2.252 | 0.642 | 1.446 | 5.529 | 1.522 |
| Probability | 0.261 | 0.324 | 0.725 | 0.485 | 0.063 | 0.467 |
| Sum | 86.12 | 284.30 | 324.65 | 16.15 | -139.56 | 145.05 |
| Sum Sq. Dev. | 0.828 | 1.209 | 0.116 | 71.773 | 9.932 | 0.025 |
| CV | 6.17% | 2.25% | 0.61% | 306.34% | 13.17% | 0.64% |
| Observations | 33 | 33 | 33 | 33 | 33 | 33 |
Table 2.
The correlation matrix.
| LNENF | LNENERG | LNGDPC | LNINDVAD | LNREN | LNURB | |
| LNENF | 1.000 | |||||
| LNENERG | 0.900 | 1.000 | ||||
| LNGDPC | 0.701 | 0.596 | 1.000 | |||
| LNINDVAD | -0.052 | -0.211 | 0.180 | 1.000 | ||
| LNREN | -0.279 | -0.043 | 0.091 | 0.017 | 1.000 | |
| LNURB | 0.815 | 0.965 | 0.489 | -0.238 | 0.019 | 1.000 |
Table 3.
Variance Inflationary Vector (VIF).
| Variable | VIF | 1/VIF |
| Ln ENF | 1.66 | 0.602 |
| Ln | 1.57 | 0.637 |
| Ln ENERG | 2.34 | 0.427 |
| Ln PGDP | 1.89 | 0.529 |
| Ln INDVAD | 3.02 | 0.331 |
| Ln URB | 1.45 | 0.690 |
Table 4.
Results of Unit Root Test (ADF).
| Variable | Level T-Statistic | Level Prob | First Difference T-Statistic | First Difference Prob | Order of Cointegration |
| Ln PGDP | -2.052 | 0.264 | -6.179 | 0.000 | I(1) |
| Ln EnF | -1.225 | 0.651 | -3.385 | 0.576 | I(1) |
| Ln INDAVD | -5.418 | 0.000 | -6.291 | 0.000 | I(0) |
| Ln REN | -1.266 | 0.633 | -4.872 | 0.001 | I(1) |
| Ln ENERG | -0.583 | 0.800 | -4.710 | 0.001 | I(1) |
| Ln URB | -0.323 | 0.910 | -5.663 | 0.000 | I(1) |
Table 5.
ARDL Long-Run Form and Bound Test.
| Test Statistic* | Value | Signif | I (0) | I (1) |
| F-statistic | 26.36 | 10% | 2.75 | 3.79 |
| K | 5 | 5% | 3.12 | 4.25 |
| 2.50% | 3.49 | 4.67 | ||
| 1.% | 3.39 | 5.23 | ||
| *Null Hypothesis: No levels relationship *Note: K is the number of explanatory variables |
||||
Table 7.
The results of diagnostic tests.
| F-statistic | χ2 | |
| Breusch-Godfrey Serial correlation Lm Test | 0.1408 (0.8699) | 0.611 (0.7367) |
| AECHHeteroscedasticity | 1.390 (1.2800) | 1.419 (0.2342) |
| Ramsey RESET | 5.9421 (0.0277) | - |
| Jarque-Bera for Normality | - | 0.265 (0.8761) |
Note: Values in parentheses represent p-values.
Disclaimer/Publisher’s Note: The statements, opinions and data contained in all publications are solely those of the individual author(s) and contributor(s) and not of MDPI and/or the editor(s). MDPI and/or the editor(s) disclaim responsibility for any injury to people or property resulting from any ideas, methods, instructions or products referred to in the content. |
© 2024 by the authors. Licensee MDPI, Basel, Switzerland. This article is an open access article distributed under the terms and conditions of the Creative Commons Attribution (CC BY) license (http://creativecommons.org/licenses/by/4.0/).
Copyright: This open access article is published under a Creative Commons CC BY 4.0 license, which permit the free download, distribution, and reuse, provided that the author and preprint are cited in any reuse.


