Submitted:
25 March 2025
Posted:
26 March 2025
You are already at the latest version
Abstract
Saudi Arabia's Vision 2030 is closely tied to issues of CO2 emissions and energy consumption. This initiative aims to modernize the country's economy, diversify its energy sources, and enhance sustainability. This paper examines the relationships among CO2 emissions, Renewable Energy Consumption (RENC), and Non-Conventional Energy Re-sources (NCER) in Saudi Arabia, from 1990 to 2019. To assess the stationarity of the panel time series data, the Augmented Dickey-Fuller (ADF) and Phillips-Perron (PP) tests were initially used. Given that the data exhibited a mixed order of integration, the Autoregressive Distributed Lag (ARDL) framework was employed. Three different lag selection criteria were applied for cointegration, using CO2 emissions as the dependent variable. Additionally, the direction and significance of causality were analyzed within the ARDL framework. Robust tests were conducted to evaluate the generalizability of the study's findings. We demonstrated a significant long-term relationship between climate change and both RENC and NCER in Saudi Arabia. The findings indicate that in the long run, a 1% increase in RENC leads to a 0.21% decrease in CO2 emissions. Furthermore, a 1% in-crease in NCER corresponds to a substantial 53.4% reduction in CO2 emissions. Finally, policy recommendations were proposed in alignment with Saudi Arabia's Vision 2030.
Keywords:
climate
; energy
; CO2 emissions
; ADF
; PP
; ARDL model
; Saudi Arabia
1. Introduction
Energy is a crucial factor that substantially impacts economic growth, development, social welfare, and ecology. In today’s industrialized societies, there is an increasing demand for energy in various sectors such as industry, commerce, agriculture, services, housing, and transportation [1].
In Saudi Arabia, the demand for energy to power air conditioning systems is expected to increase significantly due to the heightened risk of heat waves. The effects of global warming on the flow and temperature of surface waters, such as rivers and coastal seas, could impact the cooling capabilities of thermal or nuclear power plants. Additionally, changes in the water cycle, including precipitation and the melting of mountain glaciers, could also impact the capacity for hydroelectric power generation [2].
Saudi Arabia’s economy heavily relies on its oil and petrochemical industries, which account for 87% of government revenues and 90% of export earnings. Though natural gas production has increased, oil remains the primary energy source in the country. Nonetheless, renewable biomass has the potential to serve as an alternative energy source. Renewable energy sources are vulnerable to climate change, which makes the energy system susceptible. The energy sector contributes significantly to global CO2 emissions [3].
This research analyzes the relationship between climate change and energy in Saudi Arabia, both short—and long-term, to determine how climate change affects renewable and non-renewable energy sources. In other words, we explore whether there is a short- and long-term correlation between climate change and energy.
The rest of this paper is organized as follows: Section 2 presents a comprehensive literature review of studies examining CO2 emissions and their impact on climate change. In Section 3, we describe the motivating data set, and the econometric framework used in the analysis. Section 4 analyzes the data set mentioned in Section 3 to demonstrate the proposed methodologies and the results of this analysis are reported. The last section concludes the findings of the paper and presents policy implications considering the Saudi Vision 2030.
2. Literature Review
In recent decades, the environmental degeneration caused by global warming has become a major concern for policymakers and researchers alike [4]. Energy generally comes from two types of natural resources: non-renewable (fossil and fissile) and renewable. Non-renewable resources are themselves of two types: fossil and fissile. Fossil resources are those derived from the decomposition of organic matter, mostly plant matter, over millions of years to produce mainly coal, oil and natural gas [5]. Deposits of these non-renewable energy sources are depleted over time. Fissile resources are those derived from the fission of the atomic nucleus, mainly uranium. As these resources are depleted, they are still unable to satisfy consumer demand in all areas of daily life, and their production is declining at the same rate as oil. For this reason, they are also referred to as “stock energies” since their reserves are limited.
On the other hand, there is another type of natural resource called renewable energy. These include solar thermal and photovoltaic energy, wind, tidal and river power, heat from the ground and subsoil, biomass, and waste. These resources are called renewable energies because they are self-renewing after consumption [6]. Moreover, energy is one of the major factors affecting not only economic growth, but also economic development, social well-being, and ecology. It’s clear that modern, industrialized societies are using more energy in a variety of areas: industry, commerce, agriculture, services, housing, transport, and so on. The effects of climate change will vary from one region of the world to another, affecting both energy production and demand. In Saudia Arabia, energy demand for air conditioning could rise sharply, due to the increased risk of heat waves. The impact of global warming on the flow and temperature of surface waters (rivers and coastal seas) could affect the cooling capacity of thermal or nuclear power plants. Changes in the water cycle (precipitation) and the melting of mountain glaciers could also affect hydroelectric power generation capacity. The capacity to renew biomass (which can be used to produce heat or biofuels) could also be affected by climate change and its interaction with changes in air quality [7].
There is considerable uncertainty about the evolution of small-scale events such as hurricanes or storms, to which energy production systems and power transmission networks are exposed. Saudi Arabia’s energy sector is dominant in Saudi Arabia’s economy: around 87% of government revenues and 90% of export earnings came from the oil and petrochemicals industry in 2017, accounting for around 42% of Saudi Arabia’s gross domestic product [8]. Saudi Arabia’s primary energy production is limited to two products: oil (87.5%) and natural gas (12.5%): the share of natural gas has risen sharply: from 5.3% in 1990 to 12.5% in 2019; in 29 years, energy production has increased by 74% (60% for oil and 311% for gas). Increasing the use of renewable energies is an essential strategy for mitigating climate change [9]. Nevertheless, the sensitivity of renewable energies to climatic conditions means that the energy system’s vulnerability to climate change may also become greater. The energy sector is known as a major cause of climate change, around two-thirds of global CO2 emissions in 2018 [10,11].
Various authors [12,13] concluded that there is a need for more in-depth knowledge of the impacts of climate change on the energy system as a whole and on a global scale. In addition, the uncertainty of climate change and the ability of the energy system to adapt to such impacts must be considered. Among renewable energies, energy and/or electricity production from PV and wind turbines is limited by weather conditions, such as solar radiation, cloud cover, wind direction and speed. Future climate change will modify these weather conditions. Some will increase, others decrease, and future renewable energy production will vary according to these changes. In this context, at the same time as renewable energies can mitigate climate change, they also suffer the consequences of climate change. In the same way that renewable energies can mitigate climate change, they also suffer the consequences of climate change.
These impacts on renewable energies will be unavoidable to some extent, even with strict mitigation policies. [14] link global warming and its consequences to human activities rather than natural fluctuations. The Earth’s natural climate changes gradually over a long period of time (tens of thousands to millions of years). Climate change is recognized as an important issue, and the international communities, through the United Nations, have created special groups to focus on the effects of climate change and have launched protocols to organize a global response to deal with its consequences. Any change in solar input, the atmosphere or the hydrological cycle will affect interactions between the atmosphere, hydrosphere, cryosphere, and biosphere. Climate change interacts with various natural processes in the atmosphere, hydrosphere, cryosphere, and biosphere. There is growing evidence that anthropogenic gases are responsible for climate change [14]. According to various authors [15,16], the rate of carbon dioxide (CO2) emissions is a key factor in greenhouse gas emissions (GHG) and its consequent impacts on global warming, climate change, biodiversity, air quality and natural resources. Coupled with growing human consumption, this concern not only increases the vulnerability of societies, but also accentuates the scarcity of the earth’s ecological resources [17,18]. With the industrialized world’s current fast-paced consumption and production patterns, climate change is having a negative impact on ecosystems, species, and humanity. Energy transition is necessary to protect the environment in the face of climate change. A major energy transition is needed to achieve the goal of climate-neutral energy systems. The use of renewable energies appears as an alternative to conventional energy in this concept. The objective of this article is to analyze the impact of climate change on renewable and non-renewable Energy in Saudia Arabia. Is there a short- and long-term relationship between climate change and energy? On other words, we aim to gain a deeper understanding of the challenges and opportunities Saudi Arabia faces in transitioning towards sustainable and resilient energy systems. To achieve this objective, we use the ARDL (Auto- Regressive Distributed Lags) model.
3. Materials and Methods
3.1. Data Description and Summary Statistics
In this study, the data are extracted from the World Bank indicators (CD-ROOM2019). This study delves into a comprehensive analysis of annual data spanning from 1990 to 2019, focusing on key environmental metrics for Saudi Arabia. Specifically, it examines CO2 emissions per capita, expressed in tons, alongside the share of Renewable Energy Non-Conventional (RENC) as a percentage of total final energy, and the Non-Conventional Energy Ratio (NCER) as a portion of total electricity production. These essential metrics are illustrated in Table 1.
The statistical properties of these variables unfold in greater detail in Table 2, revealing the underlying patterns within the data. Skewness and kurtosis were meticulously calculated based on the third and fourth central moments. Skewness provides insight into the asymmetry of the distribution, while kurtosis sheds light on its peak sharpness. Remarkably, the results of the Jarque-Bera test [19] indicate that we do not have enough evidence to reject the null hypothesis, which posits that these variables conform to a normal distribution. This suggests that the data analyzed in this study portrays a well-defined normal distribution, offering valuable insights into the energy landscape of Saudi Arabia.
3.2. Econometric Framework
The ARDL cointegration procedure was introduced by [20] and extended by [21]. Compared with other cointegration methods [22,23,24] the ARDL cointegration approach has advantages. This co-integration technique does not require the assumption that all variables come from the same order of integration. This approach can be applied even if the variables are I(0) or I(1). We choose this technique for three main reasons: First, it is effective in executing short- and long-term relationships between different variables that do not have the same order of integration provided that these variables are stationary integration order level are I(0) or I(1). Second, the ARDL approach can remove problems associated with omitted and auto correlated variables. Third, it can be useful for a small application. To study the relationship between economic growth and political stability, Solow’s growth model is used as a theoretical framework. The model shows that national production (Y) is determined by three factors: capital (K), labor (L) and technical progress (A). The production function takes the following form:
By analogy, equation (1) can be written in the following form:
Therefore, the ARDL model can be constructed as follows:
Where lnCO2, lnRENC, and lnNCER are natural logarithms (The natural logarithm of the data is used to achieve
constant variance and allow describing the relations between the variables.) of CO2 emission, RENC, and NCER, ∆ is the delay operator, α0 is the constant, means short-term dynamics, while β1, β2, and β3 are the long-term coefficients and Ɛt is the error term of the white noise. After regression of Equation (4), the Wald test (F-statistics) was used to identify the existence of the long-run relationship between the different variables. The Wald test for multiple parameters can be carried out by imposing restrictions on the estimated long-run coefficients of CO2 with the different variables of the model. Thus, we propose the following hypotheses.
H0: β1 = β2 = β3 (no long run relationship)
H1: β1 ≠ β2 ≠ β3 (a long run relationship exists)
The model is verified under the assumptions of H0 (no existence of co-integration relationships) whereas H1 (existence of co-integration relationships). The geographical focus of the study is Saudi Arabia. Data was gathered and managed using Microsoft Excel. However, the study analysis was based on statistical packages freely available within the open-source statistical system R (available at http://cran.r-project.org).
4. Results
To investigate the causal relationships among CO2 emissions, renewable energy consumption (RENC), and non-conventional energy resources (NCER) in Saudi Arabia, our initial focus was on assessing the stationarity of the time series data for these variables. This preliminary step is essential because stationarity is a requirement for conducting accurate modeling and regression analyses. In this regard, we utilized two robust statistical techniques: the Augmented Dickey-Fuller (ADF) test and the Phillips-Perron (PP) test. These tests are designed to detect the presence of unit roots within the data, which helps determine the order of integration for each variable.
The outcomes of the ADF and PP unit root tests are summarized in Table 3. For the variable representing CO2 emissions (lnCO2), both the ADF and PP tests showed that the null hypothesis could not be rejected at the level of the data, indicating that lnCO2 is not stationary at this stage. However, when we examined the first difference of lnCO2, we were able to reject the null hypothesis at a significance level of 1%. This result suggests that lnCO2 exhibits stationarity at order one, denoted as I(1), meaning it requires first differencing to achieve stationarity.
In contrast, the variable for renewable energy consumption (lnRENC) demonstrated a different behavior. The tests indicated a clear rejection of the null hypothesis at the level, suggesting that lnRENC is stationary at order zero, or I(0), and does not require differencing. This characteristic is significant because it implies that lnRENC can be used in analyses without further transformation. Furthermore, we examined the variable for non-conventional energy resources (lnNCER). The ADF and PP tests produced results indicating a weak rejection of the null hypothesis at the level, but a strong rejection at the first difference. Thus, we can conclude that lnNCER also exhibits stationarity at order one, I(1), like lnCO2.
In summary, the results of the ADF and PP unit root tests reveal that CO2 emissions, renewable energy consumption, and non-conventional energy resources exhibit mixed orders of integration, specifically I(1) and I(0). Importantly, none of these variables is of second order, or I(2).
Given these findings, we proceeded with the co-integration testing procedure, which is crucial in examining long-term relationships among non-stationary variables. This step allowed us to calculate and apply the panel Autoregressive Distributed Lag (ARDL) method. The results confirming the stationarity tests met the preconditions for ARDL analysis indicate that it is indeed appropriate to conduct cointegration and relational analyses within the ARDL framework. This approach will enable us to better understand the dynamic interactions between CO2 emissions, renewable energy consumption, and non-conventional energy resources in the context of Saudi Arabia’s energy landscape.
A variety of criteria play a crucial role in pinpointing the ideal number of lags for a model. Prominently featured in this discussion are the Akaike Information Criterion (AIC) and the Schwarz Bayesian Criterion (SBC), as noted by [25]. Among these, AIC often emerges as the favored choice, largely due to its roots in information theory and its robust approach to addressing some of the concerns associated with the underlying assumptions of SBC. Empirical studies further bolster this preference, revealing that AIC typically outperforms SBC in terms of efficiency. With this compelling evidence in hand, we have decided to rely on AIC to guide us in selecting the most effective number of lags for our model [26].
Table 4 above shows the maximum number of lags that ensures no serial autocorrelation and minimizes the information criteria is p = 2. Applying the Akaike Information Criterion (AIC) and the Schwarz Information Criterion (SIC) to the variables resulted in the selection of three lags. Therefore, we will explore ARDL models (p, q, r) that minimize the AIC criterion by appropriately choosing the delays.
To determine whether the variables are cointegrated, we need to compare the computed F-statistics with the critical values for I(0) and I(1) presented in Table 5, which is part of the bound’s test [21]. If the computed F-statistics are greater than the I(1) value, we conclude that a long-run relationship exists between the variables. Conversely, if the F-statistic is less than the I(0) value, we find that there is no cointegration. If the computed F-statistic falls between I(0) and I(1), we cannot draw any definitive conclusions.
Based on the comprehensive findings detailed in Table 5, we can confidently conclude that a significant long-run relationship exists between CO2 emissions, renewable energy consumption (RENC), and non-renewable energy consumption (NCER). Our investigation centred around the F-statistics, which yielded a value of 6.98163. This value is a critical component of our analysis as it enables us to evaluate the nature and strength of the relationships between these key variables over an extended period.
To interpret the significance of this F-statistic, we compared it to the critical values established by Pesaran at a 5% significance level. According to the Pesaran critical values table designed for models that include both an unrestricted intercept and a trend, the lower bound is identified as 2.11, while the upper bound is specified as 3.77. By juxtaposing our calculated F-statistics with these established critical thresholds, we can determine the statistical significance of the long-run relationship. This comparison will provide valuable insights into the interdependence between CO2 emissions and the various modes of energy consumption, ultimately enhancing our understanding of their contributions to environmental dynamics.
This conclusion remains valid when we consider the Pesaran critical values at the 10%, 2.5%, and 1% significance levels, as the F-statistic (6.98163) exceeds the upper bounds of 3.35, 4.38, and 5.01, respectively. Therefore, we can confidently state that CO2 emissions are significantly linked to the other variables in this analysis over the long term. Table 6 reports on the long-term cointegration relationship between climate change and renewable and non-renewable energy.
Table 6 illustrates the long-run causality relationships among the variables studied. Firstly, renewable energy consumption (RENC) Granger-caused carbon dioxide (CO2) emissions at the 10% significance level (p-value = 0.076). This indicates that a 1% increase in renewable energy consumption leads to a 0.21% decrease in CO2 emissions. Secondly, non-conventional energy resources (NCER) also Granger-caused CO2 emissions in Saudi Arabia at a 5% significance level in the long run (p-value = 0.0346). Notably, a 1% increase in non-conventional energy resources resulted in a significant 53.4% decrease in CO2 emissions. These findings suggest that both renewable energy consumption and non-conventional energy resources have a negative impact on CO2 emissions in Saudi Arabia over the long term during the study period.
In this paper, diagnostic tests were conducted to validate the robustness and stability of the models. Therefore, Cumulative Sum (CUSUM) and CUSUM square (CUSUMSQ) tests proposed by [27]. The value of the statistic must then be verified under the null hypothesis that indicates the stability of the relationship curve in an interval fixed by two straight lines. In the case of a time series, the stability tests, also called structural change tests, examine the stability of the estimated coefficients of the equation while showing the presence of a structural change in the correlation. The CUSUM test is then adapted to test the hypothesis of stability of the long-run relations between climate change, renewable energy and non-renewable energy.
Both Figure 1 and Figure 2 vividly illustrate the CUSUM and CUSUM squared graphs of recursive residuals derived from the stability tests of the Autoregressive Distributed Lag (ARDL) model. The solid lines weave through the graphs, depicting the actual residual values, while the dotted lines form a delicate boundary representing the 95% credible interval. Throughout the observed timeframe, all lines gracefully glide within these critical bounds, revealing that the residuals do not display any noteworthy structural breaks or unexpected deviations from their anticipated behavior. This consistent stability not only highlights the robustness of the ARDL estimation results previously discussed but also reinforces the model’s credibility and its significant applicability within the research context.
In conclusion, the CUSUM and CUSUM squared test curves fall within the 5% confidence interval, indicating the stability of the model.
5. Conclusions and Policy Implications
The objective of this article is to provide a comprehensive analysis of how both renewable and non-renewable energy sources contribute to climate change in Saudi Arabia. The findings reveal that these energy types have a negative and significant effect on climate change over the long term. During the energy production process, substantial amounts of greenhouse gases and waste are released into the atmosphere, posing a serious threat to the ecosystem. The extent of climate change is gauged through various indicators, including the levels of carbon dioxide (CO2) emissions and the country’s average temperature. As energy consumption increases, there is a corresponding increase in CO2 emissions, which can jeopardize Saudi Arabia’s adherence to international climate agreements.
Climate change is one of the most severe impacts stemming from various activities, particularly the burning of fossil fuels, as well as significant greenhouse gas emissions from deforestation and agricultural practices. While land serves as both a source of and a victim of climate change, it can also play a crucial role in finding solutions. Implementing sustainable land management practices can make strides in reducing greenhouse gas emissions from land-based activities. Additionally, these practices not only contribute to climate change mitigation but also provide vital ecosystem services that enhance society’s ability to adapt to the ongoing challenges posed by climate change. By implementing these initiatives, policymakers can advance a more sustainable and resilient environment in Saudi Arabia and beyond.
All in all, the findings of this study are highly significant as they provide essential ecosystem services that can help society adapt to the adverse effects of climate change. Additionally, policymakers can utilize the insights gained from this research to mitigate the impact of climate change on energy by utilizing modern technologies, such as carbon footprint calculators and other applications designed to effectively monitor and control carbon emissions. Therefore, the insights from this study could serve as a valuable reference for policymakers, industry leaders, and other stakeholders in developing effective strategies to manage and mitigate the impact of climate change on energy in Saudi Arabia.
This study has led to insightful policy recommendations based on its findings. The research demonstrates that non-conventional energy sources have consistently reduced CO2 emissions. Given that the oil industry has historically driven economic growth in Saudi Arabia, the country’s Vision 2030 aims to diversify the economy and reduce dependency on fossil fuels. Therefore, policymakers are encouraged to invest in renewable energy solutions, such as green hydrogen generation, and to implement effective regulations for energy management, transportation, and technology use. This approach could create new economic opportunities across various sectors, including manufacturing, technology, and services.
Non-conventional renewable energy is vital in Saudi Arabia’s efforts to diversify its economy, generate jobs, advance technology, and promote sustainability. These efforts align with the goals of Vision 2030, initiated by Crown Prince Mohammed bin Salman, which seeks to embrace renewable energy sources and lessen the Kingdom’s reliance on fossil fuels. We believe that prioritizing renewable energy is essential for sustainable economic growth, resilience, and fulfilling international climate commitments. By focusing on renewable energy, Saudi Arabia could position itself as an exporter of clean energy technologies, including solar and wind power systems, to regions such as the Middle East, Asia, and Africa. Moreover, the Kingdom could supply surplus renewable energy to neighbouring countries through regional grids, further strengthening its economic position.
Author Contributions
Conceptualization, K. Ben-Ahmed and M. Amamou; methodology, K. Ben-Ahmed; software, K. Ben-Ahmed; validation, K. Ben-Ahmed, and M. Amamou; formal analysis, K. Ben-Ahmed; investigation, M. Amamou; resources, M. Amamou; data curation, M. Amamou; writing—original draft preparation, K. Ben-Ahmed; writing—review and editing, K. Ben-Ahmed; visualization, M. Amamou; supervision, M. Amamou; project administration, K. Ben-Ahmed. All authors have read and agreed to the published version of the manuscript.
Funding
The authors declare that they have no known competing financial interests or personal relationships that could have appeared to influence the work reported in this paper.
Data Availability Statement
Data will be provided at the request and after the consent of all authors.
Acknowledgments
The authors extend their appreciation to the Deputyship for Research & Innovation, Ministry of Education in Saudi Arabia for funding this research work through the project number MoE-IF-UJ-R2-22-20622-1.
Conflicts of Interest
The authors declare no conflicts of interest.
References
- World Bank. (2018). Sustainable Energy for All: The Role of Energy in Development.
- Odnoletkova, N. , & Patzek, T. W. Data-driven analysis of climate change in Saudi Arabia: Trends in temperature extremes and human comfort indicators. Journal of Applied Meteorology and Climatology 2021, 60, 1055–1070. [Google Scholar]
- Amran, Y. A. , Amran, Y. M., Alyousef, R., & Alabduljabbar, H. (2020). Renewable and sustainable energy production in Saudi Arabia according to Saudi Vision 2030; Status and prospects. Journal of Cleaner Production, 247, 119602.
- Samiullah, M. , & Khanum, R. (2024). CLIMATE CHANGE AND ENVIRONMENTAL DEGRADATION: A SERIOUS THREAT TO GLOBAL SECURITY. European Journal of Social Sciences Studies, 9(5).
- Burrett, R. , Clini, C., Dixon, R., Eckhart, M., El-Ashry, M., Gupta, D.,... & Ballesteros, A. R. (2009). Renewable energy policy network for the 21st century. REN21 Renewables Global Status Report.
- Ang, T. Z. , Salem, M., Kamarol, M., Das, H. S., Nazari, M. A., & Prabaharan, N. (2022). A comprehensive study of renewable energy sources: Classifications, challenges and suggestions. Energy strategy reviews, 43, 100939.
- Howarth, N. , Odnoletkova, N., Alshehri, T., Almadani, A., Lanza, A., & Patzek, T. (2020). Staying cool in A warming climate: temperature, electricity and air conditioning in Saudi Arabia. Climate, 8(1), 4.
- Manal, A. (2025). The Role of Renewable Energy in Driving Economic Transformation and Sustainable Development in Saudi Arabia. International Journal of Energy Economics and Policy, 15(1), 364-373.
- Khan, M. U. H. (2016). Saudi Arabia’s vision 2030. Defence Journal, 19(11), 36.
- Al-Gahtani, S. F. (2024). Saudi Arabia’s journey toward a renewable future. Energies, 17(11), 2444.
- Olabi, A. G. & Abdelkareem, M. A. (2022). Renewable energy and climate change. Renewable and Sustainable Energy Reviews, 158, 112111.
- Yalew, S. G. van Vliet, M. T., Gernaat, D. E., Ludwig, F., Miara, A., Park, C., ... & Van Vuuren, D. P. Impacts of climate change on energy systems in global and regional scenarios. Nature Energy 2020, 5(10), 794–802. [Google Scholar]
- Cronin J, Anandarajah G and Dessens O 2018 Climate change impacts on the energy system: a review of trends and gaps Clim. Change 151, pp. 79–93.
- Treut, H, Somerville, R, Cubasch, U, Ding Y, Mauritzen, C, Mokssit, A, Peterson, T, Prather, M. (2007) Historical Overview of Climate Change. In: Climate Change 2007: The Physical Science Basis. Contribution of Working Group I to the Fourth Assessment Report of the Intergovernmental Panel on Climate Change [Solomon, S et al., (eds.)]. Cambridge University Press, Cambridge, United Kingdom and New York, NY, USA.
- Rudolph, A. , & Figge, L. (2017). Determinants of Ecological Footprints: What is the role of globalization? Ecological Indicators. 81, pp. 348-361.
- Cowan, W. N. , Chang, T., Inglesi-Lotz, R., & Gupta, R. (2014). The nexus of electricity consumption, economic growth and CO2 emissions in the BRICS countries. Energy Policy, 66, pp. 359-368.
- Nathaniel, S. P. (2020). Ecological footprint, energy use, trade, and urbanization linkage in Indonesia. Geo Journal, pp. 1-14.
- Rahman, M. M. (2020). Environmental degradation: The role of electricity consumption, economic growth and globalisation. Journal of environnemental management, 253, p. 109742.
- Jarque, C.M., and Bera, A. K. (1980). Efficient tests for normality, homoscedasticity and serial independence of regression residuals Economics Letters 6 255–9.
- Pesaran, M. H. , Shin, Y. (1999). An autoregressive distributed lag modelling approach to cointegration analysis, In: Strom, S., Holly, A., Diamond, P. (Eds.). Centennial Volume of Rangar Frisch, Cambridge University Press, Cambridge.
- Pesaran, M.H. , Shin, Y., Smith, R.J. (2001). Bounds testing approaches the analysis of level relationships. Journal of Applied Econometrics.16, pp. 289-326.
- Engle, R.F. , Granger.C.W.J. (1987). Co-Integration and Error Correction: Representation, Estimation, and Testing. Econometrica.55(2), pp. 251-276.
- Johansen, S. (1988). Statistical Analysis of Cointegration Vectors. Journal of Economic Dynamics and Control. 2 (2–3), pp. 231–254.
- Johansen, S. , Juselius, K. (1990). Maximum Likelihood Estimation and Inference on Cointegration– with Applications to the Demand for Money. Oxford Bulletin of Economics and Statistics. 52(2), pp. 169–210.
- Anderson, D. R. , Burnham, K.P. (2002). Model selection and multimodal inference: a practical information-theoretical approach. 2nd Ed. New York: Springer-Verlag; 2002.
- Akaike, H. (1987). Factor analysis and AIC. Psychometrika, 52 317–32.
- Brown, R. L. , Durbin, J., and Evans, J.M. (1975). Techniques for testing the constancy of regression relationships over Time Journal of the Royal Statistical Society. Series B (Methodological) 37, pp. 149–92.
Figure 1.
CUSUMS test for CO2, RENC and NCER.
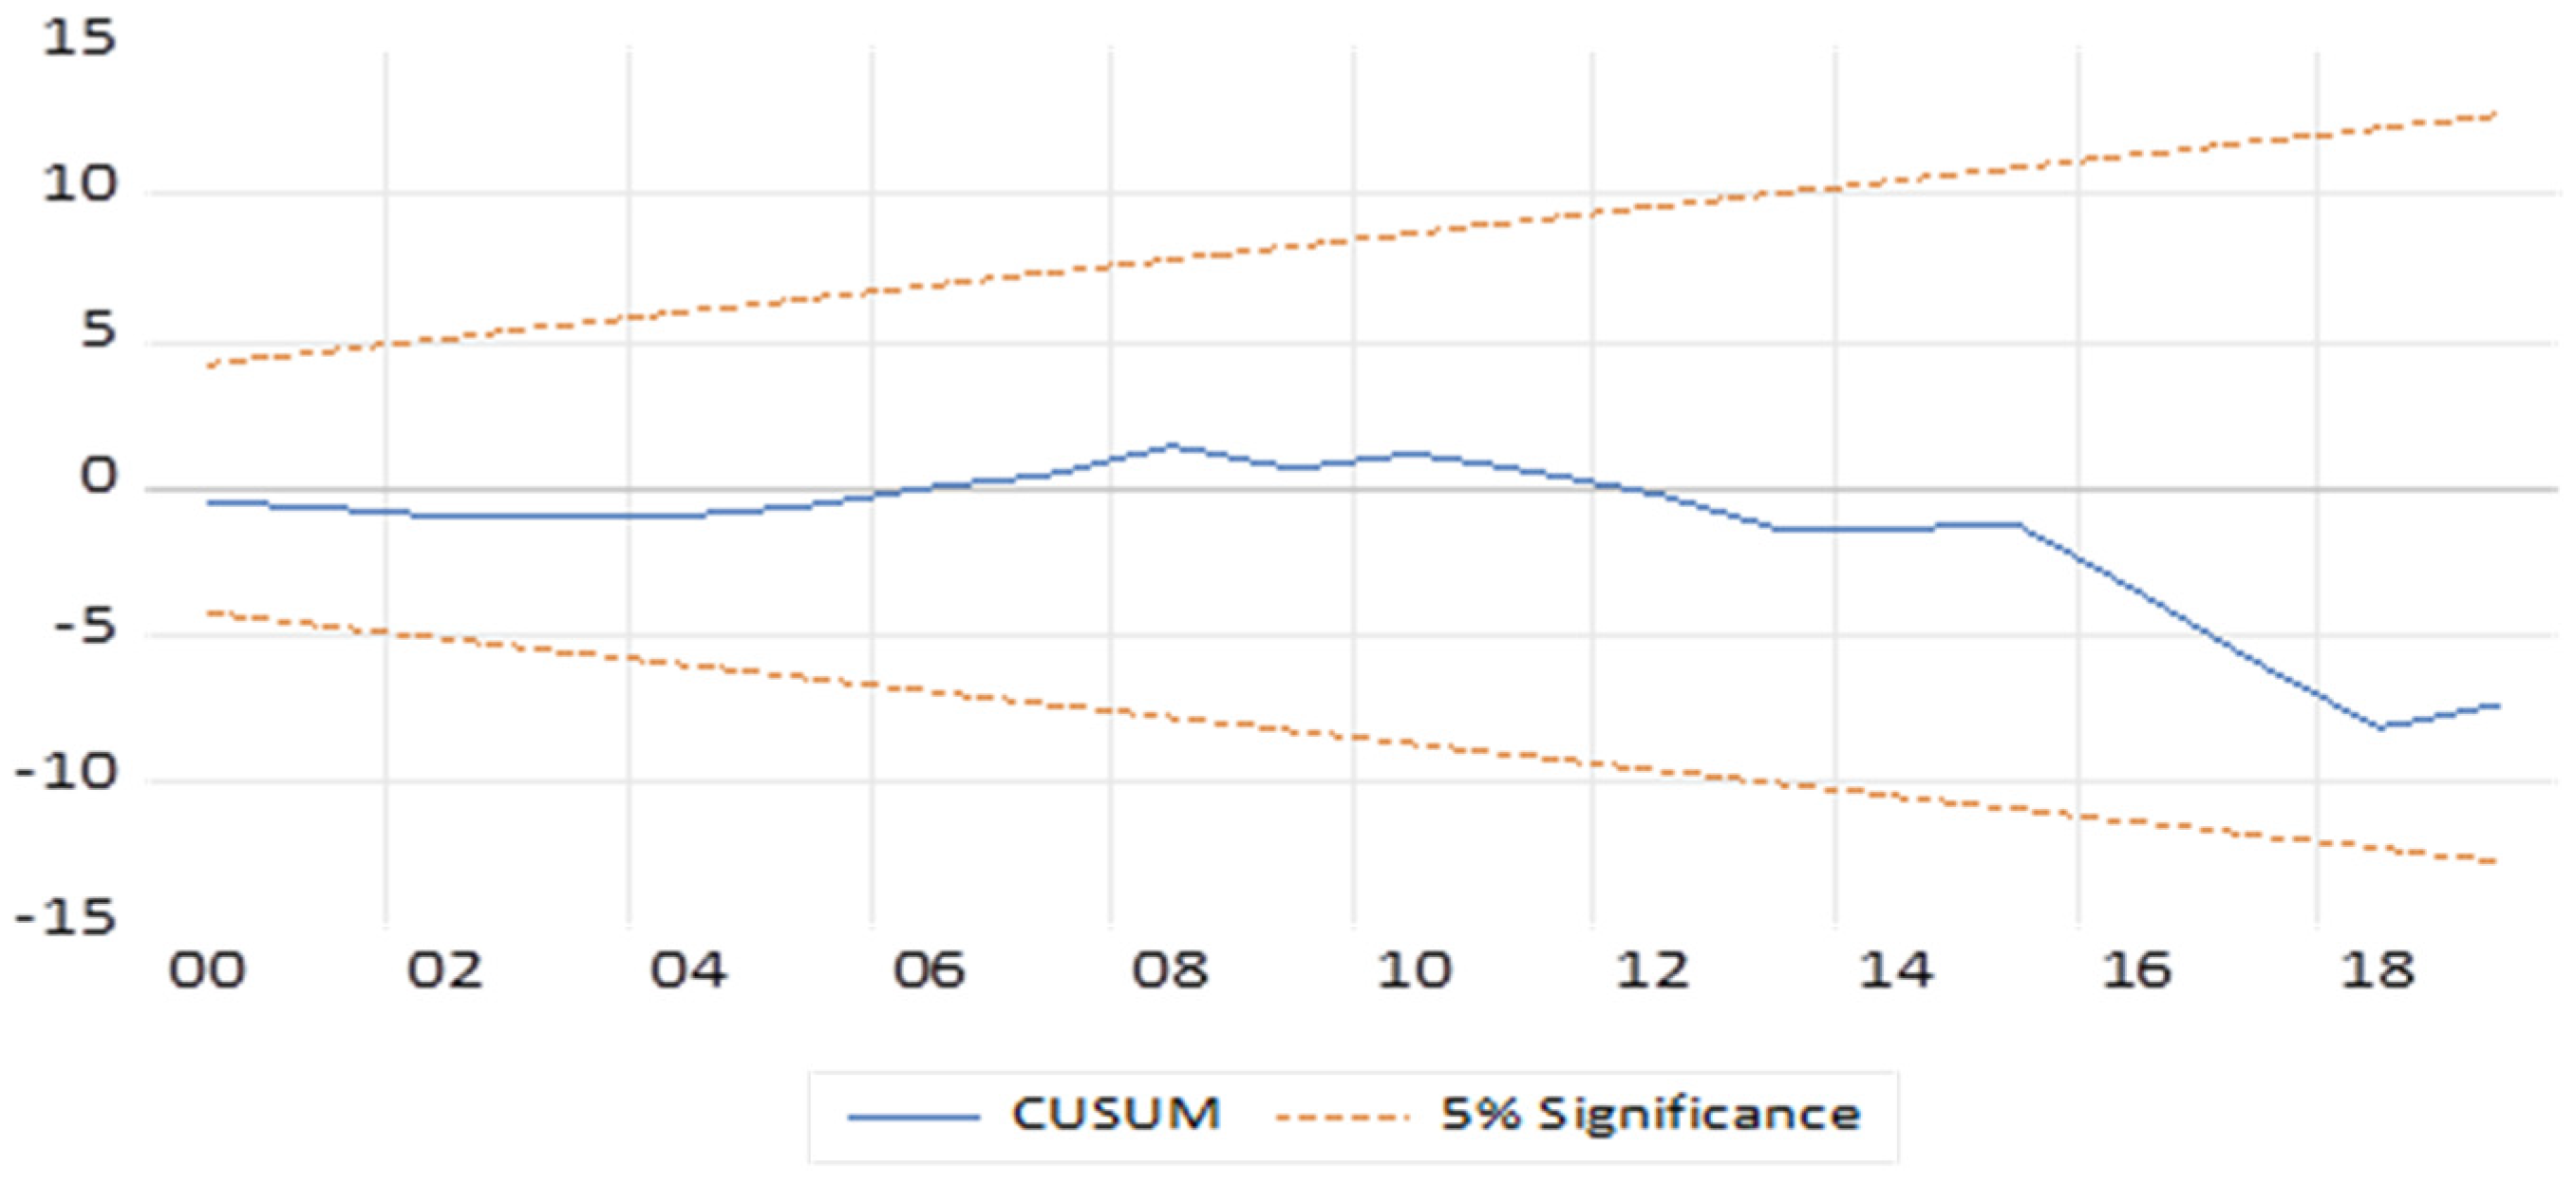
Figure 2.
CUSUM square test for CO2, RENC and NCER variables.
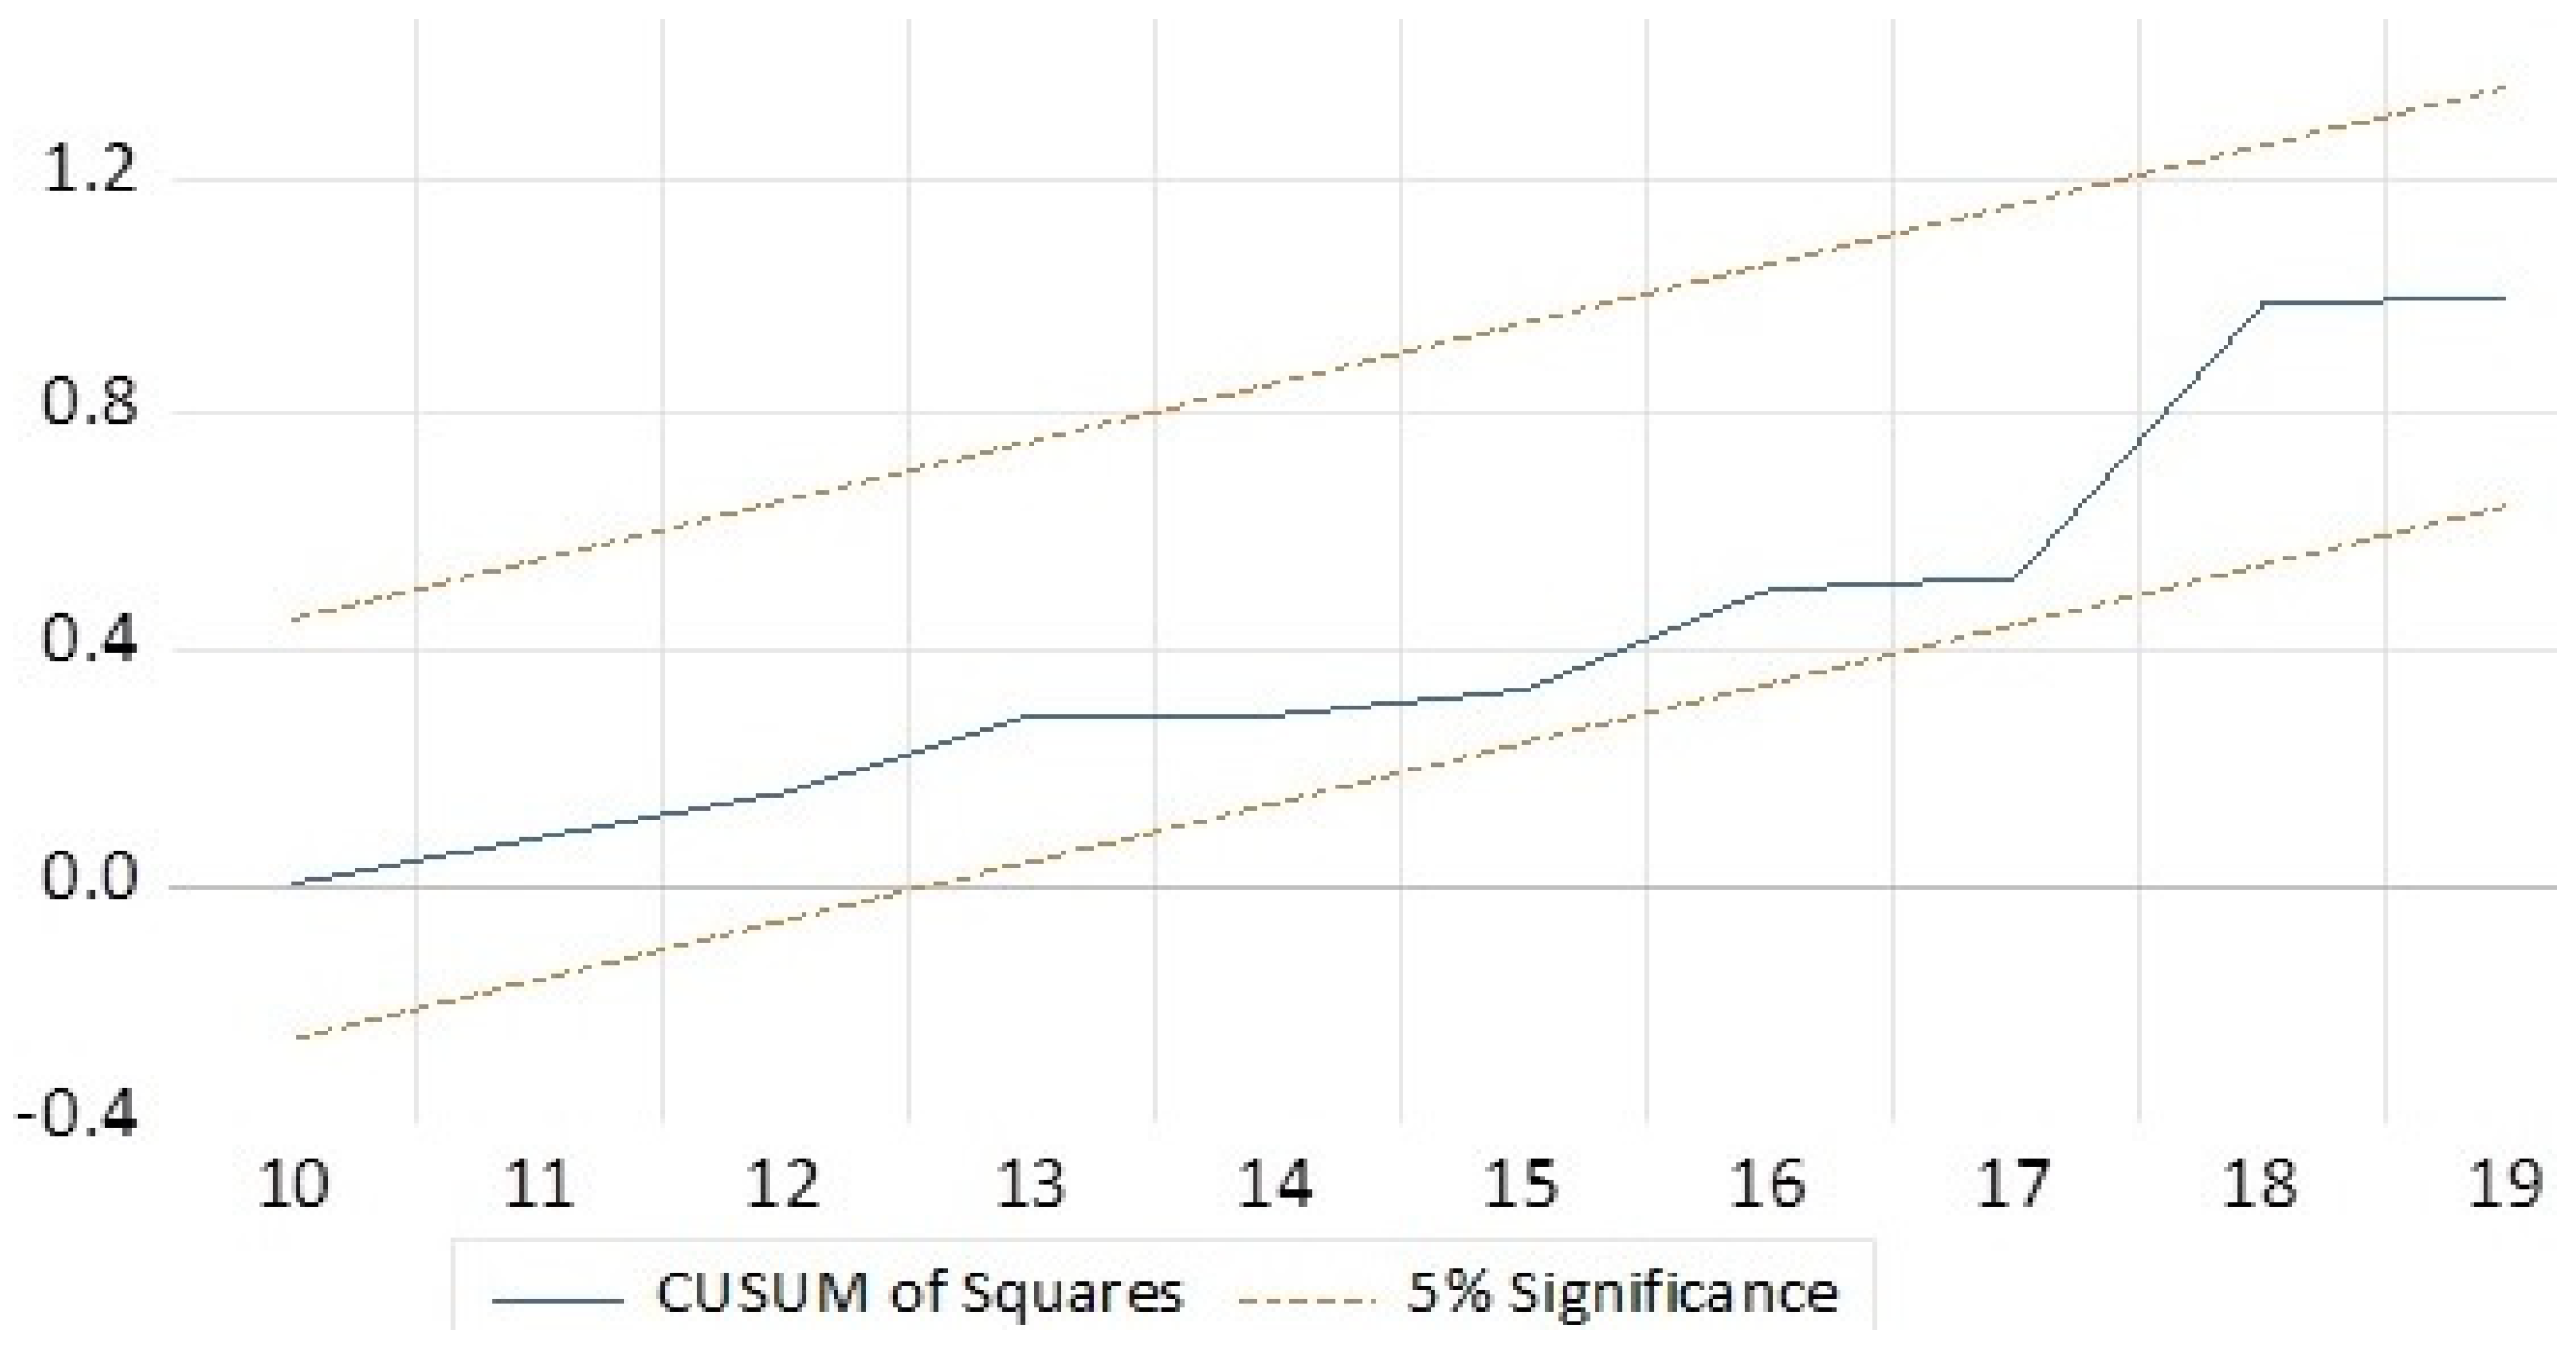

Table 1.
Data description of the variables.
| Variable | Description | Unit | Year | Source |
|---|---|---|---|---|
| CO2 | CO2 emissions per capita include sources from fossil fuel use and industrial processes. | Ton CO2/capita | 1990–2019 | https://edgar.jrc.ec.europa.eu/dataset_ghg78 |
| RENC | Renewable energy consumption is the share of renewable energy in total final energy consumption. | % of total final energy consumption | 1990–2019 | https://datacatalog.worldbank.org/public-licenses#cc-by |
| NCER | Electricity production from oil (crude oil and petroleum products), gas (natural gas excluding natural gas liquids), and coal (all coal and brown coal). | Electricity production from oil, gas and coal sources (% of total) | 1990–2019 | https://www.iea.org/data-and-statistics |
Table 2.
Statistical proprieties of the time-series data of Saudi Arabia from 1990 to 2019.
| Variable | CO2 emission | RENC | NCER |
|---|---|---|---|
| Mean | 347064 | 0.0148941 | 75.9799315 |
| Median | 339678 | 0.0204583 | 74.8247301 |
| Min. | 171407 | 0.0903271 | 67.6731248 |
| Max. | 565191 | 0.3798525 | 86.9979705 |
| St. Dev | 2746.3187341 | 0.1478266 | 3.7394211 |
| Skewness | -0.1105526 | 0.1865272 | -0.8554191 |
| Kurtosis | 3.1791151 | 1.3945724 | 2.2205716 |
| Jarque – Bera | 1.7691115 (0.5166) | 4.5861241 (0.2173) | 3.4462135 (0.3615) |
| Observations | 30 | 30 | 30 |
Source: author’s computation, 2025.
Table 3.
Results of Unit-root tests.
| At Level | At First Difference | |||||
|---|---|---|---|---|---|---|
| Variable | Intercept | Intercept and Trend | Intercept | Intercept and Trend | Decision | |
| ADF Test | lnCO2 | –2.722(0.185) | –2.511(0.131) | –8.054***(0.000) | –8.195***(0.000) | I(1) |
| lnRENC | –1.165(0.332) | –3.174*(0.079) | –6.226***(0.002) | –6.273***(0.006) | I(0) | |
| lnNCER | –1.857(0.245) | –0.827**(0.018) | –5.587***(0.003) | –3.236(0.111) | I(0) | |
| PP Test | lnCO2 | –2.722(0.185) | –2.511(0.131) | –10.112***(0.000) | –5.612***(0.007) | I(1) |
| lnRENC | –0.177(0.916) | –2.704*(0.086) | –4.441***(0.007) | –4.283***(0.002) | I(0) | |
| lnNCER | –1.622(0.422) | –3.493*(0.091) | –3.588*(0.012) | –1.247***(0.000) | I(0) | |
Note: ***, **, and * indicate t-statistics which are significant the 1%, 5% and 10%levels, respectively.
Table 4.
Lagged selection criteria.
| Lag | Log | AIC | SBC | HQ |
|---|---|---|---|---|
| 0 | –28.32414 | 2.246233 | 2.342221 | 2.274775 |
| 1 | 36.08751 | –2.228704* | –1.940741* | –2.143078* |
| 2 | 37.76101 | –2.056388 | –1.576449 | –1.913677 |
Table 5.
Critical values and for the ARDL Bounds test.
| Probability | 0.1 | 0.05 | 0.025 | 0.01 | ||||
|---|---|---|---|---|---|---|---|---|
| Bounds test | I (0) | I (1) | I (0) | I (1) | I (0) | I (1) | I (0) | I (1) |
| 2.631 | 3.355 | 2.111 | 3.774 | 3.551 | 4.382 | 4.131 | 5.011 | |
Notes: F-statistic = 6.98163, K =2. Null hypothesis (H0): No long-run relationships exist. Source: Author calculation.
Table 6.
Coefficient and p-value results of the long-run causality.
| Variable | Coefficient | Prob. |
|---|---|---|
| ln RENC | –0.214583 | 0.0762** |
| ln NCER | –0.533823 | 0.0346* |
| Constant | 70030.34 | 0.1369 |
Note: *and ** indicate the significance levels of 5% and 10% level, respectively.
Disclaimer/Publisher’s Note: The statements, opinions and data contained in all publications are solely those of the individual author(s) and contributor(s) and not of MDPI and/or the editor(s). MDPI and/or the editor(s) disclaim responsibility for any injury to people or property resulting from any ideas, methods, instructions or products referred to in the content. |
© 2025 by the authors. Licensee MDPI, Basel, Switzerland. This article is an open access article distributed under the terms and conditions of the Creative Commons Attribution (CC BY) license (http://creativecommons.org/licenses/by/4.0/).
Copyright: This open access article is published under a Creative Commons CC BY 4.0 license, which permit the free download, distribution, and reuse, provided that the author and preprint are cited in any reuse.


