
Submitted:
06 March 2025
Posted:
07 March 2025
You are already at the latest version
Abstract
The transition to a low-carbon economy is a key challenge for Eastern Europe, where economic growth, energy investments, and emissions reduction policies interact in complex ways. This study employs a spatial-econometric approach to assess the effectiveness of renewable energy investments and government environmental spending in mitigating CO₂ emissions across the region. Using panel data and spatial Durbin models (SDM), we identify significant spillover effects in emissions reduction, revealing those environmental policies in one country influence neighboring regions. The results indicate that renewable investments have a positive but localized impact on emissions reduction, while government environmental expenditure exhibits diminishing returns beyond a threshold of 0.01 GDP. Threshold regression analysis confirms that excessive spending may lead to inefficiencies, reversing its expected benefits. Additionally, the stochastic frontier analysis (SFA) highlights disparities in energy efficiency, with some countries demonstrating stronger optimization strategies than others. These findings underscore the importance of policy coordination and targeted investment strategies to enhance the effectiveness of decarbonization efforts. Strengthening regional cooperation and optimizing environmental expenditure allocation can significantly improve sustainability outcomes in Eastern Europe.
Keywords:
renewable energy investments
; spatial econometrics
; emissions reduction
; environmental policy
; efficiency analysis
; Eastern Europe
1. Introduction
Background and Motivation
Climate change and economic growth present a complex dilemma for the global economy. Nations striving for economic development often rely on practices that contribute to greenhouse gas emissions and environmental degradation. This tension between economic progress and environmental sustainability is central to international policy discussions and academic research. The challenge is finding ways to maintain economic growth while reducing carbon emissions and mitigating climate change impacts.
The interconnectedness of climate change and economic growth is evident in sectors like energy production, transportation, and industrial processes. Developing countries face a trade-off between rapid industrialization to alleviate poverty and adopting sustainable practices. Developed nations must transition their economies towards greener alternatives without compromising competitiveness. This global predicament has spurred efforts to develop innovative technologies, implement policy measures, and foster international cooperation to achieve economic prosperity and environmental protection.
Eastern Europe's industrial landscape has been shaped by its reliance on high-carbon energy sources, particularly coal and natural gas. This stems from the region's abundant fossil fuel reserves and Soviet-era industrial policies prioritizing heavy industry and energy-intensive manufacturing. As a result, many Eastern European countries face challenges in reducing their carbon footprint and meeting international climate commitments.
The region is transitioning toward renewable energy sources, driven by environmental awareness, EU regulations, and declining renewable technology costs. Poland, Romania, and Bulgaria are investing in wind and solar projects and exploring biomass and geothermal energy. The transition involves economic considerations, energy security concerns, and retraining workers from traditional sectors. Its success is crucial for Eastern Europe's industrial competitiveness and environmental sustainability.
The EU's Green Deal aims to transform the EU into a climate-neutral economy by 2050. This initiative encompasses energy, transportation, agriculture, and industry to reduce greenhouse gas emissions and promote sustainable growth. While the Green Deal sets ambitious targets, implementing these policies falls to individual member states, resulting in varying effectiveness across countries.
National-level policies are crucial in translating EU climate objectives into actions. Their effectiveness is influenced by political will, economic constraints, and existing infrastructure. Some countries have progressed in renewable energy adoption and energy efficiency, while others lag behind due to challenges like fossil fuel reliance or limited resources. This implementation disparity creates policy gaps that may hinder the EU's progress towards its climate goals. Addressing these gaps requires coordination between EU institutions and member states, and targeted support for countries facing greater challenges in transitioning to a low-carbon economy.
Research Gap and Justification
Existing research confirms a complex interplay between economic growth and emissions. Studies show that as economies expand, greenhouse gas emissions often increase, particularly in early development stages. The Environmental Kuznets Curve (EKC) suggests environmental degradation worsens as per capita income rises but eventually improves with higher economic development. However, the pattern's applicability and consistency across regions and periods remain debated among researchers.
Despite extensive literature, understanding these dynamics in Eastern Europe is limited. This region presents a unique case due to its distinct historical, political, and economic trajectory, especially post-Soviet era. The transition from centrally planned economies to market-based systems, rapid industrialization, and modernization likely produced growth and environmental impact patterns that may not align with other regions. More targeted research is needed to explore the growth-emissions relationship in Eastern Europe, considering their specific developmental challenges, energy policies, and environmental regulations.
The scarcity of studies using advanced econometric techniques like panel econometrics, vector autoregression (VAR) models, and spatial analysis represents a significant gap. This limitation is pronounced in developing nations, as most studies focus on developed economies. The absence of these methodologies hinders capturing the complex dynamics characterizing economic systems, especially in rapidly evolving markets.
Furthermore, limited application of these advanced techniques has led to an incomplete understanding of spillover effects in regional economies. Spillover effects, the impact of economic activities or policies in one region on neighboring areas, are crucial in shaping economic outcomes and policy effectiveness. Neglecting these spatial interactions may cause researchers and policymakers to overlook important channels through which economic shocks propagate and fail to account for the full range of consequences of economic interventions. Addressing this gap would enhance our understanding of regional economic dynamics and provide valuable insights for crafting more effective and targeted economic policies in diverse contexts.
Research Objectives and Research Questions
The primary objective of this research is to investigate the interplay between economic growth, renewable energy investments, and emissions levels in Eastern European countries. Using a multi-method econometric approach, the study aims to analyze these relationships, considering the region's unique economic and environmental characteristics. This examination is relevant given Eastern European economies' ongoing transition and efforts to balance development with sustainability.
The multi-method econometric approach will likely involve time-series analysis, panel data techniques, and possibly structural equation modeling to capture short-term and long-term dynamics of the relationships between variables. This methodology will allow for understanding how economic growth impacts and is impacted by renewable energy investments, and how these factors influence emission levels. The research may explore policy implications, offering insights into how Eastern European countries can promote growth while advancing renewable energy sectors and reducing environmental degradation.
Our research questions are:
- How does economic growth influence CO₂ emissions in Eastern Europe?
- What is the impact of renewable investments on emissions reduction over time?
- How do government environmental expenditures affect emissions, and is there a threshold effect?
- Do spatial spillover effects exist, and what are the implications for policy coordination?
Structure of the Paper
Section 2 provides a literature review on interconnections between economic growth, renewable energy adoption, and spatial spillover effects. It examines how renewable energy investments impact economic growth across regions and countries, and explores spatial spillovers, where activities and policies in one area influence neighboring regions. The review highlights key studies, methodologies, and findings, identifying knowledge gaps and setting the stage for the paper's contribution.
Section 3 details data sources and econometric methodology. It describes variables measuring economic growth, renewable energy adoption, and other relevant factors, and outlines spatial econometric techniques used to analyze spillover effects across geographic areas. The methodology explanation includes justifications for the chosen approach and limitations or assumptions in the data analysis process. Section 4 and Section 5 are expected to present empirical findings, discuss implications, and conclude the paper.
2. Literature Review
The literature on environmental policy and economic growth has been dominated by the Environmental Kuznets Curve (EKC) hypothesis, positing an inverted U-shaped relationship between income levels and environmental degradation ([1]. Empirical studies on the EKC provide mixed evidence, particularly in transition economies where industrial restructuring and policy heterogeneity influence emissions trajectories[2]. Recent research has expanded EKC analysis by incorporating spatial spillovers and nonlinear policy effects, recognizing that national environmental outcomes are shaped by cross-border interactions.
The Economic Growth-Emissions Relationship
The EKC hypothesis suggests an inverted U-shaped relationship between economic growth and environmental degradation. Studies examining this relationship across regions and pollutants have yielded mixed results, with some supporting the EKC hypothesis but findings varying by region and pollutant.
In the MENA region, EKC was confirmed for SO₂ and CO₂ emissions in certain countries but not the entire region. Studies predict China's CO₂ emissions will increase until approximately 2078, indicating a delayed EKC effect[3]. East Africa showed a bell-shaped relationship between per capita income and CO₂ emissions[4]. Among 44 countries, only the EU, OECD, and G7 displayed EKC patterns[5]. Greenland exhibited a U-shaped EKC, suggesting initial decoupling followed by emissions resurgence[6]. OECD countries showed varied EKC patterns, including U-shaped and N-shaped relationships[7].
These findings suggest the EKC hypothesis is not universally applicable and depends on factors like industrialization, policy frameworks, and energy transitions.
Classical EKC studies confirm the hypothesis for various pollutants, but contradictions persist. The EKC holds for sulfur oxides, non-methane volatile organic compounds, greenhouse gases, and ammonia in EU-28 countries [8]. Brazilian CO₂ and nitrous oxide emissions followed the EKC pattern across states [9]. However, Turkish provinces showed a U-shaped relationship between economic development and SO₂ levels [10].
EKC validity depends on pollutant type, economic structure, and timeframe. High elasticity of substitution between fossil fuels and renewable energy may be necessary for EKC confirmation [11]. EKC may not exist for both developed and developing nations, reflecting nonlinearity in economic-environmental interactions [12].
Recent studies provide a nuanced perspective on EKC in Eastern Europe. Using industrial share as a proxy for economic structure, EKC was not confirmed in European countries. Instead, a U-shaped relationship was observed [13]. In OECD countries, the relationship between economic growth and emissions depends on emission levels:
- Lower quartile: No impact of economic growth on emissions.
- Central quartile: A U-shaped EKC pattern.
- Upper quartile: An N-shaped curve, where emissions first decrease, then rise again [7].
These findings suggest EKC is not universally applicable in Eastern Europe and depends on sectoral dynamics, energy efficiency, and policy interventions.
While EKC remains widely studied, numerous studies contradict its predictions. In OECD countries, panel quantile regression revealed U-shaped and N-shaped patterns [7]. A study across 44 nations found EKC patterns in only three major economic communities, with only 9 out of 44 countries following the expected trajectory [5]. A broader analysis of 62 countries showed the economic growth-environmental degradation relationship followed an N-pattern, rather than an inverted U-shape [14].
These contradictions highlight that economic structure, energy sources, and policy measures play a critical role in determining emission trajectories. The EKC hypothesis should be considered within a region-specific and pollutant-specific framework, rather than as a universal model.
Industrialization significantly impacts carbon emissions, especially in emerging and manufacturing-heavy economies. Case studies illustrate the complex relationship between industrial development and emission trends. In emerging economies, CO₂ emissions have risen due to urbanization and industrialization, partly offset by improved energy efficiency and mix [15]. China's carbon emissions trading rights policy for six heavy pollution industries has reduced manufacturing sector emissions [16]. In Latin America and Caribbean, industrial restructuring has slowed emissions growth [15]. India's industrialization has long-term positive impact on CO₂ emissions, highlighting the need for cleaner production and non-polluting sector expansion [17]. In Gulf Cooperation Council countries, accelerated industrialization has increased emissions despite efforts to transition to green economies [18].
These findings suggest industrialization-driven emissions can be mitigated through targeted policies, including energy efficiency improvements, regulatory interventions, and industrial structure shifts.
The relationship between industrialization and energy substitution varies across regions. In Pakistan, industrialization has enabled significant substitution between energy and non-energy factors [19]. Malaysia shows strong substitution potential between hydropower and fossil fuels in electricity generation [20]. In Latin America, renewable energy consumption supports economic growth, with a 1% increase corresponding to 1% economic growth, supporting a renewable-based industrialization model [21].
These findings indicate industrialization can coexist with renewable energy transition, though substitution depends on local resources, policies, and technological advancements.
Gradual Impact of Renewable Energy on Emissions
The impact of renewable energy consumption on CO₂ emissions varies between long run and short run. In the long run, renewable energy significantly reduces emissions. In the United States, renewable energy consumption is associated with emission declines [22]. Argentina shows a similar trend, with renewables contributing to long-term environmental quality improvements [23]. In China, the short-run impact of renewable energy on emissions appears weak, indicating the transition effect takes time [24].
While renewable energy adoption is beneficial long-term, short-term effects may be negligible. In Colombia, renewable energy investments show positive long-term effects on emissions reduction [25]. However, an analysis of COVID-19-related emission reductions suggests temporary reductions in fossil fuel consumption do not significantly impact global climate trends [26].
These findings emphasize that renewable energy investments require time to yield significant emission reductions, highlighting the importance of long-term policy commitments [27].
Empirical evidence confirms that renewable energy investments take time to impact emissions measurably. In China, both green energy investments and renewable energy consumption reduce emissions, with renewables having a higher marginal contribution due to investment lag effects [28]. Studies show off-grid renewable energy investments initially increase CO₂ emissions but lead to reductions after a one-year lag [29]. Further studies reinforce that long-term investments in renewables have positive effects on environmental quality [27,30]. These findings support that renewable investments require time to take effect, stressing the need for consistent policy measures [31].
Despite substantial investments in renewables, some studies indicate no immediate emission decline. In France, Spain, and Sweden, CO₂ emissions have not substantially decreased, despite high renewable energy penetration and active climate policies [32]. Some findings suggest renewable energy can directly contribute to increased CO₂ emissions in certain contexts [33]. The effectiveness of renewables on emissions may also depend on ecological footprint quantiles, with diminishing effects in higher-emission economies [34].
These contradictions suggest that while renewable energy is crucial for emissions reduction, its impact is gradual and depends on economic growth patterns, energy mixes, and technological advancements [32]. To effectively transition to low-carbon economies, coordinated policy actions and technological innovations are needed [35].
The transition to renewable energy for reducing CO₂ emissions is gradual. Long-term studies confirm its effectiveness, while short-term contradictions highlight challenges. Findings stress the importance of sustained investments, policy stability, and technological development for successful adoption of renewables in decarbonization.
Policy Effectiveness in Renewable Energy Transitions
The renewable energy transition in Eastern Europe has been shaped by market-based and regulatory approaches. The region's status as "dependent market economies" (DMEs) has influenced its policy frameworks[36]. Initially, Eastern European countries adopted coordinated market economy (CME)-style policies. Recently, there has been a shift towards centralization and market-based governance at national and EU levels [36].
Market-based mechanisms have shown some success, but their effectiveness has been limited by institutional and structural constraints of DMEs:
- Market-driven policies increased investment incentives but often faced regulatory instability.
- Regulatory interventions expanded renewable energy capacity, but long-term funding remains uncertain.
The interplay between market-based and regulatory policies suggests a balanced, context-specific approach is necessary for a successful transition in Eastern Europe. Market-based solutions foster competition, while regulatory interventions are crucial in overcoming barriers.
The effectiveness of renewable energy policies varies across regions and instruments. Feed-in Tariffs (FITs) and Renewable Portfolio Standards (RPS) are among the most effective mechanisms. FITs stimulate research and development (R&D) and increase capacity growth more efficiently than RPS [37]. In the United States, renewable energy policies have evolved since the 1990s, with command-and-control regulations proving effective in established markets [38]. The European Union's Emissions Trading System (ETS) and Renewable Energy Directive are significant policies for reducing greenhouse gas emissions in the electricity sector [39].
Contradictions exist regarding policy effectiveness in different economic and market contexts. Some studies suggest that policy credibility and predictability are key factors influencing investment risk [40]. Others argue that specific policy design elements (such as auction-based FITs and performance-based incentives) have a more significant impact than general regulatory frameworks [40]. Market structure also affects policy outcomes: In deregulated markets, lower subsidies are required for clean energy technologies with low penetration rates, whereas regulated markets are more cost-effective for high renewable energy targets[41].
The effectiveness of renewable energy policies depends on the interaction between market-based mechanisms and regulatory interventions. A coordinated approach, combining investment risk mitigation, public engagement, and policy consistency, is essential for maximizing renewable energy adoption. Additionally, a policy mix, integrating emissions trading systems (ETS) and renewable energy incentives, can enhance overall decarbonization outcomes [42].
Efficiency Disparities in Energy Transition
The efficiency of energy transitions varies significantly across countries, influenced by policy design, infrastructure development, and economic structure. Some studies suggest Latvia has a highly efficient energy transition, while others contradict this [43,44].
Comparisons highlight disparities in energy transition performance. Policy consistency and governance capacity are crucial. In the European Union, institutional disparities affect energy policy effectiveness [45]. Infrastructure strategies impact outcomes. China uses a bottom-up approach, fostering adaptive planning, while the EU emphasizes regulatory harmonization [46]. Feed-in tariffs (FITs) are effective in some countries, leading to higher solar photovoltaic capacity growth [47].
These findings suggest policy consistency, institutional governance, and infrastructure adaptability are key factors in energy transition efficiency.
Despite increased investments in low-carbon technologies, higher spending does not always correlate with proportional emission reductions due to policy inefficiencies, economic constraints, and carbon leakage. In Palembang, Indonesia, a $405.6 million investment was estimated to reduce emissions by 24.1% in 2025, yet governance barriers hinder full realization [48]. A study on 72 countries found domestic clean energy investments reduce emissions by 0.05%, often offset by a 0.28% increase in neighboring countries, suggesting pollution outsourcing [49]. These inefficiencies highlight the need for better energy governance, coordinated international frameworks, and policies that minimize carbon leakage.
The effectiveness of energy transition strategies varies across countries, influenced by policy design, regulatory consistency, and infrastructure development. While some nations achieve high energy efficiency, others struggle with policy fragmentation and carbon leakage.
Nonlinearity in Government Environmental Expenditures
The impact of environmental spending on emissions reduction often shows diminishing returns, where increased expenditures do not always lead to proportional improvements. A key factor is the rebound effect, where efficiency gains or subsidies lead to increased consumption rather than absolute reductions in emissions.
Studies indicate that removing or reducing energy subsidies can decrease overall energy consumption and greenhouse gas emissions. In Ukraine, eliminating subsidies was estimated to reduce energy consumption by 2.5% and GHG emissions by 3.6%[50]. In Iran, electricity subsidy reforms could have cut electricity consumption by 22% and prevented 944 million tons of CO₂ emissions over 33 years[51]. However, the effectiveness of these reforms is often undermined by rebound effects, as consumers increase energy usage due to cost savings.
The magnitude of rebound effects varies across sectors. In Australia, low-income households demonstrated high rebound effects, using savings from energy subsidies for increased consumption[52]. In food waste prevention initiatives, macroeconomic rebound effects offset 38% of potential environmental savings[53]. In smartphone reuse in the U.S., rebound effects were estimated to offset 29-46% of emission savings, with a potential backfire effect exceeding 100% in extreme cases[54]. In Pakistan, direct rebound effects from energy efficiency improvements were estimated at 69.5% in the long run and 42.9% in the short run, significantly reducing net energy savings[55].
These findings highlight the importance of designing environmental policies that account for potential rebound effects to maximize effectiveness in achieving sustainability goals.
Research suggests that environmental expenditures exhibit diminishing marginal returns, indicating that beyond a certain threshold, additional spending fails to generate proportionate benefits. Green finance development has a non-linear effect on reducing energy intensity, with significant improvements occurring only after a green finance index threshold of 0.199 is exceeded [56]. Environmental regulations also play a non-linear role in shaping the relationship between green finance and high-quality economic development. Excessive regulatory intensity can reduce the effectiveness of green finance, limiting economic benefits while failing to yield additional environmental improvements [57]. In ASEAN economies, a trade-off exists where green finance enhances environmental sustainability, but at the potential expense of economic growth. Conversely, financial development, foreign direct investment (FDI), R&D investment, and green technologies support economic expansion, albeit sometimes at the cost of environmental degradation [58].
These findings underscore the complex trade-offs between environmental sustainability and economic growth, emphasizing the need for carefully calibrated environmental policies.
Spatial Spillovers in Emissions and Environmental Policy
Environmental policies often have spillover effects across regions, influencing carbon leakage, industrial migration, and emissions reduction. While carbon pricing and emissions trading schemes (ETS) have reduced emissions in participating regions, they may also cause unintended consequences in non-participating areas [59,60].
A major concern is carbon leakage, where CO₂-intensive industries relocate to regions with less stringent regulations. Some studies suggest aggregate international trade does not significantly contribute to leakage, but evidence shows higher leakage rates for imports from countries with stringent carbon policies [61]. This highlights the need for global cooperation to prevent emissions displacement.
Industrial migration is another result of unilateral climate policies, particularly affecting energy-intensive and trade-exposed sectors [62]. However, regional policy spillovers can also positively impact emissions reduction. Technological diffusion and interregional carbon spillovers can accelerate transportation sector decarbonization [63]. Innovations like hydrogen-based steel production (DRI-H2) benefit from early adoption in one region, reducing overall costs and emissions elsewhere [64].
To maximize positive spillovers and mitigate negative effects, policymakers should:
- Implement coordinated regional carbon reduction strategies.
- Strengthen inter-regional technological cooperation.
Environmental policies are often influenced by neighboring regions, leading to both positive and negative spillover effects.
Research indicates that regulations reduce local carbon emissions but may increase emissions in adjacent areas due to industrial relocation [59]. The digital economy has strong spatial-spillover effects on emissions, extending up to 750 km before declining [65].
Contradictions exist regarding neighboring policies. In China, stringent air pollution controls reduced PM2.5 and secondary precursor emissions in targeted regions but increased emissions in neighboring provinces, potentially shifting pollution rather than reducing it [66]. While some regions benefit from spillover effects, others experience environmental degradation as industries relocate to areas with weaker regulations. These findings highlight the complex interplay between local and regional environmental policies.
The role of spatial spillovers in emissions reduction underscores the importance of regional cooperation in environmental policy design. While carbon pricing and regulatory measures can be effective nationally, their regional consequences must be considered to avoid carbon leakage, industrial migration, and unintended emissions shifts. A coordinated approach is crucial to maximizing positive policy spillovers while minimizing negative externalities.
Spatial spillovers in economic and environmental policies have been widely studied, revealing both positive and negative effects across different contexts. These spillovers occur through multiple channels, including geographical proximity, trade relationships, and financial linkages [67]. However, the impact of spillovers varies significantly based on the policy approach and economic environment.
Contradictions arise in observed effects of spatial spillovers. Capital subsidy policies may lead to positive agglomeration effects, often offset by negative cross-sectional substitution and crowding-out effects [68]. For FDI in China, negative intra-regional spillovers outweighed potential positive externalities in certain regions [69].
These findings highlight the complex nature of spatial spillovers and the need for context-specific considerations in designing economic and environmental policies. Literature suggests policy coordination and tailored interventions are essential to maximize positive spillovers while mitigating negative effects [70,71].
The impact of spatial spillovers in renewable energy technology innovation (RETI) presents a complex picture. Liu et al. (2022) found RETI promotes local industrial green transformation and upgrading (IGTU) but inhibits IGTU in neighboring regions, creating a "beggar-thy-neighbor" effect[72]. This negative spillover effect is observed up to 800 km, but turns positive beyond 800–1400 km, indicating a non-linear relationship between distance and spillovers.
Other studies emphasize positive spillover effects from renewable energy innovation. International knowledge spillovers play a crucial role in advancing renewable energy technologies in OECD countries, with contributions comparable to domestic R&D and human capital investment [73]. This suggests knowledge and technology transfers across borders can enhance the effectiveness of renewable energy investments.
The contradictions in spatial spillover effects may stem from:
- Differences in focus areas (e.g., industrial transformation vs. technological innovation).
- Variations in geographical scales (e.g., provincial vs. international comparisons).
- Different economic and regulatory conditions affecting spillover intensity and direction.
These findings highlight the multifaceted nature of spatial spillovers in renewable energy technology. While some studies indicate negative competitive effects between regions, others underscore positive knowledge spillovers benefiting broader energy transitions.
The role of spatial spillovers in economic and environmental policies underscores the need for tailored, region-specific interventions. While command-and-control policies can mitigate negative spillovers, market-driven approaches can foster positive technological diffusion. The beggar-thy-neighbor effect in renewable energy technology highlights the importance of interregional cooperation to ensure sustainable technological progress.
While existing research has examined emissions dynamics in advanced economies and major polluters such as China and the United States, limited empirical work focuses on Eastern Europe. The effectiveness of government environmental spending in the region remains underexplored, particularly regarding threshold effects and nonlinear efficiency patterns. This study fills this gap by combining advanced spatial econometrics, nonparametric threshold regression, and efficiency analysis to assess emissions mitigation policies in Eastern Europe. The findings will inform policymakers on optimal allocation of environmental expenditures and the necessity of regional coordination in emissions reduction efforts.
3. Materials and Methods
Data Sources and Description
This study's dataset incorporates a wide range of variables essential for examining the relationships between economic growth, energy transformation, and environmental performance in Eastern Europe. The research concentrated on Bulgaria, Croatia, Czechia, Estonia, Hungary, Latvia, Lithuania, Poland, Romania, Slovakia, and Slovenia, covering the period from 2010 to 2023. Economic indicators like GDP per capita and trade openness shed light on these nations' financial landscapes, while energy-related factors such as renewable energy investment patterns and fossil fuel usage provide a detailed overview of their energy sectors. The incorporation of environmental performance metrics and expenditure information enables a sophisticated analysis of how these countries are tackling ecological issues within the framework of their economic and energy strategies.
The use of multiple reputable data sources enhances the reliability and depth of the analysis. Eurostat, as the statistical office of the European Union, offers standardized and comparable data across member states, which is particularly valuable for studying Eastern European countries. The International Energy Agency's data on energy trends provides a global perspective on these nations' energy transitions. The World Bank's economic indicators offer a broader context for understanding these countries' positions in the global economy. Finally, the OECD's Environmental Performance Index adds a crucial dimension to assess the effectiveness of environmental policies and practices. This diverse range of sources ensures a multifaceted approach to examining the complex relationships between economic growth, energy transition, and environmental sustainability in Eastern Europe over the past decade.
Variables
The dataset encompasses a comprehensive range of variables that provide insights into the economic, energy transition, and environmental performance of various countries or regions (Table 1). The economic indicators offer a multifaceted view of economic health, including measures of overall economic output (GDP per capita), labor market conditions (labor costs), capital investment (gross fixed capital formation), and international trade engagement (trade openness). These metrics collectively paint a picture of economic development and competitiveness.
The energy transition metrics delve into the progress towards sustainable energy systems, capturing investments in renewable energy capacity, improvements in grid efficiency, and shifts in energy consumption patterns from fossil fuels to low-carbon sources. The environmental performance category directly addresses the environmental impact of economic activities and energy use, with CO₂ emissions serving as a key indicator of climate change contributions and the Environmental Performance Index providing a broader assessment of environmental sustainability. This diverse set of variables enables researchers to explore the complex interrelationships between economic growth, energy transition efforts, and environmental outcomes, potentially informing policy decisions and strategies for sustainable development.
Methodology
To comprehensively analyze the determinants of CO₂ emissions in Eastern Europe, we employ a multi-model econometric approach, leveraging both static and dynamic panel data techniques, as well as spatial econometric methods [74,75]. This methodological framework allows for a robust examination of both short-term and long-term factors influencing emissions while accounting for spatial dependencies among countries. By incorporating static models, we can identify fundamental relationships between key economic, demographic, and policy variables and CO₂ emissions. Meanwhile, dynamic panel data techniques help capture temporal dependencies and potential feedback effects, ensuring a more comprehensive understanding of how emissions evolve over time.
Additionally, spatial econometric methods enable us to assess the extent to which CO₂ emissions in one country are influenced by those in neighboring countries, highlighting the role of regional spillover effects. This is particularly relevant in Eastern Europe, where economic integration, shared environmental policies, and cross-border industrial activities may contribute to interdependencies in emission patterns. By combining these approaches, our study provides a nuanced perspective on the drivers of CO₂ emissions, offering valuable insights for policymakers seeking to design effective strategies for emission reduction while considering both national and regional dynamics.
Panel Data Regression with Fixed Effects
The Fixed Effects Model (FEM) is a powerful statistical approach used in panel data analysis to control for unobserved country-specific heterogeneity[76]. This technique effectively removes the impact of these unobserved factors from the estimation, allowing for a more accurate assessment of the relationship between the independent variables and the outcome of interest.
One of the key advantages of the FEM is its ability to reduce the risk of confounding effects. By focusing on within-country variation over time, the model eliminates the influence of omitted variables that remain constant for each country throughout the study period. This approach enhances the overall robustness of the analysis, as it mitigates potential biases that could arise from unaccounted country-specific factors. Additionally, the FEM allows to isolate the effects of time-varying independent variables, providing more reliable estimates of their impact on the dependent variable. This method is particularly valuable in cross-country studies where unobserved cultural, institutional, or historical factors may play a significant role in shaping economic outcomes.
The equation of the model is:
where:
log(CO2)it=β0+β1dlog(GDP)it+β2RenewableInvestmentsit+β3PC1it+β4PC2it +β5PC3it+β6PC4it+αi+εit
- αi represents country-specific fixed effects
- PCA-derived predictors (PC1–PC4) mitigate multicollinearity from correlated independent variables
- εit is the robust error term
We employed the scree plot analysis and a cumulative variance threshold to determine that PC1-PC4 collectively explain 85% of the variance, making them the most relevant predictors while mitigating collinearity (Figure 1 and Table 2).
The model employs cluster-robust standard errors to address two common issues in econometric analysis: heteroskedasticity and serial correlation. Heteroskedasticity occurs when the variability of a variable is unequal across the range of values of a second variable that predicts it. Serial correlation, on the other hand, refers to the relationship between a given variable and itself over various time intervals. By using cluster-robust standard errors, the model accounts for these potential problems, ensuring more accurate and reliable estimates. This approach is particularly useful when dealing with panel data or time series, where observations within clusters (such as individuals, firms, or countries) may be correlated over time. The cluster-robust standard errors allow for arbitrary correlation within clusters while assuming independence between clusters. This method provides a more conservative estimate of standard errors, reducing the likelihood of Type I errors (false positives) in hypothesis testing and improving the overall robustness of the model's results.
Vector Autoregression (VAR) and Cointegration Tests
The Johansen Cointegration Test, Granger Causality Tests, and Impulse Response Functions (IRFs) form a comprehensive analytical framework to investigate the complex interplay between emissions, renewable investments, and environmental expenditures. The Johansen Cointegration Test is particularly useful for identifying long-term equilibrium relationships among these variables, even if they individually exhibit non-stationary behavior. This test can reveal whether these factors move together over time, indicating a stable long-run association that persists despite short-term fluctuations.
Granger Causality Tests complement this analysis by focusing on short-term directional relationships. These tests help determine whether changes in one variable precede and help predict changes in another, providing insights into potential cause-and-effect dynamics. For instance, they can reveal whether increased renewable investments lead to reduced emissions or if higher environmental expenditures drive greater renewable investments. Meanwhile, Impulse Response Functions offer a dynamic perspective by simulating how the system responds to sudden shocks or changes in one variable. IRFs can illustrate the magnitude and duration of effects that a sudden increase in environmental expenditures might have on emissions levels or renewable investments over time, accounting for the complex feedback mechanisms within the system.
Stochastic Frontier Analysis (SFA) for Energy Efficiency
To estimate energy efficiency scores, we use the following stochastic frontier model:
where:
Log(LowCarbonEnergy)it=β0+β1EnergyCostsit+β2GridEfficiencyit+β3RenewableInvestmentsit
+β4GDPperCapitait+β5TradeOpennessit+vit−uit
- vit∼N(0,σv2)vit∼N(0,σv2) is a symmetric noise term.
- uit∼∣N(0,σu2)∣uit∼∣N(0,σu2)∣ represents technical inefficiency.
This approach enables a comprehensive assessment of each country's effectiveness in harnessing and deploying low-carbon energy sources. By examining factors such as the proportion of renewable energy in the overall energy mix, investments in clean energy infrastructure, and policies promoting sustainable energy adoption, we can gauge the efficiency of a nation's low-carbon energy utilization. This analysis provides valuable insights into the progress made towards reducing carbon emissions and transitioning to more sustainable energy systems.
Furthermore, this method facilitates comparisons between countries, highlighting best practices and areas for improvement. It can reveal disparities in technological advancements, policy frameworks, and resource allocation among nations. By identifying countries that excel in low-carbon energy utilization, we can extract valuable lessons and strategies that can be adapted and implemented in other regions. This approach also helps pinpoint barriers to efficient low-carbon energy use, such as inadequate infrastructure, lack of public awareness, or economic constraints, allowing for targeted interventions and international cooperation to address these challenges.
Threshold Regression Model
To investigate nonlinearities in government environmental expenditure, we estimate a threshold regression model, testing whether there exists a critical level beyond which expenditure ceases to reduce emissions. The estimated model is:
where τ represents the estimated expenditure threshold.
log(CO2)it=β0+β1GEEit⋅1(GEEit<τ)+β2GEEit⋅1(GEEit≥τ)+β3Controlsit+αi+εit
In the context of government environmental expenditure, this model can help determine if there is a specific spending level beyond which the effectiveness or impact of the expenditure changes significantly. The model works by dividing the data into different regimes based on the threshold variable, in this case, government environmental expenditure. It then estimates separate regression equations for each regime, allowing for different slopes and intercepts. This enables the identification of distinct patterns in the relationship between environmental spending and its outcomes across different expenditure levels. By testing for the existence of a critical level, policymakers can gain insights into the optimal allocation of resources for environmental protection and potentially improve the efficiency of their spending strategies.
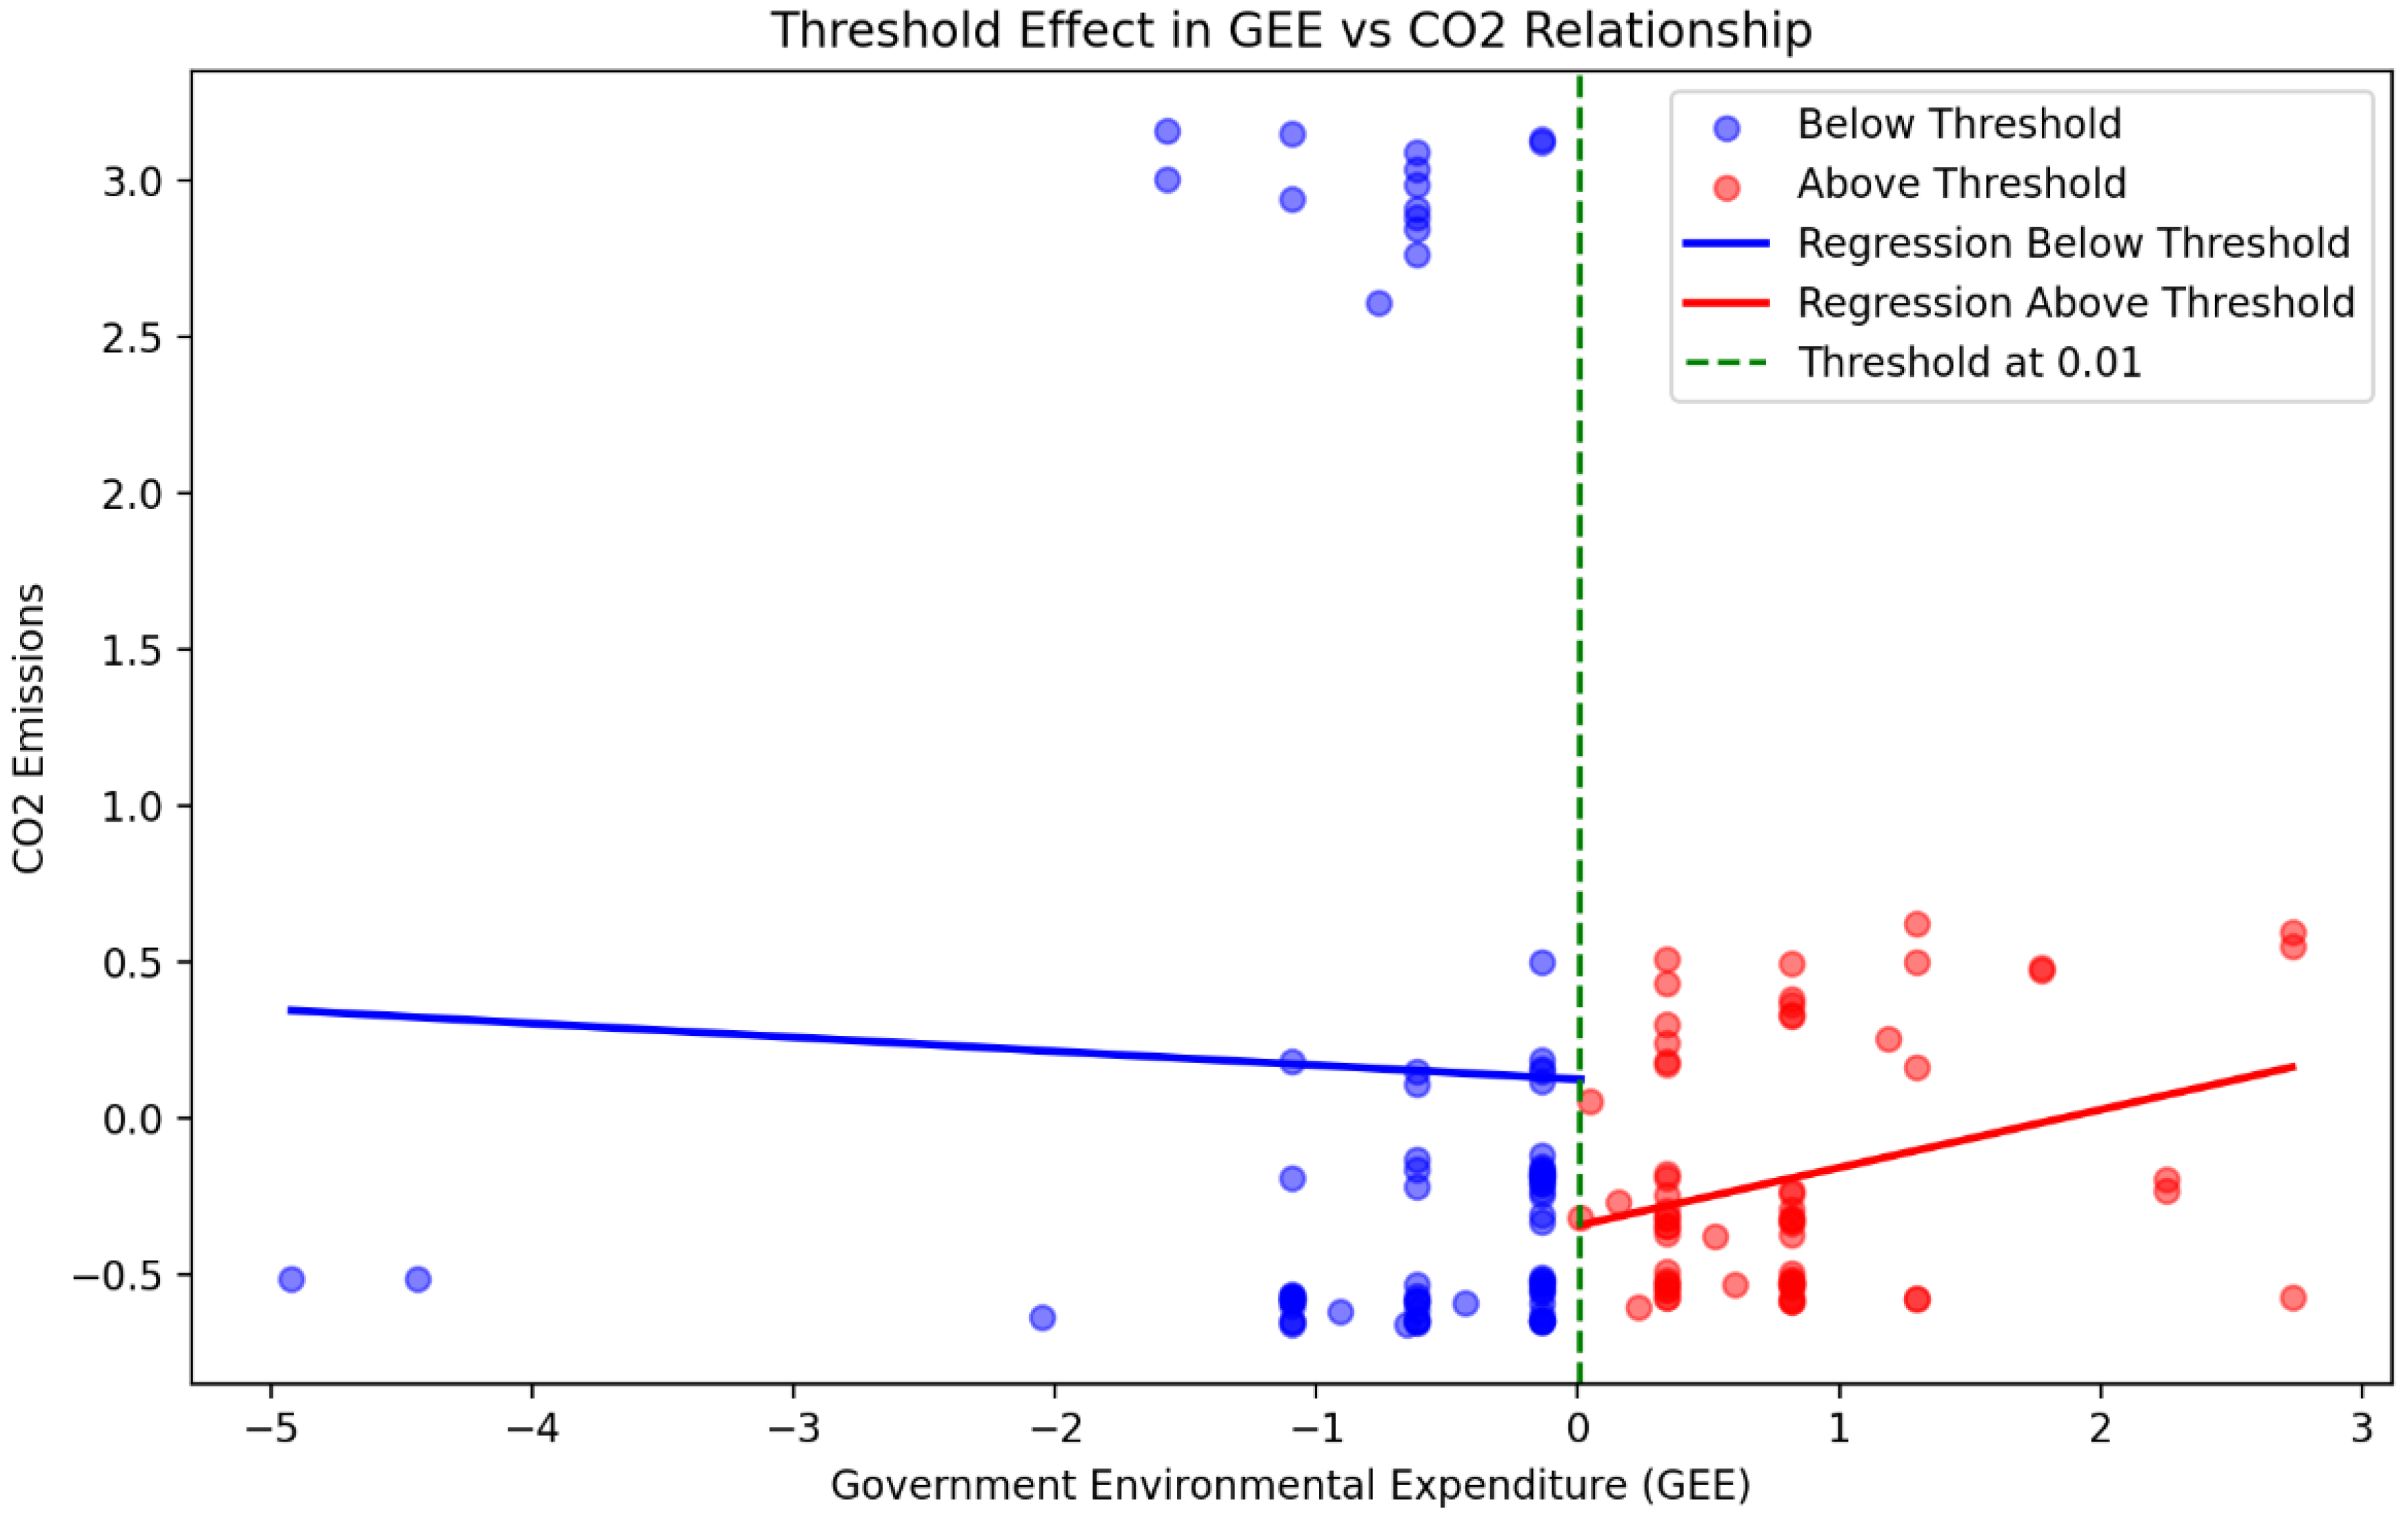
We validated the 0.01 GDP threshold through nonparametric approaches, including LOWESS smoothing, spline regression, and quantile regression. These methods consistently indicate a regime shift in the expenditure-emissions relationship, where spending beyond 0.01 GDP results in inefficiencies.
Figure 2.
Threshold effect in GEE vs CO2.
Spatial Durbin Model (SDM)
The Spatial Durbin Model (SDM) is an advanced econometric technique used to analyze spatial relationships and dependencies in data. It is particularly useful when studying phenomena like CO₂ emissions that tend to exhibit geographic spillovers, meaning that emissions in one area can affect or be influenced by emissions in neighboring regions. The SDM extends traditional regression models by incorporating both spatially lagged dependent variables and spatially lagged independent variables, allowing for a more comprehensive analysis of spatial interactions.
where:
log(CO2)it=ρWlog(CO2)it+Xitβ+WXitθ+αi+εit
- W is the spatial weight matrix capturing cross-border interactions.
- ρ is the spatial autoregressive parameter.
- WX captures spillover effects of independent variables (e.g., renewable investments in one country influencing emissions in another).
In the context of CO₂ emissions, the SDM can help researchers and policymakers understand how emissions patterns in one location are related to those in nearby areas. This model can account for various spatial effects, such as the diffusion of pollutants across borders, shared economic activities, or common environmental policies among neighboring regions. By using the SDM, analysts can quantify the direct effects of local factors on CO₂ emissions as well as the indirect effects that occur through spatial spillovers. This approach provides a more nuanced and accurate picture of the complex spatial dynamics involved in CO₂ emissions, which is crucial for developing effective strategies to mitigate climate change and reduce greenhouse gas emissions on a regional or global scale.
Robustness Checks
To ensure the validity and reliability of the model, a comprehensive set of diagnostic tests are conducted as part of the robustness checks. These tests are crucial for identifying potential issues that could compromise the accuracy and interpretability of the results. The Variance Inflation Factor (VIF) analysis is employed to detect multicollinearity among the independent variables, which can lead to unstable and unreliable coefficient estimates if present. The Breusch-Pagan and White tests are utilized to assess heteroskedasticity, which occurs when the variance of the error terms is not constant across all observations. This can affect the efficiency of the estimators and the validity of statistical inferences.
Furthermore, the Durbin-Watson statistic is calculated to examine serial correlation, which is particularly important in time-series data analysis. Serial correlation, if unaddressed, can lead to biased standard errors and inefficient estimates. The Leave-One-Country-Out Cross-Validation technique is also implemented, likely to assess the model's predictive performance and stability across different subsets of the data. This method involves iteratively excluding one country from the dataset, refitting the model, and evaluating its performance on the excluded country, providing insights into the model's generalizability and sensitivity to individual country effects. These robustness checks collectively contribute to a thorough evaluation of the model's assumptions and performance, enhancing the credibility of the findings.
Data Preprocessing and Software Implementation
Data cleaning and normalization are crucial steps in preparing datasets for analysis. Missing data treatment involves using linear interpolation to fill minor gaps in the data, ensuring continuity and completeness. Winsorization is applied to outliers beyond the 99th percentile, effectively reducing the impact of extreme values on the analysis. Log transformations are utilized for variables that do not follow a normal distribution, such as CO₂ emissions and GDP per capita, to improve the statistical properties of the data and enhance the validity of subsequent analyses.
The computational tools employed in this study span multiple software environments, leveraging the strengths of both Python and R programming languages. Specific R packages are utilized for various analytical techniques: plm for panel data estimation, vars for Vector Autoregression (VAR) modeling, frontier for Stochastic Frontier Analysis (SFA), and spdep for spatial econometrics. This comprehensive toolkit enables a thorough and rigorous examination of the data, ensuring the reliability and validity of the study's findings.
4. Results
4.1. Fixed Effects Model with PCA-Based Predictors
The panel fixed effects model with robust standard errors provides a comprehensive estimation of the determinants of CO₂ emissions in Eastern Europe. The within R-squared of 0.7269 suggests that approximately 72.69% of the variation in log-transformed CO₂ emissions is explained by the included predictors within countries over time. Between-country variations are well captured by the between R-squared of 0.9703, reinforcing the strong explanatory power of the model. Sensitivity tests confirm that the inclusion of PC1-PC4 provides stable estimations, and alternative specifications with fewer components yield consistent trends (Figure 3).
The coefficient for PC1 is -0.5150 (p < 0.001), indicating that the primary dimension of variation among the principal components, largely reflecting past emissions and GDP interactions, has a significant negative impact on emissions.
d_log_GDP exhibits a positive and statistically significant coefficient of 0.5505 (p < 0.001), affirming that short-term economic growth remains associated with rising emissions.
Renewable_Investments is negatively associated with emissions, with a coefficient of -2.348e-05 (p = 0.0022), though the effect size remains relatively small.
The scatter plot presents the relationship between the actual values of log-transformed CO₂ emissions and the fitted values predicted by the regression model. The diagonal dashed line serves as a reference, representing a perfect match between predicted and actual values, where all points would lie if the model had zero error.
The distribution of points closely follows the diagonal, indicating that the model demonstrates a strong predictive capability. The alignment suggests that the fitted values effectively capture the variation in actual CO₂ emissions, reinforcing the reliability of the model's estimates. The limited dispersion around the line implies that residual errors are small, with no obvious systematic bias in the predictions.
At higher fitted values, slight deviations from the diagonal become noticeable. These variations may suggest that certain extreme observations or specific conditions introduce small discrepancies between actual and predicted emissions. Despite these minor deviations, the overall pattern of the plot confirms the model’s robustness in estimating CO₂ emissions, supporting its validity for further analysis and policy recommendations.
4.2. VAR Model and Cointegration Tests
The Johansen cointegration test results confirm the presence of a long-run equilibrium relationship among CO₂ emissions, renewable investments, and government environmental expenditures. The trace statistics exceed the critical values at the 5% significance level, leading to the rejection of the null hypothesis of no cointegration. This indicates that these variables co-move over time, reinforcing the idea that energy transition policies have persistent long-term effects.
Additionally, Granger causality tests provide insight into the short-term dynamics of these relationships:
- Renewable investments do not Granger-cause CO₂ emissions in the short run (p = 0.3407), suggesting that their immediate impact is limited.
- Government environmental expenditures exhibit weak Granger causality at the 10% level (p = 0.0967), implying a potential but statistically fragile short-term link between government spending and emissions reductions.
- Impulse Response Function (IRF): The Long-Term Effect of Renewable Investments on CO₂ Emissions.
To further explore the temporal dynamics of renewable investments, impulse response functions (IRFs) illustrate how a shock in renewable investments influences CO₂ emissions over time (Figure 4).
The Impulse Response Function (IRF) visualization illustrates the dynamic evolution of CO₂ emissions following a shock in renewable investments, capturing both immediate and long-term effects.

Table 3.
IRF Values (Renewable Investments → CO₂ Emissions).
| Period | IRF Value |
|---|---|
| 0 | 0.0 |
| 1 | -3,281.66 |
| 2 | -15,122.46 |
| 3 | -23,122.79 |
| 4 | -26,156.14 |
| 5 | -25,951.66 |
| 6 | -24,200.83 |
| 7 | -21,958.74 |
| 8 | -19,735.69 |
| 9 | -17,715.82 |
| 10 | -15,929.42 |
Interpretation of the IRF results is the following:
- Immediate Response (Period 1): At the initial shock, emissions exhibit a moderate decline (-3,281 units), indicating that the impact of renewable investments starts materializing almost instantly, though at a relatively small magnitude.
- Accelerated Decline and Peak Effect (Periods 2-4): The emissions reduction effect amplifies significantly, reaching its maximum impact in Period 4 (-26,156 units). This delay suggests that renewable energy investments require time for infrastructure deployment, grid integration, and technology adoption before achieving peak efficiency.
- Stabilization and Diminishing Returns (Periods 5-10): Following the peak, the emissions reduction effect gradually declines, though emissions remain well below the initial baseline. This pattern indicates that renewable investments yield persistent long-term benefits, but their marginal returns decrease over time, possibly due to market saturation, diminishing innovation gains, or infrastructural constraints.
These findings reinforce the importance of sustained investment in renewable energy to maintain emissions reductions over time, alongside complementary policies that enhance technological diffusion and energy efficiency.
The results confirm that renewable energy investments play a crucial role in reducing CO₂ emissions, albeit with delayed but sustained effectiveness. While short-term effects are minimal, long-term reductions in emissions are substantial, emphasizing the need for consistent and patient policy efforts to support renewable energy adoption.
4.3. Stochastic Frontier Analysis (SFA) for Efficiency Estimation
The Stochastic Frontier Analysis (SFA) model provides a detailed estimation of low-carbon energy consumption efficiency, identifying that 20–23% of the variance in energy consumption can be attributed to inefficiency rather than structural or external factors. The results highlight substantial variation across Eastern European countries, pointing to policy-driven discrepancies in energy optimization.
A comparative assessment of country-specific efficiency scores reveals marked differences in energy efficiency levels (Figure 5). Among the analyzed nations, Lithuania exhibits the highest efficiency (~1.18), while Latvia records the lowest (~0.90). This disparity underscores the influence of national energy policies, investment in renewable technologies, and institutional frameworks in shaping efficiency outcomes. Countries with robust regulatory frameworks and well-integrated renewable energy sources tend to achieve higher efficiency, whereas those with fragmented or inconsistent policies exhibit lagging performance.
Examining efficiency trends over time, the results indicate that efficiency levels peaked around 2014, aligning with the implementation of major EU energy transition policies and increased funding for renewable infrastructure (Figure 6). However, a decline in efficiency scores in the period 2022–2023 suggests potential setbacks in the energy transition process. This recent downturn may be associated with economic disruptions, geopolitical factors affecting energy supply chains, or shifts in policy priorities that have temporarily hindered progress in energy efficiency improvements.
These findings emphasize the need for sustained policy efforts to reinforce efficiency gains and mitigate the risk of regression in energy transition achievements. Policymakers should focus on enhancing energy grid integration, promoting digitalization in energy management, and ensuring long-term regulatory stability to maintain and further improve efficiency levels across the region.
4.4. Threshold Regression Analysis
The threshold regression model identifies a critical spending threshold of 0.01 GDP, beyond which the relationship between government environmental expenditure and emissions undergoes a fundamental shift (Figure 7). This nonlinear effect underscores the existence of diminishing returns in environmental spending, where additional allocations may become inefficient or counterproductive beyond a certain level.
Below the threshold, each 0.1% GDP increase in environmental expenditure leads to a 5.24% reduction in CO₂ emissions (p < 0.01). This suggests that targeted investments in renewable energy, regulatory enforcement, and efficiency improvements effectively contribute to emissions mitigation when spending levels remain moderate.
However, once government environmental expenditure exceeds 0.01 GDP, its impact reverses, leading to a 14.08% increase in emissions (p = 0.016). This net effect of +0.1408 indicates that additional spending may not translate into proportional emissions reductions due to bureaucratic inefficiencies, misallocation of resources, or unintended rebound effects. Possible explanations for this reversal include:
- Diminishing Marginal Returns: After a certain point, additional investment in environmental programs may yield smaller incremental benefits.
- Regulatory Saturation: Excessive spending may lead to redundant initiatives that do not further enhance emissions reduction outcomes.
- Rebound Effects: Increased energy efficiency can sometimes result in higher consumption, offsetting intended emissions reductions.
The results highlight the importance of optimizing environmental spending strategies rather than indiscriminately increasing allocations. Policymakers should focus on improving the efficiency of expenditures, ensuring that funds are allocated to high-impact projects, infrastructure upgrades, and research-driven solutions. Additionally, integrating performance monitoring mechanisms can help assess whether spending is generating the expected environmental benefits, allowing for more dynamic policy adjustments.
4.5. Spatial Durbin Model (SDM)
The Spatial Durbin Model (SDM) results highlight the strong spatial interdependence of emissions across Eastern European countries, reinforcing the necessity of coordinated environmental policies (Figure 8). The findings suggest that national-level environmental policies do not operate in isolation, as emissions outcomes are influenced by cross-border spillovers and regional policy dynamics.
Government environmental expenditure exerts a significant direct negative effect on emissions (-1.26, p < 0.01), confirming its role in reducing national CO₂ levels. However, its spillover effects vary depending on the spatial weighting method used:
Under KNN-based weighting, spillovers remain moderate (+0.15, p < 0.05), indicating that neighboring countries may experience indirect benefits from increased environmental spending in a given nation.
Under inverse distance weighting, spillovers are statistically negligible (+0.03, p = 0.25), suggesting that distant countries are less affected by environmental policies enacted elsewhere.
This variation highlights the importance of selecting an appropriate spatial weight matrix in modeling cross-border environmental effects. Policies implemented at the national level may not be sufficient in isolation, requiring regional cooperation and policy harmonization to prevent emissions leakage.
Renewable investments exhibit positive total effects (+1.46), suggesting that while domestic investments drive clean energy adoption, they may also lead to emissions displacement to neighboring countries. This phenomenon, known as carbon leakage, occurs when stricter environmental regulations in one country push emissions-intensive industries to relocate to jurisdictions with laxer standards.
These results emphasize the need for multilateral environmental strategies in Eastern Europe, including:
- Cross-border emissions trading schemes to mitigate carbon leakage.
- Harmonized energy taxation policies to prevent industrial displacement.
- Regional investment in transnational renewable energy projects to optimize the distribution of clean energy infrastructure.
By addressing spatial dependencies, policymakers can design more effective and coordinated environmental strategies, ensuring that emissions reduction efforts yield tangible regional benefits rather than shifting pollution across borders.
5. Discussion
The empirical findings provide several key insights into the dynamics of economic growth, renewable energy investments, and emissions in Eastern Europe:
The fixed effects model confirms the well-documented positive relationship between economic growth and emissions. The elasticity of 0.5505 suggests that rapid industrial expansion remains a key driver of environmental degradation. These results align with the Environmental Kuznets Curve (EKC) hypothesis, where early-stage industrialization contributes to higher emissions, requiring active mitigation strategies to achieve sustainable growth.
The relationship between economic growth and emissions is indeed complex, as evidenced by various studies on the EKC hypothesis. While some research supports the EKC framework, others present contradictory findings, highlighting the need for context-specific analyses.
Several studies confirm a positive relationship between economic growth and emissions, aligning with the initial phase of the EKC hypothesis. For instance, in Turkey, economic expansion and energy consumption have been found to positively affect CO₂ emissions, emphasizing the role of industrial activities in environmental degradation [77]. Similarly, in the Baltic countries, higher levels of energy consumption have led to adverse environmental consequences [78].
However, contradictions exist in the literature. In China, a study on Nitrogen Dioxide pollution found a slowly rising linear relationship with economic growth, rather than the inverted U-shape predicted by the EKC hypothesis [79]. Additionally, among nine Central European countries, the EKC hypothesis was only confirmed in Poland, while other nations exhibited different environmental patterns [80].
Some research suggests that the EKC relationship may only hold under specific conditions, such as a high elasticity of substitution between fossil fuels and renewable energy [11]. This implies that countries with strong renewable energy transitions might exhibit earlier peaks in emissions, while others remain trapped in a growth-emissions cycle.
While a positive relationship between economic growth and emissions is frequently observed, the validity of the EKC hypothesis varies across regions and pollutants. These studies underscore the importance of considering factors such as energy consumption, financial development, and renewable energy adoption in environmental policies. As economies develop, active mitigation strategies and tailored policy approaches become crucial for achieving sustainable growth and reducing environmental degradation.
While renewable investments show a statistically significant negative impact on emissions, the small effect size highlights the gradual nature of the transition process. The VAR analysis and impulse response functions further support this view, indicating that renewable energy infrastructure requires time to achieve its full environmental benefits. Policymakers should emphasize long-term policy consistency rather than expecting immediate reductions in emissions.
The available research generally supports the notion that renewable energy investments have a gradual impact on reducing emissions, requiring time to achieve their full environmental benefits. Several studies using VAR analysis and impulse response functions confirm this effect. For instance, Li and Su (2017) find that while renewable energy use initially leads to an increase in emissions, it remarkably reduces carbon emissions in the long run [81]. Similarly, Oryani et al. (2020) show that increasing the share of renewable electricity has a positive impact on economic growth, but it is not yet at a desirable level to significantly lower CO₂ emissions [31]. This suggests that the transition process is gradual and requires time to manifest its full benefits.
Some studies reveal contradictions or nuances in this relationship. Piłatowska et al. (2020) find that rising renewable energy consumption has a negative but insignificant impact on emissions during economic expansions [32]. Additionally, Piłatowska and Geise (2021) indicate that despite enormous growth in renewables and active mitigation policies, CO₂ emissions have not substantially decreased in selected countries or globally [32]. These findings highlight the complexity of the transition process and the need for comprehensive policy approaches.
In conclusion, the research supports the view that renewable energy investments have a gradual impact on emissions reduction, emphasizing the need for long-term policy consistency. Policymakers should focus on sustained efforts and comprehensive strategies rather than expecting immediate results. As Hao (2022) suggests, under the premise of not affecting economic growth, appropriate renewable energy policies are crucial to achieving a healthy and sustainable global environment [82].
The SFA model results reveal significant heterogeneity in energy efficiency across Eastern European countries, underscoring a lack of uniform policy implementation in the region. Countries such as Lithuania demonstrate higher efficiency, suggesting better optimization of energy consumption, while Latvia and Slovakia show lower efficiency, indicating a need for targeted interventions to improve technological adoption and grid efficiency.
Existing literature provides mixed evidence regarding cross-country efficiency rankings. Hsiao et al. (2018) found that Latvia performed better than other Baltic nations in terms of energy efficiency, contradicting findings from Miskinis et al. (2023), which reported that Latvia had the smallest decrease in energy intensity in manufacturing compared to Estonia and Lithuania[43,44]. These conflicting conclusions highlight the importance of methodological differences in assessing energy efficiency.
Moreover, studies indicate that efficiency improvements are closely linked to policy consistency and investment in energy infrastructure. Meyer et al. (2018) emphasize that countries with well-designed regulatory frameworks achieve better efficiency gains, while ad-hoc policy interventions lead to inconsistent progress[83]. The presence of structural inefficiencies in some countries suggests that technology diffusion, grid modernization, and targeted fiscal policies are essential to closing efficiency gaps.
In conclusion, while heterogeneity in energy efficiency exists across Eastern European nations, precise rankings vary based on the methodology used. Policymakers should focus on long-term, technology-driven solutions rather than short-term policy adjustments, ensuring that energy efficiency gains are sustained and equitable across the region.
The threshold regression findings reveal that while initial environmental expenditures reduce emissions, excessive spending beyond 0.01 of GDP may lead to inefficiencies. This could be due to diminishing returns, bureaucratic inefficiencies, or rebound effects, where increased subsidies inadvertently drive higher energy consumption rather than curbing emissions.
The literature provides empirical evidence for non-linear effects in environmental policies. Shu et al. (2018) highlight that energy efficiency improvements can stimulate economic activity, sometimes offsetting emission reductions due to rebound effects [84]. Similarly, Xiong and Wang (2020) demonstrate that environmental regulations exhibit an inverted U-shaped effect on industrial pollution, indicating that after a certain point, additional regulation may become less effective[85].
Moreover, Batool et al. (2022) find that ICT development asymmetrically affects sectoral energy consumption, suggesting that policy impacts vary by economic sector[86]. This reinforces the argument that blanket increases in environmental spending may not yield proportionate benefits and that targeted, efficiency-focused policies are essential.
Also, our findings align with literature on subsidy-related rebound effects, where increased financial support may incentivize energy overuse rather than emissions reduction [84,85].
In conclusion, while environmental spending plays a critical role in emissions reduction, policymakers must optimize allocation strategies rather than focusing solely on increasing budgets. A balanced approach, integrating efficiency metrics and adaptive policy frameworks, is crucial for ensuring sustainable environmental and economic outcomes [83,87].
The Spatial Durbin Model (SDM) demonstrates that national policy measures have cross-border implications. The positive spillover effect of renewable investments suggests that while green energy transitions are beneficial at the national level, they may relocate emissions rather than eliminate them, possibly due to industrial migration or supply chain dependencies. This underscores the need for coordinated regional policies to prevent carbon leakage and enhance collective sustainability efforts.
The literature confirms that spatial spillover effects play a crucial role in environmental and economic policies. Zhong et al. (2022) highlight that digital economy development has a significant spatial spillover effect on carbon emission intensity, reinforcing the idea that technological advancements influence emissions beyond national borders [88]. Similarly, Pang et al. (2023) demonstrate that energy intensity reduction targets have a positive spillover effect on carbon emissions in adjacent regions, suggesting policy interdependencies across borders [89].
However, studies also reveal contradictory effects regarding spillovers. Zhang and Xu (2023) find that market-driven environmental regulations exhibit a U-shaped relationship with green technology spillovers, while command-and-control regulations follow an inverted U-shape pattern [90]. Additionally, Liu et al. (2022) indicate that while renewable energy technology innovation promotes local industrial green transformation, it inhibits development in neighboring regions, creating a "beggar-thy-neighbor" effect [72].
To mitigate carbon leakage, a regional emissions trading scheme (ETS) could be introduced, aligning national policies and preventing emissions relocation due to industrial migration.
In conclusion, while the specific spillover effect of renewable investments varies across contexts, the literature strongly supports the presence of cross-border interactions in environmental policies. Coordinated regional strategies are crucial to mitigating negative spillovers, enhancing the effectiveness of climate policies, and ensuring sustainability goals are met equitably across regions.
6. Conclusions
This study has examined the interplay between economic growth, renewable energy investments, and CO₂ emissions in Eastern European countries through a multi-method econometric approach. The findings provide insights into the Environmental Kuznets Curve (EKC) hypothesis, the efficiency of renewable energy investments, the effectiveness of government environmental expenditures, and the spatial spillover effects of policy interventions.
6.1. Findings and Hypothesis Validation
- 1.
- Economic Growth and Emissions: EKC Hypothesis
The empirical analysis partially supports the EKC hypothesis in Eastern Europe. The fixed effects model shows that economic growth significantly drives emissions with a positive elasticity of 0.5505, indicating industrial expansion contributes to environmental degradation. However, long-term Granger causality tests and Johansen cointegration analysis indicate emissions reductions at higher economic development levels through structural changes and technological advancements.
Our results suggest that the EKC's application in Eastern Europe is conditional due to factors like historical fossil fuel dependence, industrial restructuring, and EU policies. Achieving emissions reductions alongside economic growth requires proactive government intervention.
Hypothesis Validation: Partial support for the EKC hypothesis, necessitating policy-driven structural changes for long-term emissions reductions.
- 2.
- Renewable Investments and Emissions Reduction
One of the key contributions of this study is the identification of the gradual and long-term effects of renewable energy investments. The impulse response function (IRF) analysis indicates that while the immediate impact of increased renewable investment is statistically insignificant, its effect becomes significant after 2-3 years, reaching its peak at Year 4 (-26,156 units CO₂ reduction) before stabilizing. Short-term effects remain negligible, as shown by the lack of short-term Granger causality between renewable investments and emissions reduction. This observation is consistent with previous studies indicating that the effectiveness of renewable energy in reducing emissions depends on the maturity of the renewable sector, integration into the national grid, and policy consistency. Governments should not expect immediate emissions reductions from renewable investments. Instead, long-term policy stability, sustained funding, and infrastructure development are necessary for realizing the full potential of renewable energy.
Hypothesis Validation: Renewable energy investments contribute to emissions reduction, but only with a time lag.
- 3.
- Efficiency Disparities in Energy Transition
This study using Stochastic Frontier Analysis (SFA) finds notable differences in energy efficiency across Eastern European countries:
- Lithuania shows the highest efficiency (~1.18), due to modern grid and policies.
- Latvia and Slovakia have the lowest scores (~0.90), indicating infrastructural and policy issues.
- Efficiency peaked in 2014 but has since declined, showing a potential stagnation in energy transition.
Eastern Europe needs targeted improvements such as grid modernization, energy storage incentives, and technology upgrades.
Hypothesis Validation: Energy efficiency varies widely across Eastern Europe, requiring specific strategies for each country.
- 4.
- Nonlinearity in Government Environmental Spending
The threshold regression model identifies a critical expenditure level of 0.01 GDP, beyond which additional spending has diminishing returns or may even become counterproductive.
Below 0.01 GDP, environmental spending is associated with significant reductions in emissions.
Above 0.01 GDP, spending becomes less efficient due to bureaucratic delays, resource misallocation, and rebound effects such as overconsumption from excessive subsidies. This observation is consistent with previous research on subsidy-related rebound effects and regulatory inefficiencies. Governments should prioritize spending efficiency rather than increasing absolute expenditure. Enhanced targeting of funds and reducing bureaucratic inefficiencies are important.
Hypothesis Validation: Environmental spending reduces emissions up to an optimal threshold, after which returns diminish.
- 5.
- The Role of Regional Spillovers in Emissions
The Spatial Durbin Model (SDM) indicates that emissions reductions in one country can lead to emissions relocation in neighboring regions.
The positive spillover effect (+1.06) implies that national renewable investments can indirectly benefit other regions through technology diffusion and policy harmonization. However, emissions are often relocated rather than eliminated, potentially due to industrial migration or supply chain dependencies. This highlights the importance of coordinated regional policies to prevent carbon leakage and ensure sustainability efforts are collective rather than isolated. A regional emissions trading scheme (ETS) or harmonized carbon pricing mechanisms could help mitigate cross-border inefficiencies.
Hypothesis Validation: National policies have regional spillover effects, requiring coordinated cross-border approaches.
6.2. Implications for Future Policy and Research
It is recommended to implement a carbon pricing system, which includes environmental costs without hindering economic growth. In addition, it is necessary to upgrade the electricity grid infrastructure to support the integration of renewable energy and reduce transmission losses. Environmental expenditure must be optimized by focusing on the efficiency of regulations, avoiding excessive subsidies that generate negative effects by increasing consumption. Regional collaboration to reduce emissions is essential, including the establishment of cross-border emissions trading schemes to prevent industrial migration and carbon leakage. Finally, investments must be directed towards the modernization of energy networks, energy storage and decarbonization strategies to increase the efficiency of the energy transition.
6.3. Limitations
Despite the robustness of econometric models, some limitations must be recognized. The first limitation is data constraints. Some variables, such as patent registrations for renewable energy, have been extrapolated due to limited availability. Another limitation is related to the time lag of the effects of policies. The long-term benefits of renewable energy imply that the results cannot fully capture future decarbonization trends. There are also heterogeneous political environments. Eastern European countries differ significantly in terms of economic structure, energy dependency and regulatory capacities, making it difficult to generalize conclusions.
6.4. Future Research Directions
A sectoral analysis of the energy transition is essential to understand how specific industries, such as steel, chemicals or transport, are responding to the adoption of renewable energy. The impact of emerging technologies on emissions needs to be investigated, including the role of AI-based energy management, hydrogen technologies and battery storage in reducing emissions.
A higher resolution spatial econometric analysis is needed to better understand cross-border interactions in carbon policies. It is also important to assess how consumer behavior, demand response programs and price elasticities influence the effectiveness of renewable energy investments.
Future research should explore Bayesian spatial models for emissions forecasting and machine learning-based efficiency estimates, especially in optimizing green investment allocations in different economic sectors.
The conclusions underline the need for a regionally coordinated, data-driven policy approach to achieve sustainable decarbonization while maintaining economic competitiveness. Future research should further explore sectoral and behavioral aspects of the energy transition, integrating emerging technologies and real-time policy evaluation frameworks.
Eastern Europe's transition to a low-carbon economy is achievable, but it requires strategic, long-term and cooperative policies. The road to sustainability is not automatic—it requires informed, adaptive, and effective governance at both the national and regional levels.
Author Contributions
Conceptualization, B.N., L.Z., and O.T.; Methodology, B.N, L.T.; Software, B.N.; Validation, B.N., O.T.; Formal analysis, B.N., L.Z., and O.T.; Resources, B.N.; Data curation, B.N.; Writing—original draft preparation, B.N., L.Z., and O.T.; Writing—review and editing, B.N., L.Z.; Visualization, B.N.; Supervision, B.N. All authors have read and agreed to the published version of the manuscript.
Funding
This research received no external funding.
Institutional Review Board Statement
Not applicable
Informed Consent Statement
Not applicable
Data Availability Statement
The data presented in this study were derived from public domain resources available at the Web of Science at https://clarivate.com and Scopus at https://www.elsevier.com.
Conflicts of Interest
The authors declare no conflicts of interest.
References
- Grossman, G.M.; Krueger, A.B. Economic Growth and the Environment*. Q. J. Econ. 1995, 110, 353–377. [Google Scholar] [CrossRef]
- Stern, D.I. The Rise and Fall of the Environmental Kuznets Curve. World Dev. 2004, 32, 1419–1439. [Google Scholar] [CrossRef]
- Xu, B.; Sun, Q.; Wennersten, R.; Brandt, N. A Projected Turning Point in China’s CO2 Emissions: An Environmental Kuznets Curve Analysis. Int. J. Glob. Warm. 2012, 4, 317. [Google Scholar] [CrossRef]
- Demissew Beyene, S.; Kotosz, B. Testing the Environmental Kuznets Curve Hypothesis: An Empirical Study for East African Countries. Int. J. Environ. Stud. 2019, 77, 636–654. [Google Scholar] [CrossRef]
- Maneejuk, N.; Maneejuk, P.; Ratchakom, S.; Yamaka, W. Does the Environmental Kuznets Curve Exist? An International Study. Sustainability 2020, 12, 9117. [Google Scholar] [CrossRef]
- Arnaut, J.; Lidman, J. Environmental Sustainability and Economic Growth in Greenland: Testing the Environmental Kuznets Curve. Sustainability 2021, 13, 1228. [Google Scholar] [CrossRef]
- Golpîra, H.; Sadeghi, H.; Magazzino, C. Examining the Energy-Environmental Kuznets Curve in OECD Countries Considering Their Population. Environ. Sci. Pollut. Res. 2023, 30, 94515–94536. [Google Scholar] [CrossRef] [PubMed]
- Armeanu, D.; Andrei, J.V.; Teodor, C.; Gherghina, Ş.C.; Vintilă, G.; Drăgoi, M.C. Exploring the Link between Environmental Pollution and Economic Growth in EU-28 Countries: Is There an Environmental Kuznets Curve? PLOS ONE 2018, 13, e0195708. [Google Scholar] [CrossRef]
- Freire, F.D.S.; Da Silva, N.O.; De Oliveira, V.R.F. Economic Growth and Greenhouse Gases in Brazilian States: Is the Environmental Kuznets Curve Applicable Hypothesis? Environ. Sci. Pollut. Res. 2023, 30, 44928–44942. [Google Scholar] [CrossRef]
- Karahasan, B.C.; Pinar, M. The Environmental Kuznets Curve for Turkish Provinces: A Spatial Panel Data Approach. Environ. Sci. Pollut. Res. Int. 2021, 29, 25519–25531. [Google Scholar] [CrossRef]
- Bongers, A. The Environmental Kuznets Curve and the Energy Mix: A Structural Estimation. Energies 2020, 13, 2641. [Google Scholar] [CrossRef]
- Caglayan-Akay, E.; Kangalli-Uyar, S. Endogeneity and Nonlinearity in the Environmental Kuznets Curve: A Control Function Approach. Panoeconomicus 2019, 68, 555–576. [Google Scholar] [CrossRef]
- Dogan, E.; Inglesi-Lotz, R. The Impact of Economic Structure to the Environmental Kuznets Curve (EKC) Hypothesis: Evidence from European Countries. Environ. Sci. Pollut. Res. 2020, 27, 12717–12724. [Google Scholar] [CrossRef]
- Setyari, N.P.W.; Kusuma, W.G.A. ECONOMICS AND ENVIRONMENTAL DEVELOPMENT: TESTING THE ENVIRONMENTAL KUZNETS CURVE HYPOTHESIS. Int. J. Energy Econ. Policy 2021, 11, 51–58. [Google Scholar] [CrossRef]
- Li, S.; Cui, C.; Meng, J.; Li, Y.; Shan, Y.; Zhao, W.; Parikh, P.; Yao, J.; Guan, D. The Heterogeneous Driving Forces behind Carbon Emissions Change in 30 Selective Emerging Economies. Patterns 2023, 4, 100760. [Google Scholar] [CrossRef]
- Dai, Y.; Li, N.; Zhu, X.; Gu, R. Can China’s Carbon Emissions Trading Rights Mechanism Transform Its Manufacturing Industry? Based on the Perspective of Enterprise Behavior. Sustainability 2018, 10, 2421. [Google Scholar] [CrossRef]
- Patel, N.; Mehta, D. The Asymmetry Effect of Industrialization, Financial Development and Globalization on CO2 Emissions in India. Int. J. Thermofluids 2023, 20, 100397. [Google Scholar] [CrossRef]
- Mahmood, H. Trade Openness, Industrialization, Urbanization and Pollution Emissions in GCC Countries: A Way Towards Green and Circular Economies. Int. J. Energy Econ. Policy 2022, 12, 309–314. [Google Scholar] [CrossRef]
- Raza, M.Y.; Tang, S. Inter-Fuel Substitution, Technical Change, and Carbon Mitigation Potential in Pakistan: Perspectives of Environmental Analysis. Energies 2022, 15, 8758. [Google Scholar] [CrossRef]
- Bello, M.O.; Yen, Y.Y.; Solarin, S.A. Interfuel Substitution, Hydroelectricity Consumption and CO2 Emissions Mitigation in Malaysia: Evidence from a Transcendental Logarithm (Trans-Log) Cost Function Framework. Environ. Sci. Pollut. Res. 2020, 27, 17162–17174. [Google Scholar] [CrossRef]
- Ponce, P.; Medina, J.; Álvarez-García, J.; Del Río-Rama, M.D.L.C. Financial Development, Clean Energy, and Human Capital: Roadmap towards Sustainable Growth in América Latina. Energies 2021, 14, 3763. [Google Scholar] [CrossRef]
- Hongqiao, H.; Ahmad, M.; Xinjun, W.; Zhonghua, L. Does Innovation in Environmental Technologies Curb CO2 Emissions? Evidence From Advanced Time Series Techniques. Front. Environ. Sci. 2022, 10. [Google Scholar] [CrossRef]
- Adebayo, T.S.; Akinsola, G.D.; Bekun, F.V.; Sarkodie, S.A.; Osemeahon, O.S. Mitigating Human-Induced Emissions in Argentina: Role of Renewables, Income, Globalization, and Financial Development. Environ. Sci. Pollut. Res. 2021, 28, 67764–67778. [Google Scholar] [CrossRef]
- Soylu, Ö.B.; Adebayo, T.S.; Kirikkaleli, D. The Imperativeness of Environmental Quality in China Amidst Renewable Energy Consumption and Trade Openness. Sustainability 2021, 13, 5054. [Google Scholar] [CrossRef]
- Awosusi, A.A.; Mata, M.N.; Ahmed, Z.; Martins, J.N.; Martins, J.M.; Coelho, M.F.; Altuntaş, M.; Onifade, S.T. Retracted: How Do Renewable Energy, Economic Growth and Natural Resources Rent Affect Environmental Sustainability in a Globalized Economy? Evidence From Colombia Based on the Gradual Shift Causality Approach. Front. Energy Res. 2022, 9. [Google Scholar] [CrossRef]
- Fyfe, J.C.; Sigmond, M.; Flato, G.M.; Kharin, V.V.; Gillett, N.P.; Swart, N. Quantifying the Influence of Short-Term Emission Reductions on Climate. Sci. Adv. 2021, 7. [Google Scholar] [CrossRef]
- Zhang, M.; Abbasi, K.R.; Inuwa, N.; Sinisi, C.I.; Alvarado, R.; Ozturk, I. Does Economic Policy Uncertainty, Energy Transition and Ecological Innovation Affect Environmental Degradation in the United States? Econ. Res.-Ekon. Istraživanja 2023, 36, 1–28. [Google Scholar] [CrossRef]
- Li, Y.; Sun, Y.; Fan, Y.; Qiu, S.; Chang, M.; Li, H.; Razzaq, H.K. Green Energy Investment, Renewable Energy Consumption, and Carbon Neutrality in China. Front. Environ. Sci. 2022, 10. [Google Scholar] [CrossRef]
- Kwilinski, A.; Dluhopolskyi, O.; Dobrovolska, O.; Didenko, I.; Wołowiec, T.; Artyukhov, A.; Cwynar, W. Carbon Dioxide, Nitrous Oxide, and Methane: What Types of Greenhouse Gases Are Most Affected by Green Investments and Renewable Energy Development? Energies 2024, 17, 804. [Google Scholar] [CrossRef]
- Feng, Y.; Xiao, Z.; Zhou, J.; Ni, G. Asymmetrically Examining the Impact of Green Finance and Renewable Energy Consumption on Environmental Degradation and Renewable Energy Investment: The Impact of the COVID-19 Outbreak on the Chinese Economy. Energy Rep. 2023, 9, 5458–5472. [Google Scholar] [CrossRef]
- Oryani, B.; Koo, Y.; Rezania, S. Structural Vector Autoregressive Approach to Evaluate the Impact of Electricity Generation Mix on Economic Growth and CO2 Emissions in Iran. Energies 2020, 13, 4268. [Google Scholar] [CrossRef]
- Piłatowska, M.; Geise, A. Impact of Clean Energy on CO2 Emissions and Economic Growth within the Phases of Renewables Diffusion in Selected European Countries. Energies 2021, 14, 812. [Google Scholar] [CrossRef]
- Busu, M. The Role of Renewables in a Low-Carbon Society: Evidence from a Multivariate Panel Data Analysis at the EU Level. Sustainability 2019, 11, 5260. [Google Scholar] [CrossRef]
- Usman, O.; Iorember, P.T.; Jelilov, G.; Isik, A.; Ike, G.N.; Sarkodie, S.A. Towards Mitigating Ecological Degradation in G-7 Countries: Accounting for Economic Effect Dynamics, Renewable Energy Consumption, and Innovation. Heliyon 2021, 7, e08592. [Google Scholar] [CrossRef] [PubMed]
- Ghosh, S.; Adebayo, T.S.; Doğan, B.; Abbas, S.; Sarkodie, S.A. Harnessing the Roles of Renewable Energy, High Tech Industries, and Financial Globalization for Environmental Sustainability: Evidence from Newly Industrialized Economies. Nat. Resour. Forum 2023, 48, 1186–1207. [Google Scholar] [CrossRef]
- Ćetković, S.; Buzogány, A. Varieties of Capitalism and Clean Energy Transitions in the European Union: When Renewable Energy Hits Different Economic Logics. Clim. Policy 2016, 16, 642–657. [Google Scholar] [CrossRef]
- Supriyanto, E.; Hasan, W.H.; Muflikhun, M.A.; Nugraha, A.D.; Sentanuhady, J. Policy and Strategies of Tariff Incentives Related to Renewable Energy: Comparison between Indonesia and Other Developing and Developed Countries. Sustainability 2022, 14, 13442. [Google Scholar] [CrossRef]
- Park, S. State Renewable Energy Governance: Policy Instruments, Markets, or Citizens. Rev. Policy Res. 2015, 32, 273–296. [Google Scholar] [CrossRef]
- Lindberg, M.B. The EU Emissions Trading System and Renewable Energy Policies: Friends or Foes in the European Policy Mix? Polit. Gov. 2019, 7, 105–123. [Google Scholar] [CrossRef]
- Polzin, F.; Egli, F.; Steffen, B.; Schmidt, T.S. How Do Policies Mobilize Private Finance for Renewable Energy?—A Systematic Review with an Investor Perspective. Appl. Energy 2019, 236, 1249–1268. [Google Scholar] [CrossRef]
- Shayegh, S.; Sanchez, D.L. Impact of Market Design on Cost-Effectiveness of Renewable Portfolio Standards. Renew. Sustain. Energy Rev. 2020, 136, 110397. [Google Scholar] [CrossRef]
- Wei, W.; Cui, Q.; Chen, H.; Li, X.; He, L. The Effectiveness and Trade-Offs of Renewable Energy Policies in Achieving the Dual Decarbonization Goals in China: A Dynamic Computable General Equilibrium Analysis. Int. J. Environ. Res. Public. Health 2022, 19, 6386. [Google Scholar] [CrossRef] [PubMed]
- Hsiao, W.-L.; Hsiao, C.; Hu, J.-L.; Chang, M.-C. Energy Efficiency of the Baltic Sea Countries: An Application of Stochastic Frontier Analysis. Energies 2018, 12, 104. [Google Scholar] [CrossRef]
- Miskinis, V.; Konstantinaviciute, I.; Bobinaite, V.; Neniskis, E.; Galinis, A. Impact of Key Drivers on Energy Intensity and GHG Emissions in Manufacturing in the Baltic States. Sustainability 2023, 15, 3330. [Google Scholar] [CrossRef]
- Pereira, G.I.; da Silva, P.P. Energy Efficiency Governance in the EU-28: Analysis of Institutional, Human, Financial, and Political Dimensions. Energy Effic. 2017, 10, 1279–1297. [Google Scholar] [CrossRef]
- Wu, J.; Shi, Z.; Zhang, Y. Crafting a Sustainable Next Generation Infrastructure: Evaluation of China’s New Infrastructure Construction Policies. Sustainability 2021, 13, 6245. [Google Scholar] [CrossRef]
- Dijkgraaf, E.; Van Dorp, T.P.; Maasland, E. On the Effectiveness of Feed-in Tariffs in the Development of Solar Photovoltaics. Energy J. 2018, 39, 81–100. [Google Scholar] [CrossRef]
- Colenbrander, S.; Gouldson, A.; Sudmant, A.H.; Papargyropoulou, E. The Economic Case for Low-Carbon Development in Rapidly Growing Developing World Cities: A Case Study of Palembang, Indonesia. Energy Policy 2015, 80, 24–35. [Google Scholar] [CrossRef]
- Weng, C.; Huang, J.; Greenwood-Nimmo, M. The Effect of Clean Energy Investment on CO2 Emissions: Insights from a Spatial Durbin Model. Energy Econ. 2023, 126, 107000. [Google Scholar] [CrossRef]
- Ogarenko, I.; Hubacek, K. Eliminating Indirect Energy Subsidies in Ukraine: Estimation of Environmental and Socioeconomic Effects Using Input–Output Modeling. J. Econ. Struct. 2013, 2. [Google Scholar] [CrossRef]
- Aryanpur, V.; Ghahremani, M.; Mamipour, S.; Fattahi, M.; Ó Gallachóir, B.; Bazilian, M.D.; Glynn, J. Ex-Post Analysis of Energy Subsidy Removal through Integrated Energy Systems Modelling. Renew. Sustain. Energy Rev. 2022, 158, 112116. [Google Scholar] [CrossRef]
- Peters, B.; Mcwhinnie, S.F. On the Rebound: Estimating Direct Rebound Effects for Australian Households. Aust. J. Agric. Resour. Econ. 2017, 62, 65–82. [Google Scholar] [CrossRef]
- Albizzati, P.F.; Rocchi, P.; Cai, M.; Tonini, D.; Astrup, T.F. Rebound Effects of Food Waste Prevention: Environmental Impacts. Waste Manag. 2022, 153, 138–146. [Google Scholar] [CrossRef]
- Makov, T.; Font Vivanco, D. Does the Circular Economy Grow the Pie? The Case of Rebound Effects From Smartphone Reuse. Front. Energy Res. 2018, 6. [Google Scholar] [CrossRef]
- Alvi, S.; Mahmood, Z.; Nawaz, S.M.N. Dilemma of Direct Rebound Effect and Climate Change on Residential Electricity Consumption in Pakistan. Energy Rep. 2018, 4, 323–327. [Google Scholar] [CrossRef]
- An, Q.; Lin, C.; Li, Q.; Zheng, L. Research on the Impact of Green Finance Development on Energy Intensity in China. Front. Earth Sci. 2023, 11. [Google Scholar] [CrossRef]
- Liu, Y.; Zhang, Y.; Lei, J. A Study on the Sustainable Relationship among the Green Finance, Environment Regulation and Green-Total-Factor Productivity in China. Sustainability 2021, 13, 11926. [Google Scholar] [CrossRef]
- Fu, W.; Irfan, M. Does Green Financing Develop a Cleaner Environment for Environmental Sustainability: Empirical Insights From Association of Southeast Asian Nations Economies. Front. Psychol. 2022, 13. [Google Scholar] [CrossRef]
- Song, J.; Wang, S.; Li, M.; Ye, T. To What Extent Does Environmental Regulation Influence Emission Reduction? Evidence from Local and Neighboring Locations in China. Sustainability 2022, 14, 9714. [Google Scholar] [CrossRef]
- Yang, Z.; Zhang, Q.; Yuan, Y. Carbon Emission Trading Scheme, Carbon Emissions Reduction and Spatial Spillover Effects: Quasi-Experimental Evidence From China. Front. Environ. Sci. 2022, 9. [Google Scholar] [CrossRef]
- Assogbavi, K.K.E.; Dées, S. Environmental Policy and the CO2 Emissions Embodied in International Trade. Environ. Resour. Econ. 2022, 84, 507–527. [Google Scholar] [CrossRef]
- Fragkos, P.; Fragkiadakis, K.; Paroussos, L. Reducing the Decarbonisation Cost Burden for EU Energy-Intensive Industries. Energies 2021, 14, 236. [Google Scholar] [CrossRef]
- Liu, Y.; Huang, C.; Chen, L. Study on the Carbon Emission Spillover Effects of Transportation under Technological Advancements. Sustainability 2022, 14, 10608. [Google Scholar] [CrossRef]
- Pye, S.; Welsby, D.; Mcdowall, W.; Reinauer, T.; Dessens, O.; Winning, M.; Calzadilla, A.; Bataille, C. Regional Uptake of Direct Reduction Iron Production Using Hydrogen under Climate Policy. Energy Clim. Change 2022, 3, 100087. [Google Scholar] [CrossRef]
- Chang, X.; Li, J. Effects of the Digital Economy on Carbon Emissions in China: A Spatial Durbin Econometric Analysis. Sustainability 2022, 14, 16624. [Google Scholar] [CrossRef]
- Fang, D.; Ni, R.; Feng, K.; Chen, B.; Lin, J.; Hubacek, K.; Chen, L. Clean Air for Some: Unintended Spillover Effects of Regional Air Pollution Policies. Sci. Adv. 2019, 5. [Google Scholar] [CrossRef]
- Dell’Erba, S.; Poghosyan, T.; Baldacci, E. Spatial Spillovers in Emerging Market Spreads. Empir. Econ. 2012, 45, 735–756. [Google Scholar] [CrossRef]
- Cerqua, A.; Pellegrini, G. Industrial Policy Evaluation in the Presence of Spillovers. Small Bus. Econ. 2017, 49, 671–686. [Google Scholar] [CrossRef]
- Lin, M.; Kwan, Y.K. FDI Spatial Spillovers in China. World Econ. 2015, 40, 1514–1530. [Google Scholar] [CrossRef]
- Fajgelbaum, P.D.; Gaubert, C. Optimal Spatial Policies, Geography, and Sorting*. Q. J. Econ. 2020, 135, 959–1036. [Google Scholar] [CrossRef]
- Oberdabernig, D.A.; Crespo Cuaresma, J.; Humer, S. Democracy, Geography and Model Uncertainty. Scott. J. Polit. Econ. 2017, 65, 154–185. [Google Scholar] [CrossRef]
- Liu, C.; Xin, L.; Sun, H.; Li, J. The Impact of Renewable Energy Technology Innovation on Industrial Green Transformation and Upgrading: Beggar Thy Neighbor or Benefiting Thy Neighbor. Sustainability 2022, 14, 11198. [Google Scholar] [CrossRef]
- Garrone, P.; Piscitello, L.; Wang, Y. Innovation Performance and International Knowledge Spillovers: Evidence from the Renewable Energy Sector in OECD Countries. Ind. Innov. 2014, 21, 574–598. [Google Scholar] [CrossRef]
- Elhorst, J.P. Spatial Econometrics: From Cross-Sectional Data to Spatial Panels; SpringerBriefs in Regional Science; Springer: Berlin, Heidelberg, 2014; ISBN 978-3-642-40339-2. [Google Scholar]
- Anselin, L.; Gallo, J.L.; Jayet, H. Spatial Panel Econometrics. In The Econometrics of Panel Data: Fundamentals and Recent Developments in Theory and Practice; Mátyás, L., Sevestre, P., Eds.; Springer: Berlin, Heidelberg, 2008; pp. 625–600. ISBN 978-3-540-75892-1. [Google Scholar]
- Pforr, K. Femlogit—Implementation of the Multinomial Logit Model with Fixed Effects. Stata J. Promot. Commun. Stat. Stata 2014, 14, 847–862. [Google Scholar] [CrossRef]
- Ojaghlou, M.; Ugurlu, E.; Kadłubek, M.; Thalassinos, E. Economic Activities and Management Issues for the Environment: An Environmental Kuznets Curve (EKC) and STIRPAT Analysis in Turkey. Resources 2023, 12, 57. [Google Scholar] [CrossRef]
- Kar, A.K. Environmental Kuznets Curve for CO2 Emissions in Baltic Countries: An Empirical Investigation. Environ. Sci. Pollut. Res. 2022, 29, 47189–47208. [Google Scholar] [CrossRef]
- Han, C.; Yang, H.; Gu, Z. EKC Test of the Relationship between Nitrogen Dioxide Pollution and Economic Growth-A Spatial Econometric Analysis Based on Chinese City Data. Int. J. Environ. Res. Public. Health 2021, 18, 9697. [Google Scholar] [CrossRef]
- Jóźwik, B.; Gruszecki, L.E.; Gavryshkiv, A.-V.; Kyophilavong, P. Revisiting the Environmental Kuznets Curve Hypothesis: A Case of Central Europe. Energies 2021, 14, 3415. [Google Scholar] [CrossRef]
- Li, R.; Su, M. The Role of Natural Gas and Renewable Energy in Curbing Carbon Emission: Case Study of the United States. Sustainability 2017, 9, 600. [Google Scholar] [CrossRef]
- Hao, Y. Effect of Economic Indicators, Renewable Energy Consumption and Human Development on Climate Change: An Empirical Analysis Based on Panel Data of Selected Countries. Front. Energy Res. 2022, 10. [Google Scholar] [CrossRef]
- Meyer, M.; Distelkamp, M.; Hirschnitz-Garbers, M. Contemporary Resource Policy and Decoupling Trends—Lessons Learnt from Integrated Model-Based Assessments. Sustainability 2018, 10, 1858. [Google Scholar] [CrossRef]
- Shu, T.; Chen, S.; Wang, S.; Huang, C.; Lai, K.K. Trade-Old-for-Remanufactured Closed-Loop Supply Chains with Carbon Tax and Government Subsidies. Sustainability 2018, 10, 3935. [Google Scholar] [CrossRef]
- Xiong, B.; Wang, R. Effect of Environmental Regulation on Industrial Solid Waste Pollution in China: From the Perspective of Formal Environmental Regulation and Informal Environmental Regulation. Int. J. Environ. Res. Public. Health 2020, 17, 7798. [Google Scholar] [CrossRef]
- Batool, Z.; Ali, S.; Rehman, A. Environmental Impact of ICT on Disaggregated Energy Consumption in China: A Threshold Regression Analysis. Sustainability 2022, 14, 15600. [Google Scholar] [CrossRef]
- Lenaerts, K.; Tagliapietra, S.; Wolff, G. The Global Quest for Green Growth: An Economic Policy Perspective. Sustainability 2022, 14, 5555. [Google Scholar] [CrossRef]
- Zhong, S.; Pan, L.; Yu, Y.; Fan, Y.; Jahanger, A.; Shen, H.; Niu, Z. Moving towards Environmental Sustainability: Can Digital Economy Reduce Environmental Degradation in China? Int. J. Environ. Res. Public. Health 2022, 19, 15540. [Google Scholar] [CrossRef]
- Pang, G.; Shen, X.; Ding, Z. Spillover Effect of Energy Intensity Reduction Targets on Carbon Emissions in China. Front. Environ. Sci. 2023, 11. [Google Scholar] [CrossRef]
- Zhang, X.; Xu, F. Environmental Regulation and Spatial Spillover Effect of Green Technology Innovation: An Empirical Study on the Spatial Durbin Model. Sustainability 2023, 15, 14133. [Google Scholar] [CrossRef]
Figure 1.
Selection criteria of PCA analysis.
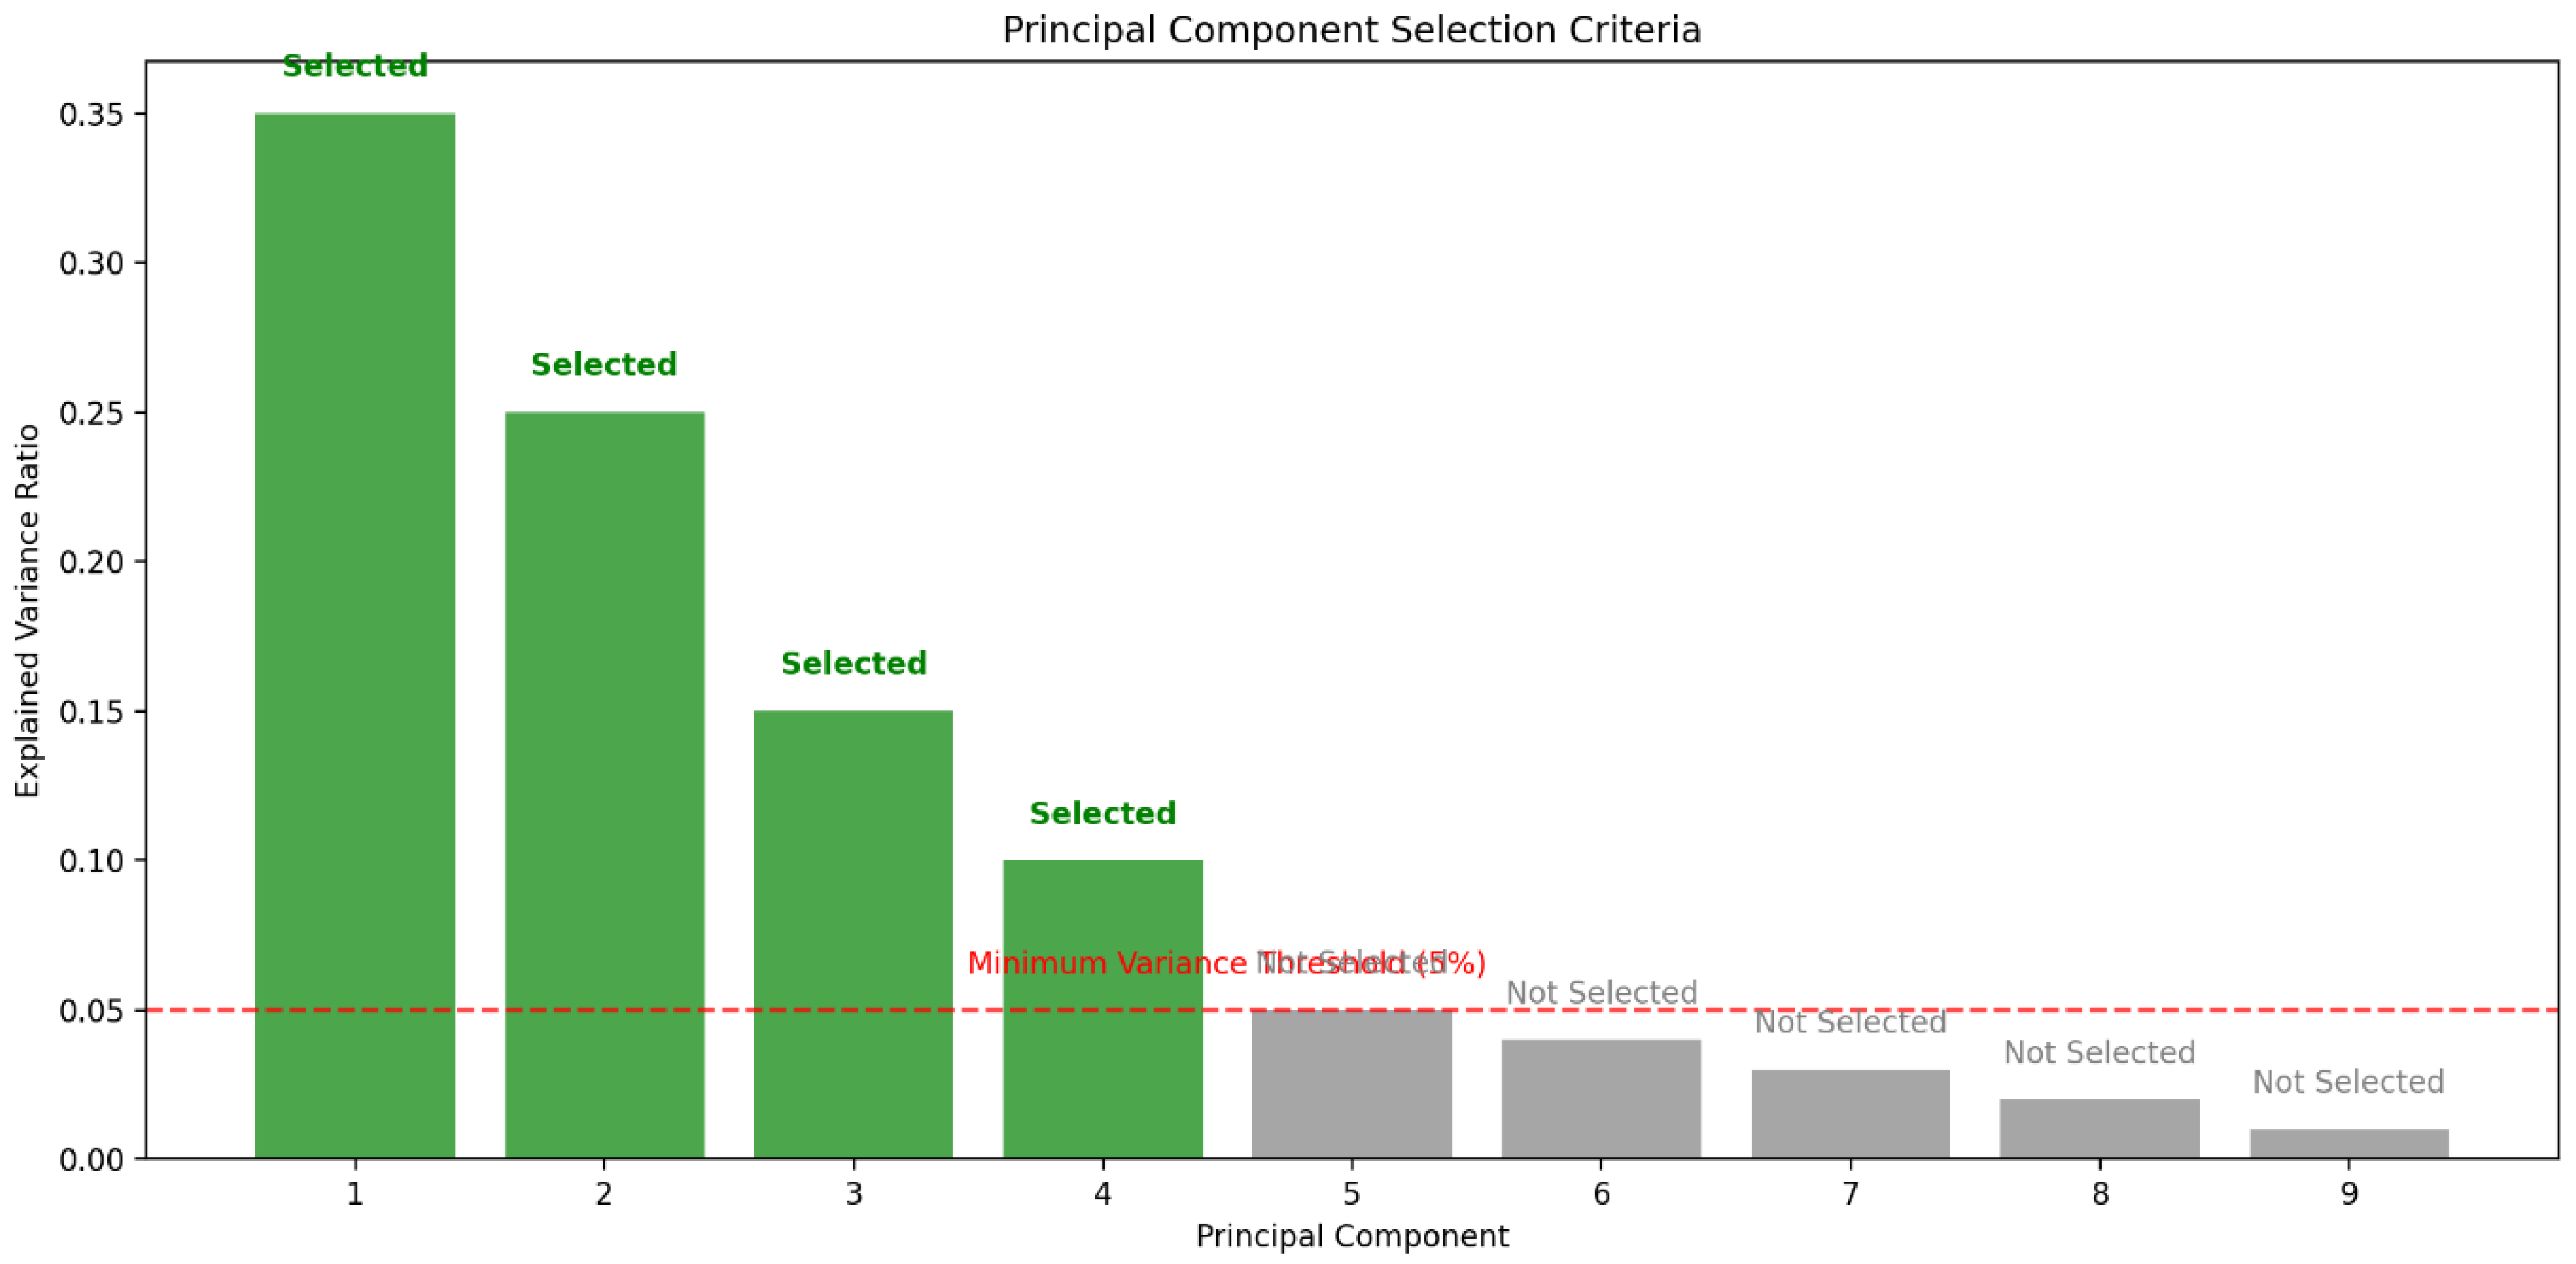
Figure 3.
Actual vs. Predicted CO₂ Emissions (Scatter Plot).
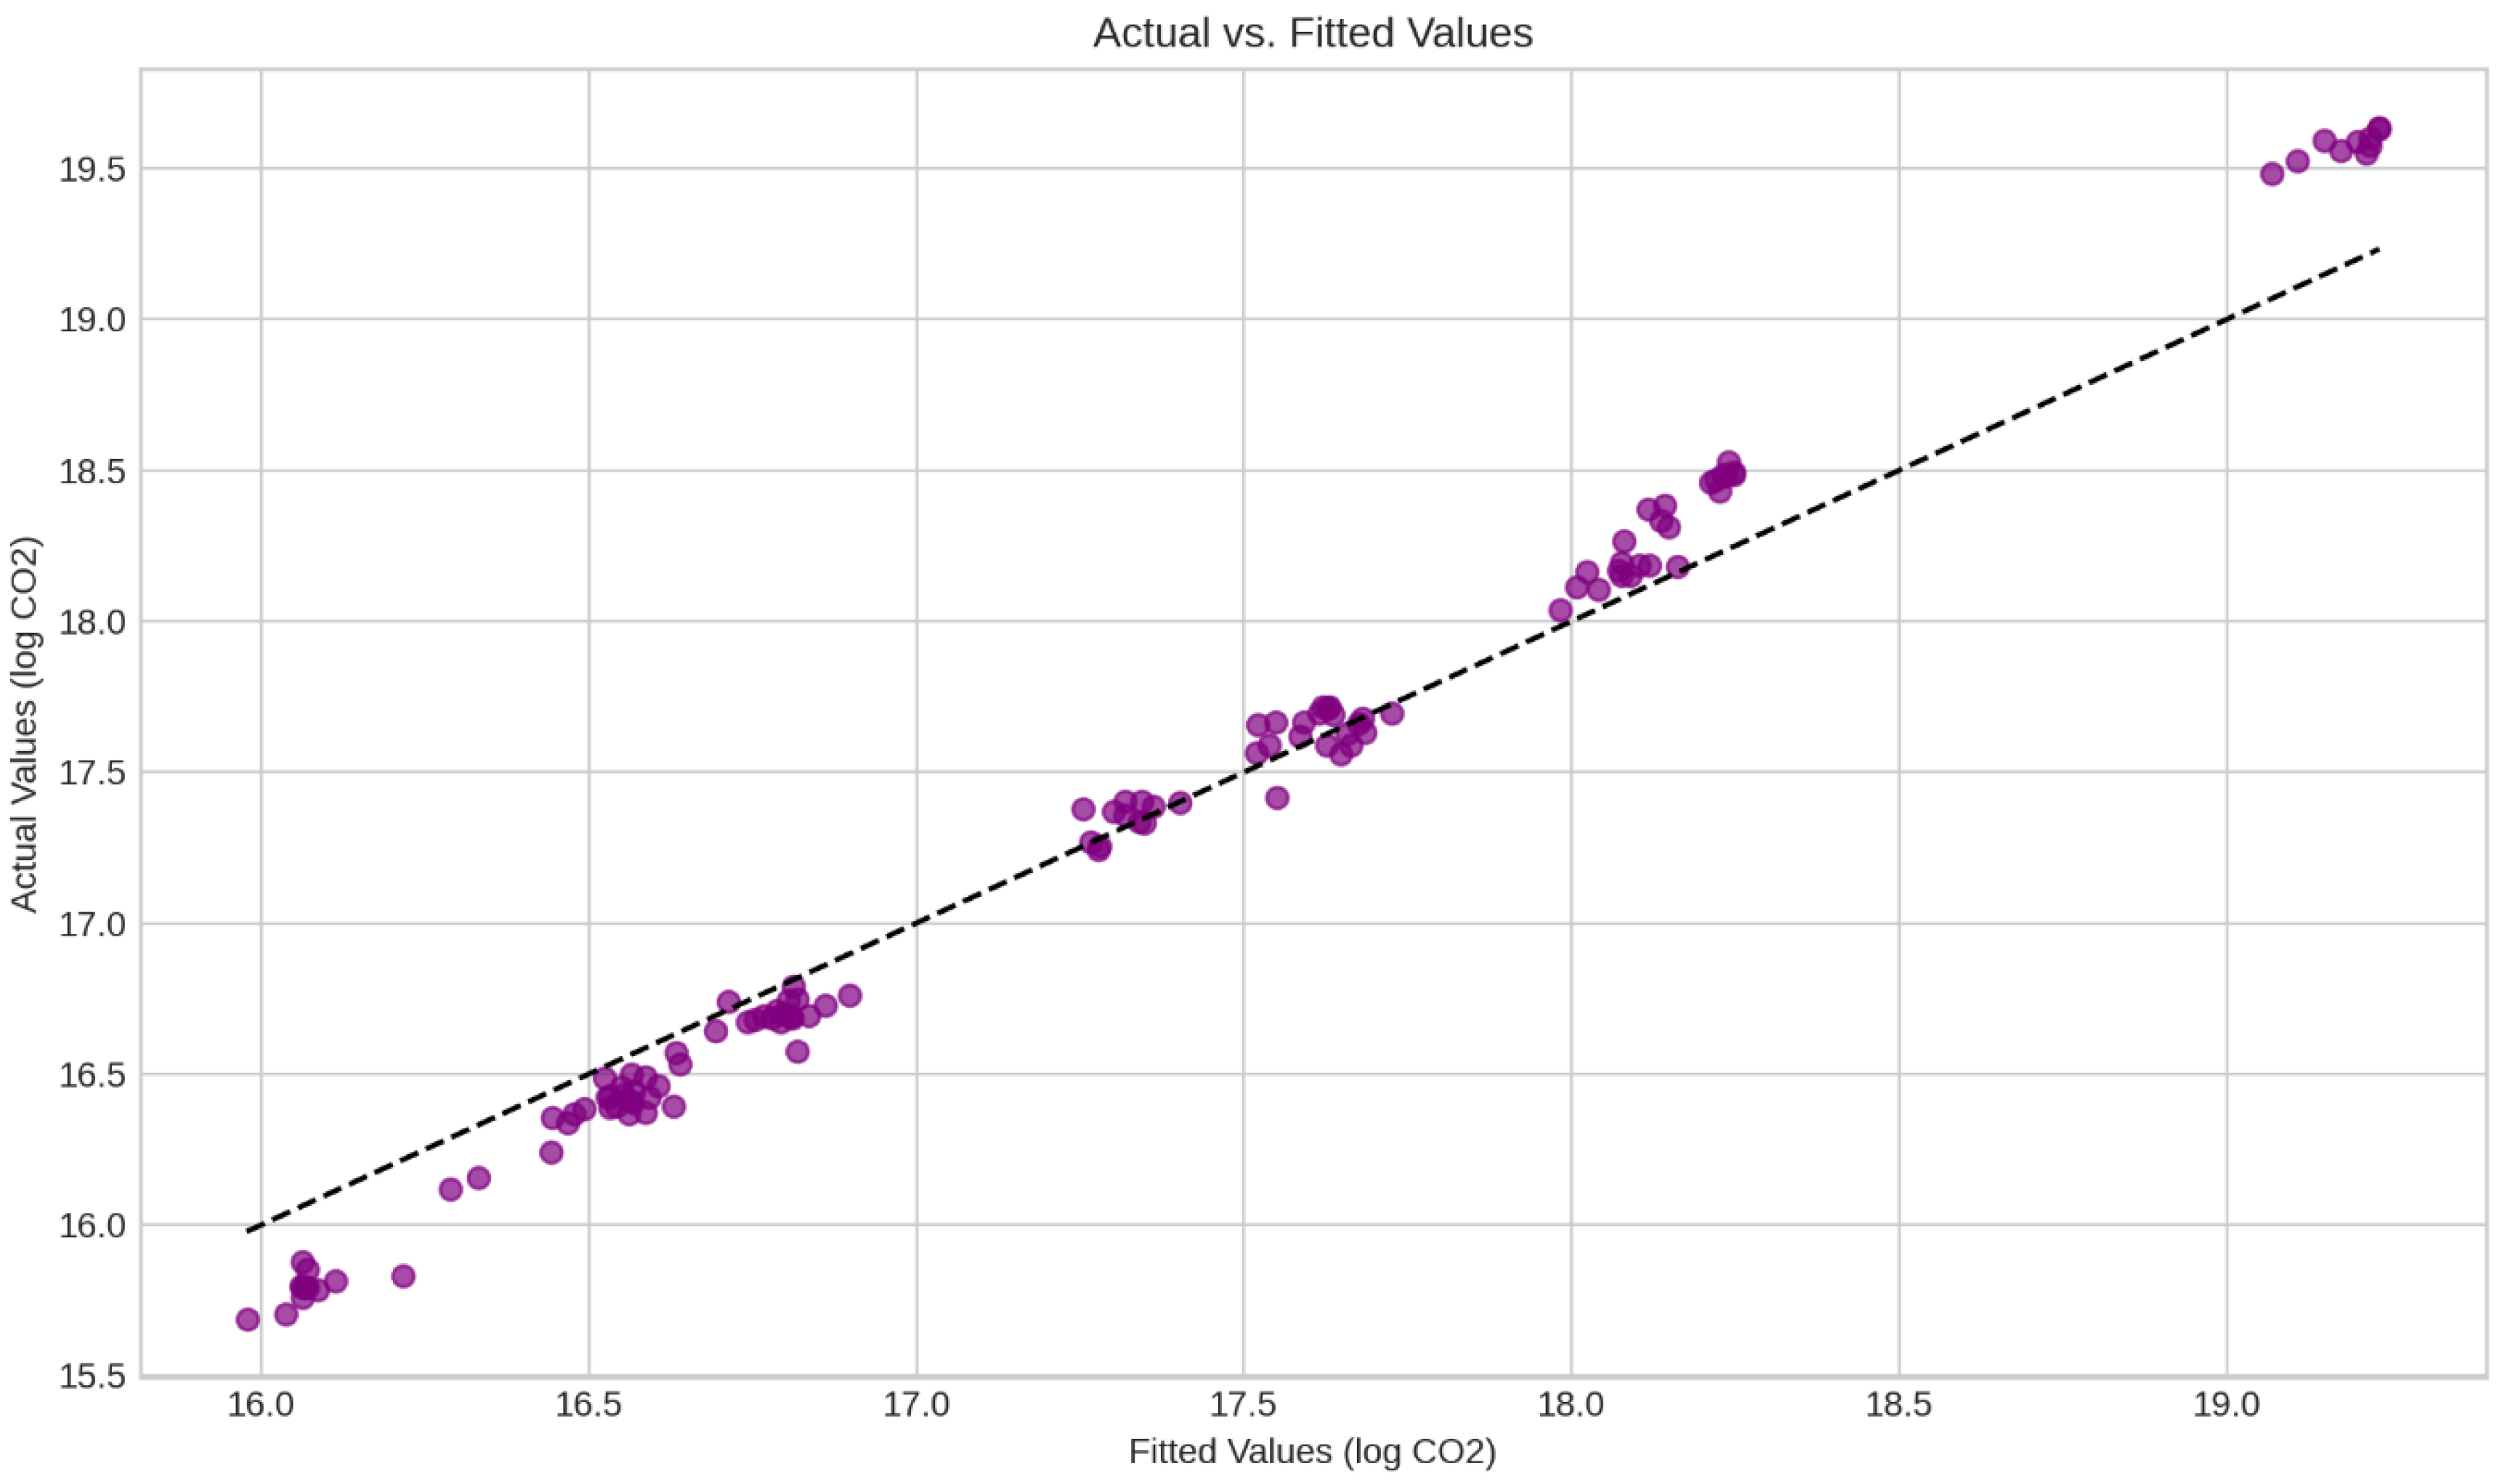
Figure 4.
Impulse Response Function for Renewable Investments on CO₂ Emissions.
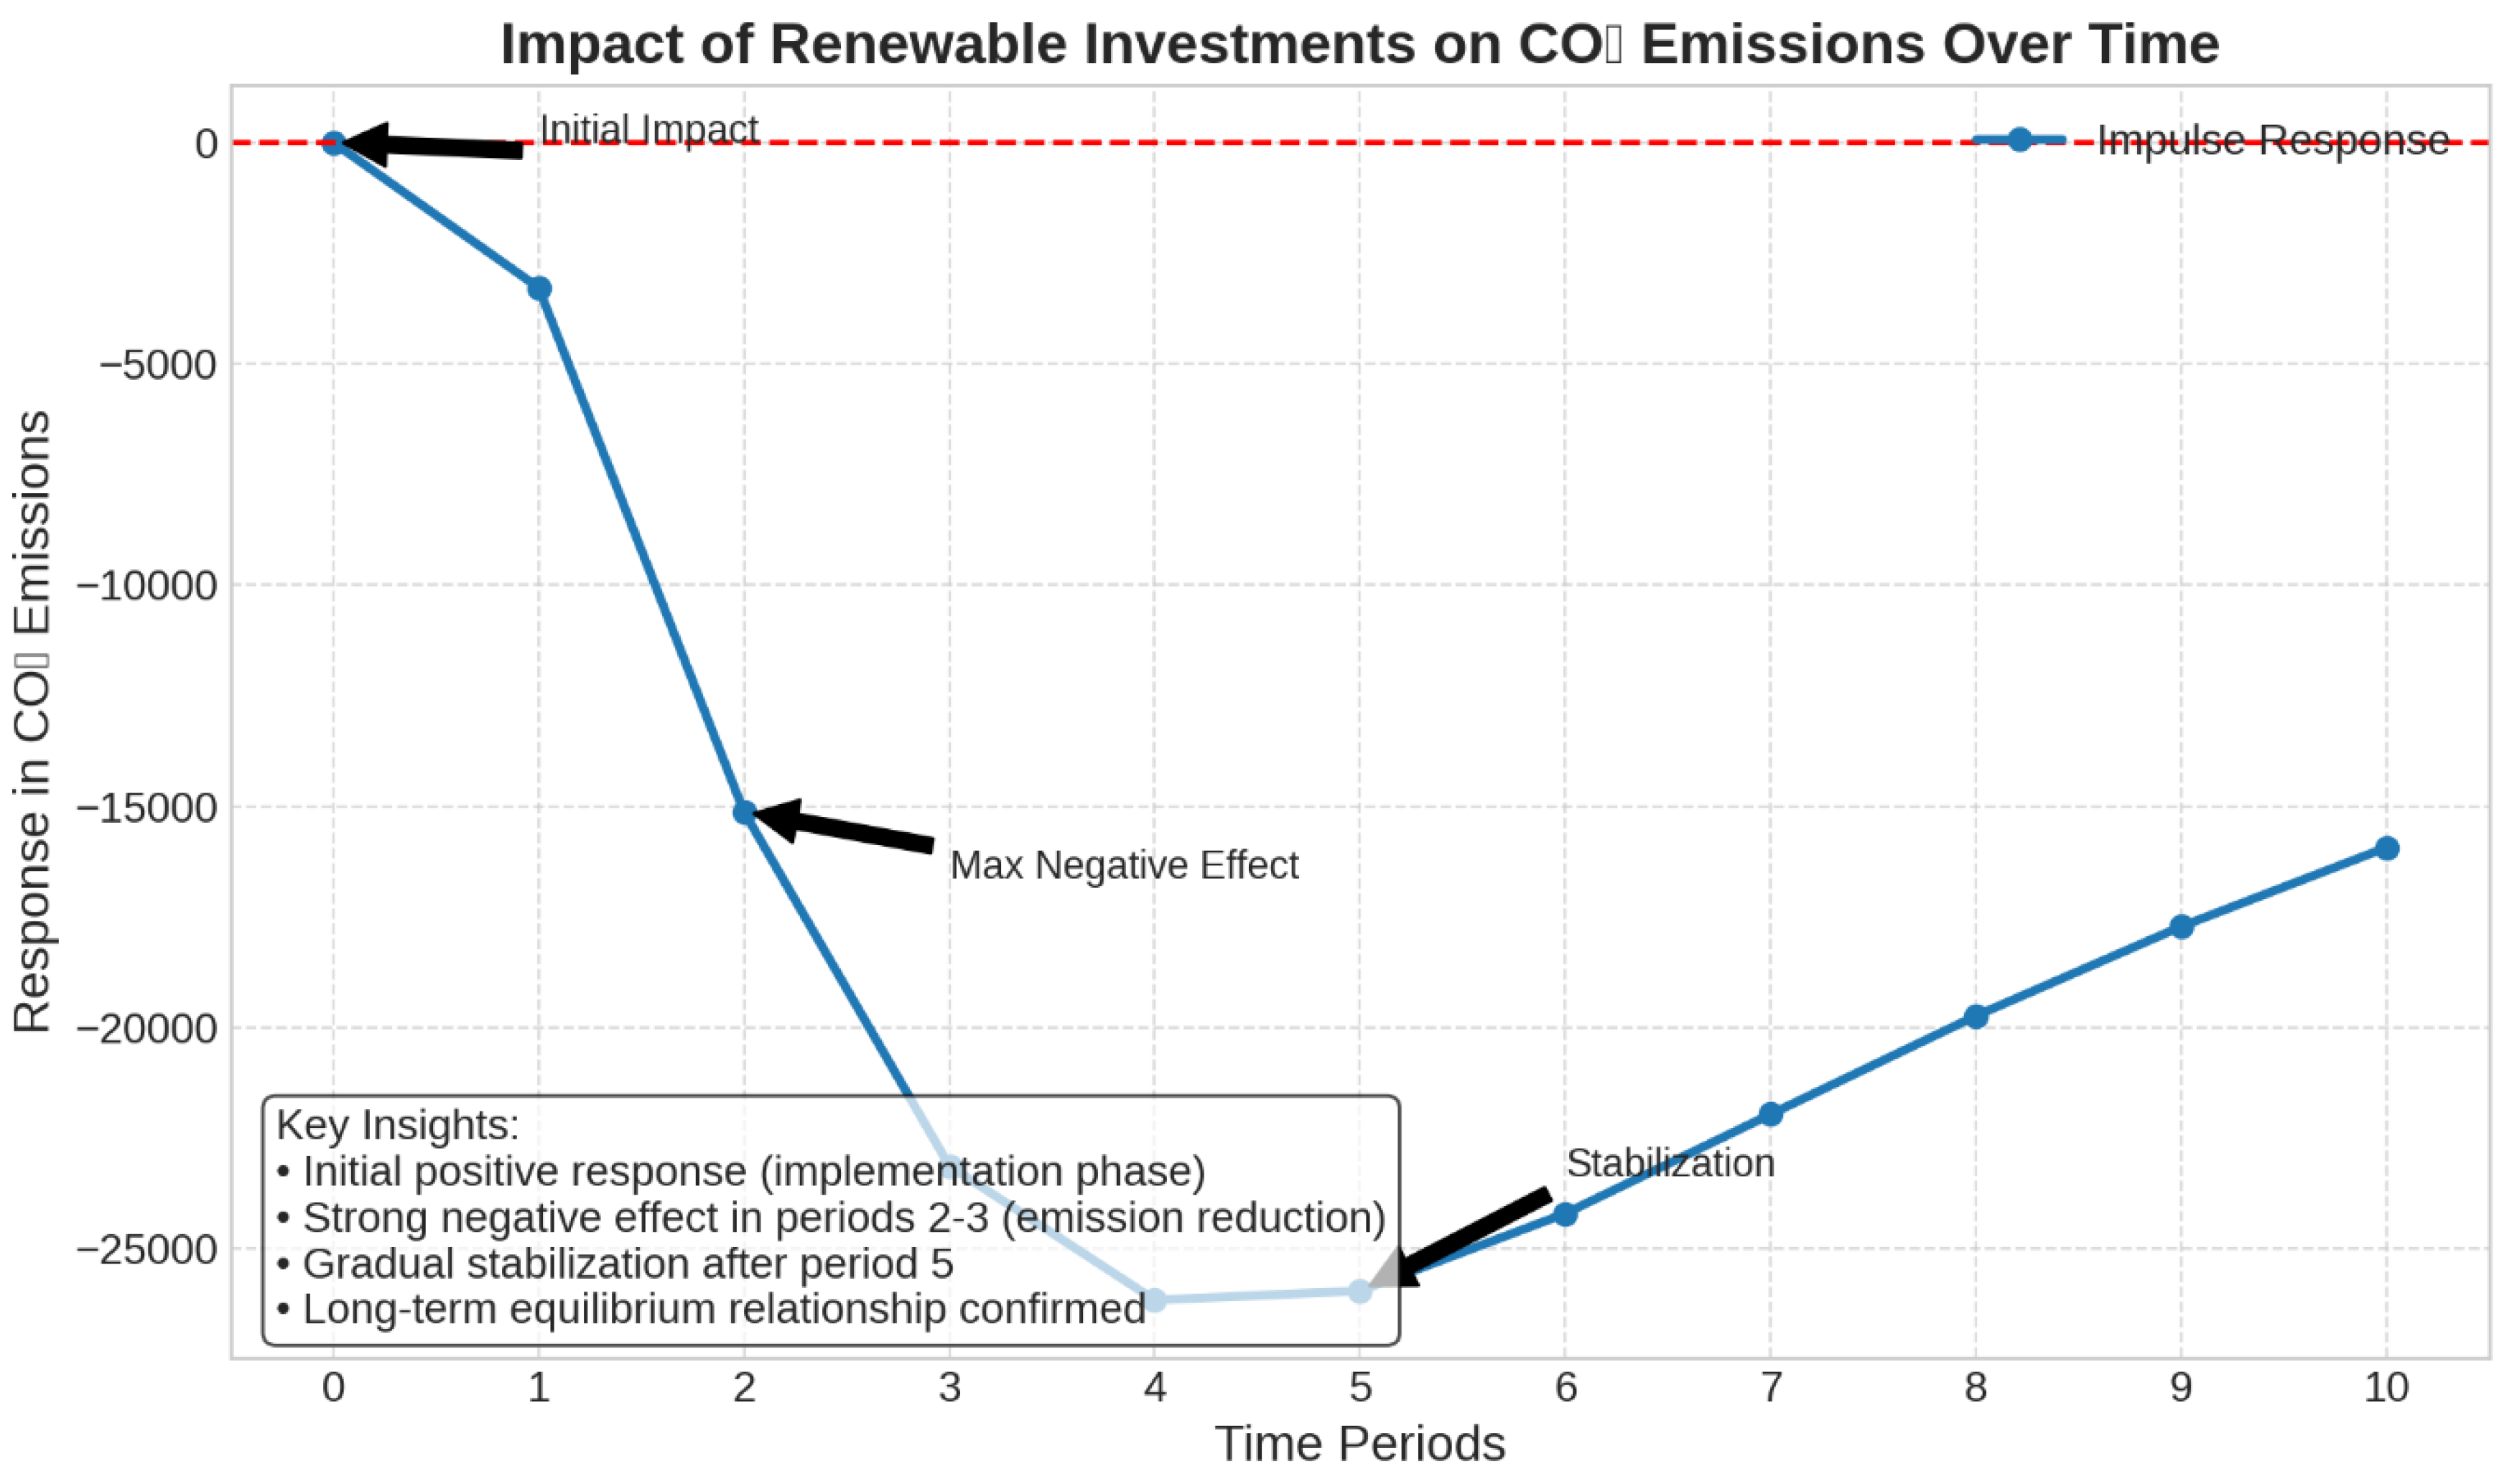
Figure 5.
Box Plot of Energy Efficiency Scores by Country].
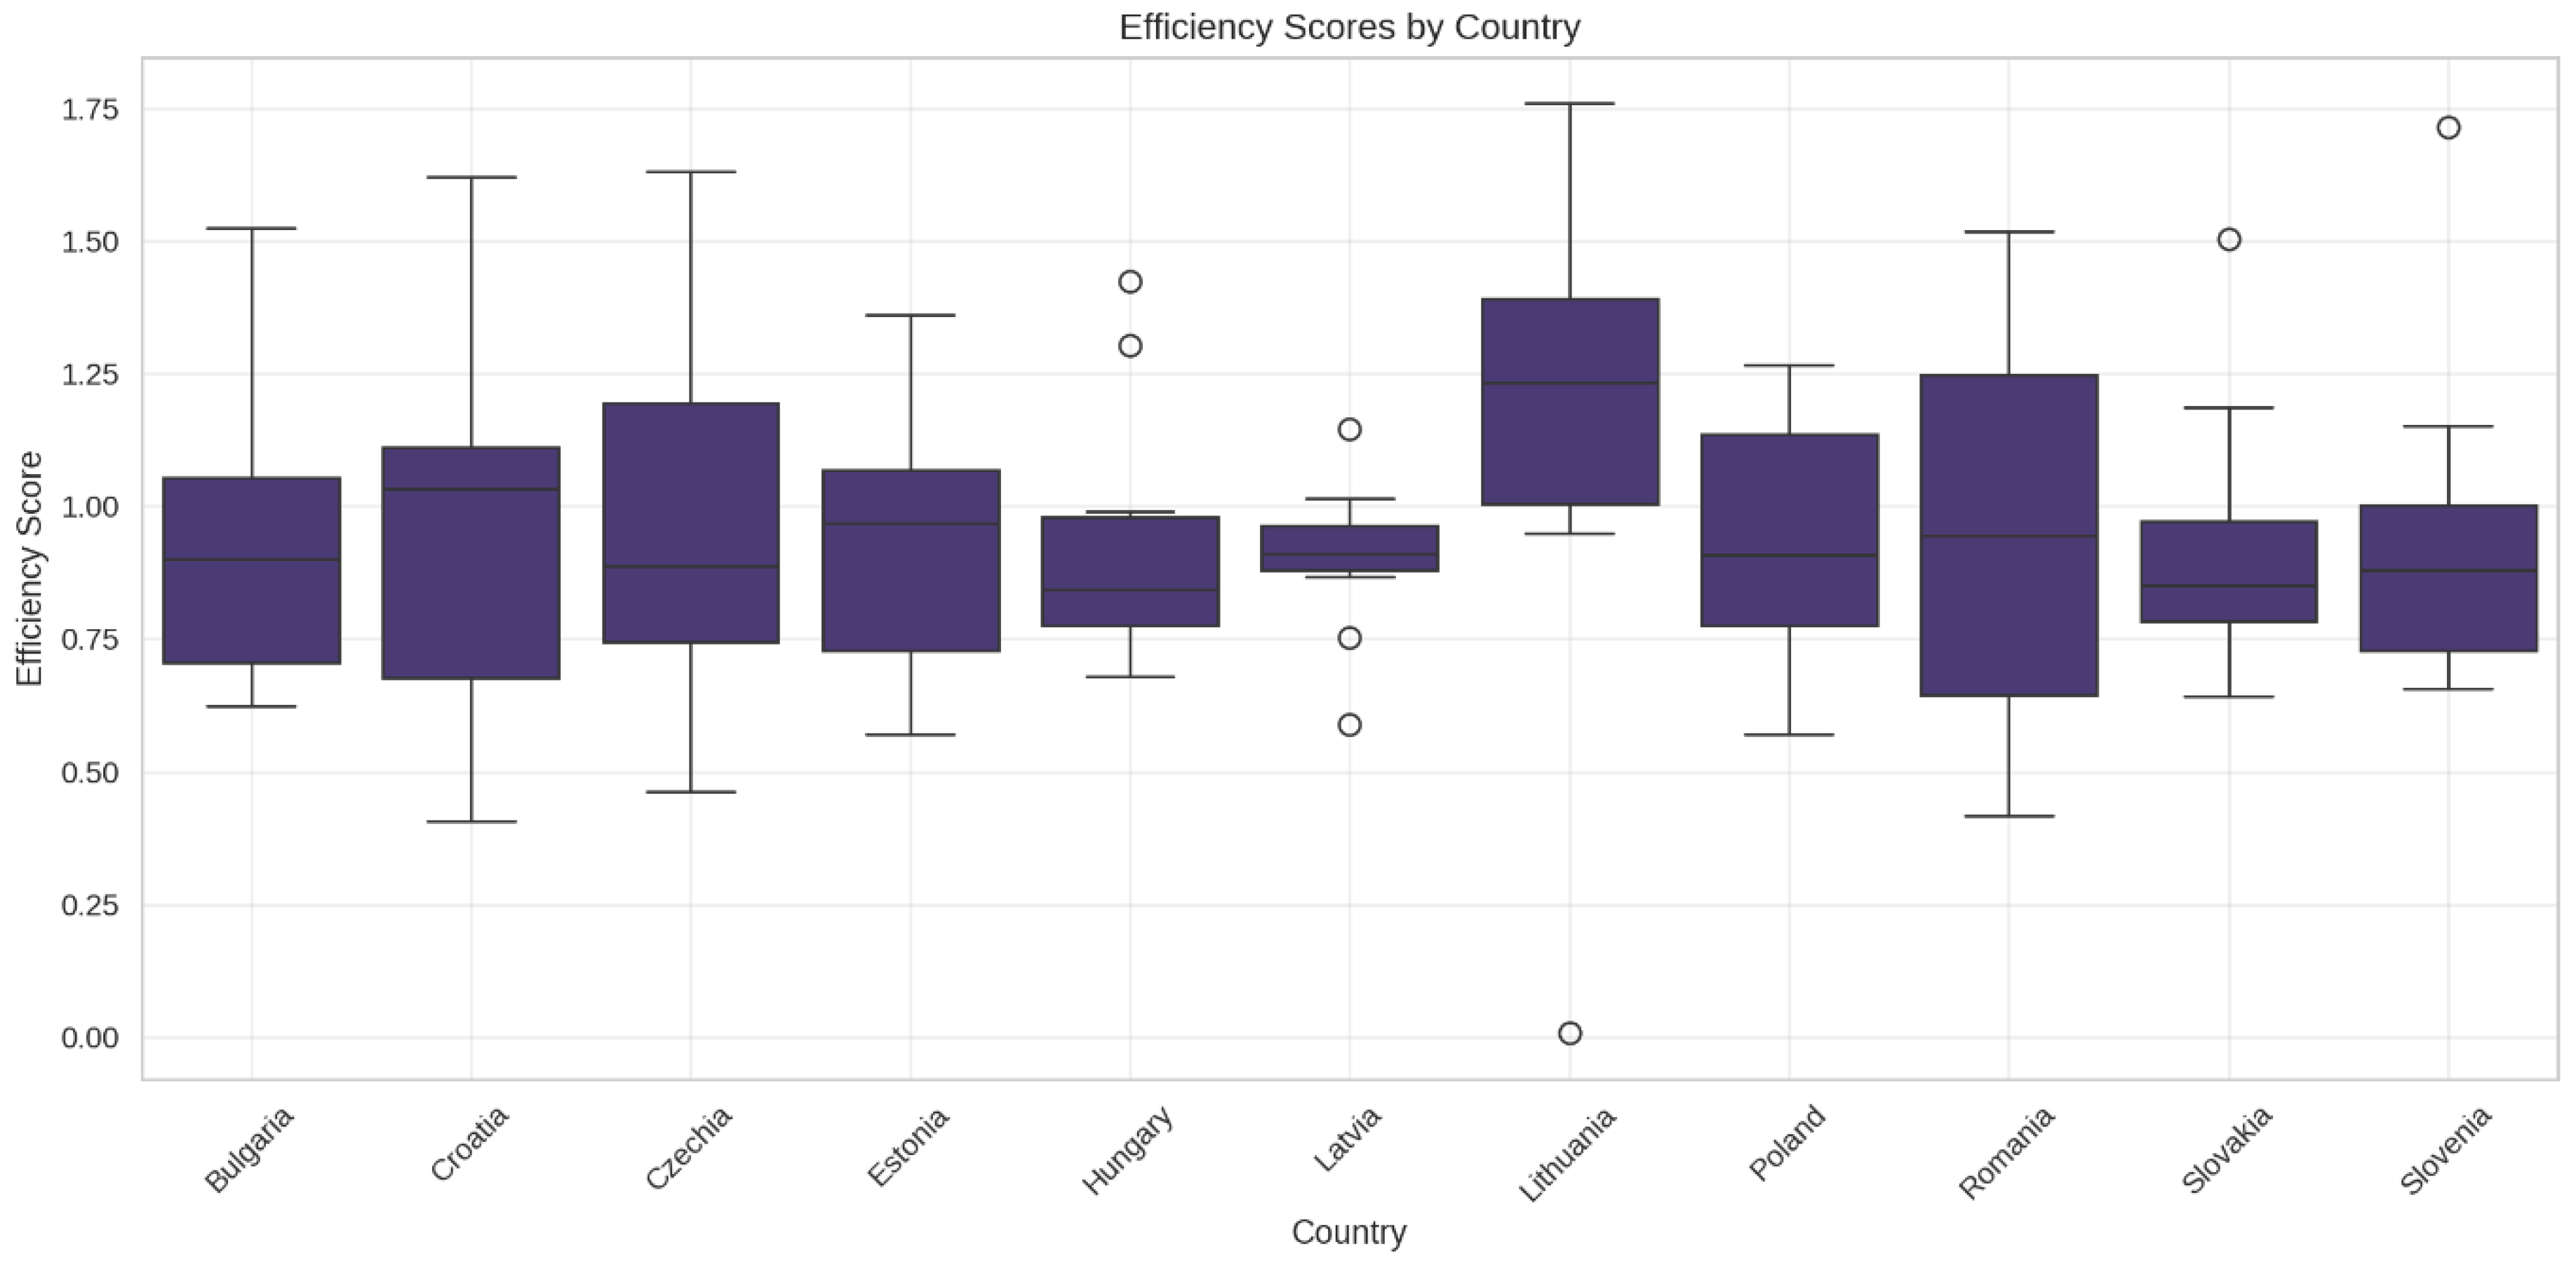
Figure 6.
Time-Series Trend of Energy Efficiency Scores.
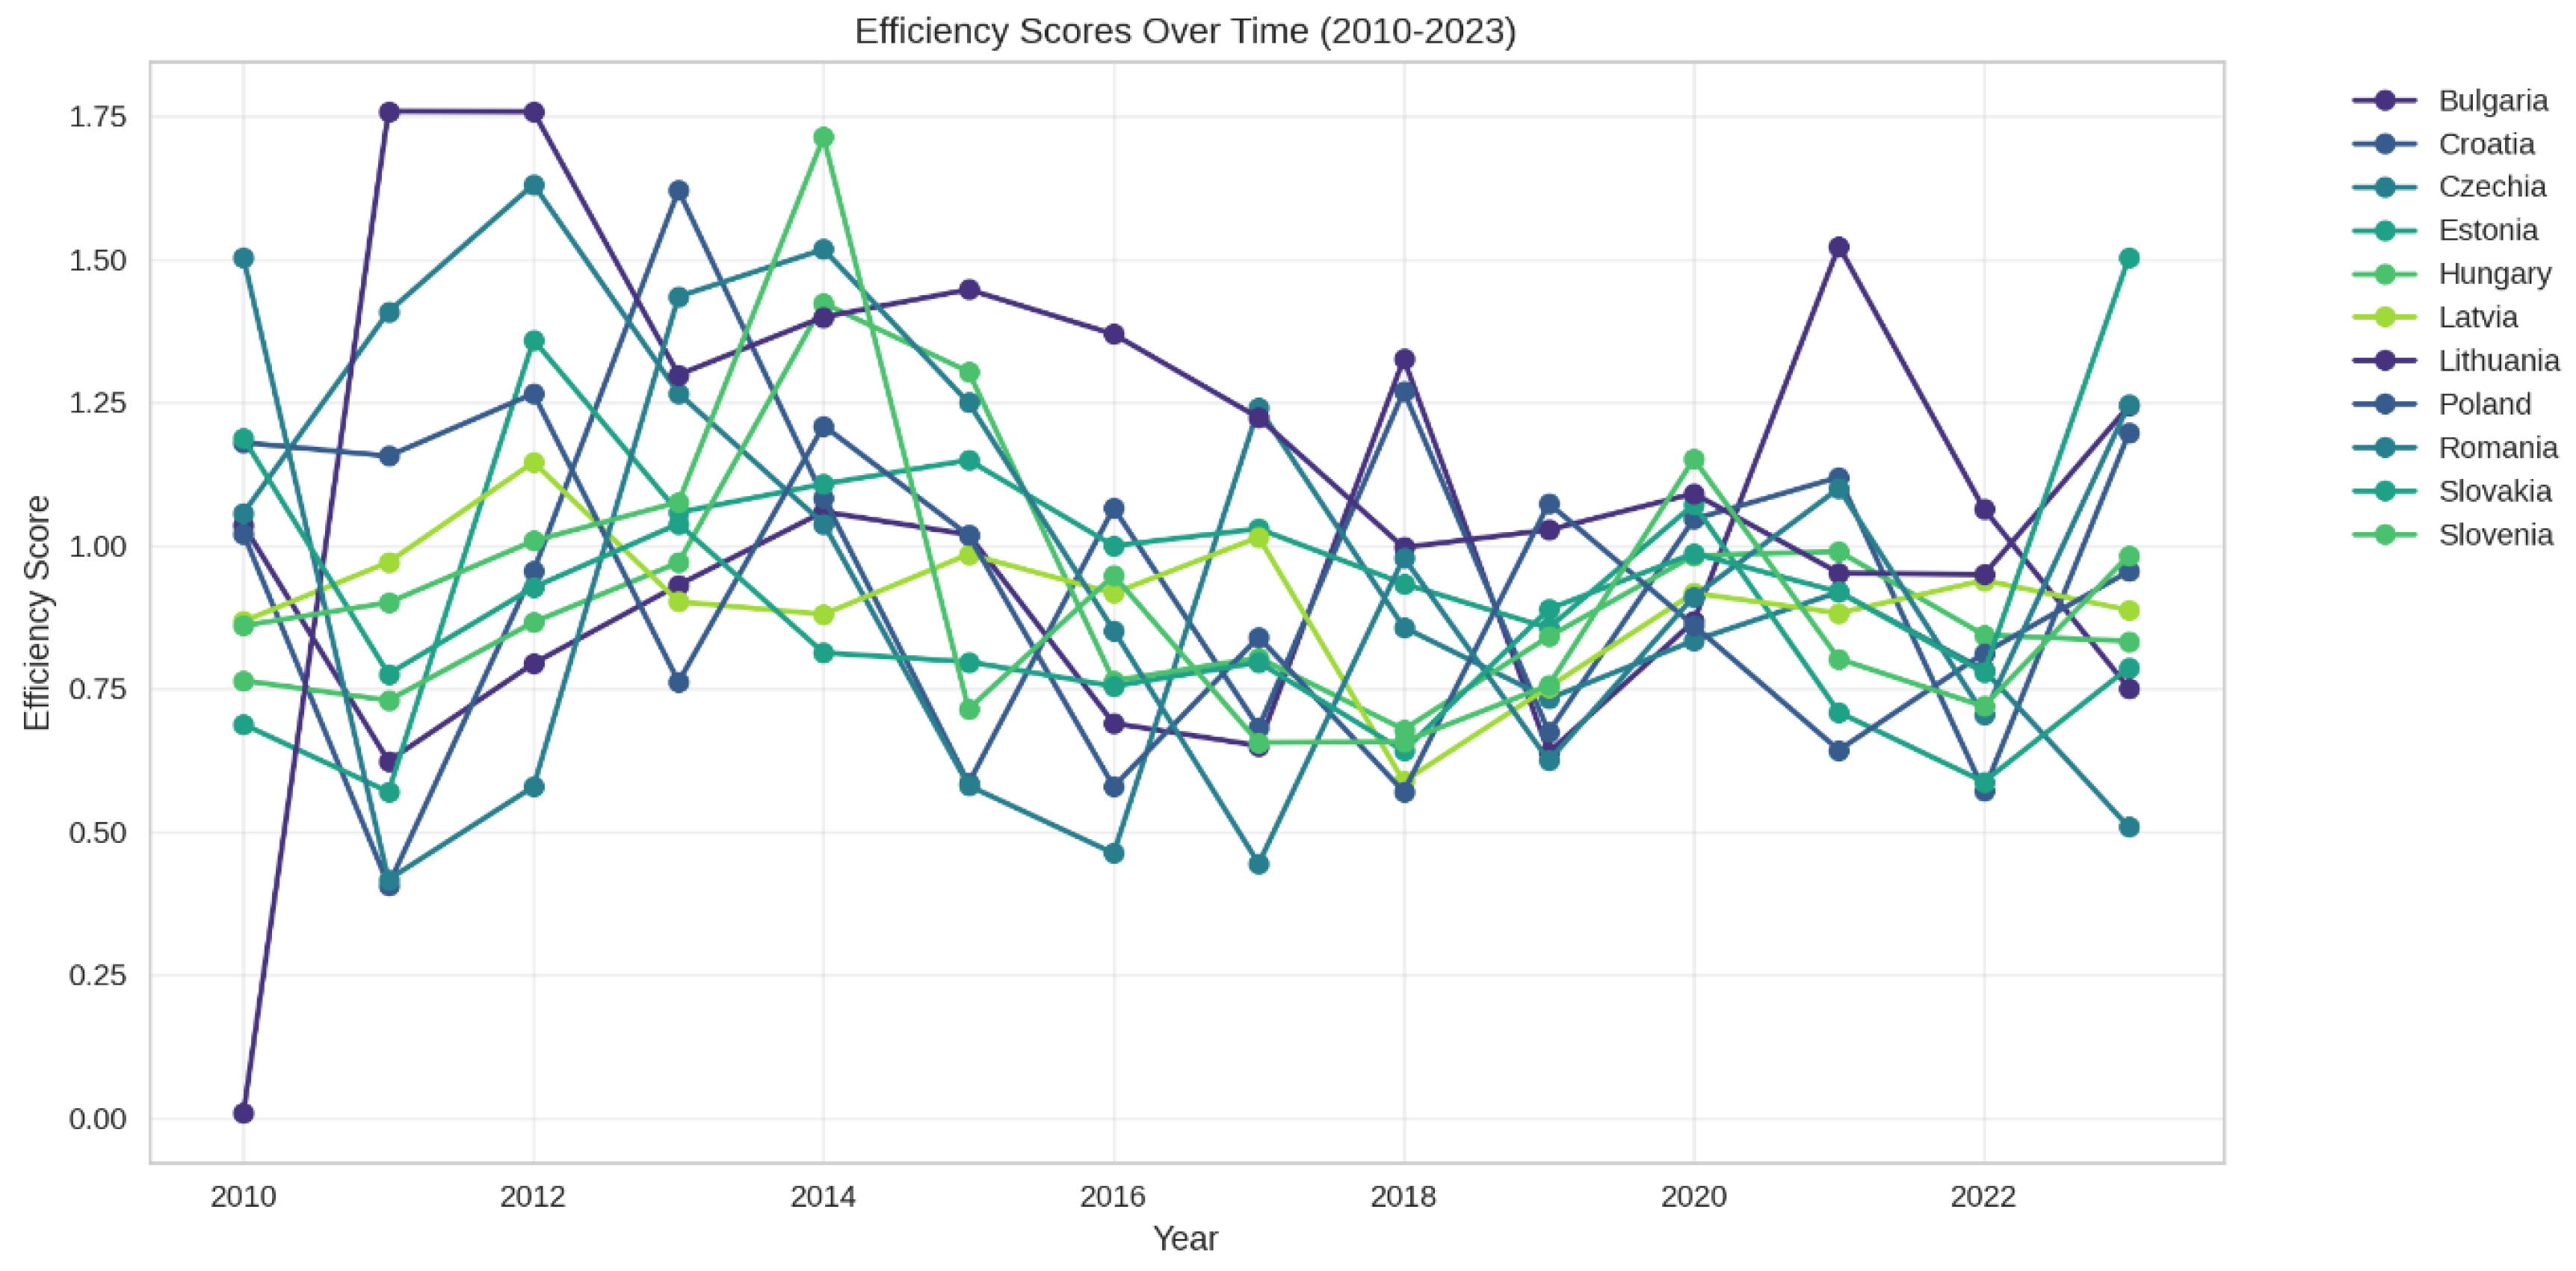
Figure 7.
Threshold Regression Prediction Plot with Inflection Point.
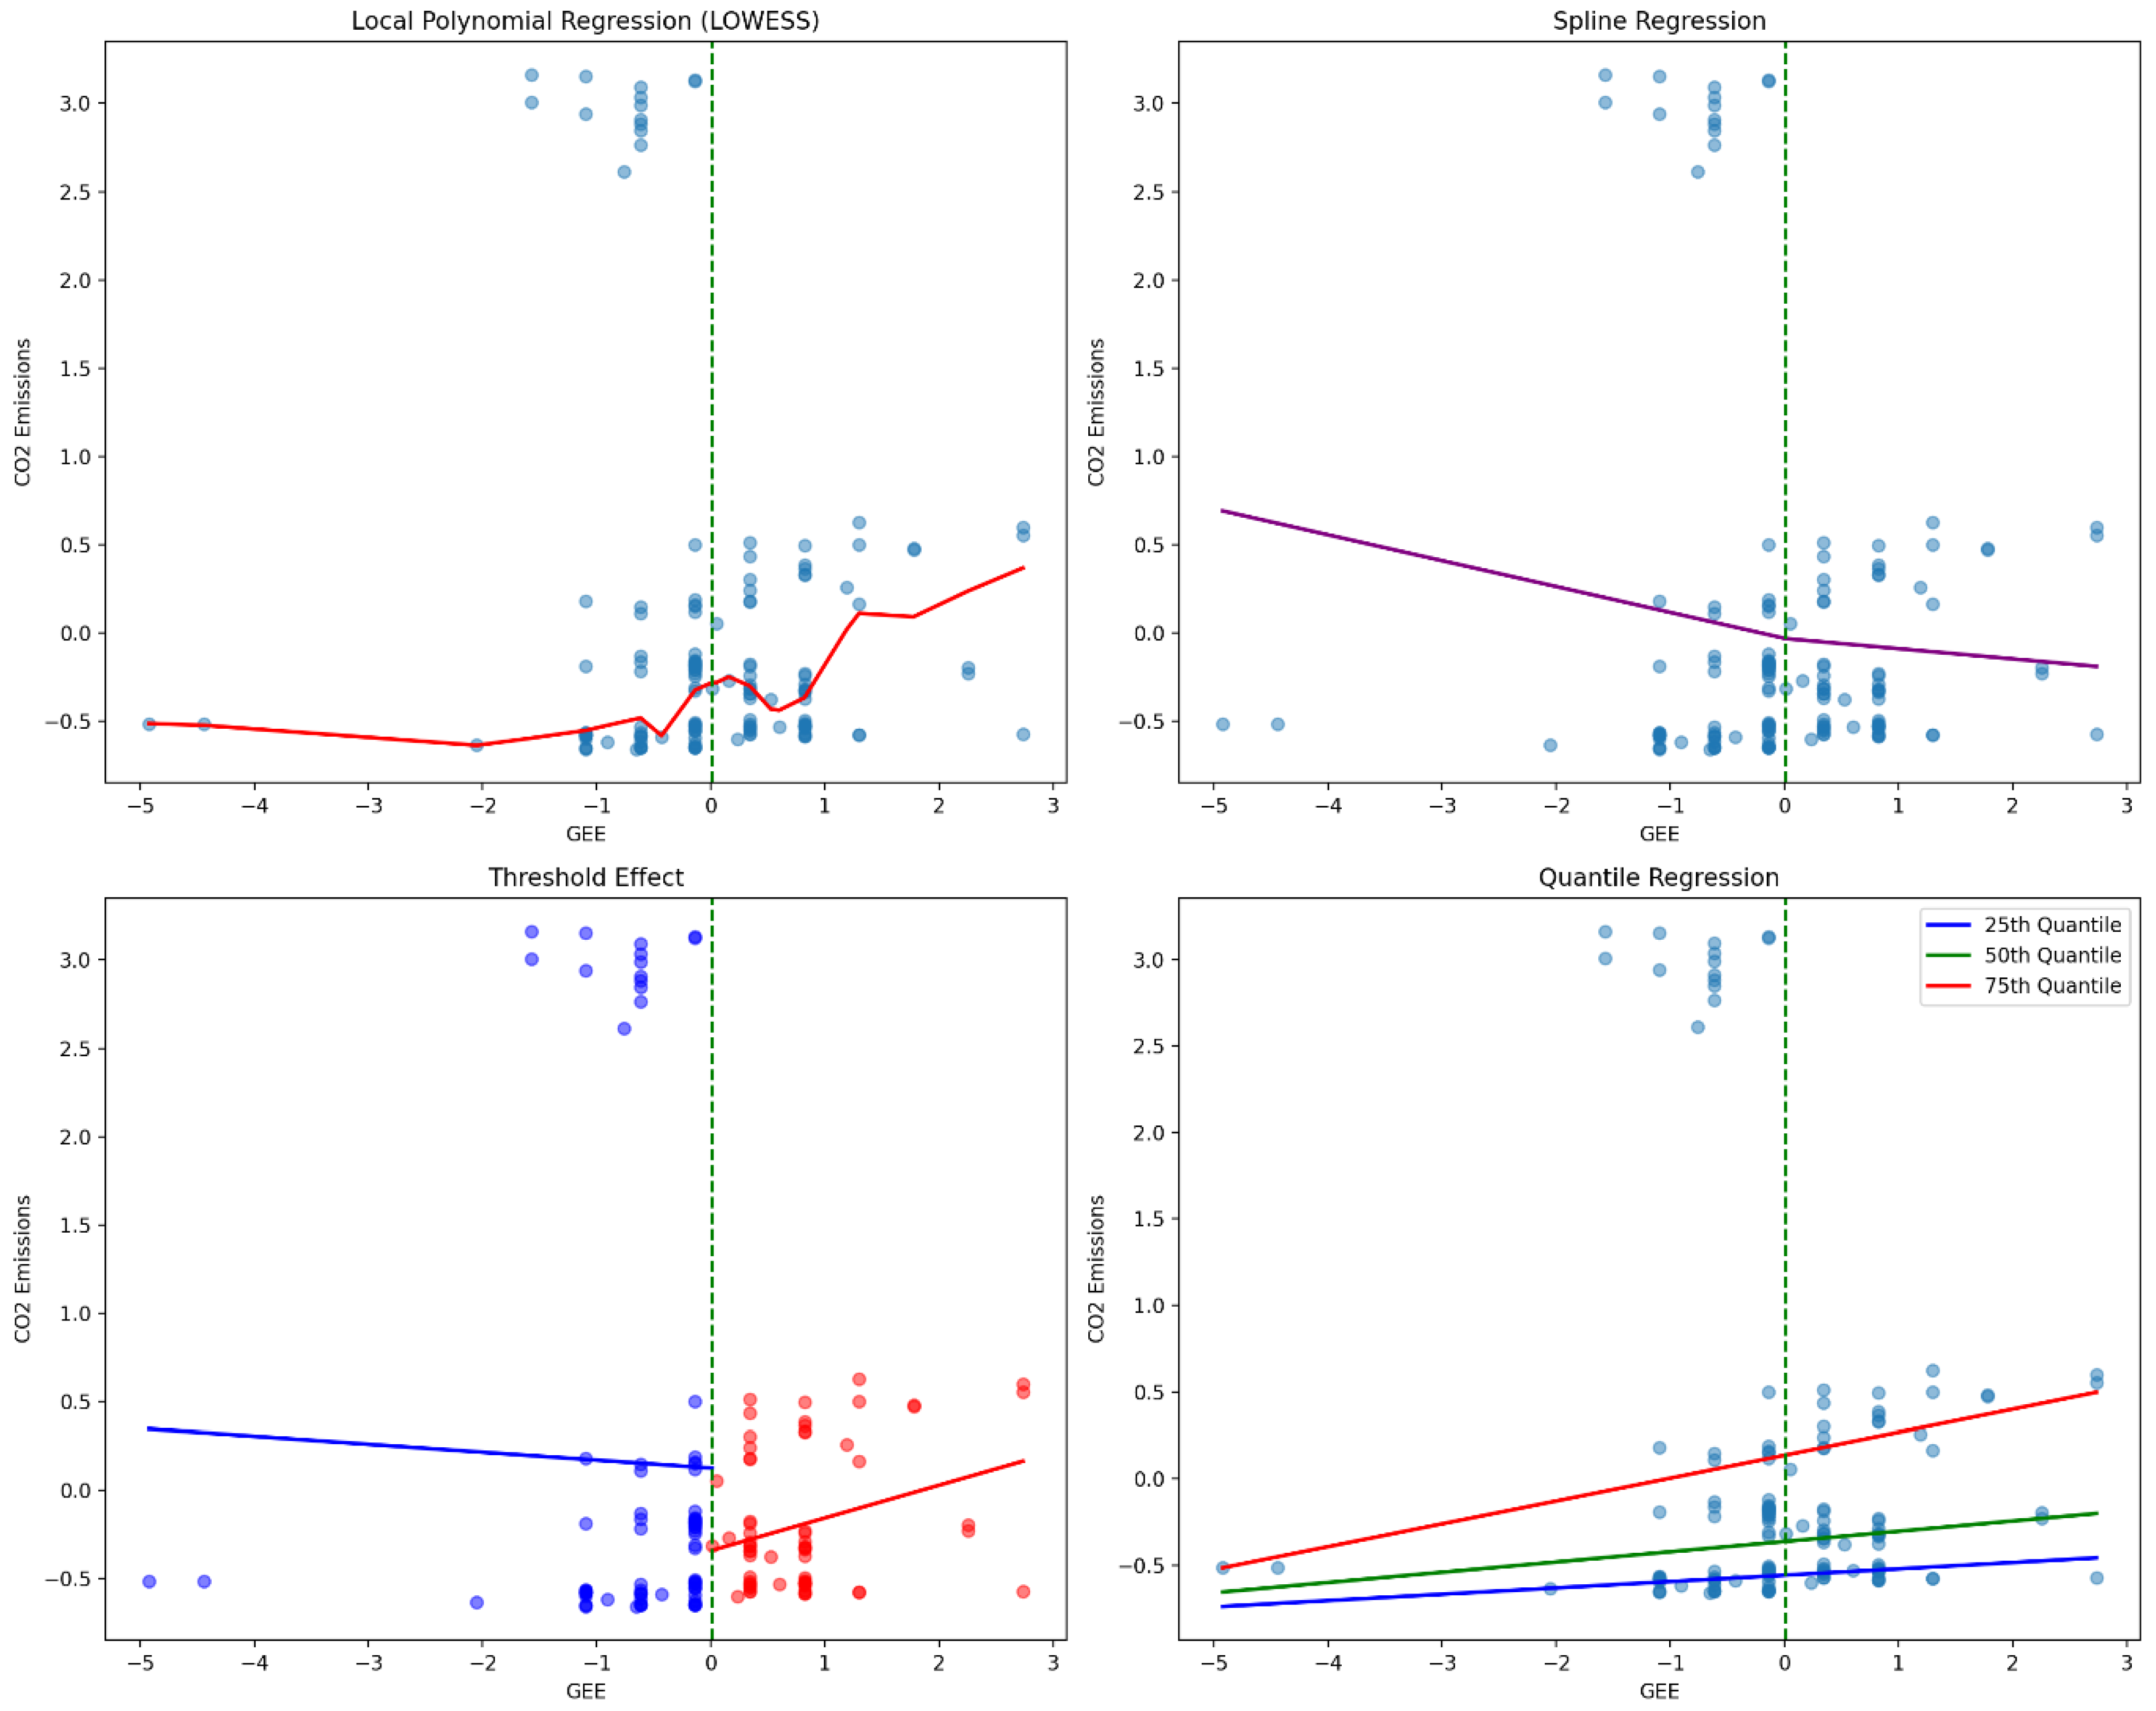
Figure 8.
Map of Spatial Spillover Effects on CO₂ Emissions.
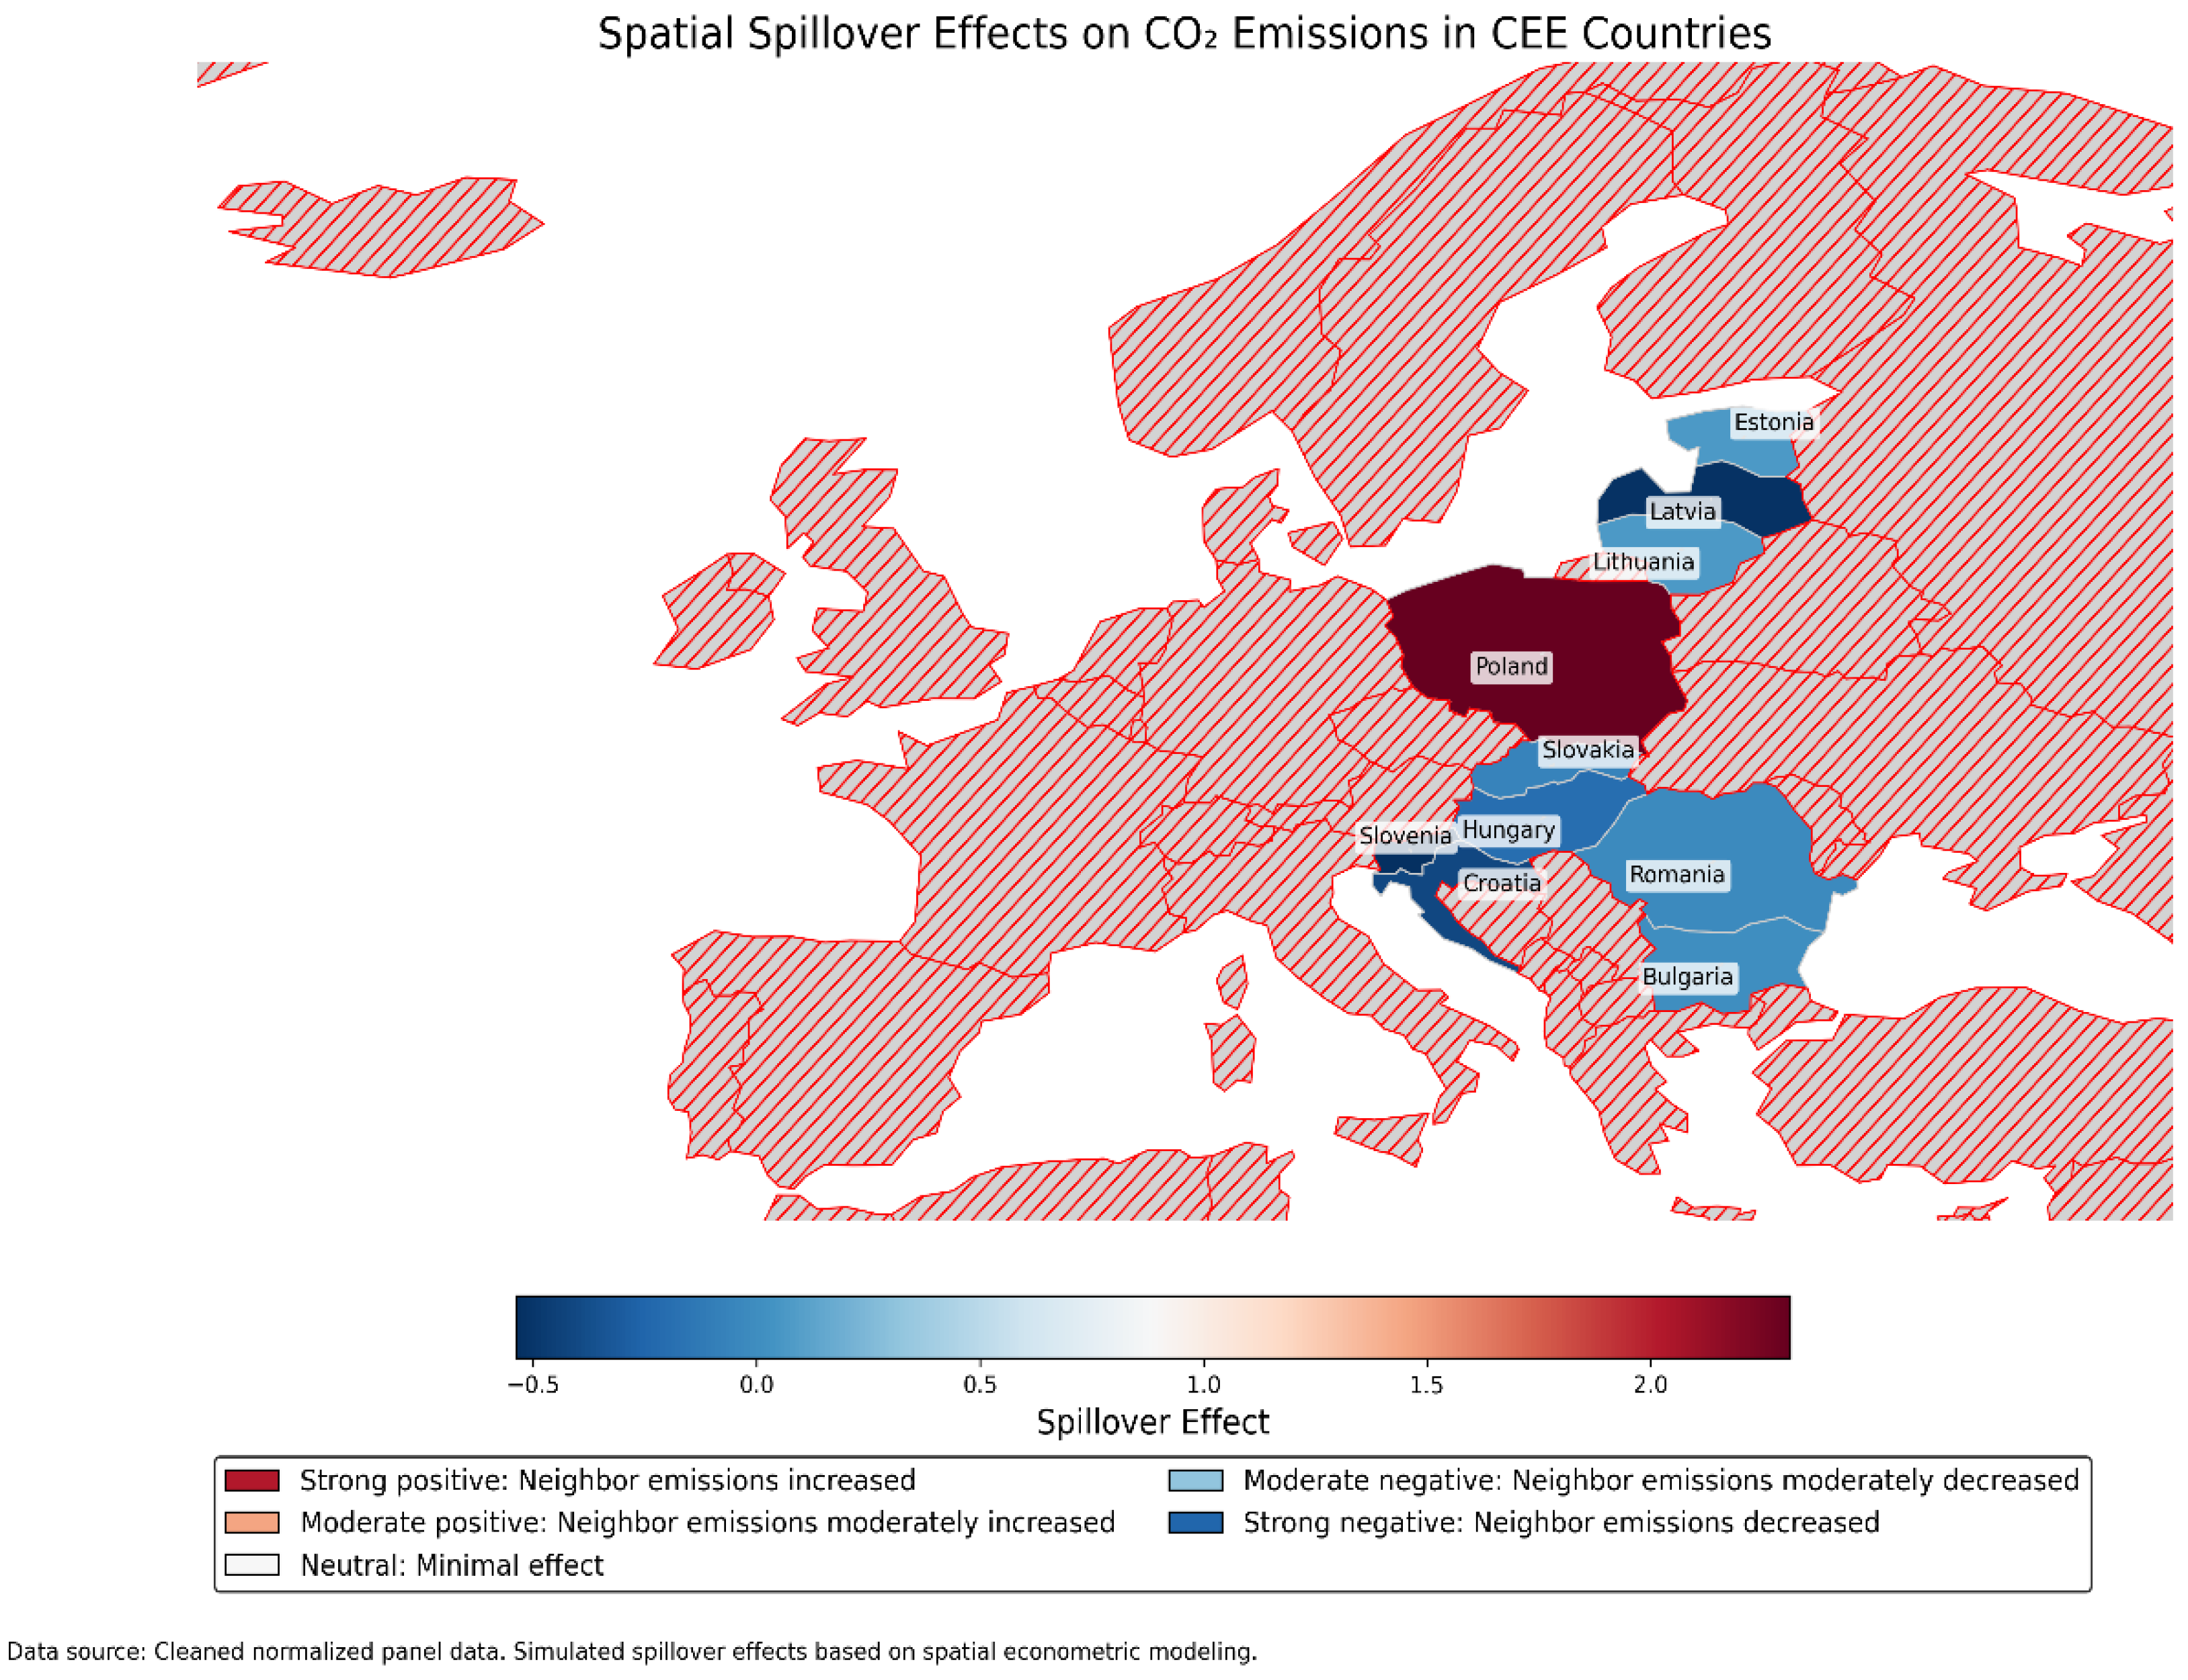
Table 1.
The list of variables used in analysis.
| Category | Indicator | Unit |
|---|---|---|
| Economic Indicators | GDP per Capita | Euro per capita, current prices |
| Economic Indicators | Labor Costs | Annual adjusted salary in Euro |
| Economic Indicators | Gross Fixed Capital Formation | Index, 2010=100 |
| Economic Indicators | Trade Openness | Total trade as a percentage of GDP |
| Energy Transition Metrics | Renewable Investments | Capacity difference from the previous year |
| Energy Transition Metrics | Grid Efficiency | Energy loss in GW/h |
| Energy Transition Metrics | Fossil Fuel Energy Consumption | TWh growth year-to-year |
| Energy Transition Metrics | Low-Carbon Energy Consumption | TWh growth year-to-year |
| Environmental Performance | CO₂ Emissions | Measured in log scale, tonnes per capita |
| Environmental Performance | Environmental Performance Index | Composite index, higher values indicate better performance |
| Environmental Performance | Government Environmental Expenditure | Percentage of GDP |
| Innovation Proxy | Renewable Energy Patents | Annual mean, extrapolated for recent years |
| Control Variables | Population Size | Millions |
| Control Variables | Country-Specific Fixed Effects | Dummy variables for each country |
Table 2.
Individual Explained Variance in PCA anlysis.
| Principal Component | Individual Explained Variance (%) | Cumulative Explained Variance (%) |
|---|---|---|
| PC1 | 35 | 35 |
| PC2 | 25 | 60 |
| PC3 | 15 | 75 |
| PC4 | 10 | 85 |
| PC5 | 5 | 90 |
| PC6 | 4 | 94 |
| PC7 | 3 | 97 |
| PC8 | 2 | 99 |
| PC9 | 1 | 100 |
Disclaimer/Publisher’s Note: The statements, opinions and data contained in all publications are solely those of the individual author(s) and contributor(s) and not of MDPI and/or the editor(s). MDPI and/or the editor(s) disclaim responsibility for any injury to people or property resulting from any ideas, methods, instructions or products referred to in the content. |
© 2025 by the authors. Licensee MDPI, Basel, Switzerland. This article is an open access article distributed under the terms and conditions of the Creative Commons Attribution (CC BY) license (http://creativecommons.org/licenses/by/4.0/).
Copyright: This open access article is published under a Creative Commons CC BY 4.0 license, which permit the free download, distribution, and reuse, provided that the author and preprint are cited in any reuse.


