
Submitted:
24 September 2025
Posted:
25 September 2025
You are already at the latest version
Abstract
Biogenic carbonate waste from seafood exploitation, primarily composed of calcium carbonate (CaCO₃), occurs in various polymorphic forms, making it valuable for envi-ronmental and biomedical applications. Mg-calcite from blue crab (Callinectes sapidus) shells is especially promising due to its 3D-ordered porosity and naturally embedded astaxanthin antioxidant, offering advantages over other calcite- or aragonite-based waste. These properties enable its use in pharmaceutical formulations and biostimulants for ac-tive compound loading and controlled release. However, long-term aged biogenic waste may experience organic degradation, potentially altering its physical, chemical, and functional performance. In this study, calibrated ball milling conditions were applied to years-aged biogenic waste to assess structural integrity, crystallinity, and functionality of the resulting powders. Notably, the antioxidant carotenoid remained preserved across all fine powders. Dynamic light scattering revealed that particle size distribution varied subtly between two milling durations (12 and 15 min) and frequencies (25 and 27 Hz). Pigmentation, crystallinity, and repurposing potential of the powders were investigated using Raman spectroscopy, X-ray diffraction (XRD), FT-IR, and SEM-EDX. Ultimately, all four powder batches showed successful conversion into phosphate minerals enriched with antioxidants when treated with phosphoric acid, highlighting the potential of aged shell waste in high-value applications under optimized mechanical and chemical condi-tions.
Keywords:
aged biogenic waste
; antioxidant preservation
; calibrated powders
; ball milling
; Raman
; XRD
; IR
; SEM-EDX
1. Introduction
Ball milling is a widely used mechanical process that facilitates the modification and synthesis of powdered materials. This technique involves grinding solid materials in a rotating drum with grinding media, leading to significant physical, chemical, and structural transformations. Ball milling enhances properties such as surface area, crystallinity, and reactivity, making it an essential tool in materials science, chemistry, and biochemistry [1,2,3,4]. Calibration of milling time and frequency allows for reproducible preparation of biogenic powders, which is crucial for consistency in downstream applications such as analysis and material fabrication [1,2].
Biogenic carbonates derived from marine organisms have gained increasing attention due to their potential across biomedical, pharmaceutical, environmental, industrial, and agricultural applications [5,6,7,8]. These materials offer a sustainable alternative for resource recovery and advanced material synthesis. The ability to control particle size and surface properties through milling, while preserving structural features of the organic-inorganic framework, supports their reuse in environmental remediation and material development [3,9,10].
Biogenic calcium carbonate occurs in several polymorphic forms—including calcite, aragonite, vaterite, and amorphous calcium carbonate (ACC)—with polymorphism strongly linked to species-specific biogenesis Crustacean-derived biogenic carbonate often displays highly porous, hierarchically structured architectures composed of calcium carbonate and embedded organic materials like chitin, proteins, pigments [5,10,11]. These features make it suitable for pollutant adsorption applications, particularly in the removal of heavy metals, dyes, and pharmaceuticals [5,6,8,12].
Ball milling enhances the adsorption potential of biogenic carbonates by reducing particle size, increasing surface area, and improving dispersion [1,3,4]. However, excessive milling can induce phase transitions or amorphization, leading to a loss of crystalline order and potentially decreasing functional performance [2,13,14,15,16]. Optimizing milling conditions is therefore critical for maintaining the balance between surface enhancement and structural stability [2,3,13].
Characterization techniques such as Raman spectroscopy, FT-IR, and X-ray diffraction (XRD) are vital for understanding these structural modifications.[15] Raman spectroscopy provides detailed vibrational data on molecular bonding and lattice distortion, while FT-IR complementary detects changes in functional groups and residual organics [16]. XRD identifies crystallographic transitions and quantifies crystallinity, which is important in evaluating the effects of milling and thermal processing [10].
Thermal treatments during food preparation, such as boiling or steaming of crustaceans, can degrade organic components and alter the physical characteristics of shells [9,10]. Cooking may promote the release of astaxanthin from crustacyanin complexes, changing the visual pigmentation and chemical makeup [11,17].Aging of cooked shell waste further impacts the material through slow degradation of organics, presenting a realistic model of landfilled biowaste [8,10,17]. Understanding these transformations is essential for assessing the reusability of long-stored waste materials.
Moreover, biogenic carbonates from post-extraction of carotenoids increased porosity, with the specific surface area from less than 10 m2/g in native shells to over 30 m2/g in treated powders [20]. These features are particularly relevant for adsorption or catalytic applications, where active surface area is a limiting factor [11,17].
Biogenic carbonates have also been successfully employed as carriers in pharmaceutical applications. Drug delivery systems using 5-fluorouracil-loaded nanoporous biogenic calcite showed controlled release behaviors and pH responsiveness [18,19]. Moreover, milling-assisted processing has enabled their integration into biofertilizers and polymer matrices for sustainable material development in various fields [20,21].
The conversion of milled biogenic carbonates into phosphate minerals (e.g., brushite, hydroxylapatite) using phosphoric acid further extends their biomedical potential [3,22,23]. These transformations preserve some aspects of the original structure, which is advantageous in bone tissue engineering and regenerative applications [22,24]. The use of crab shell waste as a phosphate precursor aligns with circular economy principles by transforming food waste into high-value biomaterials.
This study explores how various ball milling conditions (frequency, time) influence the physicochemical properties of powders from years-aged biogenic waste from crustaceans and their re-purpose for green synthesizing phosphate minerals. Raman, FT-IR, and XRD analysis, along with SEM and porosity studies, we investigate the structural, morphological, and functional evolution of these materials. The objective is to determine optimal processing routes that retain or enhance functional performance while enabling sustainable reuse of long-term stored marine biowaste. Through a holistic approach combining mechanical processing and spectroscopic analysis, this work supports the development of eco-friendly, functional materials from aged, discarded shellfish waste for their knowledge-based valorization, environmental remediation, and green, new material syntheses in alignment with blue bioeconomy and circular sustainability goals.
2. Materials and Methods
2.1. Biogenic Carbonate Waste Material
Here, five years aged biogenic waste carapace originated from an initial material stock preserved in cold and dark conditions, collected from the Adriatic coast, Croatia [] has been employed. The shells were cleaned from self-detachable dried organic membrane, washed and dried, and divided in sub stocks, relevant for calibrated ball-milling under controlled conditions as shown in Figure 1. The primary material was firstly manually crushed into smaller fragments to facilitate further ball milling (Figure 1c,d).
2.2. Ball Milling
The fragmented shell was then processed into fine powder using a Retsch Mixer Mill MM 400 ball mill, an automatic system with controlled milling time and frequency. The procedure employed six grinding balls, with parameters set at a frequency of 22 and 25 Hz and duration of 12 and 15 minutes, resulting in four groups of samples, at 25 Hz for 12 min, 25 Hz for 15 minutes, 27 Hz for 12 minutes, and 27 Hz for 15 minutes respectively. These values were selected to assess the effects of varying frequency and milling time on the powders characteristics.
2.3. Micro-Raman Spectroscopy
A Renishaw InVia Reflex Raman system (Gloucestershire, United Kingdom) with a Leica microscope and an ultra-fast Centrus detector with high sensitivity and speed has been employed. For excitation a Cobolt diode-pumped solid state laser operating at 532 nm was used. Dozens of spectra have been collected from individual powder particles from each group, using the 5× (NA 0.12 WD 13.2 mm), 20× (NA 0.35, WD 2 mm), and 100× (NA 0.9, WD 3.4 mm) microscope objectives. An edge filter has been employed to record spectra in the 50−1846 cm−1 spectral range with 0.5 cm−1 resolution. The laser power and acquisition parameters were optimized in the Wire 5.6 software to assure a reasonable signal-to-background while simultaneously recording information from mineral and organic phases of biogenic powders. Higher laser power induced higher background due to the organic counterpart fluorescence of the particles. Micrographs of the powders have been taken prior to Raman measurements using the Wire 5.6 system video camera.
2.4. Fourier Transform Infrared Spectroscopy (FT-IR)
A Shimadzu IR Spirit QATR-S2 FT-IR spectrometer (Kyoto, Japan) has been employed for powders characterization. Spectra were collected using 50 scans, in range from 400-4000 cm-1 to confirm the presence of characteristic functional groups such as amides (from chitin), carbonates (from calcium carbonate), and hydroxyl groups, providing insights into the organic and inorganic components of the aged powdered material.
2.5. X-Ray Diffraction (XRD)
XRD data have been recorded using a Bruker D8 Advance ((Bruker Company, Karlsruhe, Germany)) diffractometer in Bragg−Brentano geometry with a Cu tube with λkα = 0.15418 nm, Ni filter, and a LynxEye detector. Corundum (NIST SRM1976a) was used as an internal standard. The data were collected over the 3.8−64° 2θ interval at a 0.02° 2θ step, with 0.5 s per step. The mineral identification has been performed using the Diffrac.Eva 2.1 software with the PDF2 (release 2023) database.
2.6. Dynamic Light Scattering (DLS)
A Malvern Zetasizer Nano ZS90 particle analyzer (Malvern Instruments Ltd. Worcestershire WR14 1XZ, United Kingdom) equipped with a He-Ne laser (633 nm, 5 mW) was used to examine particle size distributions, solved in ethanol absolute. Each investigation consisted of three sets of 15 measurements which have been averaged, all taken at a scattering angle of 90° and at a temperature of 25 °C. The laser attenuation level for each measurement was selected automatically by the software. All samples have been sonicated for 90 minutes at 25 °C before measuring.
2.8. SEM-EDX
Scanning electron microscopy (SEM) coupled with energy dispersive spectroscopy (EDS) effectuated with a Hitachi SU8230 (Hitachi Company, Tokyo, Japan) equipped with an X-Max 1160 EDX element detector (Oxford Instruments, Oxford, UK). Images were taken at an acceleration voltage of 30 kV. The sample’s surface was sputtered with a gold thin film of 9 nm prior to analysis, to enhance surface conductivity and minimize charging effects under the electron beam. SEM imaging enabled detailed visualization of the powder morphology, revealing particle shape, surface texture, and aggregation states. The powders exhibited irregular granular structures, with broaden size distribution influenced by milling conditions.
2.9. Conversion of Biogenic Powders to Phosphate Minerals
Equal amounts of 0.3 g from each powder biomaterial were mixed with 600 µl of orthophosphoric acid 25%, respectively, under constant stirring at room temperature.
The four powder samples treatment with phosphoric acid has been achieved based on the stoichiometry for hydroxylapatite conversion, as previously described in our recent study [25] using the drop-by-drop acid addition to avoid excessive bubbling during effervescent reaction and to prevent ingredients pouring. In that study, we developed and optimized a sustainable route that transforms biogenic calcite into various calcium phosphate phases; and secondly, we demonstrated that Raman technology with portable instruments served as an effective, real-time, in situ analytical tool for monitoring the conversion process towards the desired phosphate mineral species.
The resulting reaction products from aged material were dried at room temperature and further analyzed.
3. Results and Discussion
3.1. Aged Biogenic Powders: Structure, Morphology and Particle Size Distribution
Given the aged waste material, their evaluation has been conducted using primary micro-Raman spectroscopy combined with optical microscopy in conjunction with their characterization using XRD, FT-IR and DLS.
3.1.1. Optical Microscopy of Powder Particles
To evaluate the morphology and particle size distribution of the crab shell powders, microscopic images were captured using a Raman spectrometer at magnifications of 5×, 20×, 50×, and 100× for each powder sample prior to Raman analysis. The four powders obtained under different milling conditions (25 Hz for 12 min, 25 Hz for 15 min, 27 Hz for 12 min, and 27 Hz for 15 min), were analyzed to assess the impact of milling parameters on particle size and uniformity. The average particle sizes optically observed at each magnification for each powder sample are summarized in Table 1 and their appearance is illustrated in the Figure 2. The powder particles appeared bright white or pinkish brown, indicating an inhomogeneous pigmentation, as expected.
Surprisingly, despite the variations in milling frequency and duration, no significant difference was optically observed in the particle sizes across the different conditions. At all magnifications (5×, 20×, 50×, and 100×), the powders exhibited similar morphology, with irregularly shaped particles and comparable, broad size distributions from about 1-2 μm to hundreds of micrometers, as illustrated in Figure 2. The images from the different samples showed that the particles were optically rather similar, with small, bright white fragments of calcite crystals mixed with larger, stronger pigmented fragments. The slightly changed milling conditions were poorly reflected in the optical microscopy appearance of biogenic powders.
3.1.2. X-Ray Diffraction (XRD) Analysis of Aged Powders
X-ray diffraction (XRD) was employed to investigate the crystallographic structure of the crab shell powders under different milling conditions. The XRD patterns (Figure 3) were obtained for all four powder samples to assess the impact of milling on the crystallinity and phase composition of the powders. They showed prominent peaks corresponding to calcium carbonate (CaCO3), specifically the calcite phase, which is the primary mineral component of the crab shell. The characteristic diffraction peaks of calcite were observed at 2θ values of approximately 29.4°, 39.4°, 43.3°, 47.5°, and 48.3°, consistent with a common XRD pattern of magnesian calcite [25] as well as with previous results obtained on mixed cuticle, samples with variable crystallinity [11], with no discernible effect of milling conditions on the overall patterns recorded.
3.1.3. Fourier Transform Infrared Spectroscopy (FT-IR) Analysis of Powders
FT-IR spectroscopy was employed to analyze the functional groups and chemical bonds characteristic to biogenic waste powders under four different milling conditions. FT-IR spectra were recorded to assess any changes in the molecular structure and surface chemistry induced by the milling process. The FT-IR spectra for all four crab shell powders (Figure 4) exhibited characteristic absorption bands corresponding to the main functional groups typically found in calcium carbonate (CaCO3) polymorphs calcite and ACC respectively, where the ACC exhibits a more prominent shoulder at 1483 cm-1 which is overlapped to characteristic band of the organic components such as proteins and chitin, present in the crab shells.
The FT-IR spectra of all four crab shell powders exhibited characteristic absorption bands corresponding to the main functional groups found in calcium carbonate (CaCO3) and organic components such as proteins and chitin [10]. The most prominent peaks observed were at 1401 cm−1, corresponding to the asymmetric stretching vibration of the carbonate (CO32−) group, and 873 cm−1, attributed to the out-of-plane bending vibration of the same group, confirming the presence of the calcite phase preservation in aged biogenic material. A multi-component broad absorption band in the 3600–3200 cm−1 region was associated with O-H stretching vibrations, likely due to surface hydroxyl groups or adsorbed moisture. Additionally, the peak at 1650 cm−1 is primarily associated with chitin, but could be also linked to C=O stretching vibrations from amide I groups, suggesting the presence of organic compounds, likely residual proteins within the powder. The spectra remained consistent across all milling conditions, with subtle changes in the area of the characteristic modes of carbonate, suggesting that the milling process did not induce chemical modifications or degradation of the material but slightly influenced the crystalline-amorphous balance. The sharpest peaks were observed for the 27 Hz_15 min milling conditions. Therefore, the asymmetric stretching mode of carbonate was used for comparison. This band has been Lorentzian deconvoluted to reveal the main component at 1401 cm-1 and an additional one at 1483 cm-1, the latter being associated with the amorphous calcium carbonate (ACC). These comparative data are illustrated in the Figure 4b, Which clearly showed that the highest carbonate band area was recorded for the highest time, highest frequency (27 Hx_15 min) while the lowest for the 25Hz_12 min. These results confirm that the structural integrity of both the inorganic and organic components in the aged crab shell powder was preserved, with slight changes in the crystalline-amorphous ratio as a function of ball milling conditions.
3.1.4. Micro-Raman Spectroscopy of Aged Powders
Raman spectroscopy was utilized to examine the structural composition and vibrational characteristics of powders particles processed under the four different milling conditions aiming to assess the status of both the mineral and native pigments and their possible changes during waste aging and subsequent milling. Examples of raw Raman data of powders particles, the procedure to compare them among each other and further to compare the material with the fresh biogenic material are showed in the Figure 5. Micro-Raman spectra excited with 532 nm of the four powders resulted from the aged biogenic material milling under different conditions showed in each sample three distinct cases: i) typical powder particles exhibiting only mineral bands, ii) particles with pigment bands only and strong fluorescence background completely covering the mineral signal, and iii) particles with both mineral and pigment bands. Such examples are illustrated in the Figure 5A, collected from the finest milled sample (27 Hz for 15 min). This inhomogeneity is not surprisingly, since we showed earlier that the pigments are abundantly distributed mainly in the exocuticle of the native crustacean [11]. In native, fresh shells, carotenoid content, which is proportional with the intensity of the v1 Raman band of the C=C stretching mode, displays a variable distribution in exocuticle, peaking a maximum at about 10 to 20 μm below the cuticle outer surface. Thus, powder particles bearing high pigment content are clearly resulted from exocuticle layer of the fragments.
Surprisingly, all the powders showed preserved carotenoids as comparatively showed in the Figure 5C. Moreover, their peak at about 1513 cm-1 is consistent with the carotenoid band in fresh shell or in aged fragments, indicating that the natural degradation of organic counterpart accompanied by the characteristic volatile compounds generating specific smell, does not affect the carotenoids. Their preservation in such intricated biomaterial during aging might raise additional added-value to these materials, as naturally embedded with powerful antioxidant preserved after years of aging. These findings might open additional biomedical applications.
Data processing for comparative analyses of the powders implied collecting dozens of micro-Raman spectra of fine particles from each stock and calculating their averaged Raman signal, as indicated in the Figure 5B. Their averaged (red line) spectrum was further taken for comparison among powders stocks. Particles with strong resonance Raman signal of carotenoids (black lines) and particles with stronger calcite bands (blue line) were observed in all four stocks. The background subtracted signal of the averaged spectra are comparatively displayed in the Figure 5C, after normalization to unit, for the four powders plotted in color codes as indicated, for milling at 25 Hz for 12 min, 25 Hz for 15 min, 27 Hz for 12 min, and 27 Hz for 15 min, respectively, compared to the RR signal of pure astaxanthin (green line) and with signal of fresh biogenic material (light blue line). As showed in the Figure 5D, Zoomed-in view of the 900-1700 cm-1 range of the averaged, raw spectra of the four powders, compared with the signal from an aged shell fragment (not milled) and one fresh fragment (light blue line), suggesting a slight broadening in the carotenoid profile band in aged fragment or powders.
3.1.5. Dynamic Light Scattering (DLS) Analysis
The particle size distribution of the crab shell samples was analyzed using Dynamic Light Scattering (DLS). Basically, the preliminary DLS data showed that the distribution is affected by the sedimentation behavior of the particles and the large size distribution present within the samples. DLS analysis (Figure 6) revealed two primary peaks in the size distribution, one at approximately 255 nm and another at around 1290 nm. DLS algorithms attempt to fit the autocorrelation data into a limited number of discrete peaks, often oversimplifying the actual size distribution and failing to capture the full complexity of the sample. This is especially problematic when the particle population spans a broad range, from hundreds to several thousand nanometers, as the inversion algorithms are not well-suited for resolving continuous or polydisperse distributions. In our case, for example, the DLS output consistently shows distinct peaks around 255 nm and 1290 nm, with no other peaks in between, even though we believe that there is no reason for intermediate-sized particles not to exist. This gap is likely an artifact of the fitting process, where the algorithm resolves only the dominant modes it can detect with confidence, disregarding less well-defined or overlapping size contributions. A third peak cut off at about 5500 nm suggests large particles which cannot stay within dispersion and produced sedimentation.
Within the peak intensity distribution for the two different milling times and frequency (Figure 6b,c), the third peak was cut off due to limitations in the software, which is programmed to calculate the distribution with a bias toward smaller particles. As a result, larger particles beyond 5000 nm could exist in the sample. The software has limitations when measuring large particle size distribution simultaneously in the sub-micrometer range and those larger than 5000 nm, leading to truncation of the size distribution at this point. To provide a relative comparison, the intensity of the 5000 nm peak could be however used as an indicator of the number of larger particles present in the sample. A higher intensity in this region suggests a greater abundance of very large particles.
Overall, while the DLS analysis offers valuable insight into the size distribution of the biogenic particles, the limitations of the measurement technique and software may influence the accuracy, particularly for larger particles beyond the 5000 nm cutoff.
Given the results, the size distribution found with DLS in submicrometer range (nanoparticles) could support the findings regarding crystallite size reduction suggested via XRD (Figure 3B).
3.2. Conversion of Aged Biogenic Calcite into Phosphate Minerals
The four powders treated with phosphoric acid following the stoichiometry for hydroxylapatite conversion, generated under careful drop by drop procedure to avoid pouring, an effervescent material which rapidly revealed under optical microscopy a typical morphology of brushite crystals growing on calcite particles. Thus, as a preliminary evaluation of the process, we used the comparative FT-Raman analyses of starting material and of the conversion product. The reason for using FT-Raman with 1064 nm laser excitation was the strong fluorescence of the conversion product under visible laser line excitation.
3.2.1. FT-Raman Analysis of Starting Material and Hydrothermal Conversion Product
We compared the pigment and mineral Raman bands profile in non-resonance conditions, using the NIR excitation at 1064 (FT-Raman technique) which offered the advantage of low background and a reliable organic to inorganic band ratio, reflecting the non-resonance contribution of the pigments, mineral and chitin to the overall Raman spectra of the bulk powders content. Further, the conversion product tracking was assessed using the starting powders as reference signal to evaluate the involution of carbonate Raman band in favors of phosphate stretching mode increasing. The recorded FT-Raman spectra for all four powders samples (Figure 7a) displayed, as expected, key peaks associated with the calcite phase of magnesian calcium carbonate in agreement with the micro-Raman spectra excited with 532 nm (Figure 5), but with advantage of much lower fluorescence background. The drawback of the NIR excitation is the low intensity of detected carotenoids, however, still relevant for the non-resonance excitation. Under NIR excitation at 1064 nm, the most intense Raman signal from powders is due to the carbonate mode at 1085 cm−1. Additional characteristic bands of calcite are clearly visible at 711 cm−1 (in-plane bending, ν4), as well as the lattice modes at 280 and 154 cm−1.
Following the phosphoric acid treatment, the reaction products were characterized using FT-Raman spectroscopy and micro-Raman with 785nm excitation. The FT-Raman spectra of the four conversion products (Figure 7b) displayed a combination of residual calcite signatures and distinct phosphate bands, aligning with the reference spectrum of brushite (CaHPO4•2H2O) from the RRUFF database (RRUFF ID: R070554). Figure 8b displays the FT-Raman spectra of the same samples after phosphoric acid treatment, where bands corresponding to brushite (879 and 986 cm−1), and carotenoids (1151 and 1515 cm−1) are evident. The emergence of strong bands at 879 cm−1 (HPO42− bending) and 986 cm−1 (ν1 symmetric stretching of HPO42−) correspond well with the characteristic modes of brushite. The dominance of the phosphate bands in the FT-Raman spectrum of conversion product confirmed the successful chemical transformation of calcite into a hydrated calcium phosphate phase. Still, remnant calcite bands at 711 cm−1 and 1083 cm−1 were observed, indicating incomplete reaction of the original biogenic material.
Under 785 nm excitation, still considerable background in the microRaman spectra of the conversion product is observed, but two weak bands, presumably attributable to trace of calcite and ACC were noted in spectra. (Supplementary Figure S2)
Notably, the bands at 1515 and 1151 cm−1, assigned to carotenoids [11,15], highlighted the preservation of these important antioxidants during the reaction and demonstrated the occurrence of an “antioxidant-enriched phosphate mineral”, highlighting the bio-carbonate origin of the starting material.
Carotenoid preservation post-conversion was unexpected and may open promising perspectives on synthesis of attractive biomineral components for the bone substitutes field.
The FT-Raman spectra (Figure 7b) indicated the presence of all the Raman bands of brushite(CaHPO4•2H2O), with strong bands at 986 and 879 cm−1, along with other weaker bands at 585, 522, 413, 379, 206, 176 cm-1. In addition, weaker, residual calcite band are still observed, suggesting a small amount of unreacted calcite remains. The carotenoid bands also appear in the final product, with relative intensities comparable to the strongest spectral bands, indicating that the carotenoids were preserved during the phosphoric acid treatment of biogenic powders.
To assess the influence of milling time and frequency on the conversion of calcite to calcium phosphate, the intensities of the two main bands—986 cm−1 (HPO42−) and 1083 cm−1 (CO32−)—were measured for each sample.
From the plot in Figure 7D one can observe that for the first three samples (25 Hz x 12 min, 25 Hz x 15 min, 27 Hz x 12 min) the conversion rate defined by the phosphate / carbonate band ratios is increasing as the milling time and the frequency increases (and powder particle size decreases), as expected as lower powder particle sizes have a higher surface area available for reaction.
Overall, the conclusion is that brushite is the dominant crystalline phase formed from all tested powders, regardless of their size distribution. Slight variations in Raman band intensities across the four conversion products suggest differences in conversion efficiency and slightly different residual biogenic content, influenced by processing conditions.
3.2.2. X-Ray Diffraction Analysis of Conversion Product
The structural transformation of biogenic calcite during its conversion into phosphate minerals is illustrated in the XRD profiles of the four products (Figure 8), with the nearly complete disappearance of calcite-specific peaks and the appearance of new reflections that matched well with the standard pattern of brushite (CaHPO4•2H2O), as indexed in the in the ICDD PDF2 database [27]. The formation of brushite across all samples suggests an efficient ion-exchange process under the applied reaction conditions, where calcium ions from calcite reacted with phosphate species to yield a stable calcium phosphate phase. Notably, the newly formed brushite has clear and sharp diffraction features, implying that the conversion proceeded without significant amorphization. This preservation of crystalline order throughout the transformation process reflects a controlled reaction mechanism that maintains structural integrity, which is particularly advantageous for applications requiring defined crystallinity, such as in bone grafting or bioactive material development. These findings demonstrate the potential of aged biogenic calcite waste as a valuable precursor for producing functional phosphate-based biomaterials through processing routes in line with blue bioeconomy concepts.
3.2.3. SEM-EDX Scanning Electron Microscopy
Scanning electron microscopy (SEM) was used to examine the morphology of the phosphate crystals obtained from the conversion of biogenic powders milled under different conditions. All samples exhibited characteristic dicalcium phosphate dihydrate (brushite CaHPO4•2H2O) crystal habitus, appearing as flower-like (Figure 9), radially oriented (commonly after the (010) plane) monoclinic-prismatic crystals elongated on the c-axis, with well developed (100), (010) and (001) faces, the (101) type occurring only sporadically. The individual crystals are generally up to 10 µm long, with a thickness ranged between 0.3 and 2 µm, forming dense and layered textures visible across all four samples. No major morphological differences were observed among the four samples, suggesting that brushite formation was consistent regardless of the milling parameters.
Energy-dispersive X-ray spectroscopy (EDX), confirmed the presence and spatial distribution of calcium (Ca), phosphorus (P), and oxygen (O), consistent with the brushite composition already determined by XRD, as showed for example in the brushite resulted from the sample 25 Hz_12 min in the Figure 10. Elemental mapping showed close enough 1:1 ratio of Ca and P throughout the mineral phase, with minimal residual carbon, indicating efficient conversion from biogenic calcite to calcium phosphate. A comparative analysis of elemental ratios at different milling frequencies further supports these findings, as shown in Supplementary Figure S3, which illustrates the variations in Ca:P and Ca:C ratios. These microstructural and compositional analyses reinforce the successful transformation pathway and support the material’s potential for biomedical reuse.
4. Conclusions
This study reports for the first time the effects of calibrated ball milling of aged biogenic carbonate materials derived from crustacean shells, as a complex mineral-organic framework, where the expected organic counterpart degradation in aged material, particularly of the carotenoids in the intricate 3D porous structure, was unexpectedly absent. Advanced characterization techniques, including Raman spectroscopy, FT-IR, XRD, DLS and SEM-EDX, were employed to analyze controlled milling-induced transformations. DLS analysis revealed a broad size distribution in milled samples, with sedimentation effects influencing measurement reliability. This research highlights the potential of ball-milled crab shell carbonate as a sustainable material for environmental and biomedical applications while addressing challenges related to crystallinity, porosity and preservation or the organic components identity during frequency and time change in ball milling settings. The findings contribute to a broader understanding of the mechanical processing effects on biogenic materials, offering insights for optimizing their reuse according to the resulted powder purpose.
This study has provided valuable insights into the effects of different ball milling conditions on the structural and functional properties of aged biogenic carbonate from crustacean waste crab shells. Slight variations in milling parameters, including frequency and duration, induced subtle changes in the particle size distribution, indicating that the calibrated milling conditions impact on particle size and functionality. The Raman, FT-IR, and XRD analyses revealed that the primary crystalline phase of calcium carbonate, primarily in the form of calcite, remained stable across all milling conditions. The presence of astaxanthin, a natural pigment in the crab shells, was confirmed via Raman spectroscopy, with no significant degradation or structural alteration observed in aged material during milling.
Overall, this study demonstrates that the ball milling process, when conducted under the conditions examined, does not significantly alter the structure or chemical integrity of biogenic carbonate. This suggests that milling can be optimized without compromising the material’s adsorption potential or other functional properties. Further research may be needed to explore how more extreme milling conditions (much longer, higher frequencies) could impact on the functionality of the powder, particularly in terms of surface reactivity and application in fields such as environmental remediation and biomedical engineering.
Supplementary Materials
The following supporting information can be downloaded at the website of this paper posted on Preprints.org. Figure S1. Carbonate stretching mode from the FT-RAMAN spectra of biogenic powders obtained under different milling time and frequency, as indicated, and their comparative analysis of crystalline/amorphous ratio from band profile. Deconvolution clearly indicated the ACC and crystalline counterpart in each sample. Figure S2. Micro-Raman spectra of phosphate-converted biogenic powders previously milled under different conditions, as indicated by color codes: 25 Hz for 12 min, 25 Hz for 15 min, 27 Hz for 12 min, 27 Hz for 15 min. The reference Raman spectrum of brushite RRUFF ID: RO70554 recorded with 785 nm excitation (unoriented) is showed in the top. Figure S3. Comparison of the Phosphorus-to-Calcium and Calcium-to-Carbon ratios calculated from the EDX data of the reaction product (brushite), corresponding to the starting powders with milling frequencies of 25 Hz and 27 Hz, for the two milling times of 12 and 15 min, respectively.
Author Contributions
Conceptualization, I.B. and S.P.; methodology, I.B., and S.P.; software, I.B, and S.P; validation, I.B., S.P.; formal analysis, I.B., S.P., G.L. and K.M.; investigation, I.B, S.P., K.M., G.L., C.C., T.T.,and L.T.; resources, I.B. and S.P.; data curation, I.B., S.P., K.M. G.L., C.C., T.T., and L.T; writing—original draft preparation, I.B., S.P., K.M., and G.L.; writing—review and editing, I.B. and S.P.; visualization, I.B., S.P., C.C., T.T., and L.T.; supervision, I.B and S.P.. All authors have read and agreed to the published version of the manuscript.
Funding
This research received no external funding.
Institutional Review Board Statement
Not applicable.
Informed Consent Statement
Not applicable.
Data Availability Statement
The original contributions presented in this study are included in the article. Further inquiries can be directed to the first and corresponding author.
Acknowledgments
The authors acknowledge the Renishaw Raman system maintenance that was supported by the STAR-UBB-N Academic Research Network of Excellence, ID PFE-550, contract no. 21PFE/30.12. 2021, funded by the Ministry of Research, Innovation and Digitization following the competition published in 2021, for Institutional Development Projects – Projects to Fund Excellence in RDI (PFE-RDI).
Conflicts of Interest
The authors declare no conflicts of interest.
Abbreviations
The following abbreviations are used in this manuscript:
| FT-IR | Fourier transform infrared spectroscopy |
| DLS | Dynamic light scattering |
| SEM-EDX | Scanning Electron Microscopy -Energy Dispersive X-ray Spectroscopy |
References
- Gao, P.; Fan, X.; Sun, D.; Zeng, G.; Wang, Q.; Wang, Q. Recent Advances in Ball-Milled Materials and Their Applications for Adsorptive Removal of Aqueous Pollutants. Water 2024, 16, 1639. [Google Scholar] [CrossRef]
- Advanced characterization techniques for the analysis of ball-milled materials: Focus on carbonates. Mater. Charact. 2021, 178, 110651. [CrossRef]
- de Lima, M.S.G.B.L.; Silva, T.R.M.P.; Mendonça, L.F.B. Mechanochemical Processing of Biogenic Carbonates and Its Application in Wastewater Treatment. J. Environ. Manag. 2022, 311, 113368. [Google Scholar] [CrossRef]
- Effect of ball-milling to the surface morphology of CaCO3. AIP Conf. Proc. 2018, 1963, 020057. [CrossRef]
- Azarian, M.H.; Sutapun, W. Biogenic Calcium Carbonate Derived from Waste Shells for Advanced Material Applications: A Review. Front. Mater. 2022, 9, 1024977. [Google Scholar] [CrossRef]
- Mihai, S.; Bondarev, A.; Necula, M. The Potential of Biogenic Materials as Sustainable and Environmentally Benign Alternatives to Conventional Adsorbents for Dyes Removal: A Review. Processes 2025, 13, 589. [Google Scholar] [CrossRef]
- Filipa, A. Vicente, Sonia P.M. Ventura, Helena Passos, Ana C.R.V. Dias, Mario A. Torres-Acosta, Uroš Novak, Blaž Likozar, Crustacean Waste Biorefinery as a Sustainable Cost-Effective Business Model. Chemical Engineering Journal, 2022, 442(2), 135937. [CrossRef]
- Nekvapil, F.; Stegarescu, A.; Lung, I.; Hirian, R.; Cosma, D.; Levei, E.; Soran, M.-L. A Novel Nanoporous Adsorbent for Pesticides Obtained from Biogenic Calcium Carbonate Derived from Waste Crab Shells. Nanomaterials 2023, 13, 3042. [Google Scholar] [CrossRef] [PubMed]
- Zhou, X.; Liu, W.; Liu, D.; Wang, L.; Wang, Y. Biogenic Calcium Carbonate with Hierarchical Organic–Inorganic Composite Structure Enhancing the Removal of Pb(II) from Wastewater. ACS Appl. Mater. Interfaces 2017, 9, 25830–25839. [Google Scholar] [CrossRef] [PubMed]
- Ogresta, L.; Nekvapil, F.; Tămaș, T.; Barbu-Tudoran, L.; Suciu, M.; Hirian, R.; Aluaș, M.; Lazar, G.; Levei, E.; Glamuzina, B.; Pinzaru, S.C. Rapid and Application-Tailored Assessment Tool for Biogenic Powders from Crustacean Shell Waste: Fourier Transform-Infrared Spectroscopy Complemented with X-ray Diffraction, Scanning Electron Microscopy, and Nuclear Magnetic Resonance Spectroscopy. ACS Omega 2021, 6, 26487–26502. [Google Scholar] [CrossRef] [PubMed]
- Nekvapil, F.; Pinzaru, S.C.; Barbu-Tudoran, L.; Suciu, M.; Glamuzina, B.; Tămaș, T.; Chiș, V. Color-Specific Porosity in Double Pigmented Natural 3D-Nanoarchitectures of Blue Crab Shell. Sci. Rep. 2020, 10, 6002. [Google Scholar] [CrossRef] [PubMed]
- Du, X.; Tang, C.; Yang, X.; Cheng, J.; Jia, Y.; Yang, S. High-Efficiency Biogenic Calcium Carbonate for Adsorption of Pb(II) and Methyl Orange from Wastewater. J. Inorg. Mater. 2020, 35, 349–358. [Google Scholar] [CrossRef]
- Nanocrystalline and Amorphous Calcium Carbonate from Waste Seashells by Ball Milling Mechanochemistry Processes. Cryst. Growth Des. 2023, 24(11). [CrossRef]
- Effects of Rotation Speed and Media Density on Particle Size Distribution and Structure of Ground Calcium Carbonate in a Planetary Ball Mill. Adv. Powder Technol. 2014, 26(2). [CrossRef]
- Nekvapil, F.; Mihet, M.; Lazar, G.; Pinzaru, S.C.; Gavrilović, A.; Ciorîță, A.; Levei, E.; Tamaș, T.; Soran, M.-L. Comparative Analysis of Composition and Porosity of the Biogenic Powder Obtained from Wasted Crustacean Exoskeletons after Carotenoids Extraction for the Blue Bioeconomy. Water 2023, 15, 2591. [Google Scholar] [CrossRef]
- Lazar, G.; Nekvapil, F.; Bajama, I. ; Tamas, T; Suciu, M; Barbu-Todoran, L; Grđan, S; Cinta Pinzaru, S; Dupont, S; Bratoš Cetinić, A. Effects of Ocean Acidification on the Morphology and Structure of Hexaplex trunculus Sea Snail Shell Biomaterial Revealed by Raman, XRD and SEM-EDX Data. In Proceedings of the 14th International Conference on Physics of Advanced Materials (ICPAM-14). Dubrovnik, Croatia, 8–15 September 2022. [Google Scholar] [CrossRef]
- Bajama, I.; Andronie, L.; Pinzaru, S.C. Drug-Drug Interaction: The Case of Flubendazole and Doxycycline Hyclate Investigated by Raman Spectroscopy. Asian J. Phys. 2022, 31, 10–19. [Google Scholar] [CrossRef]
- Lazar, G.; Nekvapil, F.; Glamuzina, B.; Tamas, T.; Barbu-Tudoran, L.; Suciu, M.; Pinzaru, S.C. Novel Drug Carrier: 5-Fluorouracil Formulation in Nanoporous Biogenic Mg-Calcite from Blue Crab Shells—Proof of Concept. ACS Omega 2021, 6, 26503–26514. [Google Scholar] [CrossRef] [PubMed]
- Lazar, G.; Nekvapil, F.; Glamuzina, B.; Tămaș, T.; Barbu-Tudoran, L.; Suciu, M.; Pinzaru, S.C. pH-Dependent Behavior of Novel 5-FU Delivery System in Environmental Conditions Comparable to the Gastro-Intestinal Tract. Pharmaceutics 2023, 15, 1011. [Google Scholar] [CrossRef]
- Nekvapil, F.; Ganea, I.-V.; Ciorîță, A.; Hirian, R.; Tomšić, S.; Martonos, I.M.; Pinzaru, S.C. A New Biofertilizer Formulation with Enriched Nutrients Content from Wasted Algal Biomass Extracts Incorporated in Biogenic Powders. Sustainability 2021, 13, 8777. [Google Scholar] [CrossRef]
- Hou X, Zhang L, Zhou Z, Luo X, Wang T, Zhao X, Lu B, Chen F, Zheng L. Calcium Phosphate-Based Biomaterials for Bone Repair. J Funct Biomater. 2022 Oct 14;13(4):187. [CrossRef]
- Yoshimura, M.; Sujaridworakun, P.; Koh, F.; Fujiwara, T.; Pongkao, D.; Ahniyaz, A. Hydrothermal Conversion of Calcite Crystals to Hydroxyapatite. Mater. Sci. Eng. C 2004, 24, 521–525. [Google Scholar] [CrossRef]
- Curry, N.A.; Jones, D.W. Crystal Structure of Brushite, Calcium Hydrogen Orthophosphate Dihydrate: A Neutron-Diffraction Investigation. J. Chem. Soc. A 1971, 3725–3729. [Google Scholar] [CrossRef]
- Turnbull, G.; Clarke, J.; Picard, F.; Riches, P.; Jia, L.; Han, F.; Li, B.; Shu, W. 3D Bioactive Composite Scaffolds for Bone Tissue Engineering. Bioact. Mater. 2018, 3, 278–314. [Google Scholar] [CrossRef] [PubMed]
- Geza Lazar; Tudor Tămaş; Lucian Barbu-Tudoran; Monica Venter; Ilirjana Bajama; Simona Pinzaru, Biowaste valorisation: Conversion of Crab Shell-Derived Mg-Calcite into Calcium Phosphate Minerals Controlled by Raman Spectroscopy, submitted, ID: JMSC-D-25-05597.
- Falini, G.; Fermani, S.; Gazzano, M.; Ripamonti, A. Structure and morphology of synthetic magnesium calcite. J. Mater. Chem. 1998, 8(4), 1061–1065. [Google Scholar] [CrossRef]
- Curry, N.A.; Jones, D.W. Crystal Structure of Brushite, Calcium Hydrogen Orthophosphate Dihydrate: A Neutron-diffraction Investigation. Journal of the Chemical Society A: Inorganic, Physical, Theoretical. 1971, 3725-3729. [CrossRef]
Figure 1.
Images of the sample appearance during the steps performed for processing the raw material, represented by the aged biogenic waste: a), b) Cooked crab shell before and after selecting suitable fragments; c) cleaned raw material; d) Cleaned and mechanically crushed material; e) Biogenic powder obtained through the ball milling process; f) obtained powder samples.
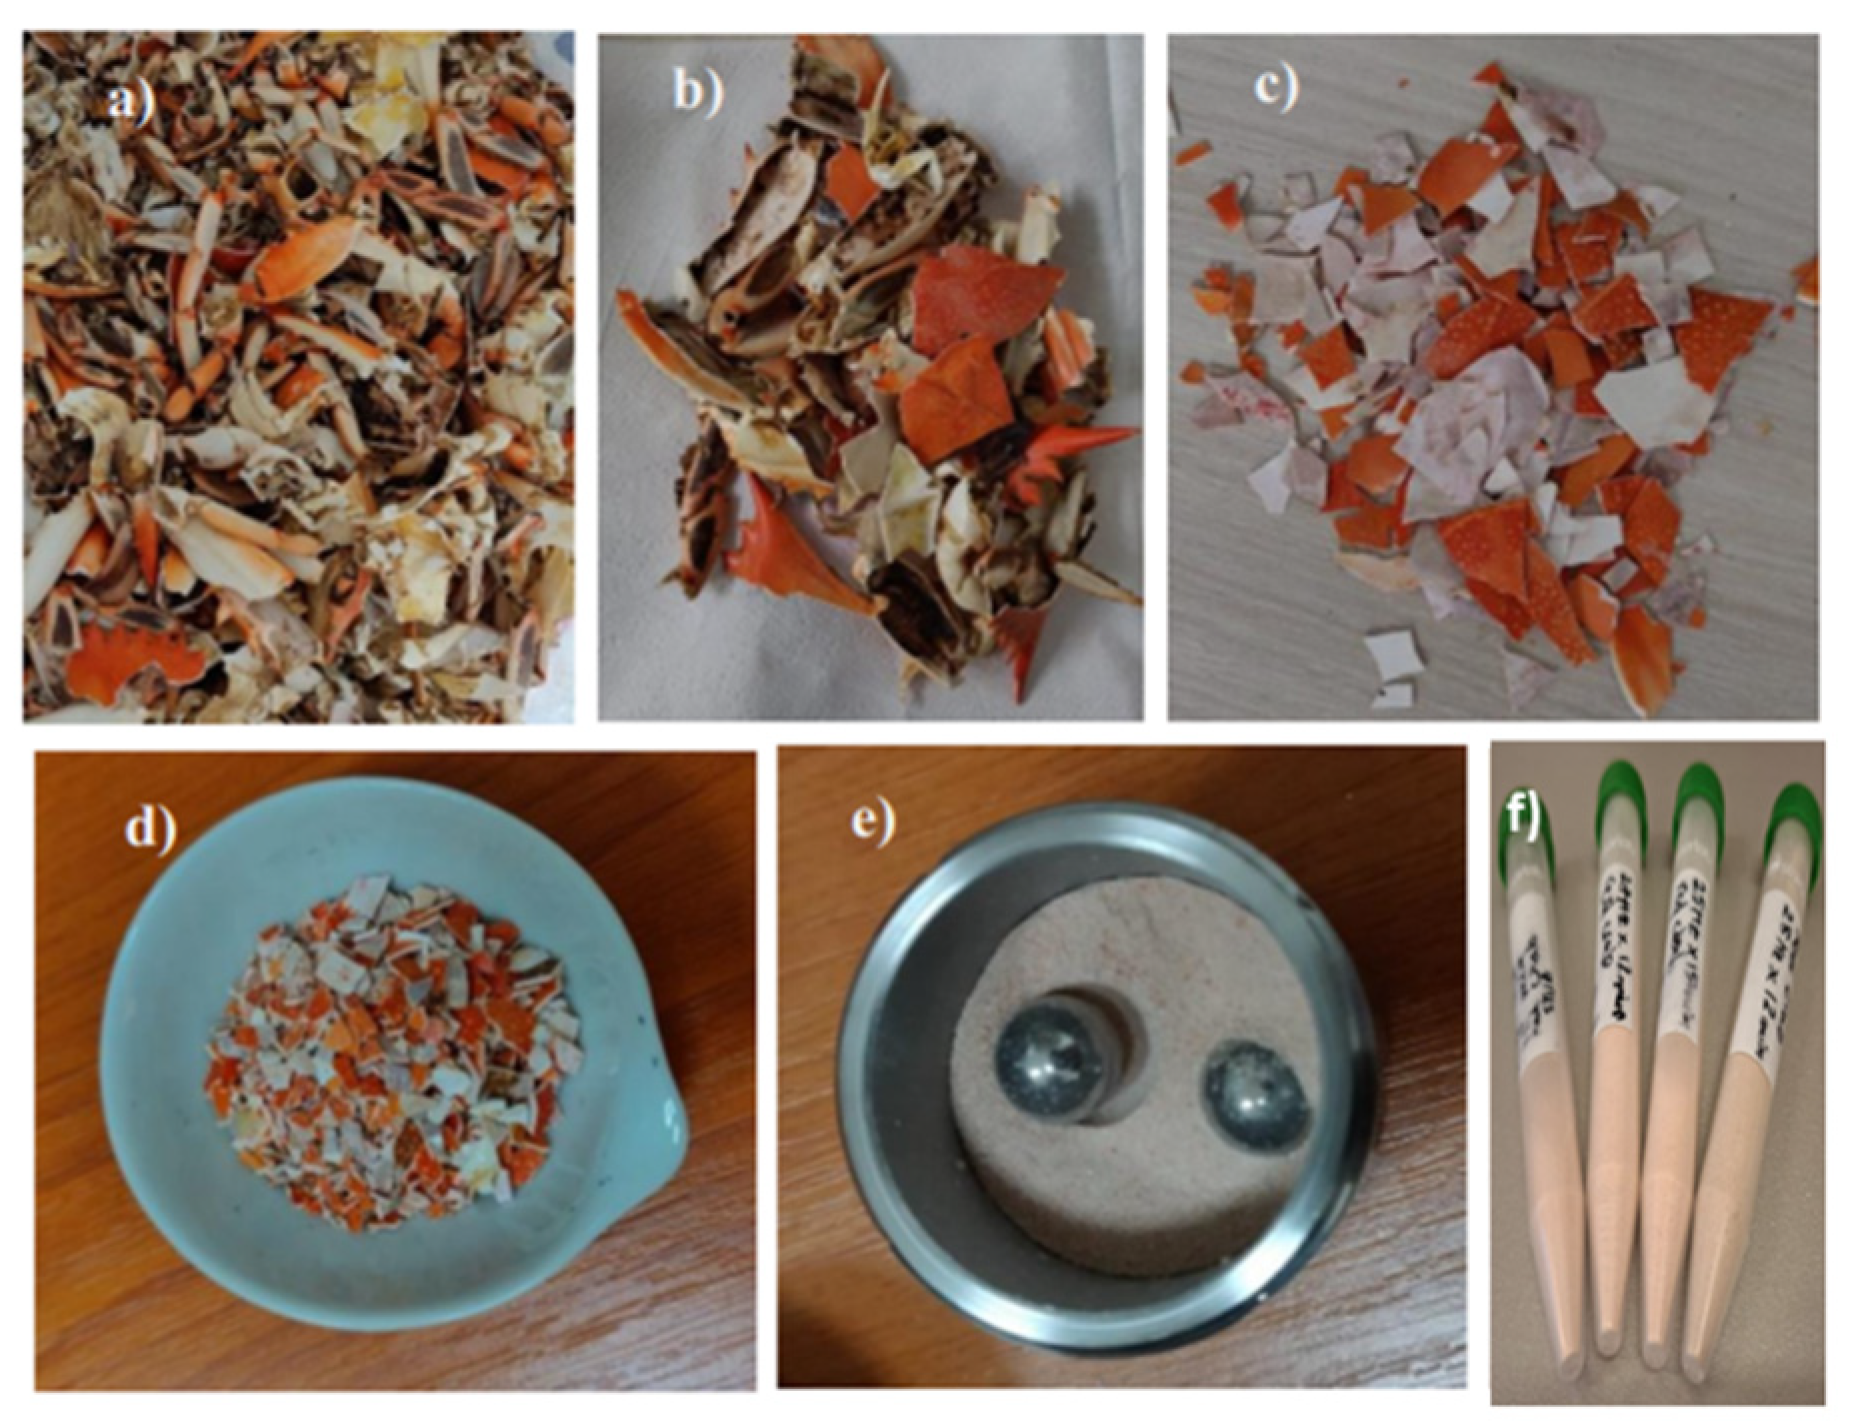
Figure 2.
Representative optical microscopy images taken with the video camera of the Raman microscope prior to measurements, showing the morphology of the aged biogenic powder obtained under milling conditions 25 Hz for 12 min, 25 Hz for 15 mi, 27 Hz for 12 min and 27 Hz for 15 min at 5×, 20×, 50×, and 100× magnifications objectives, respectively.
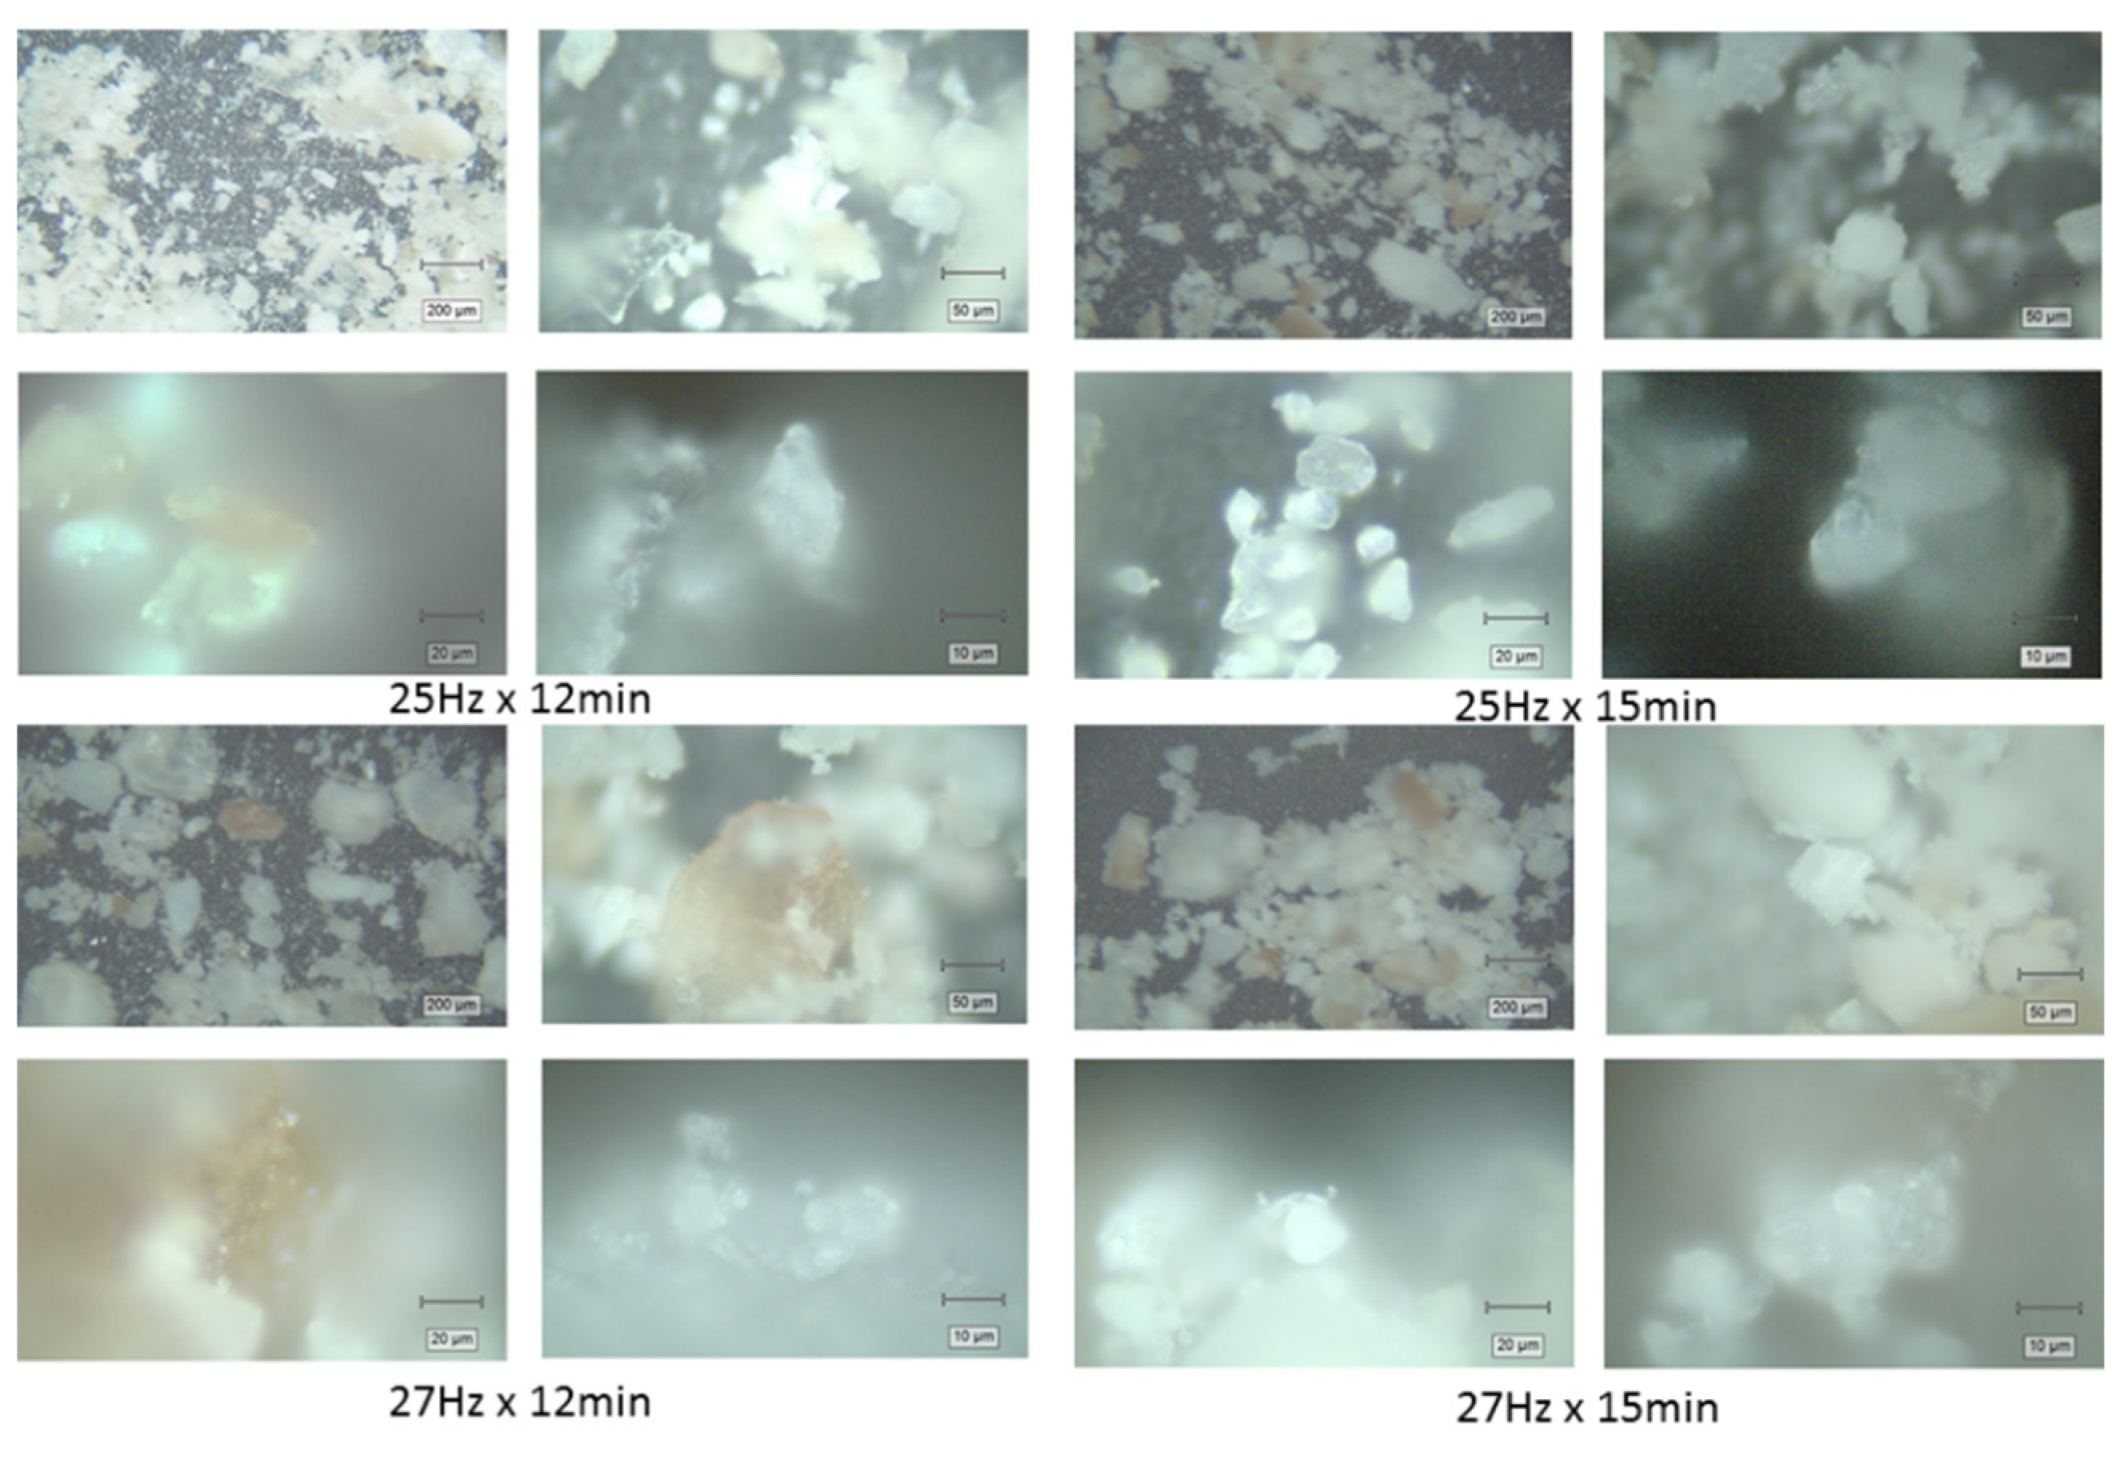
Figure 3.
X-ray diffractograms (A) of the biogenic powders milled under different conditions versus the magnesian calcite pattern from the 01-089-1305 PDF file [26]. Detail of the main calcite band at 29.4 angle (B) is given to highlight the subtle band profile change with milling conditions.
Figure 3.
X-ray diffractograms (A) of the biogenic powders milled under different conditions versus the magnesian calcite pattern from the 01-089-1305 PDF file [26]. Detail of the main calcite band at 29.4 angle (B) is given to highlight the subtle band profile change with milling conditions.
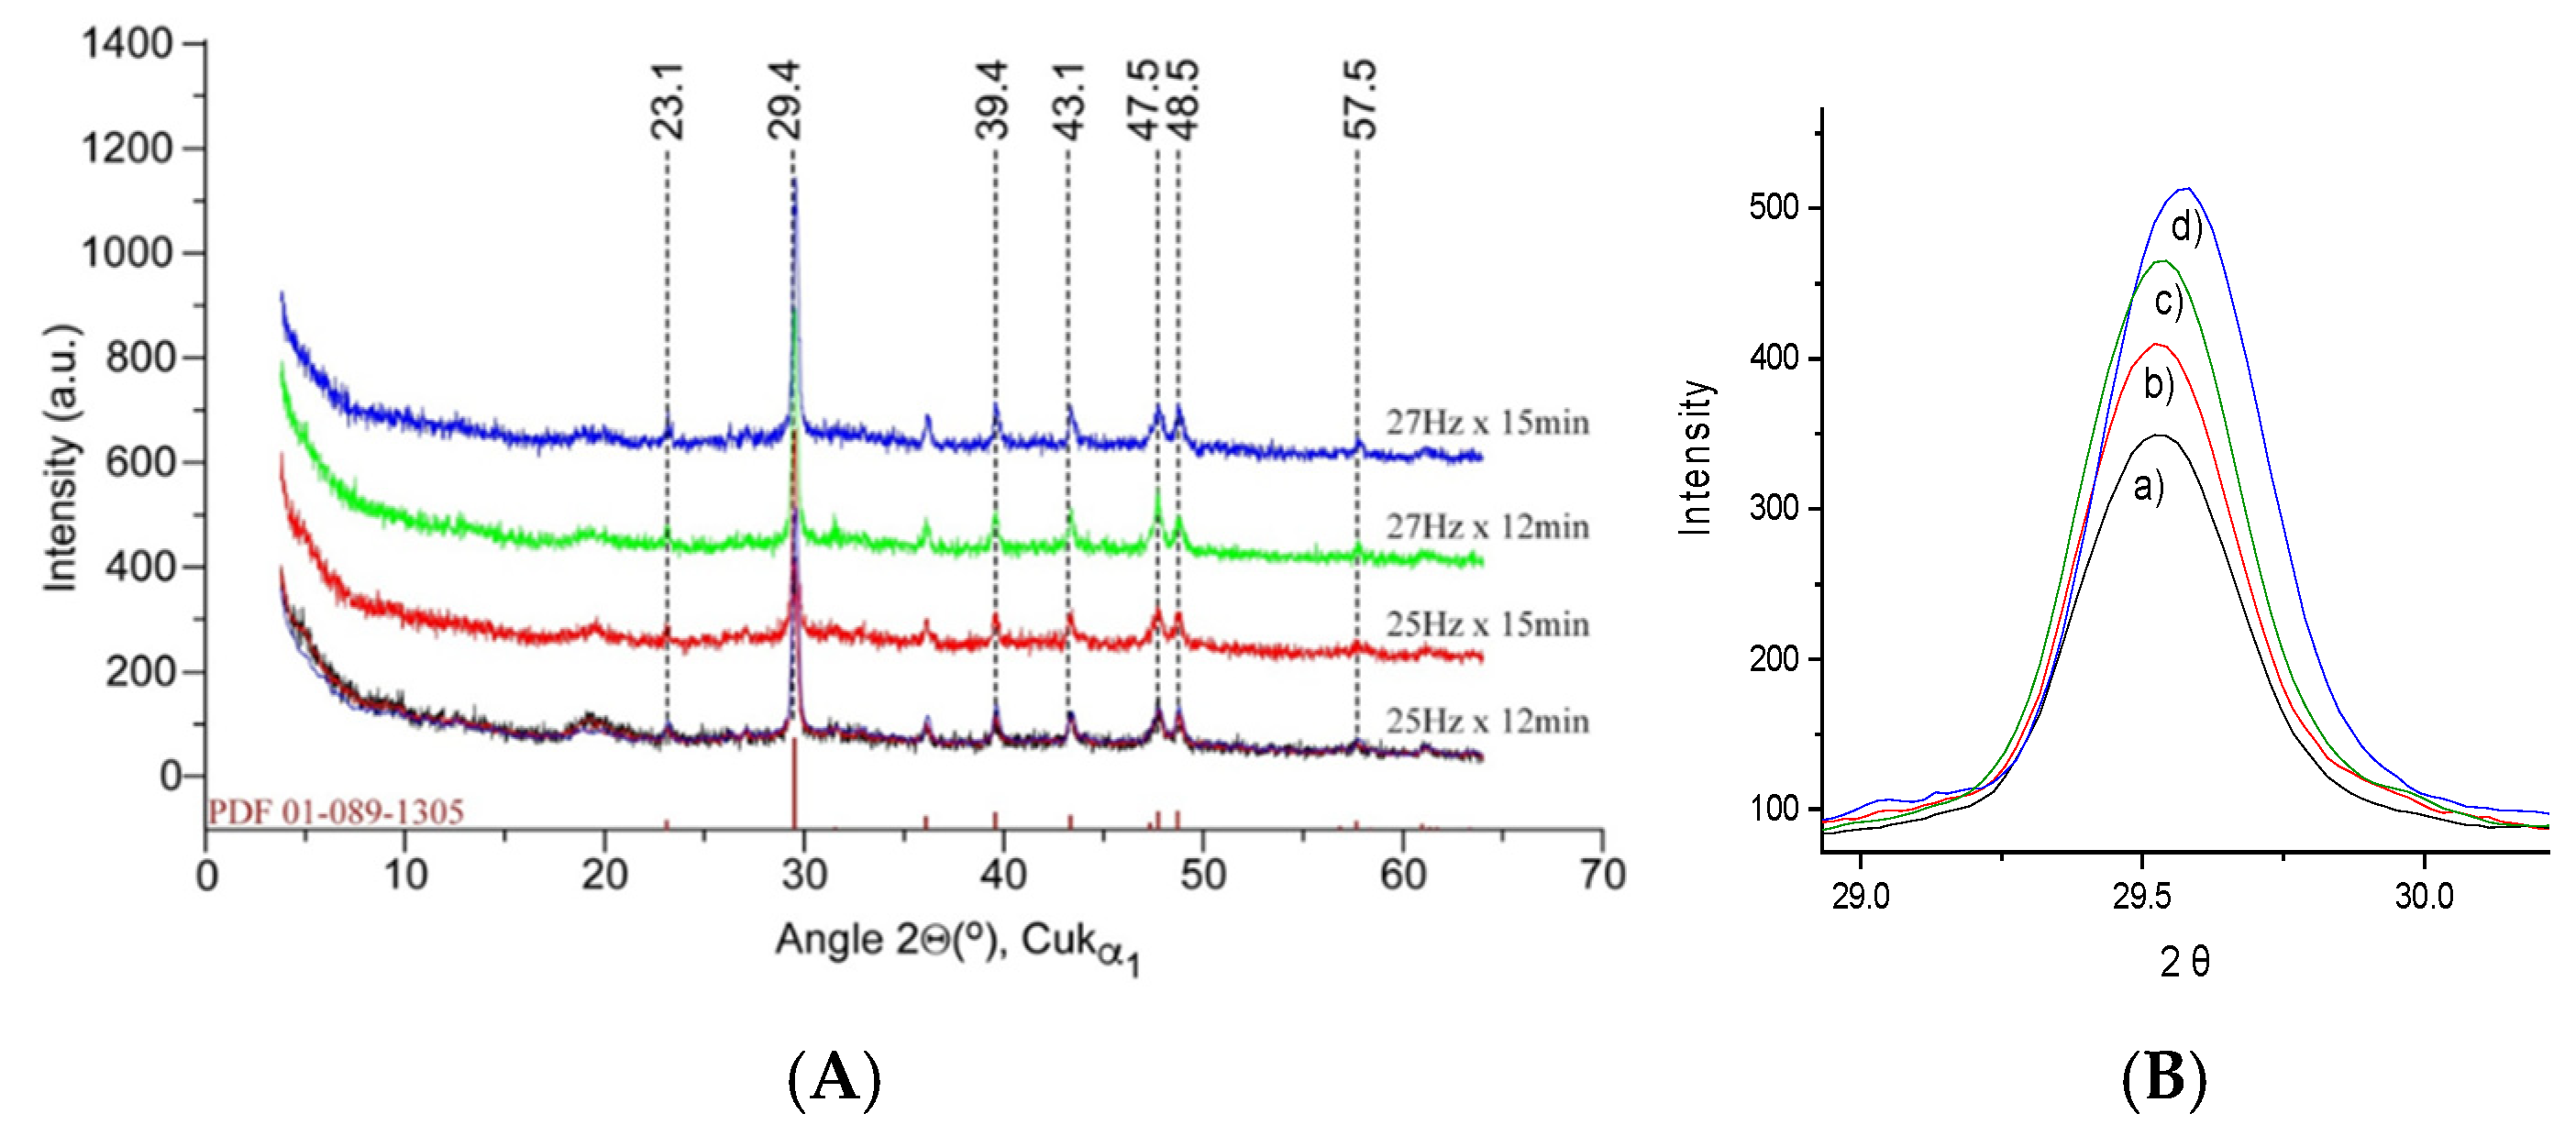
Figure 4.
a). Overlay of FT-IR spectra of biogenic powders milled under different conditions: 25 Hz for 12 min, 25 Hz for 15 min, 27 Hz for 12 min, and 27 Hz for 15 min as indicated by color codes. The main carbonate bands are plotted. An FT-IR spectrum of the raw, fresh biogenic material (blue crab carapace) is showed for comparison. b) Deconvoluted IR band in the spectral range from 1200 to 1600 cm-1 comprising the main band assigned to the υ3 asym(CO32-) mode peaking at 1401 cm−1, (red line) and the amorphous calcium carbonate ACC (green line), changing in band features depending on time and frequency of ball milling. The comparative plot of the band area of the ν3 asym(CO32−) mode for two distinct milling times, under 25 Hz and 27 Hz frequencies, respectively are given in the right side. Highest band area was recorded for 27 Hz_15min.
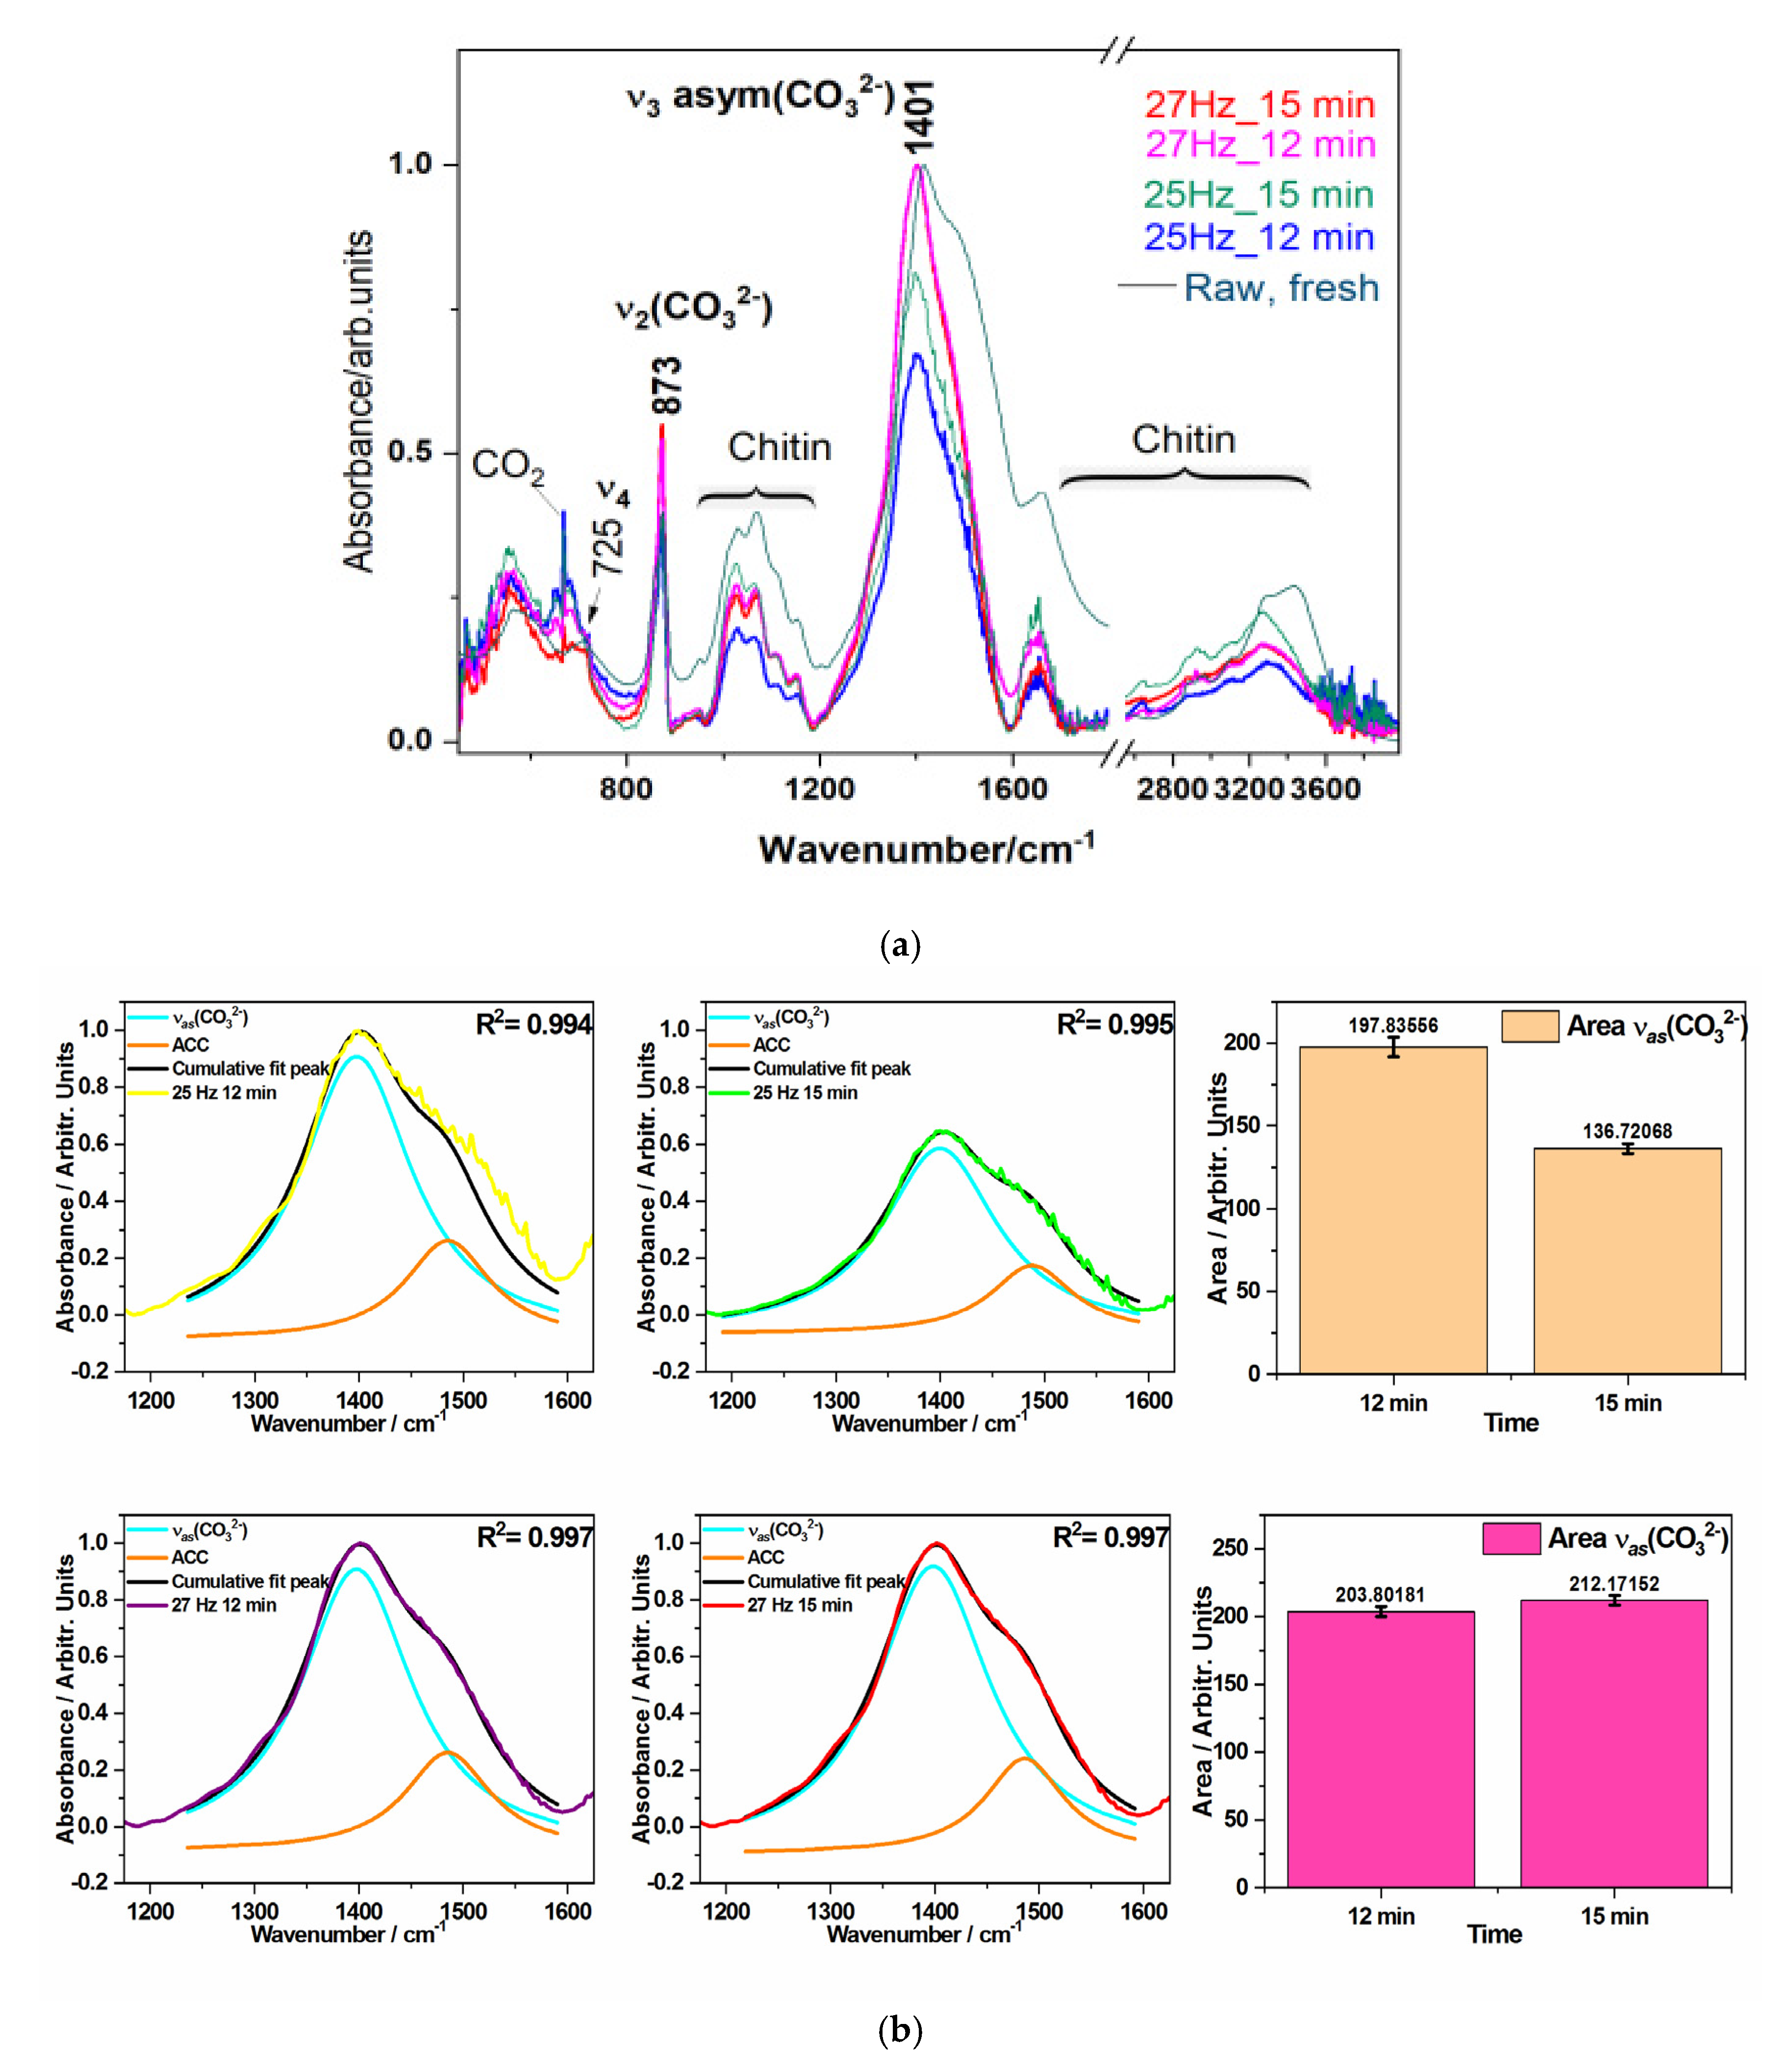
Figure 5.
Micro-Raman spectra excited with 532 nm of the four powders resulted from the milling the aged biogenic material under different conditions: (A) Typical raw spectra collected from five distinct powder particles from the finest milled sample (27 Hz for 15 min) and their averaged (red line) spectrum; particles with strong resonance Raman signal of carotenoids (black lines) and particles with stronger calcite bands (blue line) are observed; B) Raw Raman signal of random powder particle showing both the calcite and astaxanthin pigment bands, as indicated, and the corresponding background subtracted signal; C) Comparative, background subtracted and normalized averaged Raman signal of the four powders plotted in color codes as indicated, for milling at 25 Hz for 12 min, 25 Hz for 15 min, 27 Hz for 12 min, and 27 Hz for 15 min, respectively, compared to the RR signal of pure astaxanthin (green line) and with signal of fresh biogenic material (light blue line). D) Zoomed-in view of the 900-1700 cm-1 range of the averaged, raw spectra of the four powders, compared with the signal from an aged shell fragment (not milled) and one fresh fragment (light blue line), suggesting a slight broadening in the carotenoid profile band in aged fragment or powders.
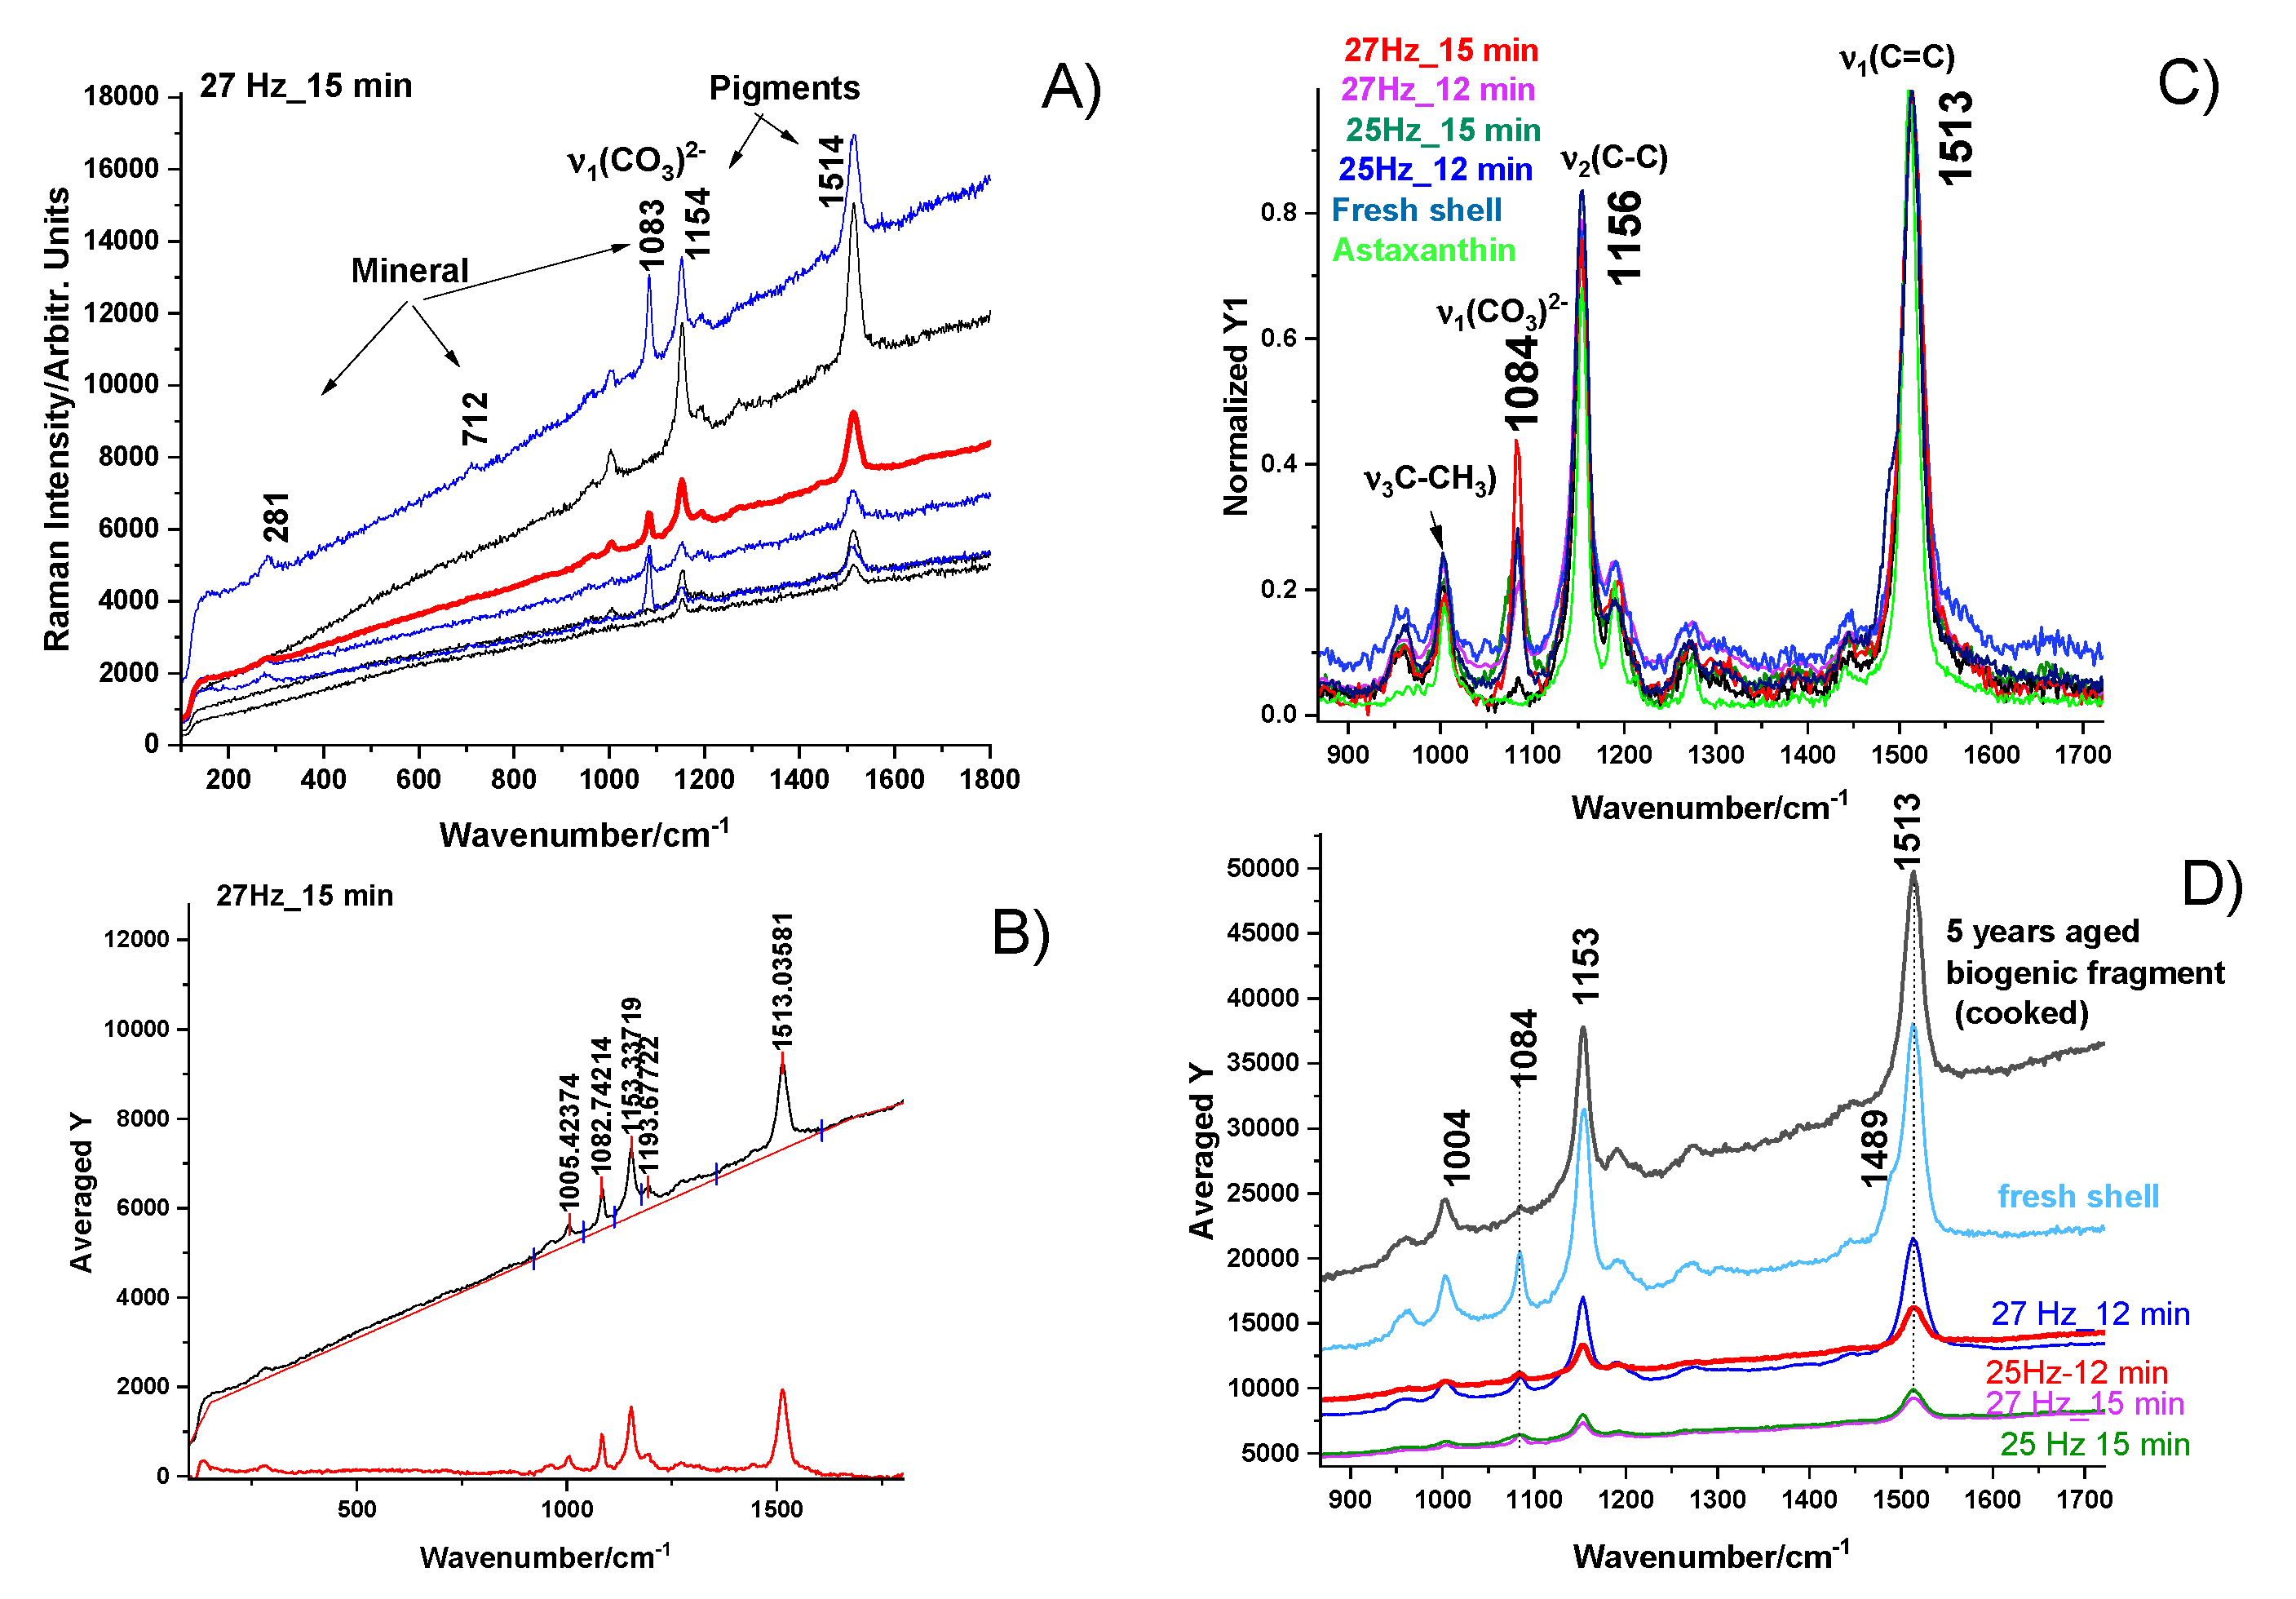
Figure 6.
Dynamic Light Scattering (DLS) analysis of crab shell powders milled under various conditions:(a) Overlay of DLS spectra for all samples milled under different conditions: 27 Hz for 15 min, 25 Hz for 15 min, 25 Hz for 12 min, 27 Hz for 12 min. (b) Column plot showing the dependence of peak intensity on frequency for a milling time of 12 min and (c) 15 min.
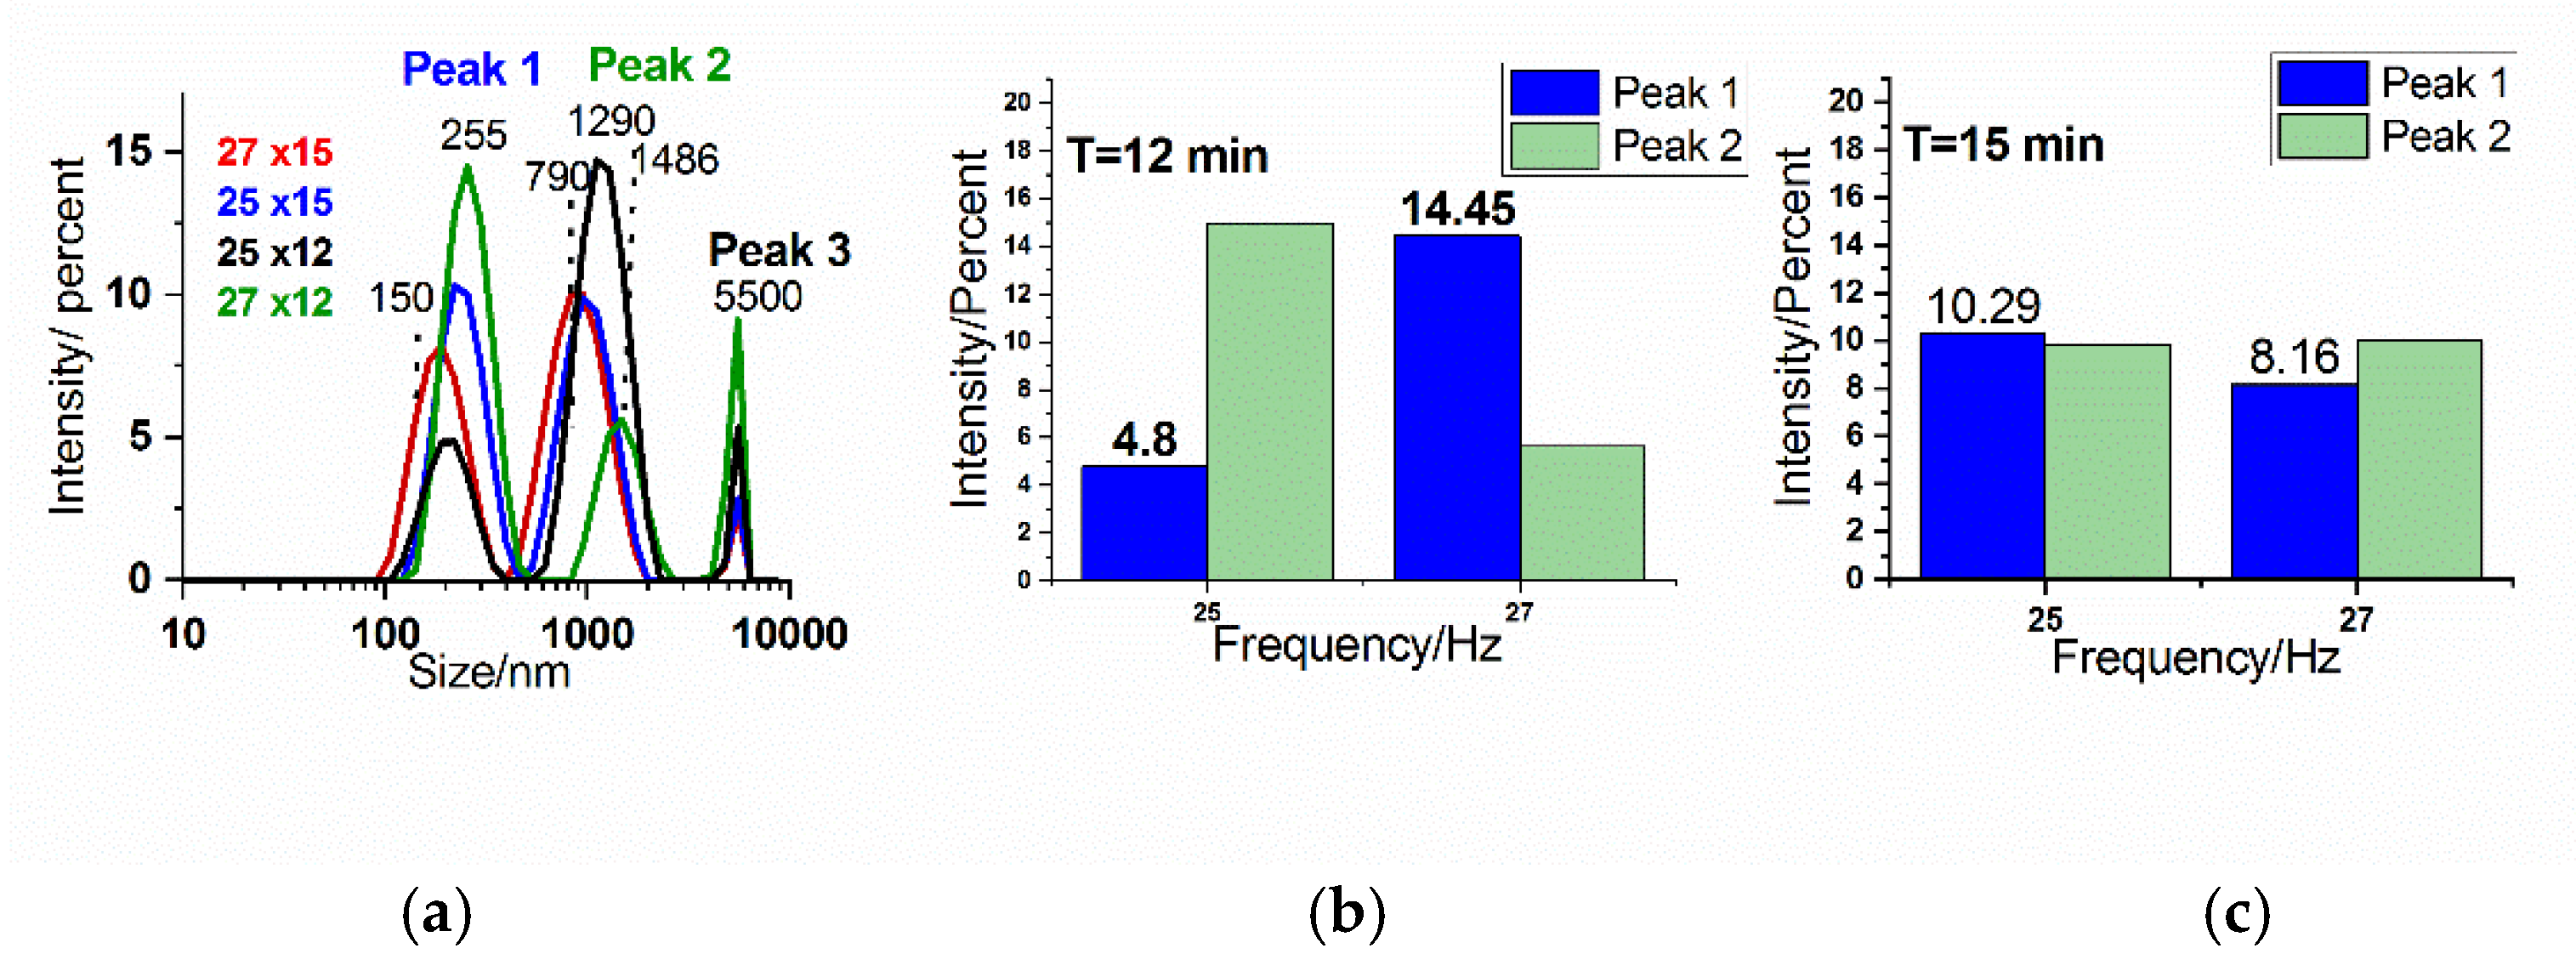
Figure 7.
a) Comparative FT-Raman spectra of aged crustacean powders obtained through ball milling with different milling times and frequencies; b) spectra of the conversion products showing the dominant bands of brushite (CaHPO4 x 2H2O), residual (trace) calcite and additional bands of carotenoids, as indicated; c) The plotted ratio of the calculated band area calcite/ACC in the starting powders, and d) ratio of the phosphate /carbonate in the final product (the band at 986 cm-1 of HPO4 and 1083 cm-1 of carbonate were used for calculation).
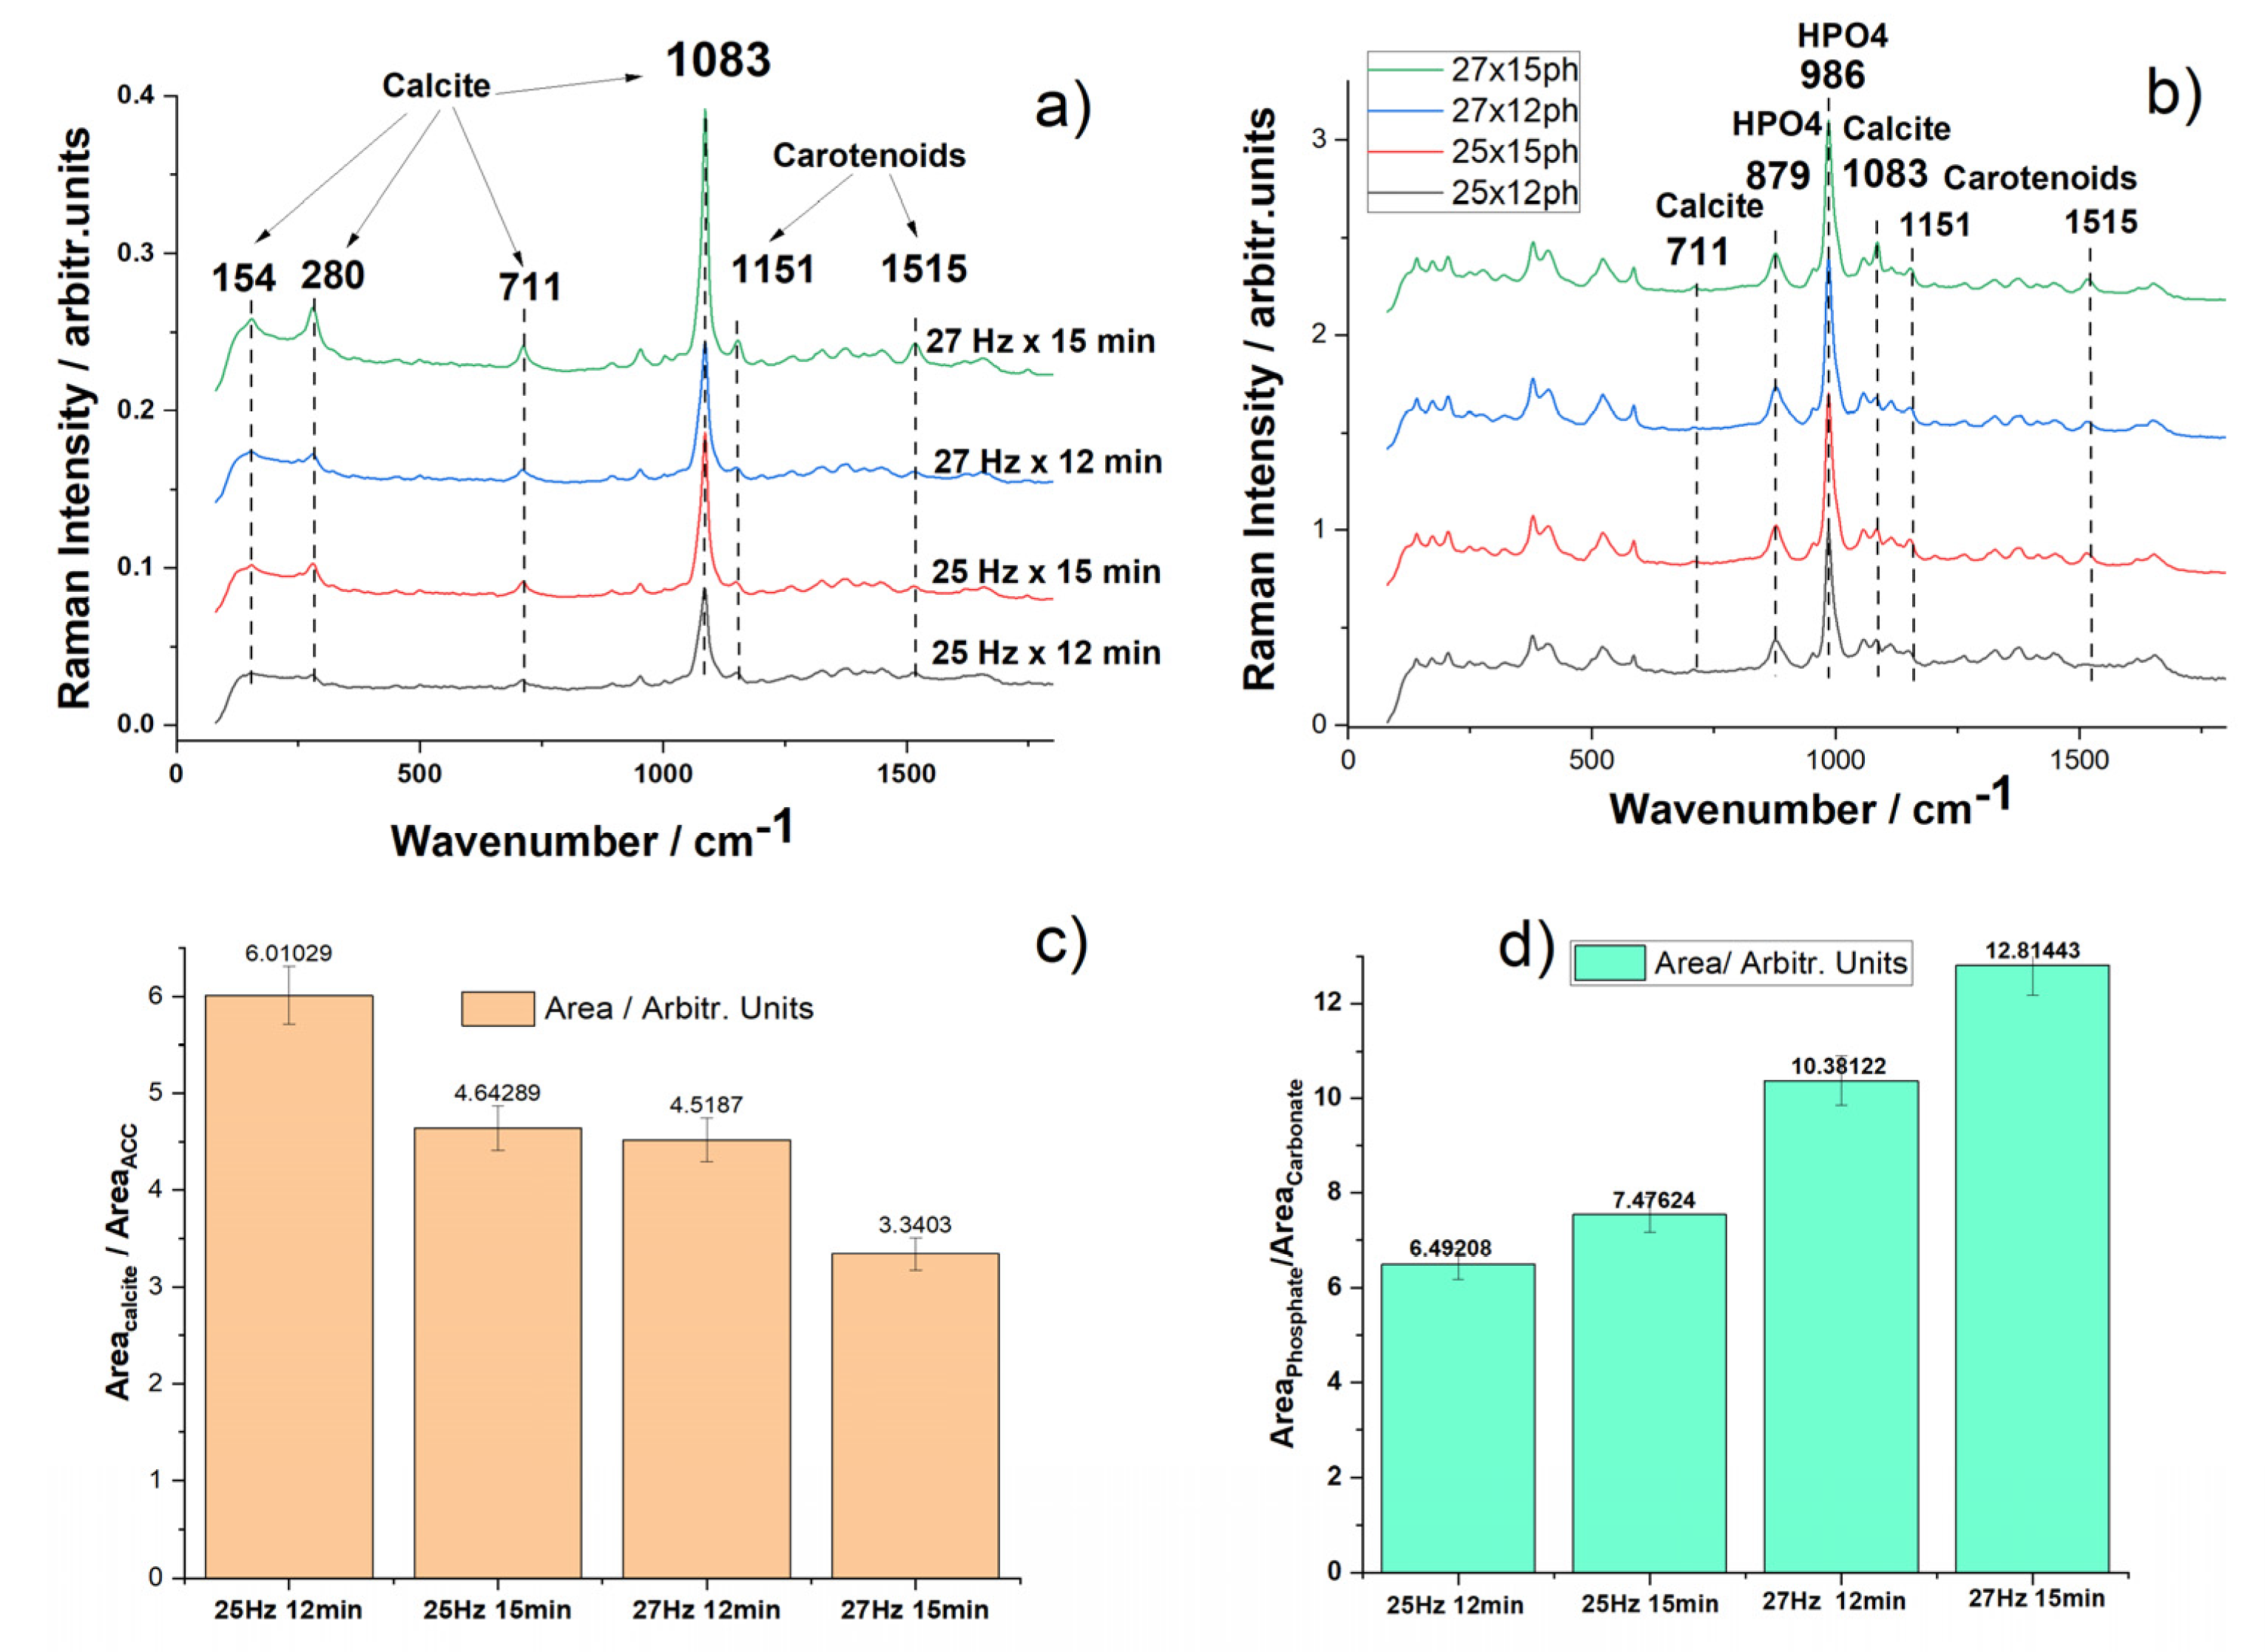
Figure 8.
XRD patterns of biogenic calcite powders after the phosphoric acid treatment, and the pattern of brushite (calcium hydrogen orthophosphate dihydrate) from PDF file 01-0720713 (36). The marked peaks were attributed to chitin (ch) and unreacted calcite (c).
Figure 8.
XRD patterns of biogenic calcite powders after the phosphoric acid treatment, and the pattern of brushite (calcium hydrogen orthophosphate dihydrate) from PDF file 01-0720713 (36). The marked peaks were attributed to chitin (ch) and unreacted calcite (c).
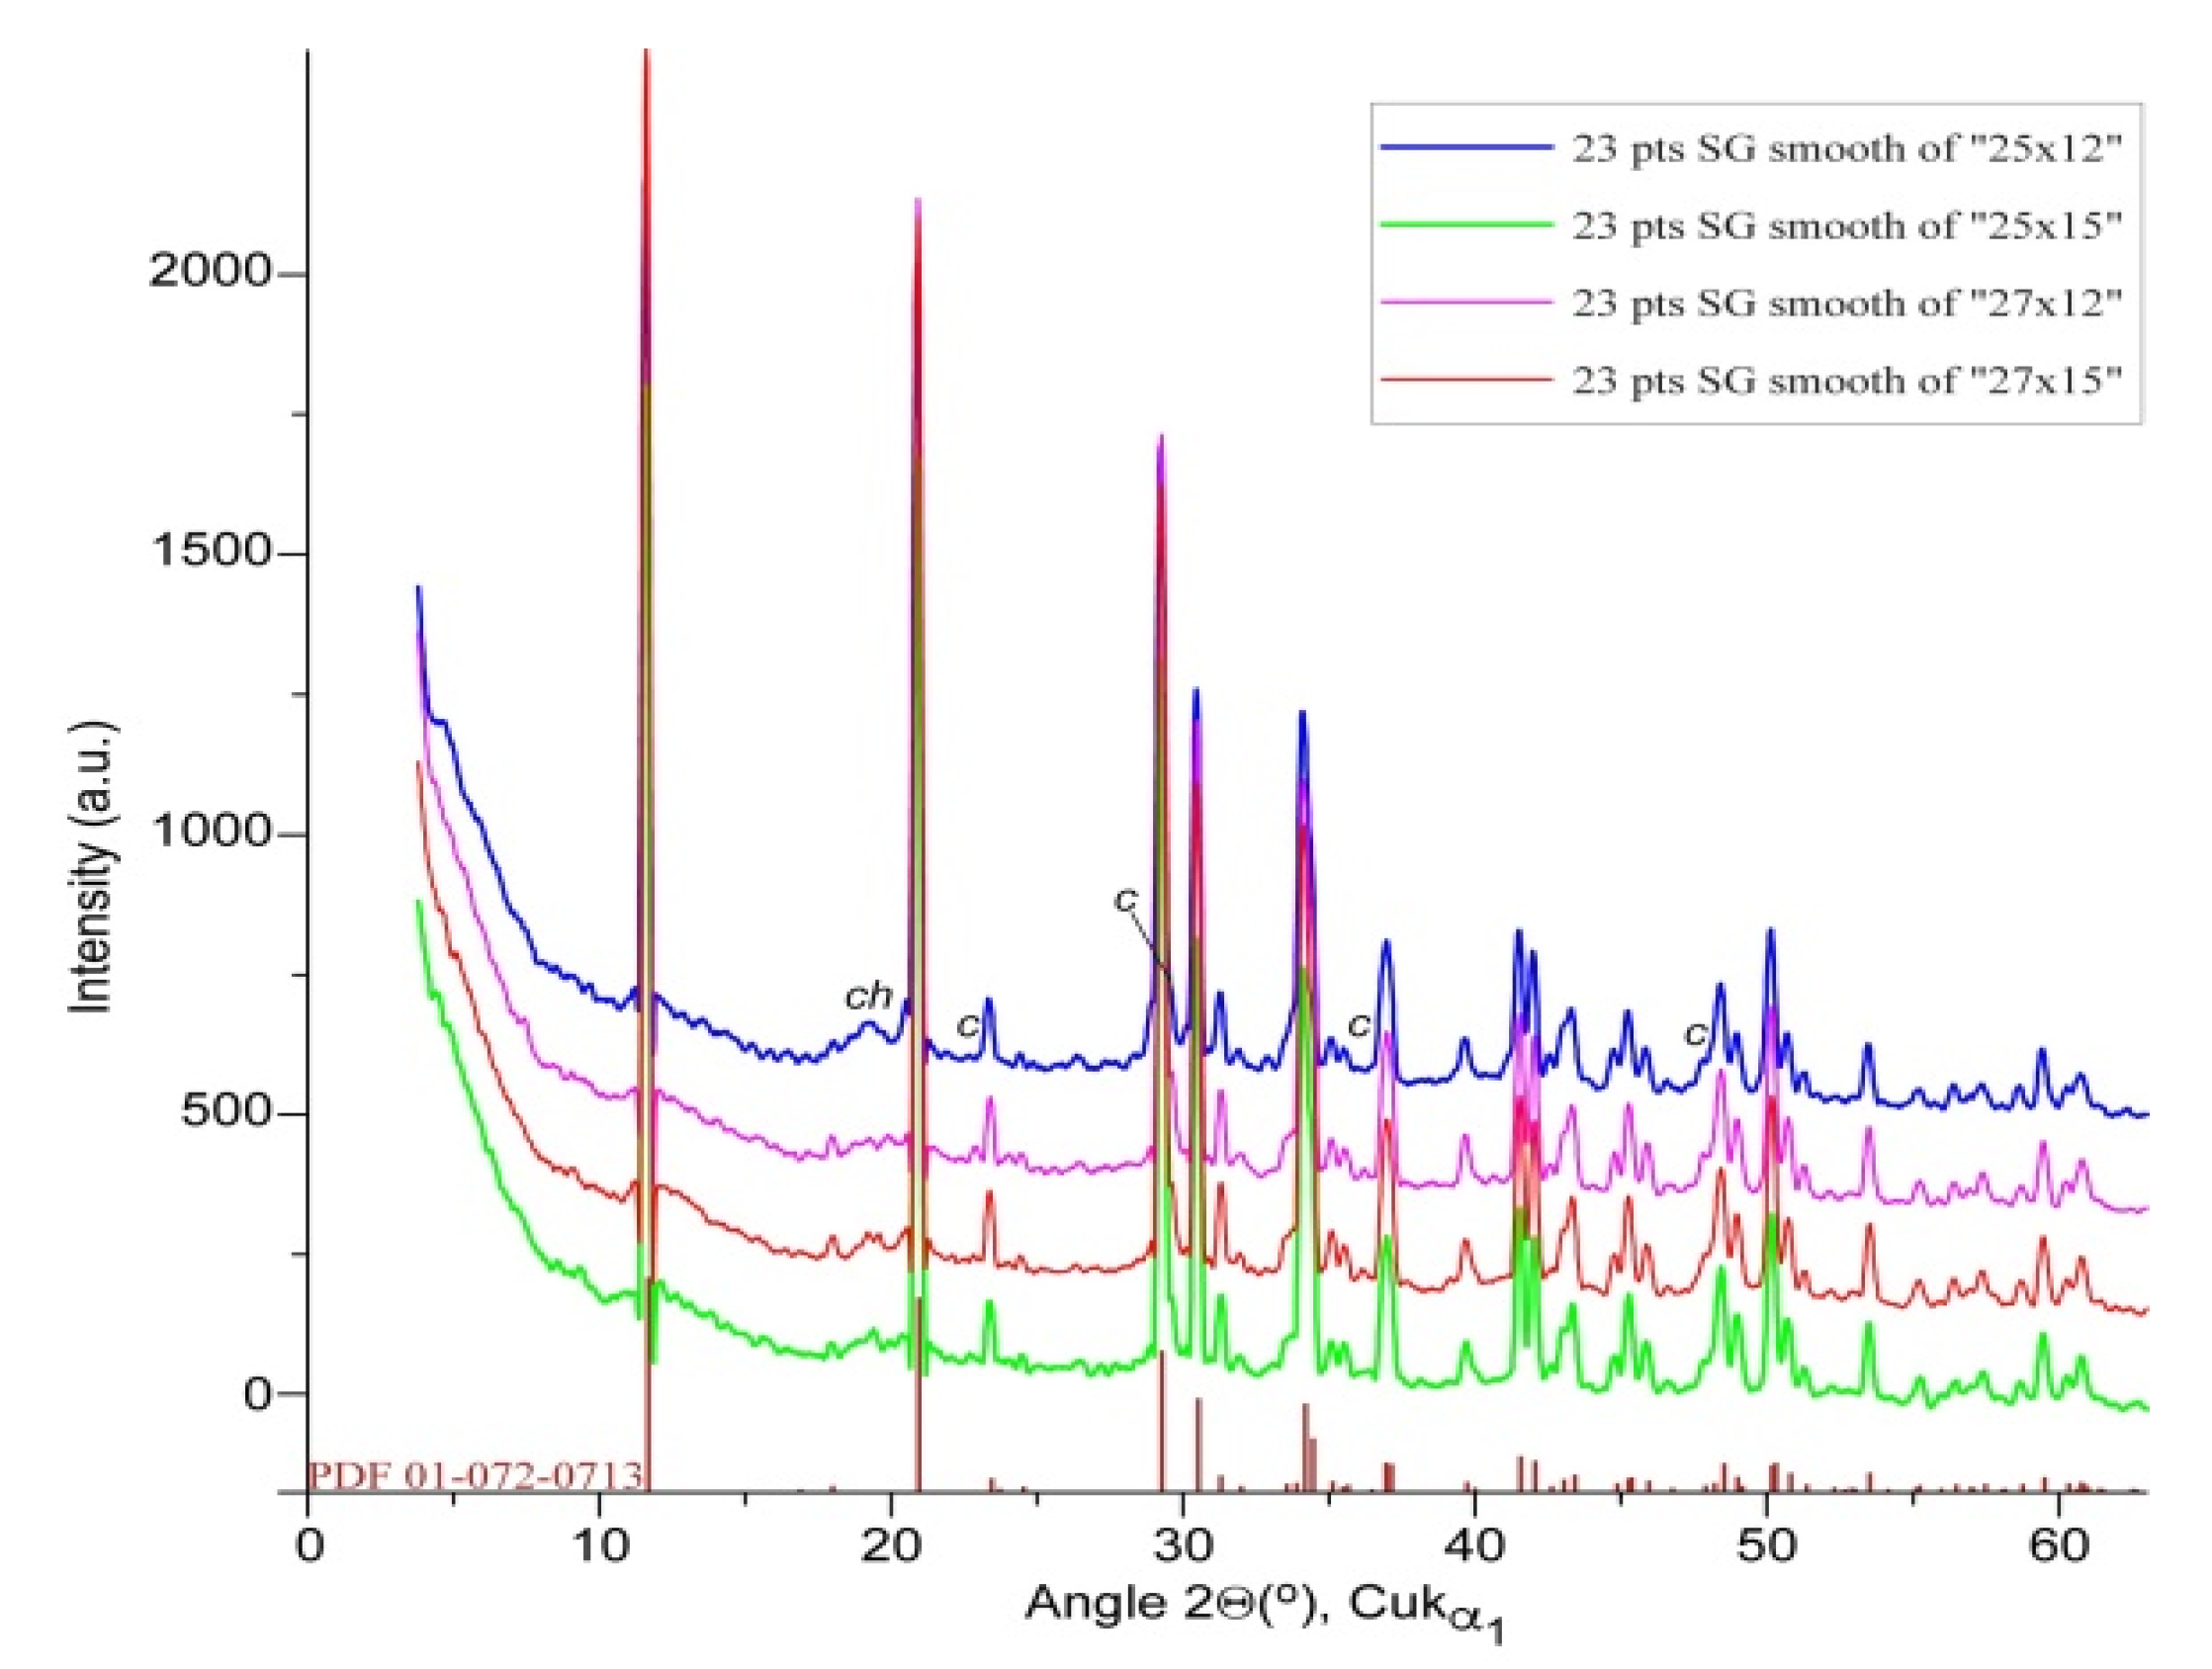
Figure 9.
SEM images recorded from the phosphate mineral (brushite) resulted from the conversion reaction of the four biogenic powders: A) 25 Hz_12 min; B) 25 Hz_15 min; C) 27 Hz_12 min; D) 27 Hz_15 min. Scale bar: 10 µm.
Figure 9.
SEM images recorded from the phosphate mineral (brushite) resulted from the conversion reaction of the four biogenic powders: A) 25 Hz_12 min; B) 25 Hz_15 min; C) 27 Hz_12 min; D) 27 Hz_15 min. Scale bar: 10 µm.
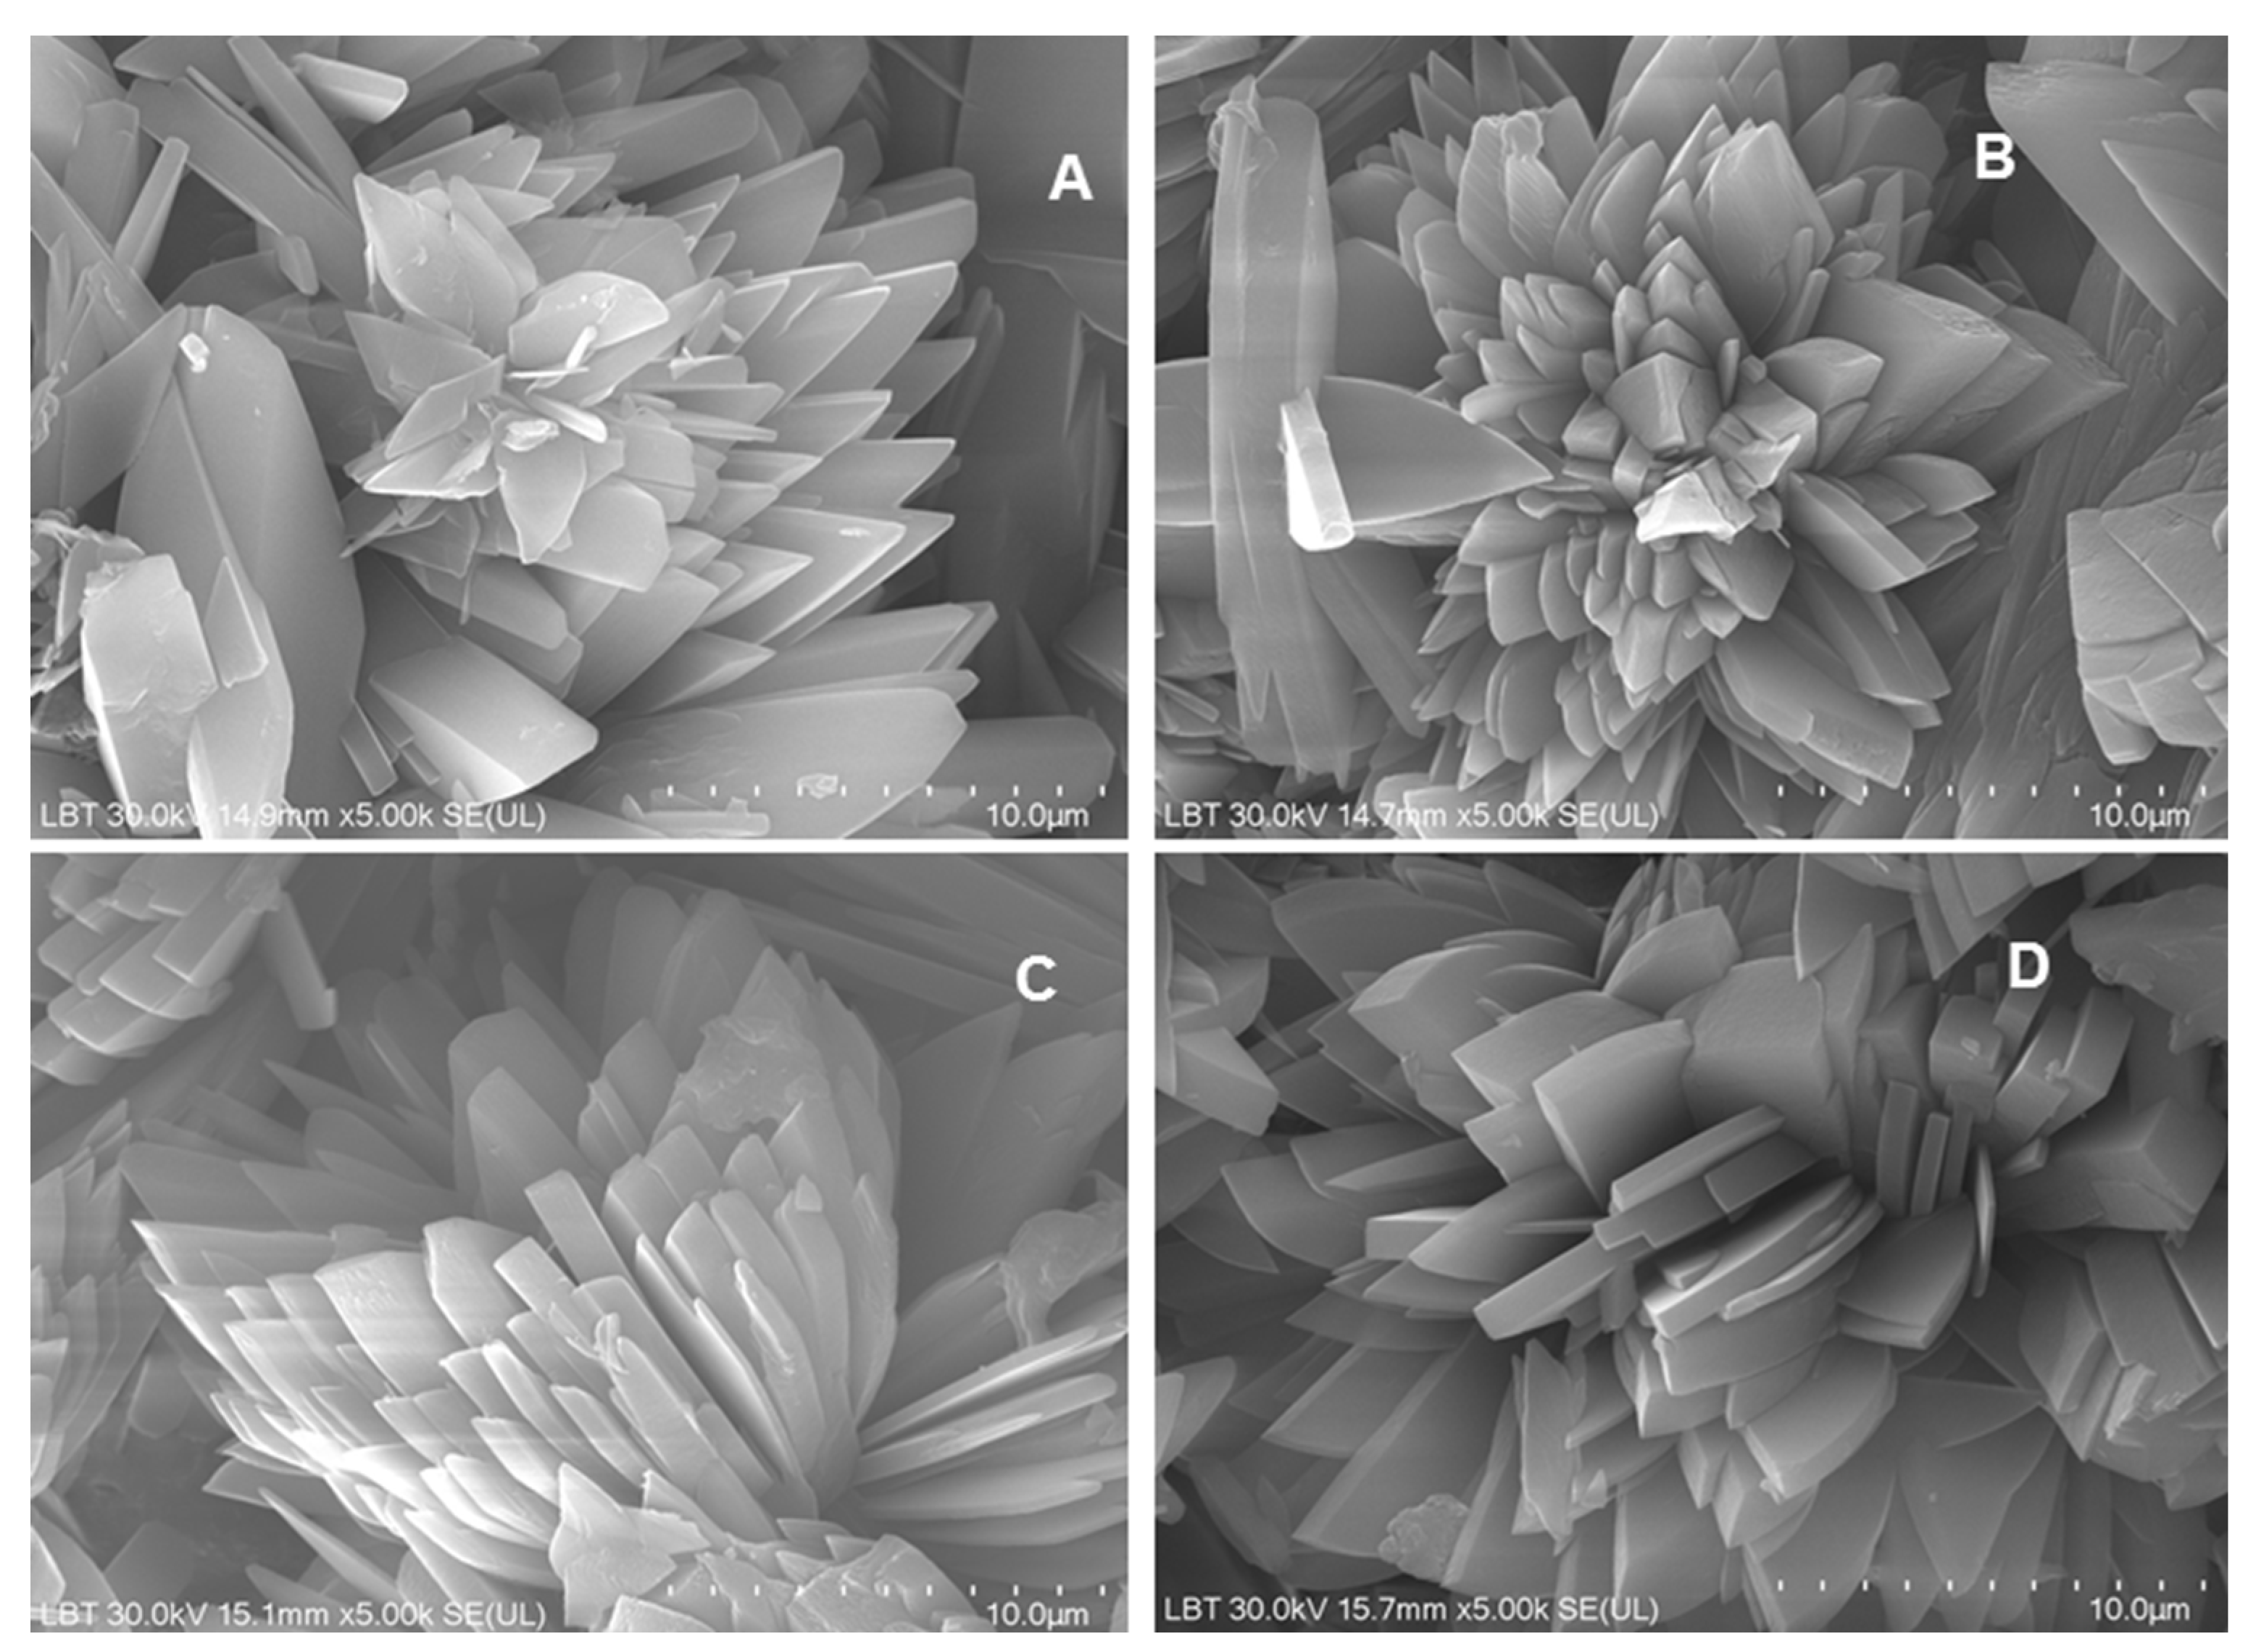
Figure 10.
EDX spectrum and maps of elements distribution (overlay and individual P, Ca and C) over the morphology of phosphate mineral from biogenic powder (25 Hz_12 min).
Figure 10.
EDX spectrum and maps of elements distribution (overlay and individual P, Ca and C) over the morphology of phosphate mineral from biogenic powder (25 Hz_12 min).
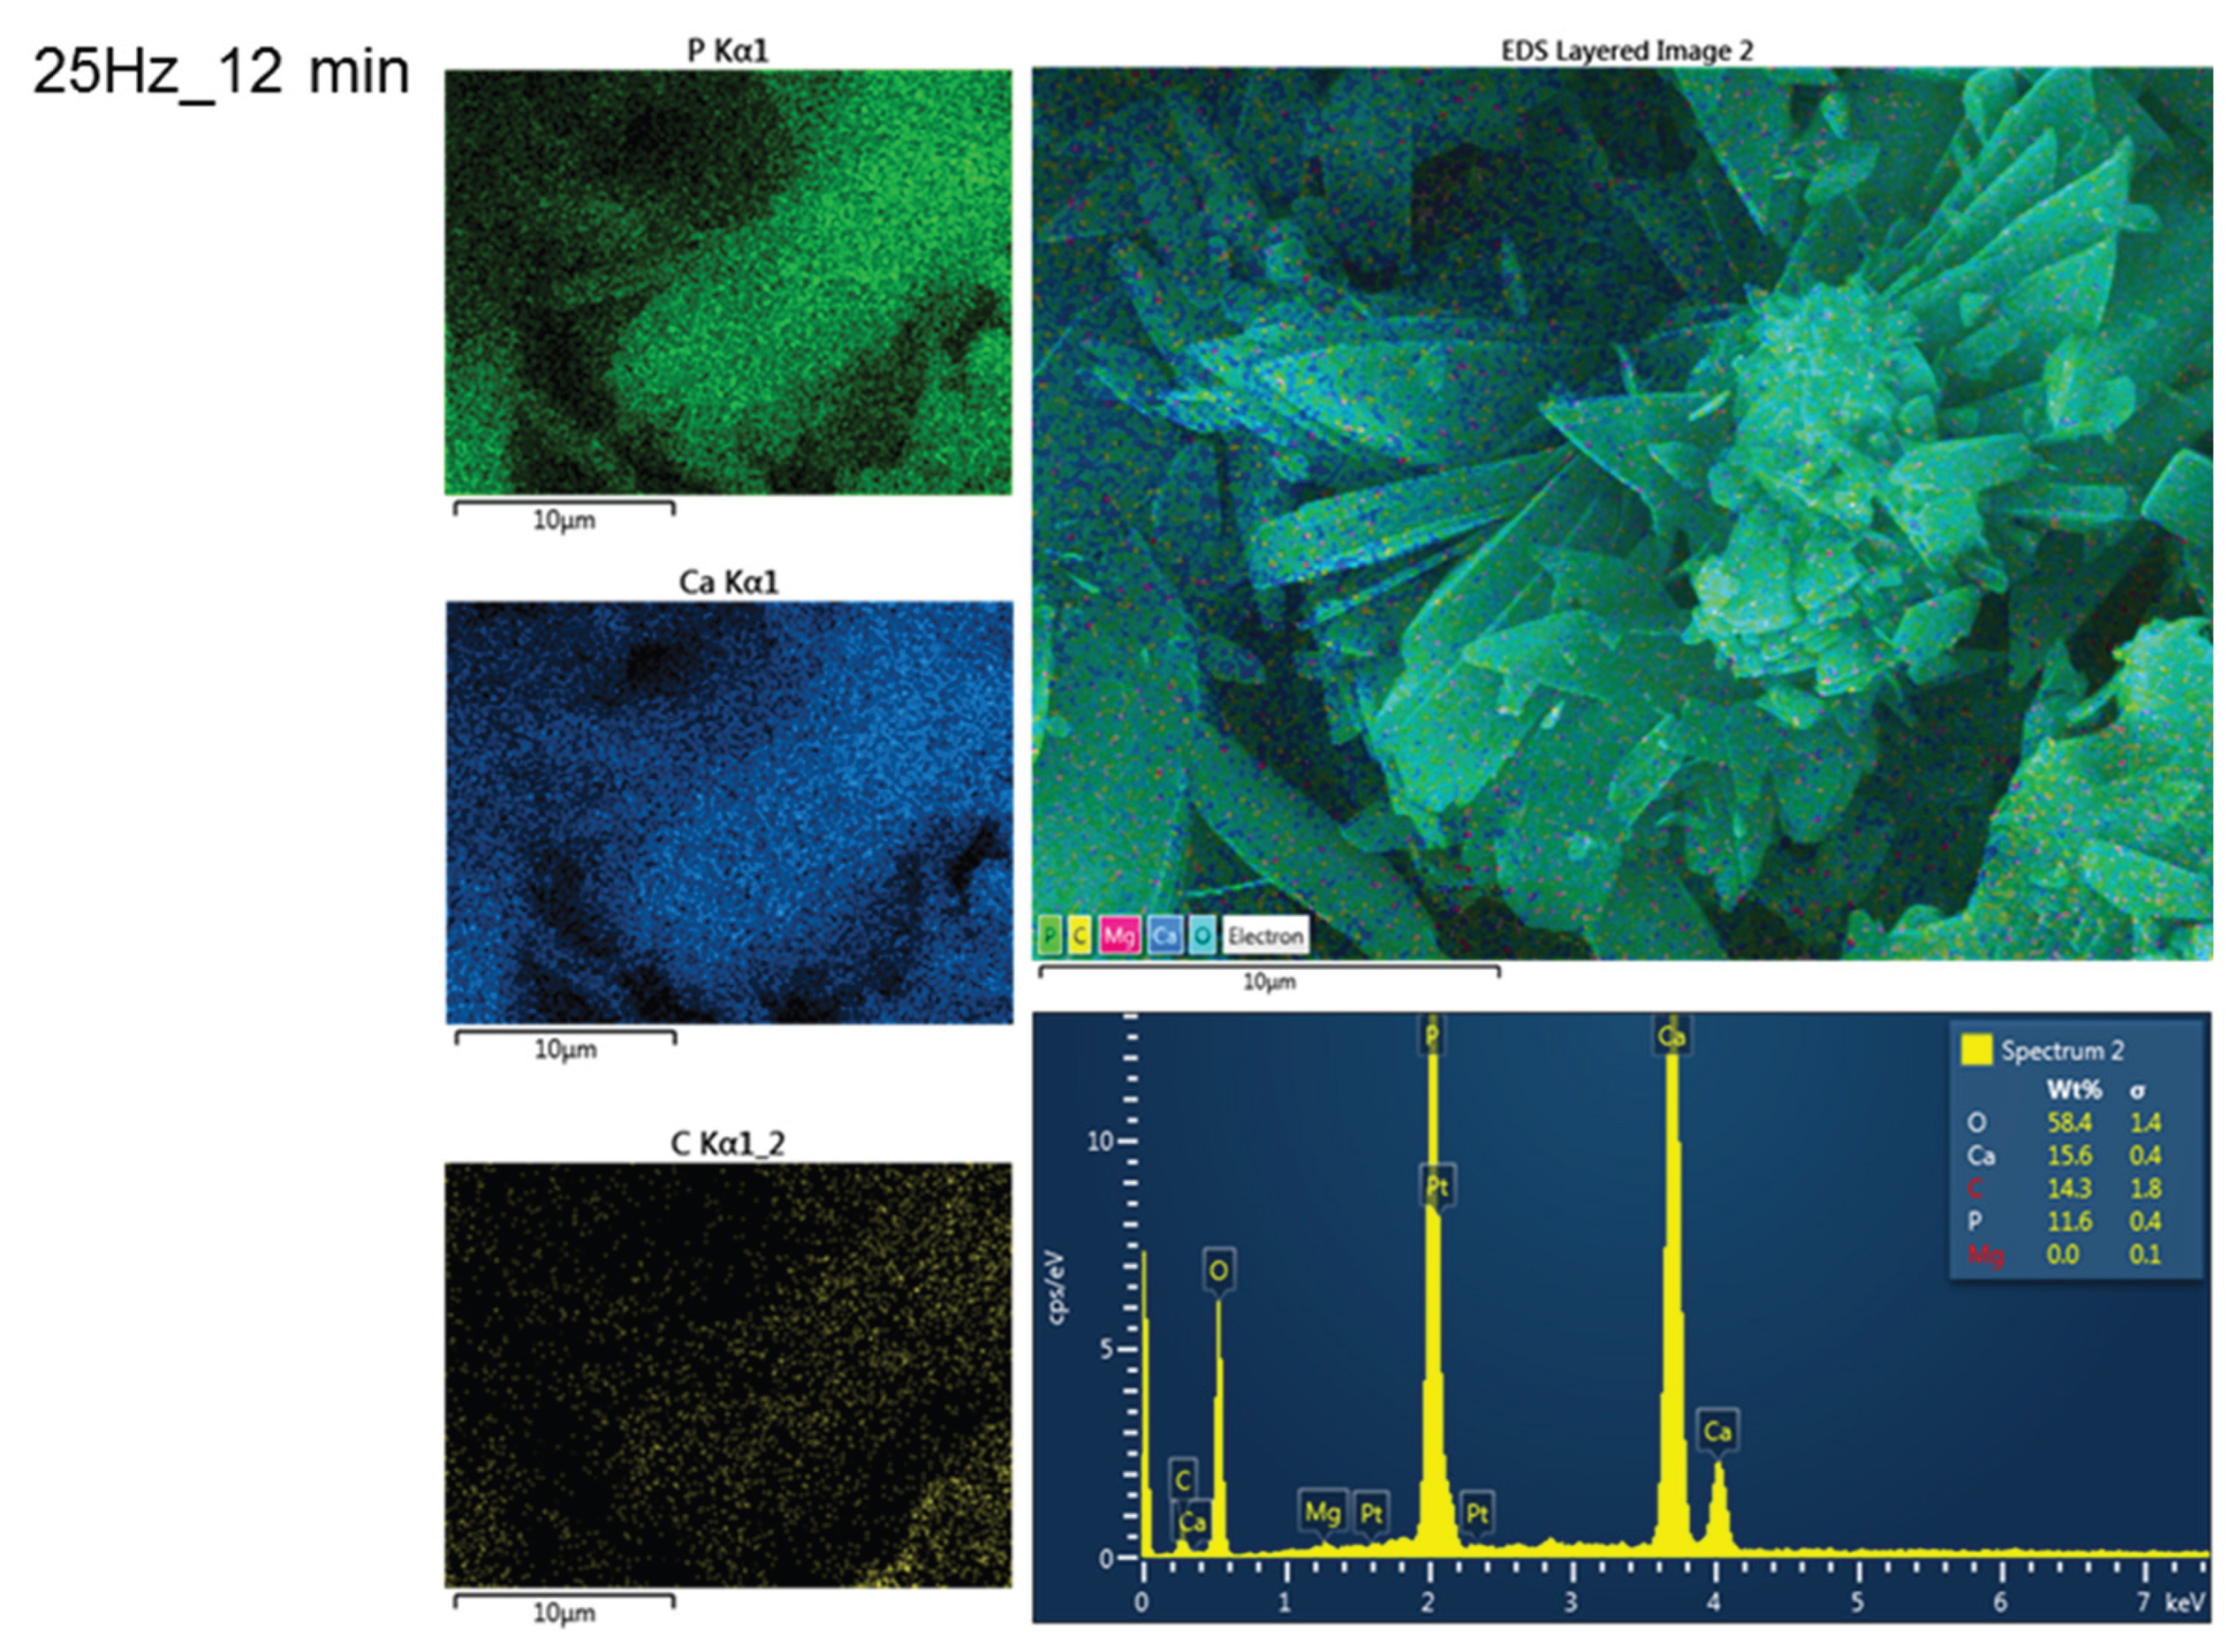

Table 1.
Averaged particle size optically observed in powders at different magnifications (5×, 20×, 50×, and 100×) for each milling condition (25 Hz for 12 min, 25 Hz for 15 min, 27 Hz for 12 min, and 27 Hz for 15 min). Values are given in micrometers (μm). Scale bars: 200, 50, 20, 10 μm.
Table 1.
Averaged particle size optically observed in powders at different magnifications (5×, 20×, 50×, and 100×) for each milling condition (25 Hz for 12 min, 25 Hz for 15 min, 27 Hz for 12 min, and 27 Hz for 15 min). Values are given in micrometers (μm). Scale bars: 200, 50, 20, 10 μm.
| Milling Conditions (frequency, time) | Particle size observed under optical microscopy/μm | |||
|---|---|---|---|---|
| 5× Obj. | 20× Obj. | 50× Obj. | 100× Obj. | |
| 25 Hz, 12 min | 10 - 400 | >5 | ̴2- 40 | ̴ 2-20 |
| 25 Hz, 15 min | 10 - 300 | >5 | 2 - 30 | ̴ 1-15 |
| 27 Hz, 12 min | 10 - 300 | >5 | 2 - 30 | ̴ 1-15 |
| 27 Hz, 15 min | 10 - 300 | >5 | 2 - 30 | ̴ 1-15 |
Disclaimer/Publisher’s Note: The statements, opinions and data contained in all publications are solely those of the individual author(s) and contributor(s) and not of MDPI and/or the editor(s). MDPI and/or the editor(s) disclaim responsibility for any injury to people or property resulting from any ideas, methods, instructions or products referred to in the content. |
© 2025 by the authors. Licensee MDPI, Basel, Switzerland. This article is an open access article distributed under the terms and conditions of the Creative Commons Attribution (CC BY) license (http://creativecommons.org/licenses/by/4.0/).
Copyright: This open access article is published under a Creative Commons CC BY 4.0 license, which permit the free download, distribution, and reuse, provided that the author and preprint are cited in any reuse.


