
Submitted:
25 September 2025
Posted:
29 September 2025
You are already at the latest version
Abstract
The line contact behavior of multiscale meshing interfaces necessitates synergistic investigation spanning nano- to centimeter-scale ranges. When nominally smooth gear teeth surfaces come into contact, the mechanical-thermal coupling effect at the meshing interface actually occurs over a collection of microscale asperities (roughness peaks) exhibiting hierarchical distribution characteristics. The emergent deformation phenomena across multiple asperity scales govern the self-organized evolution of interface conformity, thereby regulating both the load transfer efficiency and thermal transport properties within the contact zone. The fractal nature of the roughness topography on actual meshing interfaces calls for the development of a cross-scale theoretical framework that inte-grates micro-texture optimization with multi-physics coupling contact behavior. Conventional roughness characterization methods based on statistical parameters suffer from inherent limitations: their parameter values are highly dependent on measurement scale, lacking uniqueness under varying sampling intervals and instrument resolutions, and failing to capture the scale-invariant nature of meshing interface topography. In contrast, a scale-independent parameter system grounded in fractal geometry theory enables essential feature extraction and quantitative characterization of three-dimensional interface morphology. This study establishes a progressive deformation theory for gear line contact interfaces with fractal geometric characteristics, encompassing elastic, elasto-plastic transition, and fully plastic stages. By systematically investigating the force-thermal coupling mechanisms in textured meshing interfaces under multiscale conditions, the research provides a theoretical foundation and numerical implementation pathways for high-precision multiscale thermomechanical analysis of meshing interfaces.
Keywords:
meshing interface
; mechanical-thermal characteristics
; micro-asperity contact
; micro-element texturing configuration
; fractal multiscale analysis
1. Introduction
Meshing interface engineering has emerged as a distinct interdisciplinary domain dedicated to resolving multiscale contact challenges inherent in gear surface topographies. This necessitates the development of scale-bridging computational frameworks to decode the intricate interplay between interfacial mechanics and thermal transfer phenomena. This research field carries significant academic importance, as interfacial contact behavior profoundly impacts the global performance of marine power rear transmission components under coupled thermo-mechanical loading conditions. The meshing interface, specifically defined as the contact boundary region formed under THE-mode loading conditions, exhibits fundamentally distinct deformation mechanisms compared to bulk materials. This divergence originates from the marked differences between the interfacial microstructure and bulk material properties, along with their abrupt physical property transitions. Therefore, to gain an in-depth understanding of the thermo-mechanical contact behavior at meshing interfaces, it is essential to establish a multiscale research framework specifically tailored for non-smooth line-contact interface topographies.
The pioneering work in the study of meshing interface mechanics can be traced back to the Hertzian elastic contact theory [1,2]. This groundbreaking progress laid the foundation for the discipline of contact mechanics, which mainly investigates the deformation behavior of rigid contacts with Euclidean macroscopic configurations. Since Hertz’s pioneering research, the elastoplastic contact deformation problem of rotationally symmetric bodies has been of continuous interest to the academic community. This is primarily due to the significant impact of meshing interface mechanics on the durability of gear transmission systems containing contact elements. The early researchers of quasi-static contact studied the deformation problem of a rigid sphere indented into an ideal elastoplastic half-space. In another early study, the process of a rigid cylinder indenting into a linearly hardening elastic half-space is analyzed, and it is found that the contact pressure distribution exhibited a flattening characteristic, with the material having the weakest strain hardening capability showing the most significant deviation from the Hertzian pressure distribution [3,4,5]. In subsequent research, the quasi-static spherical indentation problem in a fully plastic deformation zone of a hardening material is explored, employing a power-law hardening nonlinear elastic model to simulate the deformation behavior of a rigid sphere indenting into a half-space in the fully plastic region.
With the continuous development of numerical computation methods such as the finite element method, finite difference method, finite volume method, and boundary element method, as well as significant improvements in computational efficiency, research on the mechanics of meshing interfaces has achieved groundbreaking progress in theoretical modeling and numerical simulation. In the field of contact mechanics modeling, researchers have established a finite element model for the rolling contact between a cylindrical body and an elastoplastic half-space, innovatively employing moving elliptical or modified elliptical pressure distributions to simulate cylindrical loading [6,7,8]. For spherical contact problems, the three-dimensional frictionless contact behavior between a rigid sphere and a linear kinematic hardening half-space has been systematically investigated by introducing a moving Hertzian pressure distribution [9,10,11]. In the realm of elastoplastic contact theory, scholars have conducted in-depth analyses of the mechanical responses of isotropic strain-hardening and non-hardening elastoplastic half-spaces under cyclic loading by spherical indenters, obtaining for the first time an exact interfacial mechanical solution for the first loading cycle in the fully plastic contact deformation stage. Based on extensive numerical calculations, the research team has mapped out characteristic diagrams of average contact pressure versus deformation mechanisms, covering elastic, perfectly plastic, and elastic-hardening materials [12,13,14]. Notably, studies on the contact behavior between a rigid sphere and a perfectly elastoplastic half-space reveal that as the number of loading cycles increases, the contact pressure distribution gradually deviates from the classical Hertzian solution [15,16,17]. Regarding the influence of material parameters, numerous researchers have systematically examined the multiple loading-unloading processes of elastoplastic spherical contact under various material parameter conditions and proposed a universal solution for average contact pressure based on normalized indentation strain parameters for perfectly plastic materials. The latest dynamic contact research has extended this theoretical framework to spherical indentation problems involving elastoplastic half-spaces with or without strain hardening and strain-rate-dependent constitutive relations [18,19,20]. The key finding is that a normalized strain parameter, defined as the product of yield strain and indentation strain, can uniformly characterize universal solutions for dimensionless global field parameters (e.g., dimensionless average contact pressure) at meshing interfaces [21,22,23]. This theoretical breakthrough provides a foundational basis for predicting the mechanical contact behavior of meshing interfaces under complex working conditions.
Although the aforementioned studies and numerous relevant findings in recent years have provided a vital theoretical foundation for the macroscopic contact mechanics of meshing interfaces under various loading conditions, it must be pointed out that real gear surfaces in mesh are not ideally smooth, but are composed of complex geometric features spanning multiple scales. Therefore, to accurately characterize the local deformation behavior of surface asperities (roughness peaks) during actual contact processes, a multi-scale analysis framework must be established. Against this backdrop, the microcontact theory has emerged. Its core objective is to reveal the deformation evolution mechanism of the contact region of asperities. In the field of rough surface contact theory research, a milestone is the earliest proposed probabilistic contact model. The innovation of this model lies in its first recognition that nominally smooth surfaces are actually composed of asperities distributed over multiple scales, and its pioneering use of the normal distribution to describe the height distribution characteristics of asperities. However, this model has obvious theoretical limitations: it assumes that all asperities have the same radius of curvature and a fixed lateral spacing, which is significantly different from the actual topography of rough surfaces. It is this idealized assumption that leads to the inherent theoretical flaws in all contact mechanics analyses based on this model.
The morphological characteristics of real gear meshing surfaces are traditionally characterized by statistical parameters of surface height distribution, including key parameters such as root mean square roughness, micro-asperity slope, and curvature. However, due to the significant non-stationary and random characteristics of the actual meshing surface morphology, these statistical parameters will fluctuate significantly with changes in the measurement sampling area size and instrument resolution, making them unsuitable as deterministic parameters. Therefore, to achieve precise characterization of gear meshing surface morphology, it is necessary to establish an analysis method based on scale-invariant parameters that are independent of measurement scale and instrument resolution.
The representation methods of scale invariance of geometric similarity features under different magnifications (i.e., self-affine characteristics) have gradually attracted the attention of the academic community. This has in turn promoted the application of fractal geometry in the field of contact mechanics. Fractal geometry provides an effective means for describing, measuring, and even predicting these natural phenomena, studying the response mechanisms of materials to external stimuli, and characterizing the real meshing surface topography. Experimental evidence from high-resolution microscopes has confirmed that the vast majority of actual surfaces exhibit fractal characteristics. The fact that the power spectrum of most contact surfaces follows a power-law characteristic over a wide range of scales has led to the introduction of fractal geometry into contact mechanics research, giving birth to the emerging sub-discipline of “fractal surface contact mechanics”-a field that focuses on studying the multi-scale deformation behavior induced by meshing interfaces with fractal characteristics over a wide range of scales.
The analysis demonstrates that the multi-scale nature of meshing interfaces introduces complexity to contact-related physical phenomena (including deformation and thermal conduction), which substantially complicates the performance assessment of thermo-mechanical systems. The present work proposes to: (1) establish a multi-scale theoretical contact model for meshing interfaces subject to mechanical-thermal coupling effects; and (2) develop correlations between dimensionless parameters characterizing the contact behavior of fractal-based multi-scale meshing interfaces.
2. Multiscale Characterization of Real Meshing Interface Morphology
The core properties of the meshing interface with fractal roughness characteristics are manifested as continuity, non-differentiability, and self-affinity. These scale-invariant mathematical properties are characterized by the Weierstrass-Mandelbrot (W-M) function. In its two-dimensional form, the function maintains dimensional consistency, and its expression is provided. The right-hand side of Equation (1) represents a superposition of cosine spectra with geometric progression distribution. This mathematical structure reflects the self-similarity characteristics of multi-scale features in fractal profiles, where the frequencies exhibit geometric progression growth [24,25,26].
whererepresents the two-dimensional projected length of the meshing interface profile, characterizes the fractal dimension-dependent roughness, is the fractal dimension with the interval constraint (), serves as the characteristic scaling parameter for asperity distribution at meshing interfaces (), which determines the self-affine properties by governing the spectral component density in contact profiles, and is the frequency index whose value determines the weighting contribution of multi-scale features in meshing interface profiles. The frequency indexranges between zero and , where denotes the rounding of the bracketed value to the largest integer, andrepresents the minimum wavelength in the meshing interface profile. To ensure the applicability of continuum medium description,is typically set at 5 to 6 times the material’s lattice spacing. The selection of parametermust satisfy both phase randomization and high spectral density conditions. Research indicates that represents an optimal balance between interface flatness and contact frequency distribution density. This scaling parameterplays another critical role in fractal characterization: when the lateral dimensionis magnified by a factor of, the heightwill be scaled by , expressed as. This self-affine relationship constitutes a fundamental characteristic of self-affine fractals, whose physical essence stems from scale-invariant fundamental physical laws governing specific geometric domains.
To model higher-dimensional random processes, the Weierstrass-Mandelbrot (W-M) function can be generalized using multiple variables [27]. This extension retains the original function’s essential properties—homogeneity, scaling behavior, and self-affinity—as defined in Equation (1). A bivariate formulation enables the simulation of a 3D fractal meshing interface, accurately representing its undulating topography in all directions. By taking the real part of the function, we obtain a height profile that exhibits stochastic variations across any planar orientation.
In the polar coordinate systemdescribing the contact points of a meshing interface at height , the transformation relationship with Cartesian coordinates is expressed as: , . where,andmaintain the same physical meaning and dimensional units as in Equation (1). The termdenotes a uniformly distributed random phase within the interval [0, 2π], generated by a random number generator. Its role is to ensure that the frequency components of the meshing interface profile do not spatially overlap. The parameterrepresents the wavenumber associated with the characteristic sample size, defined as . The angledescribes the ridge offset in the azimuthal direction (under uniform angular offset conditions, ). is a morphological construction parameter indicating the number of superimposed ridges, and its appropriate value can be determined based on the power spectral characteristics of the meshing interface morphology. For a two-dimensional interface with cylindrical undulations, , whereas for a three-dimensional fractal isotropic interface exhibiting axisymmetric power spectral features, the condition must be satisfied.
The height functionof a three-dimensional isotropic surface () is obtained by introducing the roughness parametersatisfying the relationinto Equation (2), and substituting the relational expressions of , , , as well as the value range of into Equation (2).
Classical geometry and fractal geometry differ fundamentally in their conceptualization of dimension. Classical geometry employs an integer-based dimensional framework, where a point is 0-dimensional, a line is 1-dimensional, a plane is 2-dimensional, and a solid is 3-dimensional. In contrast, fractal geometry introduces the innovative concept of fractional dimensions [28,29,30]. Consider a straight line segment: while its classical dimension is unequivocally 1, in fractal geometry, a surface composed of intricately interconnected line segments may exhibit a non-integer dimension between 1 and 2 (for a two-dimensional surface) or between 2 and 3 (for a three-dimensional structure). This fractional dimension quantifies the spatial filling efficiency of the surface’s complex structure [31,32,33]. If a surface that macroscopically resembles a tall mountain but is microscopically composed of countless tiny valleys will have a fractal dimension approaching 2. Conversely, a surface that appears flat at macroscopic scales but exhibits extreme microscopic complexity—such as being covered with nanoscale roughness peaks and valleys—will have a fractal dimension closer to 3. Thus, fractal dimension serves as a quantitative measure of morphological complexity across multiple scales, bridging macroscopic observations with microscopic intricacies. The physical significance of fractal interface roughness can be elucidated as follows: Equations (1, 3) demonstrate that R modulates the amplitude of the frequency components constituting the meshing interface profile. These equations also indicate that fractal interface roughness is a height-scaling parameter independent of frequency. The two-dimensional and three-dimensional functions provided by Equations (1, 3) can be used to generate random rough interface profiles, with the only unknown parameters being the experimentally determinable scale-independent parameters and. Fractal geometry possesses an inherent capability to characterize meshing interfaces across multiple scales (even those differing from the measurement scale), and its description is not constrained by the resolution of imaging instruments or the measurement length scale [34]. A fractal interface can be characterized by three uniquely defined parameters: ,, and.
The length scale range over which an interface exhibits fractal characteristics depends on its morphological structure, with different machining processes contributing to the final contact morphology in distinct ways [35,36]. Taking polishing as an example: at scales less than or equal to the average abrasive particle size, the process behaves as a stochastic process; however, at larger scales (such as wafer planarization), its effects can be described as deterministic. While fractal descriptions are widely adopted for engineering surfaces at micro/nano scales, their macro/mesoscopic morphology still adheres to Euclidean geometry. If the contact interface morphology itself is formed by stochastic processes (thin-film devices fabricated via photolithography), fractal descriptions remain valid even at macroscopic scales, requiring the determination of distinct fractal parameters for different scale ranges to ensure the applicability of the aforementioned fractal surface theory. This implies that a single set of fractal parameters cannot be applied across the entire scale range where fractal behavior is observed. Such interfaces are termed as exhibiting multifractal characteristics.
3. Multiscale Analysis of Meshing Interface Micro-Asperity Contact Mechanics Characteristics
The mechanical properties of the meshing interface are a comprehensive reflection of the interactions between the deformations of multiple micro-asperities, which are triggered by the multi-scale characteristics of the contact surface roughness (as shown in Figure 1). In the study of meshing interface mechanics, it is essential to integrate the contact deformation at the micro-asperity scale with multi-scale surface characterization. As mentioned earlier, the contact interface of two fractal surfaces can be modeled using equations (1, 2, and 3). This model can employ fractal parameters that dominate the power surface spectrum within the target frequency (wavelength) range, or it can use a multi-fractal description method. Based on this, the problem can be simplified under the action of the global surface interference amount , when a deformable fractal surface comes into contact with a rigid plane, multi-scale micro-asperity contact is formed, which exhibits a distinct scale effect (as shown in Figure 2).
In Figure 2, each truncated micro-asperity is modeled as a sphere, with its truncation position determined by the local surface interference distance, thereby forming a circular truncated contact area with a radius of. Therefore, the key to the analysis of interface contact mechanics is to accurately grasp the distribution patterns of micro-asperity contact under a given global surface interference amount, as well as the deformation behavior characteristics at the micro-asperity scale.
For relatively small interferences of the meshing interface, the textured meshing interface only involves several discrete microcontact points of varying sizes. As the meshing interface interference increases, more microcontact points will form, and some of the previously formed microcontact points will grow larger by merging with adjacent microcontact points. Figure 3 shows a similar model, that is, the microcontact points formed when two rough surfaces are in contact under the normal load. These microcontact points are approximately circular spots. Therefore, the actual contact area (the sum of the areas of all microcontact points) is much smaller than the apparent contact area. The microcontact model of the textured meshing interface is simplified as shown in Figure 3. The truncated area of the resulting microcontacts can be described by a power-law relationship. The model describes the non-smooth contact behavior between two meshing interfaces under load, with its distinctive feature being that actual meshing only occurs at discretely distributed asperity contact points, where these micro-contact points exhibit multi-scale distribution characteristics.
whereis the number of micro-asperities within the meshing domain whose contact area is greater than, andrepresents the maximum micro-contact area within the meshing domain. According to Equation (4), the distribution function of micro-asperity contact areas within the meshing domain is written as
whereis determined from the truncated contact areaof the meshing interface profile, and the relationship is expressed as
whererepresents the minimum microcontact area within the meshing domain, which indicates the truncated microcontact area below which the continuous medium mechanics cannot be applied to describe. Due to the existence of , Equation (6) is expressed in the following simplified form.
The total micro-asperity contact areaof the textured meshing interface is determined by the fractal surface height distribution (as shown in Equation (3)), which is the sum of the areas of all pixels greater than the truncated interface height. Correspondingly, and is obtained through Equations (6, 7) and Equation (5), respectively. The spatial distribution of the roughness asperities of the textured meshing interface with a given contact profile has been completely determined. However, sinceis dependent on the contact interference amount(or contact load) of the meshing domain textured interface through, the micro-contact behavior may show significant inconsistency. After the non-smooth interface is truncated by a rigid plane to a certain meshing domain interference amount and the contact area distribution of the textured interface micro-roughness asperities is established (as shown in Equation (5)), it is necessary to further investigate the deformation modes of each micro-contact. A rigorous treatment of this problem demands the introduction of contact deformation equations to accurately capture the micromechanical response of interacting roughness asperities.
The deformation problems of sphere-plane contact (point contact) and cylinder-plane contact (line contact) have become core research topics in three-dimensional and two-dimensional mechanics, respectively. In the study of three-dimensional contact problems, the conventional approach simplifies the microscopic contact between two deformable rough surfaces as a contact model of two spheres with different curvature radii (,), elastic moduli (,), Poisson’s ratios (,), and yield strengths (,). Through equivalent transformation analysis, a spherical asperity model is established with an equivalent curvature radiusand an equivalent elastic modulus. Under normal contact loading, this model determines the critical interferenceat which yielding occurs, ultimately forming a circular microscopic contact area a′ with radius, as illustrated in Figure 1 and Figure 2.
The dimensionless local contact interferenceand the radius of curvature of the meshing interface asperityare represented as
For textured meshing interfaces with effective elastic-plastic material properties (and), various deformation modes may exhibit at the micro-asperity level depending on the values of and, which are functions ofandas shown in Equation (8). The microcontact meshing behavior of textured interfaces is simply described by elastic deformation and fully plastic deformation. A more realistic description would include elastic deformation, elastic-plastic deformation, and fully plastic deformation, while a more precise characterization would involve elastic deformation, linear elastic-plastic deformation, nonlinear elastic-plastic deformation, transient fully plastic deformation, and steady-state fully plastic deformation. Even without considering interfacial strain hardening, the relationship between the dimensionless average contact pressure and the real textured meshing contact area is established for the three deformation modes at the micro-asperity level: elastic deformation, elastic-plastic deformation, and fully plastic deformation.
The deformation mode of a textured meshing interface under micro-contact is governed by the local asperity interferenceand the effective elastic-plastic material propertiesand, as illustrated in Figure 2. A single dimensionless parameter () fails to effectively characterize the deformation evolution in the elastic-plastic transition regime. Instead, it is preferable to treat the ratiosandas independent dimensionless parameters. The micro-contact parameters of the meshing interface, specifically the dimensionless average contact pressureand the ratio of local asperity contact area to real meshing contact area, must be comprehensively analyzed across a wide range ofandvalues. Figure 4 and Figure 5 respectively present the finite element simulation results in the elastic-plastic deformation region. Whenranges between 12-450, the variation patterns ofand the correspondingwith are revealed. All simulation cases indicate that yielding begins at . According to Hertz theory, this implies that elastic deformation occurs within the dimensionless range of local micro-asperity meshing interface interference.
Under normal circumstances, the fractal roughness of micro-textures, the contact load of the meshing interface, and the actual contact area all tend to increase with the increase of the fractal dimension. This is because when the fractal dimensionis high, the fractal texture interface will exhibit relatively smooth and dense surface morphological characteristics. This surface morphology significantly enhances the micro-contact load-bearing capacity, thereby leading to an increase in the actual contact area. Meanwhile, as the fractal roughnessof micro-textures gradually decreases, the contact load and the actual contact area will also show a similar increasing trend. The reason is that a high value means that the surface profile is relatively rough and not dense enough, which directly results in a smaller actual contact area and a correspondingly lower micro-contact load-bearing capacity.
The aforementioned theoretical analysis reveals the influence of the configuration and material parameters on the evolution of the real contact area in multi-scale fractal micro-textured interface morphology. It provides direct guidance for experimental evaluation methods of the real contact area of meshing interfaces, which are constrained by the sampling length and resolution of detection devices. It is particularly pointed out that the multiscale microcontact mechanics analysis is applied to assess the real contact area detection data of meshing interfaces obtained by various experimental techniques such as optical interferometry, X-ray, and tomography scanning. The multiscale microcontact mechanics analysis framework can also be used to evaluate the reliability of non-smooth meshing interface micro-asperity theory and textured micro-element elastic models in characterizing the contact mechanical behavior of multiscale surface textures. Furthermore, the micro-asperity contact mechanics theory described in this topic can be extended by introducing a more comprehensive theoretical system (micro-contact elastoplastic theory) to incorporate the coupled thermoelastic deformation effects between adjacent micro-asperities of the meshing interface under high-load conditions, where elastoplastic behavior dominates.
4. MultiscaleThermomechanicsCharacteristicsAnalysis ofMeshingInterfaceMicro-AsperityContact
While the meshing interface thermal resistance phenomenon has long been recognized, its inconsistency is intricate and challenging to explain, attributed to the combined influence of factors such as the micro-textured morphology of the meshing interface, applied contact pressure, and the thermomechanics characteristics of micro-contact multiscale elements. The thermal resistanceof the meshing interface is a thermal transfer limiting phenomenon dominated by multiscale contact thermo-mechanical coupling effects, which is particularly significant in line contact gear systems with dynamic micro-texture features. As shown in Figure 3, due to the typical multiscale fractal characteristics of the micro-asperities on the meshing interface, the actual effective contact area is significantly smaller than the apparent contact area . The thermal conduction process of the micro-textured meshing interface has the following characteristics: (1) The thermal flow transmission path is strictly limited by the micro-texture morphological features determined by fractal parameters. (2) The thermal transfer efficiency depends on the distribution characteristics of micro-contact points under the interface’s elastic-plastic deformation state. (3) The thermo-mechanical coupling effect at the microscopic scale causes a significant two-way interaction between thermal conduction and elastic deformation. This complex thermal transfer mechanism requires a multiscale thermodynamic analysis method to accurately characterize its thermal transfer behavior, by considering the micro-contact characteristics and thermomechanical coupling effects of the fractal meshing interface.
The characteristics of microcontact thermal resistance depend on the mechanical and thermophysical properties of the textured micro-elements, the morphology of the micro-textured meshing interface, and any interstitial material (or film) that may exist between the gears interfaces. Considering a vacuum environment where convective thermal transfer is absent and thermal conduction is negligible, the interfacial thermal resistance characteristics can be analyzed through the thermal conduction of the micro-textured contact points. The contact thermal conductivity coefficient of the textured micro-elements is expressed as
where,is the total thermal flux load between the meshing interfaces, and , whereandare the nominal contact temperatures of meshing interfaces (1) and (2), respectively.andrepresent the thermal conductivities of the meshing interfaces (1) and (2), respectively. is the total number of micro-asperity contacts in the meshing domain when the interference amount of the textured interface is . The value ofis determined by, and the specific expression is selected from the equations based on the deformation mode.
In the rolling/sliding line contact meshing interface, micro-asperities not only limit the thermal flux conduction but also cause the gear surface temperature to rise. Based on the two-dimensional fractal thermal conduction theory of line contact interface with the distribution density function of gear surface temperature rise, this study fully considers the proportion of the actual contact area affected by the gear surface temperature rise and the maximum temperature rise within the fractal domain under high-speed/low-speed rolling/sliding line contact conditions, and introduces a three-dimensional fractal method based on the dimensionless average temperature rise. This method is proposed at the micro-asperity contact by simplifying the concept.
wheredenotes the mean temperature rise during low-speed rolling/sliding, whilerepresents the mean temperature rise during high-speed rolling/sliding. The occurrence of low-speed or high-speed rolling/sliding is determined by the Peclet number , whereindicates the relative sliding velocity at the micro-contact interface,is density, andis specific thermal capacity. For low-speed rolling/sliding (), the thermal flux will conduct into both meshing interfaces see Figure 6. Whereas for high-speed rolling/sliding (), the thermal flux will transfer from the hotter micro-interface to the relatively cooler one, as illustrated in Figure 7.
In the analysis of microcontact thermal characteristics, the meshing interface microtexture morphology and thermodynamic properties are optimized and corrected through iterative methods until the microcontact analysis yields a distribution of micro-asperity contact unit sizes that meets the following conditions: under the given contact load, apparent contact area, rolling and sliding speed, and microcontact friction coefficient, the temperature increase at the meshing interface is within the expected range.
This analysis is based on the following assumptions: 1) The influence of the thermoelastic effect on the deformation of micro-asperity contact can be considered a secondary factor; 2) The micro-asperity contact area used in the temperature calculation is determined by the contact mechanics method described in the previous section. To calculate the thermoelastic performance parameters corresponding to the micro-asperity contact area required under specific temperature rise conditions, they can be substituted into the corresponding contact mechanics equations after the iterative calculations are completed. It should be noted that although this method achieves indirect coupling of thermal and mechanical analyses, it does not directly consider the effect of temperature on the size of micro-asperity contact units. For more accurate analysis, a fully coupled thermomechanical analysis method can be employed to solve the meshing interface heat conduction process and contact deformation behavior simultaneously.
5. Analysis ofMeshingLoad-BearingCharacteristics ofTexturedInterfaceConsideringFractalDimension
This study is based on fractal theory and establishes a fractal characterization parameter system that considers the characteristics of micro-contact elements of textured interfaces. Through theoretical derivation, the micro-contact load equation and actual contact area equation between textured micro-elements of meshing interfaces are obtained. The influence of mechanisms of key parameters, such as the friction coefficient and the peak amplitude of micro-asperities, on the mechanical properties of textured interfaces (including normal stiffness, viscous damping, and average contact load coefficient) are analyzed. A quantitative relationship model between the morphological characteristics of textured micro-elements and the meshing load-bearing characteristics is constructed. Based on the established mathematical model of micro-contact of textured interfaces, the dynamic evolution laws of meshing load-bearing characteristics of textured interfaces under different fractal characterization parameters are studied using MATLAB numerical simulation methods. The research results can provide theoretical basis and parameter guidance for the optimization design of meshing tooth surface texture micro-element configurations, thereby achieving the optimal load-bearing performance of textured interfaces.
Based on different fractal dimensions and using MATLAB simulations, the relationship between the contact load of textured micro-elements and the actual contact area of the interface within the meshing region is analyzed. As shown in Figure 8 (left), under the same meshing load, as the contact area of the textured interface increases, the unit micro-element area decreases, and the load-bearing capacity of the meshing interface is enhanced. The results indicate a proportional linear relationship between the load of the textured interface and the actual contact area. The analysis shows that as the fractal dimension increases, the slope of the variation curve gradually increases and reaches its maximum value at a fractal dimension of [], thereby demonstrating that the textured interface exhibits the best average contact load coefficient at this fractal dimension. In Figure 8 (right), it can be observed that at a fractal dimension of [], if the slope of the variation curve shows a declining trend, it indicates the existence of an optimal constant value for this fractal dimension. Specifically, when the fractal dimension of the textured micro-elements is [], the micro-contact interface achieves the best meshing load-bearing performance.
The simulation results in Figure 9 demonstrate a significant positive correlation between the asperities micro-contact area of the textured interface and the proportion of elastic micro-elements: as the textured contact area of the gear pair tooth surfaces increases, the proportion of elastic micro-elements in the micro-contact area of the meshing domain shows a monotonically increasing trend.
In contrast, the fractal dimension of the micro-texture has a pronounced negative impact on the proportion of elastic micro-elements, the proportion of elastic micro-elements decreases systematically with the increase of fractal dimension. It is particularly noteworthy that when the fractal dimension reaches the critical value [], this downward trend accelerates significantly. This phenomenon reveals the essential influence of the increase in fractal dimension on the asperities micro-contact mechanical behavior of the micro-textured meshing interface: the increase in fractal dimension significantly enhances the stress concentration effect at the tips of the asperities micro-contact units, thereby leading to the rapid expansion of the plastic deformation area and ultimately resulting in a substantial decrease in the proportion of elastic micro-elements.
6. Discussion of the Results
This paper proposes a general multi-scale theoretical approach for texturized meshing interfaces that exhibit self-affine micro-contact behavior. The core objective is to introduce a rigorous mathematical treatment method for the basic mechanical and thermal characteristics of micro-contact interfaces with multi-scale roughness. This analysis can be further extended by introducing more complex contact mechanics treatment methods, covering the deformation of adjacent micro-contacts, rolling and sliding friction, and the influence of thermal effects on contact deformation. The paper uses dimensionless forms of the meshing interface micro-texture morphology, mechanical and thermal parameters to analyze the mechanical and thermal characteristics of micro-contact interfaces with multi-scale roughness. The correlations established between various dimensionless quantities in the paper provide an effective means for real-time solution of the rolling and sliding line contact textural micro-element interface parameters (actual contact area and thermal contact conductivity). The most critical contribution of this paper is undoubtedly the establishment of a theoretical framework for the study of the thermo-mechanical characteristics of micro-contact textured meshing interfaces.
7. Conclusion
The in-depth investigation of the mechanical contact behavior and thermal transfer mechanism of micro-texturized meshing interfaces is of great significance in both traditional and modern technological fields. To regulate the complex physical mechanisms behind the micro-contact phenomena of textured meshing interfaces, it is necessary to focus on the hierarchical structure of the textural micro-element morphology and employ a multi-scale approach to handle the textural micro-elements. Combining the fractal geometry-based method, which provides a realistic and scale-invariant description of the interface micro-contact, with the hybrid analytical-numerical method that uses a constitutive model at the scale of micro-protrusions, is crucial for in-depth research on interface micro-contact phenomena at different length scales. The importance of this research method cannot be overstated, as it can influence the design of the configuration of textural micro-elements with rolling and sliding line contact meshing interfaces, which in turn is related to the operating efficiency of ship power transmission systems.
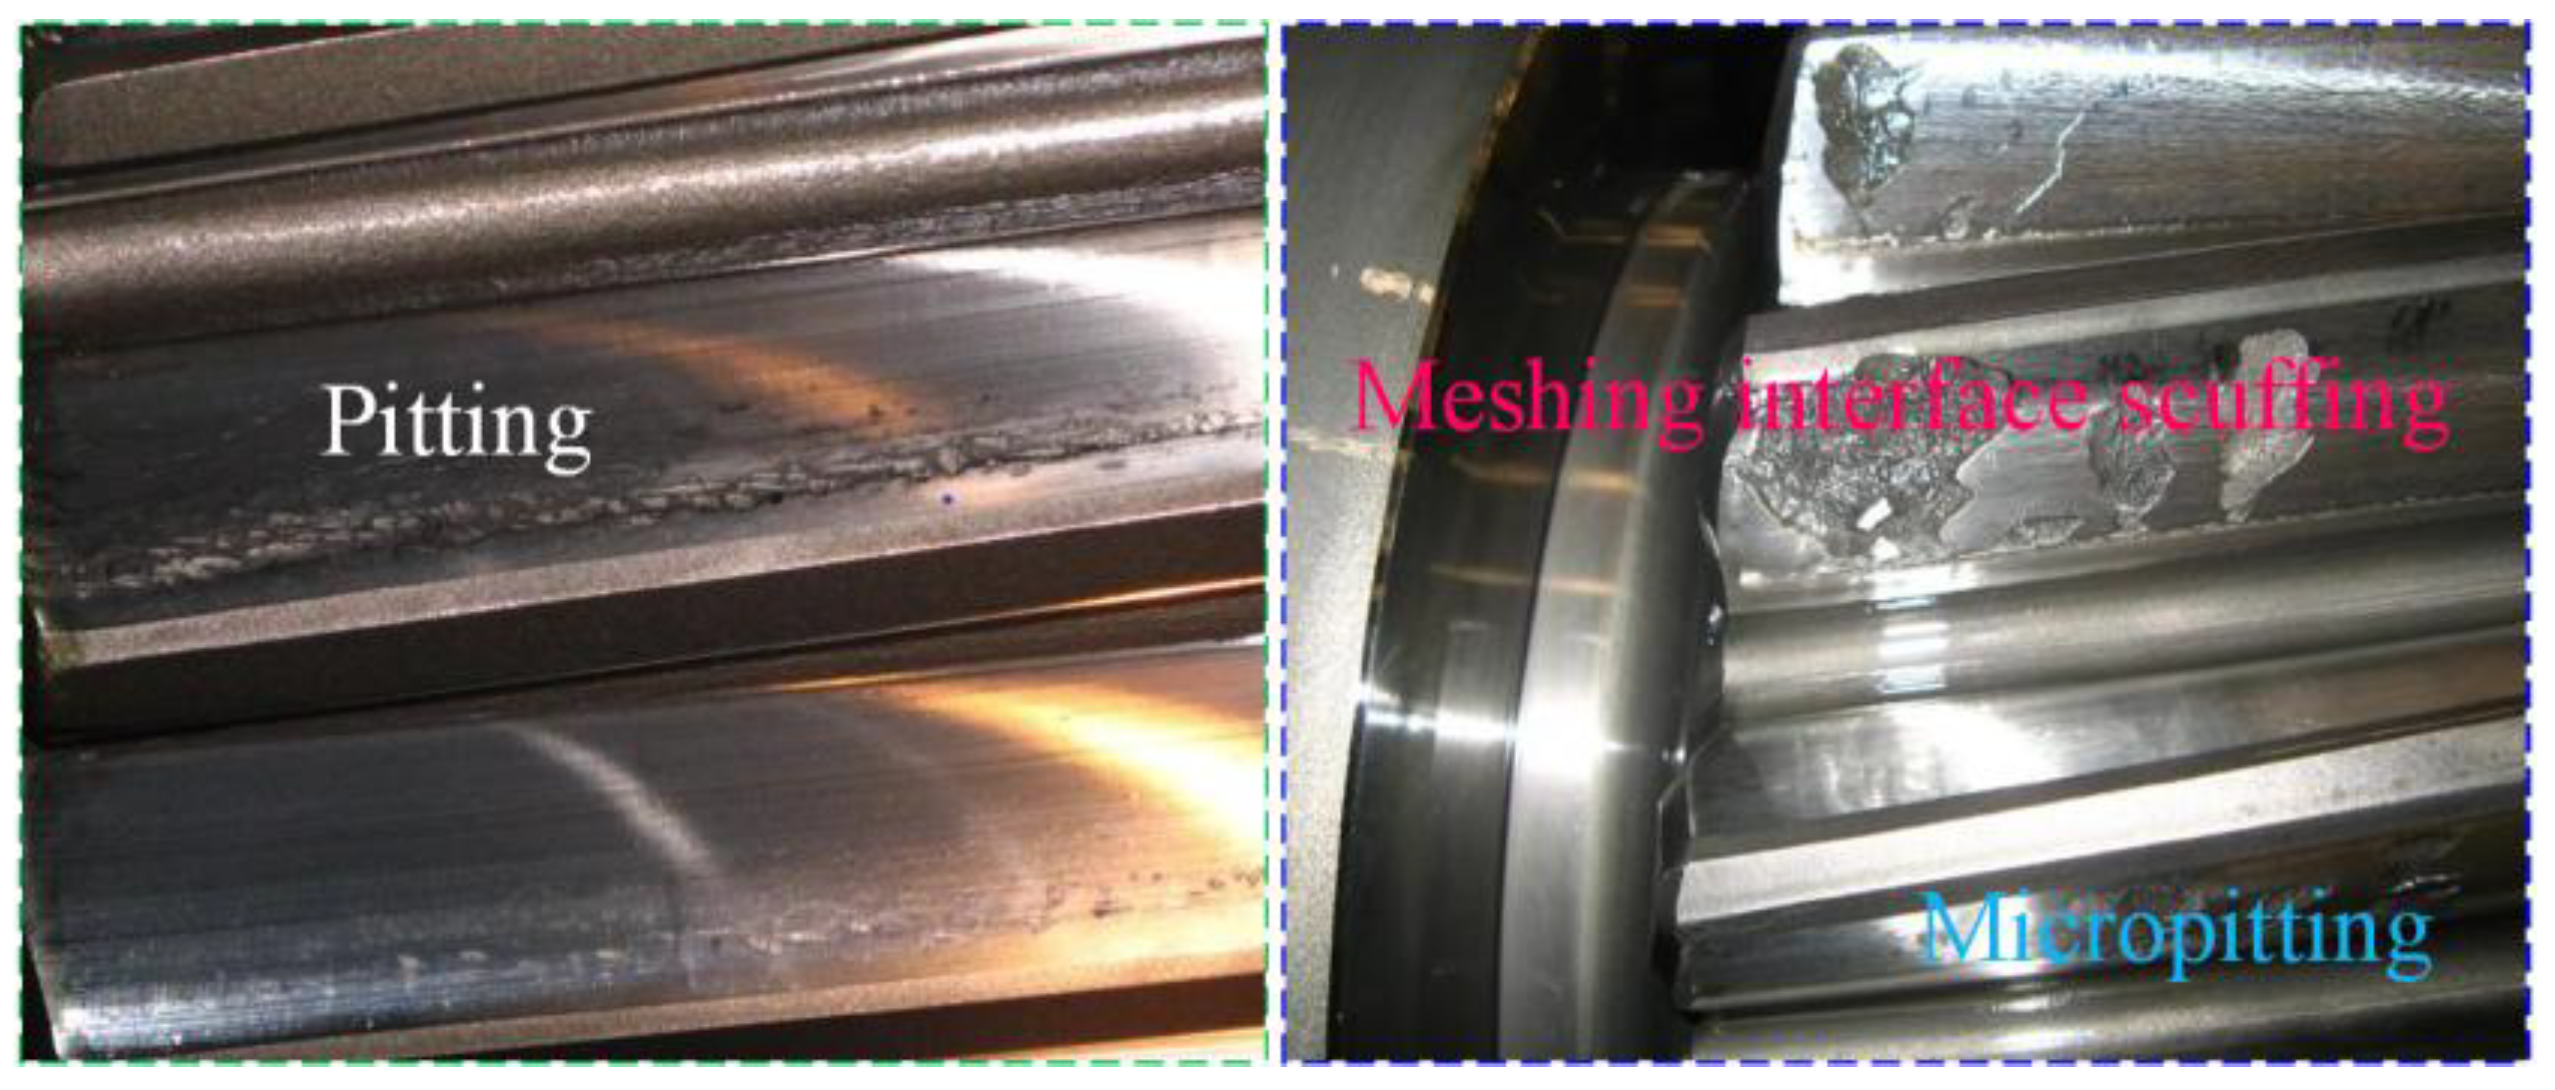
Gears, serving as the core components for torque transmission, are produced in a wide variety of sizes and are distinguished by their high load-bearing capacity and transmission efficiency. These characteristics are essential for ensuring the reliability and operational precision of Marine Power Rear Transmission Systems (MPRTS). When operating in specialized marine environments, MPRTS are subjected to extreme conditions, including but not limited to extreme high and low temperatures; intense pressures (reaching 200–300MPa, equivalent to 2000–3000 times atmospheric pressure); and corrosive exposure to strong acids and alkalis. The harsh marine environment poses significant challenges for MPRTS, particularly in terms of material degradation caused by acid-alkali corrosion. Over extended periods, MPRTS are continuously exposed to alternating conditions characterized by high temperature, high humidity, high salt fog, and seawater spray. This leads to severe electrochemical corrosion issues. As illustrated in Figure 10, gears experience contact fatigue and scuffing during operation under load. High-end equipment requires gears with even greater load-bearing capacity and serviceability, making the management of deep-sea gear load-bearing capacity a critical concern. Although advanced manufacturing techniques—such as surface hardening and precision machining—have enhanced gear load-bearing capacity to some degree, they still fall short of meeting the continuously rising demands for service life and load capacity. Frequent equipment failures resulting from inadequate gear strength remain common, underscoring that gear load-bearing capacity is a key bottleneck restricting the performance and reliability of power rear transmission systems.
This research achievement will help address the limitations of previous studies on the time - varying friction Thermo-Elastic Hydrodynamic Lubrication (TEHL) characteristics of MPRTS in service performance, which inadequately considers the microscopic morphology of the rolling/sliding transition points/lines at the contact interface. It innovatively proposes to adjust the multi-scale characterization parameters of Interface Micro-Texture (IMT) to achieve optimal interface lubrication characteristics and meshing load-bearing performance. This breakthrough overcomes the application bottleneck of traditional lubrication being ineffective under extremely harsh working conditions. It has been proven that gear surfaces with Micro -Textured Meshing Interface (MTMI) can maintain a low-friction state at the line contact interface for a long time, providing a possible solution for the homogeneous Interface Enriched Lubrication (IEL) effect and Anti-Scuffing Load-Bearing Capacity (ASLBC) of gear surfaces in the meshing domain of MPRTS under extreme working conditions of high speed and heavy load. By studying the micro-contact load-bearing evolution mechanism of textured interface TEHL characteristics under the influence of multi-scale characterization parameters, the cross-scale coupling of macroscopic parameters such as stress field, film thickness field, temperature field with micro-contact geometry and load distribution, as well as microscopic parameters such as asperity and texture direction, will further improve the theoretical system of meshing interface lubrication under extreme working conditions. It also provides important theoretical basis and technical support for enhancing the ASLBC of meshing gear surfaces in MPRTS, with significant engineering application value and academic innovation significance.
Author Contributions
Conceptualization, X. G. Wang. and Y. M. Wang; methodology, W. Q. Zou; software, J. F. Ruan; validation, X. G. Wang, Y. M. Wang and J. F. Ruan; formal analysis, W. Q. Zou; investigation, J. F. Ruan; resources, Y. M. Wang; data curation, W. Q. Zou; writing—original draft preparation, W. Q. Zou and X. G. Wang; writing—review and editing, X. G. Wang, Y. M. Wang and J. F. Ruan; visualization, J. F. Ruan; supervision, J. F. Ruan and W. Q. Zou; project administration, Y. M. Wang and W. Q. Zou. All authors have read and agreed to the published version of the manuscript.
Funding
The research subject was supported by the National Natural Science Foundation Sponsored Project (Project Approval Number: 52475257), the National Key Research and Development Program Project (Grant No. 2023YFB3406301), the Fund Project for Technological Field of National Defense Science and Technology Plan 173 (2024-JCJQ-JJ-2020) and (2024-JCJQ-JJ-2043), the Marine Propulsion Research and Development (MPRD) Program (Grant No. MG20220203) and the Supported by the Scientific Research Funds of Huaqiao University (605-50Y23032).
Institutional Review Board Statement
Not applicable.
Informed Consent Statement
Not applicable.
Data Availability Statement
The original contributions presented in this study are included in the article. Further inquiries can be directed to the corresponding author.
Acknowledgments
The authors would like to thank the Huaqiao University (HQU), Heilongjiang Institute of Technology (HLJIT), and the Harbin Institute of Technology (HIT) for their support.
Contribution of each individual co-author:
No conflict of interest exits in the submission of this manuscript, and manuscript is approved by all authors for publication. We would like to declare on behalf of our co-authors that the work described was original research that has not been published previously, and not under consideration for publication elsewhere, in whole or in part. All the authors listed have approved of the manuscript that is enclosed.
References
- Aggarwal, S.; Pandey, R.K. Frictional and load-carrying behaviours of micro-textured sector shape pad thrust bearing incorporating the cavitation and thermal effects. Lubr. Sci. 2017, 29, 255–277. [Google Scholar] [CrossRef]
- Sánchez, M.B.; Pleguezuelos, M.; Pedrero, J. Strength model for bending and pitting calculations of internal spur gears. Mech. Mach. Theory 2019, 133, 691–705. [Google Scholar] [CrossRef]
- Croccolo, D.; De Agostinis, M.; Olmi, G.; Vincenzi, N. A Practical Approach to Gear Design and Lubrication: A Review. Lubricants 2020, 8, 84. [Google Scholar] [CrossRef]
- Özdemir, M.N.; Kılıç, V.; Ünlüsoy, Y.S. A new contact & slip model for tracked vehicle transient dynamics on hard ground. J. Terramechanics 2017, 73, 3–23. [Google Scholar] [CrossRef]
- Wang, W.; He, Y.Y.; Zhao, J.; Mao, J.Y.; Hu, Y.T.; Luo, J.B. Optimization of groove texture profile to improve hydrodynamic lubrication performance: Theory and experiments. Friction 2020, 8, 83–94. [Google Scholar] [CrossRef]
- Marques, P.M.T.; Marafona, J.D.M.; Martins, R.C.; Seabra, J.H.O. A continuous analytical solution for the load sharing and friction torque of involute spur and helical gears considering a non-uniform line stiffness and line load. Mech. Mach. Theory 2021, 161, 104320. [Google Scholar] [CrossRef]
- Wang, Y.; Azam, A.; Zhang, G.; Dorgham, A.; Liu, Y.; Wilson, M.C.T.; Neville, A. Understanding the Mechanism of Load-Carrying Capacity between Parallel Rough Surfaces through a Deterministic Mixed Lubrication Model. Lubricants 2022, 10, 12. [Google Scholar] [CrossRef]
- Petare, A.C.; Mishra, A.; Palani, A.; Jain, N.K. Study of laser texturing assisted abrasive flow finishing for enhancing surface quality and microgeometry of spur gears, Int. J. Adv. Manuf. Technol. 2019, 101, 785–799. [Google Scholar] [CrossRef]
- Liu, W.L.; Ni, H.J.; Wang, P.; Chen, H.L. Investigation on the tribological performance of micro-dimples textured surface combined with longitudinal or transverse vibration under hydrodynamic lubrication. Int. J. Mech. Sci. 2020, 174, 105474. [Google Scholar] [CrossRef]
- Chang, X.; Renqing, D.; Liao, L.; Zhu, P.; Lin, B.; Huang, Y.; Luo, S. Study on hydrodynamic lubrication and friction reduction performance of spur gear with groove texture. Tribol. Int. 2023, 177, 107978. [Google Scholar] [CrossRef]
- Černe, B.; Petkovšek, M.; Duhovnik, J.; Tavčar, J. Thermo-mechanical modeling of polymer spur gears with experimental validation using high-speed infrared thermography. Mech. Mach. Theory 2024, 146, 103734. [Google Scholar] [CrossRef]
- Liang, X.H.; Zuo, M.J.; Feng, Z.P. Dynamic modeling of gearbox faults: A review. Mech. Syst. Signal Process. 2018, 98, 852–876. [Google Scholar] [CrossRef]
- Ammosov, L.; Mönkkönen, K.; Suvanto, M. Precise fabrication of microtextured stainless steel surfaces using metal injection moulding. Precis. Eng. 2020, 62, 89–94. [Google Scholar] [CrossRef]
- Zhao, J.; Hou, L.; Li, Z.; Zhang, H.; Zhu, R. Prediction of tribological and dynamical behaviors of spur gear pair considering tooth root crack. Eng. Fail. Anal. 2022, 135, 106145. [Google Scholar] [CrossRef]
- Brown, C.; Nescio, M.; Chadha, V.; Zheng, C.; Abelev, E.; Chmielus, M.; Jacobs, T. The Difficulty of Measuring Surface Topography in Additive Manufacturing: A Comparison Between Measured and True Surface Features of Binder-Jet Printed Samples. J. Tribol. 2025, 1–24, (24 pages). [Google Scholar] [CrossRef]
- Rosenkranz, A.; Grützmacher, P.G.; Gachot, C.; Costa, H.L. Surface texturing in machine elements-A critical discussion for rolling and sliding contacts. Adv. Eng. Mater. 2019, 21, 1900194. [Google Scholar] [CrossRef]
- Wang, X.G.; An, S.Y.; Wang, Y.M.; Ruan, J.F.; Ji, S.E. TEM fitting considering TEPs of contact interface of meshing gear. J. Mech. Sci. Technol. 2021, 35, 4443–4457. [Google Scholar] [CrossRef]
- Sivayogan, G.; Dolatabadi, N.; Johns-Rahnejat, P.; Rahmani, R.; Rahnejat, H. Non-Newtonian Thermo-Elastohydrodynamics and Sub-Surface Stress Field of High-Performance Racing Spur Gears. Lubricants 2022, 10, 146. [Google Scholar] [CrossRef]
- Xing, Y.Q.; Li, X.; Hu, R.Y.; Long, X.Y.; Wu, Z.; Liu, L. Numerical analyses of rectangular micro-textures in hydrodynamic lubrication regime for sliding contacts. Meccanica 2019, 56, 365–382. [Google Scholar] [CrossRef]
- Rajput, H.; Atulkar, A.; Porwal, R. Optimization of the surface texture on piston ring in four-stroke IC engine. Mater. Today: Proc. 2021, 44, 428–433. [Google Scholar] [CrossRef]
- Zhang, N.; Zhai, W.; Yin, S.; Chen, S.; Xia, J.; Luan, L.; Zhai, A. Deep-sea soft soil and deep-sea mining vehicle interaction: From soil properties to locomotion performance. Appl. Ocean Res. 2025, 154, 104372. [Google Scholar]
- Li, Z.; Xiao, H.; Tang, Y.; Liang, G.; Wang, L.; Yang, J. A deterministic model of surface profile degradation for evaluating time-varying mesh stiffness and dynamic responses of spur gear considering tooth surface wear evolution. Mech. Syst. Signal Process. 2025, 225, 112313. [Google Scholar] [CrossRef]
- Gupta, N.; Tandon, N.; Pandey, P.K.; Vidyasagar, K.E.Ch.; Kalyanasundaram, D. Tribodynamic studies of textured gearsets lubricated with fresh and MoS2 blended greases. Tribol. Int. 2022, 165, 107247. [Google Scholar] [CrossRef]
- Wang, X.G.; Huang, H.; Song, J.Y.; Wang, Y.M.; Ruan, J.F. Numerical Analysis of Friction Reduction and ATSLB Capacity of Lubricated MTMI with Textured Micro-Elements. Lubricants 2023, 11, 78. [Google Scholar] [CrossRef]
- Wos, S.; Koszela, W.; Pawlus, P. Comparing tribological effects of various chevron-based surface textures under lubricated unidirectional sliding. Tribol. Int. 2020, 146, 106205. [Google Scholar] [CrossRef]
- Sivayogan, G.; Dolatabadi, N.; Johns-Rahnejat, P.; Rahmani, R.; Rahnejat, H. Non-Newtonian Thermo-Elastohydrodynamics and Sub-Surface Stress Field of High-Performance Racing Spur Gears. Lubricants 2022, 10, 146. [Google Scholar] [CrossRef]
- Yang, Y.; Tang, J.; Hu, N.; Shen, G.; Li, Y.; Zhang, L. Research on the time-varying mesh stiffness method and dynamic analysis of cracked spur gear system considering the crack position. J. Sound Vib. 2023, 548, 117505. [Google Scholar] [CrossRef]
- Kaneta, M.; Matsuda, K.; Nishikawa, H. The Causes of Asymmetric Deformation of Surface Roughness Asperities in Elastohydrodynamic Lubrication Contacts. J. Tribol. 2022, 144, 061601, (12 pages). [Google Scholar] [CrossRef]
- Cheng, G.; Ma, J.; Li, J.; Sun, K.; Wang, K.; Wang, Y. Study on the Dynamic Characteristics of Gears Considering Surface Topography in a Mixed Lubrication State. Lubricants 2024, 12, 7. [Google Scholar] [CrossRef]
- Mu, X.K.; Sun, W.; Liu, C.; Wang, Y.L.; Yuan, B.; Sun, Q.C. Study on rough surfaces: A novel method for high-precision simulation and interface contact performances analysis. Precis. Eng. 2022, 73, 11–22. [Google Scholar]
- Li, C.; Qiu, X.; Yu, Z.; Li, S.; Niu, Q.; Kurniawan, R.; Ko, T. Novel Environmentally Friendly Manufacturing Method for Micro-Textured Cutting Tools. Int. J. Precis. Eng. Manuf. -Green Technol. 2021, 8, 193–204. [Google Scholar] [CrossRef]
- Cao, P.; Li, Q.; Feng, K.; Qin, Y. Dynamic modeling of spur gear transmission system with evolutive coupling fault of fatigue crack and wear. Eng. Fail. Anal. 2024, 156, 107820. [Google Scholar] [CrossRef]
- Wu, J.P.; Yang, C.B.; Liu, C.; Wang, Y.L.; Zhang, H.S.; Wang, L.Y.; Li, H.Y. Numerical analysis of micro-textured friction element interface temperature fields under mixed lubrication. Int. Commun. Heat Mass Transf. 2025, 163, 108743. [Google Scholar] [CrossRef]
- Ding, H.; Zhang, W.Z.; Wu, H.; Chen, T.; Li, S.; Li, H.; Zhou, Z.; Hu, X. Multi-field coupling lubrication interface heat transfer model for hypoid gear transmission. Int. Commun. Heat Mass Transf. 2024, 154, 107451. [Google Scholar] [CrossRef]
- Li, Z.H.; Jiang, M.J.; Guo, X.H.; Zhang, K.D. Improving the frictional properties of the tool/chip interface of micro-textured ceramics tools by using electromagnetic-assisted nanofluids. Mater. Today Commun. 2024, 39, 109017. [Google Scholar] [CrossRef]
- Di, J.; Fan, Z.; Zhang, H.; Wang, C.; Wang, J.; Peng, C. Numerical and experimental studies of cavitation damage characteristics of 17-4PH stainless steel under array groove structure. J. Tribol. 2025, 1–29, (29 pages). [Google Scholar] [CrossRef]
Figure 1.
Asperity-scale confined micro-contacts of meshing interface.
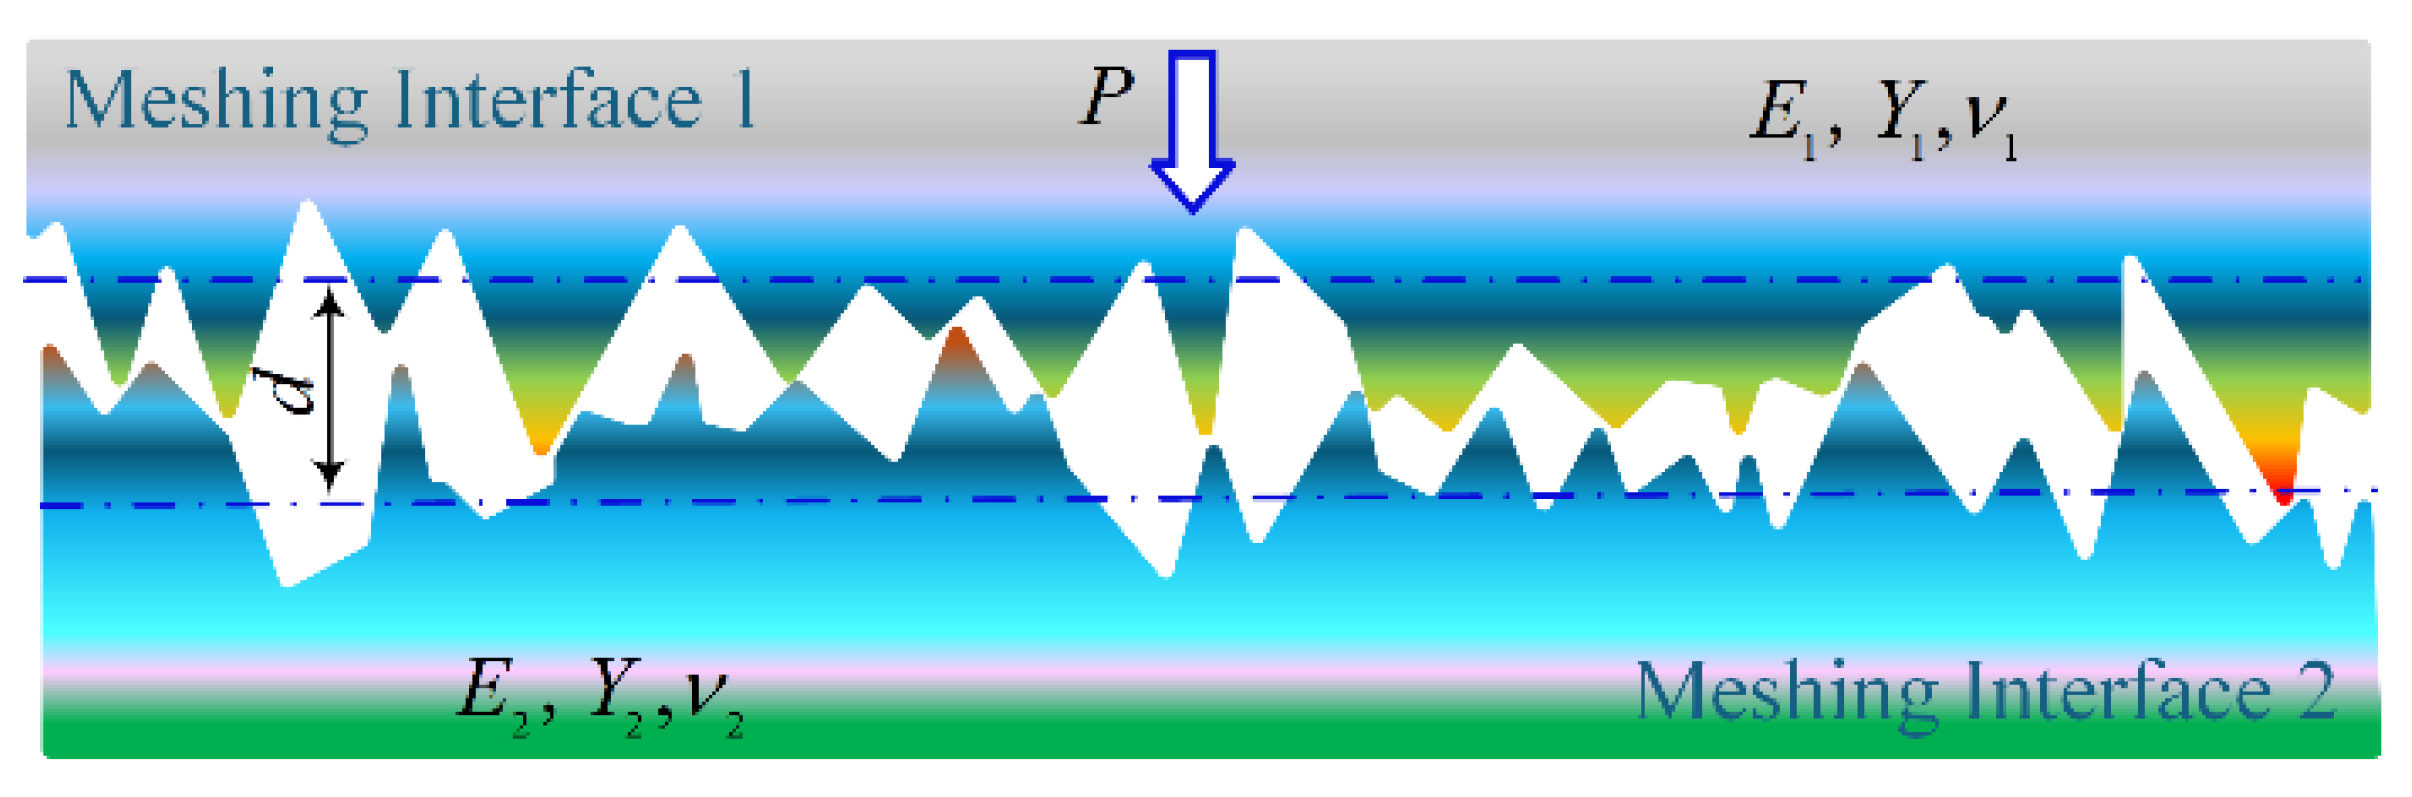
Figure 2.
A micro-contact model is developed for rigid spherical asperities interacting with an elastoplastic half-space, incorporating equivalent elastoplastic material parameters and a fractal-based representation of the rigid rough meshing interface (where the power spectral density dominates within the target frequency range). The model describes the contact configuration between the deformable half-space and the truncated asperities.
Figure 2.
A micro-contact model is developed for rigid spherical asperities interacting with an elastoplastic half-space, incorporating equivalent elastoplastic material parameters and a fractal-based representation of the rigid rough meshing interface (where the power spectral density dominates within the target frequency range). The model describes the contact configuration between the deformable half-space and the truncated asperities.
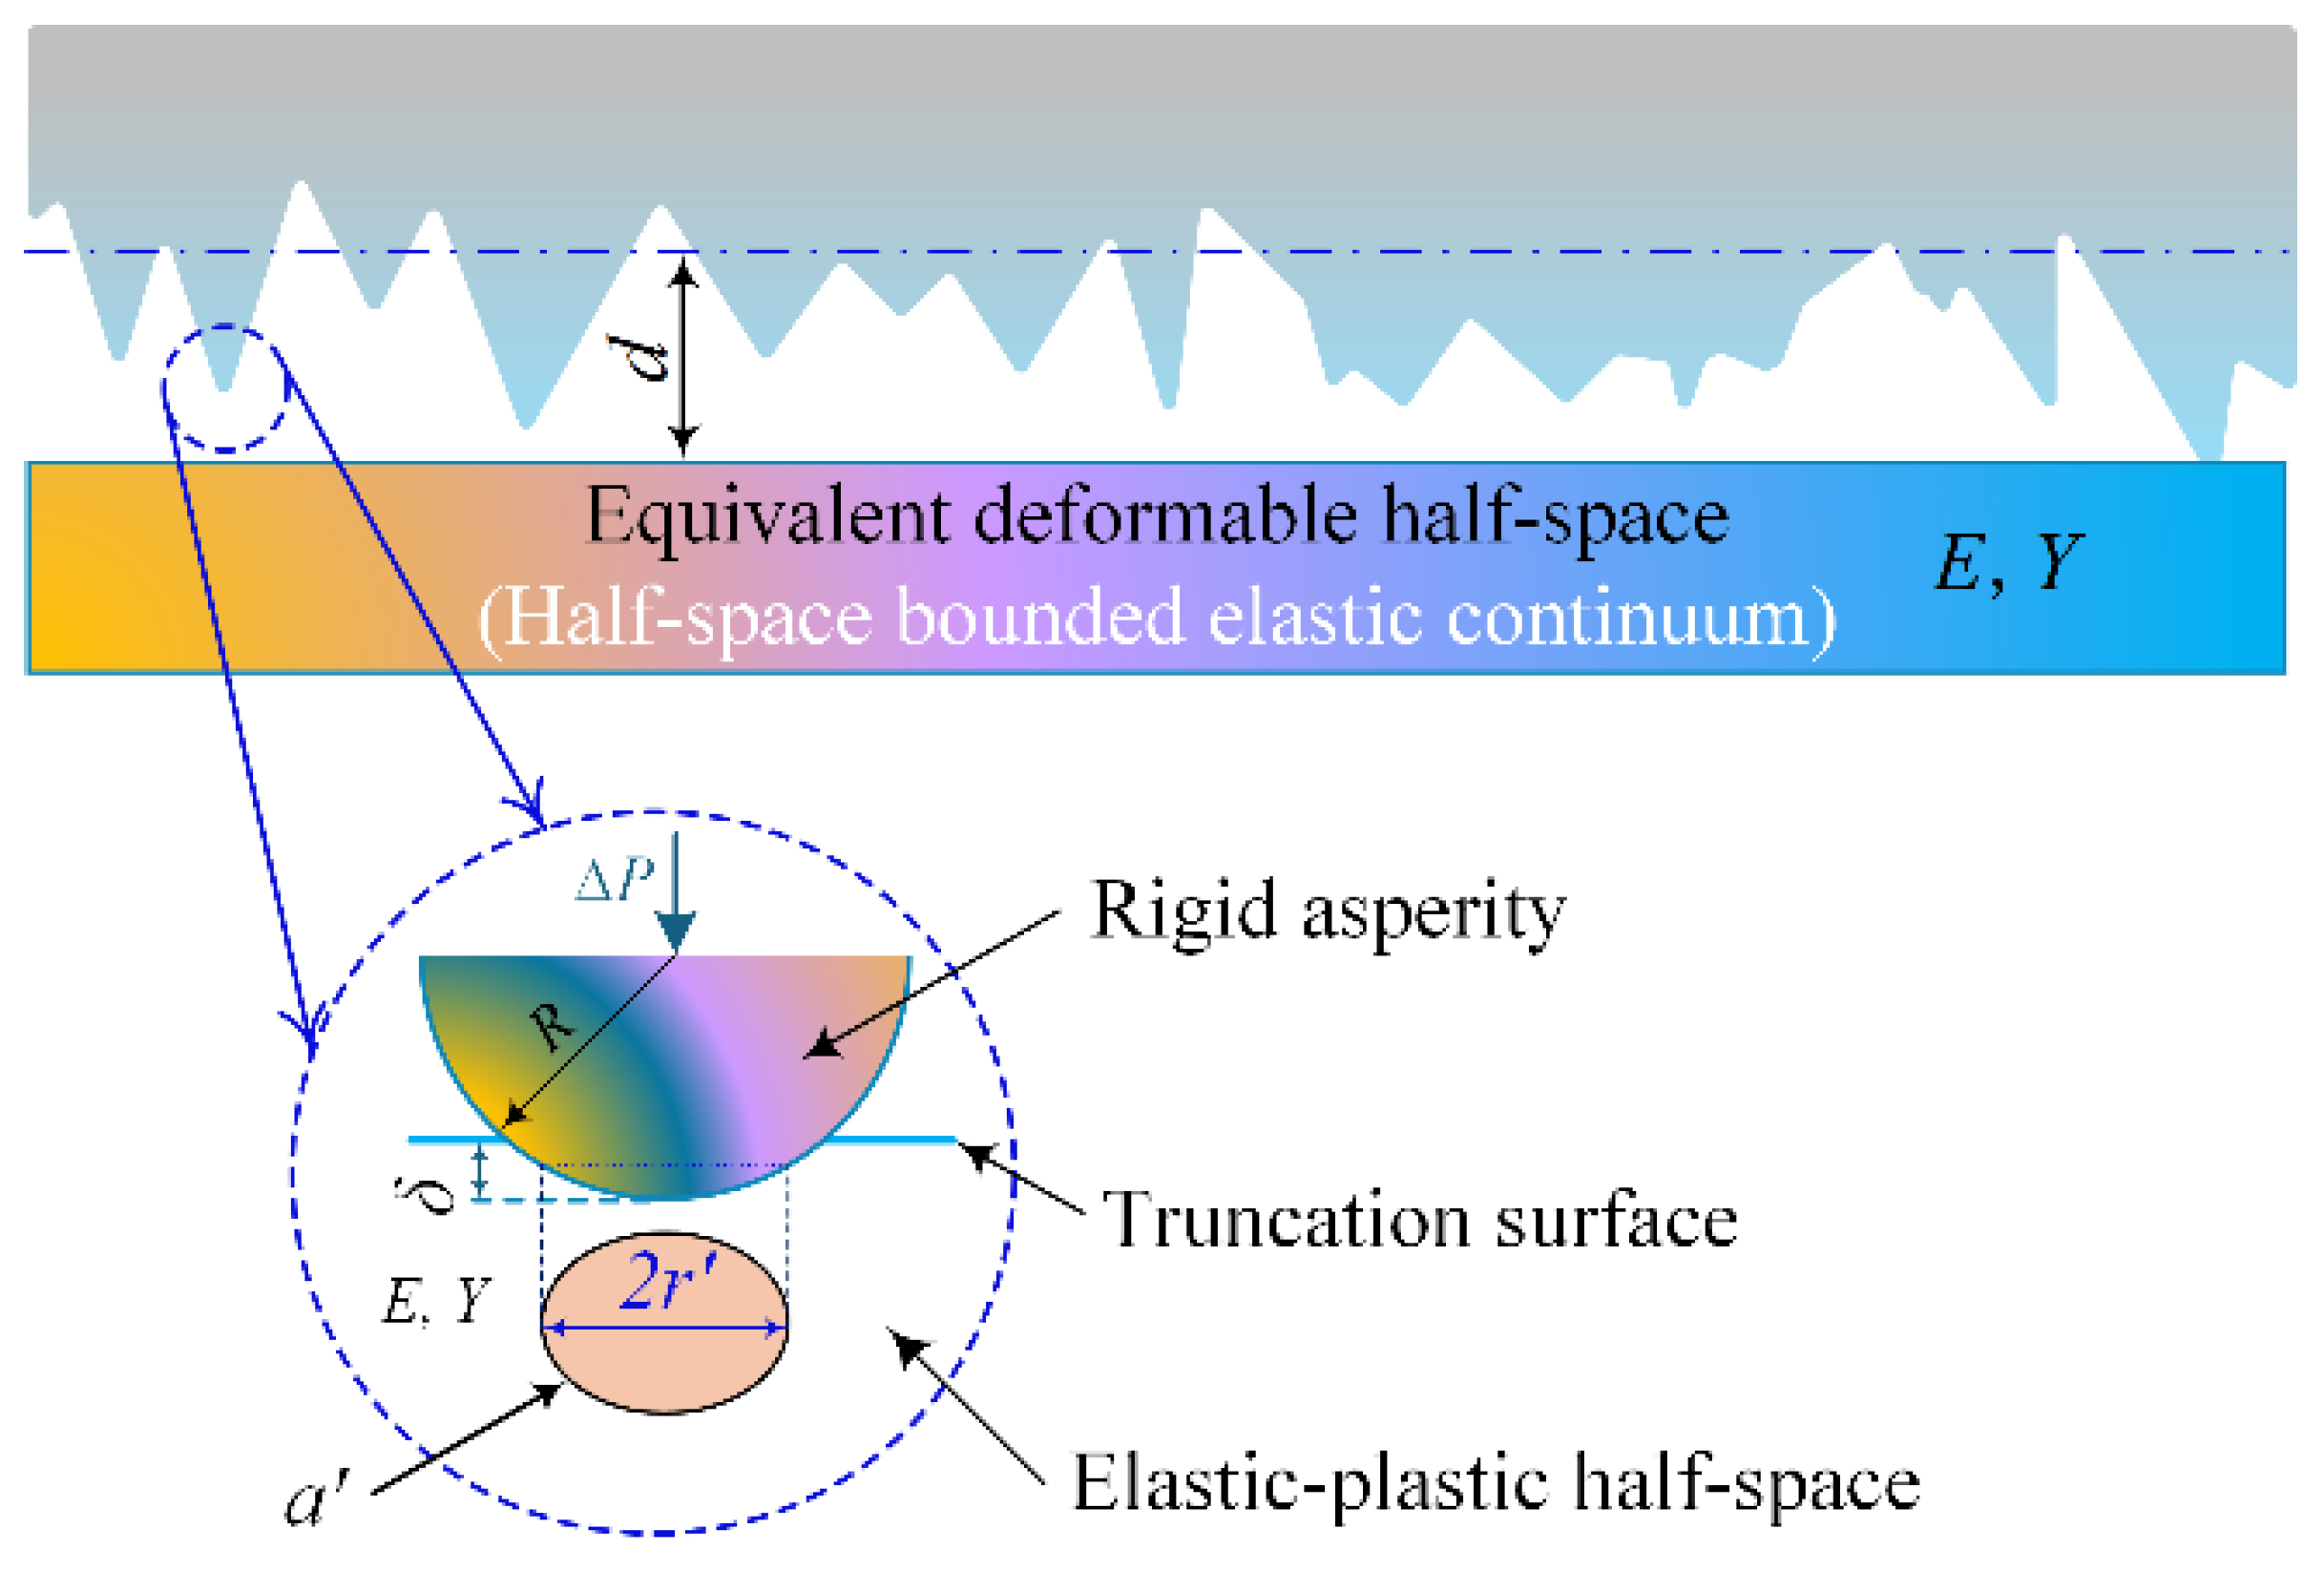
Figure 3.
A non-smooth contact model of two meshing interfaces underload indicates that the actual meshing occurs at micro- asperities contacts points of varying sizes.
Figure 3.
A non-smooth contact model of two meshing interfaces underload indicates that the actual meshing occurs at micro- asperities contacts points of varying sizes.
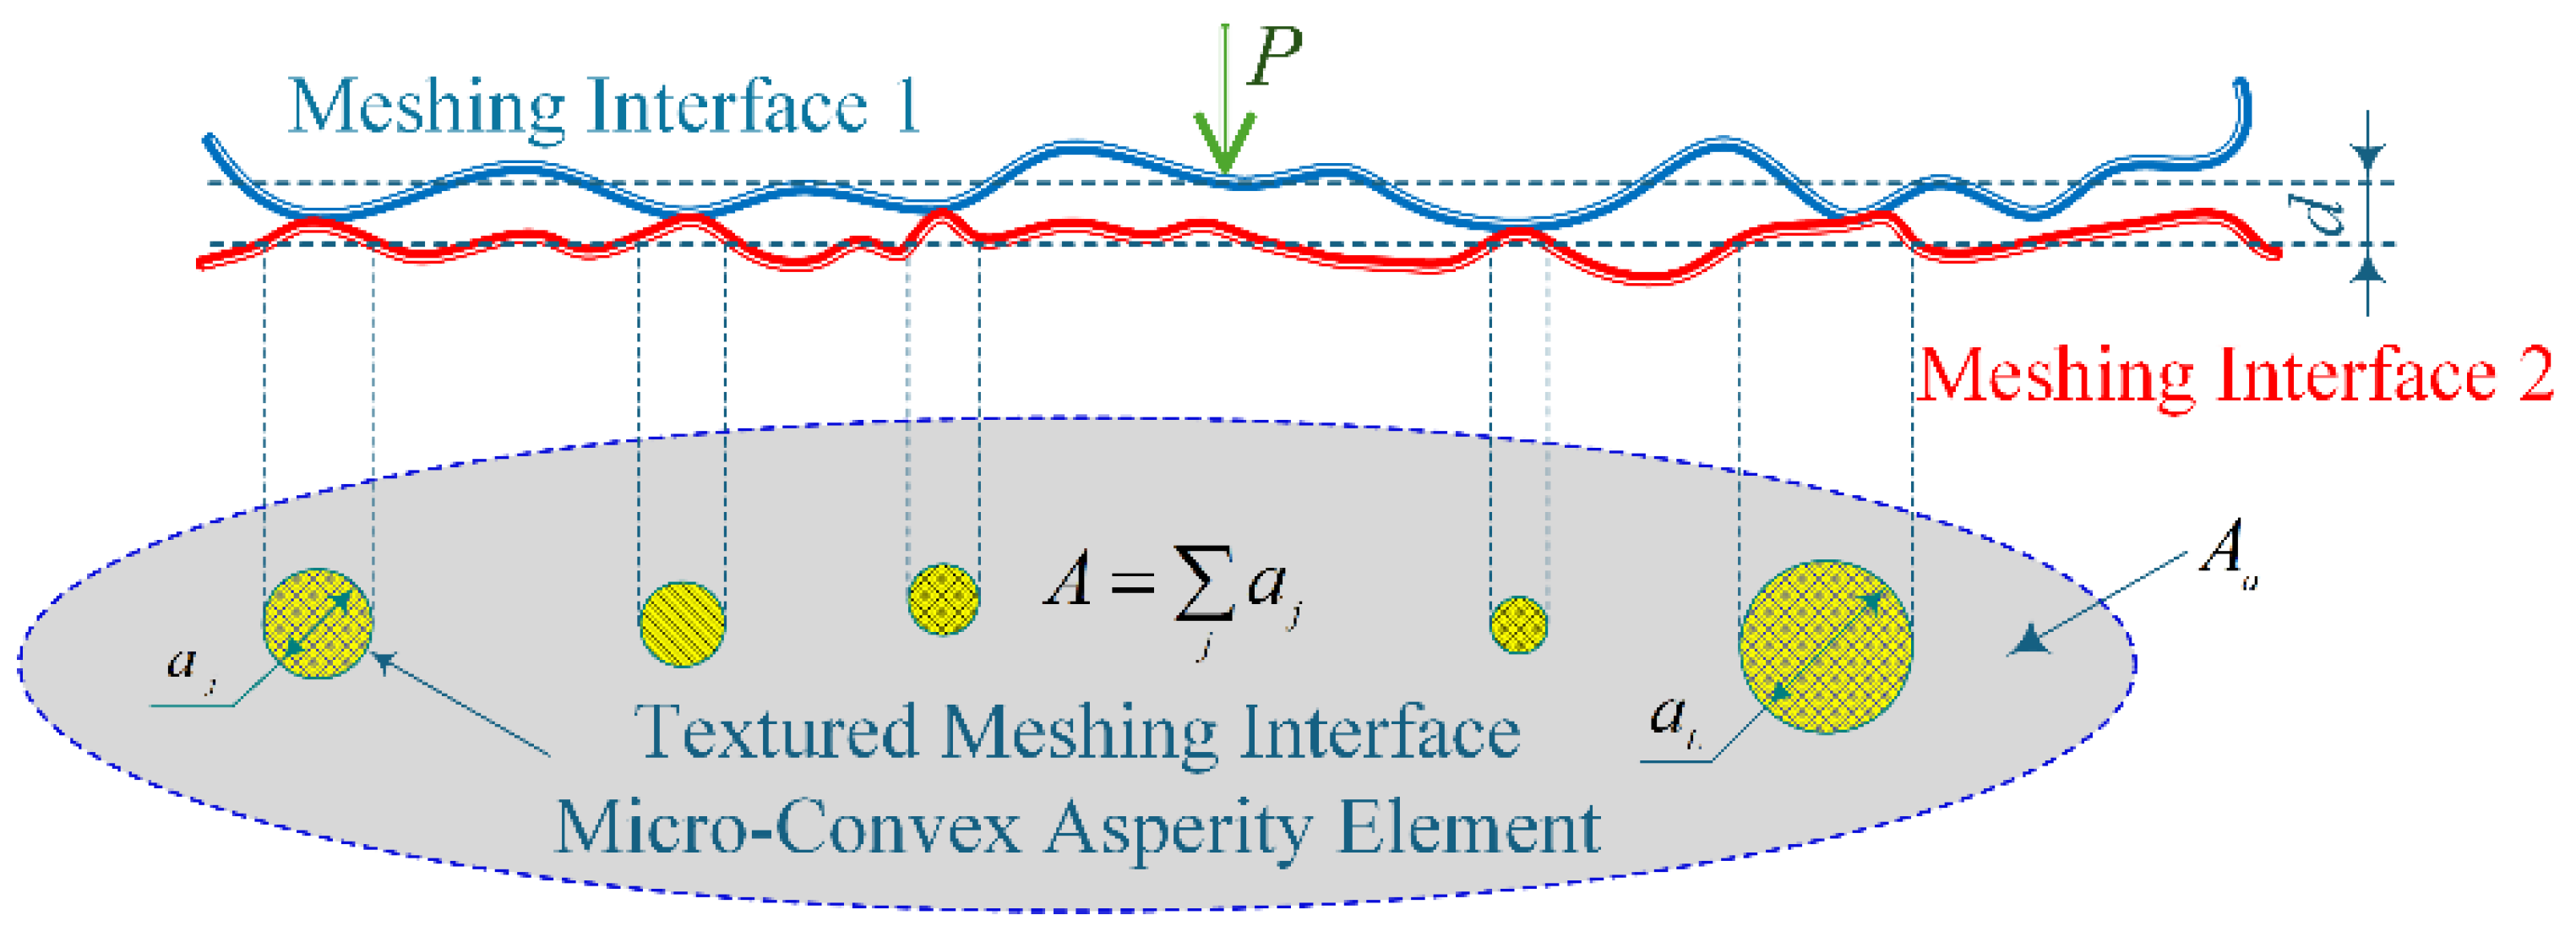
Figure 4.
Correlation between dimensionless contact pressure mean value (), local micro-roughness meshing interface interference (), and effective elastic modulus-to-yield strength ratio ().
Figure 4.
Correlation between dimensionless contact pressure mean value (), local micro-roughness meshing interface interference (), and effective elastic modulus-to-yield strength ratio ().
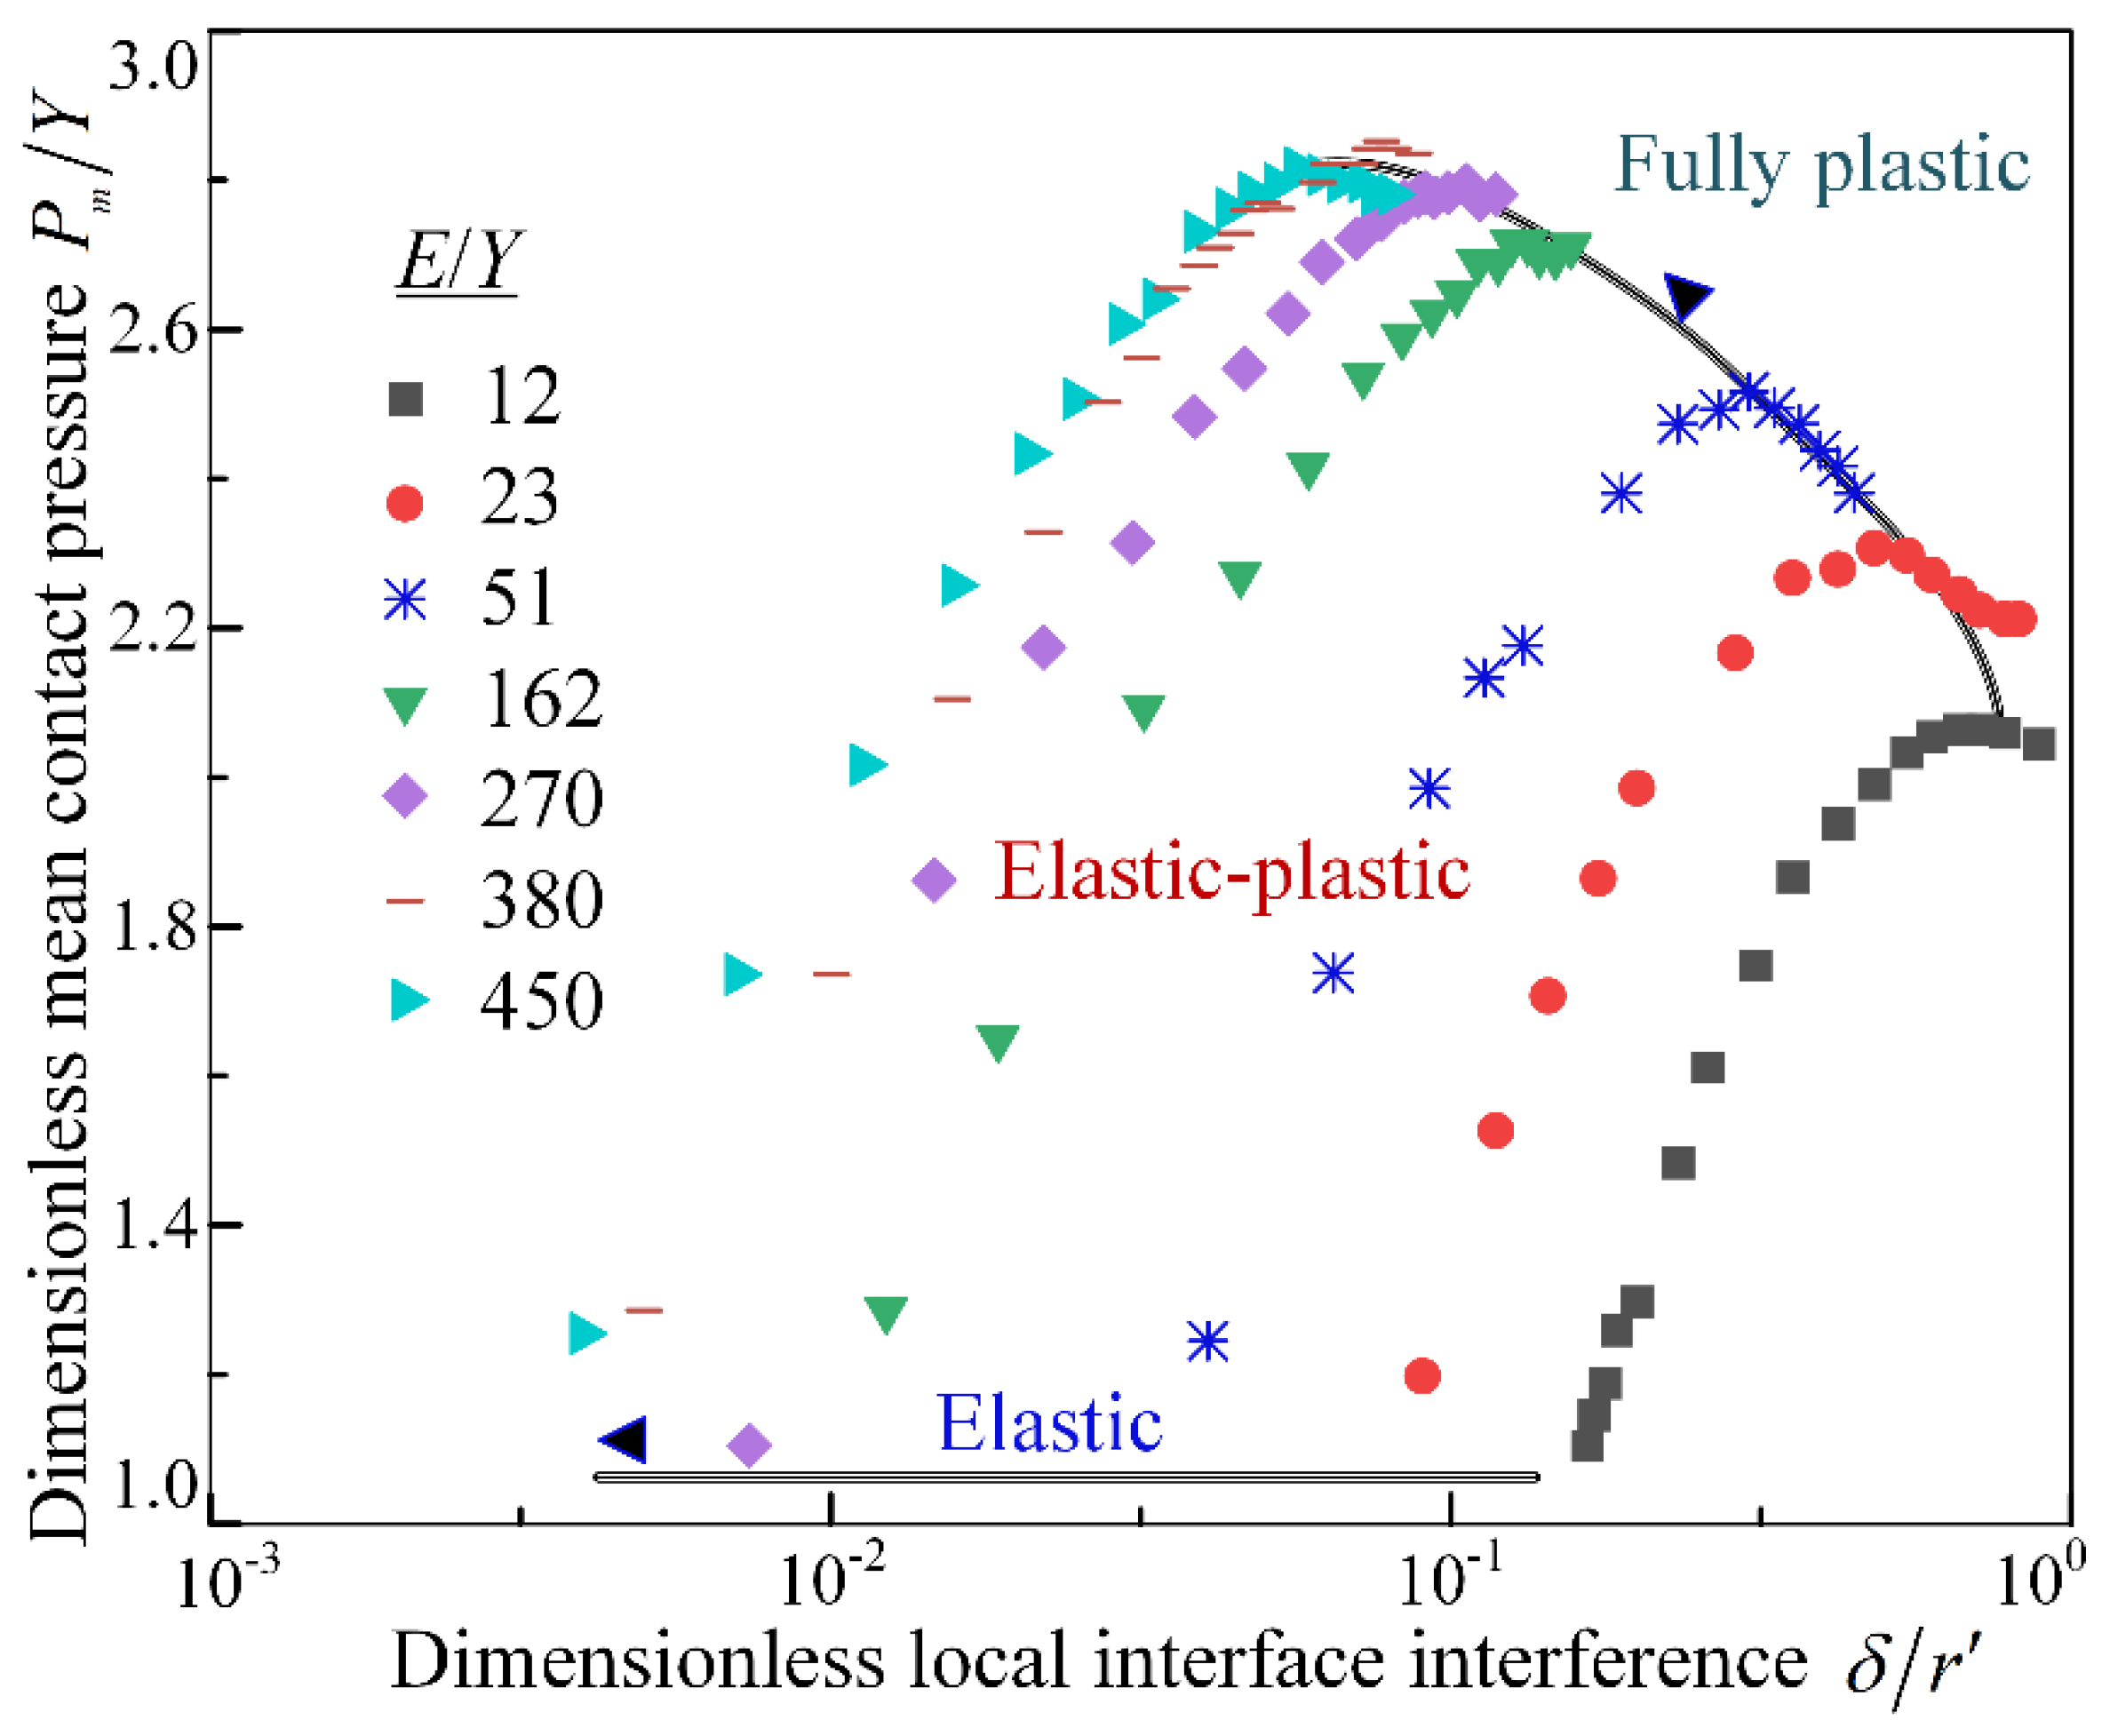
Figure 5.
Correlation between the actual meshing interface contact area ratio (), local micro-roughness meshing interface interference (), the effective elastic modulus-to-yield strength ratio ().
Figure 5.
Correlation between the actual meshing interface contact area ratio (), local micro-roughness meshing interface interference (), the effective elastic modulus-to-yield strength ratio ().
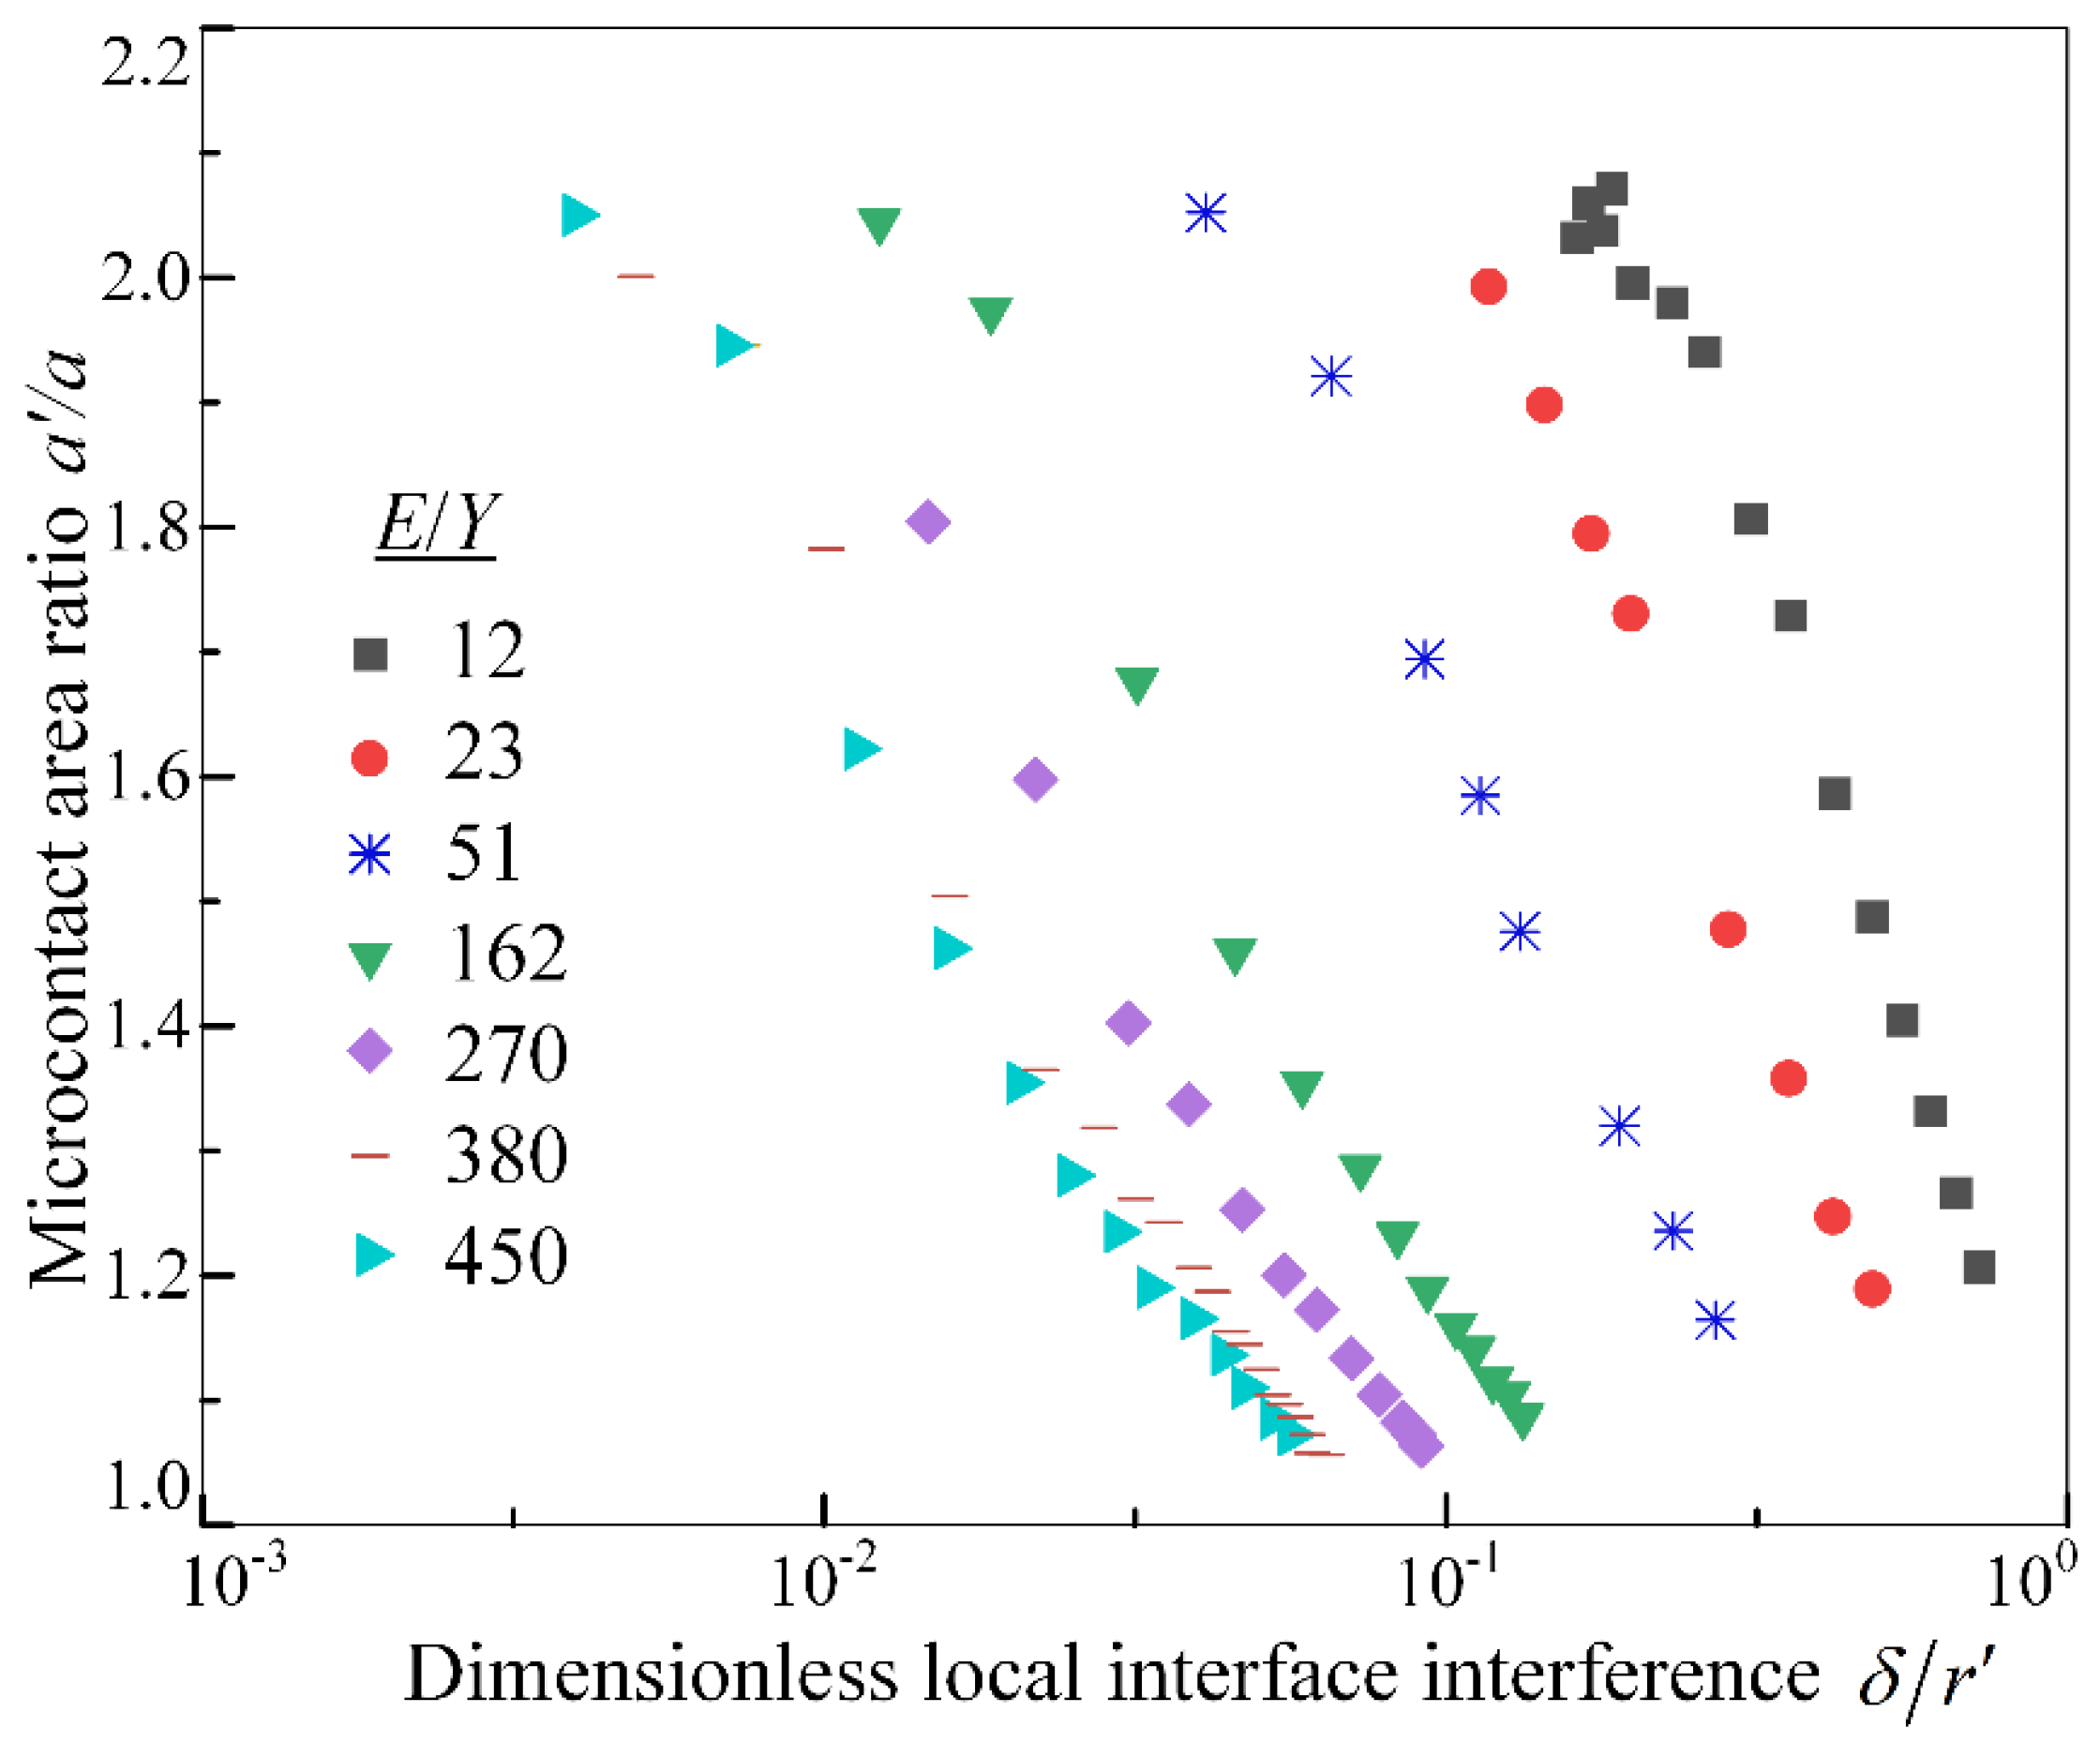
Figure 6.
Thermal conduction models for micro-asperity contact interface: Low-speed rolling and sliding line contact conditions.
Figure 6.
Thermal conduction models for micro-asperity contact interface: Low-speed rolling and sliding line contact conditions.
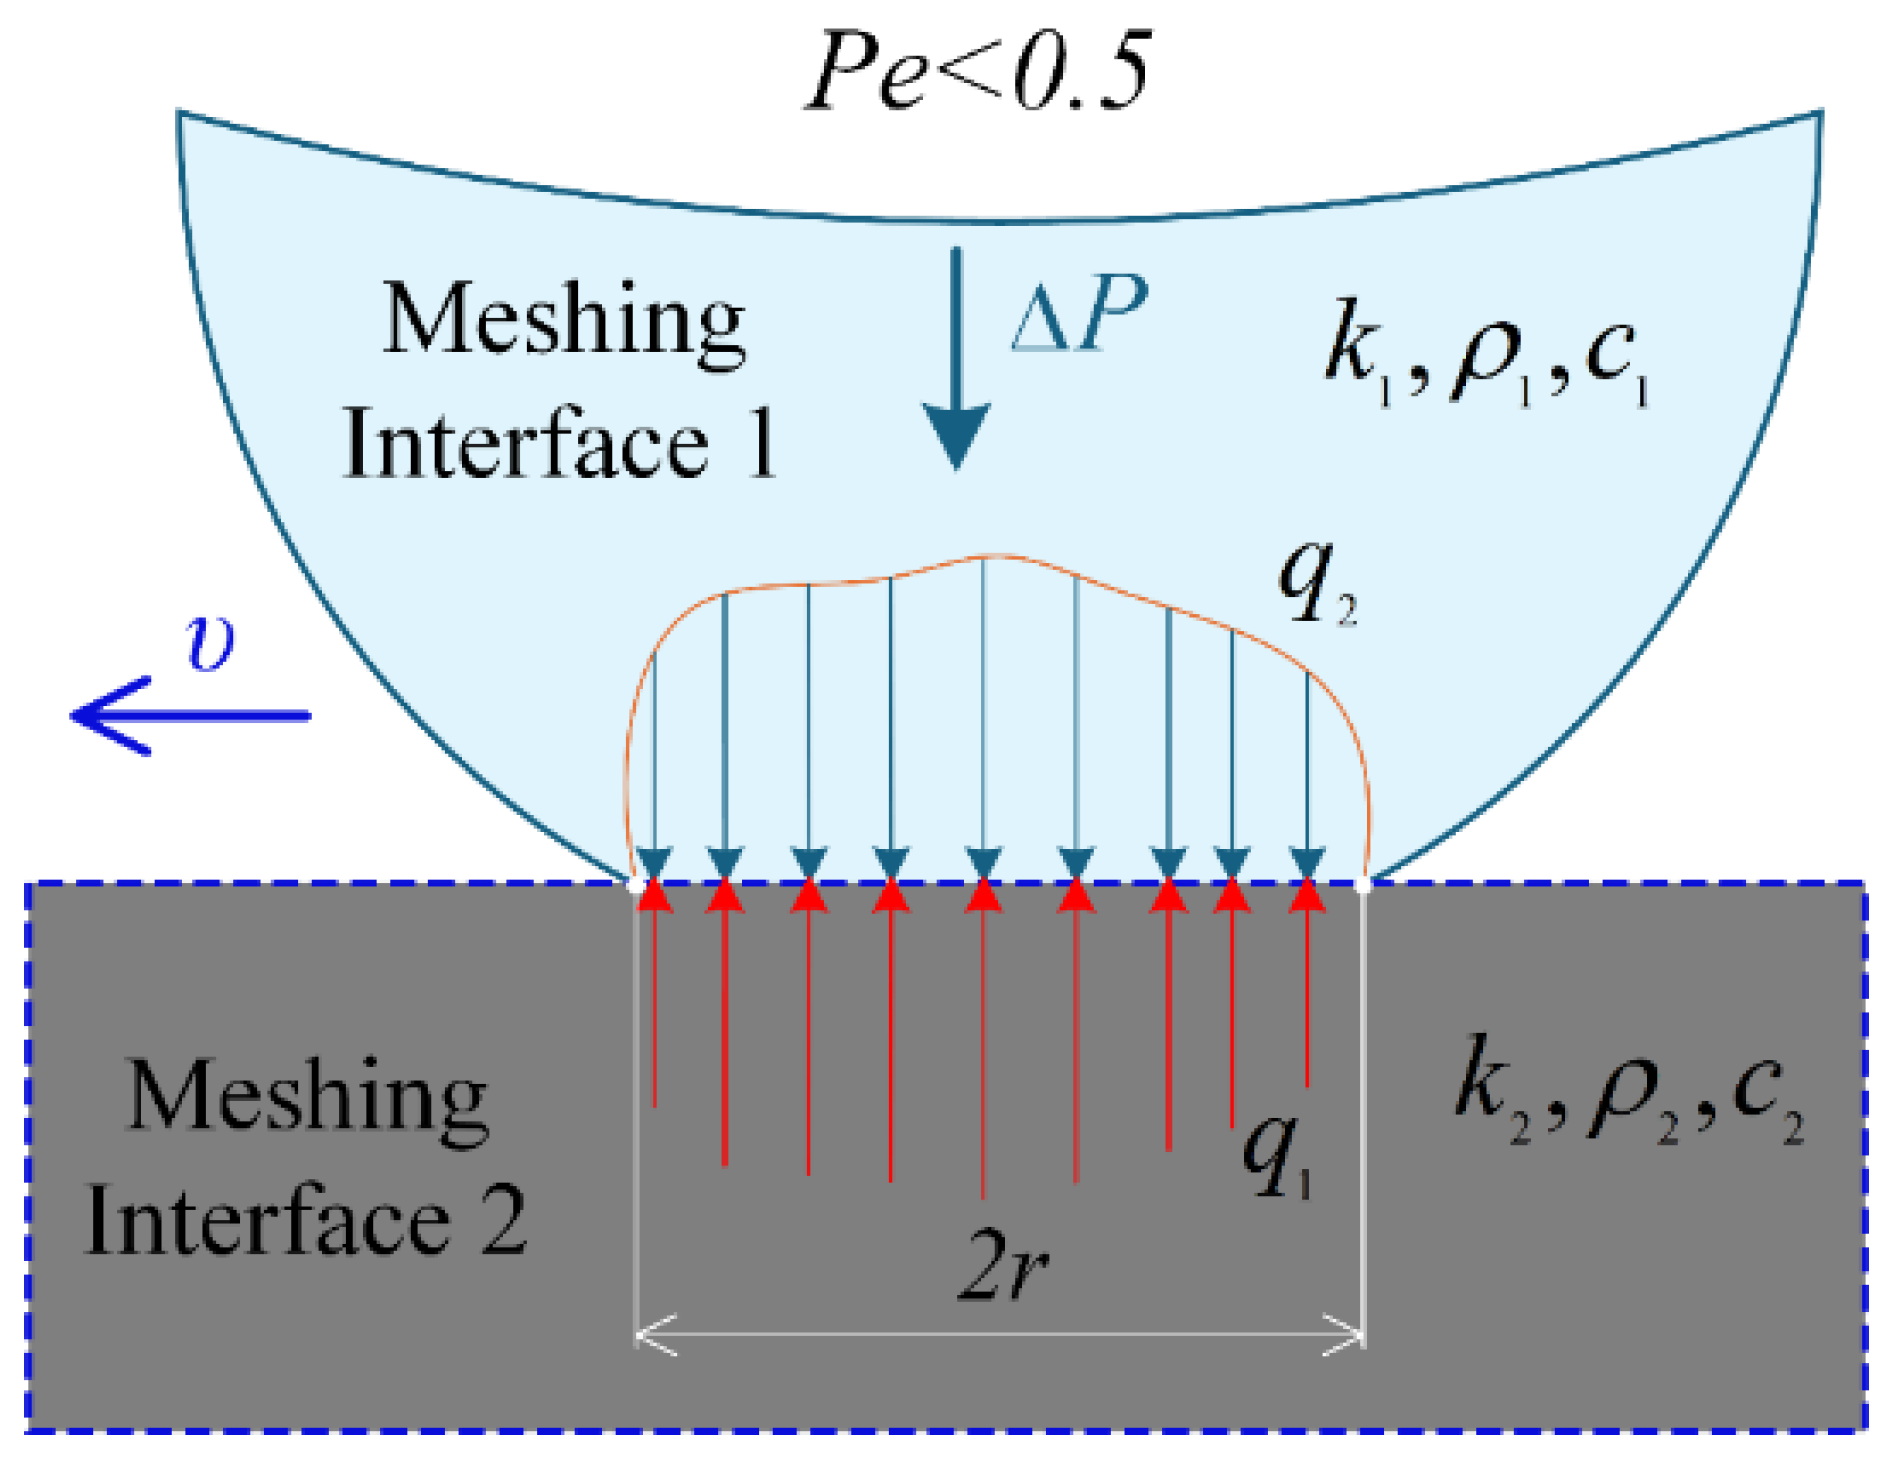
Figure 7.
Thermal conduction models for micro-asperity contact interface: High-speed rolling and sliding line contact conditions.
Figure 7.
Thermal conduction models for micro-asperity contact interface: High-speed rolling and sliding line contact conditions.
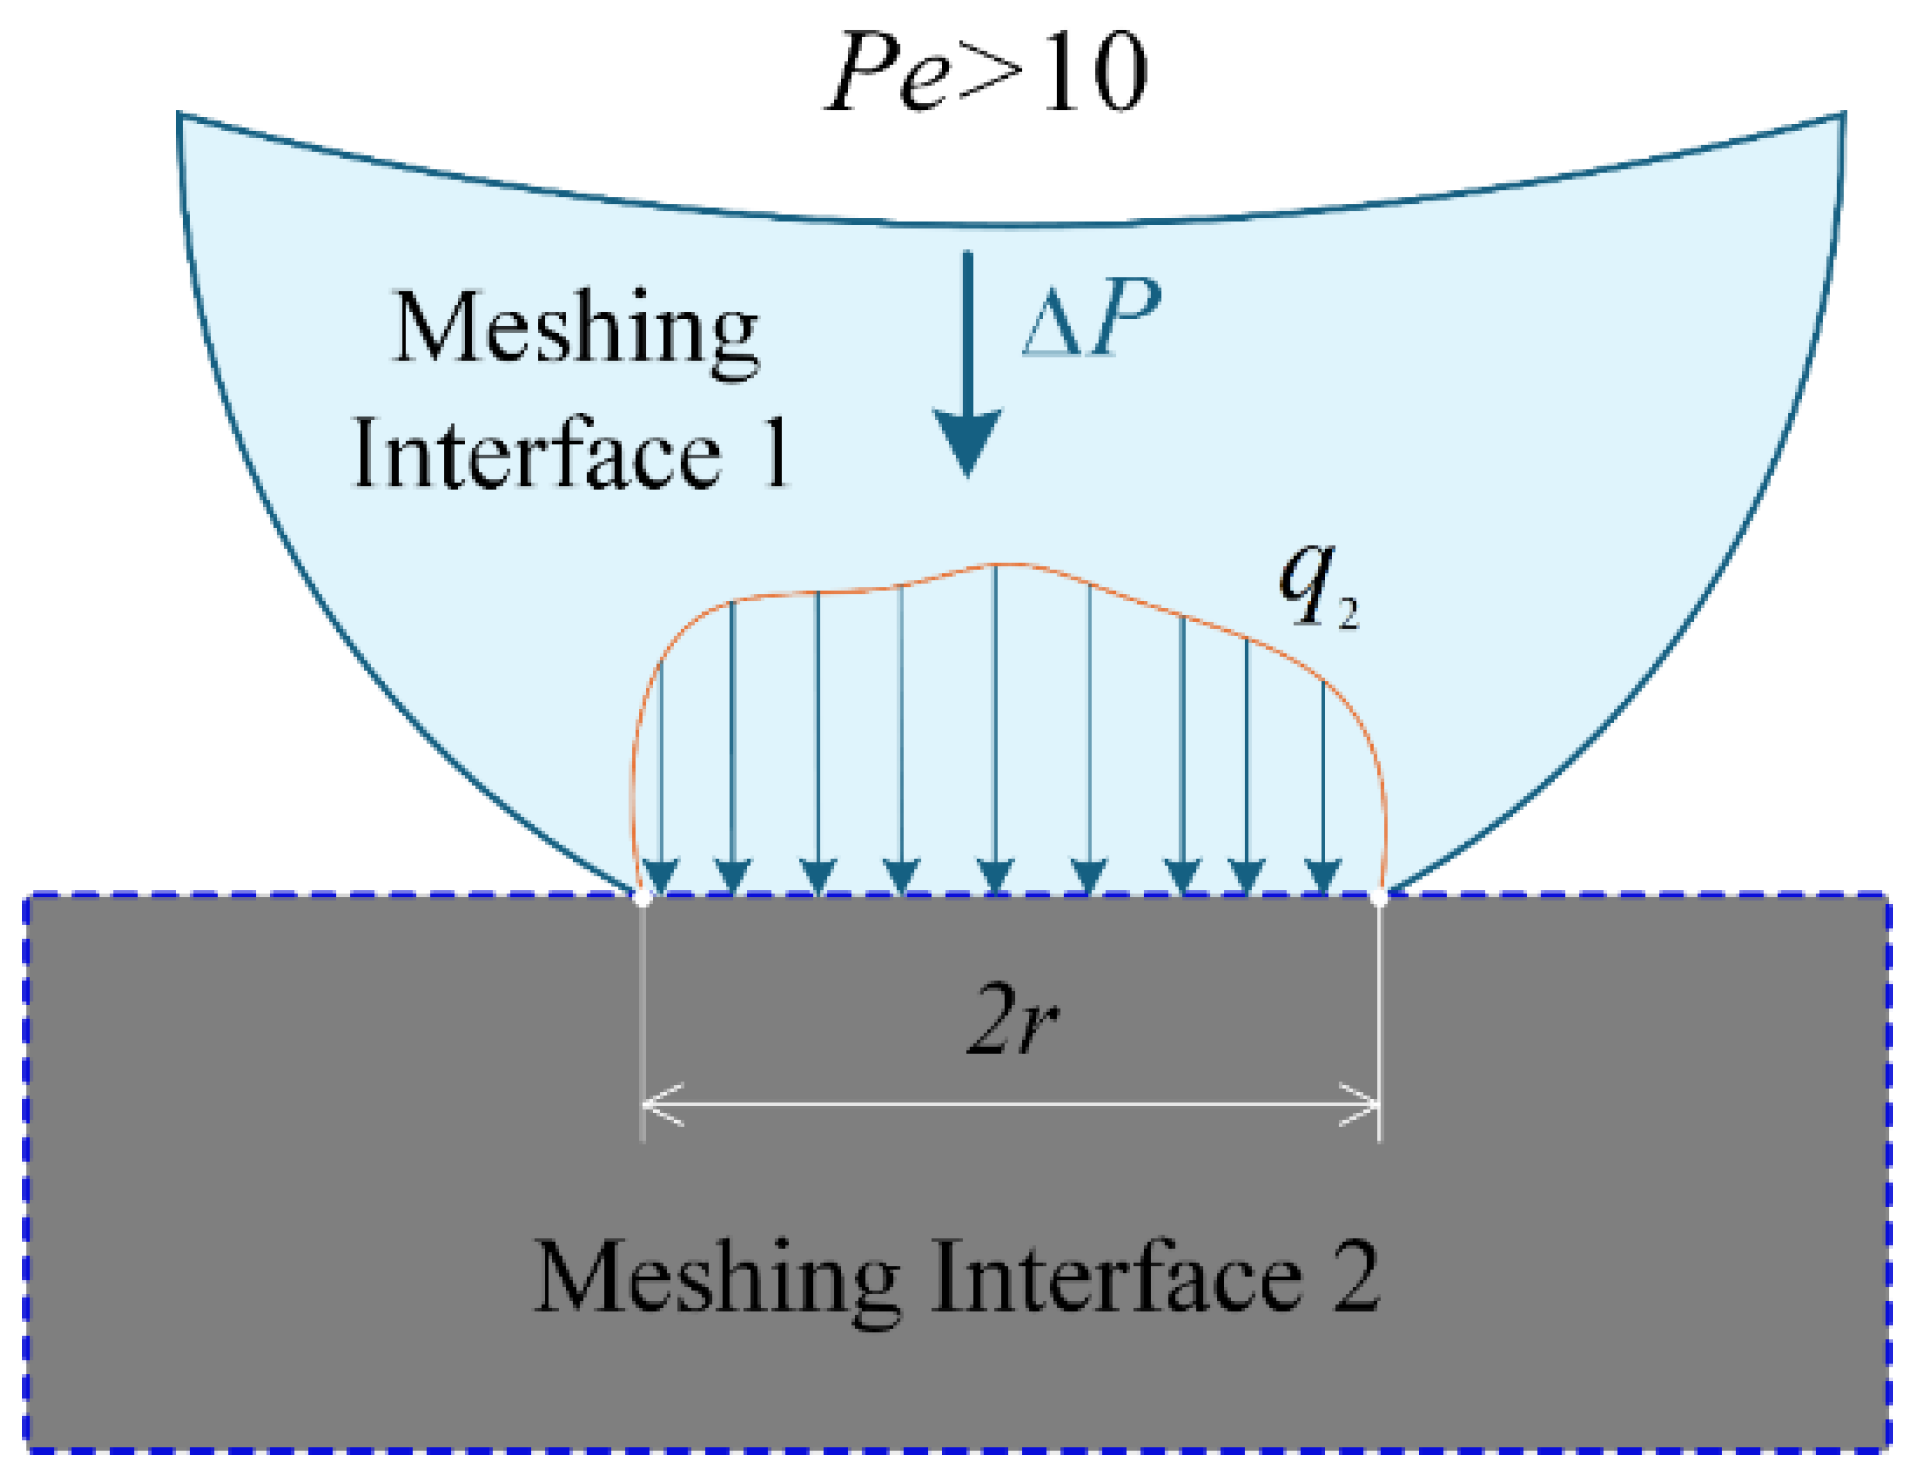
Figure 8.
Correlation of load distribution and actual asperity micro-contact area on textured meshing interfaces under varying fractal parameters (left), and the impact mechanism of actual asperity micro-contact area on dynamic load-bearing performance of textured meshing interfaces (right).
Figure 8.
Correlation of load distribution and actual asperity micro-contact area on textured meshing interfaces under varying fractal parameters (left), and the impact mechanism of actual asperity micro-contact area on dynamic load-bearing performance of textured meshing interfaces (right).
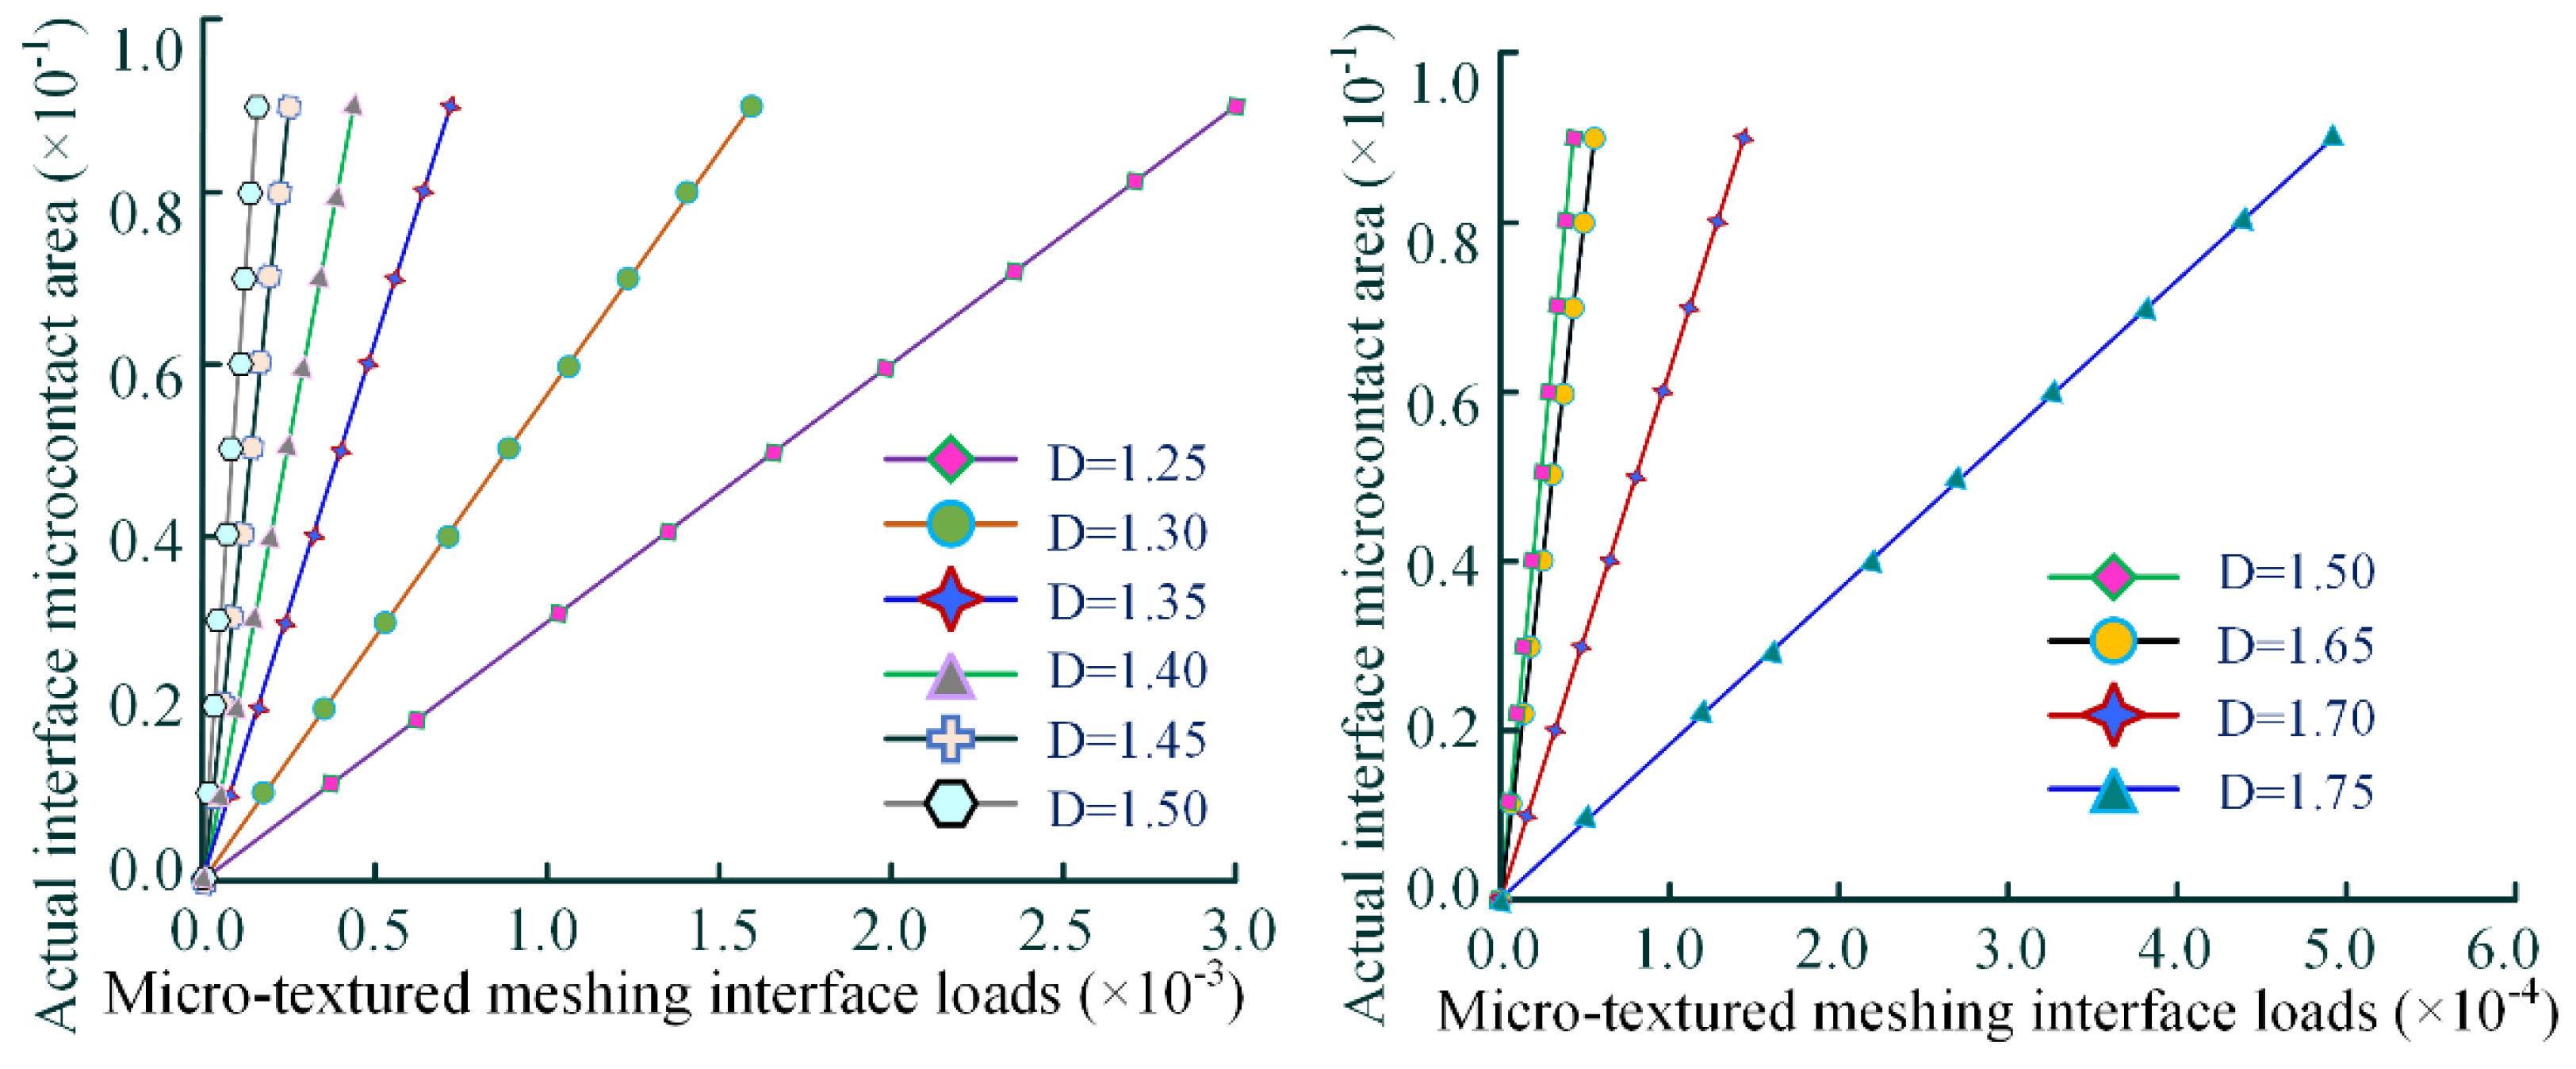
Figure 9.
The influence law of the actual micro-element contact area of the textured surface on the meshing load-bearing characteristics (left), and the time-variant characteristics of the elastic micro-element contact area ratio during the meshing process (right).
Figure 9.
The influence law of the actual micro-element contact area of the textured surface on the meshing load-bearing characteristics (left), and the time-variant characteristics of the elastic micro-element contact area ratio during the meshing process (right).
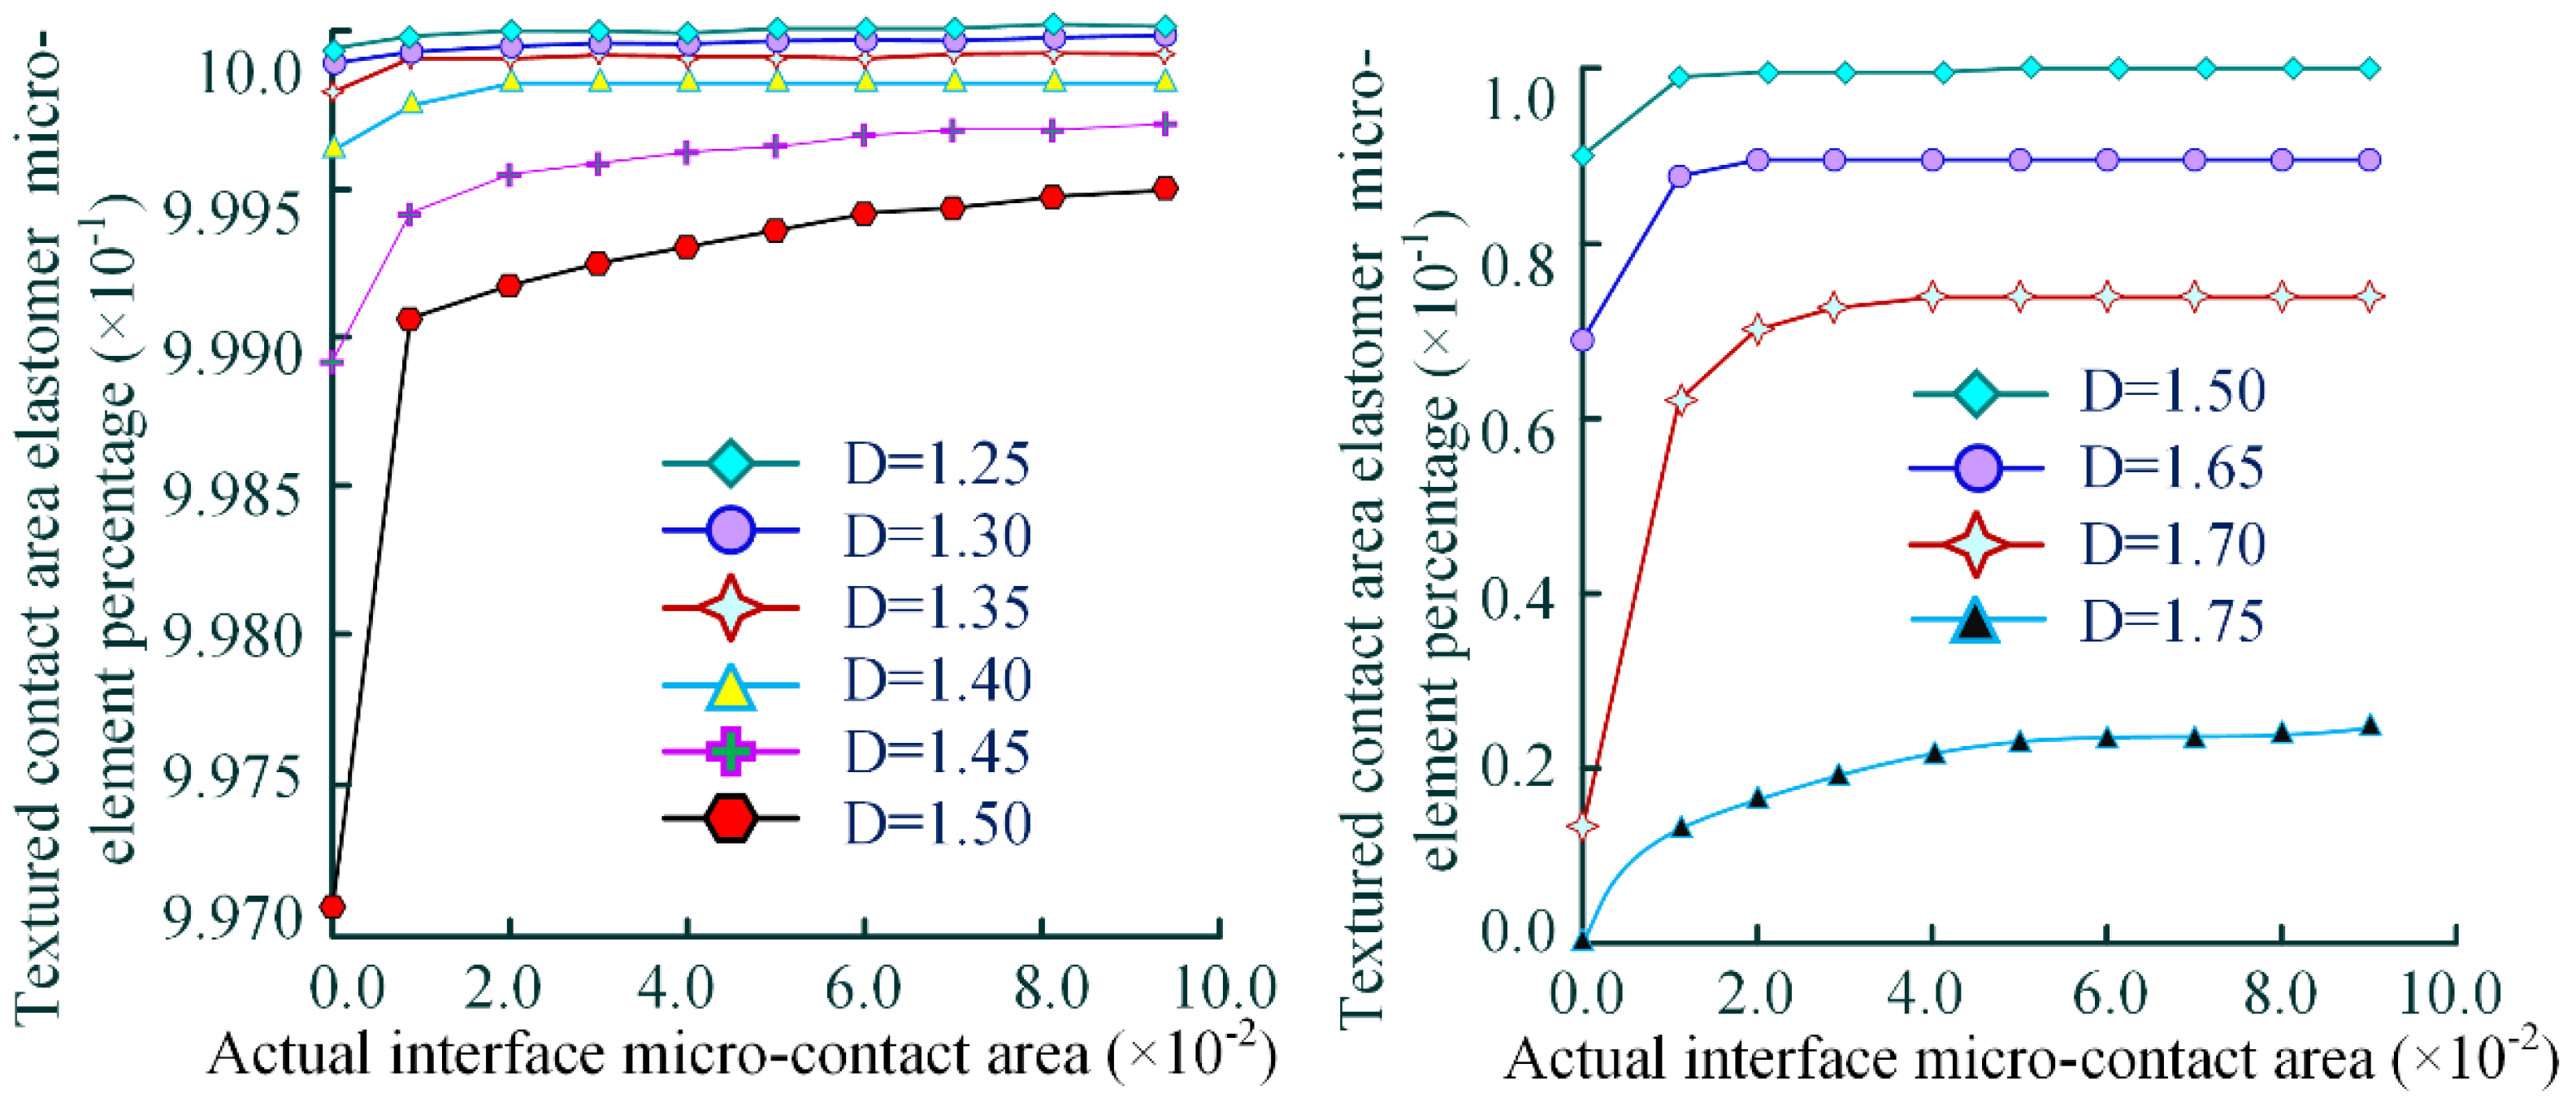
Figure 10.
The degradation of load-bearing capacity in gear system caused by contact fatigue and scuffing mechanism.
Figure 10.
The degradation of load-bearing capacity in gear system caused by contact fatigue and scuffing mechanism.
Disclaimer/Publisher’s Note: The statements, opinions and data contained in all publications are solely those of the individual author(s) and contributor(s) and not of MDPI and/or the editor(s). MDPI and/or the editor(s) disclaim responsibility for any injury to people or property resulting from any ideas, methods, instructions or products referred to in the content. |
© 2025 by the authors. Licensee MDPI, Basel, Switzerland. This article is an open access article distributed under the terms and conditions of the Creative Commons Attribution (CC BY) license (http://creativecommons.org/licenses/by/4.0/).
Copyright: This open access article is published under a Creative Commons CC BY 4.0 license, which permit the free download, distribution, and reuse, provided that the author and preprint are cited in any reuse.


